school of energy and engineering feasibility analysis to...
TRANSCRIPT

School Of Energy and Engineering
Feasibility Analysis to identify the most suitable method of providing power to the subsea control and monitoring system for the Perth Wave Energy Project
ENG450 Engineering Internship Final Report
Antoine Le-Ray
2012
A report submitted to the School of Engineering and Energy, Murdoch University in partial fulfilment of the requirements for the degree of Bachelor of Engineering
• Unit Coordinator – Gareth Lee

CONFIDENTIAL – COMMERCIAL IN CONFIDENCE
THIS DOCUMENT IS UNCONTROLLED WHEN PRINTED
Template: QLY-TEM-0002-SPECIFICATIONTEMPLATE_Rev_2
ACKNOWLEDGMENTS
I would like to thank my supervisors for their guidance and support, as well as my colleagues at CWE and everyone who aided me in my project.
In particular I would like to thank David Harrowfield from CWE for his mentoring and support throughout my time at CWE and Gregory Crebbin from Murdoch University for his assistance.
• Industry Supervisor:
• Jonathan Fievez - Chief Technology Officer - Carnegie Wave Energy
• Murdoch University Supervisors:
• Dr Trevor Pryor - Senior Lecturer, Energy Studies
• Dr Martina Calais - Senior Lecturer, Engineering

CONFIDENTIAL – COMMERCIAL IN CONFIDENCE
THIS DOCUMENT IS UNCONTROLLED WHEN PRINTED
Template: QLY-TEM-0002-SPECIFICATIONTEMPLATE_Rev_2
Except where I have indicated, the work I am submitting in this report is my own and has not been submitted for assessment in another course.
Signed:
Date:

PWEP - CONTROL AND MONITORING POWER SYSTEM FEASIBILITY ANALYSIS
CONFIDENTIAL – COMMERCIAL IN CONFIDENCE
THIS DOCUMENT IS UNCONTROLLED WHEN PRINTED
ENG450_INTERNSHIPFINALREPORT_LERAA_30773254_TRONIC OMITTED – Issued 19/12/2012 17:09Page i of vi
ENG450 ENGINEERING INTERNSHIP INDUSTRY AND ACADEMIC SUPERVISOR ENDORSEMENT PRO FORMA
This is to be signed by both the industry and academic supervisor and attached to the final report
submitted for the internship.
We are satisfied with the progress of this internship project and that the attached report is an
accurate reflection of the work undertaken.
Signed:
Industry Supervisor
Signed:
Academic Supervisor

PWEP - CONTROL AND MONITORING POWER SYSTEM FEASIBILITY ANALYSIS
CONFIDENTIAL – COMMERCIAL IN CONFIDENCE
THIS DOCUMENT IS UNCONTROLLED WHEN PRINTED
ENG450_INTERNSHIPFINALREPORT_LERAA_30773254_TRONIC OMITTED – Issued 19/12/2012 17:09Page ii of vi
1. EXECUTIVE SUMMARY
In April of 2011 CWE successfully tested CETO 3, completing the first stage of the Perth Wave Energy Project.
Stage 2 is a 2 MW grid connected plant. This plant will consist of up to 5 fifth generation CETO units deployed in 24 m water off the Coast of Garden Island with a plant to be constructed on the shore to facilitate the power generation and grid connection.
This document investigates the options for powering the offshore monitoring and control system. Various options were assessed and it was found that a grid connected hybrid umbilical running from the shore to the PLEM was the best option. Different voltage and power regimes were considered, and quotes sought from different vendors.
Legal requirements from relevant standards were established for the subsea power system, particularly with regards to design, safety and earthing.
A final system was chosen after analysing the system requirements and comparing it against the vendor's offerings. Once established this was then modelled to ensure compatibility.
Further system design showed that the successful operation of the subsea power distribution system will rely on the operation of the node controller to manage the instantaneous power levels and implement safety and protection measures. These protection measures are required for maintenance and reliability and will allow divers to safely work on the subsea system.
The final design was for a 240 to 1200 VAC transformer located onshore, power transmission over a hybrid umbilical cable, stepping back down to 240 VAC at the PLEM, and finally, distribution to the individual pods at 240VAC. This system is controlled and protected by a node controller, which is required to limit the peak power and manage faults. The whole monitoring and control system should be installed in parallel with the mechanical components to allow for removal and maintenance of any item without having to move attached hardware. The longest lead time was for the Hybrid Umbilical at 16-18 weeks.
This feasibility analysis has shown the range of parameters that should be considered to develop a reliable subsea power system to power a small load. It has also shown the range of prices associated with different technologies and design options. The final cost of the system was $343,975.8 for the 1200 VAC system compared to $353,790.0 for the 900 VDC system. The bulk of this cost is associated with the cabling and not particularly sensitive between AC and DC. The advantages of DC may prove to be more attractive under different circumstances.

PWEP - CONTROL AND MONITORING POWER SYSTEM FEASIBILITY ANALYSIS
CONFIDENTIAL – COMMERCIAL IN CONFIDENCE
THIS DOCUMENT IS UNCONTROLLED WHEN PRINTED
ENG450_INTERNSHIPFINALREPORT_LERAA_30773254_TRONIC OMITTED – Issued 19/12/2012 17:09Page iii of vi
This page has been left blank intentionally

PWEP - CONTROL AND MONITORING POWER SYSTEM FEASIBILITY ANALYSIS
CONFIDENTIAL – COMMERCIAL IN CONFIDENCE
THIS DOCUMENT IS UNCONTROLLED WHEN PRINTED
ENG450_INTERNSHIPFINALREPORT_LERAA_30773254_TRONIC OMITTED – Issued 19/12/2012 17:09Page iv of vi
Contents
Acknowledgments ................................................................................................................................ ii
1. Executive Summary ...................................................................................................................... ii
2. Introduction ................................................................................................................................... 4
3. Purpose .......................................................................................................................................... 4
4. Scope .............................................................................................................................................. 4
5. Background and Literature Review ............................................................................................. 5
6. Conceptual Design ........................................................................................................................ 6
6.1. Performance Requirements .................................................................................................... 6
6.2. Engineering Requirements ...................................................................................................... 6
7. Design Options .............................................................................................................................. 6
7.1. Hybrid Subsea Cable Providing power and Data Transmission ............................................. 7
7.2. Subsea Local Generation ........................................................................................................ 7
7.3. Pole Mounted Local Generation.............................................................................................. 7
7.4. 3G Wireless ............................................................................................................................. 7
7.5. Satellite .................................................................................................................................... 8
7.6. Acoustic Link ........................................................................................................................... 8
8. Assumptions and Requirements ................................................................................................. 8
9. Design Evaluation ......................................................................................................................... 9
10. Further Design ........................................................................................................................... 9
10.1. Standards .......................................................................................................................... 10
10.2. Hybrid Umbilical Requirements Analysis .......................................................................... 11
10.2.1. Transmission Voltage .................................................................................................... 12
10.2.2. Communication ............................................................................................................. 16
10.2.3. Reliability ....................................................................................................................... 17
10.2.4. Installation .................................................................................................................... 18
10.2.5. Durability ....................................................................................................................... 18
10.2.6. Cost ............................................................................................................................... 18
10.2.7. Availability ..................................................................................................................... 18
10.2.8. Termination ................................................................................................................... 19
10.3. Sub Sea Power Distribution Network Requirements Analysis .......................................... 19
10.3.1. Purpose ......................................................................................................................... 19
10.3.2. Scope ............................................................................................................................. 19
10.3.3. PLEM ............................................................................................................................. 20
10.3.4. Infrastructure ................................................................................................................ 20

PWEP - CONTROL AND MONITORING POWER SYSTEM FEASIBILITY ANALYSIS
CONFIDENTIAL – COMMERCIAL IN CONFIDENCE
THIS DOCUMENT IS UNCONTROLLED WHEN PRINTED
ENG450_INTERNSHIPFINALREPORT_LERAA_30773254_TRONIC OMITTED – Issued 19/12/2012 17:09Page v of vi
10.3.5. Subsea Umbilical Termination Assembly ...................................................................... 20
10.3.6. Pod ................................................................................................................................ 21
10.3.7. Intra Array Cabling ........................................................................................................ 21
10.3.8. 3 Phase Distribution ...................................................................................................... 22
10.3.9. Single Phase Distribution .............................................................................................. 22
10.3.10. DC Distribution .......................................................................................................... 22
10.4. Earthing ............................................................................................................................. 22
10.4.1. Lightning and Surge Protection ..................................................................................... 23
10.5. Subsea SCADA Requirements Analysis ........................................................................... 23
10.5.1. Instruments and Sensors .............................................................................................. 25
10.5.2. I/O Modules .................................................................................................................. 26
10.5.3. Bandwidth ..................................................................................................................... 27
10.5.4. Chassis ........................................................................................................................... 27
10.5.5. Logging Rate .................................................................................................................. 27
10.5.6. UPS ................................................................................................................................ 27
10.6. Data Switch ....................................................................................................................... 27
10.7. Maintenance & Safety ....................................................................................................... 28
11. Preliminary Design .................................................................................................................. 28
11.1. Subsea Control and Sensors ............................................................................................ 28
11.1.1. Siemens ......................................................................................................................... 29
11.1.2. Rockwell Automation .................................................................................................... 30
11.1.3. National Instruments .................................................................................................... 31
11.2. SCM .................................................................................................................................. 32
11.3. Power Transmission and Distribution................................................................................ 32
11.3.1. Transmission ................................................................................................................. 33
11.3.2. Distribution ................................................................................................................... 35
12. Discussion ............................................................................................................................... 36
12.1.1. Transmission ................................................................................................................. 36
12.2. Distribution ........................................................................................................................ 37
12.3. Protection Requirements ................................................................................................... 40
12.4. Trouble shooting................................................................................................................ 41
13. Concept Summary .................................................................................................................. 42
13.1. Infrastructure ..................................................................................................................... 42
13.2. Cost ................................................................................................................................... 43

PWEP - CONTROL AND MONITORING POWER SYSTEM FEASIBILITY ANALYSIS
CONFIDENTIAL – COMMERCIAL IN CONFIDENCE
THIS DOCUMENT IS UNCONTROLLED WHEN PRINTED
ENG450_INTERNSHIPFINALREPORT_LERAA_30773254_TRONIC OMITTED – Issued 19/12/2012 17:09Page vi of vi
14. Conclusion ............................................................................................................................... 43
15. Recommendations .................................................................................................................. 44
16. References ............................................................................................................................... 45
17. Appendices .............................................................................................................................. 48
A.1. System Modelling .................................................................................................................. 48
A.1.1. ICAPS ............................................................................................................................. 48
A.1.2. PLECS ............................................................................................................................. 49
A.1.3. Evaluation. .................................................................................................................... 53
A.2. Supporting Items ................................................................................................................... 59
PWEP - CONTROL AND MONITORING POWER SYSTEM FEASIBILITY ANALYSIS
CONFIDENTIAL – COMMERCIAL IN CONFIDENCE
THIS DOCUMENT IS UNCONTROLLED WHEN PRINTED
ENG450_INTERNSHIPFINALREPORT_LERAA_30773254_TRONIC OMITTED – Issued 19/12/2012 17:09Page vii of vi
Table of Figures
Figure 1 Conceptual Design Performance Requirements ....................................................................... 6
Figure 2 - Offshore Design Options ......................................................................................................... 7
Figure 3 - Electrical Power System Design (Source (Bai and Bai 2010) accessed 9/2012).................... 10
Figure 4 - Umbilical Requirements Map ............................................................................................... 12
Figure 5 - AC power Transmission with Step Up and Step Down Transformers ................................... 14
Figure 7 - DC Rectifier and Booster Single Line Diagram ...................................................................... 16
Figure 6 - Amtex 600 VDC to 48 VDC Rectifiers .................................................................................... 16
Figure 8 - Fork Stress Termination ........................................................................................................ 19
Figure 9 - Eye Stress Termination (MacArtney) .................................................................................... 19
Figure 10 - Subsea Power Distribution Network Scope ........................................................................ 20
Figure 11 - Expro Scope of Work........................................................................................................... 21
Figure 12 - SCADA Requirements .......................................................................................................... 24
Figure 13 - PLEM Functional Diagram ................................................................................................... 28
Figure 14 - Pod Functional Diagram ...................................................................................................... 29
Figure 15 - Siemens S7-300 System ...................................................................................................... 30
Figure 16 - Rockwell Automation Control System Layout .................................................................... 31
Figure 17 - National Instruments System.............................................................................................. 31
Figure 18 - Subsea Control Module (VENUS 2012), accessed 15/10/2012) ......................................... 32
Figure 19 - 240 VAC South Bay Cable SB-47982 ................................................................................... 33
Figure 20 - 600 VAC South Bay Cables SB-47980 .................................................................................. 33
Figure 21 - 1200 VAC South Bay Cable SB-47981 ................................................................................. 34
Figure 22 - De Regt Budgetary Designs ................................................................................................. 34
Figure 23 - Final Power Supply Model - Over View ............................................................................... 42
Figure 24 - ICAPS Circuit Diagram ......................................................................................................... 49
Figure 25 - ICAPS Power Output Simulation ......................................................................................... 49
Figure 26 - PLECS System Circuit ........................................................................................................... 50
Figure 27 - PLECS Load: Voltage, Current and Power Output ............................................................... 51
Figure 28 - Low Load Voltage Rise without Inductor 247 W ................................................................. 52
Figure 29 - Low Load Voltage Rise Inductor Left In 247 W ................................................................... 53
Figure 30 - Inductor PF correction PLECS Simulation ........................................................................... 55
Figure 31 - PI Model Per Unit Evaluation .............................................................................................. 56
Figure 32 - T model Per Unit Evaluation ............................................................................................... 57
Figure 33 - Light Load T model .............................................................................................................. 58
Figure 34 - DC Alternative System - Cost Breakdown ........................................................................... 59

PWEP - CONTROL AND MONITORING POWER SYSTEM FEASIBILITY ANALYSIS
CONFIDENTIAL – COMMERCIAL IN CONFIDENCE
THIS DOCUMENT IS UNCONTROLLED WHEN PRINTED
ENG450_INTERNSHIPFINALREPORT_LERAA_30773254_TRONIC OMITTED – Issued 19/12/2012 17:09Page viii of vi
Table of Tables
Table 1 - Design Evaluation Data Transmission, 5 = Good, 0 = Poor ...................................................... 9
Table 2 - Design Evaluation Power Transmission ................................................................................... 9
Table 3 - Relevant Standards and recommended Design Practises ...................................................... 11
Table 4 - Umbilical Performance and Design Requirements ................................................................ 17
Table 5 - Expro Scope of Work (1st Quote) .......................................................................................... 21
Table 6 - Stemar Transformer Units ...................................................................................................... 34
Table 7 - Amtex DC Converter Quote ................................................................................................... 35
Table 8 - MacArtney Cabling Pricing (AUD) .......................................................................................... 35
Table 9 - Expro Discrete Cable Quote ................................................................................................... 36
Table 10 - Expro Hybrid Copper Cable Quote ....................................................................................... 36
Table 11 - Southbay Cable Company Umbilical as Intra Array Cabling ................................................. 38
Table 12 - De Regt Umbilical as Intra Array Cabling ............................................................................. 39
Table 13 - Final System Component List ............................................................................................... 43
Table 14 - Table of Equations ................................................................................................................ 59

PWEP - CONTROL AND MONITORING POWER SYSTEM FEASIBILITY ANALYSIS
CONFIDENTIAL – COMMERCIAL IN CONFIDENCE
THIS DOCUMENT IS UNCONTROLLED WHEN PRINTED
ENG450_INTERNSHIPFINALREPORT_LERAA_30773254_TRONIC OMITTED – Issued 19/12/2012 17:09Page ix of vi
This page has been left blank intentionally

PWEP - CONTROL AND MONITORING POWER SYSTEM FEASIBILITY ANALYSIS
CONFIDENTIAL – COMMERCIAL IN CONFIDENCE
THIS DOCUMENT IS UNCONTROLLED WHEN PRINTED
ENG450_INTERNSHIPFINALREPORT_LERAA_30773254_TRONIC OMITTED – Issued 19/12/2012 17:09 Page 1 of 64
Abbreviations and Definitions
AC Alternating Current
ADC Analogue to Digital Conversion
AS Australian Standards
AWG American Wire Gauge
BA Buoyant Actuator
CCR Central Control Room
CETO 5 Fifth generation CETO wave energy device at commercial scale (C).
CMR Common Mode Rejection
CMV Common Mode Voltage
COTS Commercial Off the Shelf
CWE Carnegie Wave Energy Ltd.
DC Direct Current
DNV Det Norske Veritas
DCS Distributed Control System
EUR Euro
FMEA Failure Mode and Effects Analysis
GIPS Galvanised Improved Plow Steel
HMI Human Machine Interface
HV High Voltage ( >1000 VAC RMS)
IDL Instrument Data List
IMCA International Marine Contractors Association
JB Junction Box
KVA Kilo Volt Ampere
kW Kilo-Watt
LV Low Voltage (50-1000 VAC RMS)

PWEP - CONTROL AND MONITORING POWER SYSTEM FEASIBILITY ANALYSIS
CONFIDENTIAL – COMMERCIAL IN CONFIDENCE
THIS DOCUMENT IS UNCONTROLLED WHEN PRINTED
ENG450_INTERNSHIPFINALREPORT_LERAA_30773254_TRONIC OMITTED – Issued 19/12/2012 17:09 Page 2 of 64
May Verbal form used to indicate course of action permissible within the limits of the specification.
MCS Master Control System
MOQ Minimum Order Quantity
MW Mega-Watt
NDA Non Disclosure Agreement
NMV Normal Mode Voltage
OD Outer Diameter
PF Power Factor
PLECS Piece-wise Linear Electrical Circuit Simulation
PLEM Pipe Line End Manifold
PLC Process Logic Controller
PMG Permanent Magnet Generator
Pod Local Subsea Hydraulic Module
PV Photovoltaic
PWEP Perth Wave Energy Project
Pump Generic reference to the lower part of the CETO device
RFQ Request for Quote
RMS Root Mean Square (All voltages and Currents are provided as RMS)
ROV Remotely Operated Vehicle
SBC South Bay Cable Company
SCADA Supervisory Control and Data Acquisition
SCM Subsea Control Module
Shall Indicates requirements strictly to be followed in order to conform to this specification or standard and from which no deviation is permitted.
Should Indicates that among several possibilities, one is recommended as particularly suitable, without mentioning or excluding others, or that a certain course of action in preferred, but not necessarily required. Other possibilities may be applied

PWEP - CONTROL AND MONITORING POWER SYSTEM FEASIBILITY ANALYSIS
CONFIDENTIAL – COMMERCIAL IN CONFIDENCE
THIS DOCUMENT IS UNCONTROLLED WHEN PRINTED
ENG450_INTERNSHIPFINALREPORT_LERAA_30773254_TRONIC OMITTED – Issued 19/12/2012 17:09 Page 3 of 64
subject to the agreement.
SMPS Switch Mode Power Supply
SPD Surge Protection Device
SPICE Simulation Program with Integrated Circuits Emphasis
SUTA Subsea Umbilical Termination Assembly
The Designer Those responsible for performing the design work.
UPS Uninterruptable Power Supply
USD United States Dollars
UTA Underwater Termination Assembly
UVS Under Water Video Services
WEC Wave Energy Converter

PWEP - CONTROL AND MONITORING POWER SYSTEM FEASIBILITY ANALYSIS
CONFIDENTIAL – COMMERCIAL IN CONFIDENCE
THIS DOCUMENT IS UNCONTROLLED WHEN PRINTED
ENG450_INTERNSHIPFINALREPORT_LERAA_30773254_TRONIC OMITTED – Issued 19/12/2012 17:09 Page 4 of 64
2. INTRODUCTION
For 12 years Carnegie Wave Energy limited (CWE) has been developing CETO, a technology that is capable of harvesting energy from waves by converting the wave energy into hydraulic energy.
The CETO unit aims to minimise offshore complexity. This is achieved by locating the electrical generation on shore and the hydraulic power generation offshore.
The CETO 3 machine consists of a submerged buoyant actuator (BA) tethered to a hydraulic pump mounted to the sea floor. As waves pass the BA is drawn up with the motion of the waves resulting in the hydraulic pump pressurising fluid that is then transmitted to the shore where it can be used either for conventional power generation or for reverse osmosis.
In 2009 CWE received results for feasibility studies undertaken for Western Australia's first commercial scale demonstration project known as the Perth Wave Energy Project (PWEP). This study highlighted Garden Island near Rockingham as a suitable candidate wave site. The project is to use Government and private funding to develop a 2MW plant.
In April of 2011 CWE successfully tested a single CETO 3 unit, the first commercial scale unit, off the coast of Garden Island.
Prior to deployment the unit was tested extensively at Carnegie's Wave Energy Research Facility in North Fremantle, and this testing highlighted some areas that needed further development before the successful deployment of PWEP which is due to be commissioned in 2013.
This plant will consist of up to 5 fifth generation CETO units deployed in 24 m water off the Coast of Garden Island with a plant facility to be constructed on the shore to facilitate the power generation and grid connection.
The plant will use the pressurised hydraulic fluid to power hydraulic motors coupled to a synchronous generator, which will then be connected to the grid.
The successful operation of the plant requires automation, in particular so that the submarine devices can be monitored and controlled. The subsea control and monitoring devices require a power supply and must be able to transmit real-time data to the Central Control Room (CCR) onshore. This report focuses on the consideration of options for this power supply system and presents a recommended option for this task.
3. PURPOSE
This document presents a feasibility analysis and describes the studies that have led to a power transmission and distribution design recommendation for the offshore plant of the PWEP in light of CWE’s technical and financial objectives. The purpose of this document is to describe the decisions and thought process that led to various design concepts.
4. SCOPE
This document pertains to the offshore power distribution and transmission system including some control system items and excludes the onshore parent SCADA system.
PWEP - CONTROL AND MONITORING POWER SYSTEM FEASIBILITY ANALYSIS
CONFIDENTIAL – COMMERCIAL IN CONFIDENCE
THIS DOCUMENT IS UNCONTROLLED WHEN PRINTED
ENG450_INTERNSHIPFINALREPORT_LERAA_30773254_TRONIC OMITTED – Issued 19/12/2012 17:09 Page 5 of 64
5. BACKGROUND AND LITERATURE REVIEW
The single autonomous CETO 3 unit used a standalone power supply consisting of a lithium ion battery charged by an alternator coupled to a hydraulic motor to supply power to the SCADA system. The SCADA system was connected to a communications buoy via an umbilical cable. The data was then transmitted via a 3G wireless link.
Pre-operative analysis showed that the alternator was very inefficient and consequently was not used. The battery was therefore charged from a monitoring boat.
Of serious concern was the reliability of the 3G network, both Telstra 3G and Optus 3G were used. However, even with a combination of both providers, data connection was lost for significant lengths of time.
The movement of the buoy resulted in some wear to the umbilical cable and serious wear to the mounting shackles. This could have resulted in the loss of the communications buoy, which is deemed unacceptable.
The SCADA system was exposed to a malfunction when a damaged instrument cable short circuited. This caused other instruments on the same processing board to malfunction as there was no short circuit protection included in the SCADA system.
The area of subsea power is not new; modern WECs however are. Current subsea power systems either involve HV and long distances, or small isolated units with low power requirements. This field is mostly developed by the telecommunications and oil and gas industries. The work covered by this report focuses on an area that falls in between these two categories. The system in question has a low power requirement over a short distance, but high data transmission requirements due to a large number of sensors. Bai et al (2010) discuss the types of considerations that should be covered when designing a subsea power system, but this is largely focussed on high power HV applications for oil and gas operations. The Neptune and Venus subsea oceanographic observatories both use HVDC power supply options and include structures to support high bandwidths and large numbers of sensors. (Howe et al. 2001). The field of subsea oceanography is mostly based upon using existing infrastructure as deployed by the telecommunications industry. Principles from both observatories and oil and gas are applicable in this situation. Edson et Al (2001) discuss the use of a single phase 1500 VAC system used to power a subsea observatory in the USA. However, detailed information is not readily available in this area.
Howe et al (2001) discuss the design of the Neptune observatory's power system. They note that the reason HVDC is used for long distances is due to the reactive power requirements caused by the inductive and capacitive nature of cables. Wrinch et al (2007) also discuss the uses of AC over DC, however in a longer distance scenario than this project. It is pointed out that the use of bundled conductors can lead to voltage rise in to the capacitive coupling between the conductors and the armouring sheath.
Australian standards do not adequately cover subsea power systems; DNV standards do cover subsea HVAC and HVDC systems to some extent. They also point out the young age of WEC's and the lack of standard practices and hence standards. (DNV, Guidelines on design and operation of wave energy converters 2005).
Power System modelling for such applications can be done in software packages, but needs to be done using appropriate models. This is discussed by Wrinch et al (2007) who used the software package Electromagnetic Transients Program to model transient and steady state scenarios in subsea cables for Oceanography.
PWEP - CONTROL AND MONITORING POWER SYSTEM FEASIBILITY ANALYSIS
CONFIDENTIAL – COMMERCIAL IN CONFIDENCE
THIS DOCUMENT IS UNCONTROLLED WHEN PRINTED
ENG450_INTERNSHIPFINALREPORT_LERAA_30773254_TRONIC OMITTED – Issued 19/12/2012 17:09 Page 6 of 64
6. CONCEPTUAL DESIGN
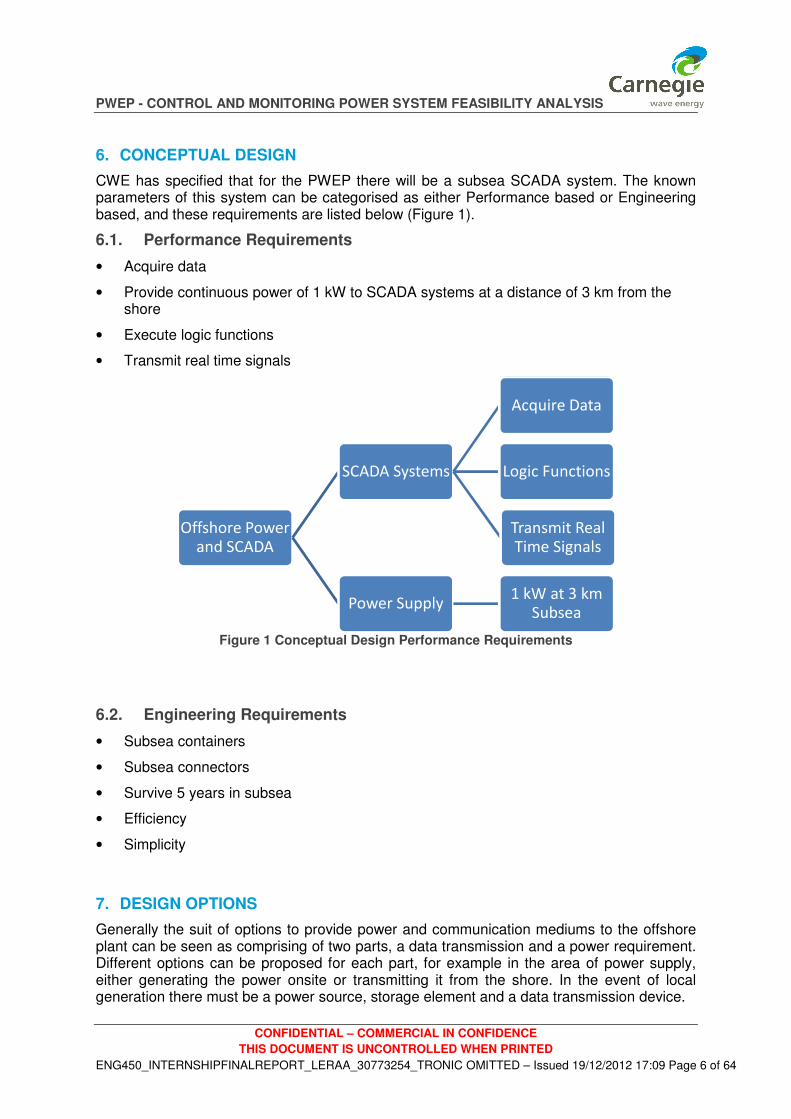
CWE has specified that for the PWEP there will be a subsea SCADA system. The known parameters of this system can be categorised as either Performance based or Engineering based, and these requirements are listed below (Figure 1).
6.1. Performance Requirements
• Acquire data
• Provide continuous power of 1 kW to SCADA systems at a distance of 3 km from the shore
• Execute logic functions
• Transmit real time signals
Figure 1 Conceptual Design Performance Requirements
6.2. Engineering Requirements
• Subsea containers
• Subsea connectors
• Survive 5 years in subsea
• Efficiency
• Simplicity
7. DESIGN OPTIONS
Generally the suit of options to provide power and communication mediums to the offshore plant can be seen as comprising of two parts, a data transmission and a power requirement. Different options can be proposed for each part, for example in the area of power supply, either generating the power onsite or transmitting it from the shore. In the event of local generation there must be a power source, storage element and a data transmission device.
Offshore Power and SCADA
SCADA Systems
Acquire Data
Logic Functions
Transmit Real Time Signals
Power Supply1 kW at 3 km
Subsea

PWEP - CONTROL AND MONITORING POWER SYSTEM FEASIBILITY ANALYSIS
CONFIDENTIAL – COMMERCIAL IN CONFIDENCE
THIS DOCUMENT IS UNCONTROLLED WHEN PRINTED
ENG450_INTERNSHIPFINALREPORT_LERAA_30773254_TRONIC OMITTED – Issued 19/12/2012 17:09 Page 7 of 64
Different design options can be proposed for both data transmission and power supply (see Figure 2 below) and these are explored further below.
Figure 2 - Offshore Design Options
7.1. Hybrid Subsea Cable Providing power and Data Transmission
The use of a hybrid subsea umbilical to provide both power and data transmission is the oil and gas industry standard. This allows for simple deployment and minimised offshore components.
A typical system consists of a hybrid umbilical terminated through a bulkhead connected to a marinised vessel which may contain power conditioning devices, communication, logic processors and data acquisition hardware. This system allows for external onshore power generation and data control, minimising offshore complexity.
The options of both a power and a data cable will also be evaluated separately.
7.2. Subsea Local Generation
This could be realised by over sizing the pump for re-pressurising the low pressure recycle pipeline coupled to an alternator; this would however require a backup power supply in the form of a UPS for periods of low activity. A similar method was employed in CETO 3 and did not perform well.
Another option would be to use a Permanent Magnet Generator (PMG) which arguably might not experience the same difficulties as the previous alternator as PMG’s can be designed to produce full rated output at a low rpm (1-1500 rpm). Voltage regulators can be used to set the output voltage regardless of the rpm (provided it is within the operating ranges of both). There are issues with using an alternator as a generator such as overheating due to continual operation. The local generation already trialled used a Rapid Power alternator; this option could be used again with a better suited motor. However this would require testing to ensure performance.
7.3. Pole Mounted Local Generation
Whilst against the CWE business model it could be possible to use another form of local generation such as PV or Wind generation mounted on a pole. This would enable SCADA and communications systems to be located above the surface.
This may be of further interest in later projects when units are deployed further from the coast. Back of the envelope calculations for solar are not overly appealing given that a 24 hour 1 kW load would require a large battery bank and PV array of ~5.6 kW. However a combination of Wind and PV could provide an optimum solution.
7.4. 3G Wireless
CETO 3 used a communications buoy containing two 3G network modems and a SCADA system. This was linked to the subsea Pod via dual redundant umbilical cables. Post operative analysis has shown that the mooring system for the communications buoy and the modems were weak points. The mooring D shackles showed serious wear after a short time and the modems repeatedly lost connection. This system was intended to be used with local

PWEP - CONTROL AND MONITORING POWER SYSTEM FEASIBILITY ANALYSIS
CONFIDENTIAL – COMMERCIAL IN CONFIDENCE
THIS DOCUMENT IS UNCONTROLLED WHEN PRINTED
ENG450_INTERNSHIPFINALREPORT_LERAA_30773254_TRONIC OMITTED – Issued 19/12/2012 17:09 Page 8 of 64
subsea generation; however poor alternator performance during shore testing resulted in the battery being charged via a generator on a barge during testing.
7.5. Satellite
Satellite internet connections are available up to 2Mb/s, however this speed is not guaranteed. This type of system comes with a significant cost premium and is sensitive to weather. This scenario could be of further interest for far off coast deployments.
7.6. Acoustic Link
Submarine Acoustic transmission has been documented by D. Green (Green 2010) where it was used to monitor the remote location of several divers. This system was based upon the Teledyne Benthos Acoustic modem which is currently being used for military, oil and gas, oceanography and scouring underwater hazards applications. (Green 2010)
This system could also be deployed to transmit the data from the Buoyant Actuator (BA) to the Pod if coupled with a directional beam. It may also be applicable to use it to log data that will allow dynamic model representation. (Green 2010)
8. ASSUMPTIONS AND REQUIREMENTS
In order to evaluate the various design alternatives a range of criteria were developed regarding the operating requirements. These criteria were then given a weighting based on discussion with CWE team members and may be readdressed. These criteria are listed below and each design option is given a ranking with respect to each criterion. These rankings together with the weights allocated to the different criteria enabled the identification of the most promising options which were then set down for further research. The criteria used for this assessment were:
• Data transmission requirements are real time
• System must be modular
• Reliable Power
• Reliable Data Transmission
• Not be visually intrusive
• Simplicity
• Cost
Further criteria for the second stage of design were also developed and used to establish further design requirements. These are listed below:
• Sampling rate of 20 S/s per instrument
• 32 bit Precision
• Single mode optic fibre cables
• Approximately 140 instruments

PWEP - CONTROL AND MONITORING POWER SYSTEM FEASIBILITY ANALYSIS
CONFIDENTIAL – COMMERCIAL IN CONFIDENCE
THIS DOCUMENT IS UNCONTROLLED WHEN PRINTED
ENG450_INTERNSHIPFINALREPORT_LERAA_30773254_TRONIC OMITTED – Issued 19/12/2012 17:09 Page 9 of 64
9. DESIGN EVALUATION
Based upon the first set of criteria the Design Options have been evaluated by means of the decision matrices in Table 1 and Table 2.
This indicates that the system that has scored highest in regards to the above criteria based upon CWE’s design requirements is the use of a data and power umbilical.
The weightings used in these tables were developed with respect to industry standard COTS products and services based upon expected requirements and the conformance of the design requirements.
Table 1 - Design Evaluation Data Transmission, 5 = Good, 0 = Poor
Table 2 - Design Evaluation Power Transmission
10. FURTHER DESIGN
The process that will be used for the design selection and evaluation will be to establish the load requirements in detail. This will be done by using the established assumptions, the Instrumentation Data List, estimations of applicable Control Systems Hardware and uncertainty measures. After the load profile is established then the different relevant parameters will be discussed in order to establish the key objectives of power systems which have reliability, quality, safety, stability and economic performance.
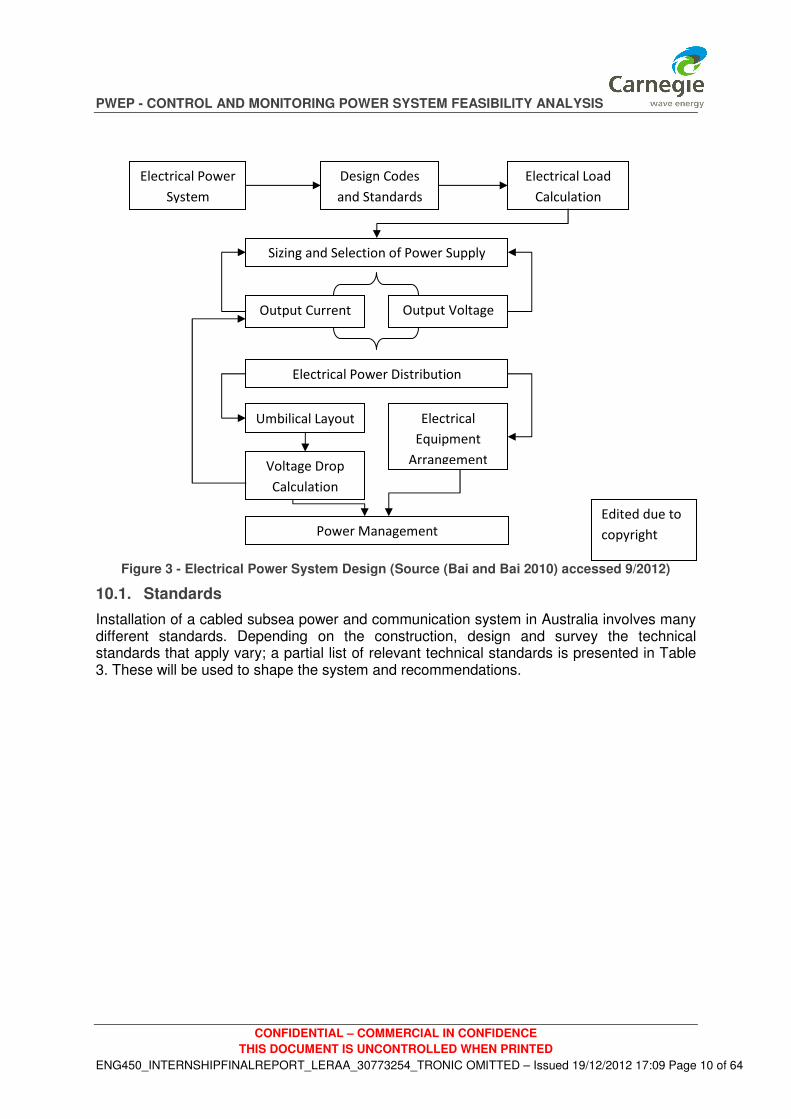
The power requirements can be defined in a process outlined by Bai et al. (Bai and Bai 2010)
This process is shown in Figure 3.
Categories
Communication
Systems Modular
Reliable Data
Communication
Out of
Sight?
Real Time
Communication Simplicity Cost Total Score
5% 20% 5% 15% 5% 50% 100%
Item
Copper Umbilical 5 4.5 5 4 5 2 3.2
Optical Umbilical 5 5 5 5 5 3 4.0
Satellite Link 5 3 0 3 3.5 3 2.9
3G Link 5 2.7 1 3 3.5 3 2.9
Acoustic Link 5 2 5 0 3 4 3.0
Weighting table # 2 Categories
Power Systems Modular Reliable Power
Out of
Sight? Simplicity Cost Total Score
5% 30% 5% 10% 50% 100%
Item
Subsea Alternator 5 2 5 3 3 2.9
Pole Mounted PV 5 3.5 0 3.5 2 2.7
Pole Mounted Wind 5 3.5 0 3.5 2 2.7
Power Cable 5 5 5 5 3 4.0
PWEP - CONTROL AND MONITORING POWER SYSTEM FEASIBILITY ANALYSIS
CONFIDENTIAL – COMMERCIAL IN CONFIDENCE
THIS DOCUMENT IS UNCONTROLLED WHEN PRINTED
ENG450_INTERNSHIPFINALREPORT_LERAA_30773254_TRONIC OMITTED – Issued 19/12/2012 17:09 Page 10 of 64
Figure 3 - Electrical Power System Design (Source (Bai and Bai 2010) accessed 9/2012)
10.1. Standards
Installation of a cabled subsea power and communication system in Australia involves many different standards. Depending on the construction, design and survey the technical standards that apply vary; a partial list of relevant technical standards is presented in Table 3. These will be used to shape the system and recommendations.
Electrical Power
System
Design Codes
and Standards
Electrical Load
Calculation
Sizing and Selection of Power Supply
Output Current Output Voltage
Electrical Power Distribution
Umbilical Layout Electrical
Equipment
Arrangement Voltage Drop
Calculation
Power Management
Edited due to
copyright

PWEP - CONTROL AND MONITORING POWER SYSTEM FEASIBILITY ANALYSIS
CONFIDENTIAL – COMMERCIAL IN CONFIDENCE
THIS DOCUMENT IS UNCONTROLLED WHEN PRINTED
ENG450_INTERNSHIPFINALREPORT_LERAA_30773254_TRONIC OMITTED – Issued 19/12/2012 17:09 Page 11 of 64
Table 3 - Relevant Standards and recommended Design Practises
Reference Title Year DNV-02-D202 Automation, Safety and
Telecommunication Systems 2008
DNV-RP-F401 Electrical Power Cables in Subsea Applications
2012
DNV-RPD-D201 Integrated Software Dependent Systems
2011
DNV-OSS-306 Verification of Subsea Facilities
2004
AS3000-2007 Wiring Rules 2007 IEC60092 Electrical Installations in
Ships 1994-08
DNV Guidelines on Design and Operation Of Wave Energy
Converters
2005
IMCA Guidelines for Isolation and Intervention - Diver Access
to Subsea Systems.
2009
AS 2067-2008 Substations and High Voltage Installations Exceeding 1kVAC
2008
AS 3008.1.1-2009 Electrical Installations - Selection of Cables
2009
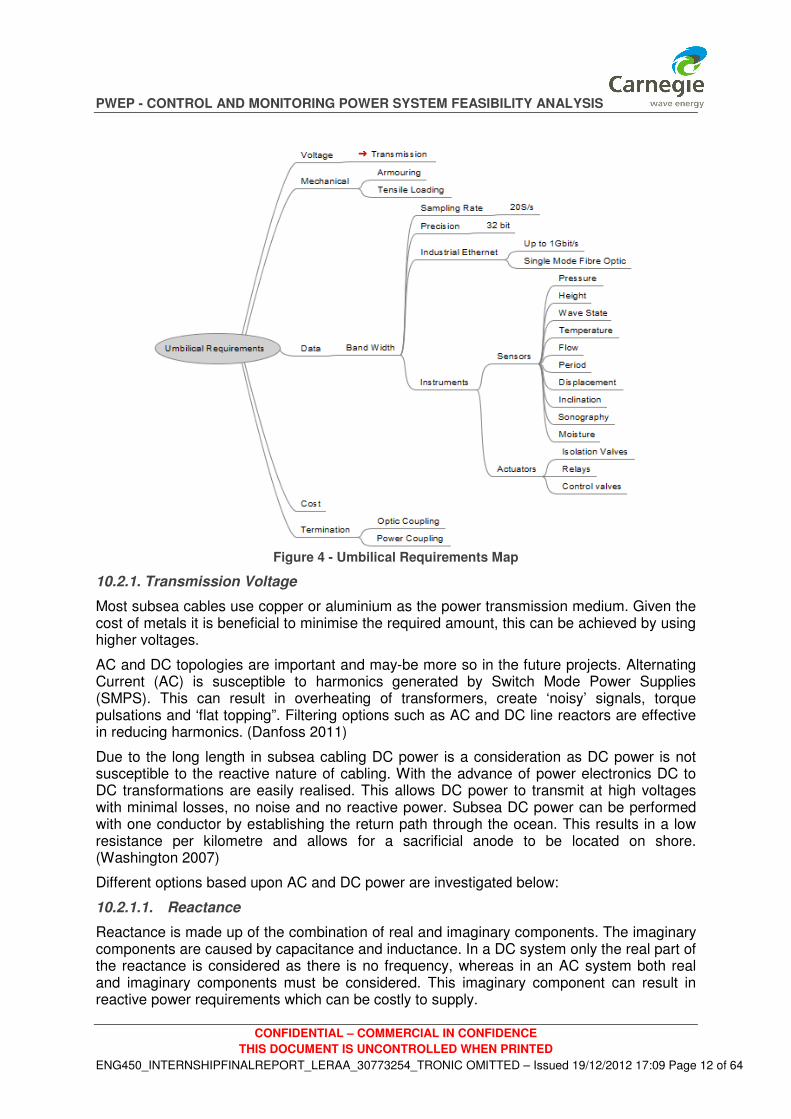
10.2. Hybrid Umbilical Requirements Analysis
The use of a hybrid subsea umbilical has been selected as the best fit for the design requirements in terms of performance and engineering for providing power and communication channels to a range of control and monitoring components located at a depth of 24 m, 3km offshore. Considerations that must be determined for this umbilical cable are shown in Figure 4. The detailed analysis of these different considerations is provided in the following sections.
PWEP - CONTROL AND MONITORING POWER SYSTEM FEASIBILITY ANALYSIS
CONFIDENTIAL – COMMERCIAL IN CONFIDENCE
THIS DOCUMENT IS UNCONTROLLED WHEN PRINTED
ENG450_INTERNSHIPFINALREPORT_LERAA_30773254_TRONIC OMITTED – Issued 19/12/2012 17:09 Page 12 of 64
Figure 4 - Umbilical Requirements Map
10.2.1. Transmission Voltage
Most subsea cables use copper or aluminium as the power transmission medium. Given the cost of metals it is beneficial to minimise the required amount, this can be achieved by using higher voltages.
AC and DC topologies are important and may-be more so in the future projects. Alternating Current (AC) is susceptible to harmonics generated by Switch Mode Power Supplies (SMPS). This can result in overheating of transformers, create ‘noisy’ signals, torque pulsations and ‘flat topping”. Filtering options such as AC and DC line reactors are effective in reducing harmonics. (Danfoss 2011)
Due to the long length in subsea cabling DC power is a consideration as DC power is not susceptible to the reactive nature of cabling. With the advance of power electronics DC to DC transformations are easily realised. This allows DC power to transmit at high voltages with minimal losses, no noise and no reactive power. Subsea DC power can be performed with one conductor by establishing the return path through the ocean. This results in a low resistance per kilometre and allows for a sacrificial anode to be located on shore. (Washington 2007)
Different options based upon AC and DC power are investigated below:
10.2.1.1. Reactance
Reactance is made up of the combination of real and imaginary components. The imaginary components are caused by capacitance and inductance. In a DC system only the real part of the reactance is considered as there is no frequency, whereas in an AC system both real and imaginary components must be considered. This imaginary component can result in reactive power requirements which can be costly to supply.

PWEP - CONTROL AND MONITORING POWER SYSTEM FEASIBILITY ANALYSIS
CONFIDENTIAL – COMMERCIAL IN CONFIDENCE
THIS DOCUMENT IS UNCONTROLLED WHEN PRINTED
ENG450_INTERNSHIPFINALREPORT_LERAA_30773254_TRONIC OMITTED – Issued 19/12/2012 17:09 Page 13 of 64
The imaginary part of the reactance can be changed by altering the frequency. In order to overcome the reactance of subsea cables it is sometimes considered to use lower frequencies requiring the use of frequency converters.
(a) Resistance
Resistance of the subsea cable is important, as high resistance results in energy wasted as heat. Resistance varies between AC and DC with respect to the skin effect and the conductivity of the material. Paralleling of conductors is an effective method of reducing resistance; however it also comes with additional cost. A representative resistance for the types of cables being considered for this application was used for initial modelling. It is based upon an existing South Bay Cable quote and is approximately 2 Ω / km.
(b) Inductance
Inductance is a property of a conductor which can limit the power being sent over a power line.
Inductors operate by storing charge in a magnetic field. The inductance of a line results in reactive power requirements; without power factor correction this can be expensive. The inductive reactance is given by equation 1 in Table 14 which is found in A.2..
Initial calculations have shown that the inductance of the South Bay Cable proposed for budgetary planning is negligible at 2.95E-4H/km. (Detailed analysis is presented in System Modelling)
(c) Capacitance
Capacitors operate by storing charge in an electric field between two conductors separated with some sort of dielectric. In this situation the conductors are the active and neutral and the dielectric consists of the gap between the two.
South Bay cables offered a capacitance of 6.56E-9 F/km.
The equation for capacitive reactance is given by equation 2 in Table 14.
In a traditional power distribution system the capacitance is neglected for short transmission systems as the inductance outweighs it. However when using a bundled cable where the gap between conductors is small, the capacitance comes into play and may be a significant factor. (Detailed analysis is presented in System Modelling)
10.2.1.2. Single Phase AC Power
Mains power is usually distributed at either 415 V three phase or 240 V single phase. The application of AC power underwater is slightly different from normal above ground scenarios.
The models that are typically used to model short, medium and long transmission lines do not apply very well. However it is possible to use power flow analysis and PI and T line models to examine the effects that come into play for subsea multi-core AC cabling. (See A.1 System Modelling)
Howe et al (2002) discuss elements of terrestrial power systems applied to subsea systems and note that for a 60 Hz system at 5 kV it requires ~ 2 kVAR at $5 per VAR per km to correct the power factor to an appropriate level. This figure is likely to be lower today given the date of the research and advances in power electronics. But even at $2 per VAR per km, 3km would require $12000 worth of compensation.
For basic modelling purposes it was assumed that 1 kW (see 6.1, this is further developed in 11.1) of power was required at a distance of 3 km. Thus by stepping the voltage up, a

PWEP - CONTROL AND MONITORING POWER SYSTEM FEASIBILITY ANALYSIS
CONFIDENTIAL – COMMERCIAL IN CONFIDENCE
THIS DOCUMENT IS UNCONTROLLED WHEN PRINTED
ENG450_INTERNSHIPFINALREPORT_LERAA_30773254_TRONIC OMITTED – Issued 19/12/2012 17:09 Page 14 of 64
reduction in current can be achieved. Two options investigated are the use of a step up and step down transformer or just a step up transformer.
The first proposed topology with two transformers is shown in Figure 5.
Figure 5 - AC power Transmission with Step Up and Step Down Transformers
The different voltage regimes that have been investigated are 240//600 VAC, 240//1200 VAC. These were selected after some initial calculations to identify the required voltage level (and hence current level) to achieve less than 5% voltage drop over the umbilical.
The second proposed topology with one transformer uses only a step up transformer allowing for just enough of a step so that the voltage “drops” to 240 at the load.
Calculations have shown that a step up of 240 // 270 (assuming 100% efficient transformer) would be required to achieve 240 at the load. However given the fluctuating nature of the load, this may cause problems with over voltage at times of low loading. Therefore this approach was discarded.
10.2.1.3. 3 Phase Power
Using 3 phase power allows more power to be transferred with fewer wires than 3 equivalent single circuits. This can be done with a 3 wire (3 active) or 4 wire (3 active, 1 neutral) configuration, either delta or wye. Each has advantages and disadvantages which will not be discussed here. Given 3 lines serving an equivalent single line load, the current will be smaller in each of the three lines than the singular equivalent. Combined with Ohms law this produces significant loss reductions as well as a reduction in cable size.
Three phase systems were considered;240 VAC, 600 VAC and 1200 VAC systems; using three phases at 240 VAC results in a load voltage of ~ 220 VAC and a reduction in losses from 469W to 81W.
Additional to the three phase power is the distribution which can be done by either rectifying to DC or using three phases broken into 3 single phase circuits. This will require loading to be done evenly. A delta to wye conversion stage could be used to minimise wires over the transmission link.
Given the range of international voltages, 220 VAC will be usable, requiring only distribution; which may be done by combining two Pods on each phase to achieve balanced loading where the PLEM is seen as having a load equivalent to a Pod. Considerations would need to be made to address uneven loading of phases.
10.2.1.4. Transformers
Transformers are required to change the voltage level from the transmission level to the distribution level. Typical transformers are essentially inductors coupled together via an iron core. The different number of coils on each side allows for stepping up or down of voltage and current levels. Other options exist such as power electronic transformers or commonly

PWEP - CONTROL AND MONITORING POWER SYSTEM FEASIBILITY ANALYSIS
CONFIDENTIAL – COMMERCIAL IN CONFIDENCE
THIS DOCUMENT IS UNCONTROLLED WHEN PRINTED
ENG450_INTERNSHIPFINALREPORT_LERAA_30773254_TRONIC OMITTED – Issued 19/12/2012 17:09 Page 15 of 64
solid state transformers. These are still quite a new technology but can be quite small and efficient, albeit expensive.
Various vendors were contacted for iron core transformer quotes; due to the low power requirement, many Commercial off the Shelf (COTS) higher voltage transformers were over rated, which would result in low loading efficiencies. Custom transformers could be designed to perform at higher voltages with appropriate ratings. Tortech in Sydney is one such company.
Of some concern is the effect that the magnetic field from the transformer may have on nearby electronic devices.
The IEE forbids the use of oil filled transformers for mobile and fixed offshore installations; all transformers will need to conform to IEC60076. (DNV, Guidelines on design and operation of wave energy converters 2005)
Taps can be used on transformers to take into account the voltage drop across the line so that the desired output voltage is achieved.
10.2.1.5. DC Power
Most subsea monitoring systems use a HVDC link for transmission; this is largely done because of the high cost of reactive power compensation and the cost of cabling.
The DC power topology considered in this study is one with two conductors. In order for this to be realised various power electronic devices would need to be used.
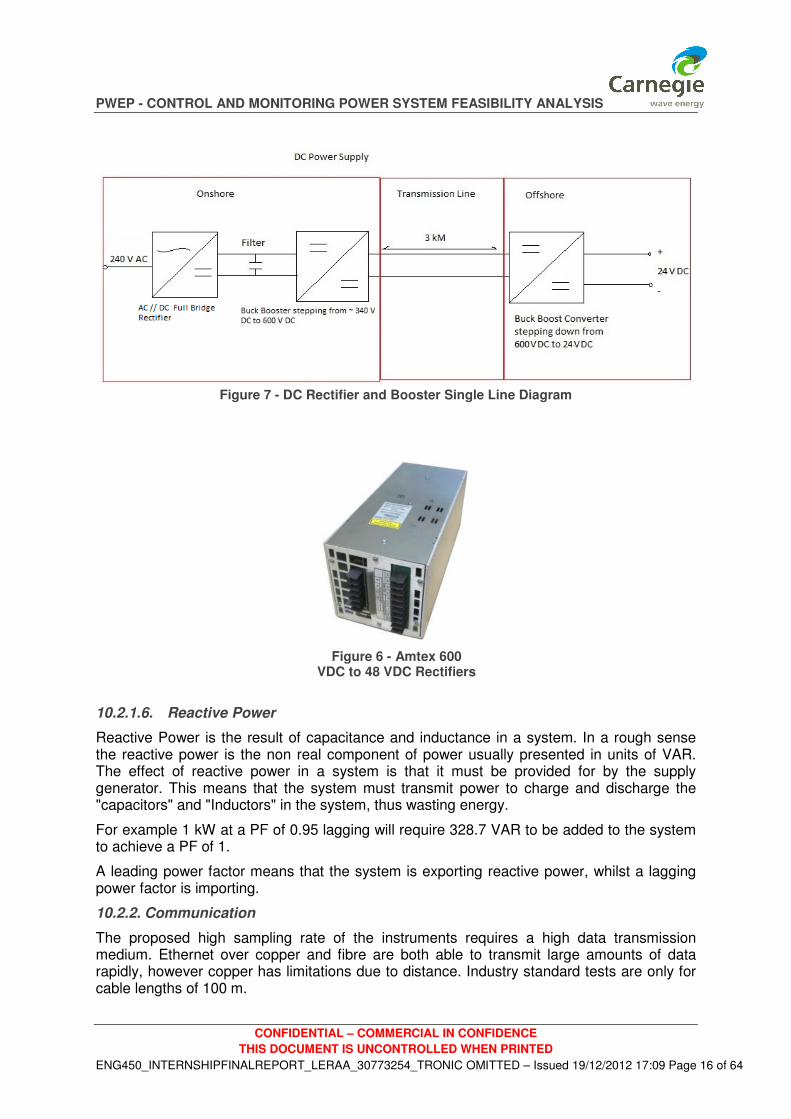
Rectifying from AC to DC power can be performed by several devices; however a full bridge rectifier is most likely to be used due to the higher power rating. Once rectified, the voltage must be stepped up, which can be done by a boost converter. This can then be transmitted down the cable where a buck converter can be used to step the voltage back down to distribution level (24 VDC).
Ampcontrol and Amtex were both approached for quotes, thus far Amtex have come back with a quote of $2,355 for a 240 VAC to 600 VDC and $1,432 for 600 VDC to 24 VDC. However the step down unit is lower rated and the efficiencies are only 80%. These units are a custom solution and the output voltage can be set to any required level up to 600 VDC.
The topology is as follows: (Figure 6 and Figure 7)
PWEP - CONTROL AND MONITORING POWER SYSTEM FEASIBILITY ANALYSIS
CONFIDENTIAL – COMMERCIAL IN CONFIDENCE
THIS DOCUMENT IS UNCONTROLLED WHEN PRINTED
ENG450_INTERNSHIPFINALREPORT_LERAA_30773254_TRONIC OMITTED – Issued 19/12/2012 17:09 Page 16 of 64
Figure 7 - DC Rectifier and Booster Single Line Diagram
10.2.1.6. Reactive Power
Reactive Power is the result of capacitance and inductance in a system. In a rough sense the reactive power is the non real component of power usually presented in units of VAR. The effect of reactive power in a system is that it must be provided for by the supply generator. This means that the system must transmit power to charge and discharge the "capacitors" and "Inductors" in the system, thus wasting energy.
For example 1 kW at a PF of 0.95 lagging will require 328.7 VAR to be added to the system to achieve a PF of 1.
A leading power factor means that the system is exporting reactive power, whilst a lagging power factor is importing.
10.2.2. Communication
The proposed high sampling rate of the instruments requires a high data transmission medium. Ethernet over copper and fibre are both able to transmit large amounts of data rapidly, however copper has limitations due to distance. Industry standard tests are only for cable lengths of 100 m.
Figure 6 - Amtex 600 VDC to 48 VDC Rectifiers

PWEP - CONTROL AND MONITORING POWER SYSTEM FEASIBILITY ANALYSIS
CONFIDENTIAL – COMMERCIAL IN CONFIDENCE
THIS DOCUMENT IS UNCONTROLLED WHEN PRINTED
ENG450_INTERNSHIPFINALREPORT_LERAA_30773254_TRONIC OMITTED – Issued 19/12/2012 17:09 Page 17 of 64
Sensitive technologies such as telecommunications usually are grounded in a manner to ensure the minimum interference to the system.
10.2.2.1. Medium
Twisted pair cables are relatively cheap and reliable; however they are susceptible to electromagnetic interference and have attenuation problems over long distances.
Optical fibre is suitable for long distances, less sensitive to electromagnetic interference, has low attenuation and more frequencies are able to be transmitted at super fast speeds. Optical fibre can be either single mode or multi mode, the main difference is single mode optic fibre allows only one ‘mode’ of light to pass, resulting in lower attenuation and higher speeds. (Irujo and Kamino 2012)
10.2.2.2. Size
Initial surveying has shown approximately 140 instruments with a total load of approximately 600 W, this estimated load has been increased to 1 kW to allow for extras.
Given an estimated sampling rate of 20 s / s, 32 bit precision the maximum sampling rate is expected to be approximately 166 kb / s, this can easily be met by a single mode optical fibres (4 are assumed for redundancy and out of band communication as well as MOQ).
10.2.2.3. Composition
The current known requirements are summarised in the table below which has been sent to De Regt, UVS and South Bay Cable for quotations. (The specification of this has involved Colleagues at CWE).
Table 4 - Umbilical Performance and Design Requirements
10.2.3. Reliability
Redundancy will allow for unexpected component failure, as shown by the additional optic fibres. Wet mate connectors can be used so that in the event of failure replacement can be made without removing the whole unit. These are the standard connection used in deep sea monitoring stations. Vendors offer different configurations for divers and ROV installations.

PWEP - CONTROL AND MONITORING POWER SYSTEM FEASIBILITY ANALYSIS
CONFIDENTIAL – COMMERCIAL IN CONFIDENCE
THIS DOCUMENT IS UNCONTROLLED WHEN PRINTED
ENG450_INTERNSHIPFINALREPORT_LERAA_30773254_TRONIC OMITTED – Issued 19/12/2012 17:09 Page 18 of 64
10.2.4. Installation
Installing an umbilical can be done in several ways.
10.2.4.1. Clamped to piping and pulled out
Clamping can be performed by using cable ties with a load spreader underneath the cable tie to minimise localised pressure.
10.2.4.2. Floated
Floating is possible with both individual floats and a continuous float. This seems to be an arduous and expensive method.
10.2.4.3. Pulled through a pipe
This is done by blowing through a tracer wire and pulling through the cable attached to a pulling head. Depending on the size of the umbilical termination this may be only possible from offshore to onshore. This will remove the need for securing the hybrid umbilical.
10.2.4.4. Anchoring
Anchoring the cable is required to prevent damage. The cable is required to be negatively buoyant and secured to the sea bed in some manner. A consideration for boat anchors should be made. Typically this is done by either clamping to another structure or burying.
(a) Clamped to a pipe
Clamping to a pipe will provide anchoring. Trelleborg offer clamping solutions that could be used. However this will add additional cost and it may be cheaper to deploy an additional pipe for the Shore to PLEM umbilical. (Trelleborg AB 2007)
(b) Buried
Burying cables is commonly done by ROV, directional drilling or with a subsea plough.
10.2.5. Durability
The cable must be robust enough to be deployed in a potentially moving sea and last the length of the plant life; this may require torque balanced armouring, Kevlar lining. Further information is available in the DNV standard Electrical Power Cables in Subsea Applications; as the hybrid umbilical is to be purchased from a vendor the technical design will not be discussed past the maximum tensile loading required.
The maximum tensile loading during installation has been estimated by a colleague as Maximum Tensile Loading = Weight of the cable *0.5 [worst case friction] *2 [worst case dynamic amplification factor].
10.2.6. Cost
The cost will depend on the final composition of the cable, a higher voltage will allow for smaller conductors to be used. Ball Park estimates range from $30 USD / m to €90 / m based upon initial quotes from SBC and De Regt
10.2.7. Availability
Vendors have indicated the following lead times for budgetary planning:
De Regt: 12-16 Weeks.
South Bay Cable 16-18 Weeks
Underwater Video Systems (UVS) – 12 Weeks
PWEP - CONTROL AND MONITORING POWER SYSTEM FEASIBILITY ANALYSIS
CONFIDENTIAL – COMMERCIAL IN CONFIDENCE
THIS DOCUMENT IS UNCONTROLLED WHEN PRINTED
ENG450_INTERNSHIPFINALREPORT_LERAA_30773254_TRONIC OMITTED – Issued 19/12/2012 17:09 Page 19 of 64
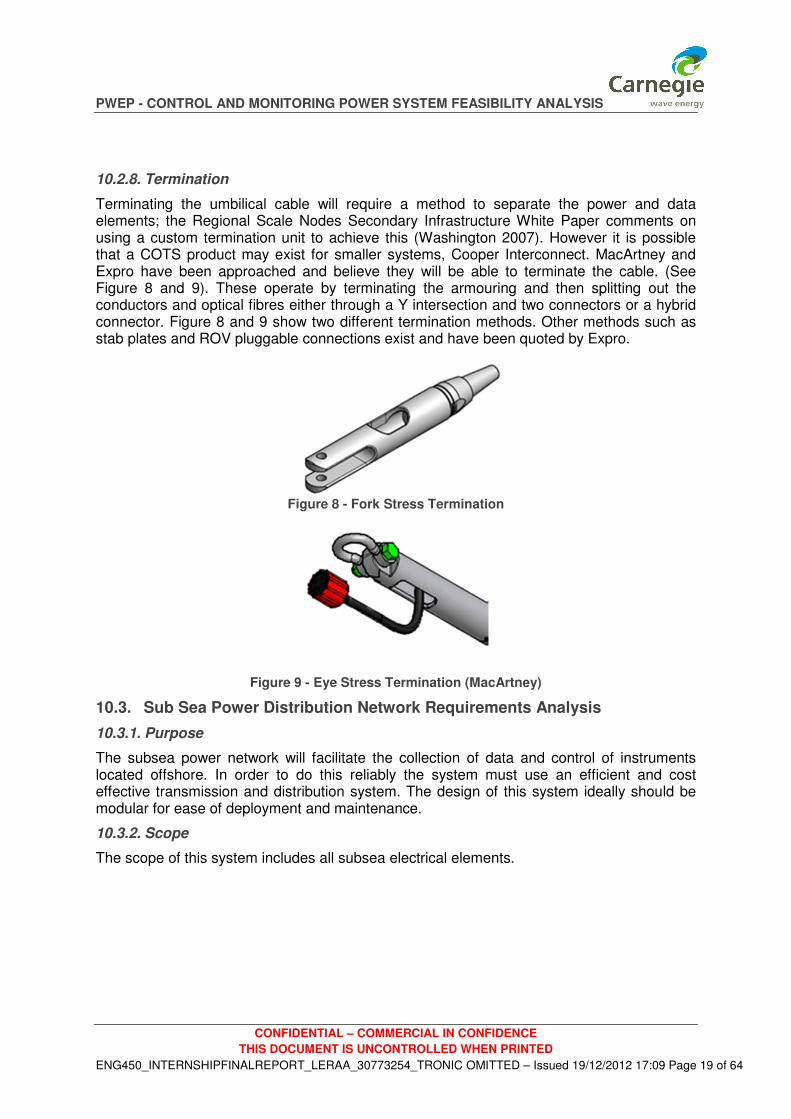
10.2.8. Termination
Terminating the umbilical cable will require a method to separate the power and data elements; the Regional Scale Nodes Secondary Infrastructure White Paper comments on using a custom termination unit to achieve this (Washington 2007). However it is possible that a COTS product may exist for smaller systems, Cooper Interconnect. MacArtney and Expro have been approached and believe they will be able to terminate the cable. (See Figure 8 and 9). These operate by terminating the armouring and then splitting out the conductors and optical fibres either through a Y intersection and two connectors or a hybrid connector. Figure 8 and 9 show two different termination methods. Other methods such as stab plates and ROV pluggable connections exist and have been quoted by Expro.
Figure 8 - Fork Stress Termination
Figure 9 - Eye Stress Termination (MacArtney)
10.3. Sub Sea Power Distribution Network Requirements Analysis
10.3.1. Purpose
The subsea power network will facilitate the collection of data and control of instruments located offshore. In order to do this reliably the system must use an efficient and cost effective transmission and distribution system. The design of this system ideally should be modular for ease of deployment and maintenance.
10.3.2. Scope
The scope of this system includes all subsea electrical elements.

PWEP - CONTROL AND MONITORING POWER SYSTEM FEASIBILITY ANALYSIS
CONFIDENTIAL – COMMERCIAL IN CONFIDENCE
THIS DOCUMENT IS UNCONTROLLED WHEN PRINTED
ENG450_INTERNSHIPFINALREPORT_LERAA_30773254_TRONIC OMITTED – Issued 19/12/2012 17:09 Page 20 of 64
Figure 10 - Subsea Power Distribution Network Scope
10.3.3. PLEM
The PLEM will contain the central manifold for the distribution of power and data for the subsea network: depending on the requirements the PLEM could act as a node with throughput capability and local monitoring and control elements. This concept could be worth exploring as it may be relevant in further larger installations. The Regional Scale Nodes Secondary Infrastructure White Paper by the University of Washington includes several ideas that are of interest. (Washington 2007)
10.3.4. Infrastructure
The PLEM SCM will act as the central hub for the Pod SCM’s and will contain power conditioning devices, data switches, contactors and outputs to the Pods.
The SCMs will need to be designed with enough volume to ensure sufficient cooling for the SCADA and the power conditioning devices. Typical construction of these is either plate metal or polymer; they are generally sealed with an O-ring and filled with an inert gas for pressure compensation. Connections made through the pressure seal must be pressure tested and sealed appropriately; commonly pressure gauges or moisture sensors are used to detect leaks.
Additional SCM’s may be required in the event that dual redundant controllers are required. This would allow individual component replacement, but will require additional costs.
Power is required to be distributed from the central transmission location to the radial loads.
10.3.5. Subsea Umbilical Termination Assembly
The Subsea Umbilical Termination Assembly (SUTA) can be configured as a remote unit with power and optic flying leads connecting to the central Subsea Control Module (SCM) or to the Pod modules. It is also possible that this may be integrated into the PLEM SCM. However, this will make in situ component replacement difficult. Two different termination options are shown in Figure 8 and 9.

PWEP - CONTROL AND MONITORING POWER SYSTEM FEASIBILITY ANALYSIS
CONFIDENTIAL – COMMERCIAL IN CONFIDENCE
THIS DOCUMENT IS UNCONTROLLED WHEN PRINTED
ENG450_INTERNSHIPFINALREPORT_LERAA_30773254_TRONIC OMITTED – Issued 19/12/2012 17:09 Page 21 of 64
10.3.6. Pod
Each Pod will house an SCM connected to 11 local instruments, additionally a further 10 instruments from the pump will be marshalled on the pump and linked to the Pod SCM. Each Pod SCM will require a power and data link from the PLEM SCM.
10.3.7. Intra Array Cabling
Intra array cabling will run from the PLEM SCM bulk-head to the Pod SCM and may consist of pressure compensated lines either oil or gel filled. These cables will be terminated by wet mate connections to allow for in situ removal.
The intra array cabling will need to be able to support the communication medium. In the event that single mode optical fibre is used, then the cable must be a hybrid cable with wet mate terminations.
Each cable is up to 100m in length and 5 sets are required.
Expro provided a quote for providing the connections from the Pods to the PLEM, including bulk heads and wet mate connectors for £xxxxxx (Expro International Group Ltd 2010). This quote is based on a deep sea system and is in excess of CWE's requirements. This quote is from a previous project performed by a colleague at CWE and is shown in Figure 11and Table 5. A more recent quote is discussed in 11.3.2.2.
Both Cooper Interconnect and MacArtney have also been approached for quotes.
Figure 11 - Expro Scope of Work
Table 5 - Expro Scope of Work (1st Quote)
In light of this large cost the option of running the same cable as the Shore to PLEM hybrid umbilical to each Pod could be feasible provided the cost of the termination is not too great.
10.3.7.1. Wet Mate Connectors
Wet mate connectors operate by having a male connection on the bulk head and female connectors filled with a gel, nominally silicone grease; this allows for subsea connection; these will be used to allow for in situ removal and replacement. These connectors have a set
Image removed due to copyright
Image removed due to copyright

PWEP - CONTROL AND MONITORING POWER SYSTEM FEASIBILITY ANALYSIS
CONFIDENTIAL – COMMERCIAL IN CONFIDENCE
THIS DOCUMENT IS UNCONTROLLED WHEN PRINTED
ENG450_INTERNSHIPFINALREPORT_LERAA_30773254_TRONIC OMITTED – Issued 19/12/2012 17:09 Page 22 of 64
life based upon the number of disconnections and reconnections; this is not anticipated to be a problem.
10.3.8. 3 Phase Distribution
Loads can be connected to a three phase system in two methods, either line to line or line to neutral. Depending on the transformer options used it is possible to have a 3 wire or 4 wire systems. A 4 wire system is required if low power single phase devices are required. The use of three phase power provides three single phases; these can be used individually when connected with the neutral.
This topology could be deployed in the PWEP array by connecting two Pods to each phase assuming the PLEM load is equivalent to a Pod load.
Three phase AC power can easily be rectified into DC. This may then require further conditioning to achieve desired voltages at each Pod.
10.3.9. Single Phase Distribution
Using single phase distribution lowers the complexity of the installation as load balancing is not required and each SCM can be wired in parallel. Loads can be floating with 2 wires or earthed with 3 wires. It is also possible to wire the system in series. However this is not recommended as the voltage would not be constant across the loads.
10.3.10. DC Distribution
DC distribution can be performed with only one conductor, using the sea as a return link. Alternatively it can be performed with two conductors removing the need for sacrificial anodes. In the event that AC power is required a small pure sine wave inverter could be used to provide an AC bus. These are common technologies and are readily available.
10.4. Earthing
Earthing is typically done for safety, equipment operation and performance. This installation is, however, slightly unique in that it is not totally shore bound nor is it a floating installation such as a ship; the IEC standard 61892 indicates that earthing is sometimes required for floating objects. Mine sites and some marine vessels do not earth their systems so that in a fault scenario the system keeps operating.
Industry standard for subsea power systems is to not ground any of the marinised containers in order to prevent a ground leakage path which can lead to excessive corrosion.
Generally an earth cable is laid along with the power cables, which AS 3000 states must be sized according to the largest current carrying wire. As such for either single phase or 3 phases there must be either 3 or 4 conductors, respectively.
The correct point to earth a DCS is at the zero potential point in the system, which is usually in the power distribution panel.
Reasons for using an earthed system are:
• To ensure timely operation of over-current protection devices for ground fault scenarios.
• Limiting potential differences between grounded objects.
• Limiting transient voltages due to lightning and load switching events.
• Ensures a good return path for SPDs and Filters.
As an alternative to running an earth cable it is possible to leave the system as a floating system. Floating systems are immune to ground loops, but can result in dangerous voltages

PWEP - CONTROL AND MONITORING POWER SYSTEM FEASIBILITY ANALYSIS
CONFIDENTIAL – COMMERCIAL IN CONFIDENCE
THIS DOCUMENT IS UNCONTROLLED WHEN PRINTED
ENG450_INTERNSHIPFINALREPORT_LERAA_30773254_TRONIC OMITTED – Issued 19/12/2012 17:09 Page 23 of 64
being present on the installation. Ideally the power sources will be earthed to a common point with the loads, but the sensors will be left to float via isolated modules.
In a normal situation the earth cable is used to provide a common point between conductive structures. However the proposed PWEP installation is stated to use an optical link between the shore and the PLEM and Pods, this enables the installation to not require an earth cable as each section is optically and galvanically isolated. AS 2067-2008 requires earthing as to minimise touch potential and earth potential rise. The offshore PWEP installation will be solidly earthed at the LV side of the onshore transformer. This means that as the hybrid umbilical and offshore power distribution is sealed it is not required to be earthed and the infield distribution is classed as a separated circuit according to AS 3000:2007 (7.4.2). Hence an earth cable is not required and each SCM will have its own local reference.
10.4.1. Lightning and Surge Protection
Given the sensitivity of electrical control systems to surge currents it is necessary to look at the possibility of a lightning strike in the area. The chances of lightning strikes in WA is low, however it is possible that a local strike may have an effect on the control system. A 200 kVA strike will cause 40 mA in the surrounding seawater for 21 m; this may be significant enough to induce a current in some sensors resulting in a data blip. Surge protection should be included in the design to limit the amount of current that is available to the offshore installation. Surge protection is sometimes manufactured into some sensor modules or as an available add-on. The use of the optical isolation between the Pods and PLEM combined with the optical isolation on the sensors results in the subsea distribution system being a series of isolated systems.
(IMCA, Code of Practice for The Safe Use of Electricty Underwater 2010)
In the event that a surge caused by a lightning strike occurs, then it is possible that digital signals may be affected. If this occurs at the time a signal is being sent then there is a 50 % chance that the signal may latch in the wrong direction. Otherwise in stable latched positions digital sensors are relatively immune to transient currents. This is not anticipated to be a problem as the switching events are not likely to be frequent.
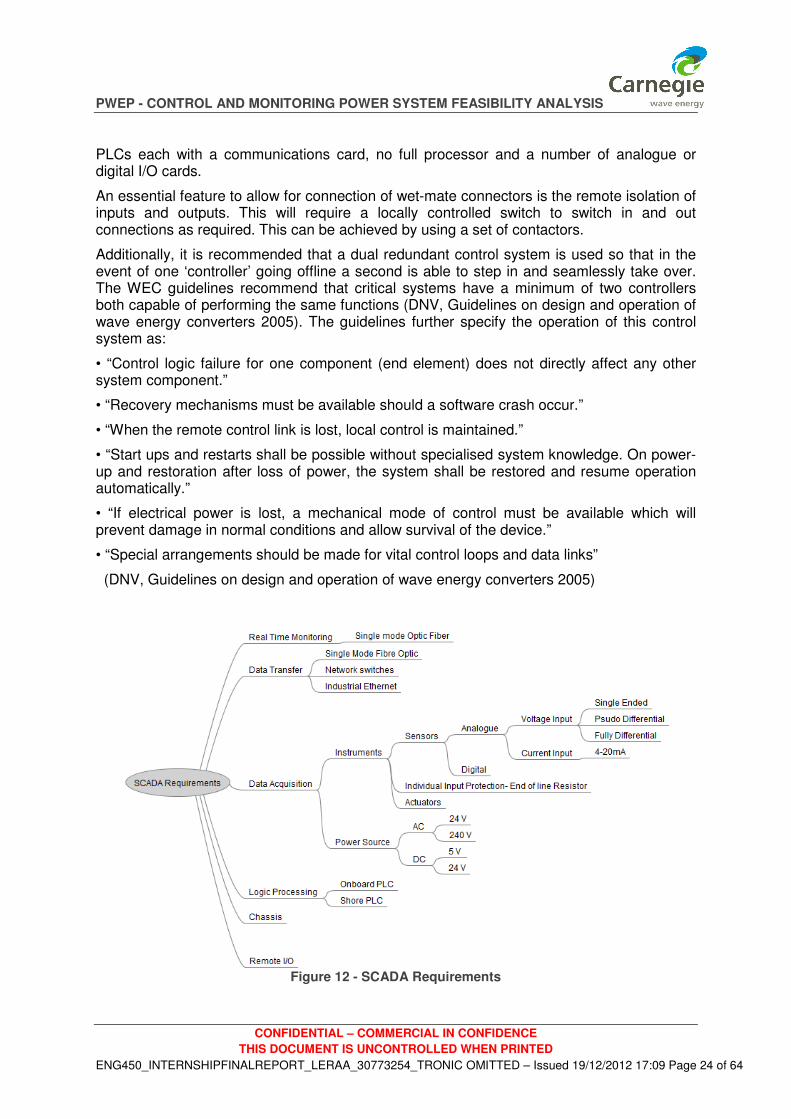
10.5. Subsea SCADA Requirements Analysis
The role of the subsea SCADA system is to provide some control functions to valves and collect information from the field sensors. A map of the requirements is shown in Figure 12.
The SCADA system will need to be located in a marinised container with bulkheads allowing wet connection of the umbilical, sensors and intra Pod communications.
Local to the PLEM will be ~34 instruments which will require monitoring and control. Given the high level of programmability of modern PLCs this could be done by a central PLC which then has remote I/O’s located on each Pod. The central processor will need an optical to digital multi port switch. This switch will allow data from the Pods to be transmitted to the main data centre.
Control system providers offer configurable products that can be arranged to have a processor, a number of I/O, network switches and power supplies that are able to execute typically 500 instructions in less than 2 ms.
The specifics of the SCADA architecture will largely depend on the requirements. For example it is possible to have one central PLC with a processor, 5 communication ports, analogue I/O cards, and an analogue card for remote shut down, connected to 5 remote
PWEP - CONTROL AND MONITORING POWER SYSTEM FEASIBILITY ANALYSIS
CONFIDENTIAL – COMMERCIAL IN CONFIDENCE
THIS DOCUMENT IS UNCONTROLLED WHEN PRINTED
ENG450_INTERNSHIPFINALREPORT_LERAA_30773254_TRONIC OMITTED – Issued 19/12/2012 17:09 Page 24 of 64
PLCs each with a communications card, no full processor and a number of analogue or digital I/O cards.
An essential feature to allow for connection of wet-mate connectors is the remote isolation of inputs and outputs. This will require a locally controlled switch to switch in and out connections as required. This can be achieved by using a set of contactors.
Additionally, it is recommended that a dual redundant control system is used so that in the event of one ‘controller’ going offline a second is able to step in and seamlessly take over. The WEC guidelines recommend that critical systems have a minimum of two controllers both capable of performing the same functions (DNV, Guidelines on design and operation of wave energy converters 2005). The guidelines further specify the operation of this control system as:
• “Control logic failure for one component (end element) does not directly affect any other system component.”
• “Recovery mechanisms must be available should a software crash occur.”
• “When the remote control link is lost, local control is maintained.”
• “Start ups and restarts shall be possible without specialised system knowledge. On power-up and restoration after loss of power, the system shall be restored and resume operation automatically.”
• “If electrical power is lost, a mechanical mode of control must be available which will prevent damage in normal conditions and allow survival of the device.”
• “Special arrangements should be made for vital control loops and data links”
(DNV, Guidelines on design and operation of wave energy converters 2005)
Figure 12 - SCADA Requirements

PWEP - CONTROL AND MONITORING POWER SYSTEM FEASIBILITY ANALYSIS
CONFIDENTIAL – COMMERCIAL IN CONFIDENCE
THIS DOCUMENT IS UNCONTROLLED WHEN PRINTED
ENG450_INTERNSHIPFINALREPORT_LERAA_30773254_TRONIC OMITTED – Issued 19/12/2012 17:09 Page 25 of 64
10.5.1. Instruments and Sensors
The bulk of the load will be sensors and instruments. This includes approximately 11 electrically activated hydraulically powered valves which will draw 15 W each. The rest of the instruments are assumed to operate at 4 - 20 mA and 24 VDC.
Instruments will need to be chosen to have the appropriate specifications. A list of design parameters has been established as:
• Range
• Voltage
• Dynamic Response
• Resolution
• Communication
• IP Rating
Lesser concerns include:
• Number of wires
• Output
Monitoring of the PWEP will allow for data collection to validate and further improve designs. The parameters that are of interest are:
• Hydraulic pressure at various locations
• Hydraulic flow at various locations
• Velocity of various machine parts
• Temperature
• Wave state
• Motor and pump torque
• Vibration
• Force
• Event
• State
• Position
These parameters are given generally. Due to the size and complexity of the subsea sector of the PWEP further description of these parameters is deemed beyond the scope of this document.
These sensors will need to be chosen so that they are able to accurately measure the parameters within the expected range. A margin for error will be included, and has been assumed as 1.1 for the maximum expected values. Different types of sensors require 2, 3 or 4 wires.
The specific instruments and locations are kept in the IDL, including a description of function and location. This has been further furnished with the above requirements and is to be sent

PWEP - CONTROL AND MONITORING POWER SYSTEM FEASIBILITY ANALYSIS
CONFIDENTIAL – COMMERCIAL IN CONFIDENCE
THIS DOCUMENT IS UNCONTROLLED WHEN PRINTED
ENG450_INTERNSHIPFINALREPORT_LERAA_30773254_TRONIC OMITTED – Issued 19/12/2012 17:09 Page 26 of 64
to suppliers as an RFQ and then freely issued to various vendors. Choosing the instruments is a separate issue and will not be discussed further.
10.5.2. I/O Modules
Analogue I/O modules take an analogue signal such as 4-20mA and convert it to a digital signal. Many of these modules include a filtering function.
Depending on the power requirements these sensors can be powered either by the module or by a remote power source.
Digital sensors work by monitoring discrete signals in the PWEP. These are mainly switches which are either on or off.
10.5.2.1. Resolution
The assumed sampling resolution of 32 bit is not a commonly used value in industry. Common industry practises only offer 16 bit, which allows for accuracy to be approximately 0.0015%. (See Assumptions and Requirements)
10.5.2.2. Time Stamping
It is desired that all measurements are accurately time stamped with reference to one clock. This can be performed by synchronising each remote I/O to the master on shore system. Real time data will not always be required; it is possible for a remote I/O to submit a time stamped package to the data logging system. This may be required to prevent bottlenecks and reduce latency. Each module will multicast data to its own chassis at the Real Time Sampling (RTS) rate as specified. This will then be transmitted to the SCM that ‘own’ the I/O device. The exact configuration of these systems varies from supplier to supplier, but generally all will have programmable sampling and transmission rates. Different options exist to manage the network application layer over a link layer such as industrial Ethernet. These protocols are available in an open or propriety manner. Examples of these are DeviceNet, Profibus and EtherNet/IP; the selection of the protocol must match the source and consumer devices.
10.5.2.3. Analogue to Digital Conversion
When choosing a sensor the resolution of the Analogue to Digital Converter (ADC) is important. The ADC works by taking a continuous signal and resolves it into many discrete steps. For example an ADC converter with a 16 bit output over the range from 0% to 100% can output 65536 unique data points and if applied to a pressure range of 0 to 300bar, this means each sampling step resolution is 4.58 mBar with an expected error of ± one-half * (the resolution).
10.5.2.4. Aliasing
Aliasing occurs when the sampling rate is too slow to represent the data. This can reduce the effectiveness of the control system. In theory the fastest that an ADC can successfully resolve is one-half of the sampling frequency.
10.5.2.5. Filtering
One of the most common causes of poor measurement is the ‘cross talk’. This occurs in systems that do not have an isolation amplifier on each input channel. Cross talk is caused by the capacitance of the input channels, which when combined with a high sampling rate and signal source impedance results in a charge being stored. This charge can superimpose the measured signal onto another channel causing corrupt data. This may be of concern in this project because of the high number of sensors sampling at 20 s/s.

PWEP - CONTROL AND MONITORING POWER SYSTEM FEASIBILITY ANALYSIS
CONFIDENTIAL – COMMERCIAL IN CONFIDENCE
THIS DOCUMENT IS UNCONTROLLED WHEN PRINTED
ENG450_INTERNSHIPFINALREPORT_LERAA_30773254_TRONIC OMITTED – Issued 19/12/2012 17:09 Page 27 of 64
Distorted measurement can be caused by the CMV. In order for good measurements to be achieved it is required that the NMV + CMV ≤ Full scale range, provided the CMR of the unit is up to specification.
These parameters are available on manufacturer’s specification sheets and should be considered when selecting units. Both crosstalk and CMV effects can be reduced by choosing modules that have isolated inputs allowing the front end of the instruments to float. This does come at a cost premium.
The use of optical isolation via single mode optical fibre links between Pods, PLEM and the shore will aid the clarity of the signals as each I/O card will be referenced to its own isolated point.
10.5.3. Bandwidth
Based upon the Instrument Data List (IDL) 216 instruments are expected to be sampling at 20 S/s with 32 bit precision or ~0.2 MB/s. In terms of monthly bandwidth, assuming a static load then the system will be transmitting approximately 46.3 Gb of data. Reducing the precision of the sampling to 16 bit will halve the bandwidth required to a modest 24.5 Gb. This is well within the capability of single mode optical fibre which can handle up to 10Gbit/s and industrial Ethernet as a Service Layer can handle 1 Gbit/s.
Intra-array connections could be copper connections such as CAT 5. However it is assumed to be a hybrid single mode optical fibre and power cable rated at either 240VAC or 48 VDC.
10.5.4. Chassis
Modern PLC’s are highly configurable; generally these consist of a chassis, with a power supply, I/O modules, a network card and a processor. The power supply is usually able to supply power to a set amount of modules with a set power requirement. Sensors requiring more power must be connected to an auxiliary power supply. These power supplies are fused and have a stabilised output. Some are able to take a wide range of inputs.
10.5.5. Logging Rate
The Onshore segment of the SCADA system must have a logging rate high enough to be able to log all the data being produced by the offshore system.
10.5.6. UPS
In the event of a power failure it is of interest to continually monitor the state of the subsea component of the PWEP. Given the existence of a large battery used on Ceto 3, it would be possible to include this as a submerged UPS.
In the event that the UPS is located subsea considerations must be made for the discharge of explosive gases even if a sealed type battery is used as in overcharge events these are still capable of releasing hydrogen.
Batteries as DC voltage sources can be hazardous to divers, given the ability of the battery to feed a fault. In off shore situations it is important to ensure that the IMCA guidelines for safe use of electricity and diver intervention be adhered to.
Given this consideration it is assumed that the UPS be located on shore and be able to power both the onshore and offshore sections for the rest of this document.
10.6. Data Switch
Single mode optic fibre links between the shore, PLEM and Pods will require single mode fibre capable switches. Using this topology will require one switch at the PLEM and a fibre port at each of the Pods. This system does come at an increased cost.
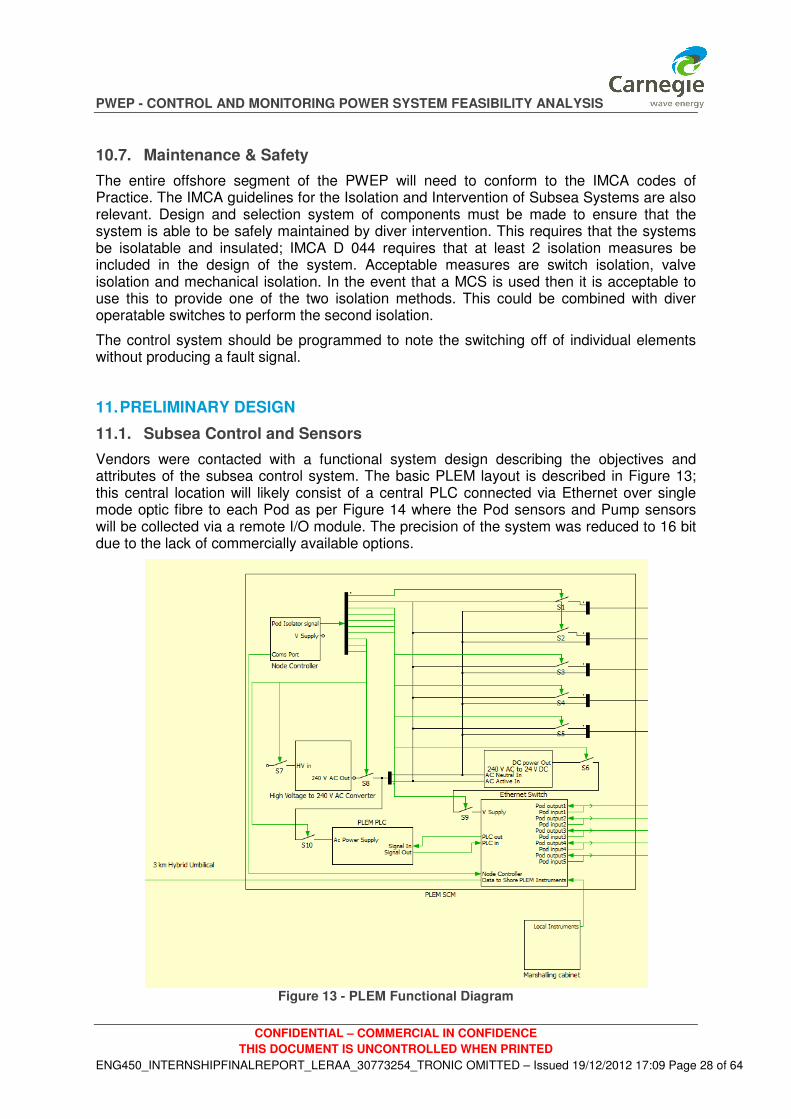
PWEP - CONTROL AND MONITORING POWER SYSTEM FEASIBILITY ANALYSIS
CONFIDENTIAL – COMMERCIAL IN CONFIDENCE
THIS DOCUMENT IS UNCONTROLLED WHEN PRINTED
ENG450_INTERNSHIPFINALREPORT_LERAA_30773254_TRONIC OMITTED – Issued 19/12/2012 17:09 Page 28 of 64
10.7. Maintenance & Safety
The entire offshore segment of the PWEP will need to conform to the IMCA codes of Practice. The IMCA guidelines for the Isolation and Intervention of Subsea Systems are also relevant. Design and selection system of components must be made to ensure that the system is able to be safely maintained by diver intervention. This requires that the systems be isolatable and insulated; IMCA D 044 requires that at least 2 isolation measures be included in the design of the system. Acceptable measures are switch isolation, valve isolation and mechanical isolation. In the event that a MCS is used then it is acceptable to use this to provide one of the two isolation methods. This could be combined with diver operatable switches to perform the second isolation.
The control system should be programmed to note the switching off of individual elements without producing a fault signal.
11. PRELIMINARY DESIGN
11.1. Subsea Control and Sensors
Vendors were contacted with a functional system design describing the objectives and attributes of the subsea control system. The basic PLEM layout is described in Figure 13; this central location will likely consist of a central PLC connected via Ethernet over single mode optic fibre to each Pod as per Figure 14 where the Pod sensors and Pump sensors will be collected via a remote I/O module. The precision of the system was reduced to 16 bit due to the lack of commercially available options.
Figure 13 - PLEM Functional Diagram

PWEP - CONTROL AND MONITORING POWER SYSTEM FEASIBILITY ANALYSIS
CONFIDENTIAL – COMMERCIAL IN CONFIDENCE
THIS DOCUMENT IS UNCONTROLLED WHEN PRINTED
ENG450_INTERNSHIPFINALREPORT_LERAA_30773254_TRONIC OMITTED – Issued 19/12/2012 17:09 Page 29 of 64
Discussed in the Neptune project is the inclusion of a controller whose sole function is the operation and control of the power system. This proposed controller monitors everything that is connected in the SCM to power. This concept allows the implementation of a start up algorithm, reducing the maximum inrush current seen by the whole system by staggering the powering up of individual components. This will also aid in fault finding as it would be possible to connect circuits one by one until the fault is located.
The proposed PLEM node controller will be able to remotely switch the inputs to each Pod via a set of remotely activated contactors controlled through the central data switch; this is required so that divers can safely wet mate umbilicals and cables to bulkheads without risk of electrocution, and also sections may be removed for maintenance. A similar system was used by the Neptune Project. (Washington 2007) (Figure 13)
Figure 14 - Pod Functional Diagram
Two vendors responded with system designs. These have been used along with a third vendor's system design from a previous CWE project to outline the average expected power consumption. These Vendors are Siemens, Rockwell Automation and National Instruments.
11.1.1. Siemens
Siemens proposed two systems: the first using a more rugged platform, the ET200 Pro series and the second using the S7-300 hardware that is capable of specified data acquisition times as per the assumptions. The ET200 series is not applicable as it uses Industrial Ethernet over copper between the Pods and the PLEM (and does not conform to the Assumptions and Requirements). The ET200 series is capable of a total I/O module scan time of 267ms.
The second offering using the S7-300 hardware (Figure 15) was initially configured with Ethernet over copper as well. However, it is possible to use the 204-2 series optical switches to perform the optical links between the Pods and PLEM.
The total steady state power for this setup was calculated to be 560 W (with all points filled and all valves operating = 677 W) with a peak of 46.9 kW caused by a comparatively large inrush current on the power supply at the PLEM and the remote I/O modules (Figure 15). The quotes for these systems were $21,484.10 and $33,189.20 respectively. (Umbilical Calculations and Notes 2012)
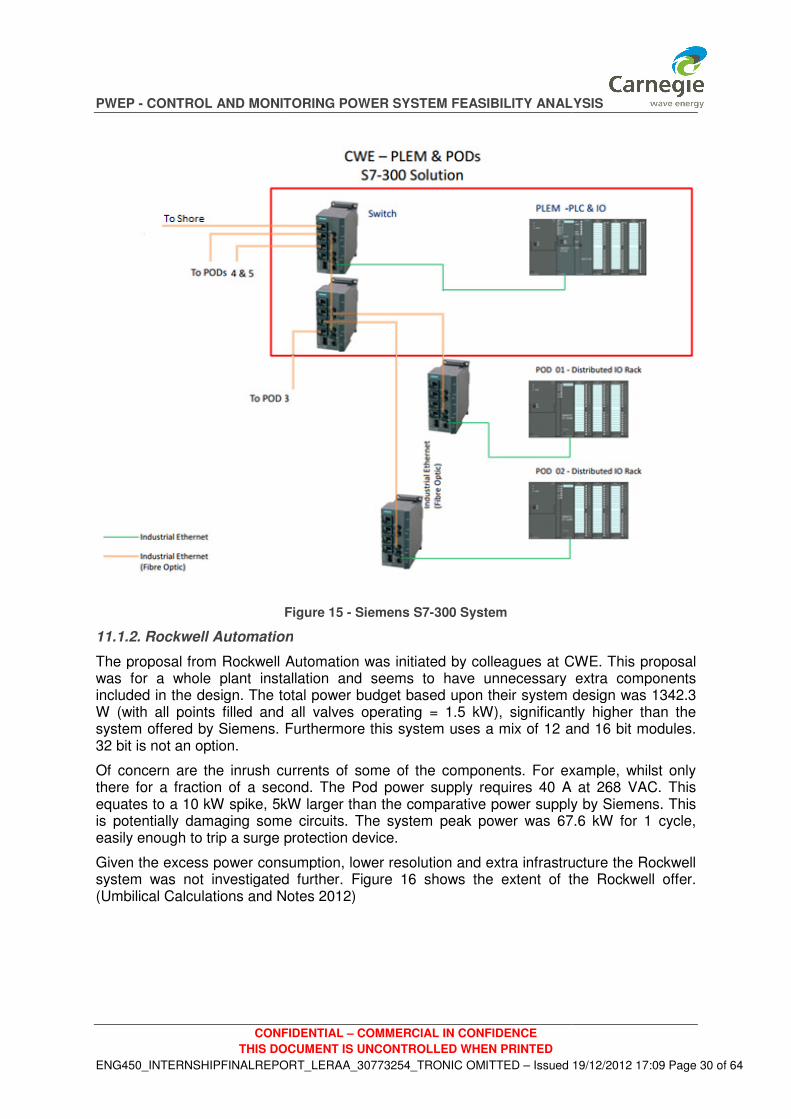
PWEP - CONTROL AND MONITORI
CONFIDENTIAL
THIS DOCUMENT IS UNC
ENG450_INTERNSHIPFINALREPORT_LERAA_30773254_TRONIC OMITTED
Figure
11.1.2. Rockwell Automation
The proposal from Rockwell Automation was initiated by was for a whole plant installation and seems to have unnecessary extra components included in the design. The total power W (with all points filled and all valves operating = 1.5 kW)system offered by Siemens. Furthermore this system uses a mix of 12 and 16 bit modules. 32 bit is not an option.
Of concern are the inrush currentsthere for a fraction of a secondequates to a 10 kW spike, 5kW larger than theis potentially damaging some circuits. The systemeasily enough to trip a surge protection device.
Given the excess power consumption, lower resolution and extra infrastructure the Rockwell system was not investigated(Umbilical Calculations and Notes 2012)
CONTROL AND MONITORING POWER SYSTEM FEASIBILITY ANALYSIS
CONFIDENTIAL – COMMERCIAL IN CONFIDENCE
THIS DOCUMENT IS UNCONTROLLED WHEN PRINTED
ENG450_INTERNSHIPFINALREPORT_LERAA_30773254_TRONIC OMITTED – Issued 19/12/2012 17:09
Figure 15 - Siemens S7-300 System
Rockwell Automation
The proposal from Rockwell Automation was initiated by colleagues at CWEwas for a whole plant installation and seems to have unnecessary extra components included in the design. The total power budget based upon their system design was 1342.3
(with all points filled and all valves operating = 1.5 kW), significantly higher than the system offered by Siemens. Furthermore this system uses a mix of 12 and 16 bit modules.
are the inrush currents of some of the components. For example,there for a fraction of a second. The Pod power supply requires 40 A at 268
kW larger than the comparative power supply byamaging some circuits. The system peak power was 67.6 kW for 1 cycle
easily enough to trip a surge protection device.
Given the excess power consumption, lower resolution and extra infrastructure the Rockwell system was not investigated further. Figure 16 shows the extent of the Rockwell offer.(Umbilical Calculations and Notes 2012)
SIBILITY ANALYSIS
19/12/2012 17:09 Page 30 of 64
CWE. This proposal was for a whole plant installation and seems to have unnecessary extra components
budget based upon their system design was 1342.3 , significantly higher than the
system offered by Siemens. Furthermore this system uses a mix of 12 and 16 bit modules.
For example, whilst only 40 A at 268 VAC. This
comparative power supply by Siemens. This peak power was 67.6 kW for 1 cycle,
Given the excess power consumption, lower resolution and extra infrastructure the Rockwell shows the extent of the Rockwell offer.
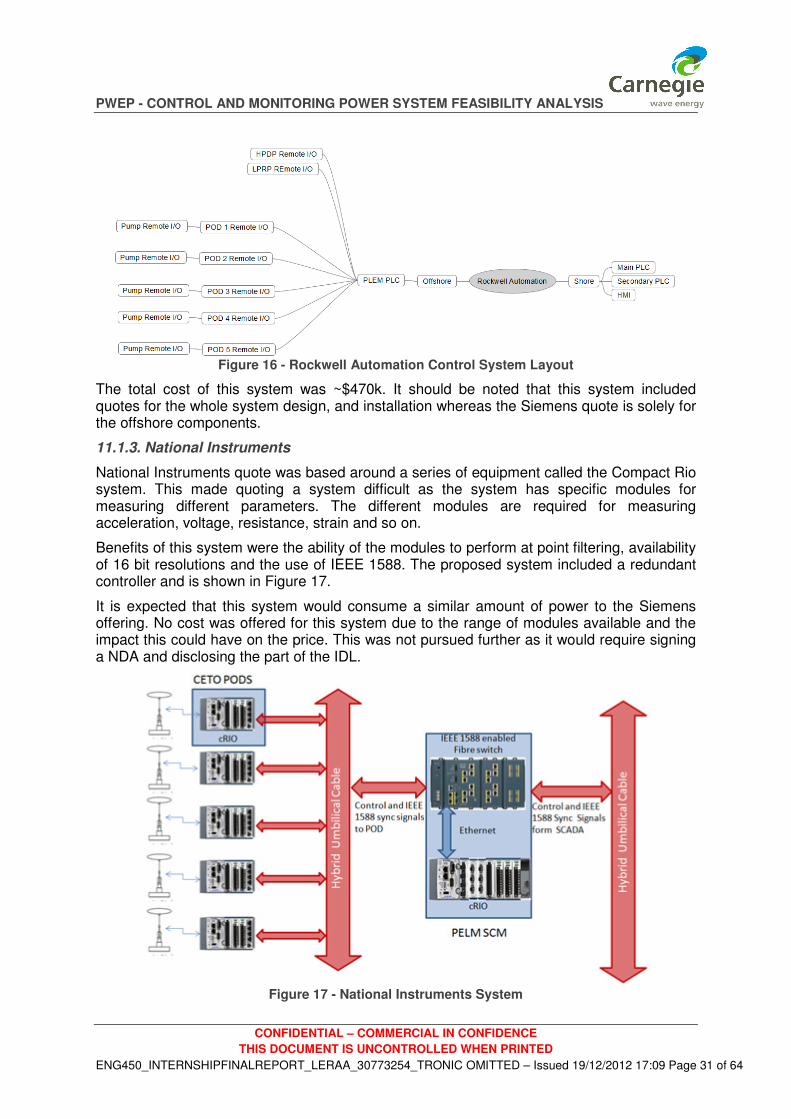
PWEP - CONTROL AND MONITORING POWER SYSTEM FEASIBILITY ANALYSIS
CONFIDENTIAL – COMMERCIAL IN CONFIDENCE
THIS DOCUMENT IS UNCONTROLLED WHEN PRINTED
ENG450_INTERNSHIPFINALREPORT_LERAA_30773254_TRONIC OMITTED – Issued 19/12/2012 17:09 Page 31 of 64
Figure 16 - Rockwell Automation Control System Layout
The total cost of this system was ~$470k. It should be noted that this system included quotes for the whole system design, and installation whereas the Siemens quote is solely for the offshore components.
11.1.3. National Instruments
National Instruments quote was based around a series of equipment called the Compact Rio system. This made quoting a system difficult as the system has specific modules for measuring different parameters. The different modules are required for measuring acceleration, voltage, resistance, strain and so on.
Benefits of this system were the ability of the modules to perform at point filtering, availability of 16 bit resolutions and the use of IEEE 1588. The proposed system included a redundant controller and is shown in Figure 17.
It is expected that this system would consume a similar amount of power to the Siemens offering. No cost was offered for this system due to the range of modules available and the impact this could have on the price. This was not pursued further as it would require signing a NDA and disclosing the part of the IDL.
Figure 17 - National Instruments System

PWEP - CONTROL AND MONITORING POWER SYSTEM FEASIBILITY ANALYSIS
CONFIDENTIAL – COMMERCIAL IN CONFIDENCE
THIS DOCUMENT IS UNCONTROLLED WHEN PRINTED
ENG450_INTERNSHIPFINALREPORT_LERAA_30773254_TRONIC OMITTED – Issued 19/12/2012 17:09 Page 32 of 64
11.2. SCM
The PLEM SCM should have diver operated switches on each output as well as one on the trouble shooting port. Additionally the PLEM SCM should be located so that the PLEM can be removed without the SCM, allowing for the pumps to operate in a closed loop while still allowing data collection. Previously the Hydraulic module from CETO 3 was mounted on a mud mat to prevent it from sinking. The SCM could be located on its own mat next to the PLEM, or use a layout similar to the Neptune SCM, which would allow the SCM to be located further away. (Washington 2007) (A similar structure was used in the VENUS project as shown in Figure 18).
Figure 18 - Subsea Control Module (VENUS 2012), accessed 15/10/2012)
In the event of a Pod failure it would be desirable to be able to monitor the pump operating in a locked position. This is possible if a similar approach is taken to the one outlined above for the Pod SCM's.
The size of the SCM's will vary, with the PLEM SCM being the largest, and the Pod SCMs being smaller. The PLEM SCM will need to be sized so that it has enough volume to allow for cooling of the transformer and electronic devices. This cooling can be affected by the material choice. Vendors such as Sealed Enclosures in Victoria are able to make either polyurethane or metal enclosures to suit. These units are able to be pressure compensated and tested after bulkheads are connected. Pricing for these has not been considered in this study. (Sealed Enclosures Pty Ltd 2011) Sealed Enclosures are also able to supply junction boxes required to marshal Signals from the Pump to the PLEM. These are simply a sealed enclosure with cable terminations mounted into machined ports.
11.3. Power Transmission and Distribution
The Shore to PLEM Hybrid Umbilical will be terminated at the PLEM. This umbilical will be at a higher transmission voltage facilitated by a series of either DC/DC converters or step up

PWEP - CONTROL AND MONITORING POWER SYSTEM FEASIBILITY ANALYSIS
CONFIDENTIAL – COMMERCIAL IN CONFIDENCE
THIS DOCUMENT IS UNCONTROLLED WHEN PRINTED
ENG450_INTERNSHIPFINALREPORT_LERAA_30773254_TRONIC OMITTED – Issued 19/12/2012 17:09 Page 33 of 64
and down transformers. At the PLEM the power will be distributed in 6 parallel circuits, allowing for each POD and the PLEM to have the same voltage. It is possible to wire the array as a series system. However this is not considered ideal as the voltage regulation would be problematic.
11.3.1. Transmission
In this installation due to the isolation provided by the optical links, transformer and the sealed nature of the system; extra earthing cabling is not required. This equates to a minimum of 2 cables for single phase and DC and 3 for three phase AC.
It has been noted that the use of optical links between PLEM and Pods rather than standard copper is likely to be significantly more expensive. In the situation that it is deemed worth changing to copper, the need for an earth cable will have to be re-assessed.
Typical design options from De Regt and South Bay Cables have been for a dual armoured outer, a polyurethane jacket, a number of single conductors and single mode optic fibres in a gel filled stainless steel tube.
The use of DC current has an effect on the insulation of the conductors. This should not be a concern as it is expected that the cable manufacturer should take this into consideration.
11.3.1.1. South Bay Cable Company
South Bay Cable Company has offered 3 final designs with quotes. These designs cover 240 VAC, 600 VAC, and 1200 VAC, where all cables are rated for DC use. The respective prices per meter of these were $158.35, $43.40 and $25.95 USD. (See Figure 19, Figure 20 and Figure 21)
Figure 19 - 240 VAC South Bay Cable SB-47982
Figure 20 - 600 VAC South Bay Cables SB-47980
Image removed due to copyright
See:
http://www.southbaycable.com/products2.html
Image removed due to copyright
See:
http://www.southbaycable.com/products2.html
OD = 39.9 mm
$/m = 158 USD
OD = 24.0 mm
$/m = 43.4 USD

PWEP - CONTROL AND MONITORING POWER SYSTEM FEASIBILITY ANALYSIS
CONFIDENTIAL – COMMERCIAL IN CONFIDENCE
THIS DOCUMENT IS UNCONTROLLED WHEN PRINTED
ENG450_INTERNSHIPFINALREPORT_LERAA_30773254_TRONIC OMITTED – Issued 19/12/2012 17:09 Page 34 of 64
Figure 21 - 1200 VAC South Bay Cable SB-47981
11.3.1.2. De Regt
De Regt has not provided a final cable design; budgetary prices for the design specifications sent to them were €85, €65, €60, and €50 for the 240 VAC, 600 VDC, 600 VAC and 1200 VAC options respectively. They are yet to provide a final design for both the 1200 VAC and 600 VDC options. (Figure 22)
Figure 22 - De Regt Budgetary Designs
11.3.1.3. AC Transformers
Various providers were approached for quotes on transformers. Most replied that the transformers were too small and declined to quote. Stemar and TEMco both can provide transformers. Stemar quotes are shown in Table 6.
Table 6 - Stemar Transformer Units
11.3.1.4. DC Converters
Amtex and Amp-control were approached for quotation on a range of products. Only Amtex returned quotes for both DC Transmission and Distribution components. These are listed in Table 7.
Image removed due to copyright
See:
http://www.deregtcables.com/oilandenergy.html
Image removed due to copyright
See:
http://www.southbaycable.com/products2.html
OD = 16.8 mm
$/m = 25.9 USD

PWEP - CONTROL AND MONITORING POWER SYSTEM FEASIBILITY ANALYSIS
CONFIDENTIAL – COMMERCIAL IN CONFIDENCE
THIS DOCUMENT IS UNCONTROLLED WHEN PRINTED
ENG450_INTERNSHIPFINALREPORT_LERAA_30773254_TRONIC OMITTED – Issued 19/12/2012 17:09 Page 35 of 64
Table 7 - Amtex DC Converter Quote
11.3.2. Distribution
11.3.2.1. MacArtney - Subconn
MacArtney was approached to quote on the cabling between sensors and SCM's, PLEM to Pods and for the custom termination for the Shore to PLEM hybrid Umbilical.
Table 8 - MacArtney Cabling Pricing (AUD)
This quote was for budgetary pricing using standard products to minimise costs, but it is clear that the price of the intra array cabling is the dominant cost. As requested the intra array cabling is capable of transmitting either 48 VDC or 240VAC.
11.3.2.2. Expro - Siemens
Expro was re-approached for budgetary pricing for the intra-array cabling, including the Shore PLEM Hybrid umbilical termination. Expro has experience in deep sea oil and gas, and many of their products are overdesigned for CWE's requirements (this is evident in the first quote Expro provided for a previous project (Intra Array Cabling 10.3.7). Expro have quoted on two different designs; one using discrete optic fibres and power conductors between the Pod and PLEM (including an unnecessary optical link to the Pods) and the other for a single hybrid copper Ethernet and power cable. These prices are shown in Table 9 and Table 10.
Amtex
DC Transmission Model Rating (kW) Quantity Price Ex - Gst Total Cost
240 VAC/600 VDC HVC1K5-E/600-3U3-R8616 1 1 2,355.00$ 2,355.00$
600/24Vdc HVI1K-600/24UT-R8616 1 1 1,432.00$ 1,432.00$
240 VAC / 900 VDC HVC 750-E/450-3U2-R8616 1.5 2 2,424.00$ 4,848.00$
900 VDC / 48 VDC HVI 1K2-900/48-3U2-R8616 1.2 1 3,062.00$ 3,062.00$
48 VDC to 24 VDC DCW200 0.2 6 515.00$ 3,090.00$
Item Quantity Price Each Total
Pump JB 1 13,920$ 13,920$
5 Multicore cables to Pod
3 metre length multicore cables 1 10,650$ 10,650$
Moulding of 25 connector
BH25F Subconn connector Mating bulkhead for POD installation 5 635$ 3,175$
116 Analogue instrument cables
5 metre length analogue instrument cables, incl 1 76,870$ 76,870$
23 Underwater digital cables *
24 metre length underwater digital cables incl: 1 17,320$ 17,320$
5 Hybrid single mode FO/power cables
100 metre length hybrid cables including: 1 100,895$ 100,895$
Bulkhead hybrid connectorMaHng bulkhead for PLEM installaHon 5 5,260$ 26,300$
Offshore cable termination 1 10,620$ 10,620$
259,750$

PWEP - CONTROL AND MONITORING POWER SYSTEM FEASIBILITY ANALYSIS
CONFIDENTIAL – COMMERCIAL IN CONFIDENCE
THIS DOCUMENT IS UNCONTROLLED WHEN PRINTED
ENG450_INTERNSHIPFINALREPORT_LERAA_30773254_TRONIC OMITTED – Issued 19/12/2012 17:09 Page 36 of 64
Table 9 - Expro Discrete Cable Quote
Table 10 - Expro Hybrid Copper Cable Quote
12. DISCUSSION
12.1.1. Transmission
There are important design decisions that will affect the design of the cable. For example, if, due to the higher costs associated with the optical fibre links from PLEM to Pods, a copper alternative is used, then a separate earth conductor from the shore should be run to provide a reference earth. This will come at an extra cost but may be lower than the cost of the optical link.
The main decision for the Hybrid umbilical is between 600, 900 VDC and 1200 VAC. These options are valid and the main advantages of the AC option over the DC options are the higher efficiency of the AC system and the lower costs. The 1200 VAC is a cheaper cable due to the lower currents present. The difficulty with this cable is the classification is now HV requiring HV licensed trades people to install and commission as well as the design must be certified by a qualified professional electrical engineer. This submission of proposal must be submitted to the network operator prior to equipment purchase and installation.
The use of the 600/900 VDC link does have some draw backs, specifically the lower efficiency of the converters, the higher cost and lower efficiency of the DC converters (~ $3 k AUD each and 90 %) and the fact that all switches and cables must be DC rated.
The DC option may be more attractive in future installations where the system has a higher power requirement and is located further from the shore. The difficulty with going to higher voltages still is the lack of commercial available units. Low power HV is not generally done, although the cash incentive to going to still higher voltages may be there for long enough cables.
As a note the Neptune project mentions the use of the DC power system configured as a single wire transmission with an ocean return also providing cathodic protection via an impressed current system. (Washington 2007)
Removed due to copyright
Removed due to copyright

PWEP - CONTROL AND MONITORING POWER SYSTEM FEASIBILITY ANALYSIS
CONFIDENTIAL – COMMERCIAL IN CONFIDENCE
THIS DOCUMENT IS UNCONTROLLED WHEN PRINTED
ENG450_INTERNSHIPFINALREPORT_LERAA_30773254_TRONIC OMITTED – Issued 19/12/2012 17:09 Page 37 of 64
Regarding the Shore to PLEM Hybrid Umbilical; based upon the designs received from De Regt and South Bay Cables it is immediately evident that the 240 VAC option is the least attractive with it being significantly larger and more expensive (See Figure 19).
As mentioned in Transmission Voltage on page 12. The effect of the reactive elements of the cable should be evaluated. This was performed by using circuit modelling concepts know as the Pi and T network models by hand and with software packages known as PLECS and ICAPS (See Figure 24, Figure 26, Figure 31 and Figure 32). This is presented in A.1 System Modelling on 48.
Based upon analysis in "A.1System Modelling" the use of the 1200 VAC link will not present any problems with regards to the shunt capacitance or inductance. The price for the termination of this Umbilical is shown in Table 8. It was assumed that the termination should be the eye type as it would have greater strength.
The cable that will be used for the final design is the 1200 VAC cable from SBC as this is the cheapest cable quoted per distance (See Figure 21).
The transmission transformers for the 1200 VAC system are supplied by Stemar from NSW; these are a typical iron core transformers rated to 1000 VA. The sizing of this transformer is ideally done so that it operates at peak efficiency. Given the average expected load of ~ 300W over sizing the transformer for the maximum peak power of 4.6 kW over 3 ms is not necessary as this short a time will not overheat the transformer significantly. The voltage regulation will drop for a short time at 4 x full load. This may have an effect on some equipment if variable input power supplies are not used at the distribution level.
The use of 3 phase power was considered, but given the low power requirement and extra requirements for the infield distribution it is deemed unnecessary. 3 Phases allow for 1/3 of the current to be present in each cable, and hence they can be sized smaller, but a third cable is required. In future installations where a larger offshore load is anticipated then the use of 3 phases may be optimal. It would also be worth considering installing separate cables to minimise the effect of the shunt capacitance.
12.2. Distribution
The distribution voltage can be either 240 VAC or some level of DC; this will depend on the intra array cabling method chosen.
The infield distribution of power to the Pods from the PLEM cannot be chosen without deciding on a control systems vendor. This is due to each vendor's equipment being different in design and voltage requirements. For the purposes of further design 240 VAC, 48 and 24 VDC will be discussed. Using lower voltages results in less risk for intervening divers.
The intra array cabling is shown to be as expensive as the Shore to PLEM hybrid umbilical. Two alternative options are to either use the Shore to PLEM hybrid Umbilical cable or to switch to a copper Ethernet connection.
Based upon the cabling prices in Table 8 and the hybrid umbilical prices in 11.3.1.1 South Bay Cable Company a quick calculation shows that the added savings on using the cheaper South Bay Cable Company's 1200 VAC cable for the intra array cabling will be outweighed by the cost of 10 umbilical terminations. The price for 500 m of the SBC 1200 VAC cable is ~ $13000 USD and 11 terminations is $117k AUD.
Based upon the quoted designs from SBC, analysis has shown that almost any of the cables are suitable for the intra array cabling. At 240 VAC the maximum voltage drop was <0.1% for 100 m, whilst the 1200 VAC cable used for 48 VDC returned a voltage drop of ~4%.
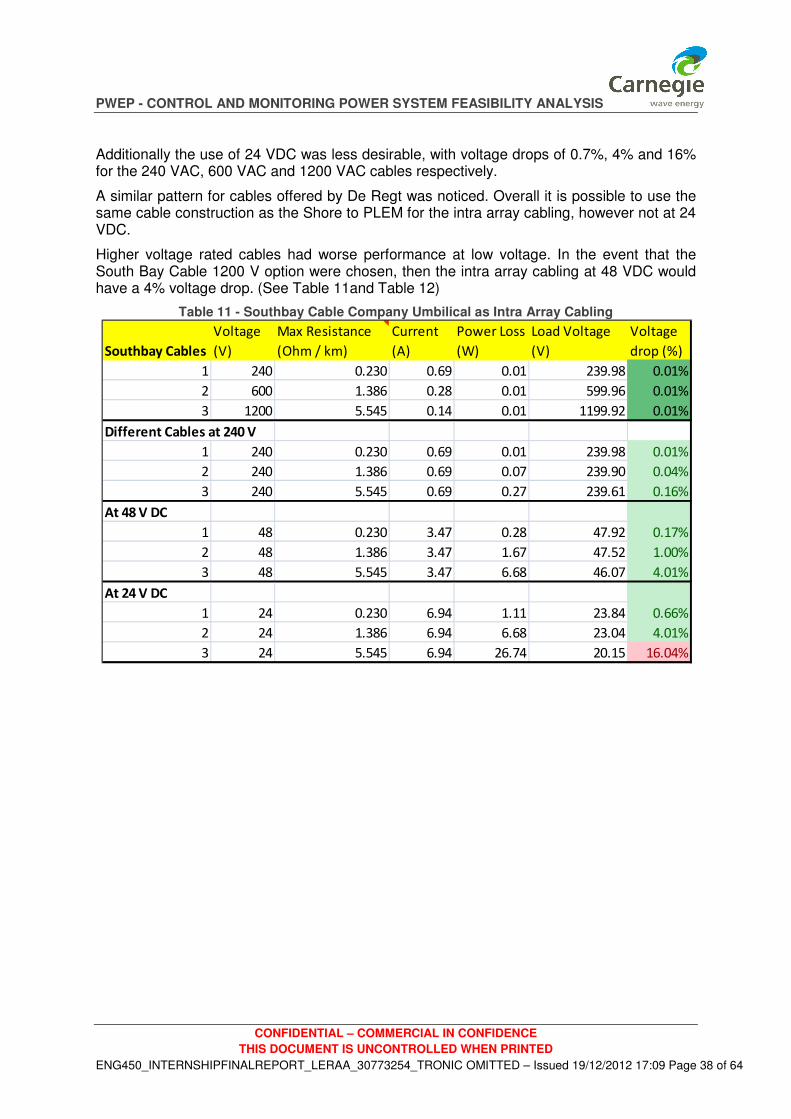
PWEP - CONTROL AND MONITORING POWER SYSTEM FEASIBILITY ANALYSIS
CONFIDENTIAL – COMMERCIAL IN CONFIDENCE
THIS DOCUMENT IS UNCONTROLLED WHEN PRINTED
ENG450_INTERNSHIPFINALREPORT_LERAA_30773254_TRONIC OMITTED – Issued 19/12/2012 17:09 Page 38 of 64
Additionally the use of 24 VDC was less desirable, with voltage drops of 0.7%, 4% and 16% for the 240 VAC, 600 VAC and 1200 VAC cables respectively.
A similar pattern for cables offered by De Regt was noticed. Overall it is possible to use the same cable construction as the Shore to PLEM for the intra array cabling, however not at 24 VDC.
Higher voltage rated cables had worse performance at low voltage. In the event that the South Bay Cable 1200 V option were chosen, then the intra array cabling at 48 VDC would have a 4% voltage drop. (See Table 11and Table 12)
Table 11 - Southbay Cable Company Umbilical as Intra Array Cabling
Southbay Cables
Voltage
(V)
Max Resistance
(Ohm / km)
Current
(A)
Power Loss
(W)
Load Voltage
(V)
Voltage
drop (%)
1 240 0.230 0.69 0.01 239.98 0.01%
2 600 1.386 0.28 0.01 599.96 0.01%
3 1200 5.545 0.14 0.01 1199.92 0.01%
Different Cables at 240 V
1 240 0.230 0.69 0.01 239.98 0.01%
2 240 1.386 0.69 0.07 239.90 0.04%
3 240 5.545 0.69 0.27 239.61 0.16%
At 48 V DC
1 48 0.230 3.47 0.28 47.92 0.17%
2 48 1.386 3.47 1.67 47.52 1.00%
3 48 5.545 3.47 6.68 46.07 4.01%
At 24 V DC
1 24 0.230 6.94 1.11 23.84 0.66%
2 24 1.386 6.94 6.68 23.04 4.01%
3 24 5.545 6.94 26.74 20.15 16.04%
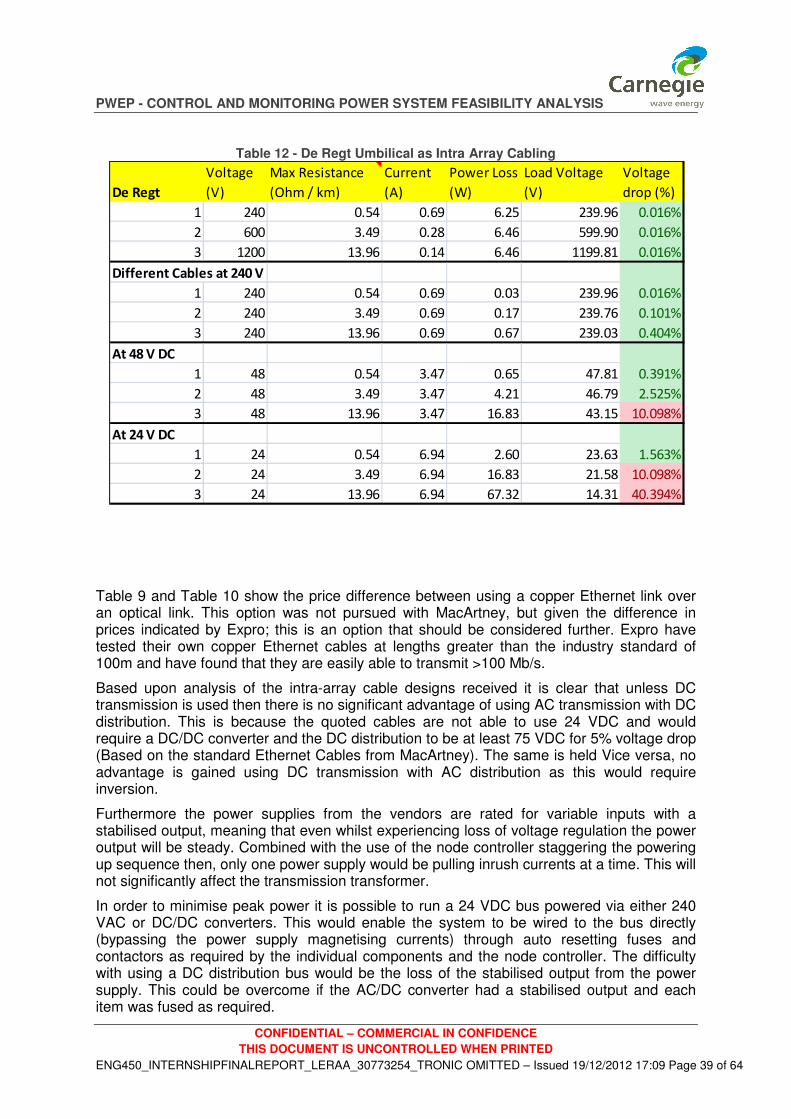
PWEP - CONTROL AND MONITORING POWER SYSTEM FEASIBILITY ANALYSIS
CONFIDENTIAL – COMMERCIAL IN CONFIDENCE
THIS DOCUMENT IS UNCONTROLLED WHEN PRINTED
ENG450_INTERNSHIPFINALREPORT_LERAA_30773254_TRONIC OMITTED – Issued 19/12/2012 17:09 Page 39 of 64
Table 12 - De Regt Umbilical as Intra Array Cabling
Table 9 and Table 10 show the price difference between using a copper Ethernet link over an optical link. This option was not pursued with MacArtney, but given the difference in prices indicated by Expro; this is an option that should be considered further. Expro have tested their own copper Ethernet cables at lengths greater than the industry standard of 100m and have found that they are easily able to transmit >100 Mb/s.
Based upon analysis of the intra-array cable designs received it is clear that unless DC transmission is used then there is no significant advantage of using AC transmission with DC distribution. This is because the quoted cables are not able to use 24 VDC and would require a DC/DC converter and the DC distribution to be at least 75 VDC for 5% voltage drop (Based on the standard Ethernet Cables from MacArtney). The same is held Vice versa, no advantage is gained using DC transmission with AC distribution as this would require inversion.
Furthermore the power supplies from the vendors are rated for variable inputs with a stabilised output, meaning that even whilst experiencing loss of voltage regulation the power output will be steady. Combined with the use of the node controller staggering the powering up sequence then, only one power supply would be pulling inrush currents at a time. This will not significantly affect the transmission transformer.
In order to minimise peak power it is possible to run a 24 VDC bus powered via either 240 VAC or DC/DC converters. This would enable the system to be wired to the bus directly (bypassing the power supply magnetising currents) through auto resetting fuses and contactors as required by the individual components and the node controller. The difficulty with using a DC distribution bus would be the loss of the stabilised output from the power supply. This could be overcome if the AC/DC converter had a stabilised output and each item was fused as required.
De Regt
Voltage
(V)
Max Resistance
(Ohm / km)
Current
(A)
Power Loss
(W)
Load Voltage
(V)
Voltage
drop (%)
1 240 0.54 0.69 6.25 239.96 0.016%
2 600 3.49 0.28 6.46 599.90 0.016%
3 1200 13.96 0.14 6.46 1199.81 0.016%
Different Cables at 240 V
1 240 0.54 0.69 0.03 239.96 0.016%
2 240 3.49 0.69 0.17 239.76 0.101%
3 240 13.96 0.69 0.67 239.03 0.404%
At 48 V DC
1 48 0.54 3.47 0.65 47.81 0.391%
2 48 3.49 3.47 4.21 46.79 2.525%
3 48 13.96 3.47 16.83 43.15 10.098%
At 24 V DC
1 24 0.54 6.94 2.60 23.63 1.563%
2 24 3.49 6.94 16.83 21.58 10.098%
3 24 13.96 6.94 67.32 14.31 40.394%

PWEP - CONTROL AND MONITORING POWER SYSTEM FEASIBILITY ANALYSIS
CONFIDENTIAL – COMMERCIAL IN CONFIDENCE
THIS DOCUMENT IS UNCONTROLLED WHEN PRINTED
ENG450_INTERNSHIPFINALREPORT_LERAA_30773254_TRONIC OMITTED – Issued 19/12/2012 17:09 Page 40 of 64
Direct comparison of the Expro and MacArtney proposals is not applicable as Expro is at one end of the scale and MacArtney at the other. Further, the MacArtney quote includes sensor cabling. The comparative total system cost (not including the sensor cabling) for the two optical options is: Expro £xxxxxx and MacArtney $151,640. Clearly of the two, the cheapest is the MacArtney option. This system will be presented as the final solution, although a more feasible system may be possible if Ethernet over copper is used in place of optic fibre in the intra array cabling.
The distribution voltage will be at 240 VAC; this bypasses the need for additional power converters on the PLEM and Pods as well as allowing lower specification switches and relays to be used.
At 240 VAC the MacArtney Cable results in less than 1 % voltage drop.
12.3. Protection Requirements
Kirkham et al discuss the design principles of a node controller in depth; many of these considerations are applicable for the design of the PWEP node controller. (Kirkham, et al. 2002)
The Node controller is required to moderate the maximum inrush current at any given time. The node controller's sole purpose is to protect and control the subsea power distribution system. It should have three modes of operation; normal, fault finding and shut down. Additionally it should be able to monitor the operating conditions inside each SCM and JB.
When starting from a flat start, it should be configured so that all connections are open and only the node controller powers up. This can be achieved by using fail to open connections on all powered items except the node controller. Once the controller is powered it can then power up the other control items in the PLEM and begin looking for faults by toggling power to all connections individually. This could be done by using distance relays controlled by the node controller to detect any change from the preconfigured expected value.
If a fault is detected it will be isolated via the contactors until it can be rectified. The system will then continue to operate as normal. Manual override from the MCS will be possible to allow for forced disconnection without triggering a shutdown.
The condition of the distribution system as well as the position of the manual override diver operated switches will be visible at the MCS HMI. Manual switching of the subsea diver switches should be preconfigured; unauthorised switching will result in a fault. This feature also acts as a "tamper" detector.
Pending successful power up of all connections the system then enters "normal mode," where it will remain unless a fault occurs. Bus voltages and currents will be monitored, allowing the node controller to monitor the health of the system. Violation of predetermined operating limits will trigger a shutdown.
This is required to limit the current possible in transmission line and distribution system as this system should be considered to be non serviceable and hence fragile.
The system is required to have the following protection measures:
• Auto resetting SPDs located at the main connection point after the switch.
• These are required to prevent current flowing into the offshore segment of the installation in the event of an onshore power surge. It is not expected that lightning strikes at sea will affect the system.
• Bus Voltage Detectors

PWEP - CONTROL AND MONITORING POWER SYSTEM FEASIBILITY ANALYSIS
CONFIDENTIAL – COMMERCIAL IN CONFIDENCE
THIS DOCUMENT IS UNCONTROLLED WHEN PRINTED
ENG450_INTERNSHIPFINALREPORT_LERAA_30773254_TRONIC OMITTED – Issued 19/12/2012 17:09 Page 41 of 64
a) To monitor the changes in voltages on the distribution buses and in the event of overvoltage initiate a protective shut down of the load.
• MCS isolatable power outputs for the offshore section, lockable via a pass code.
• Controlled “fail to open” isolation contactors.
• Diver operable isolation switches (and one for the investigation port).
• Protective relays
a) Current differential and distance relays.
b) Current limiter before the step up transmission transformer.
• Moisture / pressure sensors in each SCM / JB
a) The coordination and setting of these devices should be through the node controller.
• Corrosion requirements are being packaged as a standalone tender process and are considered beyond the scope of this project.
• For safety requirements regarding earthing for safety, see Earthing page 22.
Further protection can be offered by the use of a redundant PLC. This would monitor the health of the first PLC and in the event of failure step in. It is however worth considering splitting these controllers into different SCM's so that in the event of moisture ingress, then the second unit is still functional. However for this design it is considered that a highly reliable solution will replace the need for a redundant PLC and additional SCM's.
An alternate transmission and protection option that was a late consideration is the use of separate transmission lines in the hybrid umbilical to power the individual loads at the PLEM and Pods. This would require further investigation, but would allow the option of manually turning off each power supply and could potentially be done without transformers simplifying the installation (i.e. at 240VAC).
12.4. Trouble shooting
In unpredicted fault scenarios it is thought that it would be useful to be able to connect to the PLEM SCM and offshore SCADA system through a patch cord run from a vessel.
This cord would be required to connect to the PLEM's logic processor and provide power to the subsea array.
The connection point of this cable to the PLEM would need to be manually switchable in situ. Hyrdacon and Ocean Tools make suitable switches, and Hyrdacon's is rated to 500 V. This would mean that it could switch directly to the 240 V bus on the PLEM. (Hydracon Company, Inc 2012) (Ocean Tools 2012)
This switch should be able to isolate the shore power supply, allowing for both data and power to be connected offshore or one or the other.
Another consideration has been for the inclusion of a 75m cable to connect to the pumps during installation to monitor the pressures at the inlet and outlet. This will also require a camera to monitor the decent of the pumps. It would be possible to use the proposed trouble shooting cable with an adapted end to perform the trouble shooting function.
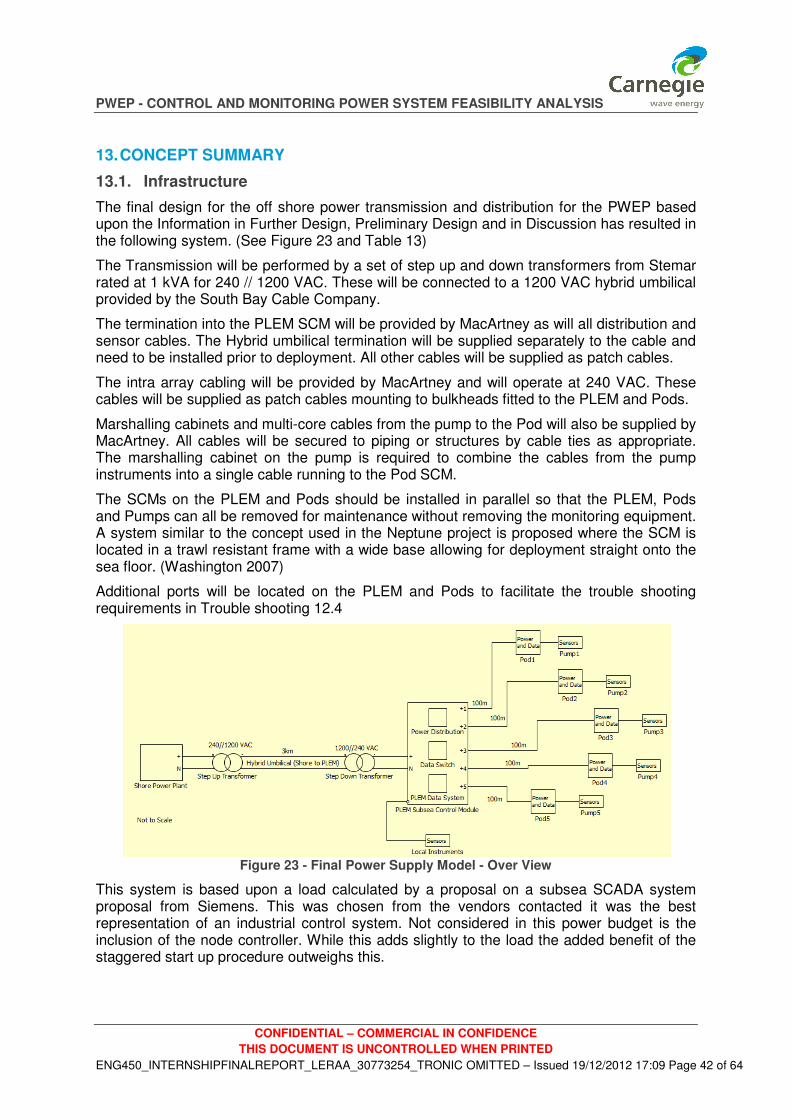
PWEP - CONTROL AND MONITORING POWER SYSTEM FEASIBILITY ANALYSIS
CONFIDENTIAL – COMMERCIAL IN CONFIDENCE
THIS DOCUMENT IS UNCONTROLLED WHEN PRINTED
ENG450_INTERNSHIPFINALREPORT_LERAA_30773254_TRONIC OMITTED – Issued 19/12/2012 17:09 Page 42 of 64
13. CONCEPT SUMMARY
13.1. Infrastructure
The final design for the off shore power transmission and distribution for the PWEP based upon the Information in Further Design, Preliminary Design and in Discussion has resulted in the following system. (See Figure 23 and Table 13)
The Transmission will be performed by a set of step up and down transformers from Stemar rated at 1 kVA for 240 // 1200 VAC. These will be connected to a 1200 VAC hybrid umbilical provided by the South Bay Cable Company.
The termination into the PLEM SCM will be provided by MacArtney as will all distribution and sensor cables. The Hybrid umbilical termination will be supplied separately to the cable and need to be installed prior to deployment. All other cables will be supplied as patch cables.
The intra array cabling will be provided by MacArtney and will operate at 240 VAC. These cables will be supplied as patch cables mounting to bulkheads fitted to the PLEM and Pods.
Marshalling cabinets and multi-core cables from the pump to the Pod will also be supplied by MacArtney. All cables will be secured to piping or structures by cable ties as appropriate. The marshalling cabinet on the pump is required to combine the cables from the pump instruments into a single cable running to the Pod SCM.
The SCMs on the PLEM and Pods should be installed in parallel so that the PLEM, Pods and Pumps can all be removed for maintenance without removing the monitoring equipment. A system similar to the concept used in the Neptune project is proposed where the SCM is located in a trawl resistant frame with a wide base allowing for deployment straight onto the sea floor. (Washington 2007)
Additional ports will be located on the PLEM and Pods to facilitate the trouble shooting requirements in Trouble shooting 12.4
Figure 23 - Final Power Supply Model - Over View
This system is based upon a load calculated by a proposal on a subsea SCADA system proposal from Siemens. This was chosen from the vendors contacted it was the best representation of an industrial control system. Not considered in this power budget is the inclusion of the node controller. While this adds slightly to the load the added benefit of the staggered start up procedure outweighs this.

PWEP - CONTROL AND MONITORING POWER SYSTEM FEASIBILITY ANALYSIS
CONFIDENTIAL – COMMERCIAL IN CONFIDENCE
THIS DOCUMENT IS UNCONTROLLED WHEN PRINTED
ENG450_INTERNSHIPFINALREPORT_LERAA_30773254_TRONIC OMITTED – Issued 19/12/2012 17:09 Page 43 of 64
Table 13 - Final System Component List
13.2. Cost
The cost of this system is purely for components and should be thought of as a guide. Items such as assembly, commissioning, engineering, busbars, cabinets and switchgear have not been included. Table 13 shows the cost break down of the major components required for the transmission and distribution of power to the subsea section of the PWEP (The DC transmission option is only ~$10 k more expensive (See Figure 34 in A.2.)). Additional costs will be present as the control system and distribution system will be integrated to some degree. The use of HV for the transmission makes the design and commission of the system more involved and will require appropriately licensed trades people. It should be pointed out that the major cost of the system is not for the power conditioning components but rather the cabling.
14. CONCLUSION
In order to reliably power the offshore monitoring and control system a range of options were considered. These options were assessed and it was found that a grid connected hybrid umbilical cable running from the shore to the PLEM was the option that best met the CWE design requirements. Different voltage and power regimes were considered, and cable designs sought from different vendors. This allowed the field to be reduced to a few options before more detailed analysis was undertaken.
The standards that apply to this system are not well developed. A range of documents were consulted to establish the legal requirements and current industry practises for the subsea power system. Particularly with regards to design, safety and earthing. From these documents the protection requirements were established as well as the intervention requirements.
The effects of the shunt capacitance and inductance were calculated based upon the cheapest cable; this was then modelled in both Icaps and PLECS for confirmation. From this it was shown that a slight capacitive effect was present in the system, but it is of little significance. The chosen cable was the SB-47981 1200 VAC from the South Bay Cable Company.
The distribution from the termination of the hybrid Umbilical was calculated as a set of minimum requirements and given to MacArtney, Cooper Industries and Expro-Siemens for quotations. MacArtney and Expro were the most responsive, with MacArtney being
Location Specific Location Item Function Vendor Length (m) Number Price
Onshore Power Plant Step Up Transformer 240//1200 V AC 1000 VA Stemar 1 592.90$
Offshore Subsea Hybrid Umbilical Transmit Power and Data SBC 3200 1 83,040.00$
Offshore PLEM
Hybrid Umbilical
Termination Join Umbilical to PLEM Mac Artney 1 10,620.00$
Offshore PLEM
Step Down
Transformer 1200//240 V AC 1000 VA Stemar 1 592.90$
Offshore PLEM Intra array cables
Distribute Power to Pods
from PLEM Mac Artney 100 5 127,195.00$
Offshore PLEM Digital Cables
Underwater Plugable
Sensor Cables Mac Artney 23 24 17,320.00$
Offshore Pod PLEM Analogue Cables Sensor Cables Mac Artney 5 116 76,870.00$
Offshore Pod Multicore Cables Pump to Pod Sensor Cable Mac Artney 3 5 13,825.00$
Offshore Pod Pump JB
Combine sensor wires to
Pod Mac Artney 5 13,920.00$
Total 343,975.80$

PWEP - CONTROL AND MONITORING POWER SYSTEM FEASIBILITY ANALYSIS
CONFIDENTIAL – COMMERCIAL IN CONFIDENCE
THIS DOCUMENT IS UNCONTROLLED WHEN PRINTED
ENG450_INTERNSHIPFINALREPORT_LERAA_30773254_TRONIC OMITTED – Issued 19/12/2012 17:09 Page 44 of 64
significantly cheaper. A direct comparison was not possible as the Expro Solution did not include sensor cabling and was rated to 4000 m. The most significant cost of the intra array cabling was the hybrid cables from the PLEM to the Pod. The option of using the Shore to PLEM hybrid umbilical for intra array distribution was not cheaper due to the additional cost of the custom terminations required. This option has merit and should be further pursued.
The distribution voltage was set at 240 VAC after examining the advantages of AC and DC as well as the available cables. It was decided that unless a DC transmission was used there would not be any added advantage in using DC distribution. Depending on the final control system vendor this requirement may change. All subsea cables are required to be wet-mate-able cables for maintenance.
The load was modelled by approaching Siemens and National Instruments with an approximate system requirement. This requirement was based upon a mixture of CWE design principles and assumed performance requirements based upon discussion with CWE team members. This was used along with a previous system quote by Rockwell Automation from a previous project. The range of systems offered was from ~$30k to ~$500k with varying responses. By far the most responsive was Siemens, who provided two different options. The more expensive of the two options was used as it had the required optical Ethernet ability for PLEM to Pod communication. This system model had a peak power of ~47 kW for ~3 ms caused by the magnetising currents of the power supplies. This peak power can be reduced to ~ 4.6 kW by using the proposed node controller to initiate a controlled start up.
The operation of the power system is critical. This led to the concept of the node controller. Further system design has shown that the successful operation of the subsea power system will rely on the operation of the node controller to manage the instantaneous power level and implement safety and protection measures. These protection measures are required for maintenance and reliability and will allow divers to safely work on the subsea system. The reduced peak power will not significantly affect the transmission transformer.
The physical layout of the system should be so that the control and monitoring system is a parallel installation rather than integrated into the PLEM, Pods and Pumps. This will allow for maintenance of these items whilst still monitoring the rest of the system components.
The final cost of the system was $343,975.8 for the 1200 VAC system compared to $353,790.0 for the DC System. The bulk of this cost is associated with the cabling and not particularly sensitive between AC and DC. The advantages of DC may prove to be more attractive under different circumstances. The longest lead time was for the proposal from Expro at 32 weeks, with SBC quoting 16-18 weeks and MacArtney at 8-10 weeks.
This feasibility analysis has shown the range of parameters that should be considered in developing a reliable subsea power system to power a small load. It has also shown the range of prices associated with different technologies and design options.
15. RECOMMENDATIONS
This system should be seen as a snap shot. This is due to the large amount of influencing factors and the assumptions that have been made. Changing of certain parameters will result in carry on effects that will require readdressing elements covered in this document.
Scope for further work and recommendations are as follows:
• Review the need for optical links between PLEM and Pods (hence earthing)

PWEP - CONTROL AND MONITORING POWER SYSTEM FEASIBILITY ANALYSIS
CONFIDENTIAL – COMMERCIAL IN CONFIDENCE
THIS DOCUMENT IS UNCONTROLLED WHEN PRINTED
ENG450_INTERNSHIPFINALREPORT_LERAA_30773254_TRONIC OMITTED – Issued 19/12/2012 17:09 Page 45 of 64
• Investigate the use of cheaper hybrid umbilical terminations for the intra array cabling using the shore to PLEM hybrid Umbilical
• Investigate the use of DC power supply combined with impressed current protection.
• Assess required redundancy level. (Extra money spent on minimising at sea repair is money well spent.)
• Full system modelling after control system is chosen, investigating shock loading, fault scenarios, voltage transients and relay settings. This will require more knowledge of the grid connection point.
• HV installation certification for the "submission of proposal"
• Use of three phases or HVDC for higher power future systems
• Further develop the concept of the node controller.
• Further investigate the use of separate pairs of conductors as transmission lines to individually power the PLEM and Pods. Initial calculations have shown that it would be possible to implement this with the existing quoted 600 VAC / DC cable; however the advantages of this would only be truly felt if the data switches switched directly back to shore, or to PLEM. Where the PLEM Media converter / switch was configured so that it was connected to each individual supply and in the event of failure switch. This option involves extra transformers and could be implemented in either AC or DC.
16. REFERENCES
Austalian Standards. “ AS 3008.1.1-2009 - Electrical installations—Selection of Cables.” Part 1.1:
Cables for alternating voltages up to and including 0.6/1 kV - Typical Australian Installation
Conditions. SAI GLOBAL, 2009.
Australian Standards. “AS 2067-2008 - Substations and High Voltage Installations exceeding 1 kV
a.c.” SAI GLOBAL, 2008.
—. “AS 3000 - Electrical Installations Wiring Rules.” Sai Golbal, 2007.
—. “AS/NZS 1768:2007 "Lightning Protection".” Australian Standards / New Zealand Standards.
Australian Standards / New Zealand Standards, 2007.
Bai, Yong, and Qiang Bai. Subsea Engineering Handbook. MA: Elsevier, 2010.
Danfoss. Harmonic Distortion of the AC Power Line - White Paper. Danfoss, 2011.
DNV. “ DNV-OS-J201 Offshore Substations for Windfarms.” Hovik: DNV, October 2009.
—. “DNV-02-D202 Automation, Safety and Telecommunication Systems.” Hovik: DNV, 2002.
—. “DNV-OS D201:2008 Electrical Installations.” Høvik: DET NORSKE VERITAS, 2001.
—. “DNV-RP-F401 Electrical Power Cables in Subsea Applications.” Hovik: DNV, 2012.
—. “Guidelines on design and operation of wave energy converters.” Hovik: DNV, 2005.

PWEP - CONTROL AND MONITORING POWER SYSTEM FEASIBILITY ANALYSIS
CONFIDENTIAL – COMMERCIAL IN CONFIDENCE
THIS DOCUMENT IS UNCONTROLLED WHEN PRINTED
ENG450_INTERNSHIPFINALREPORT_LERAA_30773254_TRONIC OMITTED – Issued 19/12/2012 17:09 Page 46 of 64
Edson, James, et al. “The Martha’s Vineyard Coastal Observatory.” OHP/ION Joint Symposium on
Long-term Observations in the Oceans. Yamanashi Prefecture, Japan: Woods Hole Oceanographic
Institution, 2001.
Expro International Group Ltd. EXPRO. Expro International Group Ltd. 2010.
http://www.exprogroup.com/ (accessed September 3, 2012).
Green, David. “In Situ Data Extraction from Ocean Sensors.” Oceans 2010. 2010.
Howe, Bruce M, Harold Kirkham, Vatche Vorperian, and Paul Bowerman. “The Design of the
NEPTUNE Power System from Fundamentals.” Oceans. HI: NASA
(http://hdl.handle.net/2014/13197), 2001.
Howe, Bruce M., Harold Kirkham, and Vatché Vorpérian. “Power System Considerations for
Undersea Observatories.” IEEE journal of Oceanic Engineering, Vol # 27, 2002.
Hydracon Company, Inc. Switches. 2012. http://www.hydracon.com/ (accessed 10 10, 2012).
IMCA. “Code of Practice for The Safe Use of Electricty Underwater.” IMCA D 045, R 015. IMCA, 2010.
—. “Diver Access to Subsea Systems.” Guidelines For Isolation and Intervention. IMCA, 2009.
Institute of Electrical and Electronic Engineers, Inc. IEEE Recommended Practice forPowering and
Grounding Electrical Equiptment " The IEEE Emerald Book". New York: Institute of Electrical and
Electronic Engineers, Inc, 2005.
Irujo, Tony, and John Kamino. Multimode or Single-Mode Fiber? White Paper, LLC: OFS FITEL, 2012.
Jongensen, J. CET0 3 C-Scale System Deployment 1 Offshore Test Report. Perth: Carnegie Wave
Energy Limited, 2011.
KIRKHAM, Harold, Phil LANCASTER, Chen-Ching LIU, Mohamed EL-SHARKAWI, and Bruce M. HOWE.
The NEPTUNE power system: design from fundamentals. Technical Report, Washington: Interactive
Oceans, 2002.
Kloos, Gerold, Zach Benitez, and Carlos A Gonzalez. “The bioWAVE and bioSTREAM Test Unit.”
European Wave and Tidal Energy Series. South Hampton.
Le-Ray, Antoine, and David Harrowfield. “Umbilical Calculations and Notes.” Carnegie Wave Energy,
2012.
Ocean Tools. Ocean Tools. 2012. http://www.oceantools.co.uk/c-switch-underwater-switch/p28
(accessed 2012).
Ogunnaike, Babatunde A, and W. Harmon Ray. Process Dynamics, Modelling and Control. New York:
Oxford University Press, 1994.

PWEP - CONTROL AND MONITORING POWER SYSTEM FEASIBILITY ANALYSIS
CONFIDENTIAL – COMMERCIAL IN CONFIDENCE
THIS DOCUMENT IS UNCONTROLLED WHEN PRINTED
ENG450_INTERNSHIPFINALREPORT_LERAA_30773254_TRONIC OMITTED – Issued 19/12/2012 17:09 Page 47 of 64
Sealed Enclosures Pty Ltd. http://www.sealed-enclosures.com/. 2011. http://www.sealed-
enclosures.com/ (accessed 09 15, 2012).
Trelleborg AB. Trelleborg. Trelleborg AB. 4 September 2007.
http://www.trelleborg.com/en/offshore/Products-and-Solutions/Compliant-clamps/ (accessed
September 3, 2012).
VENUS. 2012. http://venus.uvic.ca/ (accessed 10 15, 2012).
Washington, University of. Regional Scale Nodes Secondary Infrastructure White Paper. Washington:
Joint Oceanographic Institutions, 2007.
Western Power. “Western Power Technical Rules.” Perth: Western Power, 2007.
Woodroffe, Adrian, Michael Wrinch, and Steven Pridie. “Power Delivery to Subsea Cabled
Observatories.” Oceans 2008. Vancouver, BC, Canada, 2008.
Wrinch, Michael C, Marcelo A Tomim, and Jose Marti. “An Analysis of Sub Sea Electric Power
Transmission Techniques from DC to AC 50/60 Hz and Beyond.” Oceans 2007. Vancouver: Oceans
2007, 2007.

PWEP - CONTROL AND MONITORING POWER SYSTEM FEASIBILITY ANALYSIS
CONFIDENTIAL – COMMERCIAL IN CONFIDENCE
THIS DOCUMENT IS UNCONTROLLED WHEN PRINTED
ENG450_INTERNSHIPFINALREPORT_LERAA_30773254_TRONIC OMITTED – Issued 19/12/2012 17:09 Page 48 of 64
17. APPENDICES
A.1. System Modelling
Normal terrestrial power transmission is modelled in three ways; as short, medium or long line models. The different ways of modelling are approximate models based upon standard expected values and for short line models do not include capacitance values as the effect of the inductance usually dominates the effect of the capacitance. However the proposed cable by South Bay Cables does not have a large gap between conductors and the capacitance must be evaluated. Two methods used for modelling this effect are the Pi and T network methods. These models can have distributed or lumped parameters. For this system both the Pi and T models were evaluated and the system was tested in PLECS and ICAPS. The Pi and T models were also evaluated by hand in an effort to see what the effect of the shunt capacitance was on the power system. A capacitive system has a leading power factor and if large enough will require the addition of a reactor(s).
These models were all based upon the use of the 1200 VAC link cable as it is the cheapest option.
In order to model the system the Per Unit system was used and a steady state assumed. The Per unit system works by dividing everything to a relevant base, this makes it easier to perform calculations as transformers are done away with and differences can easily be seen as percentages.
Figure 31 and Figure 32 show the two different methods. There is some difference in the amount of reactive power required to be absorbed by the source, however this is expected as they both use slightly different approximations.
It should be pointed out that in lightly loaded scenarios the capacitive nature of the system will come out and it is possible that the voltage may rise at the load as the capacitive nature of the conductors begins to dominate.
A.1.1. ICAPS
ICAPS is a SPICE simulator that is aimed primarily at circuit diagram level; it was chosen due to familiarity and used for a simplistic model.
The ICAPS modelling was done with the load modelled as a series of parallel resistors so that the parallel combination of these resulted in 1 kW at the PLEM. (Figure 24)
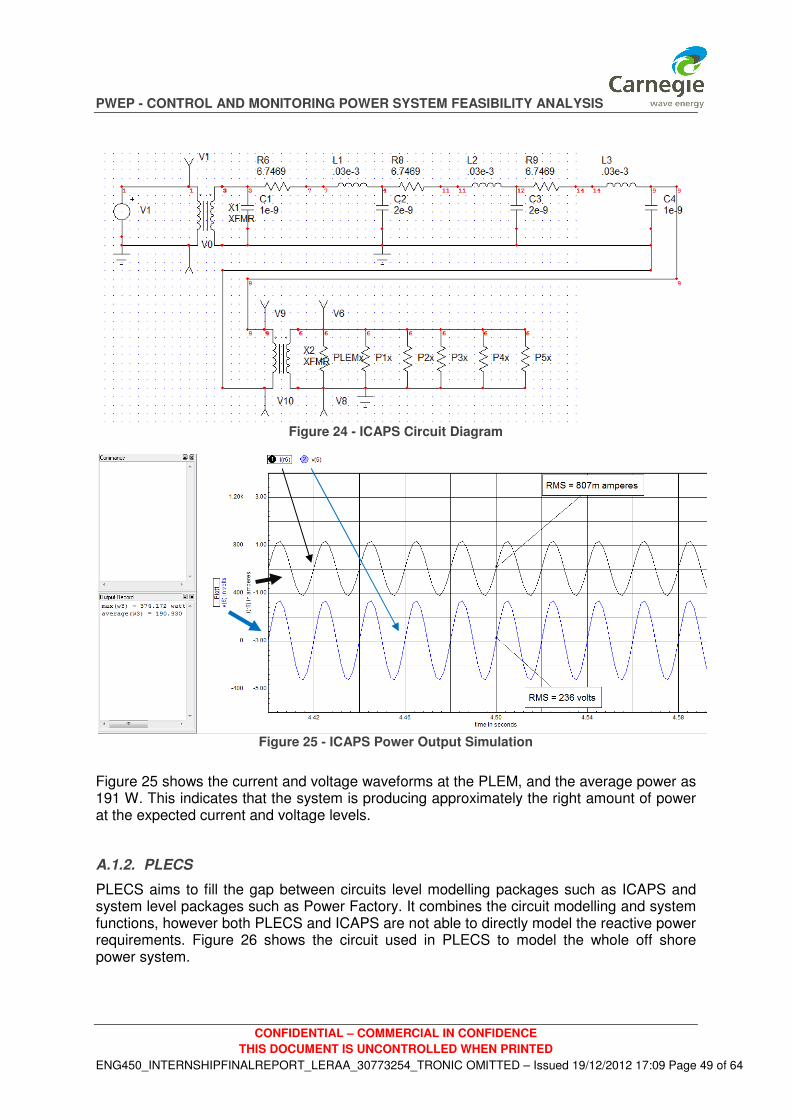
PWEP - CONTROL AND MONITORING POWER SYSTEM FEASIBILITY ANALYSIS
CONFIDENTIAL – COMMERCIAL IN CONFIDENCE
THIS DOCUMENT IS UNCONTROLLED WHEN PRINTED
ENG450_INTERNSHIPFINALREPORT_LERAA_30773254_TRONIC OMITTED – Issued 19/12/2012 17:09 Page 49 of 64
Figure 24 - ICAPS Circuit Diagram
Figure 25 - ICAPS Power Output Simulation
Figure 25 shows the current and voltage waveforms at the PLEM, and the average power as 191 W. This indicates that the system is producing approximately the right amount of power at the expected current and voltage levels.
A.1.2. PLECS
PLECS aims to fill the gap between circuits level modelling packages such as ICAPS and system level packages such as Power Factory. It combines the circuit modelling and system functions, however both PLECS and ICAPS are not able to directly model the reactive power requirements. Figure 26 shows the circuit used in PLECS to model the whole off shore power system.
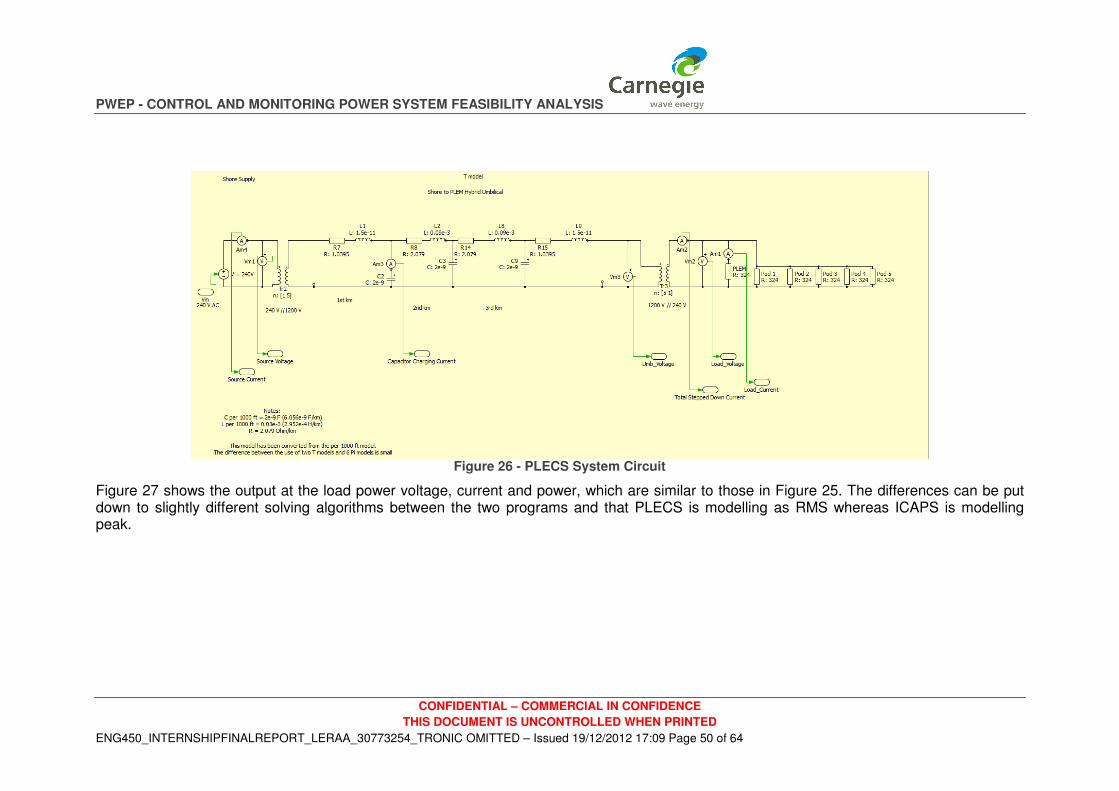
PWEP - CONTROL AND MONITORING POWER SYSTEM FEASIBILITY ANALYSIS
CONFIDENTIAL – COMMERCIAL IN CONFIDENCE
THIS DOCUMENT IS UNCONTROLLED WHEN PRINTED
ENG450_INTERNSHIPFINALREPORT_LERAA_30773254_TRONIC OMITTED – Issued 19/12/2012 17:09 Page 50 of 64
Figure 26 - PLECS System Circuit
Figure 27 shows the output at the load power voltage, current and power, which are similar to those in Figure 25. The differences can be put down to slightly different solving algorithms between the two programs and that PLECS is modelling as RMS whereas ICAPS is modelling peak.
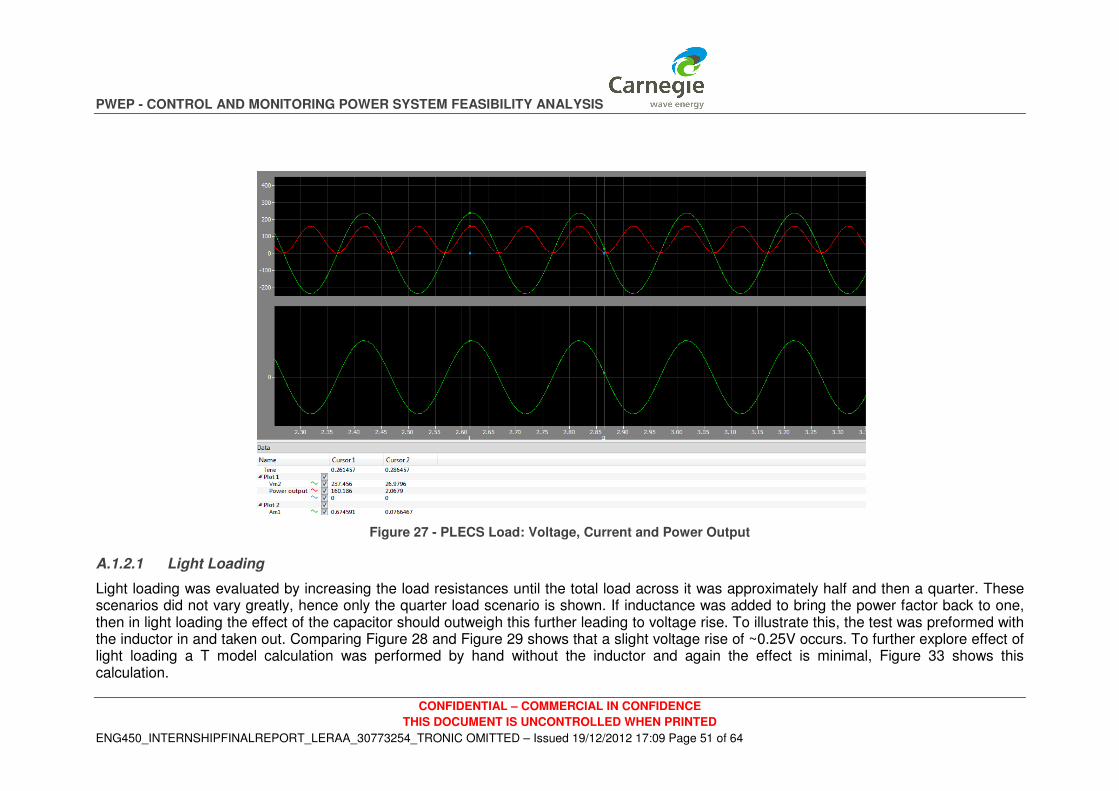
PWEP - CONTROL AND MONITORING POWER SYSTEM FEASIBILITY ANALYSIS
CONFIDENTIAL – COMMERCIAL IN CONFIDENCE
THIS DOCUMENT IS UNCONTROLLED WHEN PRINTED
ENG450_INTERNSHIPFINALREPORT_LERAA_30773254_TRONIC OMITTED – Issued 19/12/2012 17:09 Page 51 of 64
Figure 27 - PLECS Load: Voltage, Current and Power Output
A.1.2.1 Light Loading
Light loading was evaluated by increasing the load resistances until the total load across it was approximately half and then a quarter. These scenarios did not vary greatly, hence only the quarter load scenario is shown. If inductance was added to bring the power factor back to one, then in light loading the effect of the capacitor should outweigh this further leading to voltage rise. To illustrate this, the test was preformed with the inductor in and taken out. Comparing Figure 28 and Figure 29 shows that a slight voltage rise of ~0.25V occurs. To further explore effect of light loading a T model calculation was performed by hand without the inductor and again the effect is minimal, Figure 33 shows this calculation.
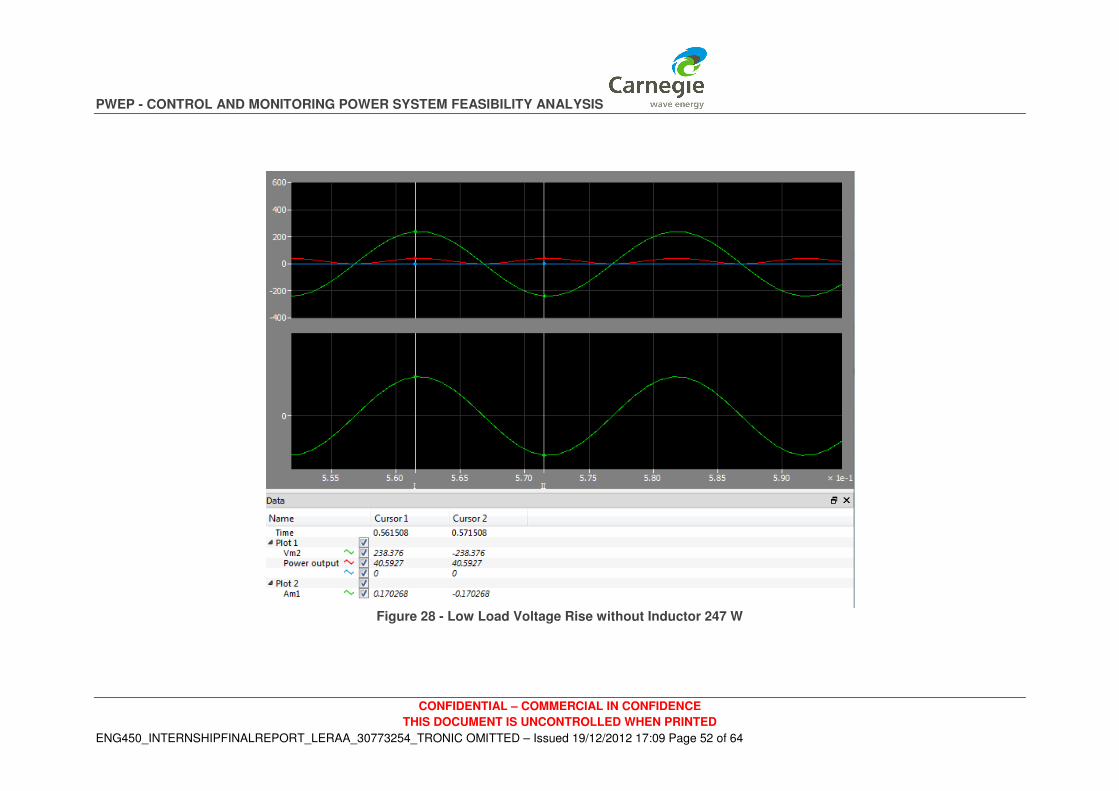
PWEP - CONTROL AND MONITORING POWER SYSTEM FEASIBILITY ANALYSIS
CONFIDENTIAL – COMMERCIAL IN CONFIDENCE
THIS DOCUMENT IS UNCONTROLLED WHEN PRINTED
ENG450_INTERNSHIPFINALREPORT_LERAA_30773254_TRONIC OMITTED – Issued 19/12/2012 17:09 Page 52 of 64
Figure 28 - Low Load Voltage Rise without Inductor 247 W
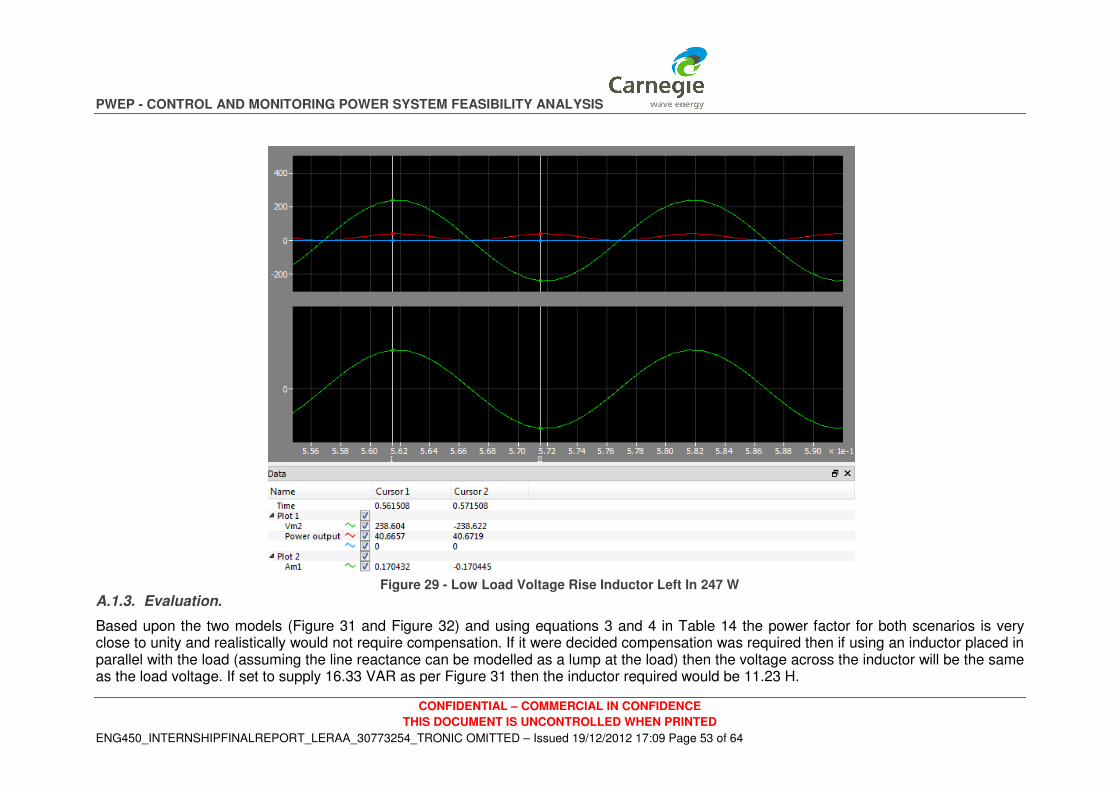
PWEP - CONTROL AND MONITORING POWER SYSTEM FEASIBILITY ANALYSIS
CONFIDENTIAL – COMMERCIAL IN CONFIDENCE
THIS DOCUMENT IS UNCONTROLLED WHEN PRINTED
ENG450_INTERNSHIPFINALREPORT_LERAA_30773254_TRONIC OMITTED – Issued 19/12/2012 17:09 Page 53 of 64
Figure 29 - Low Load Voltage Rise Inductor Left In 247 W
A.1.3. Evaluation.
Based upon the two models (Figure 31 and Figure 32) and using equations 3 and 4 in Table 14 the power factor for both scenarios is very close to unity and realistically would not require compensation. If it were decided compensation was required then if using an inductor placed in parallel with the load (assuming the line reactance can be modelled as a lump at the load) then the voltage across the inductor will be the same as the load voltage. If set to supply 16.33 VAR as per Figure 31 then the inductor required would be 11.23 H.

PWEP - CONTROL AND MONITORING POWER SYSTEM FEASIBILITY ANALYSIS
CONFIDENTIAL – COMMERCIAL IN CONFIDENCE
THIS DOCUMENT IS UNCONTROLLED WHEN PRINTED
ENG450_INTERNSHIPFINALREPORT_LERAA_30773254_TRONIC OMITTED – Issued 19/12/2012 17:09 Page 54 of 64
Adding an inductor in PLECS and simulating it shows that the power reaching the load is slightly increased as is the load voltage, however the current increases slightly (see Figure 27 VS Figure 30).
Furthermore these models have used ideal transformers which do not take into account the inductive nature of transformers which will further counteract the capacitive nature of the conductors.
Further system modelling is not possible at this level without more system specifics such as the exact load power in VA and the transformer reactances.
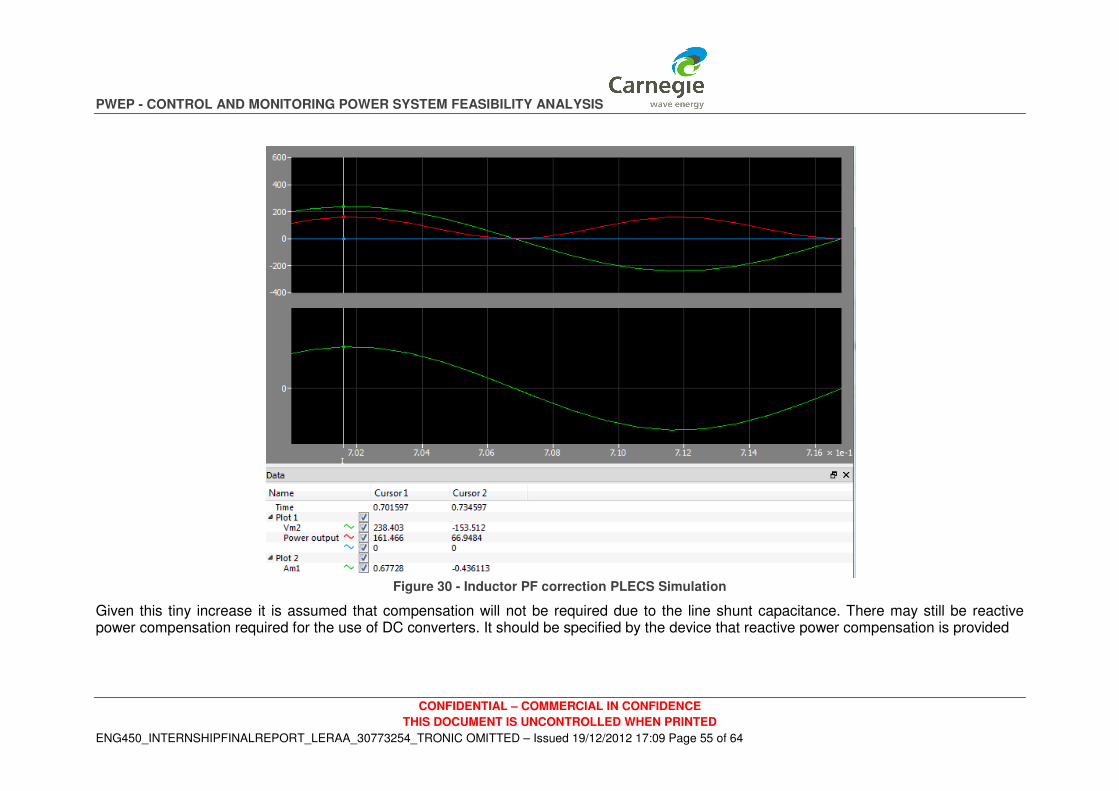
PWEP - CONTROL AND MONITORING POWER SYSTEM FEASIBILITY ANALYSIS
CONFIDENTIAL – COMMERCIAL IN CONFIDENCE
THIS DOCUMENT IS UNCONTROLLED WHEN PRINTED
ENG450_INTERNSHIPFINALREPORT_LERAA_30773254_TRONIC OMITTED – Issued 19/12/2012 17:09 Page 55 of 64
Figure 30 - Inductor PF correction PLECS Simulation
Given this tiny increase it is assumed that compensation will not be required due to the line shunt capacitance. There may still be reactive power compensation required for the use of DC converters. It should be specified by the device that reactive power compensation is provided

PWEP - CONTROL AND MONITORING POWER SYSTEM FEASIBILITY ANALYSIS
CONFIDENTIAL – COMMERCIAL IN CONFIDENCE
THIS DOCUMENT IS UNCONTROLLED WHEN PRINTED
ENG450_INTERNSHIPFINALREPORT_LERAA_30773254_TRONIC OMITTED – Issued 19/12/2012 17:09 Page 56 of 64
Figure 31 - PI Model Per Unit Evaluation

PWEP - CONTROL AND MONITORING POWER SYSTEM FEASIBILITY ANALYSIS
CONFIDENTIAL – COMMERCIAL IN CONFIDENCE
THIS DOCUMENT IS UNCONTROLLED WHEN PRINTED
ENG450_INTERNSHIPFINALREPORT_LERAA_30773254_TRONIC OMITTED – Issued 19/12/2012 17:09 Page 57 of 64
Figure 32 - T model Per Unit Evaluation

PWEP - CONTROL AND MONITORING POWER SYSTEM FEASIBILITY ANALYSIS
CONFIDENTIAL – COMMERCIAL IN CONFIDENCE
THIS DOCUMENT IS UNCONTROLLED WHEN PRINTED
ENG450_INTERNSHIPFINALREPORT_LERAA_30773254_TRONIC OMITTED – Issued 19/12/2012 17:09 Page 58 of 64
Figure 33 - Light Load T model
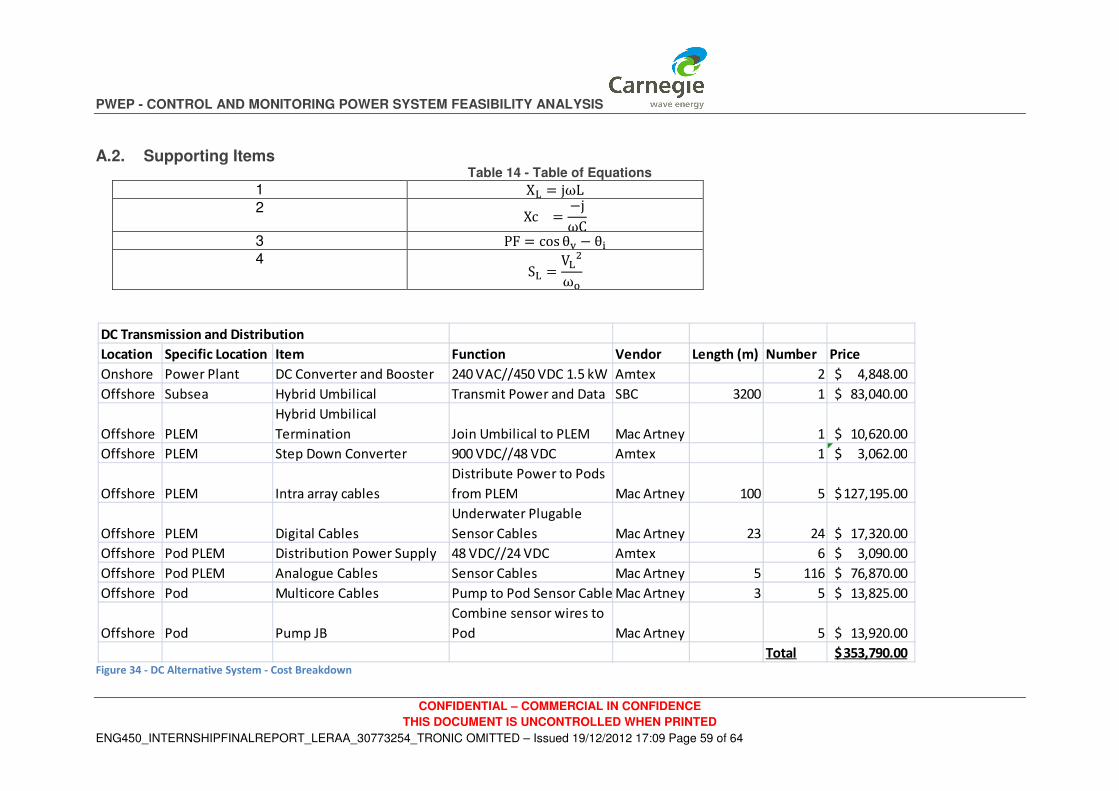
PWEP - CONTROL AND MONITORING POWER SYSTEM FEASIBILITY ANALYSIS
CONFIDENTIAL – COMMERCIAL IN CONFIDENCE
THIS DOCUMENT IS UNCONTROLLED WHEN PRINTED
ENG450_INTERNSHIPFINALREPORT_LERAA_30773254_TRONIC OMITTED – Issued 19/12/2012 17:09 Page 59 of 64
A.2. Supporting Items Table 14 - Table of Equations
1 X = jωL 2
Xc =−j
ωC
3 PF = cos θ − θ 4
S =V
ω
Figure 34 - DC Alternative System - Cost Breakdown
DC Transmission and Distribution
Location Specific Location Item Function Vendor Length (m) Number Price
Onshore Power Plant DC Converter and Booster 240 VAC//450 VDC 1.5 kW Amtex 2 4,848.00$
Offshore Subsea Hybrid Umbilical Transmit Power and Data SBC 3200 1 83,040.00$
Offshore PLEM
Hybrid Umbilical
Termination Join Umbilical to PLEM Mac Artney 1 10,620.00$
Offshore PLEM Step Down Converter 900 VDC//48 VDC Amtex 1 3,062.00$
Offshore PLEM Intra array cables
Distribute Power to Pods
from PLEM Mac Artney 100 5 127,195.00$
Offshore PLEM Digital Cables
Underwater Plugable
Sensor Cables Mac Artney 23 24 17,320.00$
Offshore Pod PLEM Distribution Power Supply 48 VDC//24 VDC Amtex 6 3,090.00$
Offshore Pod PLEM Analogue Cables Sensor Cables Mac Artney 5 116 76,870.00$
Offshore Pod Multicore Cables Pump to Pod Sensor Cable Mac Artney 3 5 13,825.00$
Offshore Pod Pump JB
Combine sensor wires to
Pod Mac Artney 5 13,920.00$
Total 353,790.00$