school of management and economics - terna.to.it · candidato: stefano pozzati relatore: prof....
TRANSCRIPT

UNIVERSITA’ DEGLI STUDI DI TORINO
School of Management and Economics
#ChinaMeltDown: an Agent-based Simulation model
CANDIDATO: STEFANO POZZATI
RELATORE: PROF. PIETRO TERNA CONTRORELATORE: PROF. SERGIO MARGARITA
Anno Accademico 2014-2015

1
Acknowledgements I would like to express my deep gratitude to Professor Terna for his patience, useful critiques and competence but mostly for his enthusiasm and dedication, which have been and will be forever a precious source of inspiration. My special thanks are also extended to Professor Margarita for accepting to be my controrelatore and for his valuable remarks and discussions. Then, I would like to thank Enzo, Grazia and my whole family for their unconditional love and support, which have made possible the opportunity to realize my goals. This thesis is specially dedicated to my grandfather Giuseppe, who will be constantly a role model to me. Finally, thank you Giulia for your love, kindness and also for reminding me every day how to be simply a better person.

2
Abstract This thesis investigates the question on whether Twitter data can provide interesting and thought-provoking insights on financial markets and if so under which circumstance. It begins with a research of an appropriate dataset of “tweets” concerning the actual Chinese financial crisis. Consequently, after a theoretical overview, a sentiment analysis has been made in order to obtain precious information. Then an Agent-Based simulation model of an artificial stock market is constructed in NetLogo. The combination of real data collected and elaborated previously with manufactured financial dynamics represents the crucial part of the analysis; thus, various experiments are undertaken within it. For instance, changing how agents reacts to different “tweets” in terms of quality and quantity. Finally, the results are discussed and some possible extensions put forward. Keywords: Agent-based simulation, NetLogo, artificial stock market, Twitter, R, sentiment analysis.

3
Contents 1INTRODUCTION.............................................................................................................5
2REVIEWOFTHELITERATURE.........................................................................................72.1COMPLEXSYSTEMSFORECONOMICS........................................................................................72.2SANTAFEINSTITUTEARTIFICIALSTOCKMARKET......................................................................122.3EVOLUTIONARYAPPROACHVERSUSRATIONALEXPECTATIONSTHEORY.........................................142.4GENOAARTIFICIALSTOCKMARKET........................................................................................17
3DATACOLLECTION.....................................................................................................203.1EXABYTESOFDATA..............................................................................................................203.2AUTHENTICATION...............................................................................................................223.3APIANDOAUTH................................................................................................................243.4LIMITSANDPOLICY.............................................................................................................263.5GETTINGTWITTERDATA.......................................................................................................293.5.1Rsoftware...................................................................................................................293.5.2Tags.............................................................................................................................313.5.3Followthehashtag.com................................................................................................343.6LIMITSANDCOSTS..............................................................................................................42
4SENTIMENTANALYSIS................................................................................................454.1RELATEDWORKS.................................................................................................................464.2SENTIMENTANALYSISON#CHINAMELTDOWN........................................................................504.3CORRELATIONANALYSIS.......................................................................................................544.4WORDCLOUD.....................................................................................................................574.5DATUMBOX.......................................................................................................................60
5INITIALSTRUCTUREOFTHEMODEL............................................................................63
6#CHINAMELTDOWNMODEL.......................................................................................656.1SETTINGUPTURTLES............................................................................................................656.2THEMARKET:BUYERSANDSELLERS.......................................................................................696.3INFLUENCERS.....................................................................................................................746.3.1TwitterInfluencers......................................................................................................746.3.2Artificialinfluencers....................................................................................................806.4THEMARKET:BIDANDASK...................................................................................................836.4.1BidandAsk...................................................................................................................83
7EXPERIMENTS............................................................................................................907.1MARKETANDRANDOMTRADERS...........................................................................................917.2BIASEDTRADERS.................................................................................................................957.2.1MarketInfluence.........................................................................................................957.2.2Buyersandsellers........................................................................................................977.2.3SmallMarket...............................................................................................................987.2.4MediumandLargeMarket.......................................................................................1017.3CHINESECRISISTHROUGHTHELENSOFTWITTER....................................................................1037.4THEEFFECTOFNEGATIVE“TWEETS”.....................................................................................1077.4.1SmallMarket.............................................................................................................107

4
7.4.2MediumandLargeMarkets......................................................................................1127.5SUMMARYOFTHEEXPERIMENTS.........................................................................................1157.6RESULTSANDDISCUSSIONS.................................................................................................1167.6.1PotentialityofTwitter...............................................................................................1167.6.2Correlationisnotcausation......................................................................................1177.7SUGGESTIONSFORFURTHERRESEARCHANDEXTENSIONS.........................................................120
CONCLUSIONS.............................................................................................................122
REFERENCES.................................................................................................................125
FIRSTAPPENDIX:SENTIMENTANALYSISANDCORRELATION........................................128
SECONDAPPENDIX:WORDCLOUDAND“BACK-BONES”..............................................131
THIRDAPPENDIX:WORDCLOUDWITHDATUMBOX.COM............................................133
FORTHAPPENDIX:#CHINAMELTDOWN........................................................................137
5
1 Introduction
The amount and quality of data which is currently available need a profound discussion. In fact, people interacts on social networks, blogs and websites like never before and their presence is recorded in different ways. Moreover, also companies have the possibility of collecting and storing huge quantities of data, which in many cases have produced great business opportunities. The world is changing and it is evolving continuously and mainly on the Internet and this surely represents a fascinating process. Nevertheless, the questions that individuals are trying to answer are basically always the same, thus, it could be interesting to understand whether these new disposals of data and new technologies would allow attempting to answer these questions from a different perspective. These phenomena are observable on a daily basis but they are frequently overestimated or underestimated and this explains why a greater discussion and in-depth analysis are required. Especially social networks receive many critiques when they are used in “institutional” sectors, in fact, these are seen by many as valuable platforms just for recreational interactions. These critiques can be true or wrong depending on different factors and situations, as many cases have shown, but their numbers are incredibly relevant and cannot be totally ignored. Therefore, a thought-provoking approach can be represented by the attempt of trying to understand more profoundly how these new platforms operate and which are the possible advantages and disadvantages. Social networks are a great source of (mainly) unstructured data, like text, that allow potentially the knowledge of opinions and thoughts of millions of individuals, thus, they could provide additional pieces of information, which is surely valuable. However, there are also relevant issues to be considered: for example, how much it is valuable and ethically plausible to observe and analyze people’s behaviors and beliefs? Unluckily, a unique answer is not available, but it is engaging the possibility to reason on all these questions. Therefore, this thesis will observe these new realities both from a conceptual and technical point of view with the aim of understanding how and whether they can have an effect on an institution like the financial market. In section 2 new methods and techniques will be presented, using as starting point the FuturICT project. These new realities will be used in order to attempt to overcome the limits which traditional instruments have encountered during the last financial crisis. In fact, even though these are used in many fields it will be interesting to analyze whether they can be valuable also in economy. Finally, two famous artificial stock markets will be presented and evaluated in order to understand their strength and weaknesses.

6
In section 3 it will be analyzed the procedures necessary to obtain data, starting with a discussion on how the process is changed during the last years, then, proceeding with the presentation of technical aspect and concepts like the Authentication process, API and OAuth. Consequently, the privacy issues and the limits of data collection will be explored in order to provide a better comprehension of these critical points. Finally, three approaches using three different softwares will be introduced in order to complete the actual data collection process. A crucial point of the whole thesis will be presented in section 4: the sentiment analysis will be introduced considering previous studies and researches, which guarantee the awareness of how this field of analysis has evolved through the years. Thereafter, the sentiment analysis on the specific “tweets” collected previously will be explained in details so that the reader will comprehend how the dataset is composed and which are the main features. Section 5 will introduce the artificial stock market created in NetLogo and its main characteristics. Here, the crucial idea is that through the agent-based simulation model different kind of agents will be able to interact together. The critical difference between the different breeds of agents is that some of them are created in the model randomly meanwhile others (“tweets”) assume features derived from the reality. Consequently, in section 6, the model will be explained in details, showing how different features and variables will be initially set, moreover, the code will be broken into pieces in order to complete the explanation. Concluding this section, the reader will be completely aware of how the model was constructed, while, in the following section, he will understand how the market will operate and how different agents will interact. Finally, section 7 will allow the reader to test the crucial part of the thesis, therefore, observing whether agents with real characteristics can affect a market which operates randomly. Thus, the reader must be aware that the critical point is represented by the introduction of the “tweets” in the market, which guarantees the possibility to observe whether the index will display a path similar to the one shown by the real Shanghai composite index. Nevertheless, many experiments will be presented previously because it will be necessary to understand clearly the sensibility of the model. Concluding, a discussion on the limits and the potentialities of this approach will be presented, moreover, in order to avoid and overcome the limits, further extensions and researches will be disclosed.

7
2 Review of the Literature
2.1 Complex Systems for Economics
The economy and its dynamics have been observed and studied extensively since early stages of human life, but it has evolved in a much more complex and detailed system, in which different actors and instruments interact; the importance of a deep understanding of the economic science has increased over the years and the 2008 debt crisis has exposed the entire world and the more relevant institutions to a critical situation, in which well-known models have operated poorly in predicting the atrocious effects, that have been experienced worldwide. This is surely also due to the complexity that these models have to face. Nevertheless, several discussions have arisen in order to understand how they have operated. Precisely the latest international financial crisis has stressed the limits of the instruments available for policy-makers, which encountered difficulties in order to face the problem. This condition has been underlined by a relevant figure, an example is represented by the Governor of the European Central Bank in 2010, during the annual Central Banking Conference: he suggested that better instruments could have brought to the table better solutions and as a consequence better reactions. Therefore, even though the words of Trichet are clearly provocative and express only a partial truth, it is a topic on which economic world has to debate carefully. In fact, most of the time, the social cost of this disaster have damaged and hurt thousands of citizens; for this reason, as painful it was, the point is that it is now necessary to understand which are the limits of the instruments used and whether it is possible to go beyond these limits. The situation is constantly evolving, therefore, instruments which are good today could not be able to face different scenarios tomorrow. In order to present some new models, an interesting suggestion could have been represented by the FuturICT proposal by Farmer et al. (2012):
The FuturICT project will exploit the rapidly expanding capacity of ICT to develop a system to continuously monitor and evaluate the social and economic states of European countries and their various components, and, what is of particular importance for this discussion, the real economy, the governmental sector, the banking and finance sector, by developing and managing a massive repository of high-quality data in all economic and financial areas; This will provide a platform for the development and application of data mining, process mining, computational and artificial intelligence and every other computer and complex science technique coupled with economic theory and econometric methods that can be devoted

8
to identifying the emergence of social and economic risks, instabilities and crises
Unfortunately, at the moment it will remain a vacant proposal because it has not raised the necessary funds. Nevertheless, it advances interesting topic on which a further analysis could bring important results. The amount of data which can be collected is enormous and it is increasing every day; new technologies, skills and knowledge could improve the overall performance of the analysis of the economy, these new possibilities have to be accurately explored. What-if analysis, scenario evaluations and experiments were also critical parts of the FuturICT project, and they could represent the opportune improvement of the current models. More pieces of information coming from modern ways of collecting data, which can be transferred into a more complex simulation, which will be much more similar to reality and thus it will produce much more actionable responses as it is stressed once again:
We intend to use new tools in information and communication technologies to implement an integrated complex systems approach for understanding financial markets and the economy. This includes the collection of new data, new methods of empirical analysis, and the development of new mathematical and computational tools. This effort will be guided by emerging new conceptual paradigms such as network theory, market ecology, behavioural economics and agent-based modelling, and empirically grounded by laboratory experiments and micro data. By combining these ideas into a practical simulation and forecasting tool our goal is to build the foundations of a new paradigm within economics.
These further opportunities could improve the current situation, but they also offer the possibility of reasoning on how economic theory has evolved over the years and if it is necessary to review some of traditional theoretical assumptions and results. The crucial aspect is expressed by the view of economy as a complex system, composed of different entities; dynamic and probabilistic are two of the main characteristics which differentiate it from previous models, which were more static and deterministic; also non-linear and network interactions are relevant differences, moreover, they stress the importance of including a dual relationship between the behavior of single individuals and individuals as a group. Finally, a further specification arises in terms of probability of the occurrence of events: like natural phenomena, as earthquakes and floods, also financial and economic downfalls not always follow a Gaussian distribution, which is the standard assumption in well-known econometric models. The frustration derived from the impossibility of using the econometric models is explained by Farmer et al. (2012):
9
Despite this convergence of academic opinion around DSGE models, in the crisis American policymakers paid no attention to them whatsoever. Instead, they looked at what happened in the 1930s and tried to avoid those mistakes.
Clearly, even though the approach is different, not all the econometric theory has to be deleted and forgotten, on the contrary, it can always represent an important part in this overall attempt of representing a more detailed simulated economic world. The interesting element of this line of reasoning is expressed by the pursuit of a different approach, which will not focus on optimization but it exploits the opportunities that new techniques like data-mining, social network analysis, system dynamics, agent-based modelling, non-linear dynamics, catastrophe theory and the theory of critical phenomena, as suggested by the FuturICT proposal; thus becomes reasonably the aim of the present work, which will use agent-based model in order to manage the presence of different consumers and social network analysis along with new sources and techniques of collecting data in order to obtain not traditional pieces of information related to the behavior of the agents. Agent-based models differently by the Dynamic Stochastic General Equilibrium (DSGE) models do not focus the attention on aggregate quantities, instead the approach can be considered done at a microscopic level. Thus, that is the reason why agent-based models are strictly connected to behavioral economics. A further shift in collecting data is required. As previously said, mainstream models use aggregate data, thus are easily available in several institutional websites freely: GDP and employment rates are not necessarily hard to find. A more tenacious research is needed in the case of gathering data at more detailed level, which would guarantee a sharper use of agent-based modelling. The evolution of ICT technology in many cases could bring a relevant support in this direction: omitting for the moment the privacy issues, which are clearly fundamental and require a careful examination, the possibility of monitoring people, even anonymously, could deliver data on a daily basis, on individual's activity: smartphones geo-localization represents the most known example. Speaking of the increased possibility that technology could deliver is absolutely necessary to understand how millions of websites, blogs and social networks could help in obtaining potential powerful data. A stimulating suggestion is again the one proposed by Farmer et al. (2012); the intuition consists in extracting expectations in real-time from these huge amounts of text available. Better softwares would be probably necessary in order to gather a greater amount of data or, proceeding in the analysis, in order to extract more precisely the inner sentiment, hidden within words. Anyway, this method is less time-consuming respect to handmade surveys, which are usually not completely reliable from a statistical perspective and are also most

10
of the time expensive. Once again considering even in this scenario the network effect, it seems reasonable to think that these expectations are influenced inside the network by most preeminent users; therefore, contagion and pace of diffusion are two elements which must be taken into account in agent-based models. Creating a socio-economic system in which expectations feedback and adaptive behavior through learning are relevant elements, and adding an optimal level of heterogeneity for the agents, should bring an instrument which could be more valuable to policy-makers respect to the currently limited instruments.
Under our approach individuals may have varying information, depending on what is behaviorally plausible. Aggregate phenomena are generated by the interaction of such individuals, who influence each other and interact with each other. Such an approach requires intensive use of ICT both for simulating our models and for gathering the data against which to test them. To this end, an important goal of FuturICT is to build a “flight simulator” for policy makers that can be used to obtain experience in managing financial-economic crises. The simulator that will be built will use advanced ICT-tools collecting real data and having state of the art graphics, to make it easy to visualize what the simulator is doing and what the outcomes of the simulation and different policy measures are.
The quote explains the goal of the FuturICT project but it is a good summary and it could be easily extended to all the agent-based models, which aim to guarantee a greater support to policy makers, in order to avoid or to limit tough stagnation and recession periods, using the potentiality which technology guarantees. Having collected the right dataset, the further challenge would be represented by the possibility to observe how actors in an agent-based model will react to specific actors which will act accordingly to real values; a recent work by Geanakoplos et al. (2012) have tried to represent the housing market in Washington D.C. as an agent-based model, in which data gathered from real indicators have been used to construct the characteristics of the households. Therefore, the process of decision making was created and results were intriguing: the simulations were able to recreate with a good approximation the home price bubbles observed in the real world over the period of analysis. Then, the question becomes whether it is possible to use ABM in order not to reproduce historical data, but in predicting future price movements and, thus, being more useful to policy makers. However, it is necessary to make a further step back and analyze the economic thinking behind these different approaches and models. Rationality is the key ingredient upon which all the economic theory is constructed: an economic actor will make the optimal decision, having the right set of
11
relevant pieces of information and fixed preferences. The first models did not place considerable attention or consider just indirectly the effect that others agents will have on each other, the main goal was to find the existence of a general equilibrium; Walras (1898), Arrow and Debreu (1954) are examples which bring interesting results in this direction, but no one has gone deep in the understanding of how the aggregate behavior is related to individual behavior. At a macroeconomic level, the crucial assumption was once again about the rationality of individuals. Thus, aggregately the economy will act just like a single rational individual. To this line of thinking are aligned most of the macro dynamic models, even if stochastic processes have been added. DSGE models are, therefore, the summary of the whole mainstream macroeconomic theory. Progressively the concept of “asymmetric information” has been introduced by economists like Akerlof and Stiglitz, which then can lead to the successive concept of “market failure”. Nevertheless, further specifications in order to cope with the limits of these models have been developed during the last decades. From a completely rational agent, the theory has shifted to a bounded rational economic man, which not always act optimally because of the lack of information or the impossibility of making the right decision. Psychology and complexity have gained a role in the latest evolution of the economic theory; as pointed out by Akerlof and Shiller (2010):
To understand how economies work and how we can manage them and prosper, we must pay attention to the thought patterns that animate people’s ideas and feelings, their animal spirits. We will never really understand important economic events unless we confront the fact that their causes are largely mental in nature. It is unfortunate that most economists and business writers apparently do not seem to appreciate this and thus often fall back on the most tortured and artificial interpretations of economic events. They assume that variations in individual feelings, impressions, and passions do not matter in the aggregate and that economic events are driven by inscrutable technical factors or erratic government action.
Thus, behavioral economics has gained great support, obtaining a relevant role, with its models based on partial-rationality and behavioral game theory. It is possible to state that economic actors do not act fully rationally, but more models are required. Agent-based models could help in this sense, helping in the construction of models in which the imperfect interaction between agents could emerge and create aggregate results. Artificial financial markets have been studied extensively and one of the most relevant example is certainly represented by the Santa Fe stock market.

12
2.2 Santa Fe Institute Artificial Stock Market
It represents one of the first attempt to reproduce a financial market and was available in the late 1980’s and early 1990’s: it focused on trading strategies and the original desire of the authors was to create an environment in which not much information was preloaded. They want to see whether it would have been possible to make the agents to create themselves the dynamics; there were a separation between good and bad strategies, in which just the first survive, other strategies would have entered in the second period. Thus, an evolutionary process was constructed. The project was far from completed and then the team augmented with the introduction of Palmer and Tayler, a physicist and a computer scientist. The simplicity and efficacy of the model consist into establish how agents will buy or sell one share of stock. The price mechanism had its flaws and depended on how the variable (ƛ) was imposed; the variable was a measure of how easily traders would find a counterpart at a given price. Setting a low level of (ƛ) would have caused long periods of excess demand or supply, otherwise the model would have produced a price overreaction, going from excess demand to excess supply unreasonably rapidly. Another problem arose in the relation between the strategies and buying/selling behavior of agents. Anyway, the model led to compelling outcomes, which suggested to the authors to proceed in the improvement process. The structure was kept as simple as possible; in fact it included just two assets, a risk free bond, paying a constant interest rate and a risky stock, paying stochastic dividends, resulting from an autoregressive process. However, is directly one of the builders (LeBaron, 2002) which stated the presence of relevant issues to be dealt with:
The system is simple and fits well with the other mechanisms of the model. Its simplicity does open several important questions. First, it is not calibrated to any sort of actual data. No where is specified as to what the time period is. This is fine for early qualitative comparisons with stylized facts, but it is a problem for quantitative calibration to actual time series. Another problem is the fixed interest rate. It would seem sensible to have interest rates set endogenously. Also, the market is definitely a partial equilibrium one since there is no market clearing restriction in place for the debt market. Clearing a second market opens rather extensive design questions, but it does remain an important open issue. Another common critique is the fact that there is only one equity issue. Adding further shares would be useful, especially for studying trading volume, but again this opens up another range of parameters, and significantly increases model complexity.
13
New versions of the model were created in order to face the critics. Coping with risk aversion in establishing agents’ preferences and beliefs, the authors introduced a classifier system to predict future stock returns. The use of classifiers was a reliable option mainly for its simplicity as a metaphor for learning, the ability to tackle high dimensional state spaces and an easy way to observe the information used by agents; nevertheless, it has to face some critics as well but it was well correlated to the Genetic Algorithm (GA), which was employed to update agents’ rules depending on forecasting accuracy. Relevant features of the model are very sensitive to the speed of the learning process, which is strictly related to the frequency of the use of GA by the agents. Two cases arose: when agents update their rule quickly the patterns created are similar to actual financial time series, differently when the update mechanism was slower, it produced outcomes similar to the ones predicted by the homogeneous rational expectations equilibrium. Then, having explored the technical features of the model, it was possible to understand and in part discover the equilibrium structure and learning dynamics of the market. Nonetheless again LeBaron (2002) specified a successive critique:
A more fundamental critique would be that real financial markets are never truly in equilibrium. They are institutions which are designed to handle buying and selling in real time, and therefore may be far from the ideal world of Walrasian market clearing. This market mechanism has simply avoided the entire microstructure aspect of the market. It is assuming that supply and demand are somehow balancing in some unspecified market institution. This seems like a good first assumption to start with, and might be fine for thinking about longer horizon price patterns. However, realistic modeling of market institutions and trading is an important extension that needs to be considered.
The interesting part of these observations is represented by their origin: it directly comes from one of the authors and underlines how difficult could be to recreate partially and flawlessly a stock market. Despite that, the possibilities of augmenting the model with extensions is also a thought-provoking aspect. The overall effect was similar to actual financial data, showing kurtosis in return series, almost no linear autocorrelation and persistent volatility. Also trading volume was persistent and correlated with price volatility, proving that even with some critical issues to be corrected in future works, the outcome was satisfactory. It is the author itself which in its work (LeBaron, 2002) summarizes the design issues:
14
1. Moving to intertemporal constant relative risk aversion preferences where wealth distributions determine the amount of price impact different traders and strategies have.
2. Calibrating fundamental movements to actual financial time series.
3. Coordinating social learning between agents.
4. Replacing the classifier systems with a more streamlined mechanism for
mapping past information into trading strategies using a neural network inspired nonlinear functions.
Further developments were made in the following years and shifted from putting the emphasis on the learning speed to the memory length in terms of past time series. It represents a feature which is common in many economic and financial situations. The importance of the Santa Fe artificial market consists in its inheritance of lessons and philosophies: trading mechanism is straightforward and it is produced by key elements, which in most of the cases are not pre-set in the model but emerge from the evolutionary dynamics. Simplicity and sensitivity are the basic characteristics, which the model should conserve. Dealing with the fragility of financial and macroeconomics equilibrium is not an easy task. Creating rational agents is a long transformation process in which predictions and beliefs play a relevant role. Therefore, computer science tools, like the Genetic Algorithm and classifiers, needed an implementation, even though their intuitiveness and efficacy are a necessary condition. However, the model has been extensively appealing to researchers for years due to its agent dynamics and conservative economic structure, a very standard setup which yields immediate outcomes.
2.3 Evolutionary approach versus Rational expectations theory The different approaches in order to construct a simple model of a stock market are described by Palmer et al. (1994). The evolutionary approach is the innovative part of the work.
Instead of the RE approach, we propose an inductive model in which we start with agents who have little knowledge or reasoning ability. The agents trade on the basis of internal models or rules that are initially very poor. By observing the success or failure of these internal models the agents can improve them, select among alternatives, and even generate totally new

15
rules. Thus over time their behavior becomes more sophisticated, and they become able to recognize and exploit many patterns in the market.
As noted previously in the last past years the debate between these two principles has been huge. The Rational Expectations (RE) states that using a logical procedure, agents will compute their optimal choices and behavior in any situation. The set of agents is not restricted to consumers, but it includes also firms and institutions for example. RE theory needs strong assumptions, which are defined by detractors unreasonable, these are complete information, perfect rationality and common expectations. Thus, all agents should have all the necessary pieces of information, perfectly able to solve even the more complex computational problems without difficulties and errors; the process is the same for everyone, therefore, agents perfectly know what other think and how they will choose their optimal choice. The failure of the theory is represented by the impossibility in practise of satisfying the three basic assumptions and in some cases, by other factors which are simply not included. The lack of complete information, perfect rationality and common expectations arises especially when the problems become more complex. In most of the scenarios agents should learn something about the context and adapt to it, then preloaded information is not enough. Moreover, even if agents should have the necessary information they probably will not be brilliant enough to compute the optimum; they will prefer a more accessible rule of thumb in the process of decision making. Finally, also duplicating the general reasoning is not obvious. On the other hand, the evolutionary approach, as stated above, is an example of bounded rationality theories. Researchers in recent years have tried to find a different explanation for the behavior of economic agents. Bounding is not an easy task, it is necessary to decide which aspect of human rationality to limit, computational time or complexity, memory capacity or forecasting ability. Therefore, in the choice of evolutionary theory is to construct a model which should be inductive and not deductive. Problems related to previous assumptions are not involved, therefore, the cases in which RE fails. The main disadvantage is represented by the almost complete absence of analytic method, thus the field, which is even today in an exploratory stage, should improve in order to produce more rigorous results. Moreover, there is an overabundance of algorithms which could describe adaptive and learning behavior, but the correct choice is once again not obvious. Reproducing a simple stock market, Palmer et al. (1994) decided to test which approach could bring the most appealing results. The model consists in a market with different kinds of stocks and agents are not homogenous, in the sense that they could have distinct operating principles. The main decision is to choose at each given time the number of shares, considering the constraint of a finite wealth. There are two possibilities for agents to make profits: the first represented by the stream of

16
dividends paid by the company issuing the stock, or by speculation which depends on the variation of the shares’ price. Dividends are ruled by a purely stochastic process meanwhile, the price depends on the offers and bids. Agent's decision is constrained by a fixed total wealth, the impossibility of borrowing funds and by market clearing conditions; besides, it is related to the whole past history of dividends and price variation. The rational expectations approach can be described by a function in which best estimates of the value of prices at the end of the period are reflected in the actual price level. It allows the rise of the arbitrage phenomenon. In addition, there is the possibility to include risk aversion. The limit is that not only all agents will construct their expectation on the same information, but their reasoning will be the same. Therefore, agents will be completely sure about what others believe and that is highly unreasonable. The subjectivity of beliefs is necessary in order to reproduce real markets’ behavior, instead with RE approach objectivity arises. Indeed, focusing on arbitrage there is no space for bubbles and crash, which leads to the technical impossibility of making profits, as a consequence of efficient market hypothesis. Suggestions of implementing the model in the RE scenario are: introducing heterogeneous expectations and allowing Bayesian learning of parameters (Palmer et al., 1994). Completely different is the evolutionary approach. Bubbles and crashes are now available and agents are coevolving without interacting directly. The intent is to reproduce the reasoning of human beings.
They start by making mental models or hypotheses, based on past experience and training. These models may directly imply a course of action, or they may let them anticipate the outcome of various possible actions, on which basis a choice can be made. In any case, humans also observe their own successes and failures, learning to modify or abandon unsuccessful mental models, and to rely more strongly on successful ones.
Therefore, the technical tools for constructing the mental process are classifiers and a genetic algorithm described previously. The results of these two approaches strongly depend on whether the system is complex or not. In sufficiently simple cases, the theoretical framework of RE and the efficient market hypothesis is respected, with convergence to an equilibrium with the price as a key variable. In richer environments, the evolutionary approach prevails; the complexity of agent’s behavior increases over time through learning and adaptive processes. Further works are needed to implement these results and directions available are numerous. Including risk aversion in learning behavior, or to attribute more or less randomly a specific information to a specific group of agents, or even limiting the computational behavior of specific agents and allowing for bankruptcy.

17
The learning process is not just related to agents inside the model, but it is a fundamental feature of agent-based modelling. The work made by Johnson (2002), uses the artificial stock market in order to explain interesting expedients to improve model-building and programming:
It is better to encapsulate information and retrieve it when necessary than it is to leave information sitting about where it can be accidentally altered. It is better to use container classes than to do math with pointers. It is a good idea to design a simulation model with an eye toward the end product, both in terms of exploring parameter combinations and data output.
It underlines once again the relevance that the Santa Fe Institute Artificial Stock Market has gained over the years and how much importance express in the field of agent-based modelling. Furthermore, Johnson stressed that object-oriented modelling can never be omitted by anyone which is facing the challenge of constructing an efficient model.
2.4 Genoa Artificial Stock Market A further example of an artificial financial market is represented by Genoa Artificial Stock Market (Marchesi et al., 2003). The aim of the model was to understand the effect of global availability of cash on the process of price formation. Thus, differently from the Santa Fe Artificial Market, it pains not great attention to the learning process of agents and the resulting decision-making mechanism. The interest is shifted to the macroeconomic dynamic of prices. The creation of a robust market with several agents involved is directed to the exploration of price dynamics from a microscopic perspective; moreover, the relationship between money supply and stock price processes is crucial in the analysis. The intelligence of agents is not considered, they know only their cash endowment and asset portfolio. They do not have learning abilities, then they place orders randomly, as summarized by the authors:
The first release of the Genoa artificial financial market is characterized by heterogeneous agents exhibiting random behaviour, one traded asset and a fairly complex interaction mechanism. Agents place buy and sell orders randomly, compatibly with their cash availability and asset portfolio. Orders are then processed by a module, the market maker, which builds the well known demand and supply curves, whose intersection point determines the new asset price. Orders, whose limit prices are compatible with the value of the new price, are satisfied, while others are discarded. The traders cash and portfolio is updated and a new simulation step begins. The Genoa artificial market is stable, i.e., prices do not diverge, being constrained by the fixed

18
amount of cash of traders. In addition, with a mechanism representing the aggregation of traders, the artificial market is able to reproduce one important feature of real markets: fat tails.
The interesting part of the work is expressed by the focus on the availability of cash and not on modelling price process through decision making, as many researchers have done previously. The contrasting perspective consists in understand if the amount of the commodity available will determine some of the fundamental features of price behavior. The latest approach is due to the belief that in a shorter time horizon agent’s expectations play the main role but when the horizon increases, the crucial determinant of prices is the flow of cash resources. In classical macroeconomics investments are defined by the propensity of households to save and the decisions of firms to use the rented money to increase their productivity. The interaction between these two, considering also inflation, is governed by the interest rates in most of the cases, therefore creating a dynamic system, in which equilibrium is reached through adjustment. In the building process of the model, the awareness that the structure of the market influence plays a relevant role in the determination of the cash flow. Traders are the active agents in the model. They are autonomous actors which have a given amount of cash and stocks and issue orders to buy or sell their stocks. Without the possibility of developing trading strategies, they operate in relation to owned cash and stocks. Only one stock is available on the market, in order to keep the simplicity of the model. Furthermore, the presence of a central market maker allows the price formation, matching supply and demand, satisfying all orders a the previously set conditions. The possibility of having an imbalance between orders helps in order to create an environment in which the relationship between increase or decrease of prices might be matched by cash increase or decrease. The market is built using object-oriented technology to create an evolving system. Authors designed it in order to allow further implementations. Examples are increasing the types of securities in the market or the possibility of implementing real online trading; moreover, there is room for learning and adaptive behavior. Finally, the work presents experiments which basically compose two cases, in which the difference is defined by a fixed amount of cash at the beginning or by an exogenous positive cash flow. In the first cases, it was possible to observe that the average asset portfolio capitalization fluctuates randomly, the distribution of prices follows a Gaussian distribution and the system showed a purely diffusive behavior. One of the principal outcomes is displayed by the presence of fat tails for returns distribution, which is a typical characteristic of real markets. In the second scenario instead, the average amount of cash and asset price grow steadily.

19
Therefore, the main finding in the Genoa Artificial Stock Market is that the order process drives the cash supply and market capitalization, but a potential increase of the latest is justified only by an adequate cash increase.

20
3 Data Collection
3.1 Exabytes of data
There were 5 exabytes of information created between the dawn of civilization through 2003, but that much information is now created every 2 days. Eric Schmidt, CEO of Google (2010)
Obtaining data seems to be the easiest part looking at the sentence upward by the executive chairman of Alphabet Inc. The quantity of data available has deeply increased in the last period, the well-known concept of “Big data”. The environment is changed, companies can generate and store thousands of bytes of information even not structured data. Some of them base their position and role on their ability to aggregate information and on their ability to get some insights out of it. Examples of this phenomenon are social networks, like Facebook, Twitter, or Linkedin; which gather great amount of data, mostly unstructured. Just to have an idea of the volume: Twitter and Facebook produce around 20 terabytes (TB) of data every day; clearly there are several other examples of enterprises, which can aggregate much more data, reaching the stunning level of terabytes every hour of every day of the year. These are only estimates, which nevertheless could be out of date rapidly, considering the speed of the increase. Differently from the past, quantity and quality of data have deeply increased. As pointed out in Einav and Levin (2013), a good example to understand the change in perspective is represented by retail stores. Previously data collected was limited to daily sales and warehouse situation, considering a big plus if there was a differentiation between products. This kind of records cost way much more respect to the current situation in term of money and time. After that Internet has greatly developed, thousands of retailers base their business Online. Thus, previously time wasting activities of recording have been reduced to simple and quick operations made automatically by their websites and softwares. The next level of data that are available today consists in much more interrelated datasets, from daily sales to every single click on the page; taking as example the biggest online retailer, Amazon, it is now common knowledge that products viewed and, at the end, not bought are as important pieces of information as the products that have been actually sold. Therefore, others particular features can be highlighted. In addition to the improved volume of data, also real-time, less structured and new types of

21
variables have deeply transformed the environment of doing business and the whole economy. This basic concept is well explained in few lines by Einav and Levin (2013):
Obviously, this is a lot of data. But what exactly is new about it? The short answer is that data is now available faster, has greater coverage and scope, and includes new types of observations and measurements that previously were not available. Modern data sets also have much less structure, or more complex structure, than the traditional cross- sectional, time-series, or panel data models that we teach in our econometrics classes.
Clearly the challenge now is to get something out of the great amount of data, that these companies provides. It is a gold mine for everyone from researchers and other companies, which are now able to get a much more profound intuition on their costumers' behavior. In this direction, these corporations and others more specialized are now able to complete the purpose; besides data mining phenomenon is also increasing and improving every day, that guarantee better techniques in order to get more appropriate services for consumers and thus greater profits for those companies. Definitely in a complex phenomenon like the one previously explained even though briefly, it would be necessary to spend some time on the ethical issues that have been generated, as a consequence, from the “datafication”, as defined by Mayer-Schönberger and Cukier (2013). But there will be time later for this relevant topic. Almost everyone agrees on the potential of “Big Data”, especially the use and analysis of unstructured data, which seems the most interesting part. But in terms of research, getting the data, and then cleaning them, can turn into a time-consuming work. Therefore, the starting point has to be: obtaining the data. The present research will focus upon mainly on real-time and unstructured data. The main source for this kind of information is Twitter, which as many other Social Networks, grants a stream of short 140 character, the popular “tweets”. The choice of using Twitter should be attributed to its identity of a great source of information. Indeed, differently from other social networks, Twitter provides real-time, easily accessible and synthetic pieces of information; it is also used by thousands of people every hour, which guarantees access to a huge target of thoughts and considerations. Therefore, in most of the cases professional journalists, independently or directly from the official user of journal they are working for, report the news soon

22
afterwards without any hesitation; nevertheless, the effect is spread by common users which report or using Twitter language “retweet”, increasing the number of people involved and thus volume of data. Volume and almost complete absence of timing lag between events and “tweets” published are two main characteristics of Twitter and the main reasons why it fits quite well for the research project. The synthetic form of “tweets” will be also a crucial aspect in future steps of the research because it will allow to work with a relevant amount of words but not enough to be completely overwhelmed. Users on Twitter used to rely heavily on abbreviations and external links in order to face the restriction of 140 characters, which will probably cause some trouble in order to detect and interpret properly the meaning of sentences; it will be associated with possibility of encountering different languages. Ultimately it is a great resource and the possibility of using it should not be wasted. Hence it necessary to proceed and explain carefully the steps required in order to get data: firstly, authentication procedure will be shown and described, focusing on API and OAuth concepts. Lastly, it will complete a brief dissertation on security and privacy policies.
3.2 Authentication The first step in order to get information in the form of “tweets” is to create an application directly on Twitter. It gives the possibility of obtaining credentials necessary to complete the task. Later different approaches will be shown to complete the process and extract a dataset containing “tweets” in which we are interested; anyway for every request an application on Twitter is mandatory. Using the correct link to the section of twitter aimed to developers, it becomes possible to start creating the application, clicking on Create new application. Consequently, the name and the description of the application have to be choose. The choice is completely up to users, which are free to decide their name and to give a short or a much more detailed description. Other requests must be fulfilled, such as Website and Callback URL.

23
Figure 1: Application Details As Figure 1 shows, the name was set SentimentTest13, and in the description a brief description of the goal underneath. Also, a regular Twitter account was indispensable to complete the authentication and to connect the application to an actual user. To get through this step, my personal account has been used.
The final result is, therefore, a complete application newly created.
Figure 2: Application interface and basic settings From now on it is possible to manage the application, controlling settings and permissions. This last section gives the possibility to select which type of access the application requires. The choices available are:

24
● Read only ● Read and write ● Read, write and access direct messages The crucial role then is played by the Keys and Access Tokens section, where it is possible to collect all relevant characteristics, needed to complete the authorization. These are personal codes that identify the application. ● api_key ● api_secret ● access_token ● access_token_secret To fully understand these concepts, it becomes essential to go more deeply into the notions of API and OAuth.
3.3 API and OAuth An API (Application Program Interface) is defined as:
set of routines, protocols, and tools for building software applications. The API specifies how software components should interact and APIs are used when programming graphical user interface (GUI) components. A good API makes it easier to develop a program by providing all the building blocks. A programmer then puts the blocks together.1
Basically is a way through which a software can connect and interact with another one. Even though the principle is always the same, there exist different types of APIs for operating systems, application and websites; these exact realities guarantee one or more APIs to programmers in order to let them create correlated and specialized applications, improving the relative environment. Twitter provides three kinds of APIs: REST API, Search API and Streaming API; Search API returns a collection of “tweets” corresponding to a specific query but does not guarantee by assumption a complete source of “tweets”, in fact not all “tweets” will be available. Streaming APIs gives access to Twitter’s global stream of data, making feasible to monitor and process “tweets” in real-time; anyway, Twitter itself suggests to place great attention on type of research that must be done, because Streaming and REST APIs
1 Beal V. (2015). Webopedia.com. API - Application Program Interface URL http://www.webopedia.com/TERM/A/API.html
25
have differences in their implementation and it could cause change in way a programmer wants to construct its application. Without going to much into technical details, it is notable that most of the APIs, concerning famous websites and companies like Social Networks or Google, are REST APIs, through which is possible to conduct singular researches; moreover, they identify Twitter applications and users using OAuth. Thus the last technical aspect that it must be considered is OAuth, through which Twitter provides authorized access to its API. The OAuth process allows to relate Client, User and Server and it is necessary to authenticate with Servers. Usually passwords and usernames grant access to private resources, unless the User wants to revoke the client’s access. The main point is the precise right and power to control access. OAuth focuses upon the level of security that this process must satisfy; it improves the safeness of this new interaction. For the sake of completeness, it is good to have a more formal definition:
OAuth is an open standard for authorization. OAuth provides client applications a 'secure delegated access' to server resources on behalf of a resource owner. It specifies a process for resource owners to authorize third-party access to their server resources without sharing their credentials. Designed specifically to work with Hypertext Transfer Protocol (HTTP), OAuth essentially allows access tokens to be issued to third-party clients by an authorization server, with the approval of the resource owner. The client then uses the access token to access the protected resources hosted by the resource server.2
Speaking about security, OAuth guarantee more trust in operations that today are much more frequent than in the past. Hundreds of application have been created in the last period, and most of them are used and based on the interaction with an account, which can be Google account or Facebook account. Many times it is possible to observe the possibility of “signing in” using a previously existing account. This procedure avoids the time wasting effort a user have to put in a new registration and in keeping all these new information in memory, in order to complete future accesses. A big concern affects thousands of users: the risk of being hacked. Therefore, not only a user should be worried about being hacked himself, but also that application at which he gave his credentials should not being hacked. An example could clarify: some years ago a Twitter application,
2 Hardt E. (2012). The OAuth 2.0 Authorization Framework. URL http://tools.ietf.org/html/rfc6749
26
Tweetgif, was hacked. Nevertheless, none of the credentials were endangered, this solely because of the use of OAuth security standards. Keys that this procedure requires, are the ones that were previously mentioned: firstly, consumer key and consumer secret key, secondly, access token and access token secret, which can easily discover in the section Keys and Access Tokens of the new application. For every possible doubt about these two concepts that compose the authentication process in order to get databases through Twitter, is Twitter itself, which provides an exhaustive documentation, in the section dedicated to developers.
3.4 Limits and Policy Twitter is unquestionably interested in protecting its relationship with each user and this means that their private information and messages should not be at the disposal of everyone. Many cyber-attacks have tried to get through the defensive system of the social network and every time this happens, Twitter managers usually does not waste much time before ensuring that no personal information was stolen. The reason is quickly understandable: trust and safeness come first. Always. Especially in a social network environment. Which is the correct level of personal information that has to be shared with others is probably difficult to estimate precisely; more cautious users suggest to not share too much information, in particular, birth data, home address or home phone number. Someone could agree, but it underlines a situation of not complete trust. If the user is not sure that he will be provided a high level of safety, he will probably not trust the social network, ending up not using it anymore. A relevant number of people leaving Twitter will surely cost much more money than the cost of providing enough protection. Moreover, there are certain pieces of personal information which are not protected by Twitter, or more exactly, protected just partially. As previously said privacy and ethical debates are fundamental. It is possible to point out that regulation of the level of privacy is just as important as protecting basic personal information. It means that also what it is written in the “tweets” can be intimate for a user and should be treated carefully.

27
This is exactly the fading boundary that characterizes the social networks, which have a huge ground compound of informed consent. It consists in giving all pieces of information to users which are signing in. Thus, “tweets” become “public” and only users are able to establish which level of privacy they want for their thoughts in 140 characters. Is it enough? This is an unresolved question; there is currently a lot of debate about the limits in which a researcher should have access to this kind of data. Lewis et al. (2008) proposes a study to observe how friendships and interests evolved through the years. It used a dataset taken from Facebook, which as Twitter, has a detailed policy about privacy and protection for personal data. Everything was good enough and no single identity was revealed. Deanonymization became a problem later. The outcomes of the study were properly released and every researcher in the whole world had the possibility to try of reproducing the above-mentioned results. In doing that some of them were able to deanonymize some IDs of the dataset as suggested in Zimmer (2008). Therefore, to fight against this concern new techniques of anonymization and privacy preserving have been created during the last years. The level of accuracy related to relational data have been well explored, and many results were accomplished; differently on social network data it is only at the beginning. Some of the most famous anonymization methods can be divided in two categories, such clustering-based approaches and graph modification approaches, which depend basically on the great importance of being a definite vertex in a social network representation graph; even more if that exact vertex can be combined with some peculiar pieces of information. Previously k-anonymity (Machanavajjhala et al., 2006) and l-diversity (Xiao and Tao, 2006) were both good methods to anonymize data, more adequate to relational data, though. Social networks are much more complex and needed much more competent solutions. Everything is well and detailed explained by Zhou, Pei and Luk (2010). Research field related to social networks seems to put great attention on the ethical problems that might arise. As pointed out by Zwitter (2014):
Many ethical research codes do not yet consider the non-privacy- related ethical effect (see, for example, BD&S’ own state- ment ‘‘preserving the integrity and privacy of subjects participating in research’’). Research findings that reveal uncomfortable information about groups will become the next hot topic in research ethics, e.g. researchers who use Twitter are able to tell uncomfortable truths about specific groups of people, potentially with negative effects on the researched group.1 Another problem is the ‘‘informed consent’’: despite the data being already public, no one really

28
considers suddenly being the subject of research in Twitter or Facebook studies. However, in order to represent and analyze pertinent social phenomena, some researchers collect data from social media without considering that the lack of informed consent would in any other form of research (think of psychological or medical research) constitute a major breach of research ethics.
These are parts of the whole debate that is raging, but it clarifies why Twitter dedicates two entire and detailed web-pages also for the creation of the application. “Developer Agreement” and “Developer Policy” are the names that a developer must encounter and read carefully before doing the research and understanding which type of API is more compliant to his necessity. “Restrictions on Use of Licensed Materials” is pertinent with what have been discussed antecedently; as a part of the agreement, Twitter clearly state which are considered the relevant limitations extracting data. Certainly to be noticed are the “Rate limits” and the “Geographic Data”, which will be reported below. The notable attention of the organization on these relevant topic is underlined by possibility of being monitored and blocked if something exceeds the limits imposed to developers.
Rate Limits. You will not attempt to exceed or circumvent limitations on access, calls and use of the Twitter API (“Rate Limits”), or otherwise use the Twitter API in a manner that exceeds reasonable request volume, constitutes excessive or abusive usage, or otherwise fails to comply or is inconsistent with any part of this Agreement. If you exceed or Twitter reasonably believes that you have attempted to circumvent Rate Limits, controls to limit use of the Twitter APIs or the terms and conditions of this Agreement, then your ability to use the Licensed Materials may be temporarily suspended or permanently blocked. Twitter may monitor your use of the Twitter API to improve the Twitter Service and to ensure your compliance with this Agreement.
Geographic Data. Your license to use Content in this Agreement does not allow you to (and you will not allow others to) aggregate, cache, or store location data and other geographic information contained in the Content, except in conjunction with a Tweet to which it is attached. Your license only allows you to use such location data and geographic information to identify the location tagged by the Tweet. Any use of location data or geographic information on a standalone basis or beyond the license granted herein is a breach of this Agreement.3
At the end of the process, a developer should agree with terms of agreements, which, by the way, it is the only way to proceed.
3 Twitter Inc. (2015). Dev.twitter.com. Developer Agreement URL https://dev.twitter.com/overview/terms/agreement

29
It can be seen or thought as simple bureaucracy but, as previously explained, it is surely something more and of course something that a researcher should always recognize as a priority.
However now the authentication procedure is completed and it is possible to continue; the next step will be concerning on actually finding the right data which will fit best for the research project.
3.5 Getting Twitter data
Finally obtained the right to access to Twitter data, it is necessary to understand which, among the several possibilities, is the best option for the purpose. The idea was to find right data in order to start an analysis which could lead to interesting results and insights, which later would be inferred in a different software of agent-based simulation.
Nevertheless, obtaining the right data in the form of “tweets” is not always easy, in fact, Twitter itself makes much of its fortune by information collected in public “tweets”. Therefore, it is an extremely hard task because no public dataset is available freely. However, it is possible but it requires considerable effort and several attempts in order to get the right one.
The first part of the analysis will be managed using R, which is a data analysis software used mainly by statisticians and analysts who need statistical analysis power, data visualization and, in some cases, predictive modelling. It also is a programming language interactive and object-oriented but most importantly is an open-source project; thus not only download and use is completely free but users are able to create different packages in order to face precise difficulties. It increases the power of the software, which effectively rely heavily on its community; founded in 1993 by Ross Ihaka and Robert Gentleman at the University of Auckland, then implemented firstly by an exiguous number of statisticians and computer scientists, and secondly by thousands of others, taking advantage of the network effect. Now the community counts millions of active users worldwide.
3.5.1 R software
After all the considerations, R seemed to be the right “place” to start. Indeed, it is possible to access to Twitter data directly from R, few lines of codes

30
were needed in order to complete the task; these are related to the authentication process previously held.
Figure 3: Code for the Authentication procedure
As it is possible to notice different packages like devtools, rjson, bit64, httr are required to the purpose. However, the most relevant and peculiar package used here is twitterR created by Jeff Gentry. Few lines of the author will help to understand the nature of the package:
Twitter is a popular service that allows users to broadcast short messages (’tweets’) for others to read. Over the years this has become a valuable tool not just for standard social media purposes but also for data mining experiments such as sentiment analysis. The twitteR package is intended to provide access to the Twitter API within R, allowing users to grab interesting subsets of Twitter data for their analyses. Gentry (2014)
The quote upward seems to recall exactly the necessary steps, needed to get data as previously mentioned; the problem of access through API is not anymore a problem.
The function setup_twitter_oauth allows to get authenticated inside R, using personal api_key, api_secret, access_token,
access_token_secret.
31
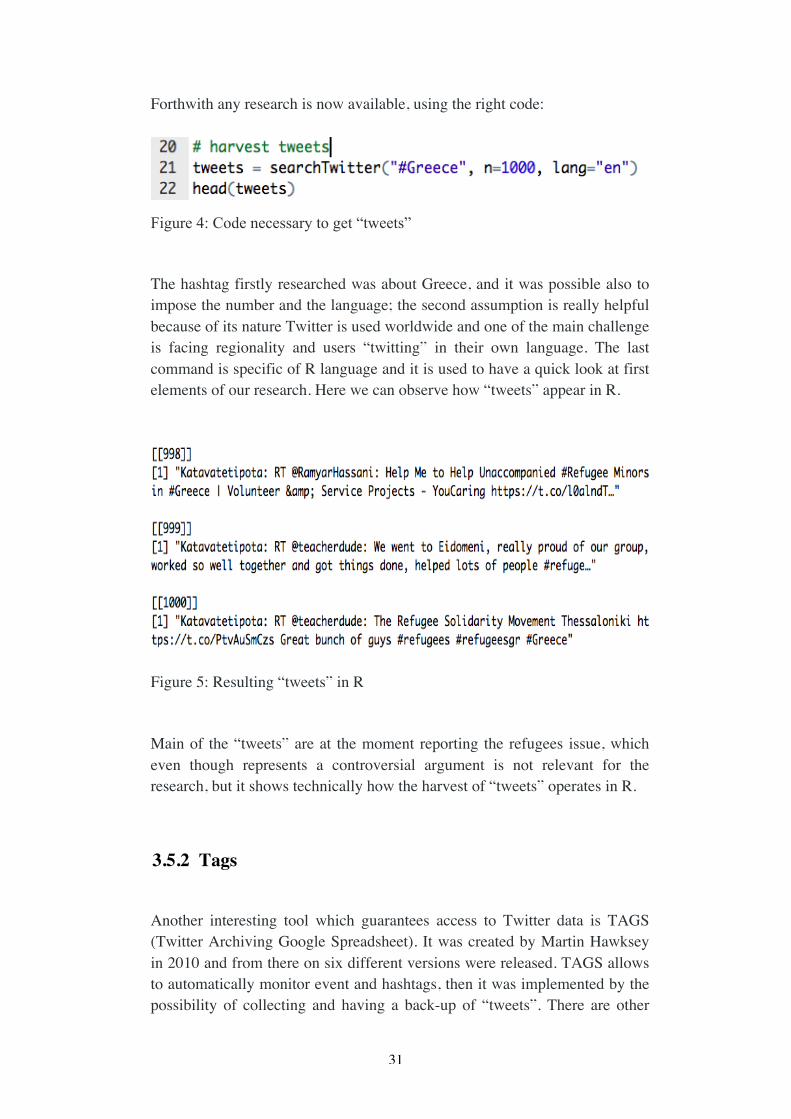
Forthwith any research is now available, using the right code:
Figure 4: Code necessary to get “tweets”
The hashtag firstly researched was about Greece, and it was possible also to impose the number and the language; the second assumption is really helpful because of its nature Twitter is used worldwide and one of the main challenge is facing regionality and users “twitting” in their own language. The last command is specific of R language and it is used to have a quick look at first elements of our research. Here we can observe how “tweets” appear in R.
Figure 5: Resulting “tweets” in R
Main of the “tweets” are at the moment reporting the refugees issue, which even though represents a controversial argument is not relevant for the research, but it shows technically how the harvest of “tweets” operates in R.
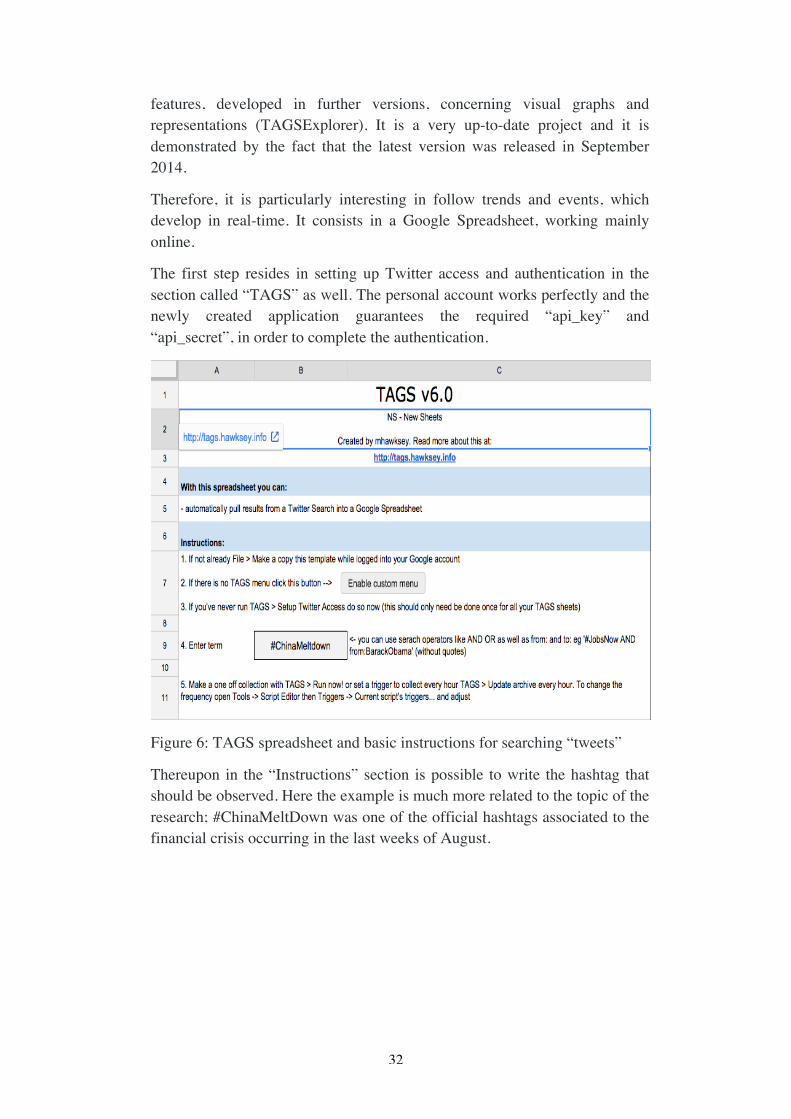
3.5.2 Tags
Another interesting tool which guarantees access to Twitter data is TAGS (Twitter Archiving Google Spreadsheet). It was created by Martin Hawksey in 2010 and from there on six different versions were released. TAGS allows to automatically monitor event and hashtags, then it was implemented by the possibility of collecting and having a back-up of “tweets”. There are other
32
features, developed in further versions, concerning visual graphs and representations (TAGSExplorer). It is a very up-to-date project and it is demonstrated by the fact that the latest version was released in September 2014.
Therefore, it is particularly interesting in follow trends and events, which develop in real-time. It consists in a Google Spreadsheet, working mainly online.
The first step resides in setting up Twitter access and authentication in the section called “TAGS” as well. The personal account works perfectly and the newly created application guarantees the required “api_key” and “api_secret”, in order to complete the authentication.
Figure 6: TAGS spreadsheet and basic instructions for searching “tweets”
Thereupon in the “Instructions” section is possible to write the hashtag that should be observed. Here the example is much more related to the topic of the research; #ChinaMeltDown was one of the official hashtags associated to the financial crisis occurring in the last weeks of August.
33
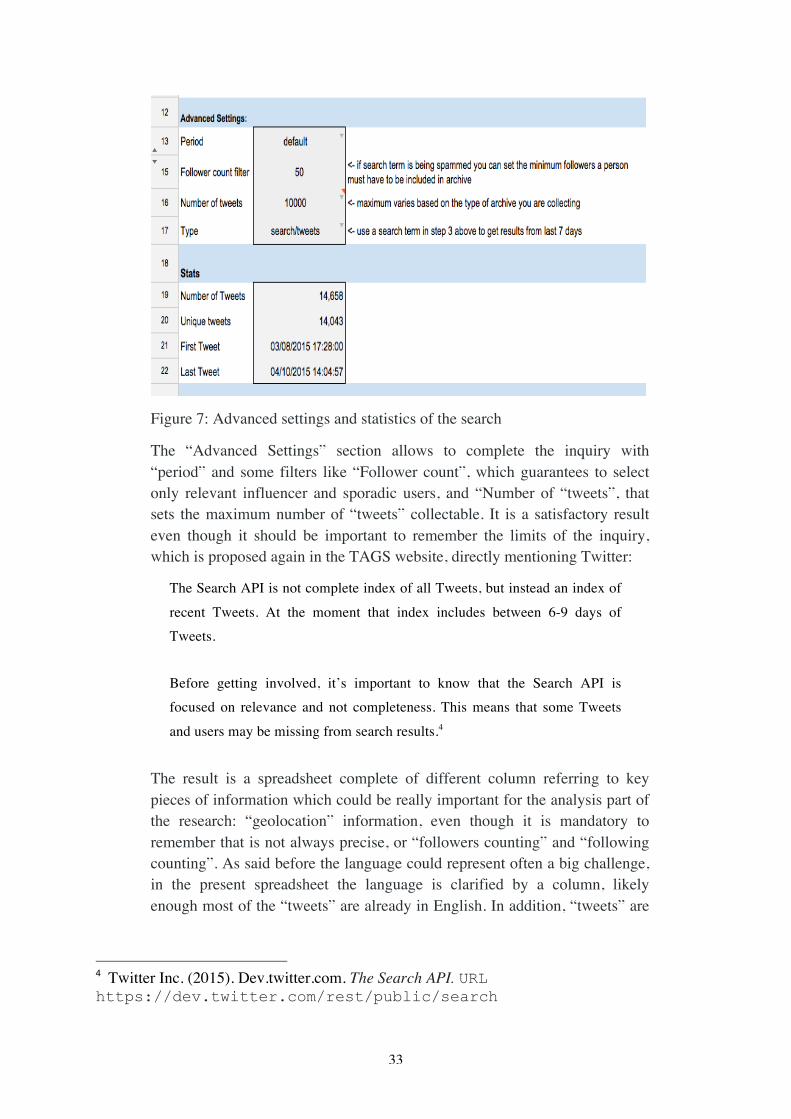
Figure 7: Advanced settings and statistics of the search
The “Advanced Settings” section allows to complete the inquiry with “period” and some filters like “Follower count”, which guarantees to select only relevant influencer and sporadic users, and “Number of “tweets”, that sets the maximum number of “tweets” collectable. It is a satisfactory result even though it should be important to remember the limits of the inquiry, which is proposed again in the TAGS website, directly mentioning Twitter:
The Search API is not complete index of all Tweets, but instead an index of recent Tweets. At the moment that index includes between 6-9 days of Tweets.
Before getting involved, it’s important to know that the Search API is focused on relevance and not completeness. This means that some Tweets and users may be missing from search results.4
The result is a spreadsheet complete of different column referring to key pieces of information which could be really important for the analysis part of the research: “geolocation” information, even though it is mandatory to remember that is not always precise, or “followers counting” and “following counting”. As said before the language could represent often a big challenge, in the present spreadsheet the language is clarified by a column, likely enough most of the “tweets” are already in English. In addition, “tweets” are
4 Twitter Inc. (2015). Dev.twitter.com. The Search API. URL https://dev.twitter.com/rest/public/search
34
never missing and presenting also “retweet” information; also personal information like IDs, profile photographs and usernames are presented.
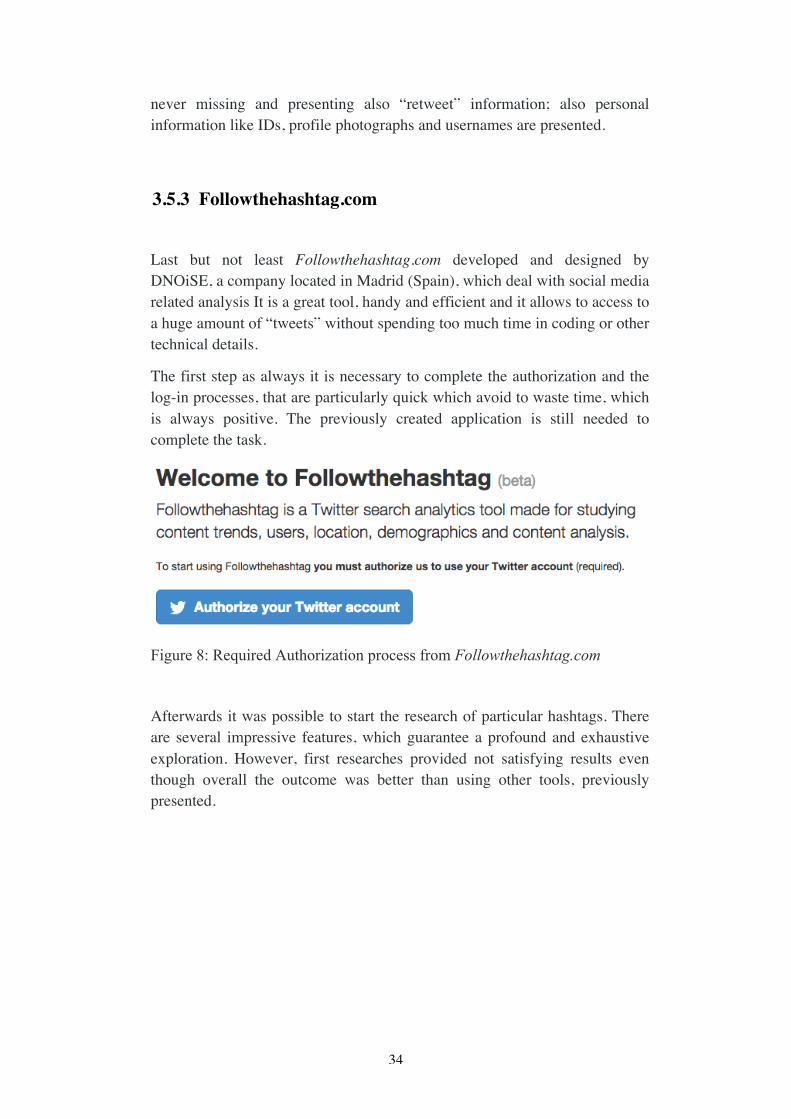
3.5.3 Followthehashtag.com
Last but not least Followthehashtag.com developed and designed by DNOiSE, a company located in Madrid (Spain), which deal with social media related analysis It is a great tool, handy and efficient and it allows to access to a huge amount of “tweets” without spending too much time in coding or other technical details.
The first step as always it is necessary to complete the authorization and the log-in processes, that are particularly quick which avoid to waste time, which is always positive. The previously created application is still needed to complete the task.
Figure 8: Required Authorization process from Followthehashtag.com
Afterwards it was possible to start the research of particular hashtags. There are several impressive features, which guarantee a profound and exhaustive exploration. However, first researches provided not satisfying results even though overall the outcome was better than using other tools, previously presented.

35
Figure 9: #IranDeal overview
Easy to be noticed, the first inquiry was about the #IranDeal hashtag. The negotiations between U.S. and Iranian delegates have been a huge trend during most of the summer; negotiators finally reached an historic accord, which in return for no more oil and financial sanctions imposed a limit to Iranian’s nuclear ability to treat radioactive materials like uranium and plutonium, which represent basic elements to create atomic bombs. Every traditional media, like newspapers and news agencies spent most of their energy to face this huge topic, therefore also on Twitter became easily and quickly the most relevant trend. Even though its important was certain, the research did not produce a great volume of “tweets”, as was predictable. 1500 “tweets” is not a disappointing outcome but did not cover the immense flow of information related to the trend.
Nevertheless, first features of Followthehashtag were presented: “Frequency”, “Total impressions” and “Contributors” are just a glimpse of what the website can provide in terms of analysis. “Retweets”, replies and images represent the basic statistics which guarantee an immediately clear overview of the trend.
Graphical visualizations can be considered the most relevant and meaningful features that the website provides; among all graphs about the reach, number of “tweets” and geo-location:

36
Figure 10: “Reach/Tweets” chart
The “Reach/Tweets” chart shows the strength of the flow divided for single day; displaying in which day the hashtag produce the higher volume of information. Not surprisingly it can be recognized an upward trend during the days in which the event actually occurred and downward trend as the time passes. In order to get a superior analysis, the filter can be set to hours or even seconds.
Figure 11: “Geo-Location” map
The “Geo-Location” map extends even more the analysis. It is now possible to understand from which countries and/ or cities the most of the “tweets” are

37
posted. Necessary to remember that it is by definition an imperfect measure because thousands of users worldwide did not use geo-localization application of their smartphones, producing a lot of missing values. Luckily enough the majority of smartphones users use the geo-location, at least the partial location, which means that provide an outcome correct in a certain range of kilometers. The graphs are editable and can be restricted in order to show only a specific region of the world (North America, Europe or Asia for example).
Figure 12: “Gender” graph
The “Gender” graph displays the proportion of male and female users. As can be observed, in the two proposed charts, which are obtained from two different hashtags, the result can be completely distinctive; the first is #IranDeal whereas the second is #FashionWeek, apparently there is more female participation in the second event. The website admits that not always the gender information is present, therefore data are mixed with an algorithm.
These features give an overall view of the above-mentioned trend and will be incredibly relevant in the second part of the research, becoming crucial in order to have a satisfactory inference. It is possible to understand how the flow of “tweets” evolves over time, observing peaks, overall trend and from where information comes. Other characteristics are available to discover influence measures, such as “top tweets”, “top influencers” or “wordcloud”, which gives a graphical representation of which words have been used the most; therefore, there is even more on the website but for the purpose of the research previously presented features could be enough.
The problem was to understand which of all possible hashtags could provide a satisfactory result in terms of volume and quality. Therefore, several attempts have been made and, in the end, some of them represented exactly what was necessary for the purpose.
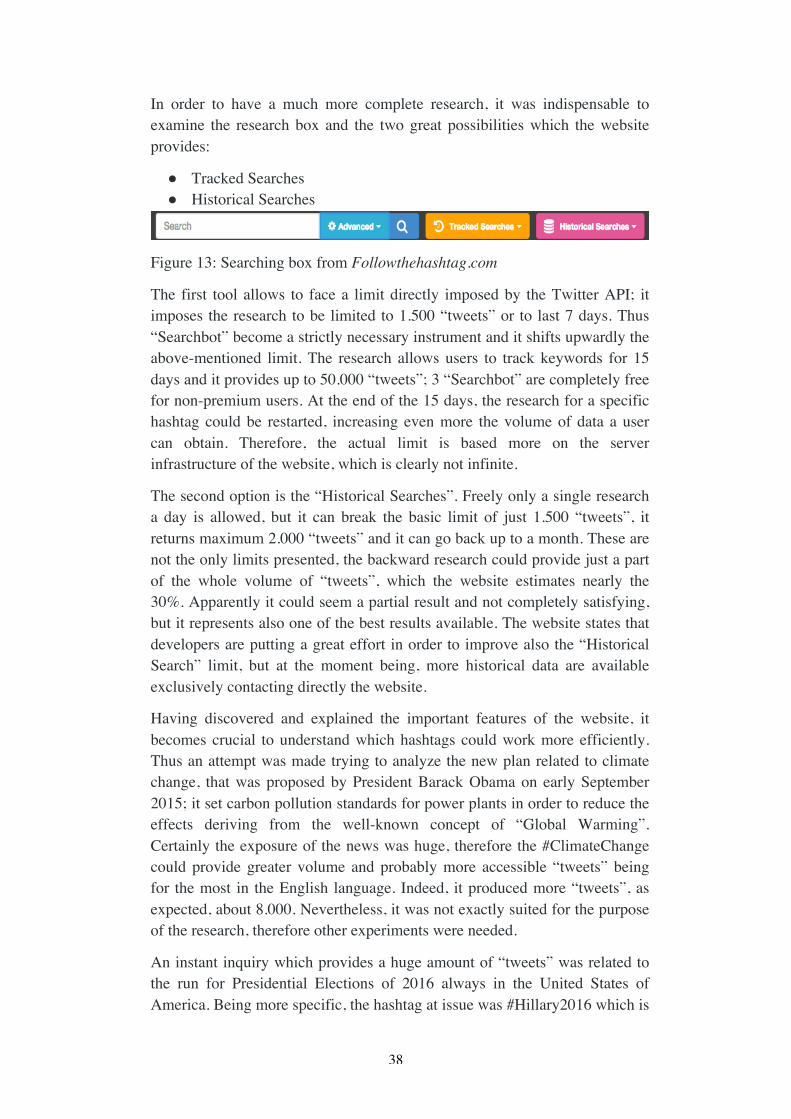
38
In order to have a much more complete research, it was indispensable to examine the research box and the two great possibilities which the website provides:
● Tracked Searches ● Historical Searches
Figure 13: Searching box from Followthehashtag.com
The first tool allows to face a limit directly imposed by the Twitter API; it imposes the research to be limited to 1.500 “tweets” or to last 7 days. Thus “Searchbot” become a strictly necessary instrument and it shifts upwardly the above-mentioned limit. The research allows users to track keywords for 15 days and it provides up to 50.000 “tweets”; 3 “Searchbot” are completely free for non-premium users. At the end of the 15 days, the research for a specific hashtag could be restarted, increasing even more the volume of data a user can obtain. Therefore, the actual limit is based more on the server infrastructure of the website, which is clearly not infinite.
The second option is the “Historical Searches”. Freely only a single research a day is allowed, but it can break the basic limit of just 1.500 “tweets”, it returns maximum 2.000 “tweets” and it can go back up to a month. These are not the only limits presented, the backward research could provide just a part of the whole volume of “tweets”, which the website estimates nearly the 30%. Apparently it could seem a partial result and not completely satisfying, but it represents also one of the best results available. The website states that developers are putting a great effort in order to improve also the “Historical Search” limit, but at the moment being, more historical data are available exclusively contacting directly the website.
Having discovered and explained the important features of the website, it becomes crucial to understand which hashtags could work more efficiently. Thus an attempt was made trying to analyze the new plan related to climate change, that was proposed by President Barack Obama on early September 2015; it set carbon pollution standards for power plants in order to reduce the effects deriving from the well-known concept of “Global Warming”. Certainly the exposure of the news was huge, therefore the #ClimateChange could provide greater volume and probably more accessible “tweets” being for the most in the English language. Indeed, it produced more “tweets”, as expected, about 8.000. Nevertheless, it was not exactly suited for the purpose of the research, therefore other experiments were needed.
An instant inquiry which provides a huge amount of “tweets” was related to the run for Presidential Elections of 2016 always in the United States of America. Being more specific, the hashtag at issue was #Hillary2016 which is

39
at the moment still the official one for the campaign of the ex-Secretary of State Hillary Clinton, who is running for President as a candidate of the Democratic Party. In this specific case the use of the social network is thought as crucial: recent analysis have found that the success obtained by President Obama was in relevant measure founded on the influence and the presence on social networks, especially Twitter like many studies have demonstrated (Cogburn and Espinoza-Vasquez, 2011). The dataset collects “tweets” from the 16th of April to 19th of August.
Figure 14: #Hillary2016 overview
Even though the total volume of “tweets” and contributors is impressive, it should be considered only as an attempt in order to understand which hashtag could obtain the most. Other experiments were made in this direction, but they are too distant from the objective of the research, therefore they are just worth of mention: hashtags like #FashionWeek and #RemeberingRajiv, were trending in the period of August and September 2015 and produced relevant volume of data but not interesting in relation with the research.
Finally, a great opportunity arises at the end of August 2015. The voice of difficulties of the Chinese stock market have been circulated for long during the summer; many economists have always considered it like a bubble and warning signs suggested that sooner or later it would have reached its breaking point. Some of the more important news agencies during the summer reported that Shanghai market was swimming in troubled water, therefore also a large number of “tweets” started to appear. Therefore, remembering one of the specific features of Followthehashtag, it was possible to track the #China hashtag; in fact, at that moment there was not an official hashtag and #China could represent the best approximation in order to get the information related to the Shanghai financial situation. The “Tracked Search” last 15 days, but luckily for the research after few days, the Chinese economy slumped, provoking thousands of “tweets”.

40
Figure 15: Statistics of #China hashtag
Figure 16: “Activity” chart
The peak in this graph is placed around the 22nd of August and the days right after. The majority is centered in those dates and the quick disappearance is certainly a typical characteristic of social networks and more generally of online information.
A counter-argument that can be moved to this dataset is surely of being biased because the hashtag is too general and not specific. With the hashtag #China it could be plausible that some “tweets” were not related to the financial crisis, but they could be “tweets” of tourists in Shanghai spending their summer holidays or other related to the precarious relation between the Chinese central government and Hong Kong, just give some examples. Even if the critic is plausible the timing of the research should suggest that most of the “tweets” were related to the explosion of news caused by a financial slump.
In order to face the critique Followthehashtag came to help once again; through the “Historical Search” it was possible to refine the research using the now official hashtag: #ChinaMeltDown. The outcome produced a much lower volume of “tweets” and this could be the prove that the counter-argument was correct; nevertheless, it could be also related to just the technical limits of this kind of research but for the purpose of this work it provided a satisfying number of “tweets”.

41
Figure 17: Statistics of #ChinaMeltDown hashtag
In the “Content” section, another proof is provided. The analysis of the website, among other statistics and graphs, offers a list of words and hashtags most used; it clearly suggests that the topic of these “tweets” is entirely dedicated to the Shanghai market, and can be observed in the following figure.
Figure 18: List of top words and hashtags
Just for completeness, even though the current dataset is more accurate and the trade-off between quantity and quality is acceptable, is possible to notice that the hashtag #China is highly correlated with #ChinaMeltDown. However, with the official hashtag a copious amount of spam in the form of “tweets” have been correctly removed.
Figure 19: Exporting buttons from Followthehashtag.com
Ultimately, the website offers the possibility of downloading the underlying dataset in .xls format, which guarantees the opportunity of doing further analyses. In addition, the whole bunch of statistics and graphs, which are much more than the few here presented, are accurately collected in a downloadable .pdf file; it is graphically interesting and attractive and summarize efficiently the whole analysis.
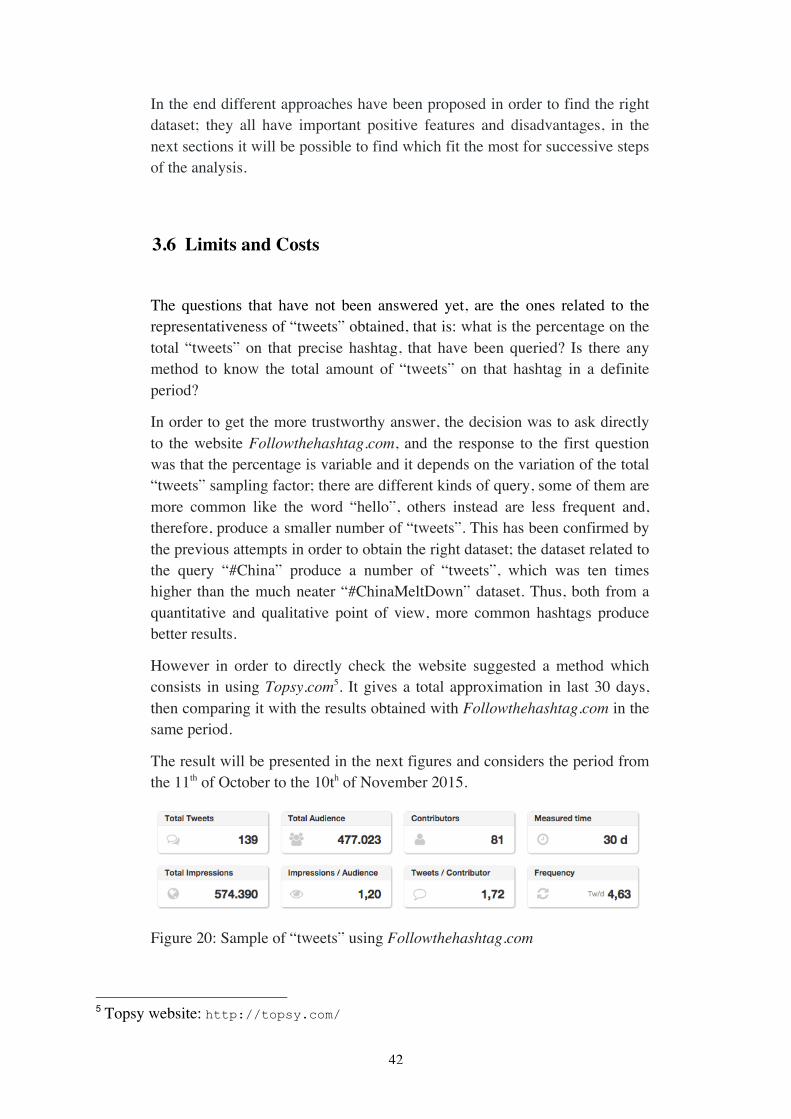
42
In the end different approaches have been proposed in order to find the right dataset; they all have important positive features and disadvantages, in the next sections it will be possible to find which fit the most for successive steps of the analysis.
3.6 Limits and Costs
The questions that have not been answered yet, are the ones related to the representativeness of “tweets” obtained, that is: what is the percentage on the total “tweets” on that precise hashtag, that have been queried? Is there any method to know the total amount of “tweets” on that hashtag in a definite period?
In order to get the more trustworthy answer, the decision was to ask directly to the website Followthehashtag.com, and the response to the first question was that the percentage is variable and it depends on the variation of the total “tweets” sampling factor; there are different kinds of query, some of them are more common like the word “hello”, others instead are less frequent and, therefore, produce a smaller number of “tweets”. This has been confirmed by the previous attempts in order to obtain the right dataset; the dataset related to the query “#China” produce a number of “tweets”, which was ten times higher than the much neater “#ChinaMeltDown” dataset. Thus, both from a quantitative and qualitative point of view, more common hashtags produce better results.
However in order to directly check the website suggested a method which consists in using Topsy.com5. It gives a total approximation in last 30 days, then comparing it with the results obtained with Followthehashtag.com in the same period.
The result will be presented in the next figures and considers the period from the 11th of October to the 10th of November 2015.
Figure 20: Sample of “tweets” using Followthehashtag.com
5 Topsy website: http://topsy.com/

43
Figure 21: Comparison between Topsy.com and Followthehashtag.com samples
Through the method suggested by the website is now possible to compute the approximation for the approximation of the sampling factor; Topsy.com gave 172 “tweets” while Followthehashtag.com 139, therefore the sampling factor produced a representativeness of nearly 81%, which would be incredibly satisfactory.
Although the outstanding result of the approximated sampling factor, it is Followthehashtag.com itself which clarify on the average the possibility of their query and the difference between data which can be obtained for free or by payment.

44
Figure 22: “Free historical data” versus “Paid historical data”
Thus, it is possible to get a better and bigger dataset, indexing 100% of “tweets” related to a search, through a payment which consists in 36€ for up to 20000 “tweets” per report, and 72€ for up to 50000 “tweets”. Nowadays there is no possibility of being a “premium” user, but it is necessary to contact the website, explaining the necessity and complete a payment using PayPal.

45
4 Sentiment Analysis
Knowing what people think has always been a crucial question for human beings and during the last few years with social networks it is easier to find an answer to this question. The amount of available information has increased deeply, millions of “tweets”, “posts” and reviews appear daily thanks to the ease of access that new websites provide; users talk about their personal life and share their opinions on different topics. The shift from traditional blog and websites to the so-called microblogging is noticeable easily. That is the predictable reason why much more companies and organizations are interested in this kind of information; people do not talk only about what they are doing during the weekend but also share preferences for products and political and religious views. Such data could bring an incredible push to different fields of research from marketing to social studies. Opinion mining and sentiment analysis are two concepts which are gaining much more relevance in order to extract all that inner potential which is hidden behind those posts. Nevertheless, a lot of work has to be done yet, much of the researches available have investigated mostly online reviews and news article, which is a completely different world from the microblogging area. The formal language versus the informal language of social networks is the main difference and it creates new challenges for researchers, but it is not the only one: as an example, Twitter which has a very restrictive constraint of 140 characters as the maximum length of the message. The length of the post increases the difficulties of extracting precious insights on the users’ behavior and belief. Being a phenomenon which is recent and always evolving, it has been less studied, but here step forward has been made lastly.
This work will use Twitter data as the basis for the analysis, therefore, it should be important to stress again the reason why microblogging, and Twitter itself, should be an interesting starting point. This is highlighted in a very simple and sharp way by Pak and Paroubek (2010):
Microblogging platforms are used by different people to express their opinion about different topics, thus it is a valuable source of people’s opinions. Twitter contains an enormous number of text posts and it grows every day. The collected corpus can be arbitrarily large. Twitter’s audience varies from regular users to celebrities, company representatives, politicians, and even country presidents. Therefore, it is possible to collect text posts of users from different social and interest groups.

46
Twitter’s audience is represented by users from many countries. Although users from U.S. are prevailing, it is possible to collect data in different languages.
Indeed, to have a much more detailed and profound view on the sentiment analysis and in order to understand strength and weakness, it is necessary to observe some of the works, which have been made during the years.
4.1 Related works The rise of sentiment analysis should be identified chronologically in the first years of the XXI century, and beyond the increased interest in the field due to the increment of the use of social networks and in general of the web, it can be attributed to new technical and technological possibilities. Concepts such as Machine Learning (ML), Natural Language Processing (NLP) and Information Retrieval (IR) are fundamental instruments in order to reach the objective of extracting precious pieces of information; these are based on interesting algorithms which need of an incredible deluge of data to be trained on and thus to bring optimum results and reach their full potential; therefore it represents another unique and relevant possibility: the amount of datasets which are now available is completely different from some years ago. It is necessary to spend few lines in order to be more specific in explaining the relative new concept of sentiment analysis, and to do so properly it is indispensable to underline the difference with the previous fact-based textual analysis: it is clearly explained by Pang and Lee (2008):
Traditionally, text categorization seeks to classify documents by topic. There can be many possible categories, the definitions of which might be user- and application- dependent; and for a given task, we might be dealing with as few as two classes (binary classification) or as many as thousands of classes (e.g., classifying documents with respect to a complex taxonomy). In contrast, with sentiment classification [...], we often have relatively few classes (e.g., “positive” or “3 stars”) that generalize across many domains and users. In addition, while the different classes in topic-based categorization can be completely unrelated, the sentiment labels that are widely considered in previous work typically represent opposing (if the task is binary classification) or ordinal/numerical categories (if classification is according to a multi-point scale). In fact, the regression-like nature of strength of feeling, degree of positivity, and so on seems rather unique to sentiment categorization (although one could argue that the same phenomenon exists with respect to topic-based relevance).

47
Extract properly the opinion which lies under each phrase could be more challenging than what people might think. There are several difficulties which a researcher must solve to complete the task. The first example which always come to mind is surely the sentiment polarity text-classification. It could apparently seem a simple task, identify two categories, positive and negative, and then determine if a text belong to the first or the second category. Thinking at simple example, it seems really simple but on the other hand it is also very easy to find some particular phrases, which are articulated in such way that is not clear even for a human being to determine whether is positive or negative. The basic classification is made through the use of a set of keywords, dividing them between positive and negative words. It is less trivial than one could initially think. Like other method it is necessary to think at the results in terms of accuracy, then it depends on how the list is created; there are certain words which are clearly negative or express negation and the opposite is true for positive, but there are also words which express a positive concept or a negative one depending on the topic and the structure of the text. Considered that the classification is made using Machine Learning algorithms, some operations which are trivial for a person become extremely complicated for computers and softwares: the structure of the phrase, double negations and other, therefore having the right dataset on which train the algorithm, could help profoundly the analysis. The problem therefore worsens if it is not anymore a matter of negative or positive or if it is necessary to find the opinion, which often is not explicit but is more hidden in the text; this concept of context-sensitivity is well-explained in a quote in work by Pang and Lee (2008):
In general, sentiment and subjectivity are quite context-sensitive, and, at a coarser granularity, quite domain dependent (in spite of the fact that the general notion of positive and negative opinions is fairly consistent across different domains). Note that although domain dependency is in part a consequence of changes in vocabulary, even the exact same expression can indicate different sentiment in different domains. For example, “go read the book” most likely indicates positive sentiment for book reviews, but negative sentiment for movie reviews.
There is a huge list of reviews and, at a lower level, of phrases which are misleading for the polarity of sentiments; a long review full of positive words can express a negative opinion just by the last sentence. Furthermore, negative words could compose a sentence which express a positive sentiment depending on the context or the field. Nevertheless, the sentiment polarity classification or simply polarity classification represents the field which has produced more results and more

48
studies, that is the reason why even though there are difficulties and weakness is the more popular. There are further kind of analysis, for example, related categories, which try to find pros and cons in a specific category or product, or the attempt to find the degree of positivity, subsetting even more this extreme of polarity. Other categorizations are feasible and depends on the topic: politically it can be interesting being able to distinguish between different views strictly related with the political orientation; a classification which could divide the sample into liberals and conservatives could provide a better insight on the structure of the electorate. In this direction goes also the subsets composed by different feelings, not only positive and negative but many other levels of sensibility: happiness, sadness, fear, surprise and anger for example. But probably another huge challenge is the one which try to cope with subjectivity and objectivity. Facts versus opinion is a topic which could help in order to identify the shade of neutral texts; a relevant work has been made by Yu and Hatzivassiloglou (2003), which have used a Bayesian classifier in order to prove whether a portion of text contains facts or opinion, which in their work is supposed to be the first step, that secondly could be divided into polarity classification. Treating subjectivity and sentiment separately could bring positive results as in many studies has been demonstrated. Going deeper into the technicality of the process is essential in order to get much more awareness of the difficulties that Natural Language Processing usually provides. Two of the technical concepts that are necessary to bear in mind are n-grams and part-of-speech (POS). N-grams is often referred as a probabilistic model which try to predict the next word from the previous words and the computation of the next word is strictly related with computing the probability of a sequence of words. But basically is a sequence of n elements of a text: the elements can be represented by syllables, letters or words, therefore it is not constant; the most used are “unigrams”, “bigrams” and “trigrams” depending on the size. A lot of scholars in literature is trying to find which outperforms the others, but it is not a solved discussion; even concerning polarity classification is not clear yet which is the better procedure. Part-of-speech instead are adjectives, verbs, nouns and adverbs. Great emphasis has been put on adjectives mainly as stated always by Pang and Lee (2008); the presence of adjectives has a relevant correlation with sentence subjectivity, therefore becoming a valuable indicator of sentiment and precious instrument in the classification part. Then, the discussion shifts from the use of isolated adjectives to the use of other part-of-speech like nouns and verbs. This approach has led also to optimal results, improving accuracy and correlation. Thus, the use of some words or adverbs could lead to a better performance in finding not only the

49
polarity of sentiment but more important objectiveness versus subjectiveness; in fact seems reasonable that the use of the third singular person in a sentence bring a more neutral and objective sense, meanwhile others characterize frequently subjective sentences. Also, the use of specific adverbs often leads to an extreme of the polarity or to the other. In order to understand more it is necessary to consider a deeper linguistic analysis and concepts like syntax, negation and frequency of words become relevant. The position in the sentence of specific words and syntactic patterns improve the analysis and bring better results in terms of subjectivity detection. Negation instead is one of the biggest challenges because a single token in a sentence could move from positivity to negativity, therefore a great attention has been put in order to avoid misleading outcomes. Consider in addition the presence of positive terms and a negation, without proper adjustments it could mislead the analysis. Lastly, two well-known rhetorical devices like irony and sarcasm can be thought as negations and most of the time are expressed in a very subtle such that it is very difficult to detect.

50
4.2 Sentiment Analysis on #ChinaMeltDown
Having now a much more profound knowledge of the sentiment analysis and how it could be handled, it is time to apply the method to the “tweets” collected under the hashtag #ChinaMeltDown. The idea is clearly to get insights which allow to own a greater awareness, which is necessary in order to complete the following steps; the analysis can be separated in different phases: first it will be presented the method and the software used, then there will be two kind of sentiment analysis even though, it is possible to state that the kinds of analysis proposed among the several previously proposed is based on the polarity classification. The exploration of the polarity of the “tweets” in this work was made through the use of R, the statistical open source software, in order to test the possibility of its application also in this field of the data analysis; in fact even though often other specific tools, softwares or programming language are preferred in the literature of sentiment analysis, the choice of using has its rationality: first of all it creates a sense of continuity within the whole analysis proposed; the first attempts of getting the dataset were made through the use of the same software. Then R has been recognized as one of the principal actors in the field of data analysis thanks to its wide range of applications, therefore it seemed interesting to try to observe how and how well it operates in this specific area. It could be seen as the attempt to discover the boundary limits of the software. The first code used try to categorize the “tweets” in the simplest way, using the presence and frequency of positive and negative words in the sentences which compose the “tweet”; the lists of positive and negative keywords6 are fixed, but the interesting feature of the code is that allows to modify it and create a more appropriate list, depending more on the topic observed, here the financial market. The crucial point is represented by the function score.sentiment, which gives the sentence a score, depending on the frequency of positive or negative words. As previously noted due to the limits and issues which can arise, it is not the more accurate method of polarization but the literature and the empirical results (Pang and Lee, 2003) show that it can reach a satisfying outcome in terms of accuracy. The idea was to get the overall flow of “tweets” during the period considered and in the meantime observing how the different categories act. Beyond the polarization the score.function has the possibility of cleaning the text, which is a necessary step in order to get a proper dataset; removing “stop-
6 Inserire link per lista di parole negative e positive.
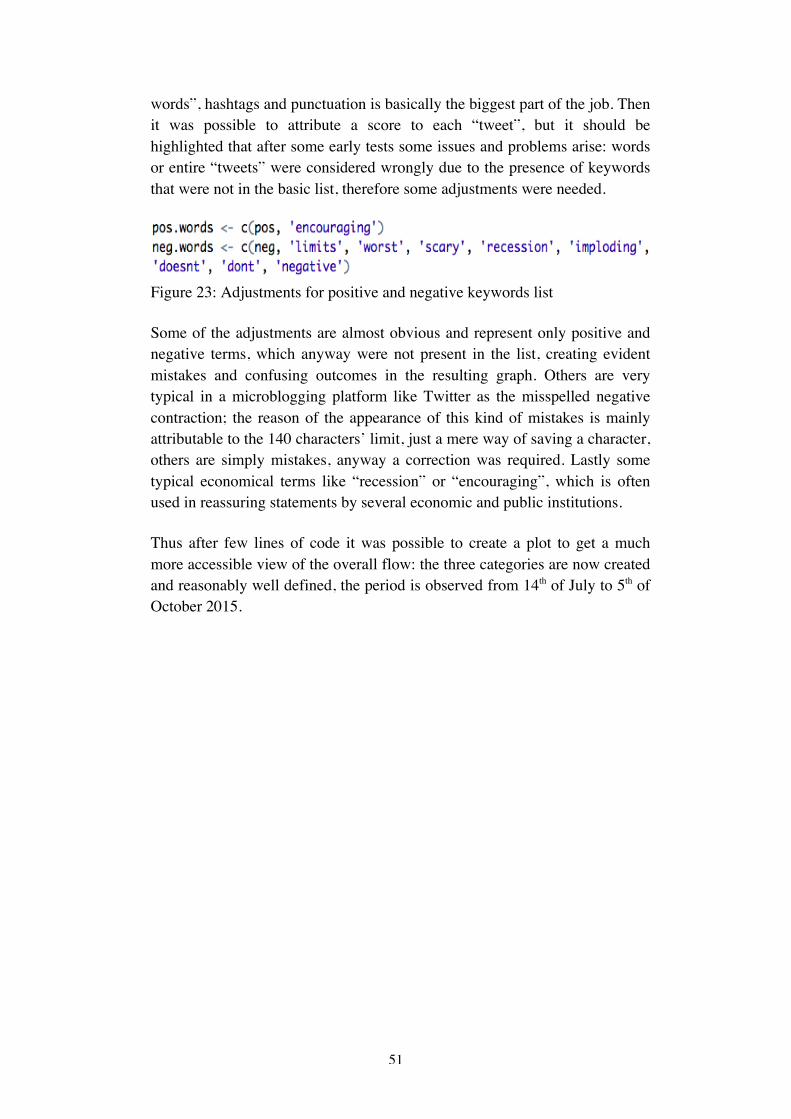
51
words”, hashtags and punctuation is basically the biggest part of the job. Then it was possible to attribute a score to each “tweet”, but it should be highlighted that after some early tests some issues and problems arise: words or entire “tweets” were considered wrongly due to the presence of keywords that were not in the basic list, therefore some adjustments were needed.
Figure 23: Adjustments for positive and negative keywords list Some of the adjustments are almost obvious and represent only positive and negative terms, which anyway were not present in the list, creating evident mistakes and confusing outcomes in the resulting graph. Others are very typical in a microblogging platform like Twitter as the misspelled negative contraction; the reason of the appearance of this kind of mistakes is mainly attributable to the 140 characters’ limit, just a mere way of saving a character, others are simply mistakes, anyway a correction was required. Lastly some typical economical terms like “recession” or “encouraging”, which is often used in reassuring statements by several economic and public institutions. Thus after few lines of code it was possible to create a plot to get a much more accessible view of the overall flow: the three categories are now created and reasonably well defined, the period is observed from 14th of July to 5th of October 2015.

52
Figure 24: Negative, Positive and Neutral “tweets” The overall trend is linear except for evident peaks mainly during the month of August, when the collapse of the Shanghai stock market occurred and the immediately previous weeks; the major peak can be found during 25-26th of August, in fact even if the deepest fall started in China and Japan on Monday 24th, it has created one of the most relevant negative effect on almost every stock market in the entire world since Lehman Brothers 2008, from the United States to Europe. The stocks fell 8.5% in Shanghai and 4.6% in Tokyo, spreading then the contagious, creating a crisis which last days. The cycle of the information started immediately but in social networks where institutions and professional journalists are not the only users, is reasonable to assume that the peak reached its maximum days after the event. An additional remark must be made on the trend of the polarized categories: being a crisis period, the number of negative “tweets” is almost everywhere higher with respect to the opposite pole, the positive ones, which is reasonable; instead the neutrals play a relevant role and it can be explained by the presence on Twitter of thousands of journalists and news agencies, which in most of the cases must maintain a neutral perspective reporting the news for ethical reason; that could be one of the reasons why the number of neutral “tweets” is so relevant, on the other hand, it could be explained by the simple method of polarity classification used, which, as repeated over and over, has its inner bias and weakness, yielding more neutral than polarized “tweets”.

53
Nevertheless, the big picture seems balanced and rational therefore could be considered an interesting starting point. Consequently, to complete the picture, it was necessary to obtain the overall trend of the Chinese stock exchange market; in order to make a good and relevant comparison it was necessary to find an aggregate index and choice bring to the Shanghai Stock Exchange Composite Index:
The Shanghai Stock Exchange Composite Index (SSECI) is a capitalization-weighted index. The index tracks the daily price performance of all A-shares and B-shares listed on the Shanghai Stock Exchange. The index was developed on December 19, 1990 with a base value of 100. Index trade volume on Q is scaled down by a factor of 1000.7
Therefore a dataset was necessary and it was easily obtained8; the period of time is clearly the same of the Twitter dataset (i.e. from the 14th of July to the 5th October 2015). Using few lines of code always on R it was possible to create a plot of the evolution of the index.
Figure 25: Shanghai Composite Index As aggregate value the closing price has been considered in plotting the SSECI; it is now possible to notice the correspondence between the deep fall
7 Bloomberg official website: http://www.bloomberg.com/quote/SHCOMP:IND 8 Yahoo index: https://www.quandl.com/data/YAHOO/INDEX_SSEC-Shanghai-Composite-Index-China
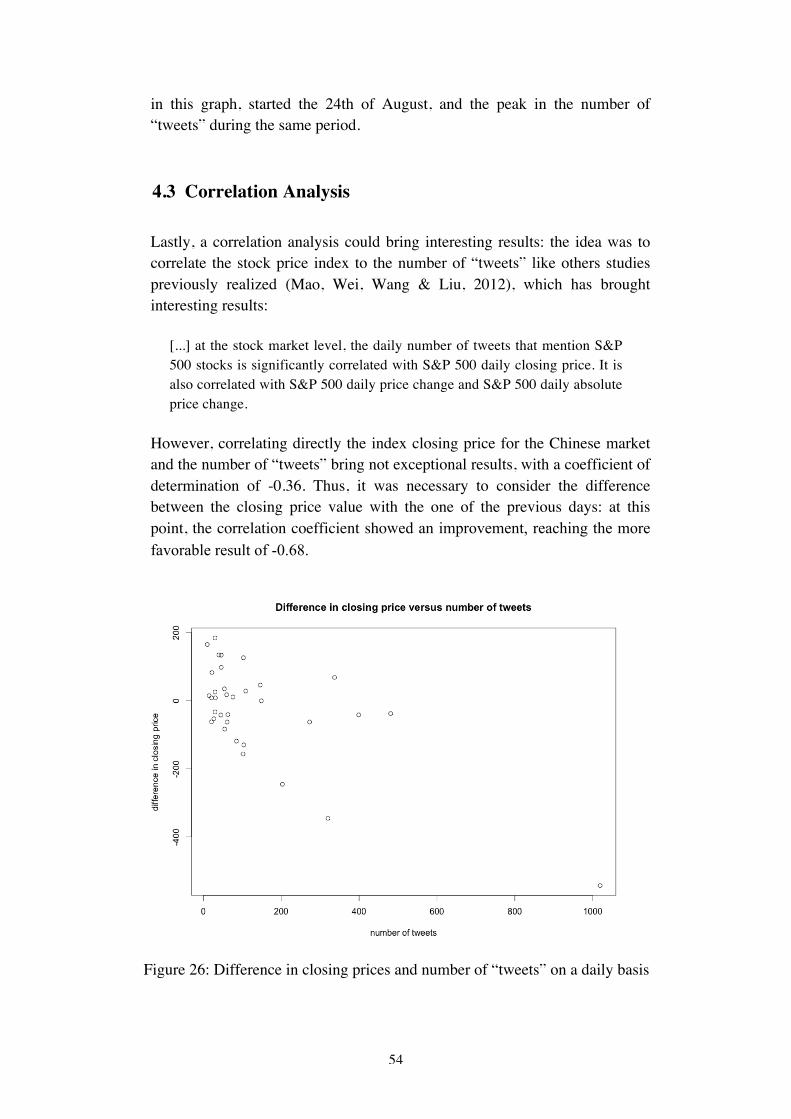
54
in this graph, started the 24th of August, and the peak in the number of “tweets” during the same period.
4.3 Correlation Analysis Lastly, a correlation analysis could bring interesting results: the idea was to correlate the stock price index to the number of “tweets” like others studies previously realized (Mao, Wei, Wang & Liu, 2012), which has brought interesting results:
[...] at the stock market level, the daily number of tweets that mention S&P 500 stocks is significantly correlated with S&P 500 daily closing price. It is also correlated with S&P 500 daily price change and S&P 500 daily absolute price change.
However, correlating directly the index closing price for the Chinese market and the number of “tweets” bring not exceptional results, with a coefficient of determination of -0.36. Thus, it was necessary to consider the difference between the closing price value with the one of the previous days: at this point, the correlation coefficient showed an improvement, reaching the more favorable result of -0.68.
Figure 26: Difference in closing prices and number of “tweets” on a daily basis

55
The graph shows how a negative difference is often associated to an important number of “tweets”, and the most extreme results seems to be reasonably (looking on the diagonal towards low-right angle of the rectangle); in fact it is probably correct to suppose that when a major fall in the aggregate Shanghai index occurs, the importance of the event will cause a huge flow of “tweets” both from professional journalists, news agencies, institutions and also normal users, demonstrating the negative relation between the two variables. An important extension of the analysis could be represented by the attempt of understanding whether also the opposite case could present interesting results; meaning that at an increase of the number of “tweets” could be associated with a more volatile index. This could be interesting in order to predict the flow of the stock market, assuming then a great influence of the related information in the social network. There have been several studies made in this direction and not strictly related to the financial market. In fact, for what concern television shows and series, Twitter provide a precious measure of the overall appeal. These studies tried to find a correlation between the volume of “tweets” with respect to television ratings. The results are significant especially for younger viewer, which clearly are more active on Twitter. Being a top influencer on the social network is highly correlated with an increase of the rating associated to the show and it provides also an accurate measure of the engagement to the program. It could be used by TV manager in order to make more proper decisions related to which show needed to be financial supported. Nevertheless, entertainment is not the only field which is interested in the flow of information coming directly from Twitter. Changing perspective, also medical services have tried to find a correlation which could suggest interesting actions and decisions. A recent study (Gesualdo et al., 2015) tried to observe data coming from Twitter related to the symptoms of allergic rhinoconjunctivitis (ARC). It could represent an implementation of actual algorithms and methods for pollen forecast, diseases surveillance and control over drug consumption.
We compared weekly Twitter trends with National Allergy Bureau weekly pollen counts derived from US stations, and found a high correlation of the sum of the total pollen counts from each stations with tweets reporting ARC symptoms (Pearson’s correlation coefficient: 0.95) and with tweets reporting antihistamine drug names (Pearson’s correlation coefficient: 0.93). Longitude and latitude of the pollen stations affected the strength of the correlation.
The results are encouraging and the field of observation is extremely widespread as suggested by these studies, which are clearly just a few of the many presents. Actually, some critics can be also moved but if the researches improved even more in quality and quantity, then it would be easier to evaluate

56
these results. Overall this is a trend which has great potential and has to be observed accurately.

57
4.4 Wordcloud In the second part of the analysis, an attempt will be made in order to discover more information on the Twitter dataset through the use of word cloud. The word cloud is a typical and popular graphical visualization of words and keywords, such as hashtags or internet links; it is communicative and allows users to get very quickly an idea of the underlying text. Therefore, it represents a brilliant way to get the first insights of the Twitter dataset. Even in this case, word clouds are created through the use of R, which shows once again its potential in the data analysis field. Thus, it is possible to examine in depth the so-called corpus analysis, which is the collection of techniques that allow to understand the frequency and the occurrence patterns of words in the text. The reason is that most of the time using Twitter data, the dataset will contain a huge number of words, therefore, an easier way to get a glimpse of the phenomenon is needed. Without going into the technicality of the code, it is necessary to annotate that once again the cleaning phase of the text represents a mandatory step; after having completed it, the first word cloud can be plotted.
Figure 27: Word cloud for the #ChinaMeltDown dataset The easily accessible word cloud is now created and then it possible to make some annotations: first of all, the structure is such that at the center of the picture are represented the more frequent words, thus is not a huge surprise
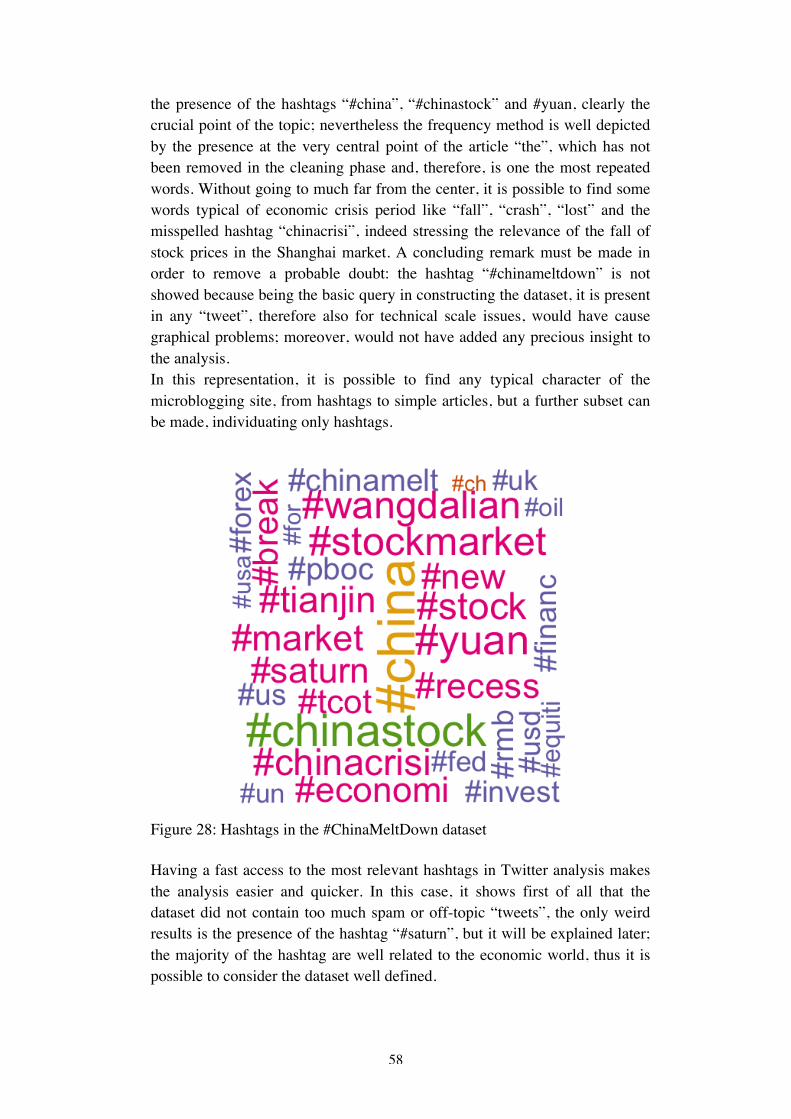
58
the presence of the hashtags “#china”, “#chinastock” and #yuan, clearly the crucial point of the topic; nevertheless the frequency method is well depicted by the presence at the very central point of the article “the”, which has not been removed in the cleaning phase and, therefore, is one the most repeated words. Without going to much far from the center, it is possible to find some words typical of economic crisis period like “fall”, “crash”, “lost” and the misspelled hashtag “chinacrisi”, indeed stressing the relevance of the fall of stock prices in the Shanghai market. A concluding remark must be made in order to remove a probable doubt: the hashtag “#chinameltdown” is not showed because being the basic query in constructing the dataset, it is present in any “tweet”, therefore also for technical scale issues, would have cause graphical problems; moreover, would not have added any precious insight to the analysis. In this representation, it is possible to find any typical character of the microblogging site, from hashtags to simple articles, but a further subset can be made, individuating only hashtags.
Figure 28: Hashtags in the #ChinaMeltDown dataset Having a fast access to the most relevant hashtags in Twitter analysis makes the analysis easier and quicker. In this case, it shows first of all that the dataset did not contain too much spam or off-topic “tweets”, the only weird results is the presence of the hashtag “#saturn”, but it will be explained later; the majority of the hashtag are well related to the economic world, thus it is possible to consider the dataset well defined.

59
Evidently it is also possible to subset even more the dataset, trying to analyze for example, the less common hashtag, but in this case, the most and less relevant ones seem to be very related, therefore, the further subset did not bring any additional insight.
Figure 29: Relative weights of principal hashtags The principal hashtags and how they are related is a crucial part and it is part of the domain of the Semantic Network Analysis: thus it possible to see the co-occurrence patterns, the edges and the structure of the network which is identified by the hashtags; it could be made through the extraction of the “backbone” of edges.
Figure 30: “Backbone” of edges What appear in Figure 30 is the presence of 7 different network within the whole dataset: the biggest and more relevant is clearly the one related with the Chinese financial crisis characterized by the presence of the previously noted principal hashtags, but other smaller agglomerates are identifiable; the hashtag “#saturn” is now linked to others among which “#ophiuchus”, and it is not related to the stock market crisis, even if some of the “tweets” seem to claim a relation between the 13th constellation of the Zodiac and the position
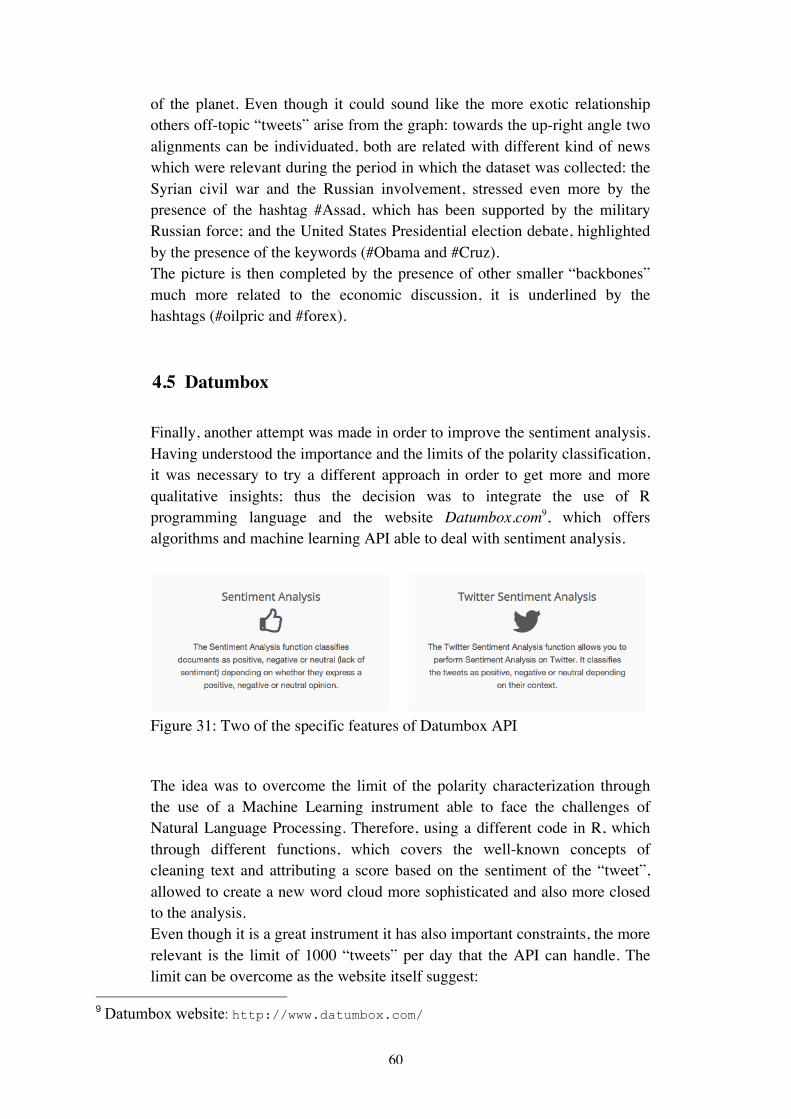
60
of the planet. Even though it could sound like the more exotic relationship others off-topic “tweets” arise from the graph: towards the up-right angle two alignments can be individuated, both are related with different kind of news which were relevant during the period in which the dataset was collected: the Syrian civil war and the Russian involvement, stressed even more by the presence of the hashtag #Assad, which has been supported by the military Russian force; and the United States Presidential election debate, highlighted by the presence of the keywords (#Obama and #Cruz). The picture is then completed by the presence of other smaller “backbones” much more related to the economic discussion, it is underlined by the hashtags (#oilpric and #forex).
4.5 Datumbox Finally, another attempt was made in order to improve the sentiment analysis. Having understood the importance and the limits of the polarity classification, it was necessary to try a different approach in order to get more and more qualitative insights; thus the decision was to integrate the use of R programming language and the website Datumbox.com9, which offers algorithms and machine learning API able to deal with sentiment analysis.
Figure 31: Two of the specific features of Datumbox API The idea was to overcome the limit of the polarity characterization through the use of a Machine Learning instrument able to face the challenges of Natural Language Processing. Therefore, using a different code in R, which through different functions, which covers the well-known concepts of cleaning text and attributing a score based on the sentiment of the “tweet”, allowed to create a new word cloud more sophisticated and also more closed to the analysis. Even though it is a great instrument it has also important constraints, the more relevant is the limit of 1000 “tweets” per day that the API can handle. The limit can be overcome as the website itself suggest:
9 Datumbox website: http://www.datumbox.com/

61
The Datumbox Machine Learning Framework is an open-source framework written in Java which allows the rapid development of Machine Learning and Statistical applications. The main focus of the framework is to include a large number of machine learning algorithms & statistical tests and be able to handle large sized datasets. The code of the Machine Learning Framework can be found on Github.
For the purpose of the actual work, the decision was not to proceed in this direction and just use the Datumbox platform for 1000 “tweets” a day and create a word cloud, which anyway gives the intuition on what could have been the complete analysis without the constraints.
Figure 32-33: Word clouds splitted by sentiment The word cloud is elaborated subsetting the dataset two times and, therefore, represent the first 2000 “tweets”; being just subsamples of the whole dataset, they produce different percentages, but the majority of the “tweets” are classified as neutral. Comparing the two results it is possible to notice that the

62
more significant increment is found always in the neutral part, meanwhile the positives lose nearly 10%. Even though limitations and technical constraints have to be considered as always, the Sentiment Analysis has produced interesting insights, which could help in future steps of this work.

63
5 Initial structure of the Model The model is structured in the following way. An artificial stock market is created and agents interact in it. The idea was to represent a financial market composed of heterogeneous agents, thus different types of traders are introduced. Initially, there are agents which operate freely and can be seen as the basis of the model. They should provide the noise in the market without several impositions. Later will be carefully explained the agent’s decision-making process, for the moment, it is preferred to give just an overall sight. Then, a bid and ask process is created in order to recreate the basic procedure of trading which is easily observable in all the real stock markets. Consequently, buyers and sellers can interact depending on the price they are willing to pay or receive. The result of the process is an index, which will fluctuate differently depending on the numbers of traders active in every single day. Then will be possible to observe upward, downward or stable trends arising; it will be clearly of great importance during the experiments part because it will make easily understandable how the change of key variables and the introduction of different agents will affect the tendency of the market. Other agents are then able to interact with the basic traders which have been quickly presented before and it represents the crucial part of the model. The market can be influenced by the introduction of buyers and sellers. These agents will be differentiated from the original ones in order to highlight how and how quickly it is possible to alter the overall flow. Then it is possible with a change of perspective to present the core results of the previous part of the analysis: the “tweets”. The data analysis section has conferred results which are now included in the simulation model. “Tweets” will be considered as agents for technical reasons and will influence as well the direction of the index. The relevance of this kind of information is represented by its origin. These are real “tweets” collected during a limited period of time, therefore, through the model will be possible to observe how reality will interact with random and manufactured agents and their characteristics. Differences and similarity will be produced in the experiments section and it will clarify how new forms of information can influence investment behavior of individuals. The sentiment analysis part provides a crucial variable; agents need to decide whether being a buyer or a seller and it depends on their positive or negative attitude toward the future flow of the market. In the model, it is represented by the sentiment variable which will be necessarily positive, negative or neutral. It will be reproduced randomly for manufactured agents or purely transferred from reality for what concern real “tweets”. Combining reality and randomness will be crucial for the simulation.

64
In the following section, the model will be examined and explained in details. Meanwhile, Figure 34 shows the interface of the program after the setup.
Figure 34: Interface of the model
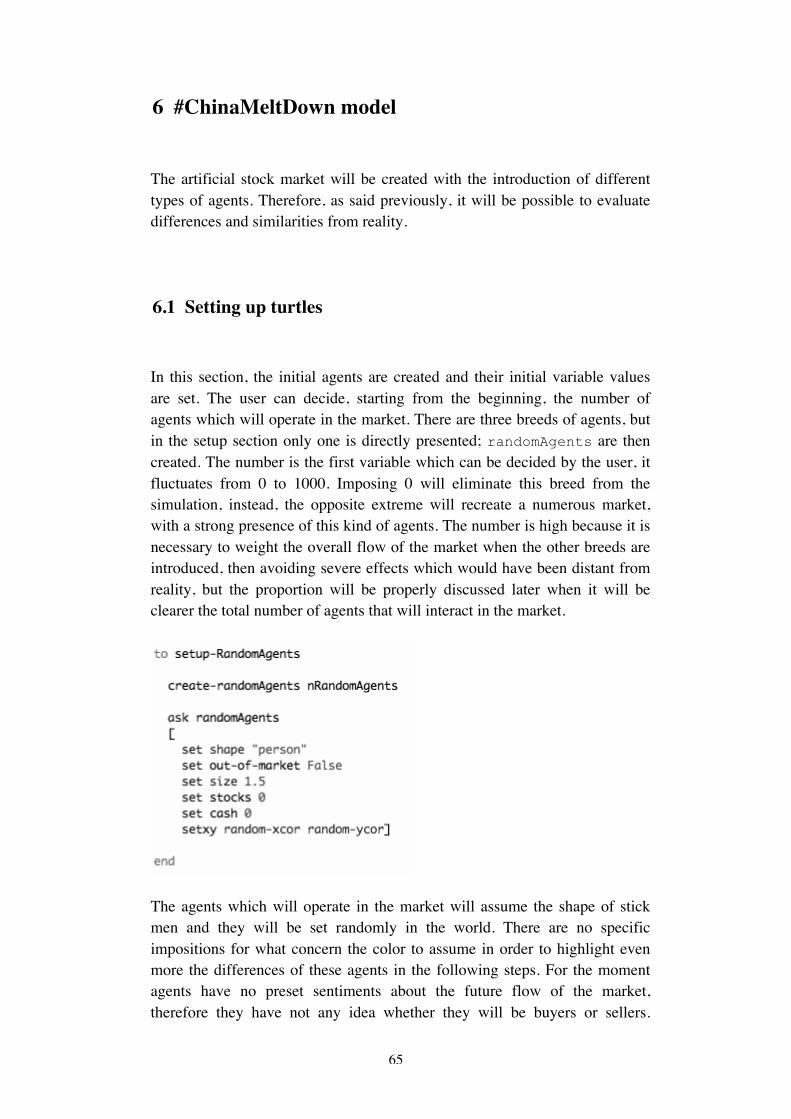
65
6 #ChinaMeltDown model The artificial stock market will be created with the introduction of different types of agents. Therefore, as said previously, it will be possible to evaluate differences and similarities from reality.
6.1 Setting up turtles In this section, the initial agents are created and their initial variable values are set. The user can decide, starting from the beginning, the number of agents which will operate in the market. There are three breeds of agents, but in the setup section only one is directly presented; randomAgents are then created. The number is the first variable which can be decided by the user, it fluctuates from 0 to 1000. Imposing 0 will eliminate this breed from the simulation, instead, the opposite extreme will recreate a numerous market, with a strong presence of this kind of agents. The number is high because it is necessary to weight the overall flow of the market when the other breeds are introduced, then avoiding severe effects which would have been distant from reality, but the proportion will be properly discussed later when it will be clearer the total number of agents that will interact in the market.
The agents which will operate in the market will assume the shape of stick men and they will be set randomly in the world. There are no specific impositions for what concern the color to assume in order to highlight even more the differences of these agents in the following steps. For the moment agents have no preset sentiments about the future flow of the market, therefore they have not any idea whether they will be buyers or sellers.
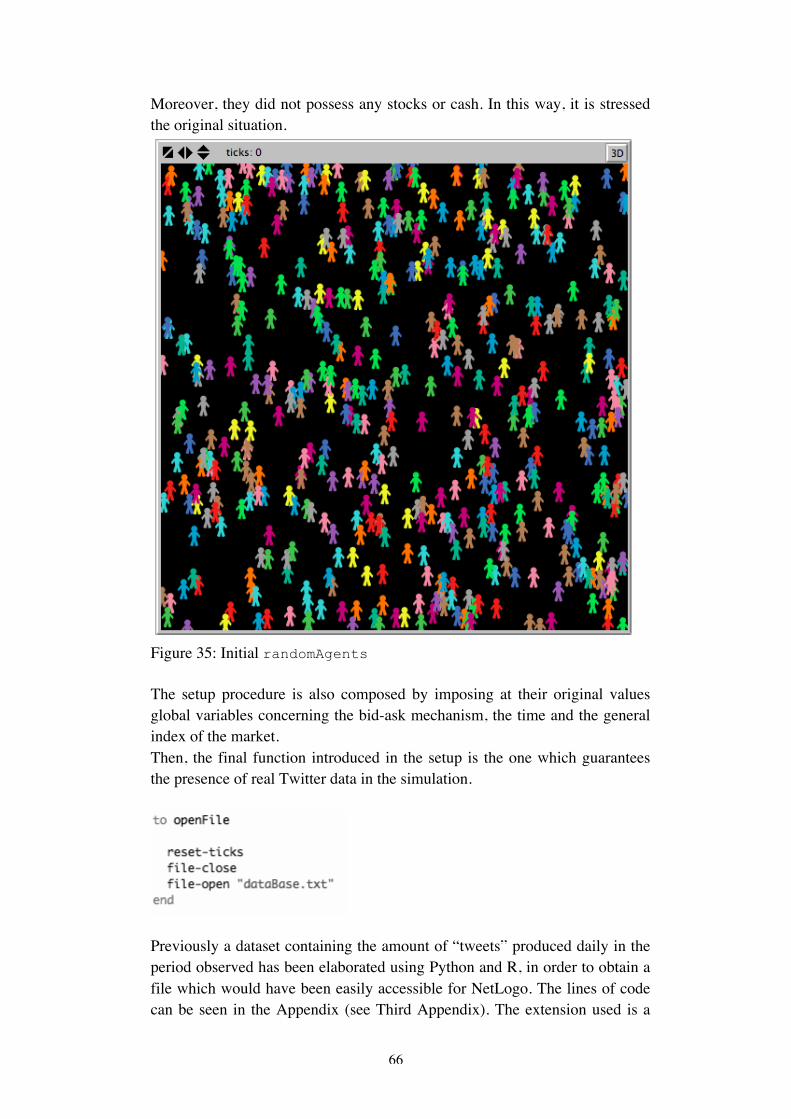
66
Moreover, they did not possess any stocks or cash. In this way, it is stressed the original situation.
Figure 35: Initial randomAgents The setup procedure is also composed by imposing at their original values global variables concerning the bid-ask mechanism, the time and the general index of the market. Then, the final function introduced in the setup is the one which guarantees the presence of real Twitter data in the simulation.
Previously a dataset containing the amount of “tweets” produced daily in the period observed has been elaborated using Python and R, in order to obtain a file which would have been easily accessible for NetLogo. The lines of code can be seen in the Appendix (see Third Appendix). The extension used is a

67
text file and it contains the number of “tweets” observed daily and then, for each single “tweet”, the sentiment obtained in the sentiment analysis part using R. The data are not attributed in the setup, for the moment NetLogo has just opened the file and it is ready to use it.
Figure 36: A glimpse of “dataBase.txt” The first day 5 “tweets” have been observed and at a more specific level, the first has a sentiment of -1, as well the second one; from the third to the fifth the sentiment is 0. Then the second day has 85 “tweets” and the following values are the sentiments which will be imposed to the breed of agents related to Twitter in the model. In order to be clearer, it is necessary to remember what the sentiment variable represents. Through the use of R and the sentiment analysis, it was possible to understand with an acceptable approximation whether the 140-character “tweets” expressed a positive, negative or neutral feeling of the Chinese economic condition. The result is the variable sentiment which will assume then positive values in the case of positive “tweets”, negative values in the case of negative ones, or 0 in neutral cases. The last value observed in the previous figure is -3, in fact, the variable is not limited between 1 and -1; a higher value positive or negative represents a “tweet” which presents a high number of characters which suggest a positive or a negative interpretation. Nevertheless, for the purpose of the model it is relevant just the direction of the feeling, then positivity, negativity or neutrality. It could be considered in future extensions of the model because it is a precious information, which could extend the relevance of Twitter data.

68
Figure 37: RandomAgent’s globals at the beginning of the simulation The above figure shows the globals, which are the variables which are accessible by the whole agentset. These are usually used when it is necessary to use them in many parts of the program. Observing properly, it is possible to observe that for the moment the variables buy, sell and pass are set equal to 0. Later they will show true or false condition as out-of-market already shows. Price instead is part of the bid-ask procedure and is different from agent to agent.
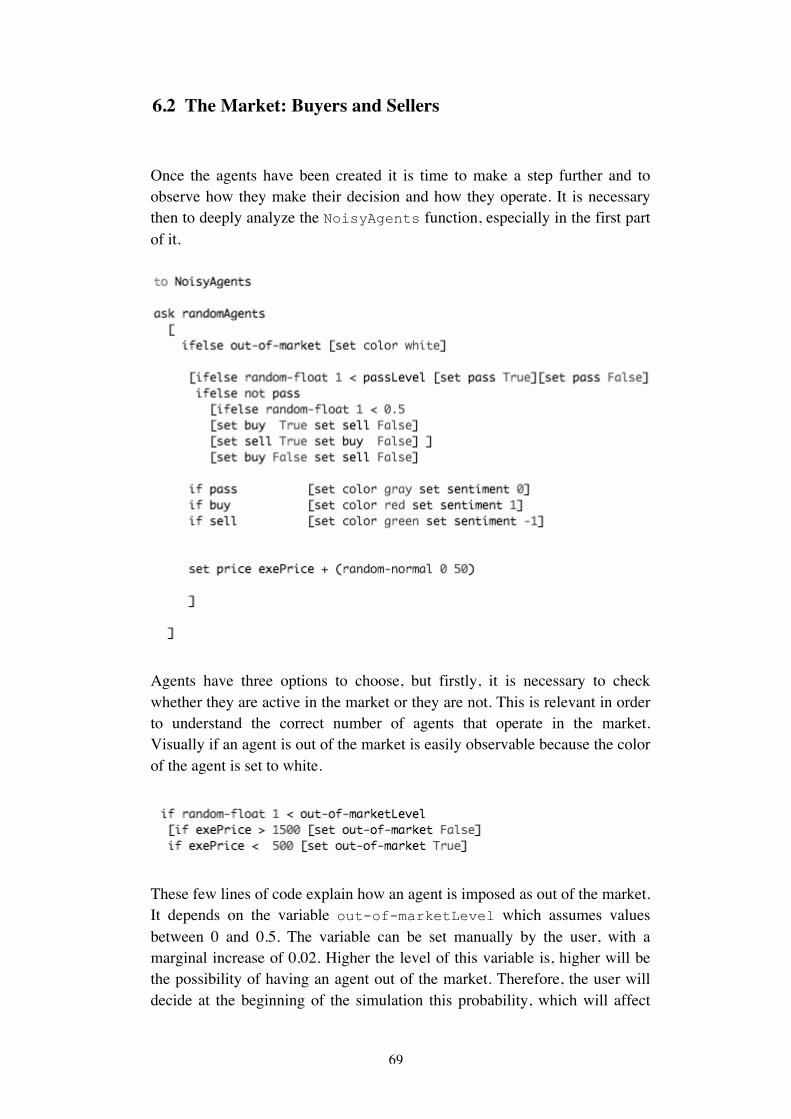
69
6.2 The Market: Buyers and Sellers Once the agents have been created it is time to make a step further and to observe how they make their decision and how they operate. It is necessary then to deeply analyze the NoisyAgents function, especially in the first part of it.
Agents have three options to choose, but firstly, it is necessary to check whether they are active in the market or they are not. This is relevant in order to understand the correct number of agents that operate in the market. Visually if an agent is out of the market is easily observable because the color of the agent is set to white.
These few lines of code explain how an agent is imposed as out of the market. It depends on the variable out-of-marketLevel which assumes values between 0 and 0.5. The variable can be set manually by the user, with a marginal increase of 0.02. Higher the level of this variable is, higher will be the possibility of having an agent out of the market. Therefore, the user will decide at the beginning of the simulation this probability, which will affect

70
the total number of traders in the market. Nevertheless, in order to limit the power of the user, a second condition will affect the probability of being active. Thus, it is necessary to consider the level of the index. In case it is greater than 1500, the agent will continue to stay active, the opposite will occur when the index will assume a value lower than 500. It is indispensable to remember that the index has a starting value of 1000, then the intuition behind this imposition is that when the exePrice experiences a negative trend, it will cause an increase in the number of agents observing the lower level of the stock price with respect to the initial value, therefore, they will decide to stay out of the market.
Figure 38: Agent decided to stay out of the market in a period of fall of the index Thus, the user has to decide whether to allow an increasing number of agents which will stay out of the markets or to limit this number in order to observe the behavior of agents without the possibility of escaping from the trade. In the experiments section, it would be interesting to observe these two possible scenarios. Consequently, the second choice which agents are able to make is the possibility of passing. Agents will be part of the market but they will not enter into the bid-ask mechanism. The intuition is that individuals will not trade every single day of the simulation, which seems acceptable from a realistic standpoint. Even in the real markets is rare that an agent will change every day his position relatively to the same stock. In fact, even the more active traders in the market will eventually wait some days before deciding to buy more stocks or, on the other hand, to sell. The difference from the previous situation is the possibility of reverting the state of the agent: if an is out of the market, this will last until the end of the simulation, while if he pass one day he could become active in the following.
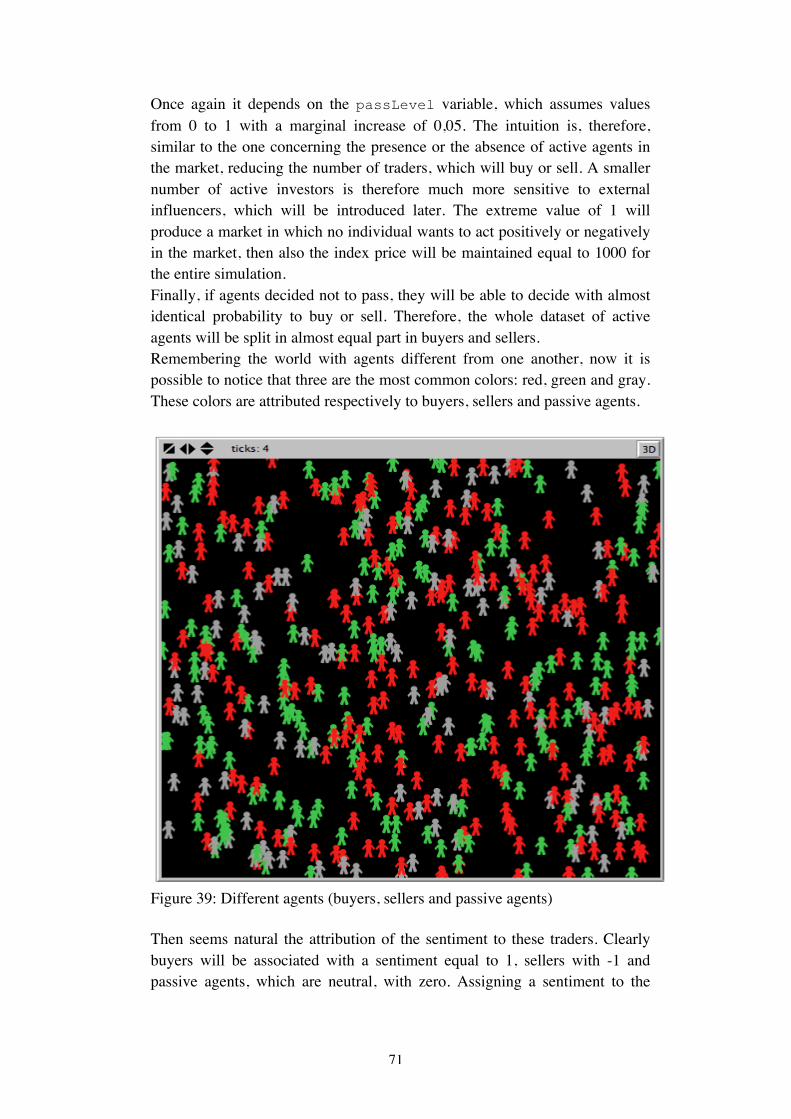
71
Once again it depends on the passLevel variable, which assumes values from 0 to 1 with a marginal increase of 0,05. The intuition is, therefore, similar to the one concerning the presence or the absence of active agents in the market, reducing the number of traders, which will buy or sell. A smaller number of active investors is therefore much more sensitive to external influencers, which will be introduced later. The extreme value of 1 will produce a market in which no individual wants to act positively or negatively in the market, then also the index price will be maintained equal to 1000 for the entire simulation. Finally, if agents decided not to pass, they will be able to decide with almost identical probability to buy or sell. Therefore, the whole dataset of active agents will be split in almost equal part in buyers and sellers. Remembering the world with agents different from one another, now it is possible to notice that three are the most common colors: red, green and gray. These colors are attributed respectively to buyers, sellers and passive agents.
Figure 39: Different agents (buyers, sellers and passive agents) Then seems natural the attribution of the sentiment to these traders. Clearly buyers will be associated with a sentiment equal to 1, sellers with -1 and passive agents, which are neutral, with zero. Assigning a sentiment to the

72
agents will make possible a comparison between these traders and the external influencers, which will be introduced next. The last thing asked to this breed is to set the price. It is defined starting from the original index price then traders will add or subtract a value with will fluctuates following a normal distribution with mean zero and standard deviation of 50. This process will allow traders to place an offer which will be higher or lower with respect to the actual value of the exePrice. This is clearly the first step of the bid-ask procedure which will be discussed in the following paragraph.
Figure 40: A buyer and a seller As can be easily observed, even though this is just an example, the first agent has decided to set the price higher respect the original value of 1000, the second one, instead, has subtracted nearly 75 to the original index. In this case, there have been represented a seller and a buyer but there is no correlation to the type of trader and the subtracting or adding phase, which is

73
once again logical. Therefore, it would be possible to find a seller setting a price higher than 1000 and a buyer setting it lower than 1000. The exePrice is then updated every single day.

74
6.3 Influencers Before proceeding to the description of the dynamics which rule the stock market, it is necessary to introduce more traders. The agents presented until this moment are just a part of the whole market. There are two more breeds to be presented: DailyTweeters and OpinionAgents.
The intuition behind these two different types of agents is crucial for the thesis. In fact, meanwhile the previously presented agents are to some extent free to decide whether to be sellers or buyers, the influencers have not the ability to make personal decisions. It is not a flaw of the model but a reasonable assumption; randomAgents will interact with these additional traders and will be thought-provoking to observe if the behavior of the original ones will be affected by the presence of the others and to which extent. Observing how trends can be altered by the introduction of agents which are hopeful for the future tendency of the market will represent a relevant component of the analysis.
6.3.1 Twitter Influencers It is mandatory to remember that the crucial part is the introduction of “tweets” into the simulation. The previous analysis has the concrete aim of producing results which could be used in the agent-based simulation. Twitter is, indeed, a precious source of information also for the financial market but the question is clearly: how much could it be relevant? For television shows, it is important to monitor the flow of related “tweets” in order to understand in real-time how the audience is reacting. A huge amount of “tweets” is clearly a positive result, it testifies that the show has been undoubtedly approved. Then, managers and sponsors can be much more confident in taking right decisions. These thoughts could be easily extended to the whole entertainment sector; the music industry seems to have the same potential of taking advantages of Twitter. An artist could observe how people is reacting to a new album, having a more direct perception in order to understand whether it was positively or negatively recognized.

75
Therefore, a further question arises naturally: is that worthwhile for economic topics? Clearly there are arguments for and against and the idea behind the simulation is to observe it in a controlled environment. The sentiment analysis section, as said previously, has produced a dataset with chronologically ordered “tweets” and relative sentiments. It represents the starting point of the whole simulation and it has been introduced in the setup of the model, then, it is now time to introduce in the model the “tweets”.
The first line of code of the above function recalls that it is necessary in order to obtain real data to operate with the file which was opened at the setup level. When the program has read all the necessary pieces of information no more “tweets” will be created. Thus, the simulation is limited in time because the period of observation and collection of the data is limited. The entire simulation is, then, limited to the number of days in which at least a “tweets” is present.
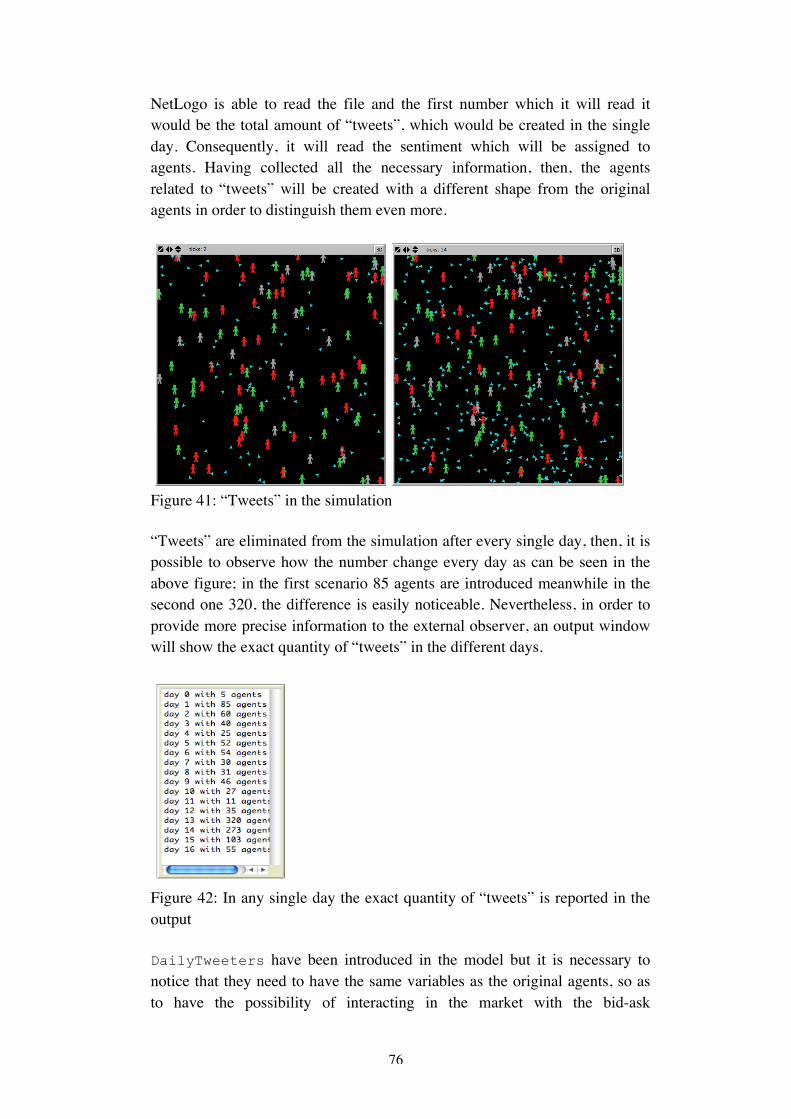
76
NetLogo is able to read the file and the first number which it will read it would be the total amount of “tweets”, which would be created in the single day. Consequently, it will read the sentiment which will be assigned to agents. Having collected all the necessary information, then, the agents related to “tweets” will be created with a different shape from the original agents in order to distinguish them even more.
Figure 41: “Tweets” in the simulation “Tweets” are eliminated from the simulation after every single day, then, it is possible to observe how the number change every day as can be seen in the above figure; in the first scenario 85 agents are introduced meanwhile in the second one 320, the difference is easily noticeable. Nevertheless, in order to provide more precise information to the external observer, an output window will show the exact quantity of “tweets” in the different days.
Figure 42: In any single day the exact quantity of “tweets” is reported in the output DailyTweeters have been introduced in the model but it is necessary to notice that they need to have the same variables as the original agents, so as to have the possibility of interacting in the market with the bid-ask

77
mechanism. Therefore, agents are divided with respect their sentiment; agents with a positive sentiment will be buyers, meanwhile negative sentiments will be associated with sellers as before, otherwise with a sentiment equal to zero they will be neutral and, therefore, they will pass.
Figure 43: DailyTweeters’ globals with different sentiments Thus, the stock market is now composed of two breeds of agents, which will interact using the bid-ask mechanism. Twitter agents operate in the market and they will influence the trend of the market, nevertheless is not obvious to believe that individuals writing on the social network will have an enormous power of influencing the market. Clearly among the “tweets” collected, some of them are highly reliable because reported by news agencies or professional investors, but effectively they do not represent the totality. Therefore, the question becomes how much Twitter can be believed? The answer, unfortunately, is not certain. It is possible to underline the relevance of the social network due mainly to the amount of people interacting with it; often the so-called “wisdom of the crowd” reproduce the knowledge of experts but it has to be reliable enough to take a decision concerning investment, which is always critical. On the other hand, it is possible to support the opposite argument of a totally unreliable instrument of knowledge in terms of financial decisions. Thus, the model needs to allow the user to calibrate the trustworthiness of Twitter data. Clearly, it is one of the most delicate arguments and need to be discussed properly, as will be done in experiments section.

78
Thus, the model allows the calibration of trustful “tweets”. The question is which probability of “tweets” which can be believed and it depends on as we have said previously. Then, will be the user to decide the most appropriate percentage using a slider.
Figure 44: The slider expresses the percentage of “tweets” which can affect the market The slider assumes values from 0 to 1. When it is at zero, the entire set of “tweets” will be considered relevant, which in the model, means that all relevant DailyTweeters will operate in the market; “relevant” indicates “tweets” which have a positive or a negative sentiment, which then can influence the market in one direction or the other. Otherwise, the totality of daily “tweets” will be considered not trustworthy, then, all DailyTweeters will pass. In order to deeply understand how “tweets” can influence the market, it is necessary to divide the simulation into two periods. The first one allows the user to manipulate the number of agents which will interact with the original agents; it represents a period of experience in which the user will add negative and positive traders (i.e. buyers and sellers) trying to observe when and how profoundly the trend will be affected; there is a mix which will guarantee an equilibrium or a stable trend? Positive or negative trends will arise in every single simulation? These are just some of the question to which the first period will attempt to provide an answer. Trying to understand how much the model is sensible will suggest also how the “tweets” will interfere with the evolution of the index. When “tweets” are introduced in the market the scenario will change and the result will be more comprehensible. Then, it represents the second scenario and other questions will emerge: the evolution will be similar to the real Shanghai composite index or it will differ deeply from the reality? In case of a similar trend, it will arise with a lag? Clearly an

79
astonishing will be the possibility of anticipating the real evolution of the index. Therefore, the necessity was to build the model allowing for these two periods. It will reduce the randomness of the original agents, which actually are created in order to produce a relevant noise but without any further imposition will not provide any thought-provoking outcomes. The creation of these two periods is then produced using a switch which will allow the user to decide between the controlled experience and the observation of the introduction of real Twitter data.
Figure 45: Switch which allows to choose between the two periods Turning on the switch will introduce the “tweets”, meanwhile, when it will be switched off, it will add the last breed which needs to be analyzed: OpinionAgents. As a consequence, in terms of coding the switch will activate respectively two different functions.
The first function has been sufficiently discussed but the second one plays a crucial role as well, then it is necessary to explain it deeply.

80
6.3.2 Artificial influencers The Twitter data collected is highly correlated with the economic phenomenon observed. Then, observing a period of financial crunch will probably produce comments or in this case “tweets”, which will be mostly negative and pessimists. Especially after the severe financial crisis that the whole world has experienced in 2008, it is acceptable to say that the entire population is much more sensible to economic and financial news. Citizens observe more intensively and are more attentive in the different policies that governments and institutions have elaborated. Moreover, the economy is not anymore a topic which just a small proportion of people pay attention to; then, it becomes clearer why a much more relevant number of economic “tweets” are arising. The emotional and interested involvement underlines how observing the flow which evolves into the social network could represent an important window on reality. Nevertheless, “tweets” comes in different volumes every single day and it is something which cannot be altered and can be observed also in the simulation. The number of “tweets” differs from day to day but it is also a matter of quality. Using the sentiment analysis “tweets” are divided in order to underline these sentiments, which implies within the current model a different attitude also toward the market. Thus, in order to make easier for the observer to understand how the market is sensible to the composition and the number of “tweets” a different breed has been introduced, as said previously. The user will be able to modify manually the composition of the market, which will guarantee a more profound awareness of how and when “tweets” could affect the artificial market. The number of artificial influencers is relevant but also the number of neutral ones, therefore, OpinionAgents are divided into just two categories: buyers and sellers. In fact, introducing a number of agents which would have pass every single turn would have produced a little effect and, at the end, not much sense. The similarities with the previously introduced influencers are maintained in order to produce a more direct comparison. In this portion of the simulation, the user will be gain confidence with the model and will understand the potential of the introduction of biased agents in the market. Indeed, it is necessary to recall that the original agents remain unchanged and they will produce the same noise in the market, but the difference will be represented by their interaction with the controlled influencers. Thus, it is necessary to present the lines of code and the function which will create the breed.

81
The similarities with Twitter agents arise immediately. As was true previously, even in this scenario the influencers are created and eliminated daily. The presence and the absolute value can be maintained constant for the entire composition or can be manually changed in order to observe how the market will instantly react to the different number of influencers. The shape is not defined just like for the “tweets” but graphically the distinction is highlighted by the different color assigned to the present breed; previously the color used was the cyan which is typical and recall instantaneously Twitter, meanwhile, in this case, yellow and orange have been used. In fact, in order to make also the observation of the influencers much more accessible a different color has been assigned for positive and negative additional traders.
Figure 46: OpinionAgents introduced in the model Figure 46 shows graphically how the number of the influencer could differ and it represents a relevant aspect of the period of experience. As said
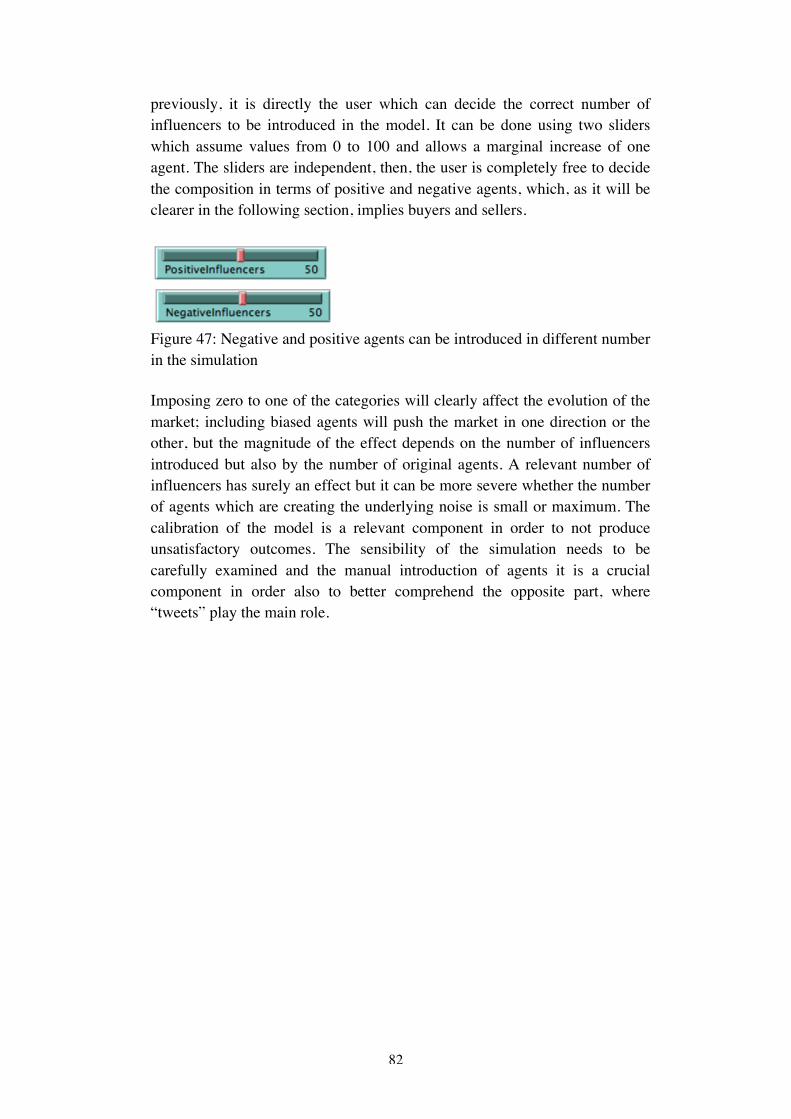
82
previously, it is directly the user which can decide the correct number of influencers to be introduced in the model. It can be done using two sliders which assume values from 0 to 100 and allows a marginal increase of one agent. The sliders are independent, then, the user is completely free to decide the composition in terms of positive and negative agents, which, as it will be clearer in the following section, implies buyers and sellers.
Figure 47: Negative and positive agents can be introduced in different number in the simulation Imposing zero to one of the categories will clearly affect the evolution of the market; including biased agents will push the market in one direction or the other, but the magnitude of the effect depends on the number of influencers introduced but also by the number of original agents. A relevant number of influencers has surely an effect but it can be more severe whether the number of agents which are creating the underlying noise is small or maximum. The calibration of the model is a relevant component in order to not produce unsatisfactory outcomes. The sensibility of the simulation needs to be carefully examined and the manual introduction of agents it is a crucial component in order also to better comprehend the opposite part, where “tweets” play the main role.

83
6.4 The Market: Bid and Ask Once the agents which compose the market have been introduced it is necessary to understand how they operate. Thus, the concepts of bid and ask will be introduced and they must be clear in order to have a better comprehension of the simulation.
6.4.1 Bid and Ask Firstly, it mandatory to give a definition for these two elements:
● bid: the highest price that a buyer is willing to pay for a share ● ask: the lowest price that a seller is willing to accept for a share
These two prices are always reported in the quotation of a stock and they represent how the market reaches an equilibrium, allowing the trades to happen. Moreover, this mechanism is based on the well-known concepts of supply and demand which basically rule every market in the world, the stock exchange is not an exception. Therefore, in order to make a trade happens it is imperative to have at least a buyer and a seller; the first one will place a bid price for the stock he is willing to buy, meanwhile the seller will impose an ask price for the same. For the moment, quantities and volumes are not considered in order to give the easiest interpretation possible. Furthermore, the ask price will be always higher than the bid and in order to better understand it is necessary to recall also that the difference between these two prices is crucial for the transaction. In fact, even though the supply and demand mechanism the foundation of the mechanism it is difficult to observe a perfect match between the two prices. The difference is called “spread” or “bid-ask spread” and it represents the margin of profits for the marketer. The difference is due to and underlines the importance of the market, which is the place where trades can happen. At the beginning, when more than two individuals were involved in the market and more than a single bid and ask prices were listed, the presence of the marketer allowed the match and, at the end, the trade. The difference between the prices represented the cost of the transaction and it was assigned to the marketer. This transaction cost is present even today; even if the mechanism of matching is not anymore manually made but it is completed electronically. The highest this difference is the highest will be the reward for the broker. Clearly, it represents a phenomenon which affects the market outcome and

84
several studies have been conducted in order to better understand it. Indeed, including the volumes will allow the analysis to be more completed and reliable. For what concerning the simulation, a bid and ask mechanism is constructed in order to allow the agents in both scenarios to trade stocks.
The above lines of code show how the mechanism is reported in the simulation and clearly it is possible to notice the structure which is divided in order to specify the different but similar behavior for buyers and sellers. As

85
partially said previously, the agents which will interact actively are not the ones which are out of the market or which will pass, therefore it is limited only to agents with positive and negative sentiments. Breaking down the code, it is possible to show the importance of the lists that are created in order to reproduce the bid and ask lists that can be observed in the real quotation of a stock.
The above output shows how the list is created, in this circumstance, the logB list is presented and it is equivalent to the bid price list. In fact, the highest value is always placed as the first element of the list and then it is ordered decreasingly. The price is always accompanied by the number which identifies the agent. For each agent, two logB are shown in order to display the ordering process. Clearly, it is necessary to recall that this is a limited example with just for buying agents, therefore, the list could assume higher dimension in the case of a higher number of agents interacting.
The opposite will happen for the sellers as can be seen in the above lists. The ask price is the opposite of the bid price, then, it has to be ordered from the lowest to the highest in order to satisfy the definition. As before, to the price is accompanied also the number of identification of the agent which is setting the price and it is always a limited example with a low number of selling agents. Speaking of the identification number of the agents it is necessary to observe in details the lines of code which guarantee the correspondence, which will be used then to impose the purchase or the sale of the stock and the modification in terms of cash.

86
However, randomAgents are not the only breed involved in the bid and ask mechanism; the introduction of OpinionAgents and DailyTweeters will not change the process of creation of the lists. The three different breed will interact simultaneously which guarantees the possibility for the additional agents to influence the market. The output for logB and logS will show clearly this interaction.
The above output shows the creation of the logS list when two breeds are involved. As can be easily observed the two types of agents interact, therefore there is no distinction between which agent will set the best offer. The same will happen in the case of “tweets” introduced in the model.
The possibility of affecting the market is then conserved in both scenarios. The only troublesome concept is the one concerning the order in which agents act and place their prices. Meanwhile, for original agents it does not create unpleasant consequences, it could represent a limitation for what concern the order in which especially “tweets”. Twitter data is collected and ordered from the first one in chronological order to the last one, thus, it means that “tweets” are also ordered within the single day in a consecutive order. Therefore, the problem arises when the ask turtles reorder randomly which will be the first agent to act first. The order in which “tweets” were collected could be relevant because even though the overall amount of negative ones would be not enormous, a long sequence of consecutive negative “tweets” could affect the trend of the

87
market. For the moment, it represents a limitation but it is due to the inner structure of the function ask turtles. Once there is the match between the bid and the ask, the agents involved will respectively add and subtract the stock traded and the two prices from the list. Then, also, the cash that every agent owns is corrected in order to reproduce the effect of the trade. This will conclude a transaction but there is no limitation on the total number, therefore, more transactions can happen every day.
Figure 48: Examples of transaction completed between two agents Lastly, it is necessary to understand how the index of the market will fluctuate; it is correlated with the trade which agents will conclude then it will assume the value corresponding to the first value in the list. Therefore, the necessity of a correct definition of the two lists is then a necessary condition order to have a correct fluctuation of the index. The exePrice is shown graphically as can be observed in the following figure.
Figure 49: Stock index during the observation Later, some experiments will show that the index can display an almost stable evolution or positive and negative trend depending on the structure of the model. In figure 49 instead, it is possible to notice that it does not exhibit a clear trend but there will be scenarios in which positive and negative trend will arise. In this case, only randomAgents were included in order to have an almost unpredictable and independent trend. It means that the proportion of agents with a positive or negative sentiment will push the index upward or

88
downward, therefore, it is useful to constantly observe the number of relevant agents and it can be done through a different graph.
Figure 50: Negative randomAgents in the market The graph shows only negative agents and the number is influenced by the imposition on the probability of agents which will pass or which will stay out of the market decided by the external observer. Here, it displays an oscillating number and it is calculated imposing the number of randomAgents at 500 and a 0,15 percentage of agents which will pass. The choice of observing only the number of negative agents is due to the fact that the same will be done for “tweets”. It necessary to remember that the interval of time which has been examined is a crisis period, therefore, much more attention is placed upon negative components and effects. Thus, having the possibility of comparing the number of negative original agents and “tweets” allows getting better insights on the days which are more sensible because of the substantial level of traders which will push the market in a negative direction. Differently, a graph is not provided for OpinionAgents because the number is always constant and surely observable for the external user, which directly decides the number of influencers to be introduced.
Figure 51: Negative “tweets” in the market Negative “tweets” are real values and really occurred, thus, the graph will remain constant but it is always valuable to can have a quick look at which

89
days are more significant in order to observe in the simulation what will happen to the variables and the index. Moreover, all the graphs above mentioned were adjusted in order to allow the comparison between days. In the simulation, it has been decided that a tick is equivalent to a day and it has created troubles, especially in the index graph. Agents will vary across the various experiments which can be done, therefore, without further impositions the graph will be altered on the horizontal axis; the index assumes different values according to the trading phase, thus, the x-axis will show a different number of fluctuations of exePrice within a single day.
Using the global variables MyT, MyTx and the plotxy function the representation of the index is divided in unit of time corresponding to a day and, moreover, within the unit, the number of fluctuations is allowed to be different from day to day. Hence, the user will have the possibility of observing the days which have denser trades and the exact moment in which a more severe positive or negative variation happens. The description of the basic structure of the model has been completed, consequently, various experiments will be demonstrated and explained.

90
7 Experiments In the present section, several experiments will be considered and different outcomes will be explained and discussed. Initially the market will be the focal point of the observation and the idea will be to understand how the original agents will operate without any interference by external agents. This will represent the basic market, then, two possible scenarios will be tested. In the first period, there will be the introduction of biased agents in terms of sentiments; it means that buyers and sellers will be manually added in the market in order to understand whether the trend of the market can be pushed upward or downward and, consequently, the magnitude of this effect. These preliminary experiments will be created in order to introduce the crucial scenario: finally, “tweets” will be added and will be interesting to understand whether the outcome will be similar to the real trend of the Shanghai index observed in the identical periods. It is necessary to remember that two datasets of “tweets” are available for the simulation, thus, will be thought-provoking to understand the differences between the first period and the second one. Across the different experiments there will be also the possibility to observe how the change of key variables will affect the overall effect. Furthermore, changing the proportion of agents will allow to observe different outcomes. Therefore, different markets in terms of size and composition will be tested and it will be possible to observe how a variable number of external traders could affect these markets. Concluding, it will be possible to discuss differences and possible extensions.

91
7.1 Market and random traders The first scenario which will be observed is the market itself. Therefore, randomAgents will be observed deeply and many manipulations will be made in order to have a better comprehension of the current breed. Initially in necessary to test how a different number of agents will affect the exePrice. Therefore, the first slider to be manipulated is the one, which allows the determination of the number of randomAgents to be introduced. Among the multiple possibilities which can be analyzed, three cases will be considered. Firstly, the two extremes will be tested; even though the slider allows the possibility of imposing zero agents, as the lower extreme will be considered a market composed of 10 agents. Zero will completely remove the breed, which will be completely nonsense because will make difficult to obtain results concerning the agents’ behavior which could be later compared with a higher number of traders. Therefore, the first one is a scenario in which only a few agents will interact. For the moment, also the probability of having inactive agents will be limited to a quite unreasonable zero percent. Thus, the whole agentset will be divided into buyers and sellers.
Figure 52: Index in the case of 10 agents operating in the market The interesting part of the analysis is represented by the possibility of observing the index and its evolution. Without any kind of influencers, the traders will be free to operate and the results show that there will be the possibility of the emergence of speculative bubbles. Therefore, the global variable sentiment gains relevance and it should be deepened. Expectations are crucial in order to explain the origin and the crush of a bubble and the variable sentiment is thought to be a synthesis of these future predictions. A positive value is attributed to buyers which, then, will decide the right price they are willing to pay in order to acquire an asset. Symmetrically the opposite will happen for sellers, therefore, allowing for the birth of a bubble.
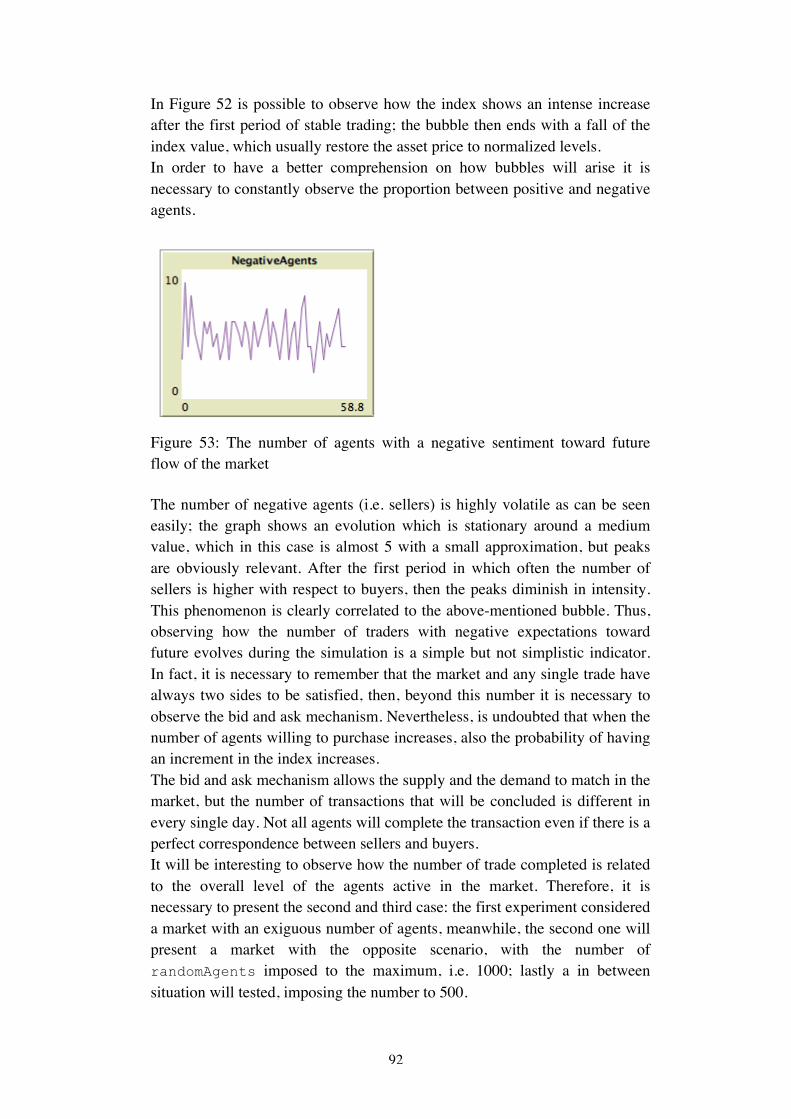
92
In Figure 52 is possible to observe how the index shows an intense increase after the first period of stable trading; the bubble then ends with a fall of the index value, which usually restore the asset price to normalized levels. In order to have a better comprehension on how bubbles will arise it is necessary to constantly observe the proportion between positive and negative agents.
Figure 53: The number of agents with a negative sentiment toward future flow of the market The number of negative agents (i.e. sellers) is highly volatile as can be seen easily; the graph shows an evolution which is stationary around a medium value, which in this case is almost 5 with a small approximation, but peaks are obviously relevant. After the first period in which often the number of sellers is higher with respect to buyers, then the peaks diminish in intensity. This phenomenon is clearly correlated to the above-mentioned bubble. Thus, observing how the number of traders with negative expectations toward future evolves during the simulation is a simple but not simplistic indicator. In fact, it is necessary to remember that the market and any single trade have always two sides to be satisfied, then, beyond this number it is necessary to observe the bid and ask mechanism. Nevertheless, is undoubted that when the number of agents willing to purchase increases, also the probability of having an increment in the index increases. The bid and ask mechanism allows the supply and the demand to match in the market, but the number of transactions that will be concluded is different in every single day. Not all agents will complete the transaction even if there is a perfect correspondence between sellers and buyers. It will be interesting to observe how the number of trade completed is related to the overall level of the agents active in the market. Therefore, it is necessary to present the second and third case: the first experiment considered a market with an exiguous number of agents, meanwhile, the second one will present a market with the opposite scenario, with the number of randomAgents imposed to the maximum, i.e. 1000; lastly a in between situation will tested, imposing the number to 500.

93
Figure 54: exePrice and number of agents with negative expectations in case of 1000 randomAgents The difference which is more evident is the number of transactions completed, which can be noted by the density of the exePrice graph. Within the single day, with an elevated number of agents interacting, much more transactions will be completed and then the value will be translated to the graph. Furthermore, as in the previous case of a limited number of agents, even in the present setup the market index shows the origin of bubbles and therefore positive trends often followed by downward trends. The second chart confirms the first scenario, in fact, even though the proportion is not fixed and change every day, the mean is approximately equal to 500 and 250 in Figure 55.
Figure 55: exePrice and number of agents with negative expectations in case of 500 randomAgents Comparing the three cases it is possible to notice that the overall flow of the index can be stable for long periods of time, even though speculative bubbles can arise. More simulations can be run and the outcome will always be different and no clear trend will arise. The trend will be always unstable and similar to a random walk. The number of agents with negative expectations will fluctuate around the mean which is usually half the number of randomAgents imposed initially. Therefore, the experiments have shown that the number of agents involved in the market has an effect on the determination of the transactions completed

94
through the bid and ask mechanism. Nevertheless, it is impossible to predict future flows of the market, this result will be particularly relevant in order to understand the effect of an introduction of further agents, which will try to influence the market. Further modifications in the passLevel and out-of-marketLevel sliders will not change the general behavior of the index. Only magnitude effects will be noticed, especially in the number of active agents and, therefore, the number of transactions. The number of agents which will exit from the market is relevant only if the index experiences a deep fall or an unbelievable rise. The following lines of code allow having a quick look on the threshold that the index has to overpass.
For completeness, the extreme case of 100% of inactive agents will be presented but it is hard to think of a market in which not a single agent will decide to operate. This assumption has to be considered because it could happen but it will have little significance in terms of the actual analysis.
Figure 56: All the agents in the market decide to wait and pass The above figure shows the only scenario in which the index will be kept completely constant throughout the entire simulation. At this point, having explained how the breed randomAgents operates without any interference it is possible to extend the observation. In the following section, the introduction of biased agents will be explained in details.
95
7.2 Biased Traders The introduction of biased agents represents an intermediate step toward the crucial part of the thesis, i.e. the introduction of “tweets” in order to observe how the market will respond. The intuition is that the user has the necessity to understand manually and by experience how the market can be influenced in the simulation. A greater awareness will allow the above-mentioned user to better comprehend the phenomenon of Twitter and, therefore, to get more insights. Before proceeding with the experiments, it is necessary to clarify how the market can be influenced in the real world. The model is based on assumptions which guarantee the model to be simple but non-simplistic and straightforward, nevertheless, it is necessary to keep in mind what is the basic idea. Consequently, it will be possible to make a step further into the model and interact with OpinionAgents, which compose a different breed with respect to randomAgents.
7.2.1 Market Influence Observing the fluctuations of a stock price, it is often difficult to understand really what is driving the asset. Many factors usually interact in the determination of the future evolution of that stock. Indeed, it represents the reason why the stock is so unpredictable even for experts and professional investors. These driving forces are complex, fragmented and contradictory in many cases, therefore trying to analyze at least some of these factors can help in order to get a better comprehension of the market. Among non-economical factors it is possible to list for example psychology and political factors; often the stock value is pushed up or down simply by the excessive response of investors to an event, which is not strictly related to the stock itself. Fear is a well-known sentiment and it affects deeply many investors. Thus, knowing that a particular company of a particular sector is struggling may induce investors owning shares of a company in the same sector to sell them before it is too late. Clearly, this peculiar behavior is much more probable in non-professional investors but, in general, psychology is not a factor which can be excluded easily. Furthermore, elections, terrorist attack, wars and epidemics have influenced the market at different levels and with different magnitude. These are just some of the possible factors which can push stock value; governments can influence from the outside the flow of the market using
96
monetary policy, currency inflation, manipulating interest rates when it is possible or through subsidies and tariffs. A famous example is represented by the quote of the Governor the European Central Bank Mario Draghi, which in order to limit the effect of speculation over the euro stated that he would have done “whatever it takes”. Regularly, many official statements are released by chairmen and CEOs in order to cope with arbitrage. These are economical tools to which the world is used to but summing these factors, it becomes more evident that understanding why a stock price is fluctuating is not an easy task. Predicting is, anyway, possible but it needs the ability to weight correctly which among these factors will count the most in a limited period of time. In the current simulation among these famous factors, it has been chosen probably the primordial: the addition of a variable number of individuals with different beliefs over the only stock present in the market. Thus, the model is not assuming any of the previously mentioned shocks, but it is jumping directly to the effect. After a relevant event, a variable number of investors will take a decision in favor or against an asset; therefore, they will decide to be willing to buy or sell. This represents the intuition behind the possibility of adding agents which are willing to buy or sell in the simulated market in order to influence the market. Thus, even though many other factors may be introduced, adding a group of agents represents the general effect of these different shocks. OpinionAgents have to be considered and analyzed as these groups of people and it is not important whether they are professional investors or domestic investors. What it is relevant is the volume of these agents. More agents willing to buy will be introduced in the model the higher the probability will be of affecting the evolution of the index. Therefore, having the possibility of observing how the pool of investors in composed may represent a powerful source of information in order to be able of influencing the market and it expresses the link between OpinionAgents and DailyTweeters. Initially, it is necessary to understand how many influencers are needed to actually affect the market relatively to the size of the market. Secondly, it will be possible to observe real pools of possible investors and inspect whether the market can be influenced.

97
7.2.2 Buyers and sellers The possibility of influencing the market is a power resource, which has always generated great debates. In the present model, it will be possible to alter the evolution of the market, introducing buyers and sellers. Keeping in mind the bid and ask mechanism, the notions of buyers and sellers is not univocal and need a better explanation. The bias of these agents is at a different level, it concerns more their sentiments toward the market. In fact, in the model is possible to introduce an amount which will be specified later of agents with a positive sentiment or a negative sentiment. They will be confident about an increase in the value of the index, therefore, becoming interested in buying, or the opposite can happen as well. The possibility of actually becoming a buyer or a seller is not obvious. Agents will decide the price they are willing to pay or to receive and only in case they will be lucky enough to find a counterpart in the market, the transaction will be completed. Later, it will be interesting to reflect what is the relation with “tweets” and how and if this part of the simulation will have been useful in order to gain a better comprehension. Initially, instead, it is necessary to reason on the different combinations of agents and the possible outcomes.
Figure 57: Two sliders allows the user to manually decide the number of agents with positive and negative sentiments to be introduced in the simulation The sliders allow an introduction of maximum 100 agents with a positive sentiment toward future evolution of the index and 100 agents with a negative sentiment. Several experiments will be conducted because it is necessary to deeply observe how a different composition of the market will affect the index. Thus, what is the right proportion of randomAgents and OpinionAgents? The answer depends on what it is considered to be right. On one hand, right could be interpreted as realistic, therefore, recreate a composition which to some extent is able to reproduce an evolution of the index which is similar to a real one. On the other hand, it could be, as well, unrealistic. Searching if there would be a composition which will cause unusual effects which differ profoundly from the real ones. The starting point will be represented by the decision of the number of randomAgents to be introduced. In order to take advantage of the previous

98
experiments, the simulation, as before, will cope with three different markets: a small, a crowded and medium market. Thus, randomAgents will be set respectively to 10, 500, 1000. Consequently, different combinations of OpinionAgents will be added in order to observe the behavior of the exePrice.
7.2.3 Small Market The small size market has been observed in the previous section and the more important results arisen are represented by the number of transactions completed in every single day and the randomness of the behavior of the randomAgents. Market bubbles can happen but after a number of days the level is usually restored to a normalized level. Initially, biased agents are introduced in small quantities, trying to reproduce and analyze a small market affected by a limited number of external traders. The proportion between positive and negative additional traders is kept constant for the entire simulation, therefore, 10 plus 10 traders are introduced.
Figure 58: exePrice resulting from a small market with a limited number of influencers Comparing Figure 52 with Figure 58, it is possible to notice that the second graph shows a much denser evolution of the index, which testifies an increased number of transactions completed. Nevertheless, what becomes evident is that even in this case, not an evident trend arise. Bubbles with periods of upward and downward trends can often be seen, but, running several simulations, the randomness of the market is not limited by the introduction of external traders. In fact, the whole dataset of traders, composed by randomAgents plus OpinionAgents, operates in exactly same way. Also biased agents decide the price that is willing to pay or to receive and then the bid and ask mechanism determines the number of

99
transactions which will come to a positive end. The interpretation is confirmed by the fact that even increasing the number of external agents to maximum but keeping constant the equality between the two kinds of biased agents, the result will not change. The outcome obtained will tend to be more similar to a market of medium size, with just 10 randomAgents and 200 OpinionAgents.
Figure 59: A small market will tend to a medium market outcome when the number of OpinionAgents is high Introducing the exact same quantity of positive and negative agents will not change profoundly the outcome of the index. It becomes necessary to observe whether the outcomes will change introducing just a category of external traders. The following experiments will introduce firstly 10 negative agents, secondly, 10 positive agents, lastly the sensibility of the model will be tested with small differences between these two categories.
Figures 60-61: Effect of the introduction of only negative and positive agents The result from the introduction of just a category of OpinionAgents has been severely affected and negative and positive trends are clearly displayed. The sliders allow the possibility of imposing even a greater number of

100
influencers, but introducing an unreasonable number will make little sense. Indeed, the decision of introducing 10 agents, which is half the quantity of randomAgents present in the market, has produced already a clear result. The user is, at this point, aware of the sensibility of the model. Therefore, it is necessary to make a step further and understand the marginal effects deriving from a marginal increase of the number external traders.
Figure 62-63: Increase of 3 OpinionAgents Relevant results can be observed even from a small increase in the number of external traders; in both the scenarios represented by the figures above a marginal increase of 3 agents, firstly in the negative category and secondly in the positive one, produces easily observable negative and positive trends. The magnitude of the effect has to be considered and in this case, reproduce a scenario which is often observed in reality the effect of a fall is always more severe with respect to the opposite scenario. Concluding, it is necessary to remark that with a marginal increase of just 3 agents, some simulations reproduce an almost stable trend. It is due to the proportion of original agents, thus, an increase of one type of agent could restore the equilibrium instead of producing a clear upward or downward trend. Nevertheless, these cases represent the minority of the possible outcomes.
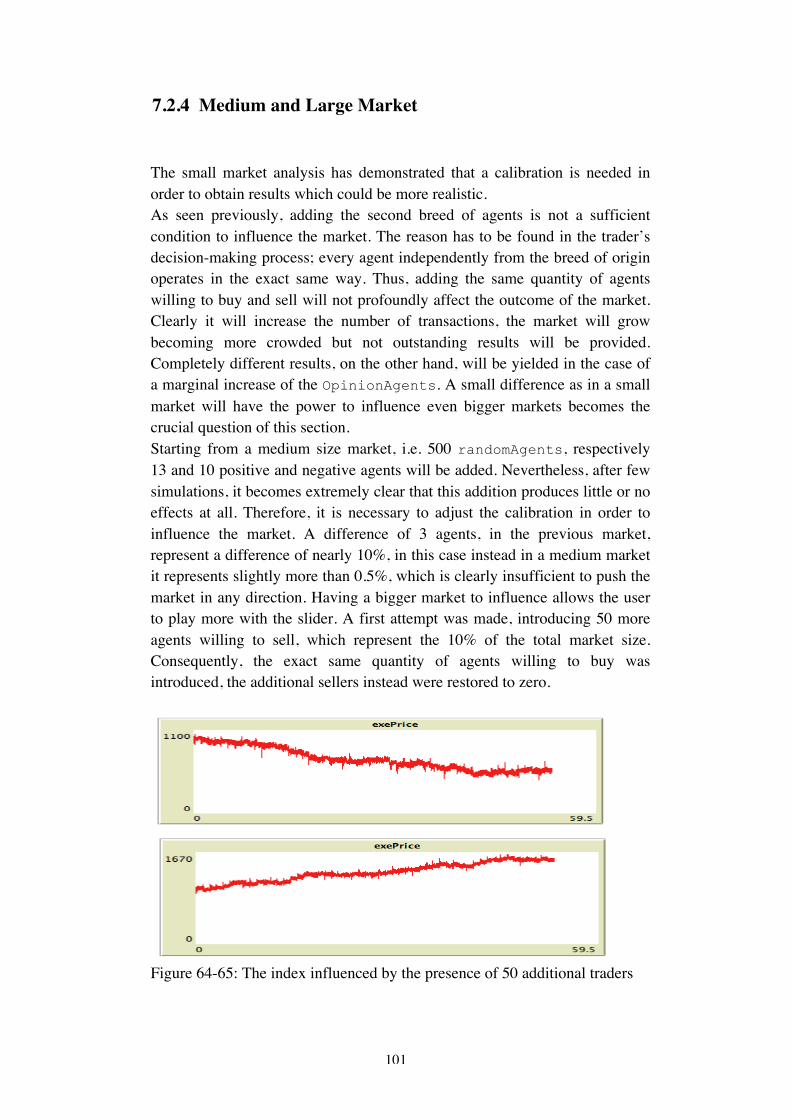
101
7.2.4 Medium and Large Market The small market analysis has demonstrated that a calibration is needed in order to obtain results which could be more realistic. As seen previously, adding the second breed of agents is not a sufficient condition to influence the market. The reason has to be found in the trader’s decision-making process; every agent independently from the breed of origin operates in the exact same way. Thus, adding the same quantity of agents willing to buy and sell will not profoundly affect the outcome of the market. Clearly it will increase the number of transactions, the market will grow becoming more crowded but not outstanding results will be provided. Completely different results, on the other hand, will be yielded in the case of a marginal increase of the OpinionAgents. A small difference as in a small market will have the power to influence even bigger markets becomes the crucial question of this section. Starting from a medium size market, i.e. 500 randomAgents, respectively 13 and 10 positive and negative agents will be added. Nevertheless, after few simulations, it becomes extremely clear that this addition produces little or no effects at all. Therefore, it is necessary to adjust the calibration in order to influence the market. A difference of 3 agents, in the previous market, represent a difference of nearly 10%, in this case instead in a medium market it represents slightly more than 0.5%, which is clearly insufficient to push the market in any direction. Having a bigger market to influence allows the user to play more with the slider. A first attempt was made, introducing 50 more agents willing to sell, which represent the 10% of the total market size. Consequently, the exact same quantity of agents willing to buy was introduced, the additional sellers instead were restored to zero.
Figure 64-65: The index influenced by the presence of 50 additional traders

102
In both cases, the variation of the index at the end of the period of observation is nearly 50% the original value. Similar increase and fall can be found in a large market with 1000 randomAgents when extreme additions are imposed using the sliders. The user is supposed to test these possibilities, which at the end suggest that the calibration is absolutely required in order to reproduce index similar to the reality. Imposing huge differences between additional sellers and buyers will surely push the index in one direction or the other, but these are limit cases. OpinionAgents were created similar to DailyTweeters, which will be analyzed in the following section, therefore pushing to the extreme these differences help in order to understand when real “tweets” will have the possibility to actually affect the market. Marginal additions and subtractions represent also crucial steps. The model allows an elevated number of possible combinations, which will produce thought-provoking results, which will lead to several discussions and considerations. Lastly, it is necessary to keep in mind that OpinionAgents in the previous experiments were introduced and kept constant for the entire simulation, which is limited to 53 days. It means that every single day, for 53 times, the exact same proportion of additional agents will be introduced in the market. Moreover, the previously created traders will be deleted before the creation of the new ones. Thus, every single day an excess of buyers and sellers will be observed, heavily pushing the index upward or downward. When “tweets” instead will be introduced, they will be different every day and therefore also the difference between positive and negative. It will be interesting to observe whether the effect will be as strong as in this scenario or not.

103
7.3 Chinese crisis through the lens of Twitter In the present section, “tweets” are finally introduced and analyzed. Two datasets of “tweets” are available and they have been collected in two separated periods. The first one collects data from the 14th July 2015 to the 6th October 2015, meanwhile, the second one from 6th January 2016 to the 3rd February 2016. These datasets are different not only in terms of observation time but also in terms of volumes and quality. Therefore, it is necessary that the user is aware that choosing the first or the second database will produce different results and discussions. In fact, Twitter is an incredible tool, which allows observing daily how a particular situation is evolving, the Chinese case is a precious example. Thus, before jumping into the simulation, it is necessary to discuss briefly what happened in China, how it has been observed through the lens of Twitter and the differences between these two periods.
Figure 66: Shanghai composite index through 2015-16 (Source: Reuters10) The Chinese economy is considered by many economists as one of the most important because of its potential and already because of its volumes (it is currently the second greatest economy of the world). But many of them have also highlighted many critical points. The economy is highly dependent on its manufacturing sector and exportations and it has experienced long periods of high levels of growth, which were (and are) crucial for its sustainability.
10 http://www.nytimes.com/interactive/2015/08/26/business/-why-china-is-rattling-the-world-maps-charts.html

104
These levels of growth are now slowing down, highlighting the stressful points. Clearly is a complex problem which would need a long and detailed explanation. Nevertheless, for the purpose of the actual work, it is necessary to understand that the Chinese economy is experiencing a transformation process which China needs to complete before it is too late. This sense of urgency has been suggested by the latest events. In fact, as can be observed in Figure 33, during the period from May 2015 to February 2016, the Chinese economy has suffered a severe slump. The Shanghai composite index fell deeply several times, the most relevant downfalls happen in June, August and in January. The concerns for the Chinese instability have grown and evolved over this period. Therefore, many economists have tried to explain the situation and have expressed their concerns. An example is represented by the following quote:
A reasonable strategy would have been to buy time with credit expansion and infrastructure spending while reforming the economy in ways that put more purchasing power into families’ hands. Unfortunately, China pursued only the first half of that strategy, buying time and then squandering it. The results has been rapidly rising debt. much of it owed to poorly regulated “shadow banks” and a threat of financial meltdown (Krugman, 2016)
The Nobel prize winner Paul Krugman underlined how the Chinese government should have to proceed in order to avoid dangerous waters. This statement is a prestigious opinion but it has been made by just one of the many economists which have expressed suspects in the Chinese financial and economic situation. During the period observed, more economists, journalists and financial experts have tried to provide an explanation. This phenomenon is extremely common, great events produce plenty of articles and editorials. Additionally, the publishing industry and conventional newspapers have suffered a crisis as well during the last years; they are trying to reinterpret themselves and the most productive attempt seems to be through the massive use of their own websites. Thus, more analysis and editorials are now published on the internet and here is where Twitter becomes a powerful source. The social network founded by Jack Dorsey enables to aggregate quickly all these prestigious pieces of information with opinions and concerns of non-experts and common users. As a consequence, it is possible to observe with a wider perspective the Chinese financial crisis through the lens of Twitter. Thus, among the huge amount of “tweets” available on the Chinese crisis, it was possible to collect two datasets concerning the downfalls happened in August and in January. These two datasets contain all these pieces of information. Then, it is necessary to inspect more deeply what happens during these two separated periods and which are the differences.

105
In the period between July and October 2015, journalists and experts were relatively surprised by the fall of the Shanghai composite index and the Chinese crisis seems to be just an episode. Consequently, government's financial measures have reassured the markets, investors and journalists enough, for example, forcing mutual and pension funds to buy shares and limiting short selling under threat of arrest. Despite the methods used, the government has shown its power through a direct intervention, as was easily predictable, and, finally, the attention has gradually dissipated. After the first period of fear and concern, the situation seemed to have found an equilibrium. Then, the composite index fell again in January. Therefore, also the amount of “tweets” was once again relevant. The second dataset considers this following period and hides within itself different worries and analysis. Many economists deepened their investigations and change their beliefs. The Chinese economy seems to be near to an undefined limit point, in which its structural problems could cause serious consequences. Moreover, People’s Bank of China seems to be facing the crisis with unconventional and ineffective measures, which raises extra concerns and increases the psychological effect, creating more instability. As a consequence, many economists are scared that the Chinese financial outlook could influence negatively and spread its effect to the rest of the world, like the subprime crisis of 2008. The discussion is clearly more complex and it involves also problems of transparency, bureaucracy and currency management. Furthermore, it is evolving every day and mainly due to capital controls, the effect could be limited to China; in fact, different from the 2008 crisis, not many banks and institutions seem to be excessively exposed. Therefore, luckily the situation seems to be not extremely dramatic but a more exhaustive analysis would be necessary to understand what could happen in the future. However, for the purpose of the actual work, it is necessary just to have an idea of what is the economic situation in China and how it has evolved over the periods observed. Keeping these differences in mind, the user will be free to choose which period of “tweets” to introduce in the market. Therefore, in the following section, various experiments will be conducted in order to observe how “tweets” can actually and potentially affect the market. Finally, concluding discussions over the potentiality of Twitter data will be provided.

106
Figure 67: A chooser allows the choice between the two periods and datasets
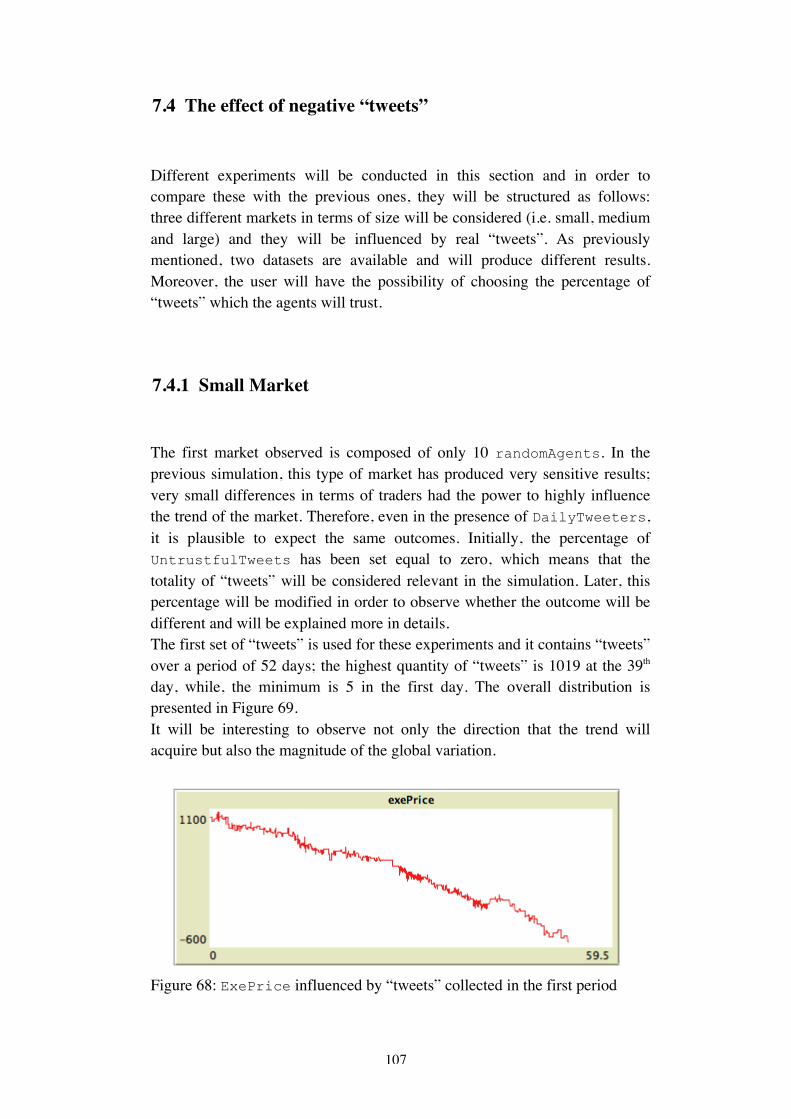
107
7.4 The effect of negative “tweets” Different experiments will be conducted in this section and in order to compare these with the previous ones, they will be structured as follows: three different markets in terms of size will be considered (i.e. small, medium and large) and they will be influenced by real “tweets”. As previously mentioned, two datasets are available and will produce different results. Moreover, the user will have the possibility of choosing the percentage of “tweets” which the agents will trust.
7.4.1 Small Market The first market observed is composed of only 10 randomAgents. In the previous simulation, this type of market has produced very sensitive results; very small differences in terms of traders had the power to highly influence the trend of the market. Therefore, even in the presence of DailyTweeters, it is plausible to expect the same outcomes. Initially, the percentage of UntrustfulTweets has been set equal to zero, which means that the totality of “tweets” will be considered relevant in the simulation. Later, this percentage will be modified in order to observe whether the outcome will be different and will be explained more in details. The first set of “tweets” is used for these experiments and it contains “tweets” over a period of 52 days; the highest quantity of “tweets” is 1019 at the 39th day, while, the minimum is 5 in the first day. The overall distribution is presented in Figure 69. It will be interesting to observe not only the direction that the trend will acquire but also the magnitude of the global variation.
Figure 68: ExePrice influenced by “tweets” collected in the first period
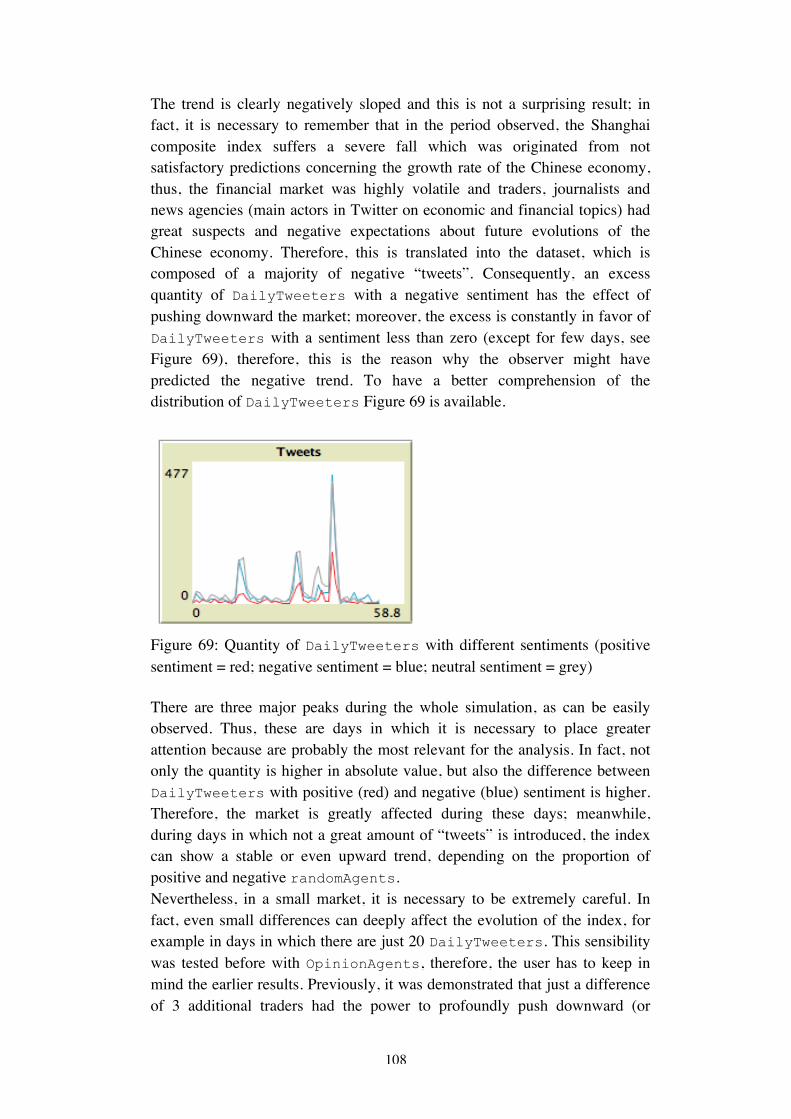
108
The trend is clearly negatively sloped and this is not a surprising result; in fact, it is necessary to remember that in the period observed, the Shanghai composite index suffers a severe fall which was originated from not satisfactory predictions concerning the growth rate of the Chinese economy, thus, the financial market was highly volatile and traders, journalists and news agencies (main actors in Twitter on economic and financial topics) had great suspects and negative expectations about future evolutions of the Chinese economy. Therefore, this is translated into the dataset, which is composed of a majority of negative “tweets”. Consequently, an excess quantity of DailyTweeters with a negative sentiment has the effect of pushing downward the market; moreover, the excess is constantly in favor of DailyTweeters with a sentiment less than zero (except for few days, see Figure 69), therefore, this is the reason why the observer might have predicted the negative trend. To have a better comprehension of the distribution of DailyTweeters Figure 69 is available.
Figure 69: Quantity of DailyTweeters with different sentiments (positive sentiment = red; negative sentiment = blue; neutral sentiment = grey) There are three major peaks during the whole simulation, as can be easily observed. Thus, these are days in which it is necessary to place greater attention because are probably the most relevant for the analysis. In fact, not only the quantity is higher in absolute value, but also the difference between DailyTweeters with positive (red) and negative (blue) sentiment is higher. Therefore, the market is greatly affected during these days; meanwhile, during days in which not a great amount of “tweets” is introduced, the index can show a stable or even upward trend, depending on the proportion of positive and negative randomAgents. Nevertheless, in a small market, it is necessary to be extremely careful. In fact, even small differences can deeply affect the evolution of the index, for example in days in which there are just 20 DailyTweeters. This sensibility was tested before with OpinionAgents, therefore, the user has to keep in mind the earlier results. Previously, it was demonstrated that just a difference of 3 additional traders had the power to profoundly push downward (or
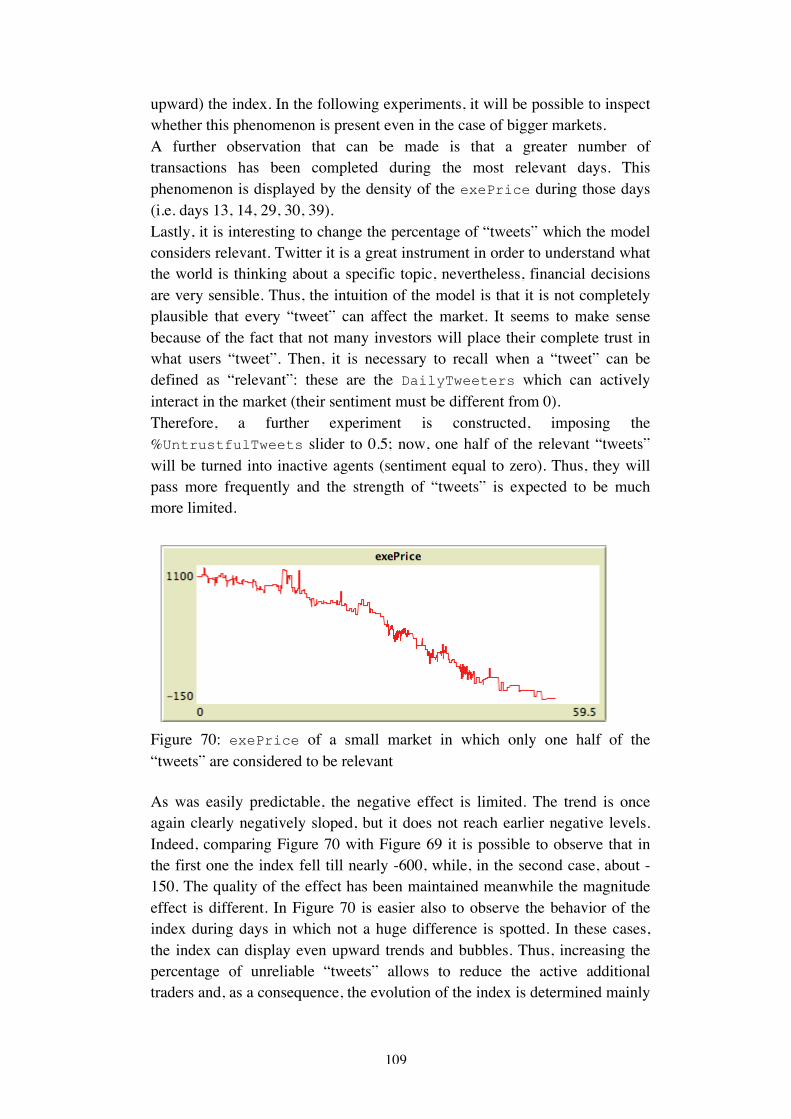
109
upward) the index. In the following experiments, it will be possible to inspect whether this phenomenon is present even in the case of bigger markets. A further observation that can be made is that a greater number of transactions has been completed during the most relevant days. This phenomenon is displayed by the density of the exePrice during those days (i.e. days 13, 14, 29, 30, 39). Lastly, it is interesting to change the percentage of “tweets” which the model considers relevant. Twitter it is a great instrument in order to understand what the world is thinking about a specific topic, nevertheless, financial decisions are very sensible. Thus, the intuition of the model is that it is not completely plausible that every “tweet” can affect the market. It seems to make sense because of the fact that not many investors will place their complete trust in what users “tweet”. Then, it is necessary to recall when a “tweet” can be defined as “relevant”: these are the DailyTweeters which can actively interact in the market (their sentiment must be different from 0). Therefore, a further experiment is constructed, imposing the %UntrustfulTweets slider to 0.5; now, one half of the relevant “tweets” will be turned into inactive agents (sentiment equal to zero). Thus, they will pass more frequently and the strength of “tweets” is expected to be much more limited.
Figure 70: exePrice of a small market in which only one half of the “tweets” are considered to be relevant As was easily predictable, the negative effect is limited. The trend is once again clearly negatively sloped, but it does not reach earlier negative levels. Indeed, comparing Figure 70 with Figure 69 it is possible to observe that in the first one the index fell till nearly -600, while, in the second case, about -150. The quality of the effect has been maintained meanwhile the magnitude effect is different. In Figure 70 is easier also to observe the behavior of the index during days in which not a huge difference is spotted. In these cases, the index can display even upward trends and bubbles. Thus, increasing the percentage of unreliable “tweets” allows to reduce the active additional traders and, as a consequence, the evolution of the index is determined mainly
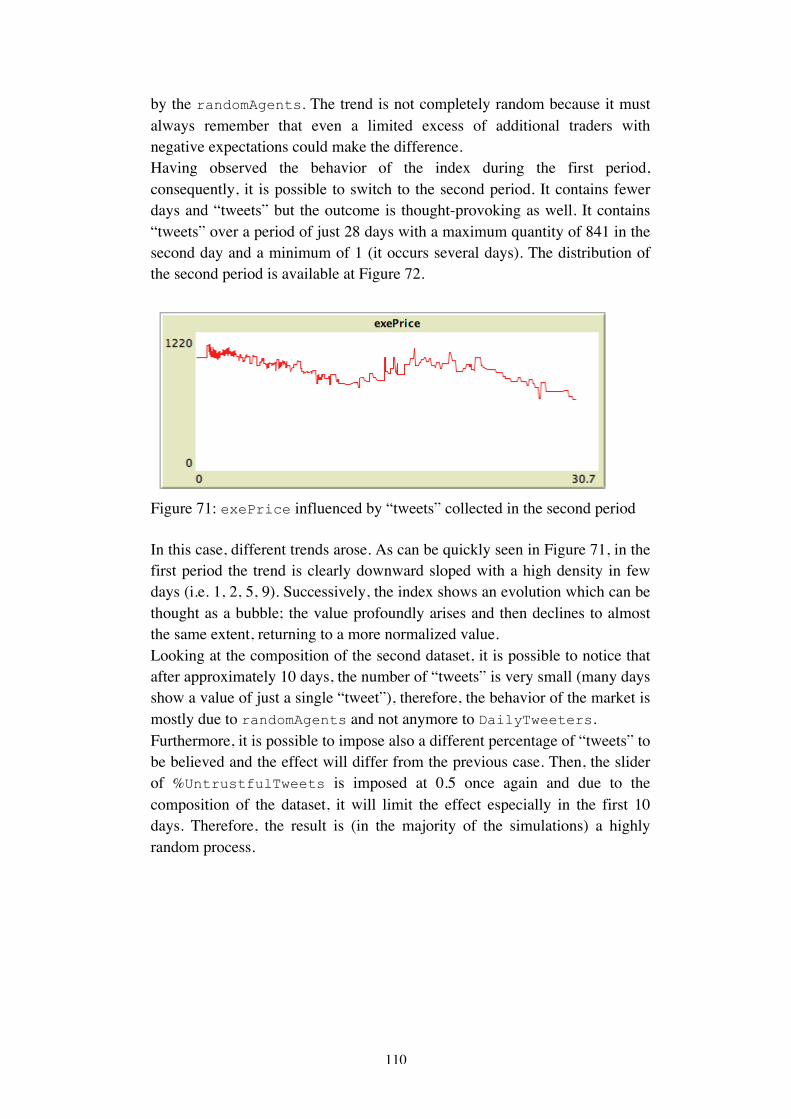
110
by the randomAgents. The trend is not completely random because it must always remember that even a limited excess of additional traders with negative expectations could make the difference. Having observed the behavior of the index during the first period, consequently, it is possible to switch to the second period. It contains fewer days and “tweets” but the outcome is thought-provoking as well. It contains “tweets” over a period of just 28 days with a maximum quantity of 841 in the second day and a minimum of 1 (it occurs several days). The distribution of the second period is available at Figure 72.
Figure 71: exePrice influenced by “tweets” collected in the second period In this case, different trends arose. As can be quickly seen in Figure 71, in the first period the trend is clearly downward sloped with a high density in few days (i.e. 1, 2, 5, 9). Successively, the index shows an evolution which can be thought as a bubble; the value profoundly arises and then declines to almost the same extent, returning to a more normalized value. Looking at the composition of the second dataset, it is possible to notice that after approximately 10 days, the number of “tweets” is very small (many days show a value of just a single “tweet”), therefore, the behavior of the market is mostly due to randomAgents and not anymore to DailyTweeters. Furthermore, it is possible to impose also a different percentage of “tweets” to be believed and the effect will differ from the previous case. Then, the slider of %UntrustfulTweets is imposed at 0.5 once again and due to the composition of the dataset, it will limit the effect especially in the first 10 days. Therefore, the result is (in the majority of the simulations) a highly random process.
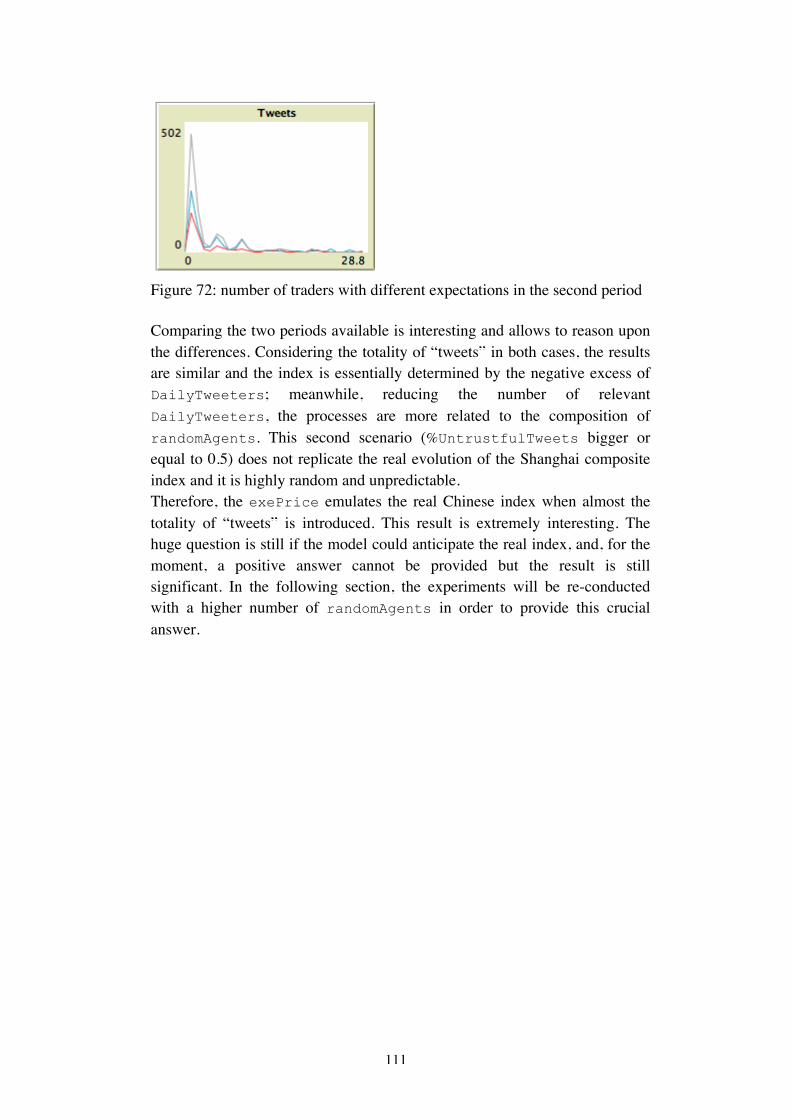
111
Figure 72: number of traders with different expectations in the second period Comparing the two periods available is interesting and allows to reason upon the differences. Considering the totality of “tweets” in both cases, the results are similar and the index is essentially determined by the negative excess of DailyTweeters; meanwhile, reducing the number of relevant DailyTweeters, the processes are more related to the composition of randomAgents. This second scenario (%UntrustfulTweets bigger or equal to 0.5) does not replicate the real evolution of the Shanghai composite index and it is highly random and unpredictable. Therefore, the exePrice emulates the real Chinese index when almost the totality of “tweets” is introduced. This result is extremely interesting. The huge question is still if the model could anticipate the real index, and, for the moment, a positive answer cannot be provided but the result is still significant. In the following section, the experiments will be re-conducted with a higher number of randomAgents in order to provide this crucial answer.
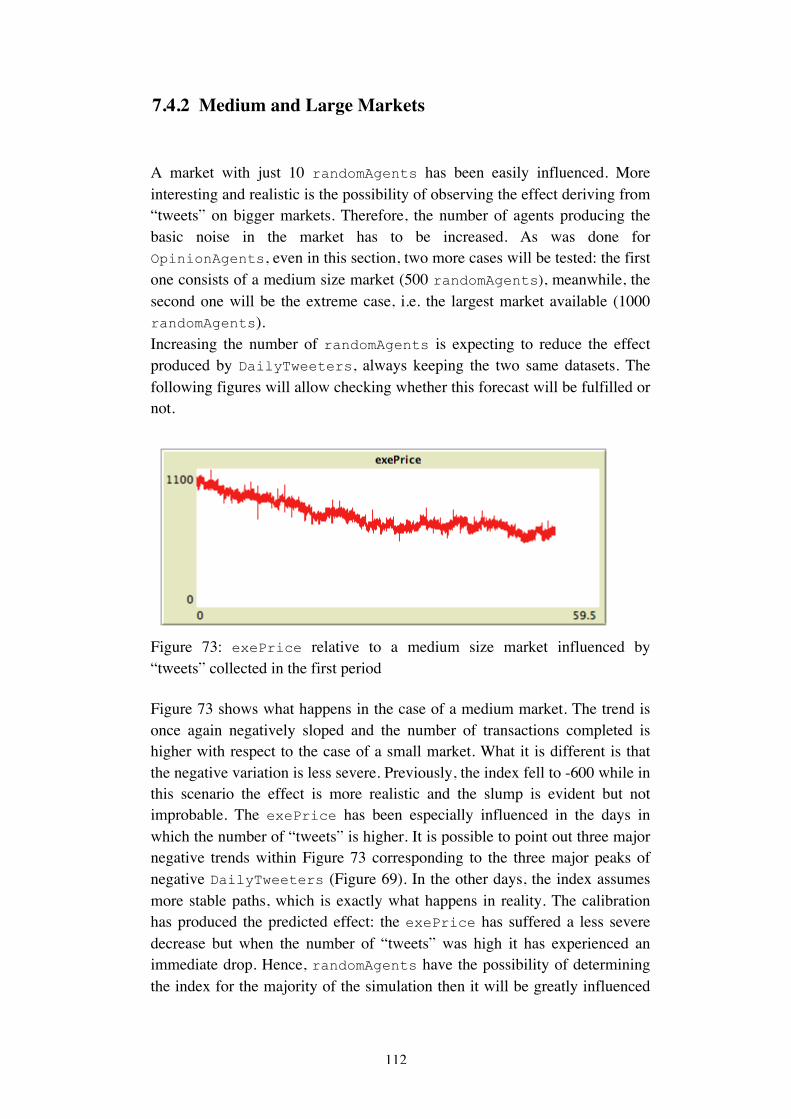
112
7.4.2 Medium and Large Markets A market with just 10 randomAgents has been easily influenced. More interesting and realistic is the possibility of observing the effect deriving from “tweets” on bigger markets. Therefore, the number of agents producing the basic noise in the market has to be increased. As was done for OpinionAgents, even in this section, two more cases will be tested: the first one consists of a medium size market (500 randomAgents), meanwhile, the second one will be the extreme case, i.e. the largest market available (1000 randomAgents). Increasing the number of randomAgents is expecting to reduce the effect produced by DailyTweeters, always keeping the two same datasets. The following figures will allow checking whether this forecast will be fulfilled or not.
Figure 73: exePrice relative to a medium size market influenced by “tweets” collected in the first period Figure 73 shows what happens in the case of a medium market. The trend is once again negatively sloped and the number of transactions completed is higher with respect to the case of a small market. What it is different is that the negative variation is less severe. Previously, the index fell to -600 while in this scenario the effect is more realistic and the slump is evident but not improbable. The exePrice has been especially influenced in the days in which the number of “tweets” is higher. It is possible to point out three major negative trends within Figure 73 corresponding to the three major peaks of negative DailyTweeters (Figure 69). In the other days, the index assumes more stable paths, which is exactly what happens in reality. The calibration has produced the predicted effect: the exePrice has suffered a less severe decrease but when the number of “tweets” was high it has experienced an immediate drop. Hence, randomAgents have the possibility of determining the index for the majority of the simulation then it will be greatly influenced

113
by the additional traders in the most relevant days, which is exactly the desired result. In order to have a quick comparison, the second case has been immediately tested. Figure 74 shows the effect on a larger market (1000 randomAgents).
Figure 74: exePrice relative to a large size market influenced by “tweets” collected in the first period As Figure 74 shows, the negative push is strongly reduced and the effect is emphasized: few days (i.e. the most relevant) have the strength to influence the market. In fact, it is possible to notice again three negative bends, but some positive peaks are also observable. At the end of the simulation the index has lost nearly 15% of its initial value, but the trend is decreasing is just some days and also some appreciations can be observed. This result was easily predictable from the previous section: increasing to 1000 randomAgents it is necessary a difference of more than 100 agents to influence the market and it can be observed only on the relevant days. Comparing these two results it is possible to underline the effect of the calibration and, furthermore, recalling the decrease of the real Shanghai composite index, the medium market case seems to produce the most reliable outcome with a comparable decrease (23%) and a similar path. The user will have to decide again the correct percentage of “tweets” which will be believed. Clearly, increasing this level will reduce the effect, switching from a market with an influenced negative trend to a random process, as pointed out previously. Believing to the whole dataset of “tweets” will be unrealistic because it will imply that Twitter will cause a major effect on the market, i.e. every “tweet” corresponds to an actual financial operation (selling or buying). Therefore, it is more prudent to impose a percentage in between the two extremes (0.25, 0.5 or 0.75). In fact, also imposing 100% of UnTrustfulTweets will have little effect because it will recreate a completely random market.

114
Nevertheless, it will be the user to decide accordingly to its beliefs the percentage, but he has to keep in mind that the more realistic would be the set up, the more realistic will be the outcome. For the sake of completeness, also the second dataset of “tweets” will be tested in a medium and a large market.
Figures 75-76: exePrice relative to a medium and large size markets influenced by “tweets” collected in the second period The second period is characterized by a relevant number of “tweets” only in the first 10 days, which is confirmed in Figures 75-76. In the first part of the graph, the trend is negative even though the fall is not particularly severe then it assumes a more random path; the trend can be observed more easily in the case of a medium market because in the large market case the “tweets” provided are not sufficient to push the index deeply downward (not even in the first 10). Especially in this scenario imposing a high percentage of UnTrustfulTweets will offset almost completely the effect of DailyTweeters.
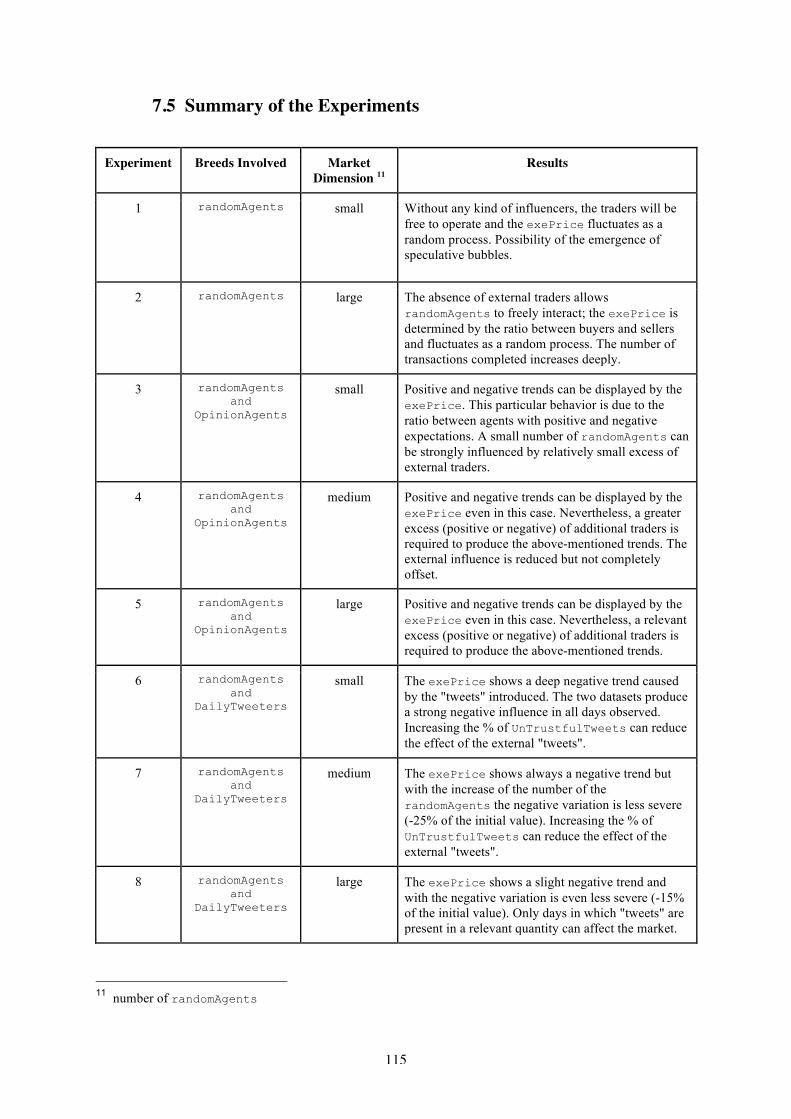
115
7.5 Summary of the Experiments
Experiment Breeds Involved Market Dimension 11
Results
1 randomAgents small Without any kind of influencers, the traders will be free to operate and the exePrice fluctuates as a random process. Possibility of the emergence of speculative bubbles.
2 randomAgents large The absence of external traders allows randomAgents to freely interact; the exePrice is determined by the ratio between buyers and sellers and fluctuates as a random process. The number of transactions completed increases deeply.
3 randomAgents and
OpinionAgents
small Positive and negative trends can be displayed by the exePrice. This particular behavior is due to the ratio between agents with positive and negative expectations. A small number of randomAgents can be strongly influenced by relatively small excess of external traders.
4 randomAgents and
OpinionAgents
medium Positive and negative trends can be displayed by the exePrice even in this case. Nevertheless, a greater excess (positive or negative) of additional traders is required to produce the above-mentioned trends. The external influence is reduced but not completely offset.
5 randomAgents and
OpinionAgents
large Positive and negative trends can be displayed by the exePrice even in this case. Nevertheless, a relevant excess (positive or negative) of additional traders is required to produce the above-mentioned trends.
6 randomAgents and
DailyTweeters
small The exePrice shows a deep negative trend caused by the "tweets" introduced. The two datasets produce a strong negative influence in all days observed. Increasing the % of UnTrustfulTweets can reduce the effect of the external "tweets".
7 randomAgents and
DailyTweeters
medium The exePrice shows always a negative trend but with the increase of the number of the randomAgents the negative variation is less severe (-25% of the initial value). Increasing the % of UnTrustfulTweets can reduce the effect of the external "tweets".
8 randomAgents and
DailyTweeters
large The exePrice shows a slight negative trend and with the negative variation is even less severe (-15% of the initial value). Only days in which "tweets" are present in a relevant quantity can affect the market.
11 number of randomAgents

116
7.6 Results and discussions The main message of the simulations is that reality can interact with a market of random traders. Thus, it confirms the potentiality of Twitter and it allows to conclude the discussion trying to inspect the difference between correlation and causation. These two concepts will be developed in-depth below, then some concluding remarks and some suggestions for future works will be provided.
7.6.1 Potentiality of Twitter The crucial part of the whole analysis was to understand whether real Twitter data could interact with a market composed of random agents. Thus, a market and many experiments (see Summary of the Experiments) were analyzed with the aim of understanding the potentiality of real “tweets”. The intuition was to test initially a complete random market, then, adding external traders in order to understand how much the model was sensible; this process has required many experimentations, which have provided the necessary awareness in order to proceed to the main point of the analysis which is the introduction of “tweets”. Hence, it has been discovered that the model’s sensibility is strictly related to the number of basic random traders (randomAgents). Consequently, it was possible to observe the behavior of the market when the Twitter datasets have been introduced. The index of the market showed a negative trend in all the simulations but the more satisfactory results have been obtained in the cases of medium market; in this circumstance, the exePrice showed an evolution similar to the real Shanghai composite index. Moreover, it was observed that a significant role was played by the days in which the presence of “tweets” was more substantial. Therefore, the results are encouraging and they have shown how an uncommon source (as social network posts) could turn into interesting pieces of information even in a sensible topic as the financial one. Thus, these thought-provoking results allow making some considerations over Twitter data. Millions of “tweets” are produced every second and organized through hashtags, therefore, the possibility of having a quick understanding of how millions of users are discussing or expressing opinions on a specific topic could be a huge source of information. Clearly some of the “tweets” are completely unreliable and imprudently created by the users and this could represent a problem in thorny topics, as economic news. Hence, “tweets” do
117
not provide a biased free source of information but the numbers are enormous, therefore, it is necessary to be careful before discard them. As the actual work suggests, the sentiment analysis has produced a sufficiently useful dataset of “tweets” which has replicated the overall evolution of the Shanghai index. A further step can be made imaging what results can provide a greater and better interpreted (more sophisticated sentiment analysis) dataset; this is just an example and, later, will be extensively discussed but it suggests clearly which could be the potentialities of this kind of data.
7.6.2 Correlation is not causation The latest part of the previous discussion has to be examined more extensively because it starts from a well-known principle which is evolving during the last years. Almost every person, which has taken at least an introductory course at statistics, has heard the principle that “correlation does not imply causation”. Regression analysis has gained importance during the years because it can provide reliable results, which have helped in the explanation of many topics in many fields. Hence, every reliable researcher has selected accurately the variables, which needs to be correlated, and he has tried to specify better the statistical model and to improve its dataset and samples. The main goal has always been the continuous research of the perfect correlation and many interesting results have been obtained. But in order to obtain trustworthy regressions a huge amount of time has to be dissipated; it is necessary to clean and select the sample to avoid the presence of potential bias and this operation has the effect of reducing the amount of information available. Therefore, the regression analysis has produced and can produce great results but a trade off has to be considered. On one side there is the research of perfection with cleaned and limited samples, which is extremely time consuming, while, on the other side, there is correlation analysis using a bigger amount of data. In fact, the world is changing and the amount of data available is increasing every day, thus there are exabytes of information which can be used, as suggested by Mayer-Schönberger and Cukier (2013):
Though it may seem counterintuitive at first, treating data as something imperfect and imprecise let us make superior forecasts, and thus understand our world better.

118
Twitter provides this kind of information in huge quantities every single day. It was not created as aggregator of financial news and opinions but even with its bias and spammers it could suggest great insights. Again Mayer-Schönberger and Cukier (2013) have tried to explain this phenomenon:
There was a shift in mindset about how data could be used. Data was no longer regarded as static or stale, whose usefulness was finished once the purpose for which it was collected was achieved, such as after the plane landed (or in Google’s case, once a search query had been processed). Rather, data became a raw material of business, a vital economic input, used to create a new form of economic value. In fact, with the right mindset, data can be cleverly reused to became a fountain of innovation and new services. The data can reveal secrets to those with the humility, the willingness, and the tools to listen.
Therefore, Twitter data and the corresponding sentiment analysis are a representation of this shift in mentality. Not being obsessed with why something is happening but more with what is happening. The datasets of “tweets” can produce great intuitions and having added to this result the possibility of introducing them in an agent-based simulation model could increase even more their value. Running various experiments allows understanding the general behavior and influence of this kind of data in a simulated market. Therefore, it is preferred to spend the time saved in the determination of the regression into the analysis of the results because at the end of the process, understanding the big picture is what really matter.
And we may tolerate blurriness and ambiguity in areas where we used to demand clarity and certainty, even if it had been a false clarity and an imperfect certainty. We may accept this provided that in return we get a more complete sense of reality - the equivalent of an impressionist painting, wherein each stroke is messy when examined up close, but by stepping back one can see a majestic picture. (Mayer-Schönberger and Cukier, 2013)
It does not mean totally unreliable models but the amount of data will compensate the partial lack of accuracy. In the case of the actual work, the question remains whether is the market to influence the media (“tweets”) or the opposite. Hence, at the end understanding whether there is causation or not and it requires time and discussions. The answer remains complex as well but a change in the perspective may help in better comprehend not univocal concepts. The model is far from being completed and further extensions are necessary to improve also the quality of the results; these improvements will be better specified in the next section but what can be said is that the user needs to

119
always keep in mind the basic concepts of correlation and causation within this model.

120
7.7 Suggestions for further research and extensions Further extensions can deeply improve the model in the two main objects: the market and the “tweets”. Introducing more variables will enhance the trader’s decision-making process and it would increase the complexity of the market, reducing randomness. Moreover, in order to have a more reliable model, agents would need the ability to learn from the general evolution of the index, their behavior and their mistakes. Therefore, the model would learn constantly and it would generate more realistic results. Having a more realistic market is crucial in order to evaluate correctly the introduction of external traders. RandomAgents could be more independent and able to adjust their decisions depending on the trend of the market and the presence of external traders. Consequently, it will be easier to evaluate how much “tweets” can affect and predict the market. Additionally, the two datasets obtained can be improved in terms of quality and quantity; thus, allows the model to have a bigger dataset with a better-specified sentiment variable could help in reducing the number of unreliable “tweets” and longer simulations. Consequently, the challenge will be represented by the choice of hashtags to be analyzed. The hashtag “#ChinaMeltDown” is valuable for the Chinese market and has been created just for this specific crisis more difficult would be to find precise hashtags on other financial phenomena. The collection of “tweets” will always be more prolific in the case of events, which will capture major attention by the public. Harder would have been to collect constantly an elevated number of “tweets” for every state or financial asset in the world. Thus, the research of “tweets” would not probably have to be limited to hashtags but proceeds with keywords. More difficult but very interesting would be represented by the possibility of a real-time stream of “tweets”, which could produce valuable results in order to predict the future evolution of the index, reducing the lags of delay. In general, Twitter and any social network to different extents could provide additional information, which could always represent a precious boost in a sensitive topic like financial decisions. Therefore, it would be also a possibility the choice of a different social network or website. This thesis could represent an initial hint of how Twitter data could be used and further developments could be beneficial in order to extend the actual work. The experiments section has shown that the model could reproduce outcomes similar to the reality. Therefore, observing how real pieces of information could influence the simulated market could provide useful results

121
also in reality, remembering that the ideal case would be the ability to predict the trend of the index analyzed. Nevertheless, the possible extensions are numerous which means that much more work has to be done.

122
Conclusions After the introduction, in the second section of the actual work, the reader has understood the different tools and methods, which could help policy-makers in the future. The discussion started with a quick presentation of the FuturICT project, which aimed to provide better instruments for the analysis and the management of critical situations using the rapidly expanding capacity of the IT sector. The main idea suggested by the project was that monitoring using new technologies and tools will allow what-if analysis, scenario evaluation and experiments; therefore, agent-based simulation, behavioral economics, data-mining and social networks analysis represented the starting points of this renovation process; these fields and techniques have been briefly presented along with a comparison with well-known and already used instruments, then, special attention was placed on two of the main examples of artificial stock markets: Santa Fe Institute and Genoa models. The first one represents an institution in the field of artificial stock markets and its main characteristics and features have been presented both from a technical perspective with genetic algorithms and classifiers and mainly from a conceptual perspective; consequently, Rational Expectations approach have been compared to the Evolutionary approach. Then, the second artificial stock market have been introduced with a brief overview of its main characteristics.
Section 3 presents how the data has been collected. Initially, it began with a discussion on the challenges, which the actual disposal of data provided: how companies, governments and institutions have changed the necessary instruments and their perspective in order to cope with Exabytes of data (mainly unstructured) collected daily. Then, the actual procedure for the collection of Twitter data has been presented from a technical perspective: first the authentication process, then, APIs and OAuth were introduced; hence, a better comprehension of these details helped the reader to understand the basics and the necessary steps required in order to obtain “tweets”. Consequently, a deep discussion has been presented on the limits of data protection, which specifically Twitter furnished. Especially privacy issues needed to be underlined: therefore, some studies allowed to inspect deanonymization and informed consent, which were concepts that the reader needed to be aware of. Finally, the collection has been completed with three different approaches through three different softwares: R, Tags by Martin Hawksey and the website Followthehashtag.com. They all displayed strengths and weaknesses but they represent valuable alternatives.

123
Section 4 focused on the sentiment analysis, which has been a crucial step in the actual work. Before proceeding to the results some studies and researches were presented; this field is relatively recent but has already produced interesting results, therefore, some of them were presented in order to have a quick overview of some of the most used techniques. Machine Learning, Natural Language Processing and Information Retrieval have been mandatory concepts, which represent the foundations of all the sentiment analyses. Then, the principal types of analysis were discussed and evaluated. An example was Polarity classification, which has allowed dividing the “tweets” into positive and negative depending on the presence and frequency of specific words; this approach guarantees satisfying results even though it presented also some weaknesses, which will need further implementations. More examples were overviewed as alternatives like classification through categories, like distinguishing between different feelings or political orientation. Hence, having a wider and more complete awareness of sentiment analysis, it was possible to discuss qualities and deficiencies. Finally, a sentiment analysis has been actually produced using R on the dataset of “tweets” collected using the hashtag “#ChinaMeltDown”. Section 5 introduced an overview of the model presenting the main features, which will have been extensively analyzed in the following section. Thus, it began with a presentation of the basic intuition of the model: the interaction within an artificial stock market of agents, which acted mainly randomly, and additional agents, which were introduced with the aim of affecting the outcome of the market. Clearly, the most relevant breed was the one derived from real “tweets” and the sentiment analysis. Thus, the basic interface of the model was shown in a figure. Section six proceeded the presentation of the model, it explained the main variables and how the principal agents were constructed. Hence, the code was broken down into pieces in order to allow an accurate description of functions and methods, then, a crucial step was to observe how agents would have interacted in the model. Therefore, the index of the market was defined using a simple bid and ask mechanism, which has been explained in details using examples for a better comprehension. Finally, section 7 has presented the experiments, which have helped the reader to understand how changing the composition and the proportion of the agents involved in the market could have affected the outcome. Firstly, a market composed of only agents, which acted randomly, was tested and the results showed unpredictable trends. Therefore, this first part was used as the basic ingredient for future comparisons. In fact, the model allowed introducing additional traders in order to understand to which extent and whether they would have had the strength to affect the market. The first breed consisted of buyers and sellers, which have been introduced in different

124
quantities and different proportion; the results have highlighted the possibility of deeply affecting the index, thus, showing a general high sensibility of the model. Then, the “tweets” have been added using two datasets, collected in two separated periods. With Twitter data was possible to test whether the addition could influence the market similarly to reality, which was the crucial aspect of the whole thesis. Indeed, different markets in terms of quantity of basic agents have been tested in order to observe how the model react. Finally concluding remarks and discussions allowed to stress interesting and critical points.
Further Developments The research is highly limited right from the beginning, in fact, it is necessary to remember that has not been possible to collect the totality of “tweets” relative to the hashtag “#ChinaMeltDown”. Hence, when the fundamental sample is strongly limited, in this case by Twitter’s policies, it is clear that the outcome produced will be limited as well. Thus, further developments have to start right from the first step of the actual work, which was the data collection. Trying to avoid these critical limits will improve the overall quality of the work, therefore, it will be necessary to find out how to proceed. As mentioned in previous sections, Twitter considers its data the most precious among its sources and mainly one of its biggest assets, hence, it is almost inevitable to buy them directly from the social network. The actual work has been conducted without any funds, which has allowed and forced to explore every alternative, but it has not had the possibility to completely overcome these practical limits. Maybe in the future, Twitter datasets will be more easily available and this will improve similar researches. Moreover, also the sentiment analysis part could be enhanced, in fact, more recent and efficient algorithms could have produced a better polarization. The ones used in the actual work have suggested an example in order to understand how to extract the sentiment inside each “tweet” and it represents already a precious approximation but the field is continuing evolving, thus, in the recent future, it will be possible to produce further extensions. Furthermore, the artificial stock market should be improved even more, possibly introducing the evolutionary approach presented in section 2; this improvement will make the model more reactive and able to produce more realistic scenarios. Considering all these restrictions, it is possible to correctly evaluate the actual thesis but more importantly, it gives the opportunity to evaluate new and future developments. Having complete Twitter data and more efficient algorithms will allow introducing better datasets into the simulation model, therefore, it will be more straightforward to understand whether these additional pieces of information could provide a better comprehension of past evolutions of the stock market or alternatively better predictions. Thus, it is highly probable that in the future more of similar works will be conducted and hopefully they will complete the analysis and produce relevant results

125
References
Akerlof, G. A., & Shiller, R. J. (2010). Animal spirits: How human psychology drives the economy, and why it matters for global capitalism. Princeton University Press. Arrow, K. J., & Debreu, G. (1954). Existence of an equilibrium for a competitive economy. Econometrica: Journal of the Econometric Society, 265-290.
Cogburn, D. L., & Espinoza-Vasquez, F. K. (2011). From networked nominee to networked nation: Examining the impact of Web 2.0 and social media on political participation and civic engagement in the 2008 Obama campaign. Journal of Political Marketing, 10(1-2), 189-213.
Cukier, K., & Mayer-Schoenberger, V. (2013). Rise of Big Data: How it's Changing the Way We Think about the World, The. Foreign Aff., 92, 28.
Einav, L., & Levin, J. D. (2013). The data revolution and economic analysis (No. w19035). National Bureau of Economic Research.
Farmer, J. D., Gallegati, M., Hommes, C., Kirman, A., Ormerod, P., Cincotti, S., Sanchez, A., & Helbing, D. (2012). A complex systems approach to constructing bettter models for managing financial markets and the economy. The European Physical Journal Special Topics, 214(1), 295-324. Geanakoplos, J., Axtell, R., Farmer, D. J., Howitt, P., Conlee, B., Goldstein, J., Masad, D., Carella, E., Hendrey, M., Howitt, P., Kalikman, P., & Yang, C. Y. (2012). Getting at systemic risk via an agent-based model of the housing market. The American Economic Review, 102(3), 53-58.
Gentry, J. (2014). twitteR: R based Twitter client. R package version 0.99, 19.
Gesualdo, F., Stilo, G., D’Ambrosio, A., Carloni, E., Pandolfi, E., Velardi, P., & Tozzi, A. E. (2015). Can Twitter Be a Source of Information on Allergy? Correlation of Pollen Counts with Tweets Reporting Symptoms of Allergic Rhinoconjunctivitis and Names of Antihistamine Drugs. PloS one, 10(7), e0133706. Johnson, P. E. (2002). Agent-Based Modeling What I Learned From the Artificial Stock Market. Social Science Computer Review, 20(2), 174-186.
126
Krugman, Paul. “When China stumbles” International New York Times 9 January 2016
Lewis, K., Kaufman, J., Gonzalez, M., Wimmer, A. & Christakis, N. (2008) Tastes, ties, and time: a new social network dataset using Facebook.com, Social Networks, vol. 30, no. 4, pp. 330–342.
Machanavajjhala, A., Gehrke, J., Kifer, D., & Venkitasubramaniam, M. (2006) L-diversity: Privacy beyond k-anonymity. In Proceedings of the 22nd IEEE International Conference on Data Engineering (ICDE’06), Washington, DC, USA, 2006. IEEE Computer Society.
Mao, Y., Wei, W., Wang, B., & Liu, B. (2012). Correlating S&P 500 stocks with Twitter data. In Proceedings of the First ACM International Workshop on Hot Topics on Interdisciplinary Social Networks Research (pp. 69-72). ACM. Marchesi, M., Cincotti, S., Focardi, S. M., & Raberto, M. (2003). The genoa artificial stock market: Microstructure and simulations. In Heterogenous Agents, Interactions and Economic Performance (pp. 277-289). Springer Berlin Heidelberg. Pak, A., & Paroubek, P. (2010). Twitter as a Corpus for Sentiment Analysis and Opinion Mining. In LREC (Vol. 10, pp. 1320-1326). Palmer, R. G., Arthur, W. B., Holland, J. H., LeBaron, B., & Tayler, P. (1994). Artificial economic life: a simple model of a stockmarket. Physica D: Nonlinear Phenomena, 75(1), 264-274. Pang, B., & Lee, L. (2008). Opinion mining and sentiment analysis. Foundations and trends in information retrieval, 2(1-2), 1-135. Walras, L. (1898). Études d'économie politique appliquée:(Théorie de la production de la richesse sociale). F. Rouge.
Xiao, X., & Tao, Y. (2006) Personalized privacy preservation. In Proceedings of the 2006 ACM SIGMOD international conference on Management of data (SIG- MOD’06), pages 229–240, New York, NY, USA, 2006. ACM Press.
Yu, H., & Hatzivassiloglou, V. (2003). Towards answering opinion questions: Separating facts from opinions and identifying the polarity of opinion sentences. In Proceedings of the 2003 conference on Empirical

127
methods in natural language processing (pp. 129-136). Association for Computational Linguistics. Zhou, B., Pei, J., & Luk, W. (2008). A brief survey on anonymization techniques for privacy preserving publishing of social network data. ACM SIGKDD Explorations Newsletter, 10(2), 12-22.
Zimmer, M. (2008) More on the “Anonymity” of the Facebook dataset – it’s Harvard College, MichaelZimmer.org Blog, URL http://www.michaelzimmer.org/2008/01/03/more-on-the-anonymity-of-the-face book-dataset-its-harvard-college
Zwitter, A. (2014). Big data ethics. Big Data & Society, 1(2), 2053951714559253.
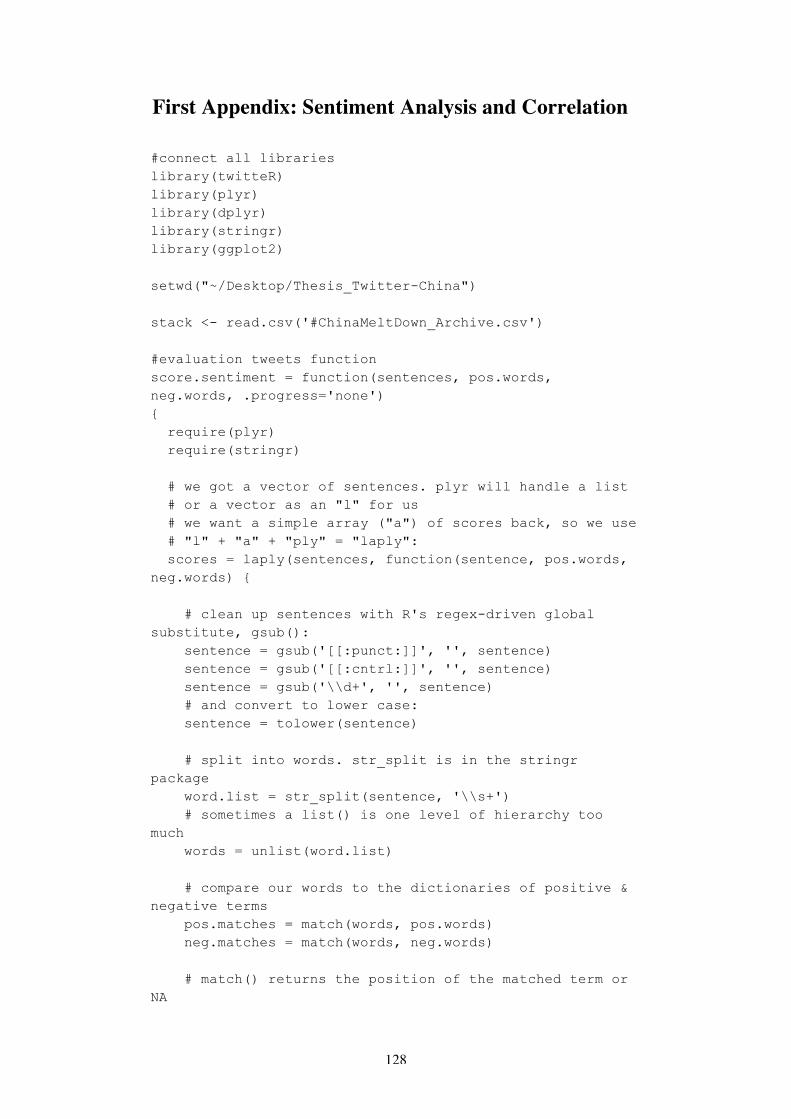
128
First Appendix: Sentiment Analysis and Correlation #connect all libraries library(twitteR) library(plyr) library(dplyr) library(stringr) library(ggplot2) setwd("~/Desktop/Thesis_Twitter-China") stack <- read.csv('#ChinaMeltDown_Archive.csv') #evaluation tweets function score.sentiment = function(sentences, pos.words, neg.words, .progress='none') { require(plyr) require(stringr) # we got a vector of sentences. plyr will handle a list # or a vector as an "l" for us # we want a simple array ("a") of scores back, so we use # "l" + "a" + "ply" = "laply": scores = laply(sentences, function(sentence, pos.words, neg.words) { # clean up sentences with R's regex-driven global substitute, gsub(): sentence = gsub('[[:punct:]]', '', sentence) sentence = gsub('[[:cntrl:]]', '', sentence) sentence = gsub('\\d+', '', sentence) # and convert to lower case: sentence = tolower(sentence) # split into words. str_split is in the stringr package word.list = str_split(sentence, '\\s+') # sometimes a list() is one level of hierarchy too much words = unlist(word.list) # compare our words to the dictionaries of positive & negative terms pos.matches = match(words, pos.words) neg.matches = match(words, neg.words) # match() returns the position of the matched term or NA

129
# we just want a TRUE/FALSE: pos.matches = !is.na(pos.matches) neg.matches = !is.na(neg.matches) # and conveniently enough, TRUE/FALSE will be treated as 1/0 by sum(): score = sum(pos.matches) - sum(neg.matches) return(score) }, pos.words, neg.words, .progress=.progress ) scores.df = data.frame(score=scores, text=sentences) return(scores.df) } pos = scan('/Users/stefanopozzati/Desktop/Thesis_Twitter-China/positive-words.txt', what='character', comment.char=';') neg = scan('/Users/stefanopozzati/Desktop/Thesis_Twitter-China/negative-words.txt', what='character', comment.char=';') pos.words <- c(pos, 'encouraging') neg.words <- c(neg, 'limits', 'worst', 'scary', 'recession', 'imploding', 'doesnt', 'dont', 'negative') Dataset <- stack Dataset$text <- as.factor(Dataset$Tweet.content) scores <- score.sentiment(Dataset$text, pos.words, neg.words, .progress='text') #total evaluation: positive / negative / neutral stat <- scores stat$created <- stack$Date stat$created <- as.Date(stat$created) stat <- mutate(stat, tweet=ifelse(stat$score > 0, 'positive', ifelse(stat$score < 0, 'negative', 'neutral'))) by.tweet <- group_by(stat, tweet, created) by.tweet <- summarise(by.tweet, number=n()) #create chart ggplot(by.tweet, aes(created, number)) + geom_line(aes(group=tweet, color=tweet), size=2) + geom_point(aes(group=tweet, color=tweet), size=4) + theme(text = element_text(size=18), axis.text.x = element_text(angle=90, vjust=1)) +

130
stat_summary(fun.y = 'sum', fun.ymin='sum', fun.ymax='sum', colour = 'darkgrey', size=2, geom = 'line') + ggtitle("#ChinaMeltDown") #Shanghai composite index library('ggplot2') SSECindex = read.csv('YAHOO-INDEX_SSEC.csv') stat <- SSECindex stat$created <- stat$Date stat$created <- as.Date(stat$created) #create chart ggplot(stat, aes(created, Close)) + geom_line(size=2, colour = "black") + theme(text = element_text(size=18), axis.text.x = element_text(angle=90, vjust=1)) + ggtitle("Shanghai Composite Index") # create the aggregate dataset to find correlation Aggregate <- read.csv("Aggregate.csv") Aggregate$X = NULL Aggregate$Date = NULL aggregate1 <- na.omit(Aggregate) clip <- aggregate1[2:35, ] DifferenceClose <- data_frame(diff(aggregate1$Close), clip$Date, clip$number) DifferenceClose1 <- DifferenceClose DifferenceClose1$`clip$Date` = NULL # Plotting plot(DifferenceClose$`clip$number`, DifferenceClose$`diff(aggregate1$Close)`, main = "Difference in closing price versus number of tweets", xlab = "number of tweets", ylab = "difference in closing price") # Correlation cor(DifferenceClose1, use="complete.obs", method = "pearson") cor.test(DifferenceClose1$`clip$number`, DifferenceClose1$`diff(aggregate1$Close)`, alternative = "less", method = "pearson", conf.level = 0.95 )
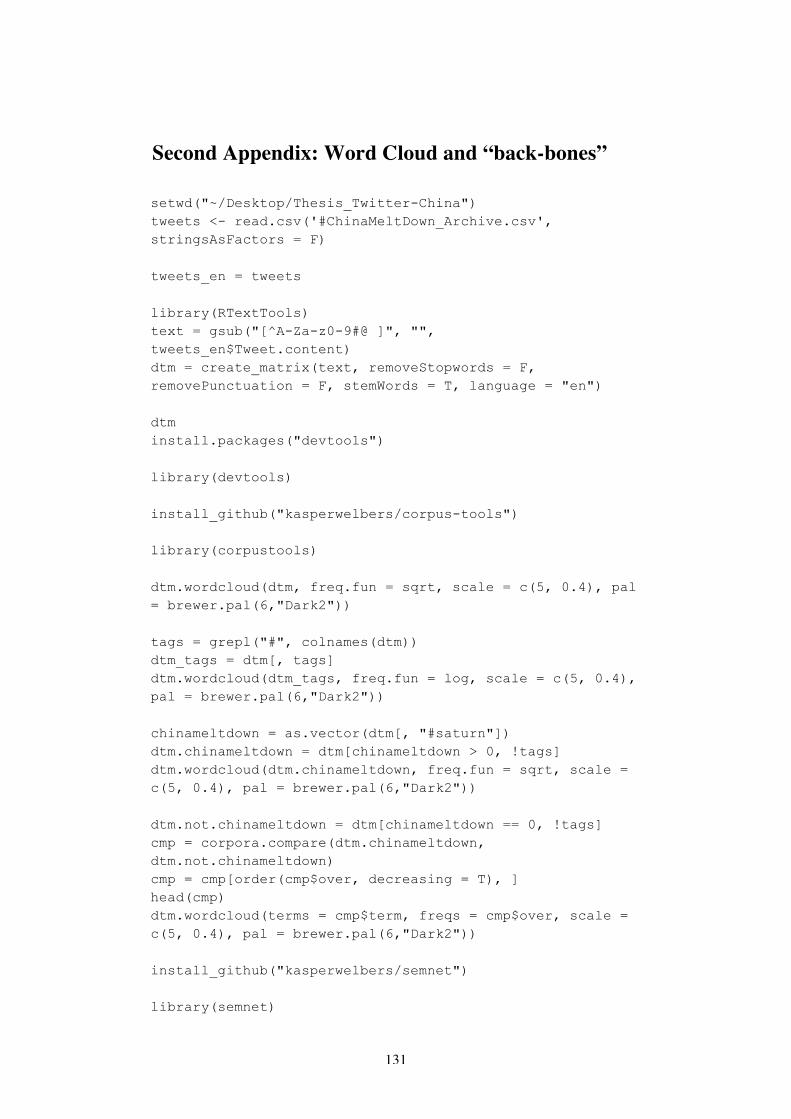
131
Second Appendix: Word Cloud and “back-bones” setwd("~/Desktop/Thesis_Twitter-China") tweets <- read.csv('#ChinaMeltDown_Archive.csv', stringsAsFactors = F) tweets_en = tweets library(RTextTools) text = gsub("[^A-Za-z0-9#@ ]", "", tweets_en$Tweet.content) dtm = create_matrix(text, removeStopwords = F, removePunctuation = F, stemWords = T, language = "en") dtm install.packages("devtools") library(devtools) install_github("kasperwelbers/corpus-tools") library(corpustools) dtm.wordcloud(dtm, freq.fun = sqrt, scale = c(5, 0.4), pal = brewer.pal(6,"Dark2")) tags = grepl("#", colnames(dtm)) dtm_tags = dtm[, tags] dtm.wordcloud(dtm_tags, freq.fun = log, scale = c(5, 0.4), pal = brewer.pal(6,"Dark2")) chinameltdown = as.vector(dtm[, "#saturn"]) dtm.chinameltdown = dtm[chinameltdown > 0, !tags] dtm.wordcloud(dtm.chinameltdown, freq.fun = sqrt, scale = c(5, 0.4), pal = brewer.pal(6,"Dark2")) dtm.not.chinameltdown = dtm[chinameltdown == 0, !tags] cmp = corpora.compare(dtm.chinameltdown, dtm.not.chinameltdown) cmp = cmp[order(cmp$over, decreasing = T), ] head(cmp) dtm.wordcloud(terms = cmp$term, freqs = cmp$over, scale = c(5, 0.4), pal = brewer.pal(6,"Dark2")) install_github("kasperwelbers/semnet") library(semnet)

132
tags = dtm[, grepl("#", colnames(dtm))] g = coOccurenceNetwork(tags) head(sort(betweenness(g), decreasing = T)) head(sort(eigen_centrality(g)$vector, decreasing = T)) sub = delete_edges(g, which(E(g)$weight <= 25)) sub = delete_vertices(sub, V(sub)$name %in% c("#chinameltdown", "#china")) sub = delete_vertices(sub, degree(sub)==0) plot(sub, edge.width = sqrt(E(sub)$weight)/ 5, vertex.size = eigen_centrality(sub)$vector * 20) g2= delete.vertices(g, V(g)$name %in% c("#chinameltdown", "#china")) g_backbone = getBackboneNetwork(g2, alpha = 0.01, max.vertices = 250) vcount(g_backbone); ecount(g_backbone) plot(g_backbone, vertex.size = 0)

133
Third Appendix: Word Cloud with Datumbox.com library(twitteR) library(RCurl) library(RJSONIO) library(stringr) library(tm) library(wordcloud) setwd("~/Desktop/Thesis_Twitter-China") stack <- read.csv('#ChinaMeltDown_Archive.csv', stringsAsFactors = F) Tweets1 <- stack$Tweet.content #################################################################### getSentiment <- function (text, key){ text <- URLencode(text); #save all the spaces, then get rid of the weird characters that break the API, then convert back the URL-encoded spaces. text <- str_replace_all(text, "%20", " "); text <- str_replace_all(text, "%\\d\\d", ""); text <- str_replace_all(text, " ", "%20"); if (str_length(text) > 360){ text <- substr(text, 0, 359); } ########################################## data <- getURL(paste("http://api.datumbox.com/1.0/TwitterSentimentAnalysis.json?api_key=", key, "&text=",text, sep="")) js <- fromJSON(data, asText=TRUE); # get mood probability sentiment = js$output$result ###################################

134
return(list(sentiment=sentiment)) } clean.text <- function(some_txt) { some_txt = gsub("(RT|via)((?:\\b\\W*@\\w+)+)", "", some_txt) some_txt = gsub("@\\w+", "", some_txt) some_txt = gsub("[[:punct:]]", "", some_txt) some_txt = gsub("[[:digit:]]", "", some_txt) some_txt = gsub("http\\w+", "", some_txt) some_txt = gsub("[ \t]{2,}", "", some_txt) some_txt = gsub("^\\s+|\\s+$", "", some_txt) some_txt = gsub("amp", "", some_txt) # define "tolower error handling" function try.tolower = function(x) { y = NA try_error = tryCatch(tolower(x), error=function(e) e) if (!inherits(try_error, "error")) y = tolower(x) return(y) } some_txt = sapply(some_txt, try.tolower) some_txt = some_txt[some_txt != ""] names(some_txt) = NULL return(some_txt) } ########################################################### #Datumbox db_key <- "84af65356767af1f4696f13ac42253e8" print("Getting tweets...") # get some tweets tweets = Tweets1 # get text x['getText()'] tweet_txt = sapply(tweets, function(x) x$getText()) # clean text tweet_clean = clean.text(Tweets1) #tweet_clean = clean.text(tweet_txt) tweet_num = length(tweet_clean)

135
# data frame (text, sentiment) tweet_df = data.frame(text=tweet_clean, sentiment=rep("", tweet_num),stringsAsFactors=FALSE) print("Getting sentiments...") # apply function getSentiment sentiment = rep(0, tweet_num) for (i in 1:tweet_num) { tmp = getSentiment(tweet_clean[i], db_key) tweet_df$sentiment[i] = tmp$sentiment print(paste(i," of ", tweet_num)) } # delete rows with no sentiment tweet_df <- tweet_df[tweet_df$sentiment!="",] #separate text by sentiment sents = levels(factor(tweet_df$sentiment)) #emos_label <- emos # get the labels and percents labels <- lapply(sents, function(x) paste(x,format(round((length((tweet_df[tweet_df$sentiment ==x,])$text)/length(tweet_df$sentiment)*100),2),nsmall=2),"%")) nemo = length(sents) emo.docs = rep("", nemo) for (i in 1:nemo) { tmp = tweet_df[tweet_df$sentiment == sents[i],]$text emo.docs[i] = paste(tmp,collapse=" ") } # remove stopwords emo.docs = removeWords(emo.docs, stopwords("german")) emo.docs = removeWords(emo.docs, stopwords("english"))

136
corpus = Corpus(VectorSource(emo.docs)) tdm = TermDocumentMatrix(corpus) tdm = as.matrix(tdm) colnames(tdm) = labels # comparison word cloud comparison.cloud(tdm, colors = brewer.pal(nemo, "Dark2"), scale = c(3,.5), random.order = FALSE, title.size = 1.5)

137
Forth Appendix: #ChinaMeltDown breed [randomAgents randomAgent] breed [DailyTweeters DailyTweeter] breed [OpinionAgents OpinionAgent] turtles-own[out-of-market buy sell pass price cash stocks sentiment] globals [logB logS exePrice UserSentiment negativity1 negativity2 positivity1 positivity2 neutrality1 neutrality2 SentimentThreshold NofNegative NofPositive NofRelevantTweets UntrustfulTweets NofRelevantTweets1 TotalDailyAgents MyT MyTx] to setup clear-all reset-ticks set exePrice 1000 set logB [] set logS [] set MyT 0 set TotalDailyAgents 0 setup-RandomAgents openFile end to setup-RandomAgents create-randomAgents nRandomAgents ask randomAgents [ set shape "person" set out-of-market False set size 1.5 set stocks 0 set cash 0 setxy random-xcor random-ycor]

138
end to openFile reset-ticks file-close file-open TwitterDataset end to go if ticks >= 53 [stop] ifelse DoYouBelieveInTwitter? [Daily-Twitter-Agents] [Daily-Opinion-Agents] set TotalDailyAgents (MyT + (count turtles)) NoisyAgents volatility graph set MyT 0 end to NoisyAgents ask randomAgents [ ifelse out-of-market [set color white] [ifelse random-float 1 < passLevel [set pass True] [set pass False] ifelse not pass [ifelse random-float 1 < 0.5 [set buy True set sell False] [set sell True set buy False] ] [set buy False set sell False] if pass [set color gray set sentiment 0] if buy [set color red set sentiment 1] if sell [set color green set sentiment -1] set price exePrice + (random-normal 0 50) ]

139
] set logB [] set logS [] set-current-plot "exePrice" set-current-plot-pen "exePrice" ask turtles [ set MyT MyT + 1 set MyTx (ticks + (MyT / TotalDailyAgents)) plotxy MyTx exePrice if not pass and not out-of-market [ let tmp[] set tmp lput price tmp set tmp lput who tmp if buy [set logB lput tmp logB] set logB reverse sort-by [item 0 ?1 < item 0 ?2] logB if (not empty? logB and not empty? logS) and item 0 (item 0 logB) >= item 0 (item 0 logS) [set exePrice item 0 (item 0 logS) let agB item 1 (item 0 logB) let agS item 1 (item 0 logS) ask turtle agB [set stocks stocks + 1 set cash cash - exePrice] ask turtle agS [set stocks stocks - 1 set cash cash + exePrice] set logB but-first logB set logS but-first logS ] if sell [set logS lput tmp logS] set logS sort-by [item 0 ?1 < item 0 ?2] logS if (not empty? logB and not empty? logS) and item 0 (item 0 logB) >= item 0 (item 0 logS) [set exePrice item 0 (item 0 logB) let agB item 1 (item 0 logB)

140
let agS item 1 (item 0 logS) ask turtle agB [set stocks stocks + 1 set cash cash - exePrice] ask turtle agS [set stocks stocks - 1 set cash cash + exePrice] set logB but-first logB set logS but-first logS ] ] if random-float 1 < out-of-marketLevel [if exePrice > 1500 [set out-of-market False] if exePrice < 500 [set out-of-market True] ] ] tick end to Daily-Twitter-Agents ifelse file-at-end? [ ask DailyTweeters [die] ] [ ask DailyTweeters [die] let num file-read output-print (word "day " ticks " with " num " agents") while [num > 0] [ create-DailyTweeters 1 [ set color cyan set size 0.75 setxy random-xcor random-ycor set sentiment file-read] set num num - 1 ] ask DailyTweeters with [sentiment > 0] [set buy True set sell False set pass False
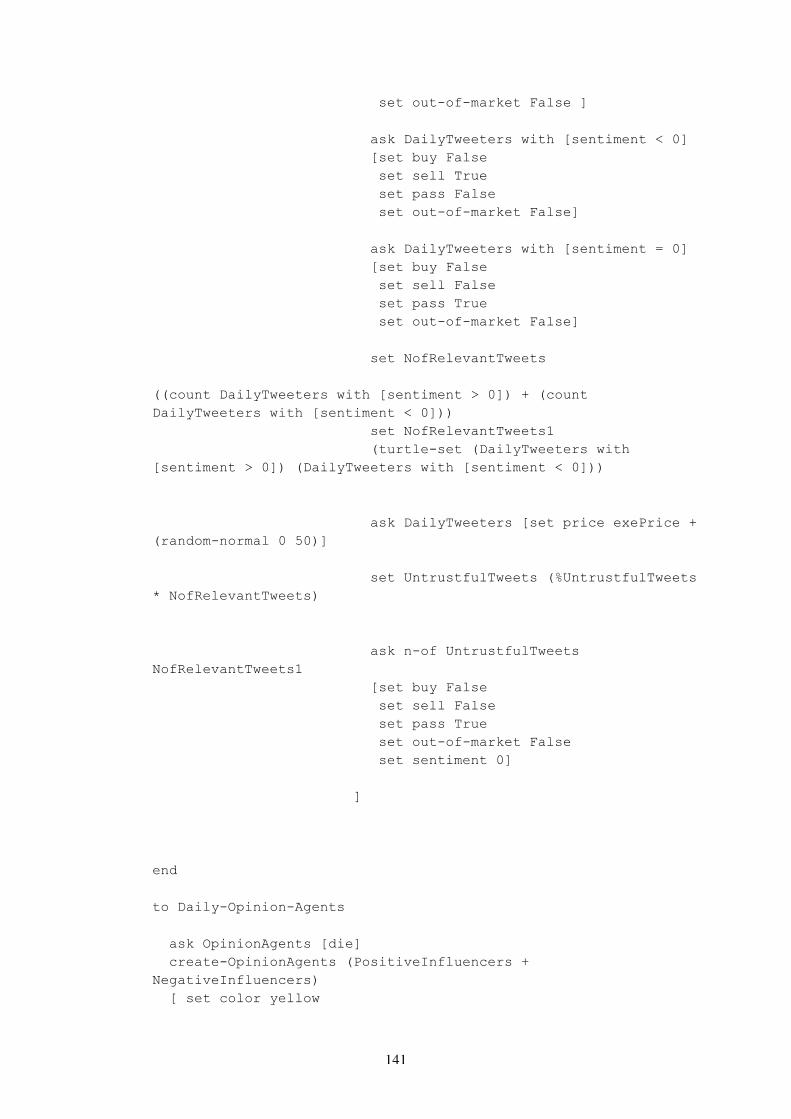
141
set out-of-market False ] ask DailyTweeters with [sentiment < 0] [set buy False set sell True set pass False set out-of-market False] ask DailyTweeters with [sentiment = 0] [set buy False set sell False set pass True set out-of-market False] set NofRelevantTweets ((count DailyTweeters with [sentiment > 0]) + (count DailyTweeters with [sentiment < 0])) set NofRelevantTweets1 (turtle-set (DailyTweeters with [sentiment > 0]) (DailyTweeters with [sentiment < 0])) ask DailyTweeters [set price exePrice + (random-normal 0 50)] set UntrustfulTweets (%UntrustfulTweets * NofRelevantTweets) ask n-of UntrustfulTweets NofRelevantTweets1 [set buy False set sell False set pass True set out-of-market False set sentiment 0] ] end to Daily-Opinion-Agents ask OpinionAgents [die] create-OpinionAgents (PositiveInfluencers + NegativeInfluencers) [ set color yellow

142
set size 0.75 setxy random-xcor random-ycor set buy True set sell False set pass False set out-of-market False set sentiment 1] ask n-of NegativeInfluencers OpinionAgents [ set buy False set sell True set pass False set out-of-market False set sentiment -1 set color orange] ask OpinionAgents [ set price exePrice + (random-normal 0 50)] end to volatility set negativity1 0 set negativity1 (count RandomAgents with [sentiment < 0]) set positivity1 0 set positivity1 (count RandomAgents with [sentiment > 0]) set neutrality1 0 set neutrality1 (count RandomAgents with [sentiment = 0]) set negativity2 0 set negativity2 (count DailyTweeters with [sentiment < 0]) set positivity2 0 set positivity2 (count DailyTweeters with [sentiment > 0]) set neutrality2 0 set neutrality2 (count DailyTweeters with [sentiment = 0]) end to graph set-current-plot "RandomAgents" set-current-plot-pen "negativity1" plot negativity1 set-current-plot "RandomAgents" set-current-plot-pen "positivity1" plot positivity1 set-current-plot "RandomAgents" set-current-plot-pen "neutrality1"

143
plot neutrality1 set-current-plot "Tweets" set-current-plot-pen "negativity2" plot negativity2 set-current-plot "Tweets" set-current-plot-pen "positivity2" plot positivity2 set-current-plot "Tweets" set-current-plot-pen "neutrality2" plot neutrality2 end