school of real estate & planning school of real estate and planning sponsor ownership, board...
TRANSCRIPT
School of Real Estate & Planning
School of Real Estate and Planning
Sponsor Ownership, Board Independence and Asian REITs Performance
© Henley Business School 2013 www.henley.reading.ac.uk
Annisa Dian Prima*, Simon Stevenson and Peter Wyatt
ERES 20th Annual Conference - 5 July 2013
School of Real Estate & Planning
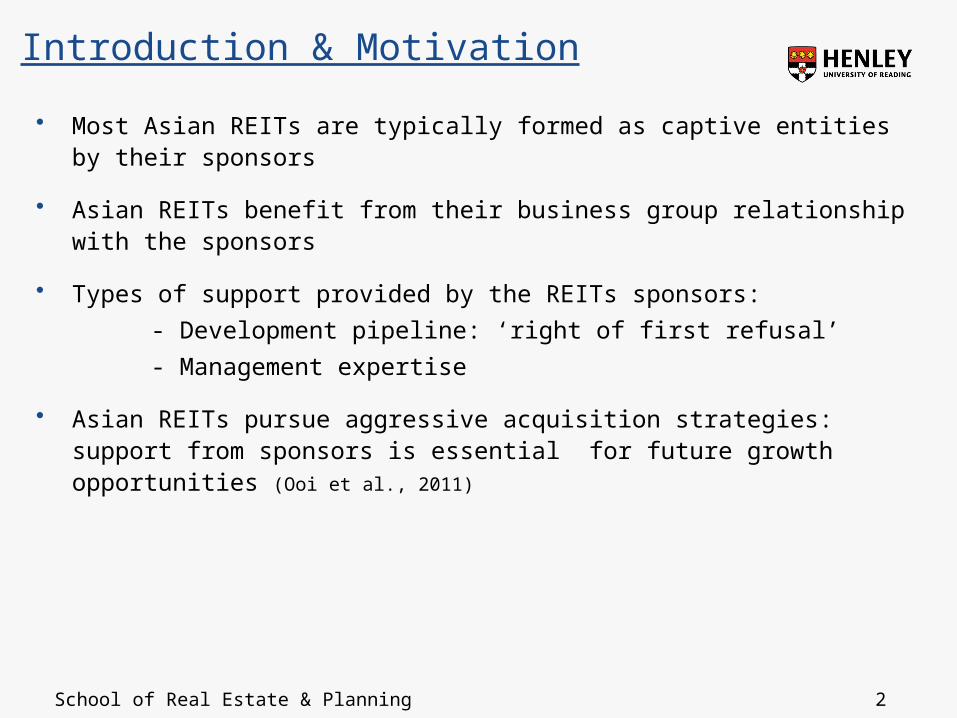
• Most Asian REITs are typically formed as captive entities by their sponsors
• Asian REITs benefit from their business group relationship with the sponsors
• Types of support provided by the REITs sponsors:
- Development pipeline: ‘right of first refusal’
- Management expertise
• Asian REITs pursue aggressive acquisition strategies: support from sponsors is essential for future growth opportunities (Ooi et al., 2011)
2
Introduction & Motivation

School of Real Estate & Planning 3
Introduction & Motivation
• Agency conflict is exacerbated by the captive relationship between the manager and the sponsor
• Sponsors have substantial control over REITs management, financing and investment policies (Wei et al., 1995)
• Related party transactions with the sponsors are inevitable (Ooi et al., 2012)
• REITs serve as an ‘exit strategy’ for the developer sponsor (Rosenberg, 1986; Wong et al. 2012)

School of Real Estate & Planning
Introduction & Motivation
“…Potential conflicts of interest among the REIT, the Manager, the Sponsor and the major Unitholders could result in corporate actions and business decisions that are not in the Unitholder’s best interests…”
-One of the REITs prospectus-
“…The Manager may experience conflicts of interest as a result of the activities and interests of its affiliates in acquiring and disposing of potential investments. As a wholly-owned subsidiary of the Sponsor, the Manager may experience conflicts of interests in connection with any potential acquisitions from sponsor or its affiliates, and in agreeing the terms of such potential acquisitions... Any potential conflicts of interest between the REIT and the Sponsor and its affiliates may not necessarily be resolved in favour of the REIT…”
-One of the REITs prospectus-
4

School of Real Estate & Planning
Research Objective
• Aim: to investigate the influence of sponsor ownership and other governance variables on board independence and Asian REITs performance
• Kudus and Sing (2011) attempt to investigate the relationship between insider (sponsor) ownership on board independence and Asian REITs performance
- Insider ownership as a proxy of sponsor ownership good proxy?
- Pyramid structure of sponsor ownership
- Sample period between 2002 and 2007 exclude the financial crisis period
• Higher likelihood of sponsors expropriation during the crisis due to a negative shock on investment opportunities and financial constraint (Johnson et al., 2000; Lemmon and Lins, 2003)
• Firm value is adversely affected when Asian REITs are involved in the related party transactions with their sponsors during the crisis (Ooi et al., 2012)
5

School of Real Estate & Planning
Literature Review
• Board Independence and Managerial Ownership – integral governance mechanisms
(Jensen and Meckling, 1976; Fama and Jensen, 1983 ; Weisbach, 1988; Capozza and Seguin, 2003)
• Entrenchment hypothesis: managerial ownership is negatively related to board independence and firm performance
(Fama and Jensen, 1983; Ghosh and Sirmans, 2003; Kim et al., 2007)
• Incentive alignment hypothesis: managerial ownership is positively related to board independence and firm performance
(Capozza and Seguin, 2003 ; Yeh and Woidtke, 2005)
• The countervailing forces between the incentive effect and the entrenchment effect raise the possibility that managerial ownership is nonlinearly related to board independence and firm performance
(Friday et al.,1999; Morck et al.,1988; Han, 2006; Dolde and Knopf, 2009; Kudus and Sing, 2011)
6

School of Real Estate & Planning
Empirical Models
Board independence model:
BIndi,t = β0 + β1 SPONi,t + β2 BOARDi,t + β3 OWNi,t + β4 CEOi,t + β5
CONTROLi,t + λt +ηi + εi,t
Stock return and performance model:
ARRi,t = δ0 + δ1 SPONi,t + δ2 BOARDi,t + δ3 OWNi,t + δ4 CEOi,t + δ5
CONTROLi,t + λt +ηi +εi,t
ARRi,t is a vector of three performance measure variables, namely of:
- Jensen’s Alpha : Abnormal returns- ROE and ROA : Operating efficiency
7

School of Real Estate & Planning
Model Specification
Each model include 3 specifications:
1) Linear
2) Quadratic
- squared term of sponsor ownership
3) Spline
- sponsor ownership is divided into three range segments
- 0% - 5% of ownership, 5%-25 % of ownership, and > 25% of ownership
8

School of Real Estate & Planning
Estimation of sponsor ownership
9
Partly-owned Subsidiary
Sponsor
Subsidiary
REIT
10%
50%
5%
Sponsor
Subsidiary
REIT
10%
100%
10%
Wholly-owned Subsidiary
1. Wholly-owned : Sponsors retain a 10 percent stake in the REIT
2. Partly-owned : Sponsors retain a 5 percent stake in the REIT
School of Real Estate & Planning
Sample Characteristics
10
Sample Characteristics
JapanSingapor
eMalaysi
a Hong Kong
Total
No. of existing & delisted REITs
45 24 14 8 91
No. of REITs in the sample
42 24 14 7 87
Proportion of sample to existing REITs
93.33 100 100 87.50 96.67
No. of Pooled Observations
275 132 70 37 514
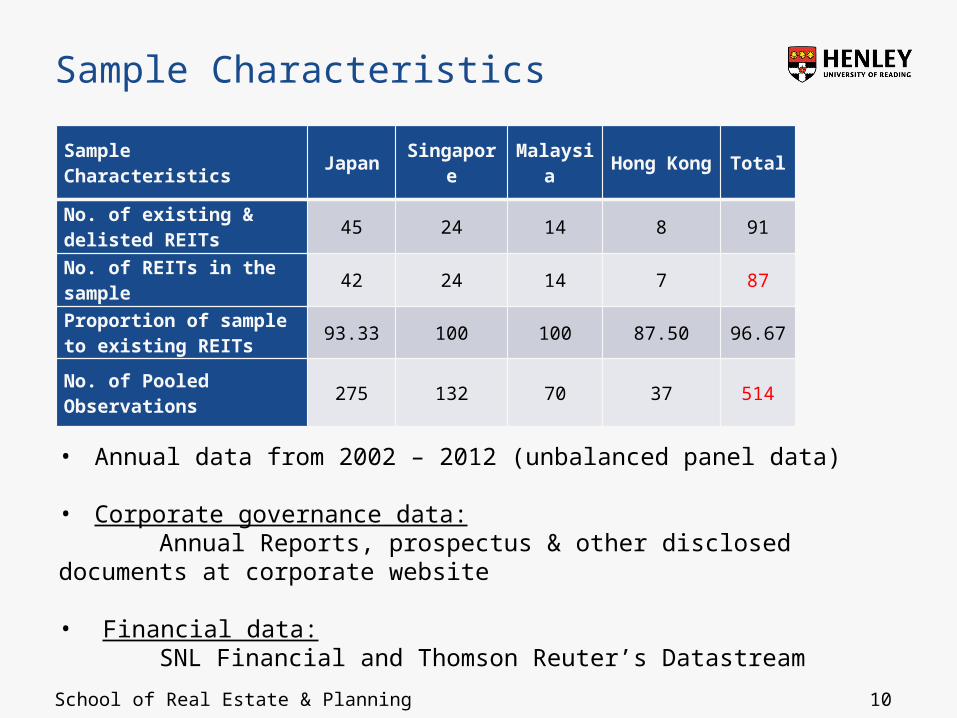
• Annual data from 2002 – 2012 (unbalanced panel data)
• Corporate governance data: Annual Reports, prospectus & other disclosed documents at corporate website
• Financial data: SNL Financial and Thomson Reuter’s Datastream

School of Real Estate & Planning
Descriptive Statistics
11
Japan Singapore Malaysia Hong Kong TotalVariable Symbol Mean Mean Mean Mean Mean
Panel A: CEO ProfileCEO Tenure CEOTen 2.607 2.674 2.685 2.649 2.638CEO Duality Dual 0.516 0.000 0.171 0.000 0.300
Panel B: Board CompositionBoard Size Bsize 3.502 7.667 6.600 7.324 5.268Board Independence Bind 66.439 45.905 40.046 42.414 55.842
Panel C: Ownership StructureCEO Ownership CEOOwn 0.000 0.074 0.730 0.001 0.118Insider Ownership InsOwn 0.000 0.757 14.671 11.353 3.010
Independent Ownership IndOwn 0.000 0.045 0.040 0.002 0.017Total Blockholding TotBlk 25.068 42.623 7.719 12.485 26.308
Panel D: Sponsor Characteristic and OwnershipSponsor Ownership SponOwn 8.601 29.143 37.327 26.004 19.040Sponsor Developer Stype 57.8 84.1 91.4 86.5 71.2Panel E: Control VariablesFirm Size (log term) Fsize 4.725 6.012 5.680 6.578 5.320Market to Book MTB 1.061 0.872 0.939 1.269 1.011Leverage (log term) LEV 1.588 1.443 1.382 1.366 1.507Asset Strategies Type 0.593 0.250 0.357 0.730 0.482Panel F: Performance MeasuresAbnormal Return Alpha 0.096 -0.428 -1.256 -0.679 -0.274Return of Equity ROE 5.236 8.507 10.999 9.795 7.189Return on Asset ROA 2.587 5.647 7.474 5.950 4.281

School of Real Estate & Planning
OLS: Board Independence and Abnormal Returns
12
Model 1: GLS Model 2: OLSBIND Alpha
Linear Quadratic Spline Linear Quadratic SplineConstant 66.846***
(5.736)66.990***
(5.710)65.472***
(5.830)136.362
(106.275)128.44
(104.767)135.246
(108.575)SponOwn -0.091*
(0.050)-0.094* (0.051)
1.303** (0.533)
1.501*** (0.543)
SponOwn_sqr -0.131 (0.200)
9.010* (5.438)
SponOwn5 0.316 (0.254)
8.049 (5.015)
SponOwn5_25 -0.045 (0.100)
-0.052 (1.234)
SponOwn25 -0.163** (0.081)
1.726** (0.785)
BInd -1.332* (0.717)
-1.333* (0.720)
-1.415* (0.723)
BSize -3.286*** (0.525)
-3.290*** (0.527)
-3.312*** (0.527)
-6.935 (6.016)
-6.890 (6.007)
-7.394 (6.093)
Dual -1.530* (0.884)
-1.536* (0.887)
-1.695* (0.881)
-7.633 (15.609)
-9.463 (15.709)
-10.911 (15.775)
CEOOwn -0.269*** (0.059)
-0.271*** (0.059)
-0.231*** (0.060)
4.022*** (1.212)
4.262*** (1.215)
4.341*** (1.313)
InsOwn -0.094 (0.058)
-0.096* (0.058)
-0.081 (0.053)
1.768** (0.786)
1.901** (0.783)
2.014** (0.802)
TotBlk 0.026 (0.031)
0.025 (0.030)
0.028 (0.030)
1.097* (0.578)
1.191** (0.577)
1.287** (0.594)
MTB 0.005 (0.003)
0.005 (0.003)
0.005 (0.004)
0.140** (0.060)
0.155*** (0.060)
0.142** (0.060)
FSize -0.017** (0.007)
-0.017** (0.008)
-0.017** (0.008)
-0.028 (0.120)
-0.046 (0.120)
-0.045 (0.122)
Type -0.339 (1.572)
-0.331 (1.576)
-0.300 (1.559)
-24.358* (13.234)
-23.088* (13.158)
-23.603* (13.134)
Country F.E Yes Yes YesYear F.E Yes Yes YesNo. Observations 514 514 514 508 508 508R-squared 0.141 0.142 0.148 0.228 0.232 0.232

School of Real Estate & Planning
OLS: Operating Performance
13
Model 3: OLS Model 4: OLS
ROE ROAExplanatory Variable Linear Quadratic Spline Linear Quadratic SplineConstant 5.561
(3.933)5.530
(3.972)5.637
(3.970)7.955*** (2.774)
7.961*** (2.785)
7.912*** (2.791)
SponOwn 0.076** (0.031)
0.077** (0.032)
0.040* (0.021)
0.040* (0.022)
SponOwn_sqr 0.034 (0.222)
-0.008 (0.126)
SponOwn5 -0.001 (0.194)
0.064 (0.117)
SponOwn5_25 0.125** (0.057)
0.059 (0.039)
SponOwn25 0.046 (0.062)
0.023 (0.038)
CEOTen 0.552*** (0.171)
0.552*** (0.172)
0.551*** (0.168)
0.286** (0.114)
0.285** (0.115)
0.289** (0.114)
CEOOwn 0.259*** (0.045)
0.260*** (0.045)
0.259*** (0.050)
0.096** (0.040)
0.096** (0.040)
0.100** (0.042)
Country F. E. No No No Yes Yes YesYear F. E. Yes Yes Yes Yes Yes YesNo. Observations 514 514 514 514 514 514R-squared 0.187 0.187 0.189 0.253 0.253 0.254

School of Real Estate & Planning
OLS: Financial Crisis
14
Model 5: OLS Model 6: OLS Model 7: OLSAlpha ROE ROA
Explanatory Variable Linear Quadratic Spline Linear Quadratic Spline Linear Quadratic SplineConstant -6.744
(4.577)-6.062 (4.574)
-5.382 (4.528)
12.239 (10.747)
11.154 (11.122)
11.29 (11.184)
14.813** (6.795)
14.067** (6.818)
14.091** (6.824)
SponOwn -0.012 (0.024)
0.036 (0.062)
0.163*** (0.061)
0.077 (0.140)
0.102*** (0.036)
0.043 (0.091)
SponOwn_sqr -0.001 (0.001)
0.002 (0.003)
0.001 (0.002)
Sponown5 0.507 (0.373)
0.117 (0.343)
0.067 (0.213)
Sponown5_25 -0.05 (0.074)
0.117 (0.110)
0.067 (0.073)
Sponown25 -0.028 (0.029)
0.198* (0.113)
0.128** (0.064)
BInd -0.061 (0.040)
-0.061 (0.040)
-0.079** (0.039)
-0.039 (0.092)
-0.039 (0.092)
-0.037 (0.095)
-0.067 (0.054)
-0.067 (0.054)
-0.065 (0.055)
BSize -0.871*** (0.326)
-0.875*** (0.329)
-0.904*** (0.319)
-0.516 (0.521)
-0.496 (0.525)
-0.513 (0.529)
-0.477 (0.329)
-0.463 (0.328)
-0.475 (0.333)
CEOTen 0.047 (0.230)
0.071 (0.231)
0.114 (0.237)
0.891** (0.352)
0.852** (0.343)
0.858** (0.343)
0.542** (0.213)
0.515** (0.209)
0.517** (0.210)
CEOOwn -0.021 (0.042)
-0.010 (0.045)
0.026 (0.060)
0.291*** (0.068)
0.272*** (0.070)
0.278*** (0.075)
0.168*** (0.043)
0.155*** (0.048)
0.159*** (0.052)
LEV 2.061 (1.283)
1.859 (1.321)
1.810 (1.310)
-0.781 (2.716)
-0.429 (2.767)
-0.554 (2.727)
-3.294* (1.863)
-3.052* (1.825)
-3.121* (1.820)
MTB 3.989*** (0.876)
3.997*** (0.881)
3.769*** (0.829)
-0.703 (1.759)
-0.730 (1.751)
-0.766 (1.812)
-0.702 (1.04)
-0.721 (1.032)
-0.751 (1.062)
Country F. E. No No No No No No No No NoYear F. E. Yes Yes Yes Yes Yes Yes Yes Yes YesNo. Observations 224 224 224 227 227 227 227 227 227R-squared 0.329 0.331 0.341 0.209 0.212 0.210 0.263 0.267 0.265

School of Real Estate & Planning
Concluding Remarks
• Sponsor ownership and board independence: nonlinear
- Monitoring abilities
• Sponsor ownership and abnormal returns: nonlinear
- Monitoring costs
- Use of private information (information asymmetry)
• Sponsor ownership and ROE: nonlinear
- Tacit knowledge
- Efforts and involvement
• Sponsor ownership and ROA: linear
- Quality of real estate assets
- Capital raising assistance
• Sponsor ownership and operating performance (ROE, ROA) during crisis: linear
- Sponsors commitment to support REITs during good time and bad time
15E-mail: [email protected]