school resources and educational outcomes in developing countries · pdf file ·...
TRANSCRIPT

School Resources and Educational Outcomes in Developing Countries:
A Review of the Literature from 1990 to 2010
Paul Glewwe (University of Minnesota)
Eric Hanushek (Stanford University) Sarah Humpage (University of Minnesota) Renato Ravina (University of Minnesota)
Presentation for:
Addressing the Global Learning Crisis:
Lessons for Research on What Works in Education
January 27, 2012

2
Introduction There is a lot of evidence that education raises incomes and has other desirable outcomes. Developing countries spend hundreds of billions of dollars each year on schools, educational materials and teachers, but… …relatively little is known about how effective these expenditures are at increasing student learning and students’ years of completed schooling. This paper examines studies published between 1990 and 2010, in both the education and economics literatures, to investigate which specific school and teacher characteristics, if any, appear to have strong positive impacts on learning and time in school.
1
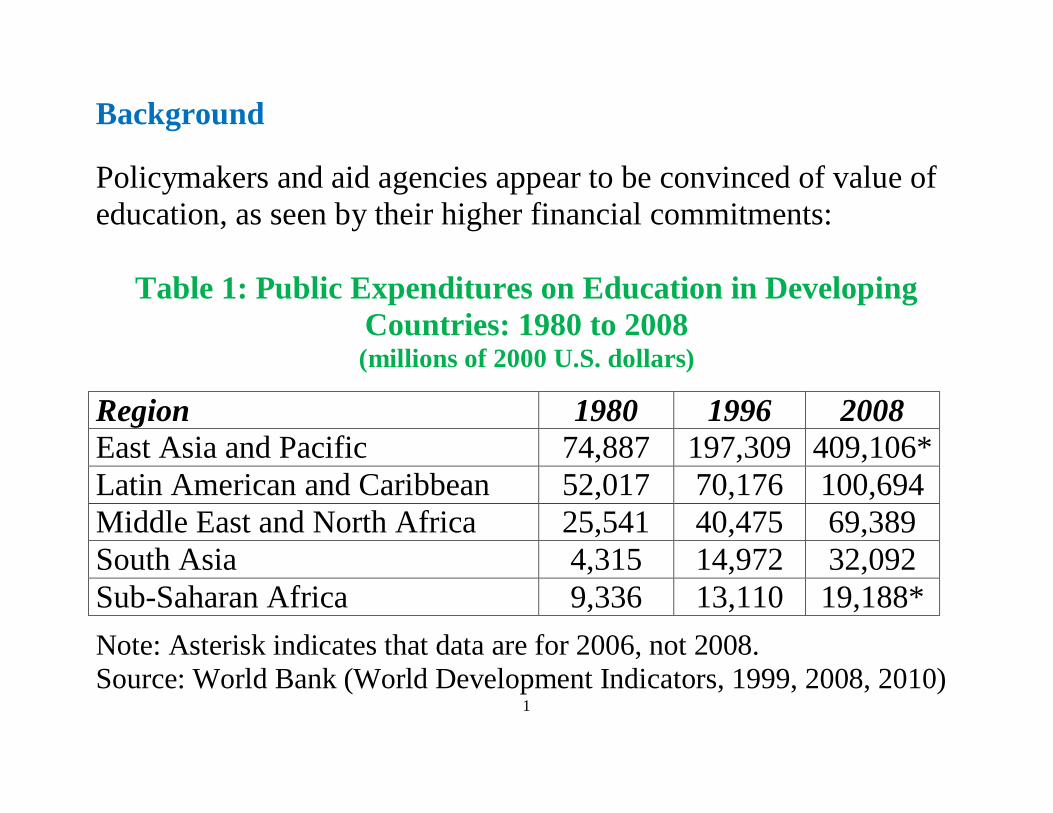
Background Policymakers and aid agencies appear to be convinced of value of education, as seen by their higher financial commitments:
Table 1: Public Expenditures on Education in Developing Countries: 1980 to 2008 (millions of 2000 U.S. dollars)
Region 1980 1996 2008 East Asia and Pacific 74,887 197,309 409,106* Latin American and Caribbean 52,017 70,176 100,694 Middle East and North Africa 25,541 40,475 69,389 South Asia 4,315 14,972 32,092 Sub-Saharan Africa 9,336 13,110 19,188*
Note: Asterisk indicates that data are for 2006, not 2008. Source: World Bank (World Development Indicators, 1999, 2008, 2010)

2
Table 2 Official Development Assistance for Education, 1980 to 2009
(millions of constant 2008 U.S. dollars) 1980 1990 2000 2009 All Donors 7,889 11,291 7,820 14,186 DAC (OECD Development Assistsance Committee) Countries
7,889 8,914 5,642 9,492
Multilateral -- 2,377 2,178 4,445 Non-DAC Countries -- -- -- 248 Source: International Development Statistics, OECD (www.oecd.org/dac/stats/idsonline).

3
Increased spending appears to have paid off in terms of getting kids into school:
Table 3: Primary and Secondary Gross Enrollment Rates: 1980 to 2008
Primary Secondary Region 1980 1995 2008 1980 1995 2008 East Asia and Pacific 111 115 112 43 65 73 Latin American & Caribbean 106 111 117 42 53 88 Middle East and North Africa 87 97 106 42 64 72 South Asia 76 99 108 27 49 52 Sub-Saharan Africa 78 75 97 14 27 33 Source: World Bank (World Development Indicators, 1998, 2010)

4
Table 4: Primary School Completion Rates: 1980 to 2008
Region 1991 2008 East Asia and Pacific 100 100 Latin American and Caribbean
83 101
Middle East and North Africa 77 94 South Asia 76 79 Sub-Saharan Africa 50 62
Source: World Bank (World Development Indicators, 2002, 2010)

5
The good news is that almost all developing countries are doing a good job of getting most or all kids through primary school, and most countries are getting most kids into secondary school. We also have some policies that we are fairly certain will increase enrollment further – recent research shows that enrollment increases when:
• The distance to the nearest school decreases • School fees are reduced or eliminated (or become subsidies) • School quality improves
The bad news is that:
• Children in most developed countries are not learning a lot • At best, learning outcomes are increasing slowly over time • We know much less about what can be done to increase learning

6
Table 5: Scores on International Comparable Tests (PISA), 2000 to 2009
READING MATH Country 2000 2003 2006 2009 2003 2006 2009
Argentina 418 374 398 381 388
Brazil 396 403 393 412 356 370 386
Chile 410 442 449 411 421
Colombia 385 413 470 481
Indonesia 371 382 393 402 360 381 371
Jordan 401 405 384 387
Mexico 422 400 410 425 385 406 419
Peru 327 370
Thailand 431 420 417 421 417 417 419
Tunisia 375 380 404 359 365 371
Turkey 375 380 404 423 424 445
Uruguay 434 413 426 422 427 427

7
Objective of This Paper
Due to:
• Lack of clear research results on what school and teacher characteristics lead to improve test scores, and
• In many countries, disappointing results regarding little impact of increased expenditures per student
…many policymakers and researchers in both developed and developing countries have advocated changing the way that schools are run (e.g. changing teacher incentives and, more generally, changing the way that schools are organized).

8
But… …before abandoning all hope of finding out whether certain school or teacher characteristics have a causal impact on students’ educational outcomes it also seems useful review the literature, because:
• Prior reviews cover studies only through the early 1990s • Many new studies, including many with stronger research
designs, have now appeared. This paper examines both the economics literature and education literature published in the last two decades to assess the extent to which specific school and teacher characteristics have a causal impact on student learning and enrollment.

9
More specifically, this paper reviews the literature that attempts to estimate the impact on student learning and time in school of:
1. School infrastructure and pedagogical materials (electricity, roof/wall/floor, desks/tables/chairs, blackboard, textbooks, library, computers, etc.)
2. Teacher and principal characteristics (education, training,
experience, sex, subject knowledge, and ethnicity)
3. School organization (pupil-teacher ratio, teaching methods, teacher absence, homework assignment, student assessment methods, teacher contract, expenditure per pupil, etc.)

10
Interpreting the Research on Basic Education Inputs The underlying conceptual framework we use considers schools to be “factories” that produce “learning” using various school and teacher characteristics as “inputs”. This is the production function approach. Intuitively, the process by which cognitive skills are learned is determined by many different factors, and production functions are expressions, in simple terms, of this process. In this sense, an education production function always exists, although its existence does not guarantee that one can estimate it.

11
Relationships of Interest It is useful to step back to consider what relationships are of interest that one wants to estimate when examining the impact of school and teacher characteristics on educational outcomes, and how those relationships interact with households’ behavior. Start with the production function for learning (a structural relationship), which can be depicted as:
A = a(S, Q, C, H, I) (1) A is skills learned (achievement) S is years of schooling Q is a vector of school and teacher characteristics (quality) C and H are vectors of child and household characteristics I is school inputs that parents control, e.g. child attendance

12
Assume that parents, by optimizing their utility, have well defined demand functions for years of schooling and educational inputs:
S = f(Q, C, H, P) (2) I = g(Q, C, H, P) (3)
where prices related to schooling are denoted by the vector P. Inserting (2) and (3) into (1) gives the reduced form equation for (A):
A = h(Q, C, H, P) (4) This reduced form equation is a causal relationship, but it is not a textbook production function because it reflects household preferences and includes prices among its arguments.

13
This presentation focuses on attempts to estimate equation (1), the production function for cognitive skills. But in fact some of the studies we examine may be closer to estimates of equation (4), e.g. if they include the price of schooling or distance to schooling. Thus far we have not had time (or maybe the motivation) to classify studies but what they are estimating. For now, simply note that the impacts of school and teacher variables (Q) on student learning are not the same in equations (1) and (4). In particular, consider a change in one element of Q, call it Qi. Equation (1) shows how changes in Qi affect A holding all other explanatory variable constant (a partial derivative), while equation (4) provides the total derivative of A with respect to Qi since it allows S and I to change in response to the change in Qi.
For example, parents may respond to better teaching by changing their provision of educational inputs such as textbooks.

14
Estimation Problems It is not easy to estimate equation (1). To be concrete, consider a simple linear specification of (1):
A = β0 + β1S + βQ1Q1 + βQ2Q2 + … + βC1C1 + βC2C2 + … (1′) + βH1H1 + βH2H2 + … + βI1I1 + βI2I2 + … + uA
where each variable in Q, C, H and I is shown explicitly. Note that the “error term”, uA, accounts for:
1. All variables in (1) that are not in the data 2. Differences between (1) and its linear approximation in (1) 3. Measurement error in A 4. Measurement error in the the right hand side variables

15
Unfortunately, uA is very likely to be correlated with the right hand side variables in (1′), for (at least) four reasons:
1. Omitted Variable Bias. Difficult to observe variables include: teachers’ motivation (a Q variable), school principals’ management skills (Q), children’s ability and motivation (C), and parents’ willingness and capacity to help (H), and the time they spend helping (I), their children with schoolwork. Also, “high quality” schools are usually better in many dimensions, both observed and unobserved.
2. Selection and Attrition Bias. School and teacher characteristics (Q) often affect which children attend school, and which school they attend. For example, improved schools could attract less prepared students who would otherwise drop out, reducing average test scores.

16
3. Endogenous Program Placement Bias. Governments may raise school quality in areas with bad education outcomes, in an attempt to assist disadvantaged groups. On the other hand they may raise school quality in areas with good education outcomes, if those areas have political influence. The former causes underestimation of school quality variables’ impacts on learning, while the latter causes overestimation.
4. Measurement Error Bias. Anyone who has directly observed household or school survey data collection in developing countries understands that even the best data contain many errors. Random measurement error typically causes underestimation of true impacts, while nonrandom errors could cause underestimation or overestimation.

17
Potential Solutions The above estimation problems are very hard to solve. Perhaps the most obvious approach for addressing problems of omitted variable bias is to collect data on the omitted variables. Similarly, to eliminate or minimize measurement error bias one should improve data collection to reduce measurement error. Yet even the best efforts to collect comprehensive and accurate data fall short. Thus we briefly review five methods that can be used to avoid or minimize bias when estimating equation (1). A common feature of these methods, however, is that they may be difficult to apply, and they often rely upon additional assumptions, special circumstances or unique opportunities.

18
1. Instrumental Variable (IV) Methods can be used to address omitted variable bias & measurement error bias. Unfortunately, it is frequently difficult to find plausible instruments.
2. Panel Data can be used to estimate the impact of changes (over time) in observed variables on changes in test scores, and more generally to apply value added methods. But many unobserved variables could change over time, and “differencing” may exacerbate measurement error bias.
3. Regression Discontinuity Design methods take advantage of thresholds in “smooth” variables the lead to sharp changes in school conditions. The main disadvantage of this method is that such opportunities are relatively rare, and so in most cases it cannot be applied.

19
4. Matching methods can be used to ensure that comparisons of students in different types of schools are based only on comparisons of students who are “well matched”, at least in terms of observed characteristics. However, these methods do not ensure that students are similar in terms of unobserved characteristics.
5. Randomized control trials (RCTs) have become increasingly
popular since the mid 1990s. In principle, they remove bias because they randomly assign a policy (which could be as simple as a change in one school or teacher characteristic) to a set of randomly selected schools, and those not randomly selected serve as controls. However, they often have the following limitations: the control schools must be treated within 1-2 years; it may not be clear “why” a policy works or doesn’t work; and compliance may be a problem.

20
Review Methodology First, the scope of this review is limited to:
1. Studies published from 1990 to 2010 (and working papers since 2005)
2. Primary and secondary schools (thus it excludes pre-primary, vocational or post-secondary education).
3. Studies of “traditional” school and teacher characteristics;
thus it does not examine school policies related to incentives for students & parents (Behrman et al.), school organization and management (Galiani & Perez-Truglia), relative perfor-mance of private and public schools (MacLeod & Urquiola) and issues of child health (Alderman & Bleakley).
21
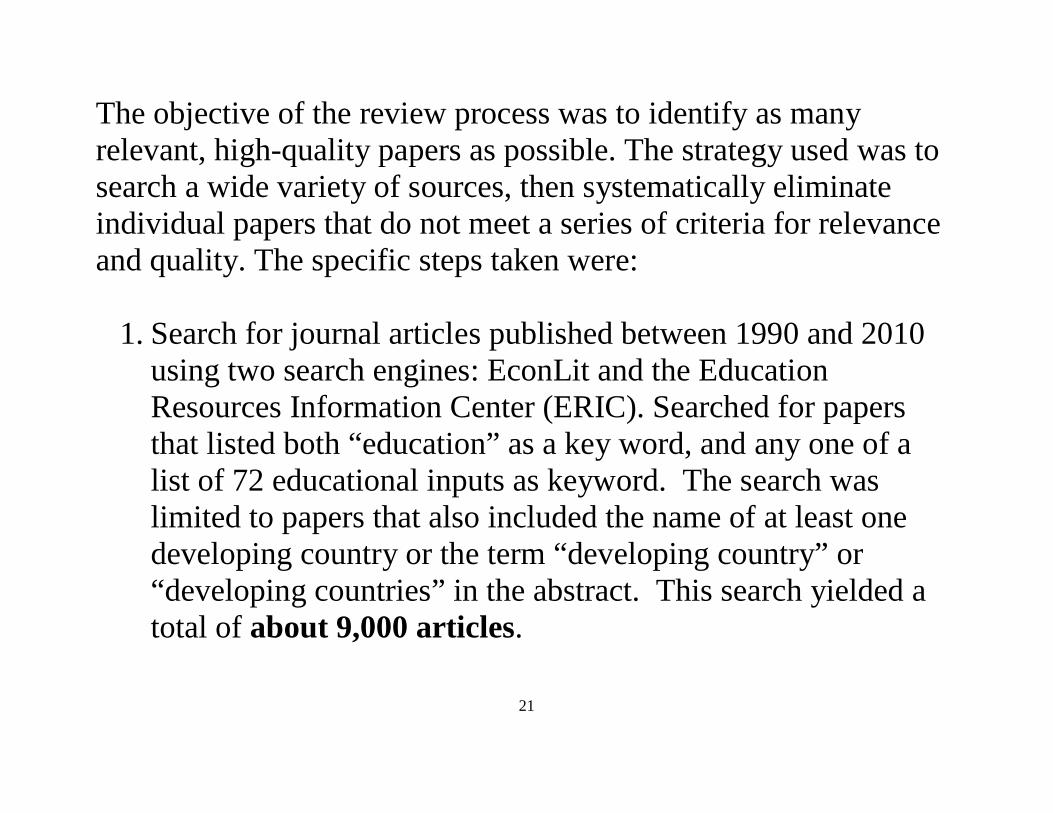
The objective of the review process was to identify as many relevant, high-quality papers as possible. The strategy used was to search a wide variety of sources, then systematically eliminate individual papers that do not meet a series of criteria for relevance and quality. The specific steps taken were:
1. Search for journal articles published between 1990 and 2010 using two search engines: EconLit and the Education Resources Information Center (ERIC). Searched for papers that listed both “education” as a key word, and any one of a list of 72 educational inputs as keyword. The search was limited to papers that also included the name of at least one developing country or the term “developing country” or “developing countries” in the abstract. This search yielded a total of about 9,000 articles.
22
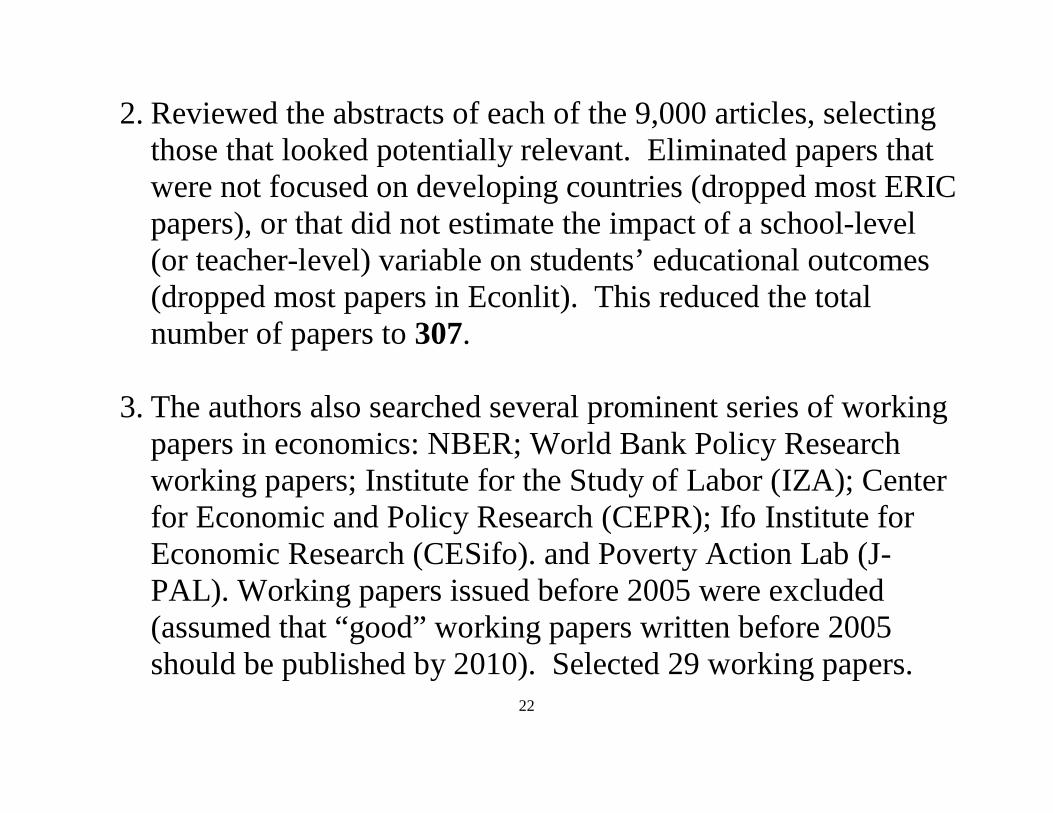
2. Reviewed the abstracts of each of the 9,000 articles, selecting those that looked potentially relevant. Eliminated papers that were not focused on developing countries (dropped most ERIC papers), or that did not estimate the impact of a school-level (or teacher-level) variable on students’ educational outcomes (dropped most papers in Econlit). This reduced the total number of papers to 307.
3. The authors also searched several prominent series of working
papers in economics: NBER; World Bank Policy Research working papers; Institute for the Study of Labor (IZA); Center for Economic and Policy Research (CEPR); Ifo Institute for Economic Research (CESifo). and Poverty Action Lab (J-PAL). Working papers issued before 2005 were excluded (assumed that “good” working papers written before 2005 should be published by 2010). Selected 29 working papers.

23
4. All four authors reviewed the abstracts the 307 published paper s and 29 working papers. This narrowed the sample to 253 by eliminating duplicate papers and papers that did not analyze the impacts on students’ educational outcomes of: school infrastructure and pedagogical supplies; teacher and principal characteristics; or school organization (including pedagogical practices).
5. All 253 papers were read by at least one author, which eliminated papers for one of three reasons: a) Paper did not focus on a developing country; b) Paper focused on an education policy unrelated to school infrastructure and pedagogical supplies; teacher and principal characteristics; or school organization; and c) Paper did not include quantitative analysis. More than half of these 253 papers were eliminated, which reduced the studies considered to 112.

24
6. The remaining 112 papers were reviewed for quality, both econometric methodology and covariates included. Papers were retained if they used any of the following methods: RCTs; difference in differences (DD) regression, regression discontinuity design (RDD), or matching methods. Also, papers using simpler quantitative methods (e.g. OLS) and including at least one general family background variable (e.g. parental schooling or household income) and school expenditure per pupil, or one family background variable, one teacher variable, and at least one additional school variable, were kept. Excluding papers that did not meet these restrictions reduce the number of papers to 79.
7. Finally, papers that applied OLS to cross-sectional without
using any more sophisticated methodology were also eliminated. This gave a final total of 43 articles (see Table 6).

25
Table 6: Steps Used to Select Papers Used in Literature Review
Step Number of Papers
Search EconLit and ERIC databases ~5,500 Review abstracts of all results 307 Add working papers published after 2004 336 Review abstracts again, eliminate duplicate papers and papers beyond scope of the review
253
Read entire papers, eliminating those that lack relevance or quantitative analysis
112
Eliminate papers based on methodology and/or lack of basic covariates
79
Final set of “high quality” papers 43

26
RESULTS! Note:
1. Many studies present multiple estimates of the impact of the same variable. In general, different estimation methods or estimations based on different subgroups (for example boys and girls, or different grades) were counted as separate estimates, but adding or removing a few variables for the same estimation method (or a similarly minor change) was not.
2. When an author presents multiple estimations, but argues that one is the most reliable, only that preferred estimate is used.

27
Table 7: Summary of Impacts on Test Scores of School Infrastructure and Pedagogical Supplies
(All 79 Studies)
Negative, Significant
Negative, Insignificant
Zero, or insign. & no sign given
Positive, Insignificant
Positive, Significant
Total Studies
Textbooks/Workbooks 4 (3) 13 (8) 7 (5) 10 (7) 26 (10) 21 Desks/Tables/Chairs 0 (0) 0 (0) 13 (1) 7 (5) 8 (4) 8 Computers/Elec. game 1 (1) 9 (5) 1 (1) 8 (3) 7 (4) 8 Electricity 0 (0) 3 (2) 0 (0) 6 (5) 6 (2) 6 School infrastr. index 0 (0) 1 (1) 7 (1) 1 (1) 13 (4) 6 Blackboard/flip chart 0 (0) 2 (2) 13 (1) 3 (3) 7 (3) 6 Library 1 (1) 3 (2) 7 (1) 1 (1) 10 (5) 6 Roof/wall/floor 0 (0) 1 (1) 0 (0) 3 (2) 2 (1) 4
1. Figures are number of estimates; figures in parentheses are number of papers/studies. 2. Includes all school infrastructure characteristics with at least two separate papers/studies.

28
Table 8: Summary of Impacts on Test Scores of Teacher
and Principal Characteristics (All 79 Studies)
Negative, Significant
Negative, Insignificant
Zero, or insign.
Positive, Insignificant
Positive, Significant
Total Studies
Teacher educat. level 4 (3) 11 (9) 11 (3) 22 (11) 24 (11) 24 Teacher experience 3 (3) 16 (11) 1 (1) 26 (13) 17 (7) 20 Tchr knowledge (test) 2 (2) 2 (2) 0 (0) 11 (5) 18 (7) 9 Female teachers 6 (4) 7 (5) 2 (1) 12 (7) 12 (5) 11 Tchr training (in serv.) 1(1) 10 (6) 0 (0) 7 (5) 11 (6) 11 Teacher quality index 0 (0) 0 (0) 8 (1) 0 (0) 6 (2) 2 Teaching degree 0 (0) 2 (1) 2 (1) 0 (0) 2 (1) 2 Principal experience 0 (0) 1 (1) 0 (0) 3 (2) 2 (2) 2 Principal education 2 (1) 1 (1) 1 (1) 1 (1) 1 (1) 2
1. Figures are number of estimates; figures in parentheses are number of papers/studies. 2. Includes all school infrastructure characteristics with at least two separate papers/studies.

29
Table 9: Summary of Impacts on Test Scores of School Organization (All 79 Studies)
Negative, Significant
Negative, Insignificant
Zero, or insign.
Positive, Insignificant
Positive, Significant
Total Studies
Pupil-teacher ratio 30 (13) 29 (13) 3 (2) 24 (12) 15 (9) 29 Teacher absenteeism 7 (4) 6 (3) 2 (1) 0 (0) 0 (0) 5 Tchr assign homework 0 (0) 4 (2) 0 (0) 0 (0) 12 (3) 5 School provides meals 4 (1) 3 (2) 0 (0) 0 (0) 6 (3) 4 Multi-grade teaching 4 (1) 0 (0) 10 (1) 5 (2) 2 (2) 4 Hours of school day 1 (1) 1 (1) 0 (0) 2 (1) 4 (2) 4 Tutoring 1 (1) 0 (0) 0 (0) 2 (1) 2 (1) 3 Salaried teacher 0 (0) 0 (0) 0 (0) 4 (1) 2 (2) 3 Contract teacher 1 (1) 0 (0) 0 (0) 1 (1) 4 (1) 2 Expenditure/pupil 2 (2) 0 (0) 0 (0) 0 (0) 1 (1) 2 Cost of attending 1 (1) 1 (1) 0 (0) 4 (2) 0 (0) 2 Total schl enrollment 2 (1) 0 (0) 2 (1) 1 (1) 1 (1) 2 Group work 0 (0) 4 (1) 0 (0) 5 (1) 4 (2) 2 Tchr gives examples 2 (1) 0 (0) 0 (0) 2 (1) 3 (1) 2 Student attendance 0 (0) 0 (0) 0 (0) 0 (0) 8 (2) 2

30
Table 10A: Summary of Impacts on Test Scores of School Infrastructure and Pedagogical Supplies (43 High Quality Studies)
Negative,
Significant Negative,
Insignificant Zero, or
insign. & no sign given
Positive, Insignificant
Positive, Significant
Total Studies
Textbooks/Workbooks 1 (1) 8 (4) 3 (1) 6 (4) 3 (2) 8 Desks/Tables/Chairs 0 (0) 0 (0) 0 (0) 4 (3) 3 (2) 4 Computers/Elec. game 1 (1) 9 (5) 0 (0) 8 (3) 4 (3) 6 Electricity 0 (0) 3 (2) 0 (0) 3 (2) 0 (0) 3 Blackboard/flip chart 0 (0) 2 (2) 0 (0) 2 (2) 2 (1) 3 Library 0 (0) 1 (1) 0 (0) 1 (1) 4 (2) 3 Roof/wall/floor 0 (0) 1 (1) 0 (0) 3 (2) 2 (1) 4
1. Figures are number of estimates; figures in parentheses are number of papers/studies. 2. Includes all school infrastructure characteristics with at least two separate papers/studies.
31
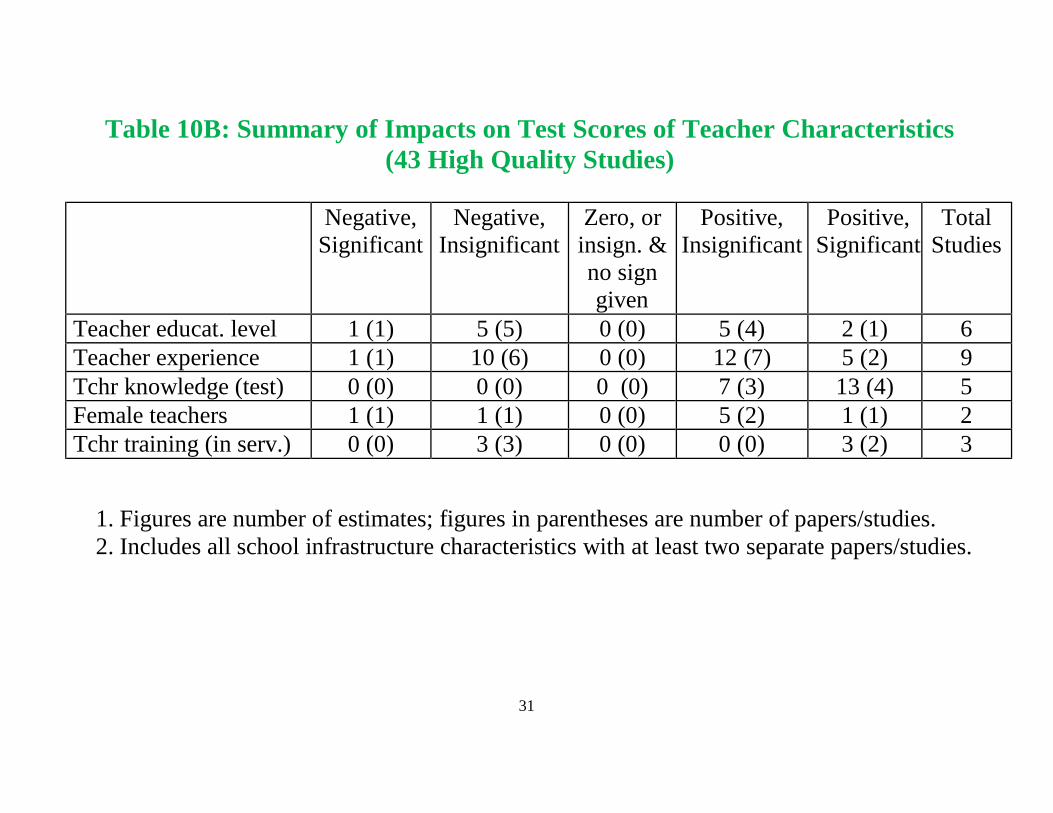
Table 10B: Summary of Impacts on Test Scores of Teacher Characteristics (43 High Quality Studies)
Negative,
Significant Negative,
Insignificant Zero, or
insign. & no sign given
Positive, Insignificant
Positive, Significant
Total Studies
Teacher educat. level 1 (1) 5 (5) 0 (0) 5 (4) 2 (1) 6 Teacher experience 1 (1) 10 (6) 0 (0) 12 (7) 5 (2) 9 Tchr knowledge (test) 0 (0) 0 (0) 0 (0) 7 (3) 13 (4) 5 Female teachers 1 (1) 1 (1) 0 (0) 5 (2) 1 (1) 2 Tchr training (in serv.) 0 (0) 3 (3) 0 (0) 0 (0) 3 (2) 3
1. Figures are number of estimates; figures in parentheses are number of papers/studies. 2. Includes all school infrastructure characteristics with at least two separate papers/studies.

32
Table 10C: Summary of Impacts on Test Scores of School Organization (43 High Quality Studies)
Negative,
Significant Negative,
Insignificant Zero, or
insign. & no sign given
Positive, Insignificant
Positive, Significant
Total Studies
Pupil-teacher ratio 14 (5) 18 (9) 1 (1) 10 (6) 3 (3) 14 Teacher absenteeism 4 (2) 2 (2) 0 (0) 0 (0) 0 (0) 2 School provides meals 0 (0) 1 (1) 0 (0) 0 (0) 2 (1) 2 Multi-grade teaching 4 (1) 0 (0) 0 (0) 5 (2) 1 (1) 2 Hours of school day 0 (0) 0 (0) 0 (0) 0 (0) 4 (2) 2 Tutoring 0 (0) 0 (0) 0 (0) 2 (1) 2 (1) 2 Contract teacher 1 (1) 0 (0) 0 (0) 1 (1) 4 (1) 2
1. Figures are number of estimates; figures in parentheses are number of papers/studies. 2. Includes all school infrastructure characteristics with at least two separate papers/studies.

33
Table 11: Summary of Impacts on Test Scores of School Variables (13 RCT Studies)
Negative,
Significant Negative,
Insignificant Zero, or
insign. & no sign given
Positive, Insignificant
Positive, Significant
Total Studies
Textbooks/workbooks 0 (0) 1 (1) 3 (1) 0 (0) 0 (0) 2 Computers/Elec. game 1 (1) 7 (4) 0 (0) 8 (3) 4 (3) 5 Blackboard/flip chart 0 (0) 1 (1) 0 (0) 0 (0) 0 (0) 1 Pupil-teacher ratio 3 (1) 2 (1) 0 (0) 0 (0) 0 (0) 1 School provides meals 0 (0) 1 (1) 0 (0) 0 (0) 0 (0) 1 Tutoring 0 (0) 0 (0) 0 (0) 0 (0) 2 (1) 1 Contract teachers 0 (0) 0 (0) 0 (0) 0 (0) 4 (1) 1 Comm. inform. campgn. 0 (0) 4 (1) 5 (1) 4 (1) 1 (1) 1 Merit-based scholarship 0 (0) 0 (0) 0 (0) 1 (1) 1 (1) 1
1. Figures are number of estimates; figures in parentheses are number of papers/studies. 2. Includes all school infrastructure characteristics with at least two separate papers/studies.

34
Table 12: Impacts of School and Teacher Variables on Time in School (All 79 Studies)
Negative, Significant
Negative, Insignificant
Zero, or insign. & no sign given
Positive, Insignificant
Positive, Significant
Total Studies
School Infrastructure Textbooks/workbooks 0 (0) 2 (2) 1 (1) 2 (1) 2 (2) 4 Library 0 (0) 0 (0) 0 (0) 0 (0) 2 (2) 2 Roof/wall/floor 0 (0) 1 (1) 0 (0) 0 (0) 1 (1) 2 Building new schools 0 (0) 0 (0) 0 (0) 1 (1) 4 (3) 3 School quality index 0 (0) 0 (0) 0 (0) 1 (1) 4 (2) 2
Teacher Characteristics Teacher educat. level 0 (0) 2 (2) 0 (0) 2 (2) 1 (1) 4 Teacher experience 1 (1) 0 (0) 0 (0) 4 (3) 2 (2) 5 Tchr training (in serv.) 1 (1) 2 (2) 0 (0) 0 (0) 0 (0) 2 School Organization Pupil-teacher ratio 0 (0) 3 (2) 0 (0) 2 (1) 2 (1) 3 Cost of attending 0 (0) 5 (3) 0 (0) 1 (1) 0 (0) 4 Merit based scholarship 0 (0) 1 (1) 0 (0) 2 (2) 0 (0) 2

35
Table 13: Impacts of School and Teacher Variables on Time in School (43 High Quality Studies)
Negative, Significant
Negative, Insignificant
Zero, or insign. & no sign given
Positive, Insignificant
Positive, Significant
Total Studies
School Infrastucture Textbooks/workbooks 0 (0) 2 (2) 1 (1) 2 (1) 2 (2) 4 Roof/wall/floor 0 (0) 1 (1) 0 (0) 0 (0) 1 (1) 2 Building new schools 0 (0) 0 (0) 0 (0) 1 (1) 4 (3) 3 Teacher Characteristics Teacher educat. level 0 (0) 2 (2) 0 (0) 2 (2) 1 (1) 4 Teacher experience 1 (1) 0 (0) 0 (0) 4 (3) 1 (1) 4 Tchr training (in serv.) 1 (1) 2 (2) 0 (0) 0 (0) 0 (0) 2 School Organization Pupil-teacher ratio 0 (0) 3 (2) 0 (0) 2 (1) 2 (1) 3 Cost of attending 0 (0) 5 (3) 0 (0) 1 (1) 0 (0) 4 Merit based scholarship 0 (0) 1 (1) 0 (0) 2 (2) 0 (0) 2

36
Table 14: Impacts of Teacher and School Variables on Time in School
(13 RCT Studies)
Negative, Significant
Negative, Insignificant
Zero, or insign. & no sign given
Positive, Insignificant
Positive, Significant
Total Studies
Textbooks/workbooks 0 (0) 0 (0) 1 (1) 0 (0) 2 (2) 2 Building new schools 0 (0) 0 (0) 0 (0) 1 (1) 3 (2) 2 School provides meals 0 (0) 0 (0) 0 (0) 1 (1) 0 (0) 1 Merit based scholarship 0 (0) 1 (1) 0 (0) 1 (1) 0 (0) 1
1. Figures are number of estimates; figures in parentheses are number of papers/studies. 2. Includes all school infrastructure characteristics with at least two separate papers/studies.

37
Table 15: Summary of Impacts in Tables 7-11 (Number of studies in parentheses)
Teacher/School Variable All 79 Studies 43 High Quality Studies RCTs School Infrastructure Textbooks/workbooks Mostly positive (21) Inconclusive (8) No signif. effect (2) Desks/Tables/Chairs Almost all positive (11) All positive (4) -- Computers/Elec. game Mostly positive (8) Positive?/Ambig. (6) Inconclusive (5) Electricity Mostly positive (6) No signif. effect (3) -- School infrastr. index Mostly positive (6) -- -- Blackboard/flip chart Mostly positive (6) Positive?/Ambig. (3) No signif. effect (1) Library Mostly positive (6) Mostly positive (3) -- Roof/wall/floor Mostly positive (4) Mostly positive (4) -- Teacher Characteristics Teacher educat. level Mostly positive (24) Inconclusive (6) -- Teacher experience Positive?/Ambig. (20) Positive?/Ambig. (9) -- Tchr knowledge (test) Mostly positive (9) All positive (5) -- Female teachers Inconclusive (11) Inconclusive (2) -- Tchr training (in serv.) Mostly positive (11) Positive?/Ambig. (3) -- Teacher quality index Mostly positive (2) -- -- Teaching degree Positive?/Ambig. (2) -- -- Principal experience Mostly positive (2) -- -- Principal education Inconclusive -- --

38
School Organization Pupil-teacher ratio Negative?/Ambig. (29) Negative?/Ambig. (14) Negative (1) Teacher absenteeism Almost all negative (5) All negative (2) -- Tchr assigns homework Mostly positive (5) -- -- School provides meals Positive?/Ambig. (4) Positive?/Ambig. (2) No signif. effect (1) Multi-grade teaching Inconclusive (4) Inconclusive (2) -- Hours of school day Positive?/Ambig. (4) All positive (2) -- Tutoring Positive?/Ambig. (3) All positive (2) Positive (1) Teacher salary Almost all positive (3) -- -- Contract teacher Positive?/Ambig. (2) Positive?/Ambig. (2) Positive (1) Expenditure/pupil Inconclusive (2) -- -- Cost of attending Inconclusive (2) -- -- Total schl enrollment Inconclusive (2) -- -- Group work Mostly positive (2) -- -- Tchr gives examples Inconclusive (2) -- -- Student attendance All positive (2) -- -- Parent follow up Mostly positive (2) -- -- Commun. Inform. Camp. -- -- Positive?/Ambig. (1) Merit-based scholarship -- -- Positive (1)

39
Table 16: Summary of Impacts in Tables 12-14 (Number of studies in parentheses)
Teacher/School Variable All 79 Studies 43 High Quality Studies RCTs School Infrastructure Textbooks/workbooks Positive?/Ambig. (3) Positive?/Ambig. (3) Positive (1) Library Positive (2) -- -- Roof/wall/floor Positive?/Ambig. (2) Positive?/Ambig. (2) -- Building New Schools Positive (3) Positive (3) Positive?/Ambig. (2) School quality index Positive (2) -- Teacher Characteristics Teacher education level Positive?/Ambig. (4) Positive?/Ambig. (4) -- Teacher experience Positive?/Ambig. (5) Positive?/Ambig. (4) -- Tchr training (in serv.) Mostly negative (2) Mostly negative (2) -- School Organization Pupil-teacher ratio Inconclusive (3) Inconclusive (3) -- School provides meals -- -- Inconclusive (1) Cost of attending Negative?/Ambig (4) Negative?/Ambig (4) -- Merit-based scholarship Inconclusive (2) Inconclusive (2) Inconclusive (1)

40
Summary 1. Can't draw definite conclusions about pupil teacher ratio, but it is unlikely to have a strong negative impact on learning; the 79 and 43 studies are rather inconclusive, and we have only 1 RCT (and that confounds pupil-teacher ratio with contract teacher). 2. The evidence suggests electrification has little effect (surprising?). 3. Some evidence that fixing walls/roofs/floors will have positive effects, but this is based on only 4 high quality studies. 4. Little evidence in favor of provision of school meals and community information campaigns. 5. Textbooks/workbooks unlikely to have big effects; the Kenya paper shows how something that should work can go wrong.

41
6. Desks/tables/chairs seem promising, though based on only 4 high quality studies (and no RCTs). 7. Blackboards/flipcharts are not very promising. 8. Libraries seem to be promising, 9. Introduction of computers, internet etc. has mixed results at best, which casts doubt on this now popular and expensive policy. 10. Teacher education, experience, female teachers and in service training have mixed effects; little reason to push in these directions. 11. In contrast, teacher knowledge of subjects they teach seems very important, as one would expect.

42
12. Little evidence (& no high quality studies) of principal characterist. 13. Not enough evidence on (formal) teaching degree or teacher salary. 14. Multigrade teaching maybe not so bad, but just 2 high qual. studies 15. While the evidence is limited, teacher absenteeism is likely to have a major negative impact on learning, which is quite intuitive. 16. Student time in school (longer school days and higher attendance) increase learning (would be surprising if they didn't!) 17. Some pedagogical techniques show promise (group work, teacher assigns homework, meetings with parents), others don't (teacher uses examples in class), but none has been examined in a high quality study or an RCT. Can they be clearly defined?
18. Tutoring seems to hold promise.

43
Future Research Implications 1. Little need for more studies on things that have been examined a lot and have at best mixed results, in particular pupil teacher ratio, textbooks/workbooks, and teacher education and experience. 2. Also little need to study teacher knowledge, student time in school, and teacher attendance since it is pretty clear (either from studies or common sense) that all three work. 3. Perhaps more studies on things that appear most promising: desks/tables/chairs, library, contract teachers and tutoring. 4. More studies of computers. internet, etc. are needed given their popularity and the mixed findings thus far.

44
5. Maybe more studies on what, if any, principal characteristics lead to higher test scores. But principals are hard to study (U.S. work). 6. Maybe more studies on impact of teaching degree and/or teacher salary (latter gets into area of teacher incentives). For salaries it is very important to distinguish between level and form/distribution of salaries across teachers. 7. Maybe some RCTs on pedagogical methods? (Eric is skeptical) 8. Would be useful to have RCTs of aid organizations projects, hundreds of findings could turn up some useful regularities. 10. Big question: Is there a role for researchers to do more studies of school and teacher characteristics? I think so. If schools and teachers go in for expensive laptops or I-pads for every kid, maybe we need some good studies of them to see if this makes sense.