schoolboardof browardcounty disparitystudyfindings
TRANSCRIPT

October 27, 2015 (Revised)
SCHOOL BOARD OFBROWARD COUNTY
DISPARITY STUDY FINDINGS
1

PRESENTATION AGENDA
• Describe Study Objectives• Present Study Findings• Outline Race and Gender-Conscious
Remedies• Present Administrative Recommendations• Outline Next Steps
2

DISPARITY STUDYOBJECTIVES
• Identify Prime Contract and Subcontract Awards and Payments
• Determine Extent of Any Prime Contract or Subcontract Disparity
• Determine How SBBC Practices Affect Any Documented Disparity
• Assess Effectiveness of M/WBE Program• Recommend Best Management Practices
3

STUDY PROFILE
Study Period Fiscal Years July 1, 2008 – June 30, 2013
Professional Services
Construction
Contractual Services (Other Professional and Non-Professional Services)
Commodities
4
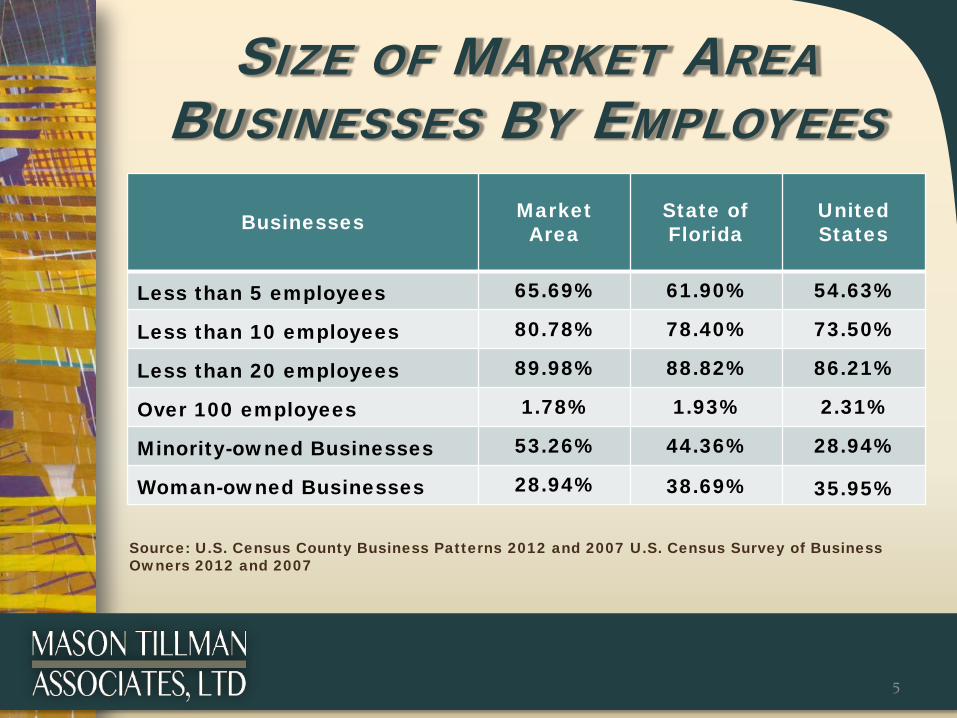
SIZE OF MARKET AREABUSINESSES BY EMPLOYEES
Businesses Market Area
State of Florida
United States
Less than 5 employees 65.69% 61.90% 54.63%
Less than 10 employees 80.78% 78.40% 73.50%
Less than 20 employees 89.98% 88.82% 86.21%
Over 100 employees 1.78% 1.93% 2.31%
Minority-owned Businesses 53.26% 44.36% 28.94%
Woman-owned Businesses 28.94% 38.69% 35.95%
Source: U.S. Census County Business Patterns 2012 and 2007 U.S. Census Survey of Business Owners 2012 and 2007
5

6
Businesses State ofFlorida
Market Area
All Business Enterprises 1,908,564 759,649
Total MBEs 680,069 428,548
Total MBE Percentage 35.63% 56.41%
Total Non-MBEs 1,228,495 331,101
Total Non-MBE Percentage 64.37% 43.59%
NUMBER OF MARKET AREABUSINESSES BY ETHNICITY
Source: U.S. Census Survey of Business Owners 2007

GEOGRAPHIC DISTRIBUTIONOF PRIME CONTRACT
DOLLARS
Total Dollars
Within Market Area$556,147,401
66.38%
Outside Market Area$281,691,556
33.62%
FY July 1, 2008 – June 30, 2013Market Area: Broward County,
Palm Beach County and Miami-Dade County
7

DISTRIBUTION OF ALLPRIME CONTRACT DOLLARS BY
VENDORTotal Dollars $837,838,957 Total Utilized Vendors 3,584Total Prime Contracts 111,107
8
Vendor Total DollarsAwarded
Percent of Dollars
Number of Contracts
Percent of Contracts
47 (1.31%) Vendors Received $ 418,998,989 50% 29,936 26.94%
126 (3.52%) Vendors Received $ 586,585,522 70% 52,842 47.56%
3,458 (96.48%) Vendors Received $ 251,253,435 30% 58,265 52.44%

PRIME CONTRACT DISPARITY:CONSTRUCTION
9
Ethnicity/Gender
Percent Available
FormalContracts
$50,000 and Over
Dollars Lost
InformalContractsLess Than
$50,000
Dollars Lost
African Americans
15.30% 2.71% $29,983,156 0.02% $1,516,216
Asian-Pacific Americans
1.53% 0.86% $1,588,157 0.00% $151,786
Subcontinent Asian Americans
0.76% 0.00% $1,822,208 0.00% $75,893
Hispanic Americans
19.12% 21.31% $0 5.48% $1,353,967
Native Americans
0.57% 0.00% $1,366,656 0.00% $56,920
Caucasian Females
11.66% 10.49% $2,785,721 8.56% $308,181
Non-minority Males
51.05% 64.62% $0 85.95% $0

10
Ethnicity/Gender
Percent Available
FormalContracts
$195,000 and Over
Dollars Lost
Informal ContractsLess Than
$50,000
Dollars Lost
African Americans
8.29% 5.57% $244,325 1.95% $48,908
Asian-Pacific Americans
2.50% 14.30% $0 0.00% $19,289
Subcontinent Asian Americans
4.21% 0.00% $378,404 0.00% $32,487
Hispanic Americans
47.11% 24.78% $2,006,194 2.54% $343,845
Native Americans
0.00% 0.00% $0 0.00% $0
Caucasian Females
7.76% 0.00% $697,683 14.73% $0
Non-minority Males
30.13% 55.35% $0 80.78% $0
PRIME CONTRACT DISPARITY:PROFESSIONAL SERVICES

11
Ethnicity/Gender
Percent Available
Formal Contracts$50,000 to $499,999
Dollars Lost
InformalContractsLess Than
$5,000
Dollars Lost
African Americans
16.21% 6.06% $6,520,950 1.54% $2,129,457
Asian-Pacific Americans
1.21% 0.00% $776,263 0.01% $173,174
Subcontinent Asian Americans
1.66% 0.00% $1,067,362 0.21% $211,252
Hispanic Americans
21.34% 8.49% $8,255,578 9.94% $1,654,208
Native Americans
0.15% 0.00% $97,033 0.00% $21,917
Caucasian Females
22.50% 10.16% $7,926,339 12.59% $1,438,424
Non-minority Males
36.94% 75.28% $0 75.71% $0
PRIME CONTRACT DISPARITY:CONTRACTUAL SERVICES

12
Ethnicity/Gender
Percent Available
Formal Contracts$50,000 to $499,999
Dollars Lost
InformalContractsLess Than
$5,000
Dollars Lost
African Americans
12.20% 1.44% $12,496,026 0.79% $10,891,038
Asian-Pacific Americans
0.58% 0.00% $672,587 0.07% $482,960
Subcontinent Asian Americans
1.20% 0.00% $1,393,216 0.32% $837,393
Hispanic Americans
19.85% 14.16% $6,608,291 3.63% $15,490,651
Native Americans
0.21% 0.23% $0 0.15% $56,288
Caucasian Females
15.96% 3.70% $14,240,885 3.39% $11,999,985
Non-minority Males
50.00% 80.46% $0 91.64% $0
PRIME CONTRACT DISPARITY:COMMODITIES

SUBCONTRACT DISPARITY: CONSTRUCTION
Ethnicity PercentAvailable
Percent of Dollars
Dollars Lost
African Americans 13.44% 1.21% $10,743,422
Asian-Pacific Americans 1.31% 0.06% $1,094,673
Subcontinent Asian Americans 0.82% 0.95% $0
Hispanic Americans 16.56% 15.96% $528,229
Native Americans 0.66% 0.11% $483,538
Caucasian Females 11.48% 9.07% $2,115,828
Non-minority Males 55.74% 72.65% $0
TOTAL 100.00% 100.00%
13

SUBCONTRACT DISPARITY: PROFESSIONAL SERVICES
Ethnicity PercentAvailable
Percent of Dollars
Dollars Lost
African Americans 7.83% 1.07% $545,138
Asian-Pacific Americans 2.29% 0.00% $184,596
Subcontinent Asian Americans 4.10% 2.81% $103,974
Hispanic Americans 43.98% 19.42% $1,979,783
Native Americans 0.00% 0.00% $0
Caucasian Females 8.55% 9.90% $0
Non-minority Males 33.25% 66.80% $0
TOTAL 100.00% 100.00%
14

RACE AND GENDER CONSCIOUS
RECOMMENDATIONS
15

SUBCONTRACT REMEDIES
• Subcontract Goals– Set Narrowly Tailored Overall Subcontract
Goals Based on Disparity Findings by Industry
Group Construction Professional Services
African Americans 13.44% 7.83%Asian-Pacific Americans 1.31%
Hispanic Americans 43.98%
Caucasian Females 11.48%
16

PRIME CONTRACT REMEDY: PROFESSIONAL SERVICES
• Incentive Credits – Assign 10% to 15% of the Maximum Evaluation
Points to M/WBE Prime Consultants
17

PRIME CONTRACT REMEDY: CONTRACTUAL SERVICES
• Incentive Credits – Assign 10% to 15% of the Maximum Evaluation
Points to M/WBE Prime Consultants
Ethnicity/Gender
African Americans
Asian-Pacific Americans
Subcontinent Asian Americans
Hispanic Americans
Caucasian Females
18

PRIME CONTRACT REMEDY: CONSTRUCTION
• Apply Bid Discount on Low Bid Contracts– Reduce Eligible Bidder’s Price by 5% for
Evaluation Purposes Only
Ethnicity/Gender
African Americans
Asian-Pacific Americans
Hispanic Americans
Caucasian Females
19

PRIME CONTRACT REMEDY: COMMODITIES
• Apply Bid Discount on Low Bid Contracts– Reduce Eligible Bidder’s Price by 5% for
Evaluation Purposes Only
Ethnicity/Gender
African AmericansSubcontinent Asian
AmericansHispanic Americans
Caucasian Females
20

RACE AND GENDER NEUTRAL
RECOMMENDATIONS
21

ADMINISTRATIVERECOMMENDATIONS
• Create Unbundling Process• Revise Bonding Requirements• Standardize Pre-qualification Criteria*• Expand Solicitation Notification• Provide Debriefing Sessions for Unsuccessful
Bidders• Implement Formal Dispute Resolution
Standards• Develop Expedited Subcontractor Payment
Program*Recommendation Currently in Progress
22

ADMINISTRATIVERECOMMENDATIONS
• Enhance the Direct Owner Purchasing Program*
• Use Direct Contracting to Award Small Contracts
• Establish Low-Cost Post-Award Supportive Services
• Develop Contract Opportunities Forecast• Conduct Routine Post-Award Contract
Compliance Monitoring*Recommendation Currently in Progress
23

WEBSITE ENHANCEMENTRECOMMENDATIONS
• Website Consolidation– Provide a Uniform URL for SBBC Departments– Use a Single Logo Across Departments – Offer Mobile-Optimized Website
• Procurement & Warehousing Services Department Website* – Maintain Links– Provide a Consistent Layout– Update Content
*Recommendation Currently in Progress
24

TRACKING AND MONITORINGRECOMMENDATIONS
• Prime Contracts– Centralize a Financial Management System– Link Purchase Orders to Prime Contract– Link Supplier Payments to Prime Contract– Require Subcontractor List in Prime Bid – Create Module for Subcontract Award and Payments– Track Type of Work by Industry Code
• Subcontracts– Track and Report All Subcontractors, Truckers and
Suppliers– Create a Subcontractor Utilization Form – Institute a System for Prime Contractors to Input
Subcontractor Payments into Electronic Database
25

NEXT STEPS• Acknowledge Completion of the 2015
Disparity Study Report• Implement Communications Plan• Secure Community and Technical
Assistance to Implement Disparity Study Recommendations (Phase-II Project Plan)
• Revise Procurement Policies Pertaining to Adopted Recommendations
• Continue to Implement and Refine Recent Action and Activities Targeted at Improving Participation
26

NEXT STEPS
Review SBBC Policies:• Policy 3320 - Purchasing Policies• Policy 7007 - Supplier Diversity and
Outreach Program• Policy 7003 - Pre-Qualification of
Contractors and Selection of Architects, Engineers, Design Builders, Construction Managers and Total Program Managers Pursuant to the Consultants Competitive Negotiation Act
27

THANK YOU!
謝謝!¡Gracias!
Cпасибо!
cảm ơn!
Merci!감사합니다!धन्यवाद!
28

APPENDIX
29

SPOTLIGHT: LIMITED CAPITAL DOLLARSAND LARGE CONSTRUCTION CONTRACTS
Project Name Prime Name AwardAmount
Cooper City High School Skanska USA Building, Inc. $19.5M
Fort Lauderdale High School Kaufman Lynn Construction, Inc.
$14.9M
Blanche Ely High School Balfour Beatty Construction $5.9M
South Broward High School Recreational Design & Construction, Inc.
$3.5M
Fort Lauderdale High School KVC Constructors, Inc. $3.2M
Southwest Bus Facility TGSV Enterprises, Inc. $2.3M
Sheridan Technical Center Burke Construction Group, Inc.
$1.3M
Hallandale High School National Roofing Company $1.2M
30

ACTION & ACTIVITIES FORIMPROVED PARTICIPATION
• Aggressive Outreach to Build Certified and Pre-qualified Vendor Pool of M/WBEs
• Work with District Staff to Ensure that M/WBEs are Solicited in Small Dollar Procurements (2 of 3 Vendors Must be M/WBEs)
• Increased Points Awarded for M/WBE Participation in the Request for Proposal Evaluation Criteria
• M/WBE Participation Percentage and Subcontractor Name in Agreements
31

ACTION & ACTIVITIES FORIMPROVED PARTICIPATION
• Review Solicitations to Ensure M/WBE Language is Included
• Increased Notifications to M/WBEs of Current and Up-coming Procurement Opportunities
• Provide One-on-One Business Counseling on BCPS Procurement Process
• Partner with Small and Minority Business Advocates in Providing Information to Build Business Capacity
• Researched Florida Service Disabled Veteran Business Enterprise Preferences and Recommended Options for Program Expansion
32

THE SCHOOL BOARD OFBROWARD COUNTY, FLORIDA
Donna P. Korn, ChairDr. Rosalind Osgood, Vice Chair
Robin BartlemanHeather P. Brinkworth
Abby M. FreedmanPatricia Good
Laurie Rich LevinsonAnn MurrayNora Rupert
Robert W. RuncieSuperintendent of Schools
33