schools block dataset technical specification · this document provides a full technical...
TRANSCRIPT
Schools block
dataset technical
specification: 2019
to 2020
For use in schools block allocations
December 2018

2
Contents
Introduction 3
Using the data to allocate school budgets 7
Local adjustments to the supplied schools block data 8
Schools block schools and pupils 11
School information 12
Detailed specification for individual factors 15

3
Introduction
This document provides a full technical specification for the school level data that has
been made available to local authorities in the prepopulated schools block data sheet of
the authority proforma tool (APT), for use in allocating their 2019 to 2020 schools block
funding to schools. We have updated the 2019 to 2020 dataset to use the October 2018
census data. These changes are summarised below.
This note accompanies the separate APT instructions document which has also been
prepared by the Education and Skills Funding Agency (ESFA).
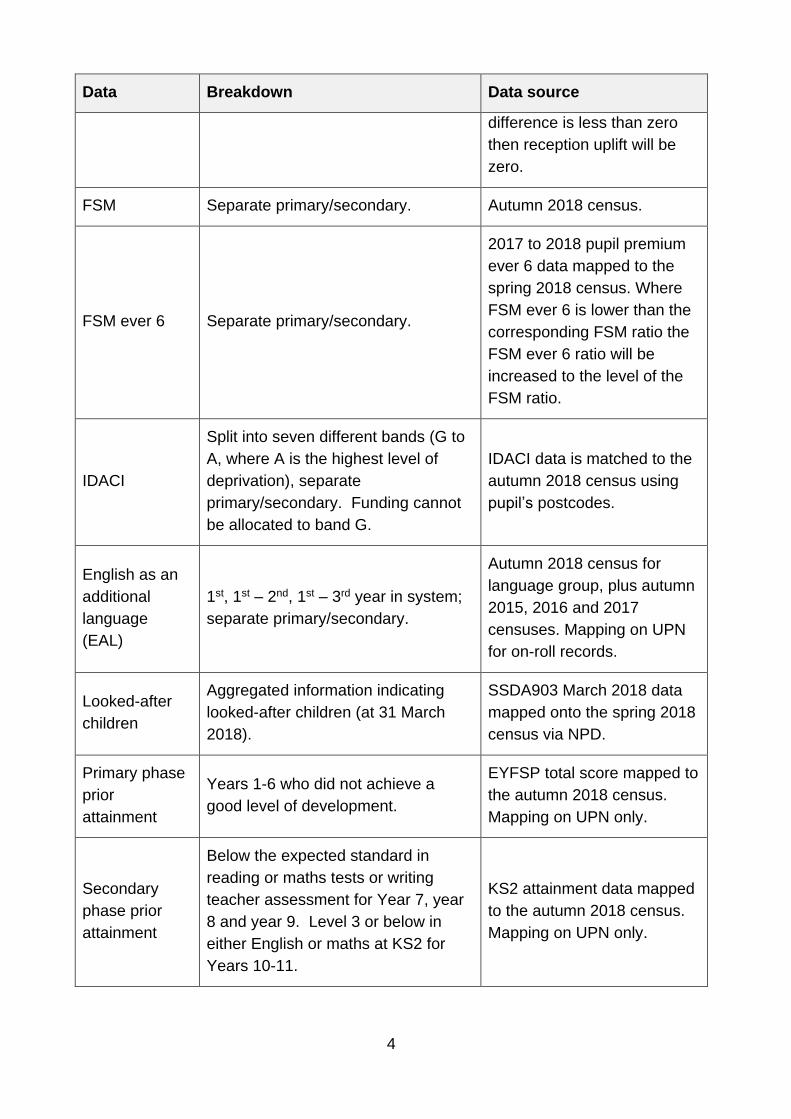
The data contained in the December 2018 APT is based on autumn (October) 2018
School Census returns, or other existing data collections. The table below outlines what
data will be provided, and summarises the source data for each indicator. The indicators
and their descriptions were set out in the pre-16 schools funding: guidance for 2019 to
2020. This document now provides more explanation on the construction of the data.
Data Breakdown Data source
School list
LAESTAB, URN, local authority,
phase, primary year groups,
secondary year groups.
Mainstream schools on
autumn 2018 census. URN is
matched from the get
information about schools
(GIAS) tool on gov.uk.
Academy type n/a
Taken from the Department’s
records – showing status as
at 31 October 2018.
London fringe n/a
District as mapped from the
school postcode in the
autumn 2018 census.
Year groups
Primary and secondary for middle
schools. Primary and secondary for
all schools. Key stage 3 and key
stage 4 for secondary schools.
Autumn 2018 census.
Number on roll
(NOR)
Primary, secondary, reception, years
1-6, key stage 3, key stage 4, year 7,
year 8, year 9, years 10-11.
Autumn 2018 census.
Reception
difference n/a
Difference between on roll in
Year R, autumn 2017 census
and Spring 2018 census. If
4
Data Breakdown Data source
difference is less than zero
then reception uplift will be
zero.
FSM Separate primary/secondary. Autumn 2018 census.
FSM ever 6 Separate primary/secondary.
2017 to 2018 pupil premium
ever 6 data mapped to the
spring 2018 census. Where
FSM ever 6 is lower than the
corresponding FSM ratio the
FSM ever 6 ratio will be
increased to the level of the
FSM ratio.
IDACI
Split into seven different bands (G to
A, where A is the highest level of
deprivation), separate
primary/secondary. Funding cannot
be allocated to band G.
IDACI data is matched to the
autumn 2018 census using
pupil’s postcodes.
English as an
additional
language
(EAL)
1st, 1st – 2nd, 1st – 3rd year in system;
separate primary/secondary.
Autumn 2018 census for
language group, plus autumn
2015, 2016 and 2017
censuses. Mapping on UPN
for on-roll records.
Looked-after
children
Aggregated information indicating
looked-after children (at 31 March
2018).
SSDA903 March 2018 data
mapped onto the spring 2018
census via NPD.
Primary phase
prior
attainment
Years 1-6 who did not achieve a
good level of development.
EYFSP total score mapped to
the autumn 2018 census.
Mapping on UPN only.
Secondary
phase prior
attainment
Below the expected standard in
reading or maths tests or writing
teacher assessment for Year 7, year
8 and year 9. Level 3 or below in
either English or maths at KS2 for
Years 10-11.
KS2 attainment data mapped
to the autumn 2018 census.
Mapping on UPN only.

5
Data Breakdown Data source
Mobility
Start date in education at any school
in England was in last three
academic years; separate
primary/secondary.
Autumn 2018 census.
Sparsity Primary, secondary, middle, all-
through. Autumn 2018 census, GIAS.
Table 1 Data included in the December APT
The autumn 2018 census day was 4 October 2018 and therefore the data reflects the
status of schools at that date. The final data used is the data in the database at the point
of its closure on 1 December 2018. All data for maintained schools will have been first
approved by the local authority prior to being used by the department.
The pupil level indicators for numbers on roll, IDACI, free school meals (FSM) eligibility
and mobility have been calculated from data collected in the autumn 2018 census. This
data has also been linked, using the UPN collected in the autumn census, to data held in
the department's national pupil database (NPD) to create the EAL and prior attainment
indicators. This data extract has been prepared prior to the autumn 2018 census being
formally matched into the NPD. The IDACI indicators are based on the relationship
between pupil postcode, local authority district and IDACI scores.
Changes made to the dataset for the 2019 to 2020 formula, compared to that used for
the 2018 to 2019 formula, are:
primary pupil number breakdown updated to reflect years 1 to 6 pupils on roll.
This is used in the calculation of funding through the primary prior attainment
factor. As all pupils have been assessed under the new tests there is now only
one low attainment ratio for primary pupils.
secondary pupil number breakdown updated to reflect year 7, year 8, year 9
and years 10 to 11 pupils on roll. The secondary low attainment ratio is now
split into a ratio for pupils in each of the years 7, 8 and 9 and another for years
10 to 11 to reflect the change in the new KS2 assessments. This is used in the
calculation of funding through the secondary prior attainment factor.
any pupils recorded in year X are now included in the data. These pupils are
allocated to a year group based on their age. Only those pupils in year X aged
between 4 and 15 are included.

6
More information about the school census can be found in school census 2018 to 2019:
guide for schools and local authorities.
If you have any queries about this specification, please contact us.

7
Using the data to allocate school budgets
For each of the pupil-led factors there are one or more allowable indicators. The pupil led
factors are:
age weighted pupil units (AWPU)
deprivation
English as an additional language (EAL)
prior attainment
mobility
looked-after children (LAC)
For AWPU, the indicator to be used is the number on roll (NOR) in total and for primary,
key stage 3 (KS3) and key stage 4 (KS4). For the other indicators, schools attract funding
through pupil units. These pupil units are calculated as the appropriate NOR weighted by
the proportion of pupils that qualify under the indicator. So the pupil units for primary FSM
would be given by:
NOR Primary ∗ Number of Primary Pupils elegible for FSM
Number of Primary Pupils with valid FSM response
Or, from the supplied dataset:
NOR Primary * Primary FSM proportion
All the indicator data (except NOR) is presented in the APT in the form of a decimal
proportion that should be applied to the NOR. This means that if authorities record a
change to a school’s NOR figures in the Inputs & Adjustments sheet of the APT (see the
circumstances described on the next page in which adjustments to NOR figures can be
made), then the proportion in the schools block dataset can still be multiplied by them to
derive the appropriate pupil units. The calculations of the proportions always exclude
pupils with a NULL value for the required response. This, plus the facility for local
authorities to alter the NOR, can result in pupil units for the indicators which are not
whole numbers. Values in the schools block are shown to 2 decimal places but this is
presentational only and numbers are not rounded.

8
Local adjustments to the supplied schools block data
In some cases it will be necessary to use a local calculation or estimate for an indicator,
based on the technical descriptions given in this document, to ensure the data used in
the APT to calculate school budgets is representative. This only applies to individual
schools. This section describes when and how this should take place. Adjustments
should be recorded via the Inputs & Adjustment sheet of the APT, and a clear
explanation for the change must be provided in each case.

9
Schools undergoing change
In the case of a planned amalgamation, the data should be taken from each of the
schools as they appear in the Schools Block Data sheet of the APT and then merged
using weighted sums for each of the factors. In the example shown in the table below,
Old Street Infants and Old Street Juniors are combining to form New Street Primary. The
primary FSM proportion for the new school is calculated as the weighted average of the
relevant proportion figures for the former schools. A similar calculation should be done for
all the other pupil-led factors.
School NOR Primary Primary FSM proportion
Old Street Infants 300 0.10
Old Street Juniors 100 0.05
New Street Primary 300+100=400 (300 ∗ 0.10) + (100 ∗ 0.05)
300 + 100= 0.0875
Table 2: example weighted average calculation
In the case of a brand new school with no relevant predecessors, or a school converting
from the private sector, a local estimate should be used based on similar schools in the
local authority for the first year.
Individual data points that are not representative
For some schools the indicator data contained in the schools block dataset will not be
representative. A common example of this relates to the mobility indicator. If a school had
opened in April two years ago, then the majority of its pupils will be classed as mobile.
This can often occur for sponsored academies, with many pupils classed in the census
data as joining the school on the date it became an academy, rather than the date they
joined the new school or its direct predecessor. In this case, it would be reasonable to
use a local estimate for the mobility indicator, using the method outlined in the mobility
section below. Making such a change does not require prior ESFA approval, but clear
explanations for any such changes must be provided on the Inputs & Adjustments sheet
of the APT.
Anomalous primary/secondary pupils
Where a primary school has only one or two secondary phase pupils in the Schools
Block Data sheet of the APT, or conversely for a secondary school with a small number
of primary phase pupils, this may suggest a school census recording error. Local
authorities may wish to verify whether these are errors, and if so amend individual
schools’ NOR data accordingly, to avoid incorrect formula allocations. Making such a
change does not require prior ESFA approval, but clear explanations for any such
changes must be provided on the Inputs & Adjustments sheet of the APT.

10
Sparsity distances
Local authorities can make exceptional applications for schools that would have had
significantly higher distances if road distances had been used instead of crow flies
distances and would not otherwise have qualified for the sparsity factor.
Similarly, exceptional applications can be made for schools that open after the distances
have been calculated. An existing school that qualifies for sparsity funding in the data
provided will not lose that funding in-year if a new school opened nearby. For schools
that may qualify for sparsity funding as a result of another school nearby closing, an
exceptional application should be agreed with the relevant schools forum, and submitted
to the ESFA for approval.
Applications should have been made by the 20 November 2018 deadline.

11
Schools block schools and pupils
All mainstream schools that are recorded on the autumn 2018 census are included in the
Schools Block Data sheet of the APT. This covers all mainstream schools open on
census date except the two city technology colleges. Special schools, alternative
provision schools (AP), pupil referral units (PRUs), early years providers and other
institutions without schools block pupils are excluded.
The school filters applied to the census data to identify the schools included in the
dataset are:
the school type code is a value less than 50 or is equal to 55
the phase is either ‘PS’ (primary, including academies), ‘MP’ (middle, deemed
primary), ‘MS’ (middle, deemed secondary), ‘SS’ (secondary, including
academies), or ‘AT’ (all-through excluding PRUs)
The pupil filters applied ensure that only pupils aged 4 or above at the start of the 2018 to
2019 academic year that are in national curriculum year groups R to 11 are counted.
Note that pupils are counted as headcount not full time equivalent. These are:
On_Roll = 1 - the pupil must be recorded in autumn 2018 census as on roll at a
school passing the school-level filter
Enrol_Status in (‘C’, ‘M’) - the pupil’s on-roll status at the school is either ‘C’ or ‘M’;
the pupil must either be solely registered at the school, or if dual-registered have
their main registration at the school
and either
NC_Year_Actual in (‘R’, ‘1’, ‘2’, ‘3’, ‘4’, ‘5’, ‘6’, ‘7’, ‘8’, ‘9’, ‘10’, ‘11’) and
Age_At_Start_Of_Academic_Year >= 4 - the pupil must be recorded in the autumn
2018 census as in national curriculum year groups R to 11 inclusive and the pupil
must be aged 4 or more as at 31 August 2018
or
NC_Year_Actual = ‘X’ and Age_At_Start_Of_Academic_Year >= 4 and
AgeAtStartOfAcademicYear < 16) - the pupil must be recorded in the autumn 2018
census as in year X (not following the national curriculum) and the pupil must be
aged between 4 and 15 as at 31 August 2018
The dataset only includes pupils which pass both the school and pupil filters.

12
School information
This section explains how the fields in the dataset which provide information about each
school are obtained. It also describes how the London fringe, NOR and reception
difference figures are produced.
School information
These fields are taken from the autumn 2018 census, except for the URN and the school
name which are mapped from GIAS:
URN
LAEstab
school name
phase
number of primary year groups for middle schools
number of secondary year groups for middle schools
number of primary year groups for all schools
number of secondary year groups for all schools
number of key stage 3 year groups for all schools
number of key stage 4 year groups for all schools
Academy type
This field contains the value 0 for maintained schools and Recoupment Academy for
academies. Flagging these in the schools block dataset aims to facilitate correct
recording. The valid values for this field are:
Recoupment Academy
0
London fringe
For the five local authorities who have some of their schools within the London fringe
area (Buckinghamshire, Essex, Hertfordshire, Kent and West Sussex), we have
determined an appropriate uplift that should be applied to the affected schools’ budgets.
The uplift was calculated using the specific cost of teaching staff within the different pay
band areas and the proportion of school expenditure that goes on teaching staff. Using
the national distribution of teaching staff by pay band spine point (School Workforce
Census, 2013) and spine point salary data (School Teachers’ Pay and Conditions
Document 2013) we calculated the average uplift between the London fringe and the rest
of England teacher pay band areas to be 2.96%.
Analysis of the financial year 2012 to 2013 section 251 outturn reporting lines indicated
that 53% of school expenditure goes on teaching staff costs. On this basis, the uplift for
London fringe schools was 53% of 2.96% which gives a value of 1.56% to be applied to

13
the school formula funding – excluding factors that should be paid as actual, such as
rates, PFI, split-site and exceptional circumstances.
The districts in the five affected local authorities that fall within the London fringe are:
Buckinghamshire: Chiltern, South Bucks
Essex: Basildon, Brentwood, Epping Forest, Harlow
Hertfordshire: Broxbourne, Dacorum, East Hertfordshire, Hertsmere, St Albans,
Three Rivers, Watford, Welwyn Hatfield
Kent: Dartford, Sevenoaks
West Sussex: Crawley
All fringe schools will have the value 1.0156360164 for this indicator; all other schools will
have the value 1.
School number on roll
NOR
NOR Primary
NOR Reception
NOR Y1-6
NOR Secondary
NOR KS3
NOR KS4
NOR Y7
NOR Y8
NOR Y9
NOR Y10-11
Pupils have been counted by headcount, irrespective of whether or not they are part
time. Pupils recorded in national curriculum year groups R to 6 are classed as in the
primary phase and those in year groups 7 to 11 are classed as in the secondary phase.
Primary pupils are additionally split into reception pupils and pupils in years 1 to 6 and
secondary pupils are additionally split into key stage groups: KS3 (years 7 to 9) and KS4
(years 10 to 11) and individual years 7 to 9 and years 10 to 11.
The NOR figures are calculated from the autumn 2018 census as the number of pupils at
each school passing the pupil filters described in the “Schools block schools and pupils”
section of this document, whose national curriculum year group is in the relevant range.
Pupils recorded in year X in the October census aged between 4 and 15 are now
included in the data. These pupils are allocated to a year group based on their age at the
start of the academic year. The table below shows the year to which these pupils will be
assigned.

14
Table 3: schools block year group for pupils in recorded in year group X
For total NOR, the range is years R to 11 (including pupils in year X allocated to years R
to 11).
Reception difference
The difference between the number of pupils on roll in reception (only those pupils aged
4 and over at the start of the academic year) in each school between the autumn 2017
and spring (January) 2018 censuses is provided in the dataset. This is calculated by
subtracting the total number of year R pupils in autumn 2017 from the total in spring
2018, or given as zero if the result of this calculation is negative. If there are no year R
pupils at the school then the result is 0. This is illustrated in the table below.
URN
Number of pupils in year R
(counting rules applied)
(2) – (1) Reception
difference
October 2017 (1) January 2018
(2)
xxxx1 0 0 0 0
xxxx2 62 62 0 0
xxxx3 38 33 -5 0
xxxx4 55 62 7 7
Table 4: reception difference illustration

15
Detailed specification for individual factors
For all the indicators, the NOR filters apply at pupil level. Where a pupil does not have a
valid response for the indicator in the census or other data source, they are excluded
when calculating the indicator. For example, a pupil with no postcode recorded on the
census is discounted when calculating a school’s IDACI proportions. The data used for
each indicator is taken from the October 2018 census unless otherwise indicated.
Deprivation
The allowable indicators are free school meals (FSM) and free school meals (Ever 6) and
IDACI.
Free school meals
Primary FSM Proportion
Secondary FSM Proportion
The proportion of pupils eligible for free school meals according to the autumn 2018
census has been aggregated to school level, with separate indicators for primary and
secondary phase pupils.
Free school meals Ever 6
Primary Ever 6 Proportion
Secondary Ever 6 Proportion
This counts the proportion of pupils on roll on the spring 2018 census that were recorded
as eligible for FSM in any of the censuses (autumn, spring and summer, including the
alternative provision (AP) and pupil referral unit (PRU) census) over the previous six
years. This uses the same data as that used for allocating the pupil premium. As a
consequence, schools that have opened since the spring 2018 census will not have FSM
ever 6 data. More information on this indicator and the pupil premium can be found in
pupil premium funding and accountability for schools guidance.
Where a school has an FSM ever 6 ratio lower than their FSM ratio the FSM ever 6 ratio
will be increased to the level of the FSM ratio.
IDACI
IDACI Primary Proportion Band G
IDACI Primary Proportion Band F
IDACI Primary Proportion Band E
IDACI Primary Proportion Band D
IDACI Primary Proportion Band C
IDACI Primary Proportion Band B

16
IDACI Primary Proportion Band A
IDACI Secondary Proportion Band G
IDACI Secondary Proportion Band F
IDACI Secondary Proportion Band E
IDACI Secondary Proportion Band D
IDACI Secondary Proportion Band C
IDACI Secondary Proportion Band B
IDACI Secondary Proportion Band A
The income deprivation affecting children index (IDACI) is a subset of the indices of
multiple deprivation (IMD). It is an area-based measure defined at the level of lower
super output area (LSOA) and is based on the data published in September 2015. It is a
score between 0 and 1, which can be interpreted as the proportion of children aged
under 16 in the LSOA which are in income deprived households. Further information on
the updated IDACI figures can be found through the DCLG statistical release.
Only pupils with an IDACI score above 0.2 can be assigned deprivation funding through
this factor, meaning there are six bands which can be given different unit values each for
primary and six for secondary phase pupils.
IDACI Score IDACI band
x < 0.2 G
0.2 ≤x< 0.25 F
0.25 ≤x< 0.3 E
0.3 ≤x< 0.35 D
0.35 ≤x< 0.4 C
0.4 ≤x< 0.5 B
0.5 ≤x≤ 1 A
Table 4 IDACI bands
For each of the bands, the proportion of pupils on the autumn 2017 census with valid
IDACI scores has been aggregated to school level, with separate indicators for primary
and secondary phase pupils.
English as an additional language (EAL)
EAL 1 Primary Proportion
EAL 2 Primary Proportion
EAL 3 Primary Proportion
EAL 1 Secondary Proportion
EAL 2 Secondary Proportion
EAL 3 Secondary Proportion

17
There are three allowable indicators for EAL, all based on the Language Code given in
the census. Both the short code set and the long code set are grouped so that pupils with
an English code (including believed to be English) are “1_ENG”, pupils whose language
is unknown or undeclared are “3_UNK” and all other pupils are “2_OTH”.
Pupils attract EAL funding if they are grouped as “2_OTH” from the Language Code on
the autumn 2018 census and can be shown to have been in the school system for less
than one year, less than two years or less than three years. This is achieved by deriving
a pupil level “years in system” count based on the pupil’s presence in the autumn 2015,
autumn 2016 and autumn 2017 censuses. Using the years in system indicator and the
current national curriculum year, an estimated national curriculum start year can be
derived. This is important, as the indicator is offset for pupils who were in Year R, N1 or
N2 for any of the interrogation years. This is done because language did not previously
have to be declared in the census for pupils aged less than 5, causing the data for pupils
when in year R to be partial and unrepresentative. Also for this reason, pupils in year R
are excluded from the calculation of the ratios. Pupils grouped as “3_UNK” are also
excluded.
Table 5 EAL categories by current and starting year group
Table 5 illustrates which EAL category a pupil who is grouped as “2_OTH” would map to,
given their current year group and their starting year group. Pupils in year R and pupils
grouped as “3_UNK” are not given a category. Other pupils grouped as “1_ENG” are
given the category EAL_0.
A school’s EAL 1 Primary Proportion is calculated as the number of pupils in year groups
R to 6 with the EAL 1 value, divided by the total number of pupils in years R to 6 with the
EAL 0, 1, 2 or 3 value (i.e. pupils not given a category are excluded).
A school’s EAL 2 Primary Proportion is calculated as the number of pupils in year groups
R to 6 with the EAL 1 or EAL 2 value, divided by the total number of pupils in years R to 6
with the EAL 0, 1, 2 or 3 value.
A school’s EAL 3 Primary Proportion is calculated as the number of pupils in year groups
R to 6 with the EAL 1, EAL 2 or EAL 3 value, divided by the total number of pupils in
years R to 6 with the EAL 0, 1, 2 or 3 value.
Current Year
Start YearR 1 2 3 4 5 6 7 8 9 10 11
R NULL EAL_1 EAL_2 EAL_3
1 EAL_1 EAL_2 EAL_3
2 EAL_1 EAL_2 EAL_3
3 EAL_1 EAL_2 EAL_3
4 EAL_1 EAL_2 EAL_3
5 EAL_1 EAL_2 EAL_3
6 EAL_1 EAL_2 EAL_3
7 EAL_1 EAL_2 EAL_3
8 EAL_1 EAL_2 EAL_3
9 EAL_1 EAL_2 EAL_3
10 EAL_1 EAL_2
11 EAL_1

18
Corresponding calculations are done to obtain the secondary proportions.
Looked-after children
LAC X Proportion
Details of children looked after by a local authority are returned to the department on the
annual SSDA903 collection. We have produced an extract of the SSDA903 2018 looked-
after children data collected from local authorities indicating whether a child has been
looked after for one day or more on 31 March 2018.
The data are matched into the National Pupil Database using the unique pupil number
(UPN), and extracts are obtained showing where the children were on roll based on the
spring 2018 census. The UPN is the main field used for matching purposes but other
information about the child is also used such as date of birth, gender, ethnicity and
responsible local authority.
The school level weighting for this indicator is given by dividing the number of matched
pupils by the NOR in the spring 2018 census.

19
Prior attainment
The early years foundation stage profile (EYFSP) results and key stage 2 (KS2)
attainment data are allowable indicators for primary and secondary prior attainment
respectively.
Primary prior attainment
For primary schools, funding can be targeted at pupils who did not achieve a good level
of development on the new EYFSP.
Low Attainment under new EYFSP Proportion
Pupils in the autumn 2018 census in years 1 to 6 are matched onto the new EYFSP data
using their UPN. A school’s proportion in the dataset is the number of pupils in years 1 to
6 recorded as not achieving a good level of development divided by the number of pupils
in years 1 to 6 recorded in the attainment data. Pupils who could not be matched onto the
attainment data, or for whom the attainment data does not provide a result, are excluded
from this calculation.
Secondary prior attainment
For secondary schools, the years 7 to 9 cohort will include a much higher proportion of
pupils identified as ‘low prior attainment’ than other secondary year groups. This is
because year 9 were the first to take the new, more challenging key stage 2 tests (at the
end of academic years 2015/16).
Low Attainment Secondary Proportion Year 7
Low Attainment Secondary Proportion Year 8
Low Attainment Secondary Proportion Year 9
For pupils in year 7, year 8 or year 9 funding can be targeted at pupils who are below the
expected standard of achievement in either English reading, English teacher-assessed
writing, or mathematics at KS2. Specifically, this means pupils scoring ‘B’ or ‘NS’ or ‘CA’
with a scaled score below 100 (after any adjustment) in mathematics or English reading;
and pupils scoring ‘BLW’, ‘HNM’, ‘PKF’, ‘PKE’, ‘PKG’ or ‘WTS’ in English teacher-
assessed writing
Low Attainment Secondary Proportion Years 10-11
For pupils in years 10 to 11 funding can be targeted at pupils who achieve a Level 3 or
below in either English reading, English teacher-assessed writing, or mathematics at
KS2. Specifically, this means pupils scoring ‘2’, ‘3’, ‘B’ or ‘N’ in mathematics or English
reading; and pupils scoring ‘W’, ‘1’, ‘2’ or ‘3’ in English teacher-assessed writing.

20
In 2012 the KS2 English assessment methodology was changed to include a separate
reading test, a grammar, punctuation and spelling test and writing teacher assessment.
For pupils who were assessed prior to this change, the English element will identify those
pupils who fail to achieve a level 4 in English (specifically, scoring ‘2’, ‘3’, ‘B’ or ‘N’).
For each of the years 7 to 9 and years 10 to 11 only pupils who have undertaken
assessment have been considered in calculating each school’s proportion. Pupils marked
as absent or with a result other than those listed are excluded from this calculation.
Pupils in years 7 to 11 in the Autumn 2018 census who could not be matched onto the
KS2 attainment data are also excluded.

21
Mobility
Mobility Primary Proportion
Mobility Secondary Proportion
A separate primary and secondary school level proportion is provided based on the
number of pupils whose entry date (start at current school) is within the previous 3
academic years and whose start month was not in August or September. If the pupil
started in reception then start months August, September or January will not be counted.
Pupils who started the school in nursery classes are not mobile.
A pupil’s start year is calculated by counting backwards from their current national
curriculum year group as recorded on the autumn 2018 census, assuming one academic
year per national curriculum year.
Table 4 shows examples of determining whether pupils are classed as mobile. The
figures in the dataset are the proportion of pupils classed as mobile for primary and
secondary phase pupils in each school.
Pupil NC year
actual Entry date
In previous
three academic
years?
Entry
month Start year Mobile
1 R 09/09/2018 Yes Sep R 0
2 4 01/01/2015 No Jan R 0
3 5 01/11/2016 Yes Nov 3 1
4 8 09/09/2016 Yes Sep 6 0
5 8 NULL - - - 0
6 10 09/09/2014 No Sep 6 0
7 5 09/01/2016 Yes Jan 2 1
Table 6: Illustration to determine pupil mobility
Funding may be targeted only at those schools experiencing pupil mobility above a 10%
threshold, and funding is not provided for the first 10% of mobile pupils. Each school’s
mobility proportions given in the Schools Block Data sheet of the APT are their actual
mobility proportions as calculated; deduction of the first 10% is done automatically by the
APT’s calculations.

22
Sparsity
Primary Sparsity av. Distance to 2nd school
Secondary Sparsity av. Distance to 2nd school
A sparsity distance is provided for each school, which measures the straight-line distance
that pupils live from their second nearest school. For each school, those pupils for whom
it is their closest school are identified, and then the average (mean) distance to the
second nearest school for these pupils is calculated. This is the school’s sparsity
distance and is calculated in miles.
For the purposes of this factor, selective grammar schools are not considered when
identifying the second nearest school, but faith schools are included. Distances are
calculated using the crow flies straight line distance from a pupil’s postcode to a school’s
postcode. Postcode information is taken from the autumn 2018 census for pupils and
GIAS for schools. Straight-line distances are calculated by deriving easting and northing
coordinates from the postcodes, then applying Pythagoras’s Theorem.
Where there is at least one other compatible school in the same postcode as the pupil’s
nearest compatible school, all compatible schools in this postcode are considered to be
this pupil’s “nearest schools”. The distance to the pupil’s second nearest school is then
the same as the distance to the nearest school. Pupils living outside of England are
excluded from the sparsity distance calculations. For these pupils, the calculations would
pick up each pupil’s nearest and second nearest English schools, and not necessarily
their actual nearest schools, and would likely artificially inflate their sparsity distances.
Local authorities can seek ESFA approval to record an adjusted sparsity distance on the
Inputs & Adjustments sheet of the APT for a school if they think that excluding pupils
resident outside of England has distorted the resulting figure.
The process for producing these figures was as follows:
using the autumn 2018 census, eligible pupils attending schools in the schools
block dataset were identified. Schools are identified together with the age range of
pupil that they admit. These datasets contain postcode coordinates for both pupils
and schools.
these coordinates are used to identify the nearest and second nearest school for
each pupil, and the distance in miles that they live from both schools.
we identify the set of pupils who live nearest to each school.
for each set of pupils we calculate the average (mean) distance to the second
nearest school. This is the school’s sparsity distance.
A school may attract sparsity funding if it is:

23
primary and has fewer than 21.4 pupils on average in each year group, and has a
sparsity distance that is greater than or equal to 2 miles
secondary and has fewer than 120 pupils on average in each year group, and has
a sparsity distance that is greater than or equal to 3 miles
a middle school and has fewer than 69.2 pupils on average in each year group,
and has a sparsity distance that is greater than or equal to 2 miles
an all-through school and has fewer than 62.5 pupils on average in each year
group, and has a sparsity distance that is greater than or equal to 2 miles
Local authorities may, if they wish, reduce the pupil numbers and increase the distance
criteria (they may narrow the criteria), but the criteria quoted above may not be widened.
Exceptional applications can also be made on behalf of existing schools that do not
attract sparsity funding using the above criteria.

24
© Crown copyright 2018
You may re-use this information (excluding logos) free of charge in any format or
medium, under the terms of the Open Government Licence. To view this licence
visit http://www.nationalarchives.gov.uk/doc/open-government-licence/
email [email protected].
Where we have identified any third party copyright information you will need to obtain
permission from the copyright holders concerned.
Any enquiries regarding this publication should be sent to us
at:www.education.gov.uk/contactus .