schrag - oracle 8i to 10g upgrade case study
DESCRIPTION
Roger Schr ag D atabase Specialists, I nc. H otsos Per for mance Symposium M ar ch, 2005 w w w .dbspecialists.com 1 – Our Oracle environment, upgrade strategy – Impressions: upgrade process and compatibility – Impressions: Oracle 10g in general The view from 30,000 feet: In greater detail: 2TRANSCRIPT

1
An Oracle 8i to 10g Upgrade
Case Study Roger Schrag
Database Specialists, Inc.
www.dbspecialists.com
Hotsos Performance SymposiumMarch, 2005

2
Today's Session The view from 30,000 feet:
– Our Oracle environment, upgrade strategy– Impressions: upgrade process and compatibility– Impressions: Oracle 10g in general
In greater detail:– Sizing the shared pool and SGA– Optimizer statistics collection and accuracy– Query optimization– SQL Tuning Advisor– Overhead

3
Today’s SessionGoal: Help you plan for your own Oracle 10g upgrade. We will:
– Look at one company’s experience upgrading to 10g– Discuss real-life experiences– Provide data so you can draw your own conclusions
We will not:– Walk through the actual upgrade steps– Make any judgments about Oracle 10g
4
Always Remember Each Oracle system is unique and will have its own
challenges. Never take somebody else’s word on anything
when it comes to Oracle technology. In this session we are only relaying one company’s
experiences. The only way for you to know how your specific
system will fare on Oracle 10g is to try it—in a test environment—and see.

5
White Paper Contains additional topics and examples we won't
have time to discuss today Contains additional “supporting evidence” for
conclusions reached in today's session that we won't have time to discuss or that won’t fit legibly on a PowerPoint slide– TKPROF reports, execution plans, AWR reports
Download: www.dbspecialists.com/presentations

6
The View From 30,000 Feet Our Oracle environment Our upgrade strategy Impressions: upgrade process and compatibility Impressions: Oracle 10g in general
7
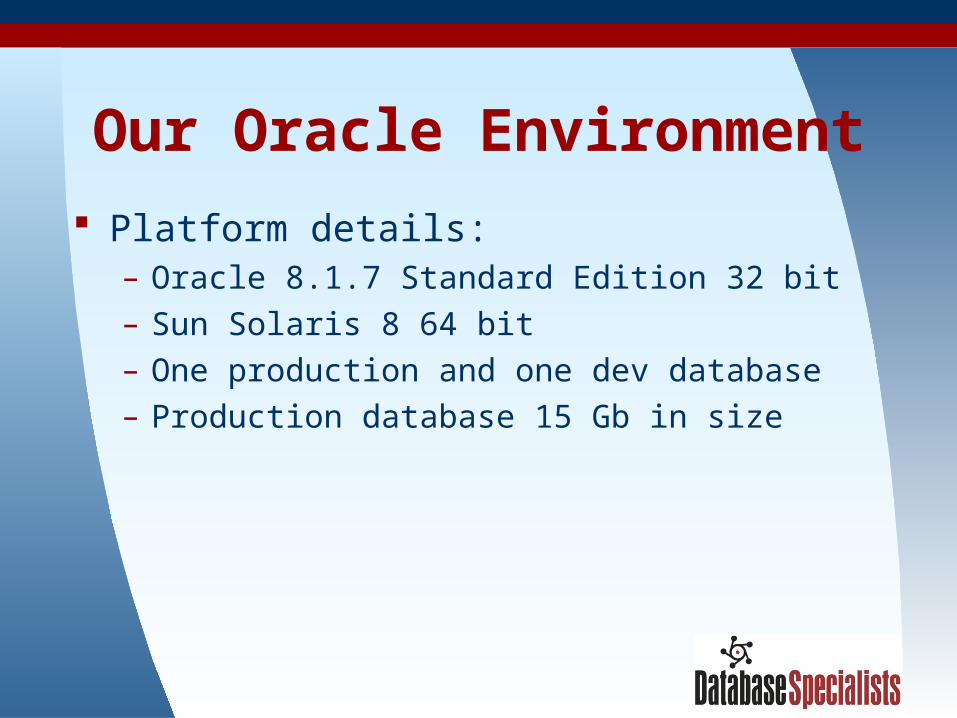
Our Oracle Environment Platform details:
– Oracle 8.1.7 Standard Edition 32 bit– Sun Solaris 8 64 bit– One production and one dev database– Production database 15 Gb in size

8
Our Oracle Environment Application: Customer database monitoring tool
– Backend daemons process inbound agent files from our customers’ database servers in the field
– Web-based user interface for report generation, system configuration
– Almost all code is PL/SQL (roughly 50,000 lines)– Leverages Oracle 8i features—eg GTTs, table()– About 50 SQL statements have hints
9
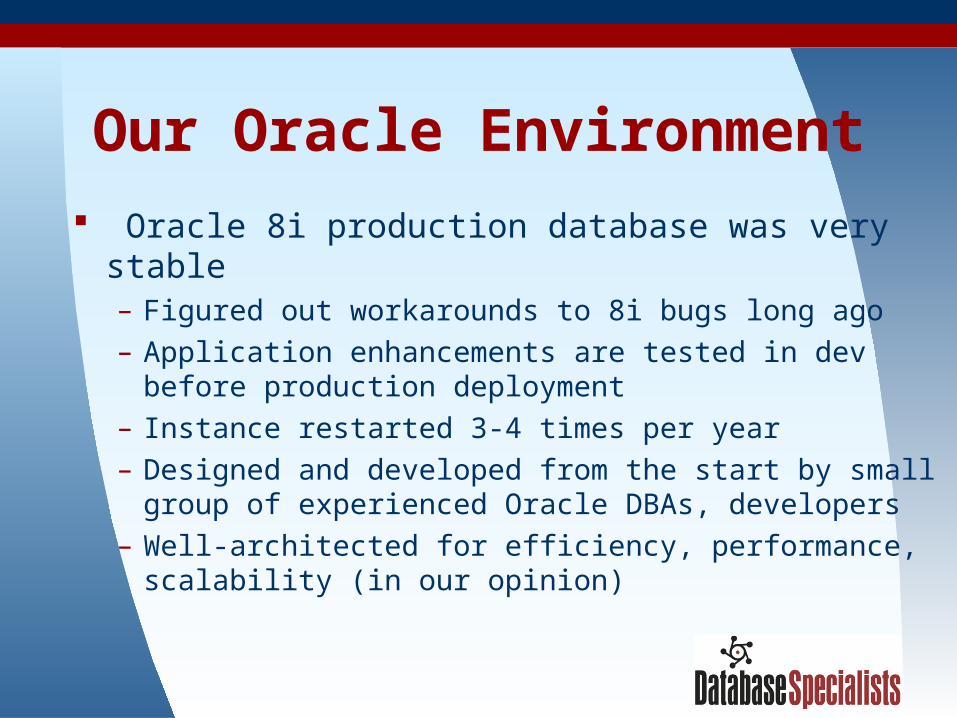
Our Oracle Environment Oracle 8i production database was very stable
– Figured out workarounds to 8i bugs long ago– Application enhancements are tested in dev before
production deployment– Instance restarted 3-4 times per year– Designed and developed from the start by small group
of experienced Oracle DBAs, developers– Well-architected for efficiency, performance, scalability
(in our opinion)

10
Our Reasons to Upgrade to 10g
Oracle 8i met all of our needs. So why upgrade?
– Oracle 8i desupport. (What difference does it make?)– Gain Oracle 10g experience. (For us, a more
compelling reason.)

11
Our Upgrade Strategy Restore production hot backup onto dedicated test
server. Export Oracle 8i test database and import into empty
Oracle 10g test database. Why export/import instead of upgrading in place?
– Switch all tablespaces to LMTs– Compact all application segments (purges left holes)– Change character set– “Fresh” data dictionary, database components – Worked out a strategy to keep the down time tolerable

12
Our Upgrade Strategy Our Oracle 8i and 10g test databases started out
with the same data—handy for testing and comparison.
Two critical points to remember when comparing these two test databases:– Application segments in Oracle 10g test database
occupied fewer blocks.– Our Oracle 10g test database was 64 bit while our
Oracle 8i test database was 32 bit.
13
Impressions: Upgrade Process
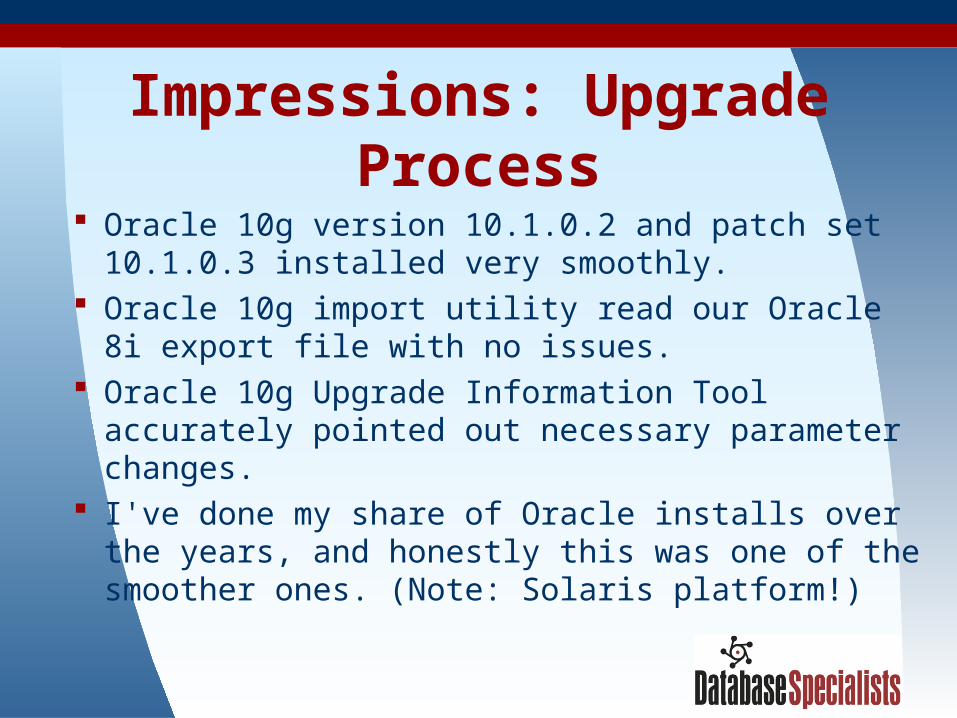
Oracle 10g version 10.1.0.2 and patch set 10.1.0.3 installed very smoothly.
Oracle 10g import utility read our Oracle 8i export file with no issues.
Oracle 10g Upgrade Information Tool accurately pointed out necessary parameter changes.
I've done my share of Oracle installs over the years, and honestly this was one of the smoother ones. (Note: Solaris platform!)

14
Impressions: Compatibility Encountered two compatibility issues:
– EXTPROC needed reconfiguring (tighter security) and recompiling (32 bit to 64 bit change).
– Oracle 10g PLSQL compiler did not like our Oracle 8i wrapped PL/SQL code. (Cause is probably an Oracle 8i export bug.) Rewrapping with Oracle 10g wrapper utility resolved this.
– All other application code functioned correctly. Retained Oracle 8i modplsql client initially.
– No interoperability issues encountered.
15
Impressions: Oracle 10g Worked well out of the box:
– Enterprise Manager Database Control and iSQLPlus were terribly slow, but they worked.
Our system appears as stable on Oracle 10g as it was on Oracle 8i:– No ORA-600s or other funnies.– Caveat: We are using few Oracle 9i and bare minimum
Oracle 10g new features.

16
Impressions: Oracle 10g Bigger, bulkier, hungrier for system resources:
– Bigger executable size, shared pool, SYSTEM tablespace…
More overhead:– Daemon processes, hard parses, statistics collection…
Overhead and bulkiness were tolerable for us.

17
Impressions: Oracle 10g Application performance was about the same:
– Most SQL consumed similar resources.– Due to our hints, OLTP nature, we had not expected Oracle
10g to run noticeably faster.– Very few queries ran slow enough in Oracle 10g to be a
problem.– Oracle 10g did better than 8i when hints were removed, but not
as well as either version with the hints in place.– If we had started out on Oracle 10g, do we think we could have
done without manual query optimization (hints)? We do not believe so.

18
Impressions: Oracle 10g Discouraged by SQL Tuning Advisor. (But did not
test exhaustively due to frustration.) The bottom line for us:
– Install and upgrade went better than we expected.– Increased overhead and heft are manageable—a fair
exchange for increased functionality and sophistication.– We expect to get more out of our system than was
possible with Oracle 8i, once we leverage newer features. (But will proceed in this direction very cautiously!)

19
Upgrade Issues in Greater Detail
Sizing the shared pool and SGA Optimizer statistics collection and accuracy Query optimization SQL Tuning Advisor Overhead

20
Sizing the Shared Pool and SGA
We like SGA to be only as large as necessary. Oracle 8i settings:
– shared_pool_size = 40 Mb– Total SGA size was 84 Mb
Oracle 8i performance characteristics:– 50,000 lines of PL/SQL code– 15-20 executions per second– Under 660 hard parses per day– Buffer cache hit ratio > 97%– Library cache hit ratio ~100%

21
Sizing the Shared Pool and SGA
Oracle 10g settings:– shared_pool_size = 144 Mb– Total SGA size is 194 Mb
Why?– Minimum shared_pool_size setting for 64 bit platforms is
144 Mb according to Metalink document 263809.1– Recommended by Upgrade Information Tool as well

22
Sizing the Shared Pool and SGA
Just to satisfy a curiosity… shared_pool_size = 48 Mb on Oracle 10g:
– Instance would not start shared_pool_size = 64 Mb on Oracle 10g:
– Instance started, but frequent ORA-4031 errors shared_pool_size = 96 Mb on Oracle 10g:
– Everything seemed to work properly We run Oracle 10g in production with:
– shared_pool_size = 144 Mb

23
Reasons for Larger Shared Pool
Three reasons why the shared_pool_size setting needs to be increased when upgrading to Oracle 10g:– Allocation for overhead– Shared SQL area memory usage– SQL statements generated by Oracle
24
Allocation for Overhead A portion of the shared pool is used to hold internal
memory structures (overhead). Oracle 8i and 9i make the shared pool larger than
shared_pool_size specifies in order to allow space for this overhead.
Oracle 10g does not make the shared pool larger than shared_pool_size specifies.– Thus Oracle 10g gives you less usable space in the shared
pool for the same shared_pool_size setting. See Metalink document 270935.1.
25
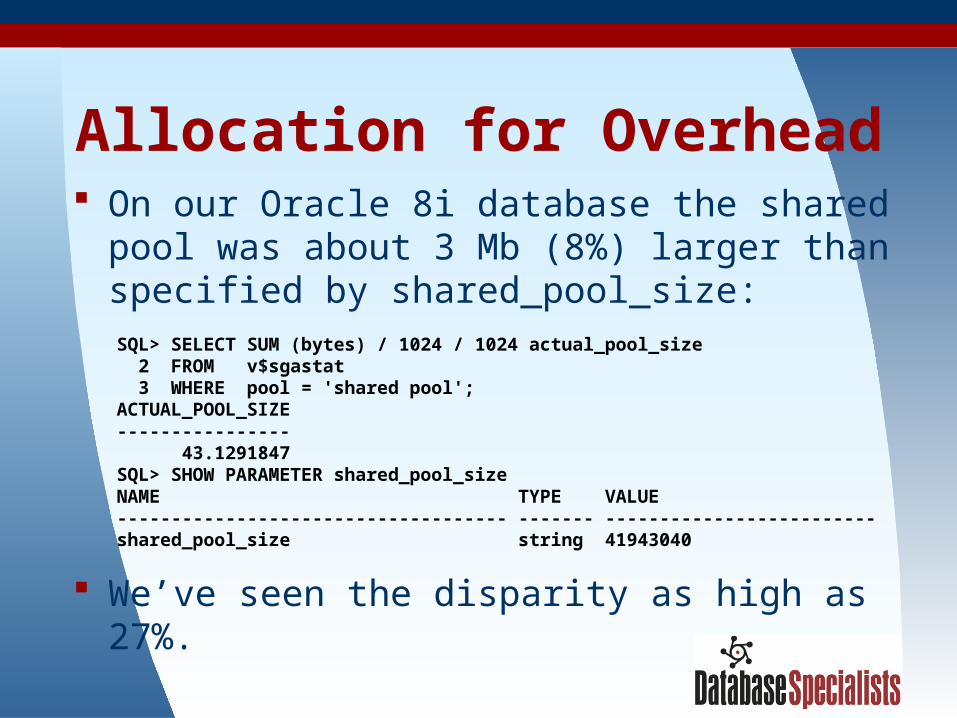
Allocation for Overhead On our Oracle 8i database the shared pool was
about 3 Mb (8%) larger than specified by shared_pool_size:
SQL> SELECT SUM (bytes) / 1024 / 1024 actual_pool_size 2 FROM v$sgastat 3 WHERE pool = 'shared pool'; ACTUAL_POOL_SIZE ---------------- 43.1291847 SQL> SHOW PARAMETER shared_pool_size NAME TYPE VALUE ------------------------------------ ------- ------------------------- shared_pool_size string 41943040
We’ve seen the disparity as high as 27%.
26
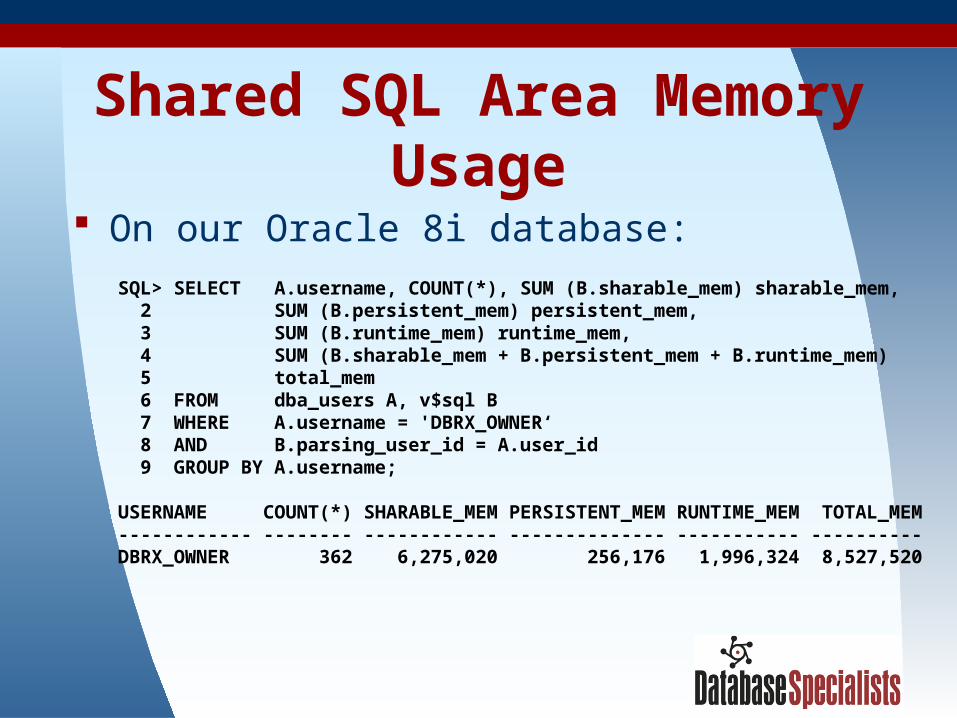
Shared SQL Area Memory Usage
Individual SQL statements appear to occupy more memory in the shared SQL area in Oracle 10g than in Oracle 8i.
In our environment the difference was almost 2x. The move from 32 bit Oracle software to 64 bit
accounts for much of this growth.– How much, we don’t know.
27
Shared SQL Area Memory Usage
On our Oracle 8i database: SQL> SELECT A.username, COUNT(*), SUM (B.sharable_mem) sharable_mem, 2 SUM (B.persistent_mem) persistent_mem, 3 SUM (B.runtime_mem) runtime_mem, 4 SUM (B.sharable_mem + B.persistent_mem + B.runtime_mem) 5 total_mem 6 FROM dba_users A, v$sql B 7 WHERE A.username = 'DBRX_OWNER‘ 8 AND B.parsing_user_id = A.user_id 9 GROUP BY A.username;
USERNAME COUNT(*) SHARABLE_MEM PERSISTENT_MEM RUNTIME_MEM TOTAL_MEM ------------ -------- ------------ -------------- ----------- ---------- DBRX_OWNER 362 6,275,020 256,176 1,996,324 8,527,520

28
Shared SQL Area Memory Usage
On our Oracle 10g database: SQL> SELECT A.username, COUNT(*), SUM (B.sharable_mem) sharable_mem, 2 SUM (B.persistent_mem) persistent_mem, 3 SUM (B.runtime_mem) runtime_mem, 4 SUM (B.sharable_mem + B.persistent_mem + B.runtime_mem) 5 total_mem 6 FROM dba_users A, v$sql B 7 WHERE A.username = 'DBRX_OWNER‘ 8 AND B.parsing_user_id = A.user_id 9 GROUP BY A.username;
USERNAME COUNT(*) SHARABLE_MEM PERSISTENT_MEM RUNTIME_MEM TOTAL_MEM ------------ -------- ------------ -------------- ----------- ---------- DBRX_OWNER 360 12,941,006 487,048 3,361,160 16,789,214

29
SQL Generated by Oracle The shared SQL area on any Oracle instance will
contain statements issued by Oracle itself and not by the application.
Often called “internal SQL” or “recursive SQL”. Automatic and self-management infrastructure in
Oracle 10g (database and EM Database Control) generates a lot of internal SQL.
The shared pool will need to be larger in order to accommodate the extra statements.
30
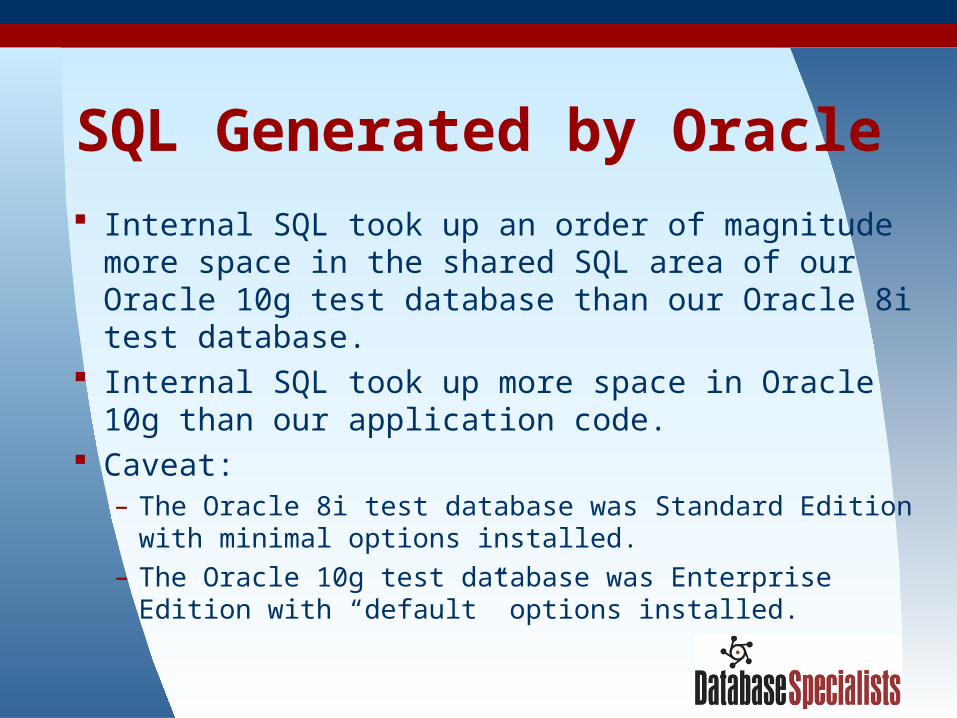
SQL Generated by Oracle Internal SQL took up an order of magnitude more
space in the shared SQL area of our Oracle 10g test database than our Oracle 8i test database.
Internal SQL took up more space in Oracle 10g than our application code.
Caveat:– The Oracle 8i test database was Standard Edition with
minimal options installed. – The Oracle 10g test database was Enterprise Edition with
“default” options installed.

31
SQL Generated by Oracle On our Oracle 8i database: SQL> SELECT A.username, COUNT(*), SUM (B.sharable_mem) sharable_mem, 2 SUM (B.persistent_mem) persistent_mem, 3 SUM (B.runtime_mem) runtime_mem, 4 SUM (B.sharable_mem + B.persistent_mem + B.runtime_mem) 5 total_mem 6 FROM dba_users A, v$sql B 7 WHERE A.username IN ('DBSNMP', 'SYS', 'SYSTEM', 'SYSMAN') 8 AND B.parsing_user_id = A.user_id 9 GROUP BY A.username;
USERNAME COUNT(*) SHARABLE_MEM PERSISTENT_MEM RUNTIME_MEM TOTAL_MEM ------------ -------- ------------ -------------- ----------- ---------- SYS 192 2,331,619 125,356 569,688 3,026,663 SYSTEM 30 810,325 19,644 163,480 993,449 ------------ -------------- ----------- ---------- sum 3,141,944 145,000 733,168 4,020,112
32
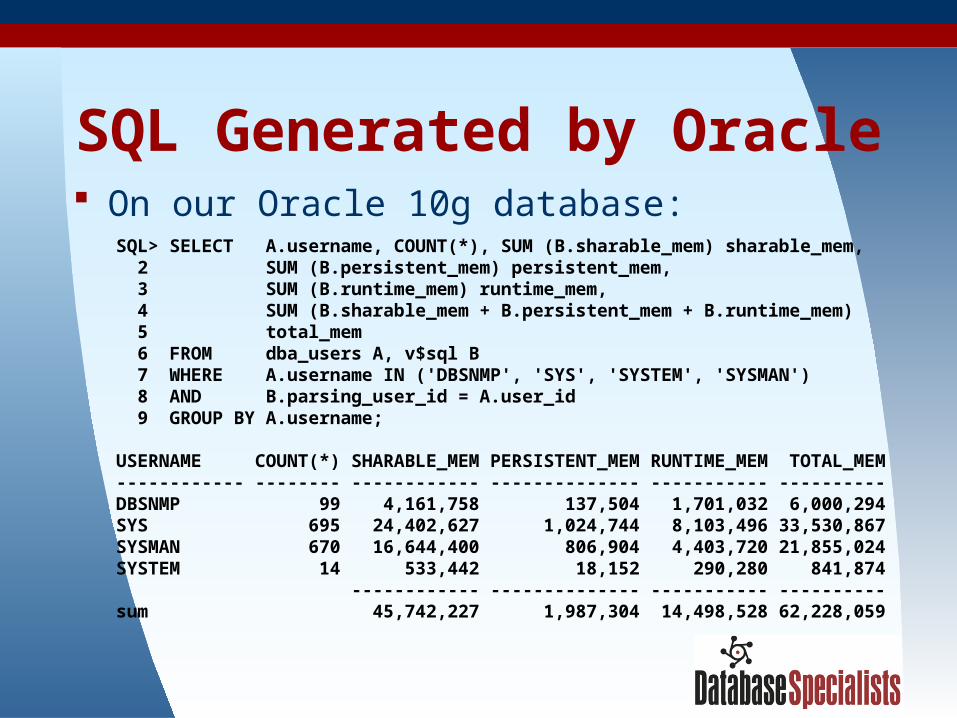
SQL Generated by Oracle On our Oracle 10g database: SQL> SELECT A.username, COUNT(*), SUM (B.sharable_mem) sharable_mem, 2 SUM (B.persistent_mem) persistent_mem, 3 SUM (B.runtime_mem) runtime_mem, 4 SUM (B.sharable_mem + B.persistent_mem + B.runtime_mem) 5 total_mem 6 FROM dba_users A, v$sql B 7 WHERE A.username IN ('DBSNMP', 'SYS', 'SYSTEM', 'SYSMAN') 8 AND B.parsing_user_id = A.user_id 9 GROUP BY A.username;
USERNAME COUNT(*) SHARABLE_MEM PERSISTENT_MEM RUNTIME_MEM TOTAL_MEM ------------ -------- ------------ -------------- ----------- ---------- DBSNMP 99 4,161,758 137,504 1,701,032 6,000,294 SYS 695 24,402,627 1,024,744 8,103,496 33,530,867 SYSMAN 670 16,644,400 806,904 4,403,720 21,855,024 SYSTEM 14 533,442 18,152 290,280 841,874 ------------ -------------- ----------- ---------- sum 45,742,227 1,987,304 14,498,528 62,228,059
33
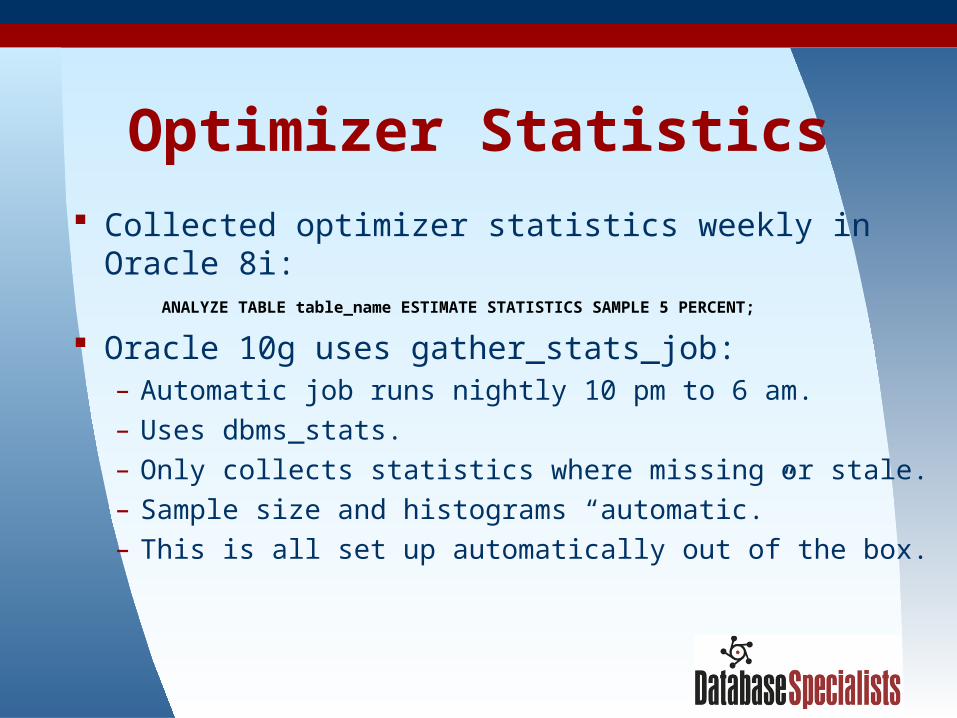
Optimizer Statistics Collected optimizer statistics weekly in Oracle 8i:
ANALYZE TABLE table_name ESTIMATE STATISTICS SAMPLE 5 PERCENT; Oracle 10g uses gather_stats_job:
– Automatic job runs nightly 10 pm to 6 am.– Uses dbms_stats.– Only collects statistics where missing or stale.– Sample size and histograms “automatic.”– This is all set up automatically out of the box.
34
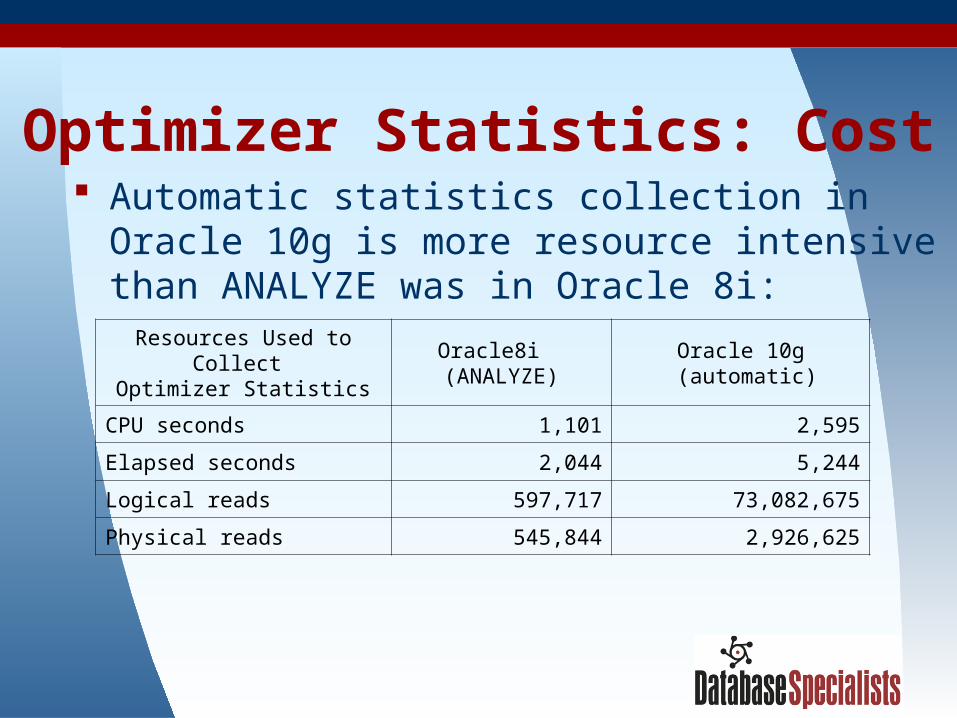
Optimizer Statistics: Cost Automatic statistics collection in Oracle 10g is
more resource intensive than ANALYZE was in Oracle 8i:Resources Used to Collect
Optimizer StatisticsOracle8i
(ANALYZE)Oracle 10g (automatic)
CPU seconds 1,101 2,595
Elapsed seconds 2,044 5,244
Logical reads 597,717 73,082,675
Physical reads 545,844 2,926,625
35
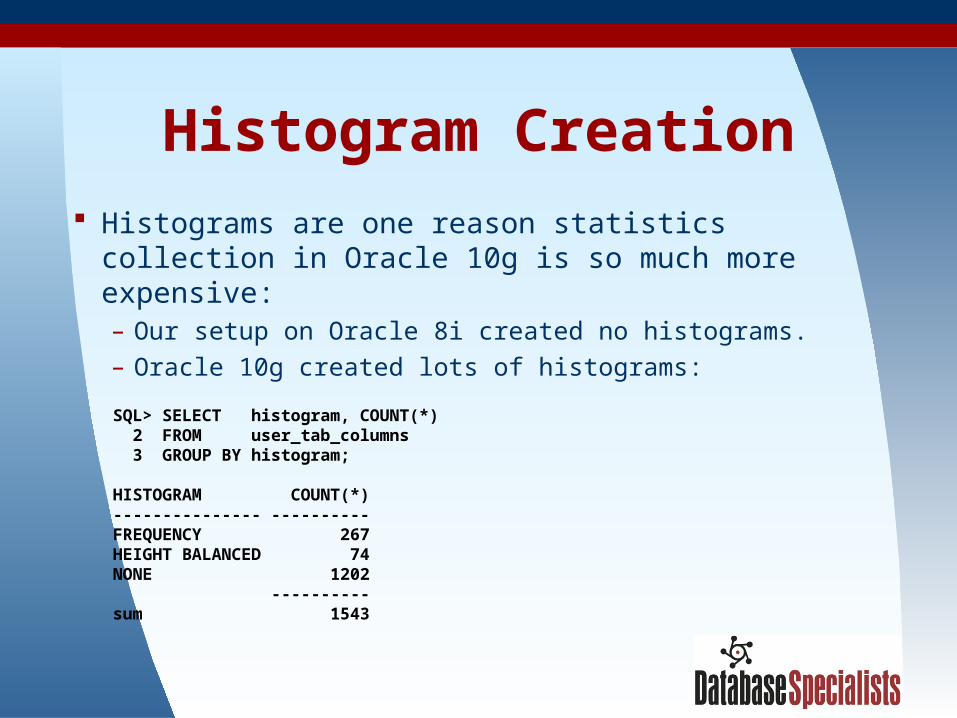
Histogram Creation Histograms are one reason statistics collection in Oracle
10g is so much more expensive:– Our setup on Oracle 8i created no histograms.– Oracle 10g created lots of histograms:
SQL> SELECT histogram, COUNT(*) 2 FROM user_tab_columns 3 GROUP BY histogram;
HISTOGRAM COUNT(*) --------------- ---------- FREQUENCY 267 HEIGHT BALANCED 74 NONE 1202 ---------- sum 1543
36
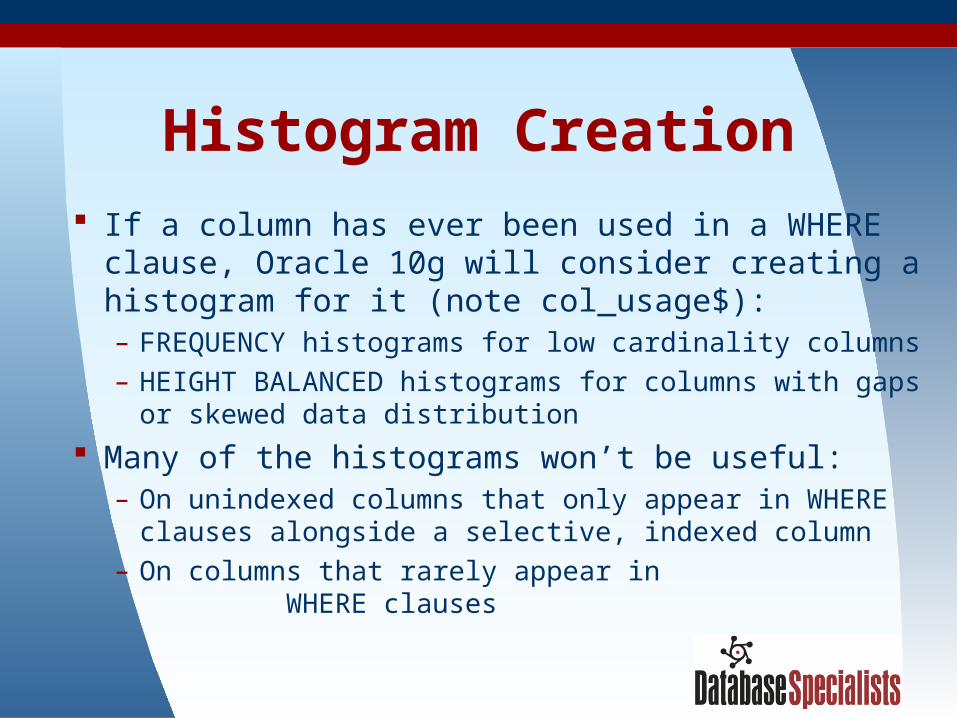
Histogram Creation If a column has ever been used in a WHERE clause,
Oracle 10g will consider creating a histogram for it (note col_usage$):– FREQUENCY histograms for low cardinality columns– HEIGHT BALANCED histograms for columns with gaps or
skewed data distribution Many of the histograms won’t be useful:
– On unindexed columns that only appear in WHERE clauses alongside a selective, indexed column
– On columns that rarely appear in WHERE clauses

37
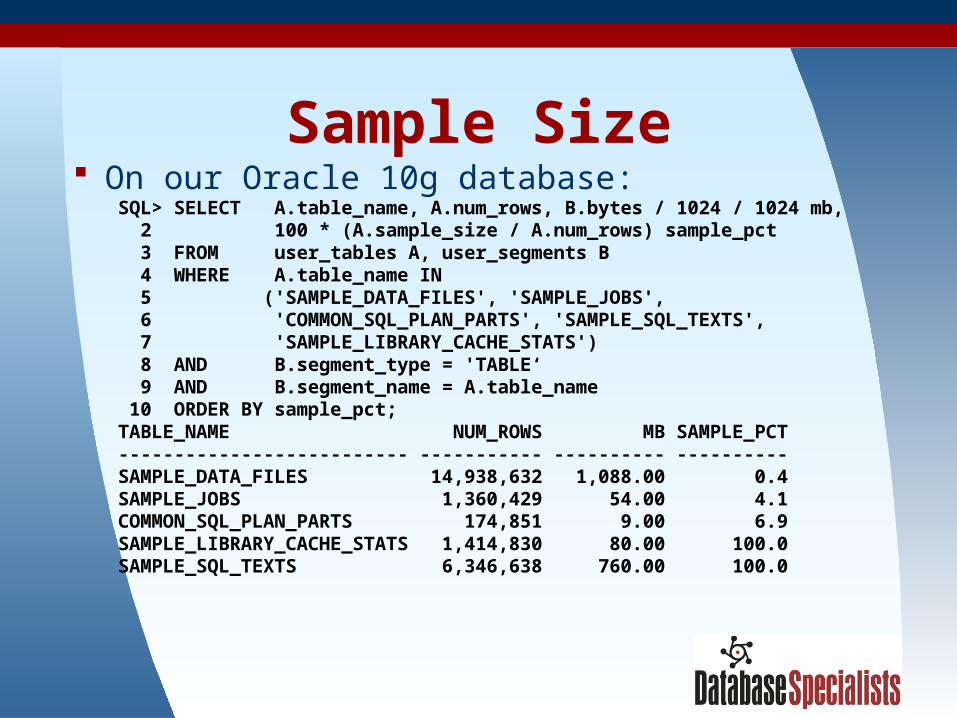
Sample Size Sample size is another reason statistics collection
in Oracle 10g was so much more expensive. Oracle 8i sample sizes were consistent:
– Sample sizes on tables over 1 Mb were 4.5 to 5.4%.– Sample sizes on smaller tables were 100%.
Oracle 10g sample sizes were all over the map:– Sample size on 80 Mb table: 100%– Sample size on 1,088 Mb table: 0.4%– Sample size on 760 Mb table: 100%
38
Sample Size On our Oracle 10g database: SQL> SELECT A.table_name, A.num_rows, B.bytes / 1024 / 1024 mb, 2 100 * (A.sample_size / A.num_rows) sample_pct 3 FROM user_tables A, user_segments B 4 WHERE A.table_name IN 5 ('SAMPLE_DATA_FILES', 'SAMPLE_JOBS', 6 'COMMON_SQL_PLAN_PARTS', 'SAMPLE_SQL_TEXTS', 7 'SAMPLE_LIBRARY_CACHE_STATS') 8 AND B.segment_type = 'TABLE‘ 9 AND B.segment_name = A.table_name 10 ORDER BY sample_pct; TABLE_NAME NUM_ROWS MB SAMPLE_PCT -------------------------- ----------- ---------- ---------- SAMPLE_DATA_FILES 14,938,632 1,088.00 0.4 SAMPLE_JOBS 1,360,429 54.00 4.1 COMMON_SQL_PLAN_PARTS 174,851 9.00 6.9 SAMPLE_LIBRARY_CACHE_STATS 1,414,830 80.00 100.0 SAMPLE_SQL_TEXTS 6,346,638 760.00 100.0

39
Sample Size How Oracle 10g came to sample every row in a
760 Mb table:– First, Oracle sampled all 35 columns of the table on
0.0892929621% of the rows.– Next, Oracle sampled 8 of the columns on
0.8929296209% of the rows.– Next, Oracle sampled 3 of the columns on
8.9292962091% of the rows. – Finally, Oracle performed a COUNT (DISTINCT) on
one of the columns without a SAMPLE clause.

40
Optimizer Statistics: Accuracy
Oracle 10g optimizer statistics did not appear to be particularly more accurate than those collected by ANALYZE in Oracle 8i.
In particular Oracle 10g’s estimate of distinct column values was sometimes less accurate than Oracle 8i’s.– Could have been caused by excessively small sample
size on some tables (…just a guess)

41
Optimizer Statistics: Accuracy
How accurate do optimizer statistics need to be?– If every business process on your system gives
satisfactory response time, then the statistics are accurate enough.
– But if a business process runs too slowly, can you blame the optimizer statistics?
We will see some queries that got unsatisfactory execution plans in our Oracle 10g test environment.– Is it the statistics? We don’t know.

42
Query Optimization Queries in our application follow an OLTP workload
model.– All run quickly (except for quarterly purge).– Quick, but some are complex.
We believe we’ve written practical, logical SQL. Oracle 8i ran most of our SQL efficiently:
– We added hints to SQL only when response time concerns arose.
– About 50 statements throughout the application have hints.

43
Query Optimization Did not expect things to run faster in Oracle 10g.
– Queries already had efficient execution plans in 8i.– We expect the gains to come when we leverage Oracle
9i and 10g new features. Concern: What if some queries run slower in
Oracle 10g?– In a business process with 100 SQL statements, it only
takes one bad execution plan to slow the whole process down.

44
The Executive Summary Most SQL in our application consumed
roughly the same CPU time and number of logical reads in Oracle 10g as in Oracle 8i.
Some statements ran a little faster, and a few ran a little slower.
Most workload operations yielded similar response times in both versions of Oracle.
Only a very few SQL statements were slow enough on Oracle 10g to cause concern.

45
Query Optimizer Challenge Could Oracle 10g find efficient execution
plans for the queries that required hints in Oracle 8i?– Is adding hints to queries a thing of the past?
Well… not yet:– Oracle 10g ran the troublesome queries faster
without hints than Oracle 8i without hints.– However, both versions of Oracle ran the queries
faster with hints than Oracle 10g did without hints.

46
Query Optimization in Detail
SQL that ran similarly in Oracle 8i and 10g SQL that ran faster in Oracle 10g SQL that ran faster in Oracle 8i

47
SQL That Ran Similarly Loader Daemon comparison Performance Summary report comparison See the white paper for TKPROF report
excerpts
48
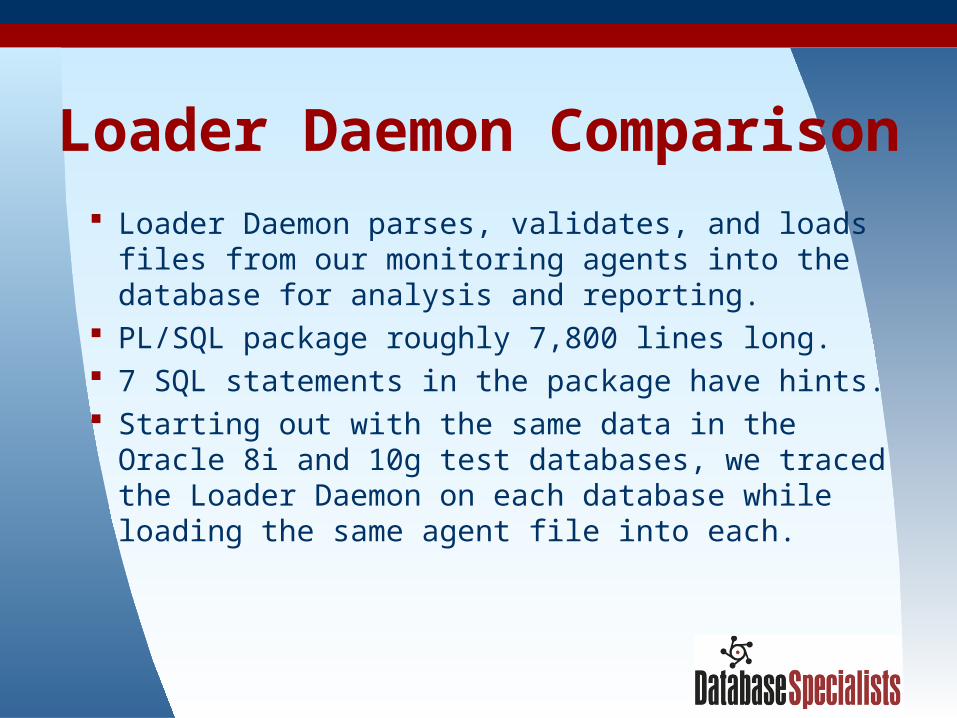
Loader Daemon Comparison Loader Daemon parses, validates, and loads
files from our monitoring agents into the database for analysis and reporting.
PL/SQL package roughly 7,800 lines long. 7 SQL statements in the package have hints. Starting out with the same data in the Oracle 8i
and 10g test databases, we traced the Loader Daemon on each database while loading the same agent file into each.
49
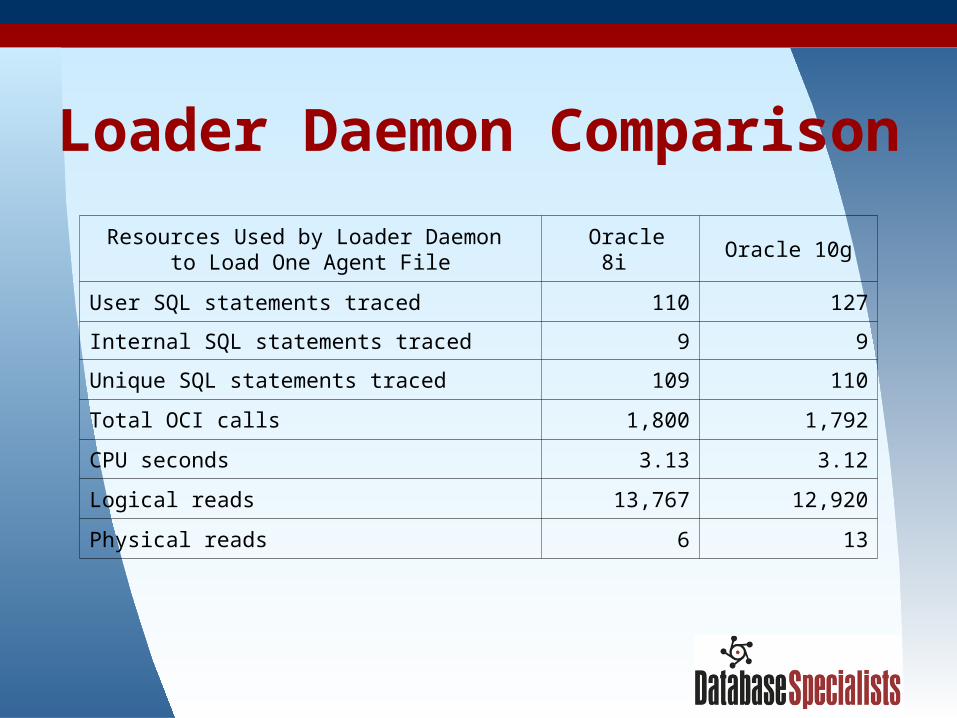
Loader Daemon ComparisonResources Used by Loader Daemon
to Load One Agent File Oracle 8i Oracle 10g
User SQL statements traced 110 127
Internal SQL statements traced 9 9
Unique SQL statements traced 109 110
Total OCI calls 1,800 1,792
CPU seconds 3.13 3.12
Logical reads 13,767 12,920
Physical reads 6 13

50
Loader Daemon Comparison Business process gave roughly same response time and
load profile on Oracle 8i and 10g. Fewer logical reads on Oracle 10g:
– Import made 10g segments more compact. More user SQL statements traced on Oracle 10g:
– Oracle 10g database had smaller PL/SQL cursor cache due to behavior change implemented in 9.2.0.5 re open_cursors. (See Metalink document 274496.1.)
– Cache misses lead to extra (soft) parse calls.– TKPROF reported these extra parse calls as extra
traced statements.

51
Performance Report Comparison
Performance Summary report provides a summary of performance statistics for one monitored Oracle database over a specified period of time (like a Statspack report).
PL/SQL package roughly 3,200 lines long. 4 SQL statements in the package have hints. Starting out with the same data in the Oracle 8i and
10g test databases, we traced sessions that called the report with the same parameters on each database.

52
Performance Report Comparison
Resources Used by PerformanceSummary Report Oracle 8i Oracle 10g
User SQL statements traced 98 98
Internal SQL statements traced 10 10
Unique SQL statements traced 98 97
Total OCI calls 654 531
CPU seconds 0.89 0.88
Logical reads 4,641 3,661
Physical reads 1 0

53
Performance Report Comparison
Business process gave roughly same response time and load profile on Oracle 8i and 10g.
Fewer logical reads on Oracle 10g again. Fewer total OCI calls in Oracle 10g:
– Same number of parse and execute calls.– Oracle 8i had twice as many fetch calls as 10g.– It appears as if Oracle 8i did extra fetch calls to make
sure it had retrieved all rows from a cursor, while perhaps Oracle 10g asked for more rows up front.

54
SQL That Ran Faster in 10g We did not expect noticeable response time
improvements on Oracle 10g because everything already ran “fast enough” on 8i.
We removed the hints from queries that had been slow in Oracle 8i to see if Oracle 10g could find the right execution plan.
In several cases Oracle 10g did better than 8i did without hints, but 10g’s execution plan was still far inferior to that chosen when the hints were in place.

55
Recent Event Notifications Query appears in several reports. Retrieves a list of recent event notifications for all
databases to which the specified user has access.
Joins 7 tables and includes a subquery. To get the query to run efficiently in Oracle 8i we
had added a hint to specify join order and which join algorithm to use for each table.
Not a trivial query, nor the most complex.
56
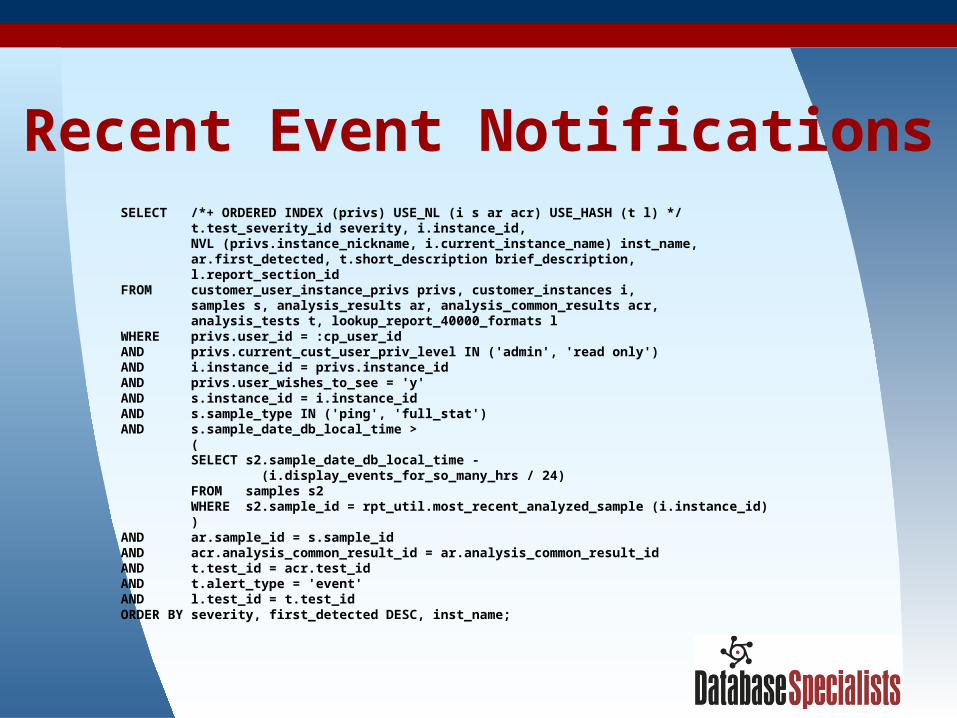
Recent Event Notifications SELECT /*+ ORDERED INDEX (privs) USE_NL (i s ar acr) USE_HASH (t l) */
t.test_severity_id severity, i.instance_id, NVL (privs.instance_nickname, i.current_instance_name) inst_name, ar.first_detected, t.short_description brief_description, l.report_section_idFROM customer_user_instance_privs privs, customer_instances i, samples s, analysis_results ar, analysis_common_results acr, analysis_tests t, lookup_report_40000_formats lWHERE privs.user_id = :cp_user_idAND privs.current_cust_user_priv_level IN ('admin', 'read only')AND i.instance_id = privs.instance_idAND privs.user_wishes_to_see = 'y'AND s.instance_id = i.instance_idAND s.sample_type IN ('ping', 'full_stat')AND s.sample_date_db_local_time > ( SELECT s2.sample_date_db_local_time - (i.display_events_for_so_many_hrs / 24) FROM samples s2 WHERE s2.sample_id = rpt_util.most_recent_analyzed_sample (i.instance_id) )AND ar.sample_id = s.sample_idAND acr.analysis_common_result_id = ar.analysis_common_result_idAND t.test_id = acr.test_idAND t.alert_type = 'event'AND l.test_id = t.test_idORDER BY severity, first_detected DESC, inst_name;
57
Recent Event Notifications
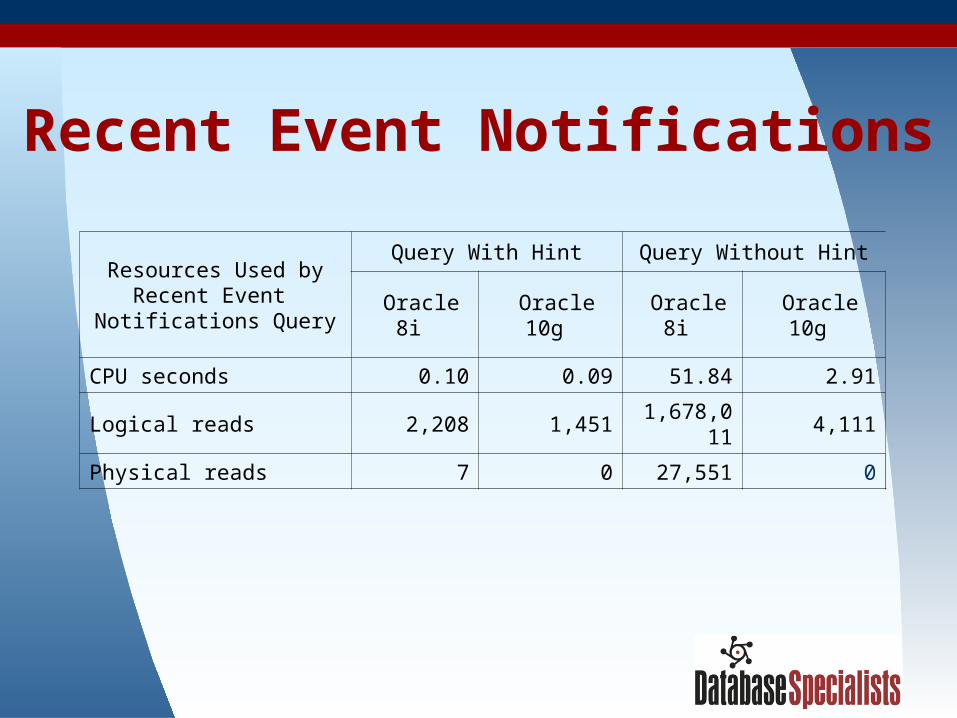
Resources Used by Recent Event
Notifications Query
Query With Hint Query Without Hint
Oracle 8i Oracle 10g Oracle 8i Oracle 10g
CPU seconds 0.10 0.09 51.84 2.91
Logical reads 2,208 1,451 1,678,011 4,111
Physical reads 7 0 27,551 0

58
Recent Event Notifications Without the hint, Oracle 10g did a better job
than Oracle 8i—but still not good enough:– Good: Oracle 10g figured out the right time to
perform the subquery.– Bad: Oracle 10g chose a hash join to a table with
800,000 rows when nested loops was the right way to go.
With the hint, Oracle 10g did better than Oracle 8i (with the hint) by performing the subquery as early as possible instead of as late as possible.

59
Oracle 8i Without Hint Rows Execution Plan------- --------------------------------------------------- 0 SELECT STATEMENT MODE: CHOOSE 0 SORT (ORDER BY) 0 FILTER 7093 HASH JOIN 71 TABLE ACCESS MODE: ANALYZED (FULL) OF 'LOOKUP_REPORT_40000_FORMATS' 7092 HASH JOIN 4 TABLE ACCESS MODE: ANALYZED (FULL) OF 'ANALYSIS_TESTS' 512382 HASH JOIN 512382 NESTED LOOPS 832470 HASH JOIN 465504 HASH JOIN 41 TABLE ACCESS MODE: ANALYZED (FULL) OF 'CUSTOMER_INSTANCES' 465504 TABLE ACCESS MODE: ANALYZED (FULL) OF 'SAMPLES' 832469 INDEX MODE: ANALYZED (FAST FULL SCAN) OF 'ANALYSIS_RESULTS_PK' (UNIQUE) 512382 INDEX MODE: ANALYZED (UNIQUE SCAN) OF 'CUSTOMER_USER_INST_PRIVS_PK' (UNIQUE) 126110 INDEX MODE: ANALYZED (FAST FULL SCAN) OF 'ANALYSIS_COMMON_RESULTS_N1' (NON-UNIQUE) 42 TABLE ACCESS MODE: ANALYZED (BY INDEX ROWID) OF 'SAMPLES' 42 INDEX MODE: ANALYZED (UNIQUE SCAN) OF 'SAMPLES_PK' (UNIQUE)

60
Oracle 10g Without Hint Rows Row Source Operation------- --------------------------------------------------- 0 SORT ORDER BY (cr=4212 pr=0 pw=0 time=3573213 us) 0 HASH JOIN (cr=4212 pr=0 pw=0 time=3573077 us) 71 TABLE ACCESS FULL LOOKUP_REPORT_40000_FORMATS (cr=3 pr=0 pw=0 time=489 us) 0 HASH JOIN (cr=4209 pr=0 pw=0 time=3562005 us) 4 TABLE ACCESS FULL ANALYSIS_TESTS (cr=18 pr=0 pw=0 time=853 us) 243 HASH JOIN (cr=4191 pr=0 pw=0 time=3554047 us) 126110 INDEX FAST FULL SCAN ANALYSIS_COMMON_RESULTS_N1 (cr=341 pr=0 pw=0 time=126363 us)(object id 49302) 243 HASH JOIN (cr=3850 pr=0 pw=0 time=2830427 us) 343 TABLE ACCESS BY INDEX ROWID SAMPLES (cr=391 pr=0 pw=0 time=19666 us) 359 NESTED LOOPS (cr=292 pr=0 pw=0 time=578919 us) 15 NESTED LOOPS (cr=58 pr=0 pw=0 time=1791 us) 41 TABLE ACCESS FULL CUSTOMER_INSTANCES (cr=15 pr=0 pw=0 time=759 us) 15 INDEX UNIQUE SCAN CUSTOMER_USER_INST_PRIVS_PK (cr=43 pr=0 pw=0 time=1588 us)(object id 49663) 343 INLIST ITERATOR (cr=234 pr=0 pw=0 time=40802 us) 343 INDEX RANGE SCAN SAMPLES_UK2 (cr=234 pr=0 pw=0 time=40979 us)(object id 49504) 14 TABLE ACCESS BY INDEX ROWID SAMPLES (cr=147 pr=0 pw=0 time=33644 us) 14 INDEX UNIQUE SCAN SAMPLES_PK (cr=133 pr=0 pw=0 time=33165 us)(object id 49501) 832469 INDEX FAST FULL SCAN ANALYSIS_RESULTS_PK (cr=3459 pr=0 pw=0 time=1665167 us)(object id 49571)

61
SQL That Ran Slower in 10g SQL noticeably slower in very few cases on 10g. A report ran unacceptably slower after the upgrade:
– CPU time doubled.– Logical reads increased by order of magnitude.
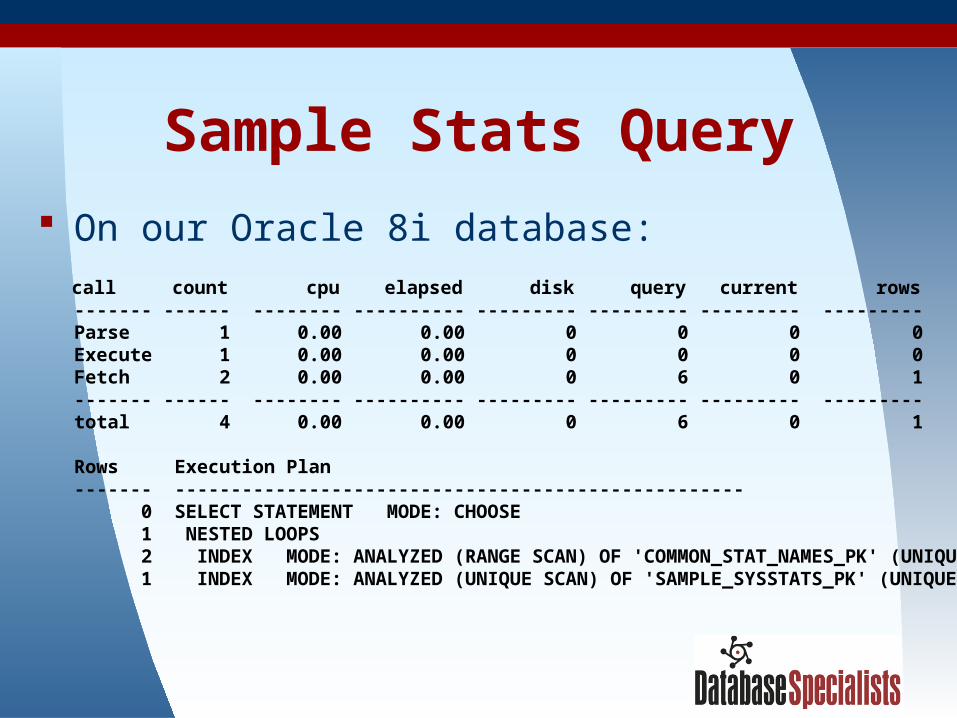
Slowdown attributed to one query (which runs many times):
SELECT B.value FROM common_stat_names A, sample_sysstats B WHERE A.name = :p_statname AND B.common_stat_name_id = A.common_stat_name_id AND B.sample_id = :p_sample_id;
62
Sample Stats Query On our Oracle 8i database: call count cpu elapsed disk query current rows
------- ------ -------- ---------- --------- --------- --------- ---------Parse 1 0.00 0.00 0 0 0 0Execute 1 0.00 0.00 0 0 0 0Fetch 2 0.00 0.00 0 6 0 1------- ------ -------- ---------- --------- --------- --------- ---------total 4 0.00 0.00 0 6 0 1 Rows Execution Plan------- --------------------------------------------------- 0 SELECT STATEMENT MODE: CHOOSE 1 NESTED LOOPS 2 INDEX MODE: ANALYZED (RANGE SCAN) OF 'COMMON_STAT_NAMES_PK' (UNIQUE) 1 INDEX MODE: ANALYZED (UNIQUE SCAN) OF 'SAMPLE_SYSSTATS_PK' (UNIQUE)
63
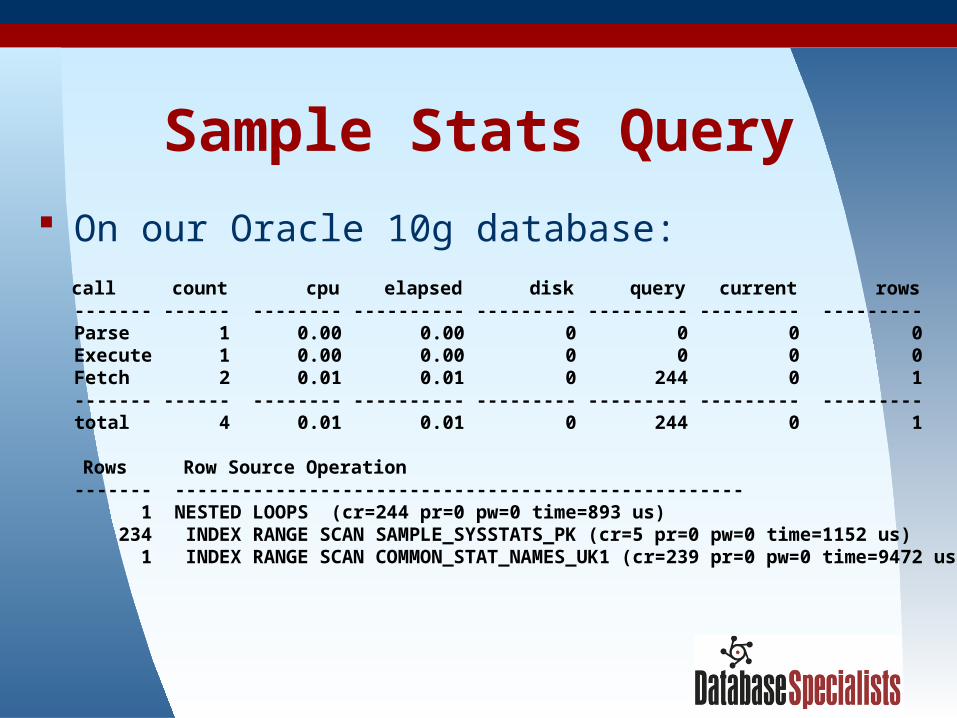
Sample Stats Query On our Oracle 10g database: call count cpu elapsed disk query current rows
------- ------ -------- ---------- --------- --------- --------- ---------Parse 1 0.00 0.00 0 0 0 0Execute 1 0.00 0.00 0 0 0 0Fetch 2 0.01 0.01 0 244 0 1------- ------ -------- ---------- --------- --------- --------- ---------total 4 0.01 0.01 0 244 0 1
Rows Row Source Operation------- --------------------------------------------------- 1 NESTED LOOPS (cr=244 pr=0 pw=0 time=893 us) 234 INDEX RANGE SCAN SAMPLE_SYSSTATS_PK (cr=5 pr=0 pw=0 time=1152 us) 1 INDEX RANGE SCAN COMMON_STAT_NAMES_UK1 (cr=239 pr=0 pw=0 time=9472 us)

64
Sample Stats Query Who cares about a 0.01 second query?
– Suppose the query runs 50+ times each time a popular report is viewed?
Adding an ORDERED hint to the query made Oracle 10g choose the correct execution plan.
The same exact behavior occurred in both our test and production Oracle 10g environments.
Both tables in the query are IOTs.– Oracle has determined this is “a problem with the optimizer
caching cost model.”
65
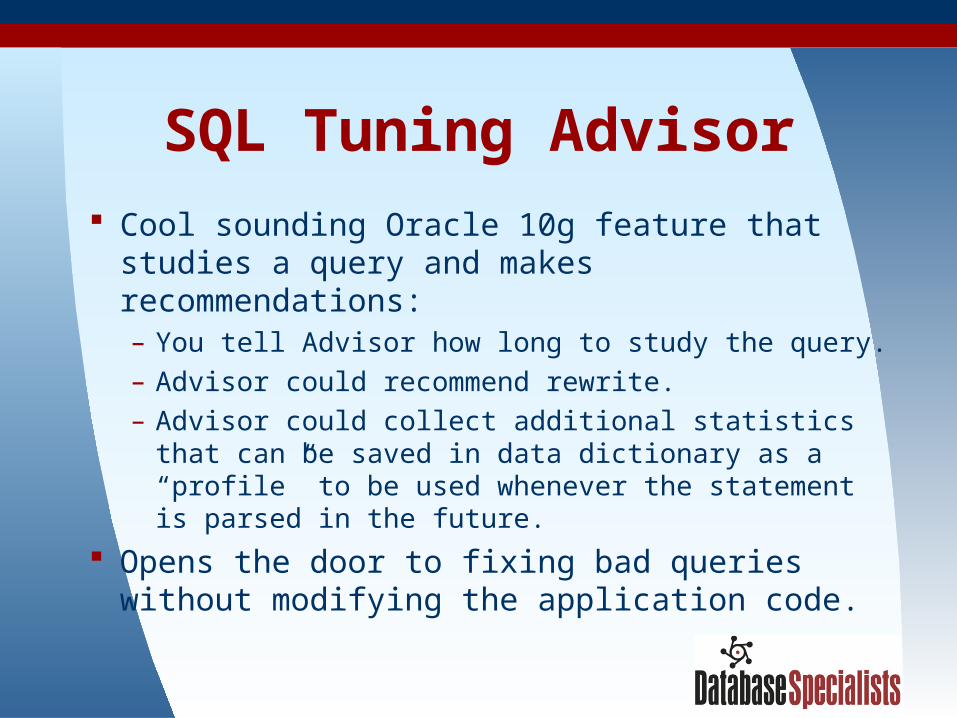
SQL Tuning Advisor Cool sounding Oracle 10g feature that studies
a query and makes recommendations:– You tell Advisor how long to study the query.– Advisor could recommend rewrite.– Advisor could collect additional statistics that can
be saved in data dictionary as a “profile” to be used whenever the statement is parsed in the future.
Opens the door to fixing bad queries without modifying the application code.
66
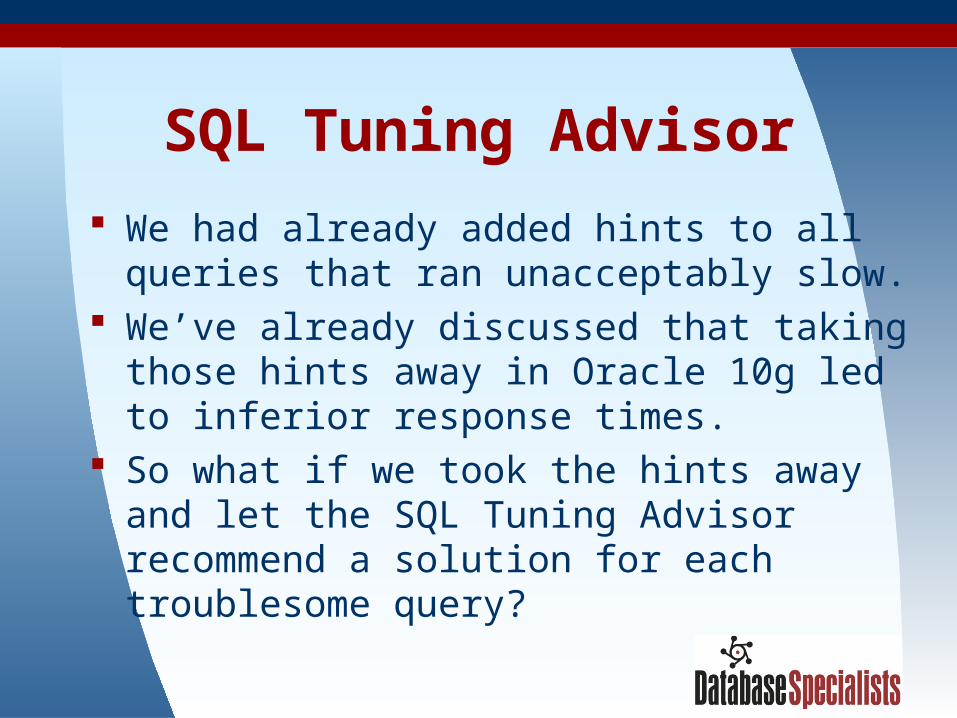
SQL Tuning Advisor We had already added hints to all queries that
ran unacceptably slow. We’ve already discussed that taking those
hints away in Oracle 10g led to inferior response times.
So what if we took the hints away and let the SQL Tuning Advisor recommend a solution for each troublesome query?

67
Recent Event Notifications SQL> SELECT dbms_sqltune.report_tuning_task
2 ('Tuning case 47696', 'TEXT', 'ALL', 'ALL') 3 FROM SYS.dual;DBMS_SQLTUNE.REPORT_TUNING_TASK('TUNINGCASE47696','TEXT','ALL','ALL')---------------------------------------------------------------------GENERAL INFORMATION SECTION---------------------------------------------------------------------Tuning Task Name : Tuning case 47696Tuning Task ID : 951Scope : COMPREHENSIVETime Limit(seconds): 600Completion Status : COMPLETEDStarted at : 01/27/2005 13:42:34Completed at : 01/27/2005 13:42:48---------------------------------------------------------------------SQL ID : b6c2qka14951zSQL Text: SELECT t.test_severity_id severity, i.instance_id, ... ORDER BY severity, first_detected DESC, inst_name---------------------------------------------------------------------There are no recommendations to improve the statement.

68
Sample Stats Query SQL> SELECT dbms_sqltune.report_tuning_task
2 ('Tuning case 47694', 'TEXT', 'ALL', 'ALL') 3 FROM SYS.dual;DBMS_SQLTUNE.REPORT_TUNING_TASK('TUNINGCASE47694','TEXT','ALL','ALL')---------------------------------------------------------------------GENERAL INFORMATION SECTION---------------------------------------------------------------------Tuning Task Name : Tuning case 47694Tuning Task ID : 950Scope : COMPREHENSIVETime Limit(seconds): 600Completion Status : COMPLETEDStarted at : 01/27/2005 13:32:02Completed at : 01/27/2005 13:32:03---------------------------------------------------------------------SQL ID : g5pqqgcuq8pmaSQL Text: SELECT B.value /* tuning case 47694 */ FROM common_stat_names A, sample_sysstats B WHERE A.name = :p_statname AND B.common_stat_name_id = A.common_stat_name_id AND B.sample_id = :p_sample_id---------------------------------------------------------------------There are no recommendations to improve the statement.
69
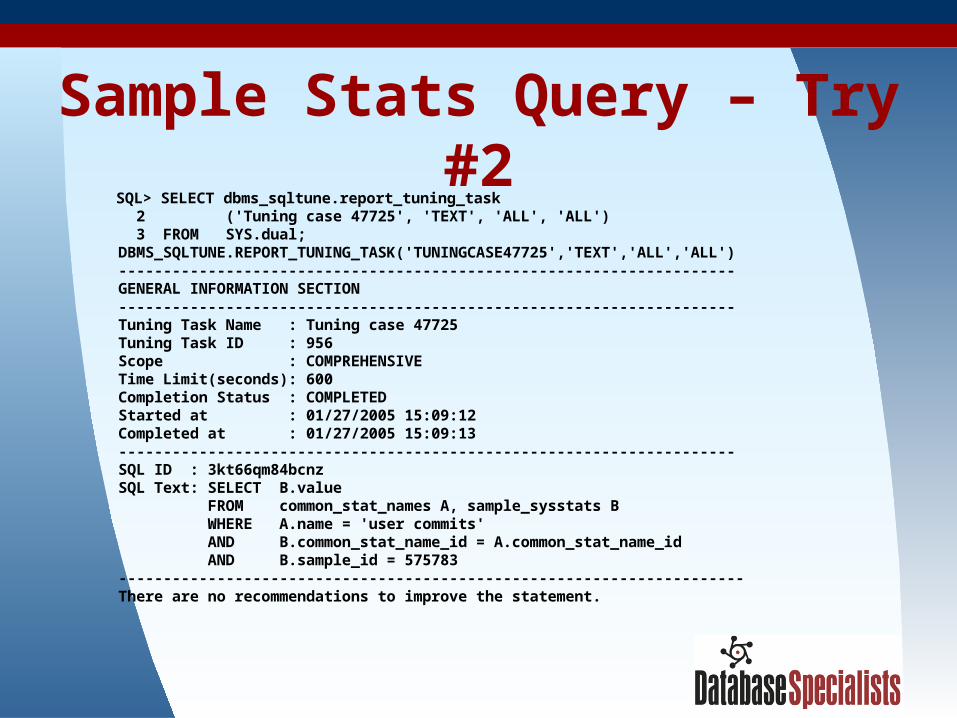
Sample Stats Query – Try #2
SQL> SELECT dbms_sqltune.report_tuning_task 2 ('Tuning case 47725', 'TEXT', 'ALL', 'ALL') 3 FROM SYS.dual;DBMS_SQLTUNE.REPORT_TUNING_TASK('TUNINGCASE47725','TEXT','ALL','ALL')---------------------------------------------------------------------GENERAL INFORMATION SECTION---------------------------------------------------------------------Tuning Task Name : Tuning case 47725Tuning Task ID : 956Scope : COMPREHENSIVETime Limit(seconds): 600Completion Status : COMPLETEDStarted at : 01/27/2005 15:09:12Completed at : 01/27/2005 15:09:13---------------------------------------------------------------------SQL ID : 3kt66qm84bcnzSQL Text: SELECT B.value FROM common_stat_names A, sample_sysstats B WHERE A.name = 'user commits' AND B.common_stat_name_id = A.common_stat_name_id AND B.sample_id = 575783----------------------------------------------------------------------There are no recommendations to improve the statement.

70
A Trivial Query SQL> SELECT dbms_sqltune.report_tuning_task
2 ('Tuning case 47702', 'TEXT', 'ALL', 'ALL') 3 FROM SYS.dual;DBMS_SQLTUNE.REPORT_TUNING_TASK('TUNINGCASE47702','TEXT','ALL','ALL')---------------------------------------------------------------------GENERAL INFORMATION SECTION---------------------------------------------------------------------Tuning Task Name : Tuning case 47702Tuning Task ID : 952Scope : COMPREHENSIVETime Limit(seconds): 600Completion Status : COMPLETEDStarted at : 01/27/2005 13:51:45Completed at : 01/27/2005 13:51:57---------------------------------------------------------------------SQL ID : 9cz4z8xvtxbm1SQL Text: SELECT instance_id, sample_type, sample_date_db_local_time /* tuning case 47702 */ FROM samples WHERE sample_id + 1 = :sample_id

71
A Trivial Query -------------------------------------------------------------------------------
FINDINGS SECTION (1 finding)------------------------------------------------------------------------------- 1- Restructure SQL finding (see plan 1 in explain plans section)---------------------------------------------------------------- The predicate "SAMPLES"."SAMPLE_ID"+1=:B1 used at line ID 1 of the execution plan contains an expression on indexed column "SAMPLE_ID". This expression prevents the optimizer from selecting indices on table "DBRX_OWNER"."SAMPLES".
Recommendation -------------- Rewrite the predicate into an equivalent form to take advantage of indices. Alternatively, create a function-based index on the expression.
Rationale --------- The optimizer is unable to use an index if the predicate is an inequality condition or if there is an expression or an implicit data type conversion on the indexed column.

72
A Trivial Query -------------------------------------------------------------------------------
EXPLAIN PLANS SECTION-------------------------------------------------------------------------------
1- Original-----------Plan hash value: 3806118825
-----------------------------------------------------------------------------| Id | Operation | Name | Rows | Bytes | Cost (%CPU)| Time |-----------------------------------------------------------------------------| 0 | SELECT STATEMENT | | 4656 | 122K| 2375 (4)| 00:00:29 || 1 | TABLE ACCESS FULL| SAMPLES | 4656 | 122K| 2375 (4)| 00:00:29 |-----------------------------------------------------------------------------
Query Block Name / Object Alias (identified by operation id):-------------------------------------------------------------
1 - SEL$1 / SAMPLES@SEL$1-------------------------------------------------------------------------------

73
Overhead What does the automation, self-management, and
new functionality of Oracle 10g cost us? For example:
– Memory usage– The cost of a parse– CPU usage by automation and self-mgmt processes
As you would expect, all of these go up noticeably with Oracle 10g.
For us, the increases were all manageable.

74
SYS Has Put on Weight Oracle 8i production (SE, minimal options):
– 2,303 objects in SYS schema– 100 Mb allocated in SYSTEM tablespace
Oracle 10g production (SE, minimal options):– 6,284 objects in SYS schema– 454 Mb allocated in SYSTEM, SYSAUX
Oracle 10g test (EE, “default” options):– 21,848 objects in SYS schema– 800 Mb allocated in SYSTEM, SYSAUX

75
Memory Usage
Process stats from prstat and top Total VM size includes SGA Remember: 32 bit to 64 bit change
Oracle Dedicated Server Processes Oracle 8i Oracle 10g
Resident set size of Oracle process 97 Mb 224 Mb
Total virtual memory size of Oracle process 121 Mb 301 Mb
SGA size according to v$sgastat 84 Mb 197 Mb
Size of the Oracle executable 32 Mb 95 Mb

76
Hard Parse Cost Hard parses have been expensive in Oracle for a long
time. Mechanisms to reduce the need for hard parses:
– Shared SQL area– Bind variables
Hard parses should be a one-time expense in properly designed systems.
As the optimizer gets more sophisticated you might expect hard parses to get more expensive.
In Oracle 10g, they do.

77
Hard Parse Cost Comparison
Resources used by Loader Daemon Agent File 1 (hard parse)
Oracle 8i Oracle 10g
User SQL statements traced 110 127
Internal SQL statements traced 402 977
Unique SQL statements traced 139 149
Total OCI calls 9,094 10,754
CPU seconds 7.49 10.94
Logical reads 26,776 27,373
Physical reads 695 959

78
Hard Parse Cost Comparison
Resources used by Loader Daemon Agent File 2 (soft parse)
Oracle 8i Oracle 10g
User SQL statements traced 110 127
Internal SQL statements traced 9 9
Unique SQL statements traced 109 110
Total OCI calls 1,800 1,784
CPU seconds 3.10 3.09
Logical reads 13,763 12,912
Physical reads 8 13

79
Hard Parse Cost Comparison
Resources used by Loader Daemon Difference
Oracle 8i Oracle 10g
User SQL statements traced 0 0
Internal SQL statements traced 393 968
Unique SQL statements traced 30 39
Total OCI calls 7,294 8,970
CPU seconds 4.39 7.85
Logical reads 13,013 14,461
Physical reads 687 946

80
CPU Used by Oracle Daemons
How much additional CPU time will Oracle 10g daemons consume?
Simple test: Measure CPU usage on an idle instance.
Flaws in this test:– Some Oracle features probably use more resources
on a busy database than an idle one (eg AWR).– How do you measure CPU time accurately? (We
used sar.)

81
CPU Usage Comparison No Oracle processes running: 02:00:03 %usr %sys %wio %idle 02:05:03 0 4 0 96 02:10:03 0 4 0 96 02:15:03 0 4 0 96
Idle Oracle 8i instance: 02:00:03 %usr %sys %wio %idle 02:05:03 1 4 1 94 02:10:03 0 4 1 95 02:15:03 0 4 0 95
Idle Oracle 10g instance plus EMDC: 13:00:05 %usr %sys %wio %idle 13:05:05 5 6 3 87 13:10:05 3 6 2 89 13:15:05 3 6 4 88

82
Activity in Idle Oracle 10g An AWR report for a one hour period on an
Oracle 10g instance with no user activity showed:– 27,000 statement executions– 49 CPU seconds used– 8 Mb redo generated
83
Wrapping Up We’ve been happy with Oracle 10g:
– Installed easily– Upgrade went smoothly– No serious compatibility issues– Very few response time issues caused by upgrade– New features ought to justify increased heft, complexity, and
overhead For us, the upgrade justification boiled down to getting
the experience. Technology-wise, Oracle 8i was already meeting our needs.

84
Always Remember Each Oracle system is unique and will have its
own challenges. Never take somebody else’s word on anything
when it comes to Oracle technology. In this session we are only relaying one company’s
experiences. The only way for you to know how your specific
system will fare on Oracle 10g is to try it—in a test environment—and see.

85
White Paper Contains additional topics and examples we
didn’t have time to discuss today Contains additional "supporting evidence" for
conclusions reached in today's session that we didn’t have time to discuss or that couldn’t fit legibly on a PowerPoint slide– TKPROF reports, execution plans, AWR reports
Download: www.dbspecialists.com/presentations

86
Contact InformationRoger SchragDatabase Specialists, Inc.388 Market Street, Suite 400San Francisco, CA 94111
Tel: 415/344-0500Email: [email protected]: www.dbspecialists.com