schroders and asia · amsterdam copenhagen dubai frankfurt geneva gibraltar luxembourg madrid milan...
TRANSCRIPT

Marketing material for professional investors or advisers only. This material is not suitable for retail clients
Schroders Investment Conference 2018, Manchester
22 May 2018
#SICM18
@Schroders_UK
Matthew Dobbs, Fund Manager
Schroders and Asia

Schroders offices
SchrodersA worldwide team dedicated to asset management
1
Source: Schroders. Statistics are as of 30 September 2017.
AsiaBeijingHong Kong JakartaMumbaiSeoul
ShanghaiSingaporeSydneyTaipeiTokyo
Investment offices in green
Europe and Middle EastAmsterdamCopenhagenDubai FrankfurtGeneva
GibraltarLuxembourgMadridMilanParis
RomeStockholmZurich
UK Chester
EdinburghGuernsey
JerseyLondonOxford
AmericasBermuda
Buenos AiresCayman Islands
Mexico CityNew York
PhiladelphiaSantiago
São Paulo
Focus– Asset management is our sole business
Financial strength– $563.0 billion in AUM globally
Resources– Well established teams in all key
investment regions– Over 420 portfolio managers and
analysts worldwide– Over 4,000 personnel in 28 countries
Experience and independence– Over 200 years of financial services experience– Founding Schroder family controls 47.9% of voting
equity

Schroders in the Far EastStrong regional presence
2
– Matthew Dobbs has over 36 years of investment experience with Schroders, 30 of which has been spent following Far Eastern markets
– Richard Sennitt has 24 years of investment experience all of which have been spent following the Far Eastern markets and all at Schroders
– 391 ex Japan analysts based in seven offices across the region
Schroders office
Source: Schroders, as at 31 March 2018.1February 2018. Includes a joint-venture team of 5 Indian equity specialists at Axis Asset Management (Axis AMC) in Mumbai. The Axis AMC team is fully integrated and provides support and coverage for Indian stocks within our research universe.
Investment office
Representative office
TokyoOpened 1974SeoulOpened 1987BeijingOpened 1996Mumbai2
Opened 2012TaipeiOpened 1989ShanghaiOpened 1994
Hong KongOpened 1971SingaporeOpened 1977JakartaOpened 1991
SydneyOpened 1963MelbourneOpened 2007
2A joint venture fund management company with Axis Asset Management Company
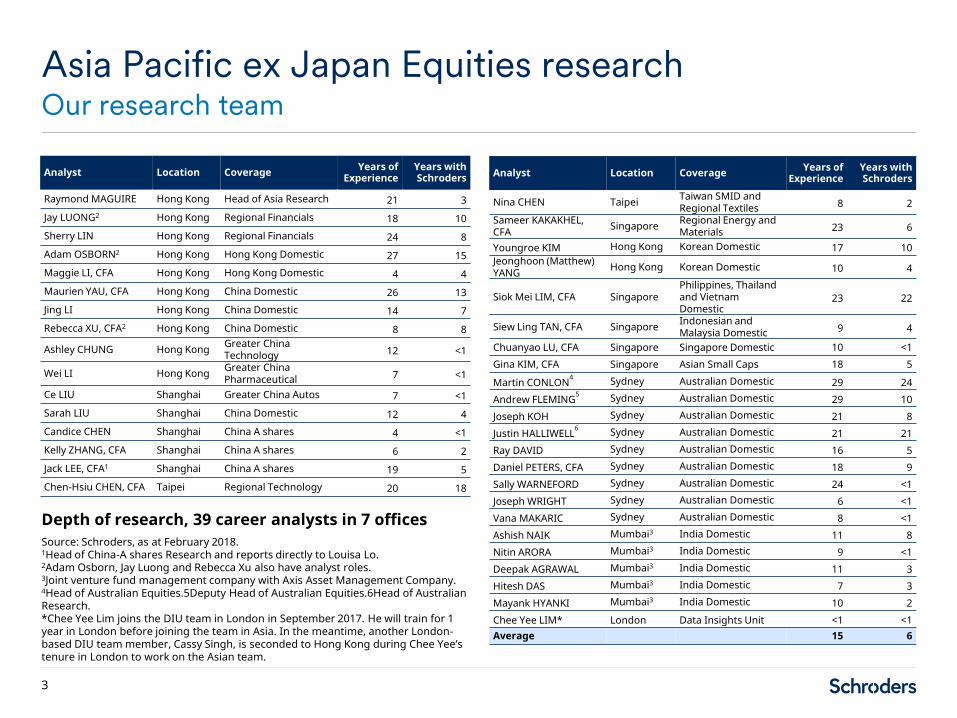
Depth of research, 39 career analysts in 7 offices
Asia Pacific ex Japan Equities researchOur research team
3
Source: Schroders, as at February 2018.1Head of China-A shares Research and reports directly to Louisa Lo. 2Adam Osborn, Jay Luong and Rebecca Xu also have analyst roles.3Joint venture fund management company with Axis Asset Management Company. 4Head of Australian Equities.5Deputy Head of Australian Equities.6Head of Australian Research.*Chee Yee Lim joins the DIU team in London in September 2017. He will train for 1 year in London before joining the team in Asia. In the meantime, another London-based DIU team member, Cassy Singh, is seconded to Hong Kong during Chee Yee’s tenure in London to work on the Asian team.
Analyst Location Coverage Years ofExperience
Years withSchroders
Raymond MAGUIRE Hong Kong Head of Asia Research 21 3
Jay LUONG2 Hong Kong Regional Financials 18 10
Sherry LIN Hong Kong Regional Financials 24 8
Adam OSBORN2 Hong Kong Hong Kong Domestic 27 15
Maggie LI, CFA Hong Kong Hong Kong Domestic 4 4
Maurien YAU, CFA Hong Kong China Domestic 26 13
Jing LI Hong Kong China Domestic 14 7
Rebecca XU, CFA2 Hong Kong China Domestic 8 8
Ashley CHUNG Hong Kong Greater China Technology 12 <1
Wei LI Hong Kong Greater China Pharmaceutical 7 <1
Ce LIU Shanghai Greater China Autos 7 <1
Sarah LIU Shanghai China Domestic 12 4
Candice CHEN Shanghai China A shares 4 <1
Kelly ZHANG, CFA Shanghai China A shares 6 2
Jack LEE, CFA1 Shanghai China A shares 19 5
Chen-Hsiu CHEN, CFA Taipei Regional Technology 20 18
Analyst Location Coverage Years ofExperience
Years withSchroders
Nina CHEN Taipei Taiwan SMID and Regional Textiles 8 2
Sameer KAKAKHEL, CFA Singapore Regional Energy and
Materials 23 6
Youngroe KIM Hong Kong Korean Domestic 17 10Jeonghoon (Matthew) YANG Hong Kong Korean Domestic 10 4
Siok Mei LIM, CFA SingaporePhilippines, Thailand and Vietnam Domestic
23 22
Siew Ling TAN, CFA Singapore Indonesian and Malaysia Domestic 9 4
Chuanyao LU, CFA Singapore Singapore Domestic 10 <1Gina KIM, CFA Singapore Asian Small Caps 18 5
Martin CONLON4 Sydney Australian Domestic 29 24Andrew FLEMING5 Sydney Australian Domestic 29 10Joseph KOH Sydney Australian Domestic 21 8Justin HALLIWELL6 Sydney Australian Domestic 21 21Ray DAVID Sydney Australian Domestic 16 5Daniel PETERS, CFA Sydney Australian Domestic 18 9Sally WARNEFORD Sydney Australian Domestic 24 <1Joseph WRIGHT Sydney Australian Domestic 6 <1Vana MAKARIC Sydney Australian Domestic 8 <1Ashish NAIK Mumbai3 India Domestic 11 8Nitin ARORA Mumbai3 India Domestic 9 <1Deepak AGRAWAL Mumbai3 India Domestic 11 3Hitesh DAS Mumbai3 India Domestic 7 3Mayank HYANKI Mumbai3 India Domestic 10 2Chee Yee LIM* London Data Insights Unit <1 <1Average 15 6

Schroder Asian Alpha Plus Fund

Schroder Asian Alpha Plus FundRisk aligned to target alpha but not beta
5
Performance shown is past performance. Past performance is not a guide to future performance. The value of investment can go down as well as up and is not guaranteed.Source: Schroders, Style Research, as at 31 March 2018. Based on unaudited data. 1Schroders, Since inception to 31 March 2018.
ActiveTracking error 3.3%
Active share 69.9%
Unconstrained 29.4% of portfolio out of benchmark
Absolute return influence Weighted average upside of 7.9%
Concentrated 58 holdings – benchmark coverage 30.1%
Beta 0.97
Fund volatility 14.8%
Benchmark volatility 14.9%
Hit rate1 Average outperformance1
Overall 56% 1.3%
Up markets 54% 1.4%
Down markets 59% 1.3%

Returns to 29 March 2018 (£)
Schroder Asian Alpha Plus FundPerformance
6
Performance shown is past performance. Past performance is not a guide to future performance. The value of investment can go down as well as up and is not guaranteed.Source: Schroders, Morningstar. Performance is presented net of fees, bid to bid, GBP, for the Z Acc share class, as at 29 March 2018.Source for ratings: Morningstar, Rayner Spencer Mills, Fund Calibre, City Financial, Square Mile and Trustnet, as at 30 April 2018 and Citywire, as at 31 March 2018. 1Inception date 30 November 2007.2Prior to 01 October 2015 Benchmark was MSCI AC Far East ex Japan. 3Morningstar universe: UK Registered Investment Funds, Asia Pacific ex Japan, Asia Pacific ex Japan ex Australia, Equity. Based on Z Acc share class. Please see Morningstar disclaimer at the end of the presentation.
3 months %
1 year %
3 years p.a. %
5 years p.a. %
Since inception1 p.a. %
Schroder Asian Alpha Plus Fund -2.9 +15.8 +15.0 +11.0 +11.4
MSCI AC Asia ex Japan2 -3.1 +12.0 +10.9 +9.5 +7.8
Relative performance +0.2 +3.8 +4.1 +1.5 +3.6
Percentile ranking3 29 17 10 21 3
Quartile ranking3 2 1 1 1 1
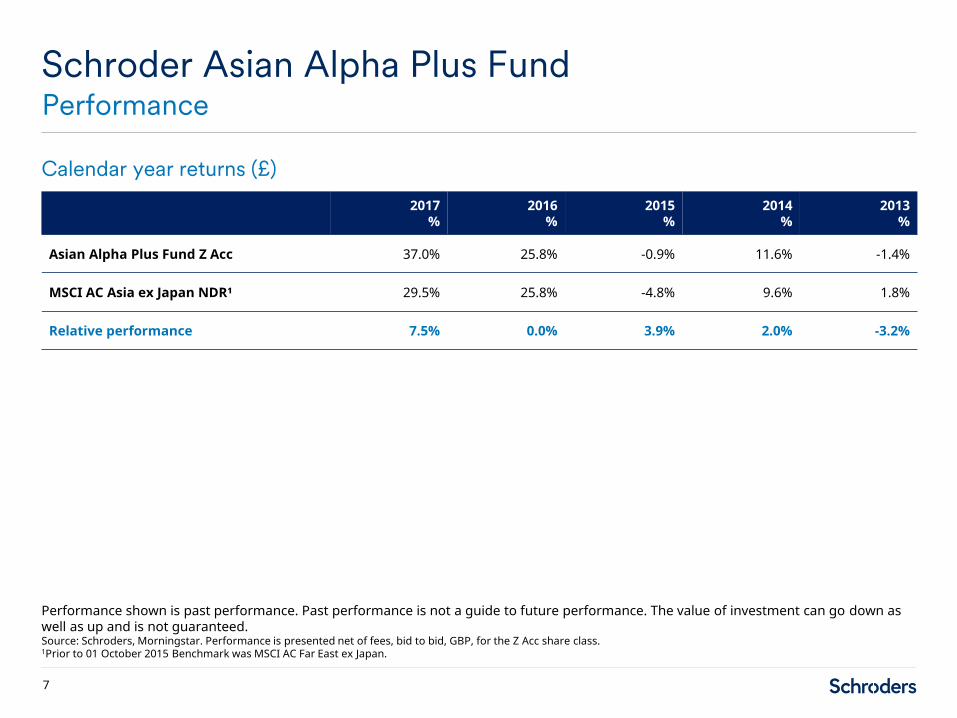
Calendar year returns (£)
Schroder Asian Alpha Plus FundPerformance
7
Performance shown is past performance. Past performance is not a guide to future performance. The value of investment can go down as well as up and is not guaranteed.Source: Schroders, Morningstar. Performance is presented net of fees, bid to bid, GBP, for the Z Acc share class.1Prior to 01 October 2015 Benchmark was MSCI AC Far East ex Japan.
2017%
2016%
2015%
2014%
2013%
Asian Alpha Plus Fund Z Acc 37.0% 25.8% -0.9% 11.6% -1.4%
MSCI AC Asia ex Japan NDR¹ 29.5% 25.8% -4.8% 9.6% 1.8%
Relative performance 7.5% 0.0% 3.9% 2.0% -3.2%
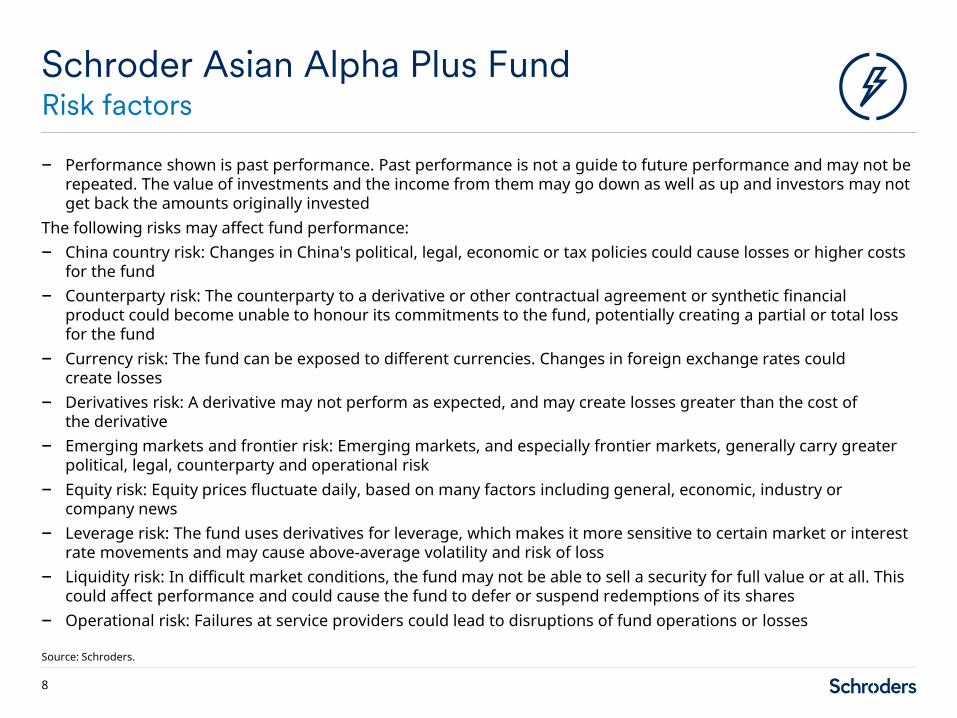
– Performance shown is past performance. Past performance is not a guide to future performance and may not be repeated. The value of investments and the income from them may go down as well as up and investors may not get back the amounts originally invested
The following risks may affect fund performance:– China country risk: Changes in China's political, legal, economic or tax policies could cause losses or higher costs
for the fund– Counterparty risk: The counterparty to a derivative or other contractual agreement or synthetic financial
product could become unable to honour its commitments to the fund, potentially creating a partial or total loss for the fund
– Currency risk: The fund can be exposed to different currencies. Changes in foreign exchange rates could create losses
– Derivatives risk: A derivative may not perform as expected, and may create losses greater than the cost of the derivative
– Emerging markets and frontier risk: Emerging markets, and especially frontier markets, generally carry greater political, legal, counterparty and operational risk
– Equity risk: Equity prices fluctuate daily, based on many factors including general, economic, industry or company news
– Leverage risk: The fund uses derivatives for leverage, which makes it more sensitive to certain market or interest rate movements and may cause above-average volatility and risk of loss
– Liquidity risk: In difficult market conditions, the fund may not be able to sell a security for full value or at all. This could affect performance and could cause the fund to defer or suspend redemptions of its shares
– Operational risk: Failures at service providers could lead to disruptions of fund operations or losses
Schroder Asian Alpha Plus FundRisk factors
8
Source: Schroders.

Schroder Asian Alpha Plus FundCountry and sector positions vs. benchmark1
9
Country weights
9.5%
4.2%
1.5%
1.5%
0.8%
0.2%
-0.1%
-1.1%
-1.5%
-2.0%
-2.9%
-3.9%
-4.1%
-5.1%
3.1%
Hong Kong
United Kingdom
Italy
Thailand
Sri Lanka
India
Pakistan
Philippines
Indonesia
Singapore
Malaysia
Taiwan
Korea
China
Cash
Source: Schroders. Fund position less benchmark weight. Based on unaudited data. as at 31 March 2018.1Benchmark: MSCI AC Asia ex Japan. Country and sector examples are for illustrative purposes only and are not a recommendation to buy or sell.
Underweight Overweight
Sector weights
7.5%
2.7%
0.6%
0.1%
-0.5%
-0.6%
-0.6%
-2.2%
-2.6%
-2.9%
-4.6%
3.1%
Consumer Discretionary
Real Estate
Health Care
Energy
Financials
Information Technology
Industrials
Materials
Telecommunication Services
Utilities
Consumer Staples
Cash

Top 20 holdings
Schroder Asian Alpha Plus Fund As at 31 March 2018
10
Source: Schroders. Based on unaudited data. Top 20 holdings excludes a position in the Schroder AsiaPacific Fund plc which was 2.2% at the end of March 2018.Stocks and countries shown are for illustrative purposes only and should not be viewed as a recommendation to buy or sell.
Company name Country % portfolio
TSMC Taiwan 6.0
Samsung Electronics Korea 5.3
Tencent Holdings China 4.7
Alibaba Group China 4.0
AIA Group Hong Kong 3.9
Midea Group China 3.0
China Pacific Insurance China 2.9
Hangzhou Hikvision China 2.9
HDFC Bank India 2.7
Bangkok Bank Thailand 2.6
Company name Country % portfolio
Standard Chartered Hong Kong 2.4
China Petroleum & Chemical China 2.3
Swire Properties Hong Kong 2.3
Oversea-Chinese Banking Singapore 2.2
Zee Entertainment India 2.0
BHP Billiton Australia 2.0
NCsoft Corp Korea 1.8
NAVER Korea 1.8
Kerry Properties Hong Kong 1.8
China Construction Bank China 1.7
Total of top 20 58.3

Schroder AsiaPacific Fund plc

Returns to 31 March 2018 (£)
Schroder AsiaPacific Fund plcNAV performance
12
Performance shown is past performance. Past performance is not a guide to future performance. The value of investment can go down as well as up and is not guaranteed.Source: Morningstar, Schroders.Source for ratings: Morningstar and Trustnet, as at 30 April 2018. Please see Morningstar disclaimer at the end of the presentation.1Prior to 28 February 2011 Benchmark was MSCI AC Far East ex Japan.2NAV Total Return, net of fees, GBP.
Benchmark: MSCI AC Asia ex Japan Index1 (net dividends reinvested)Current value: £843,090,677Inception date: 20 November 1995
3 months%
1 year%
3 years% p.a.
5 years% p.a.
Since inception2
% p.a.
Schroder AsiaPacific Fund plc2 -3.0 16.8 15.9 12.2 8.5
MSCI AC Asia ex Japan -2.9 12.2 11.3 9.9 5.7
Relative performance -0.1 4.6 4.6 2.3 2.8

Calendar year returns (£)
Schroder AsiaPacific Fund plcNAV performance
13
Performance shown is past performance. Past performance is not a guide to future performance. The value of investment can go down as well as up and is not guaranteed.Source: Morningstar, Schroders.1Prior to 31 January 2011 Benchmark was MSCI AC Far East ex Japan.2NAV Total Return, net of fees, GBP.
2017%
2016%
2015%
2014%
2013%
Schroder AsiaPacific Fund plc2 38.7% 27.7% -0.1% 15.9% -1.8%
MSCI AC Asia ex Japan1 29.5% 25.8% -3.9% 11.3% 1.2%
Relative performance 9.2% 1.9% 3.8% 4.6% -3.0%

– Performance shown is past performance. Past performance is not a guide to future performance and may not be repeated. The value of investments and the income from them may go down as well as up and investors may not get back the amounts originally invested
– Investors in the emerging markets and the Far East should be aware that this involves a high degree of risk and should be seen as long term in nature. Less developed markets are generally less well regulated than the UK, they may be less liquid and may have less reliable arrangements for trading and settlement of the underlying holdings
– The trust holds investments denominated in currencies other than sterling, investors should note that exchange rates may cause the value of these investments, and the income from them, to rise or fall
– The trust invests in smaller companies that may be less liquid than in larger companies and price swings may therefore be greater than investment trusts that invest in larger companies
– The trust may borrow money to invest in further investments, this is known as gearing. Gearing will increase returns if the value of the investments purchased increase in value by more than the cost of borrowing, or reduce returns if they fail to do so
– Investments such as warrants, participation certificates, guaranteed bonds, etc. will expose the fund to the risk of the issuer of these instruments defaulting on paying the capital back to the fund
Schroder AsiaPacific Fund plcRisk factors
14
Source: Schroders.

Schroder AsiaPacific Fund plcCountry and sector positions vs. benchmark1
15
Country weights
Source: Schroders. As at 31 March 2018. Fund position less benchmark weight. Based on unaudited data. 1Benchmark: MSCI AC Asia ex Japan. Country and sector examples are for illustrative purposes only and are not a recommendation to buy or sell.
Underweight Overweight Underweight Overweight
Sector weights
5.1%
2.7%
1.4%
1.4%
1.1%
1.0%
0.5%
-0.1%
-0.6%
-0.8%
-0.8%
-1.0%
-2.9%
-3.4%
-3.6%
HK / China
Australia
India
Thailand
Vietnam
UK
Sri Lanka
Pakistan
Indonesia
Philippines
Korea
Singapore
Malaysia
Taiwan
Cash
7.0%
3.0%
1.5%
1.2%
-0.2%
-0.3%
-0.6%
-0.7%
-0.7%
-2.9%
-4.0%
0.4%
-3.6%
Consumer Discretionary
Information Technology
Real Estate
Industrials
Energy
Financials
Telecommunication Services
Health Care
Materials
Utilities
Consumer Staples
Fixed Income
Cash

Top 20 holdings
Schroder AsiaPacific Fund plcTop 20 holdings as at 31 March 2018
16
Source: Schroders. FactSet PA2. Based on unaudited data.Stock examples are for illustrative purposes only and are not a recommendation to buy or sell.
Company name Country % portfolio
Samsung Electronics Korea 6.1
TSMC Taiwan 5.3
Tencent China 4.8
Alibaba Group China 4.4
AIA Group Hong Kong 3.8
China Pacific Insurance China 2.8
Hangzhou Hikvision China 2.7
HDFC Bank India 2.7
Midea Group China 2.3
Standard Chartered Hong Kong 2.3
Company name Country % portfolio
Oversea-Chinese Banking Singapore 2.2
Zee Entertainment India 2.0
BHP Billiton Australia 1.9
Swire Properties Hong Kong 1.9
NCsoft Corp Korea 1.9
China Petroleum & Chemical China 1.9
NAVER Korea 1.8
Fortune Real Estate Hong Kong 1.8
Techtronic Industries Hong Kong 1.7
Kerry Properties Hong Kong 1.6
Total of top 20 56.0

Schroder Oriental Income Fund Limited

Asian income investment caseAsian yield in context
18
Source: 1Bloomberg, as at 31 March 2018. 2FactSet, as at 31 March 2018. 3Source: FactSet, MSCI, Schroders, Total dividends paid calculated using the dividend yield and market value, as at 31 December 2017.
Asian yield versus UK1
0
1
2
3
4
5
6
7
05 06 07 08 09 10 11 12 13 14 15 16 17
UK Base RateUK YieldAsia Pac ex Jap Yield
0
10
20
30
40
50
60
70
80
AC PxJp UK
5 year average Mar 18
Payout ratio in Asia not extended2
0
5
10
15
20
25
30
35
40
45
MSCI AC AsiaPacific ex Japan
MSCI UK
Number of stocks accounting for the top 50% of total dividends paid3
% % %
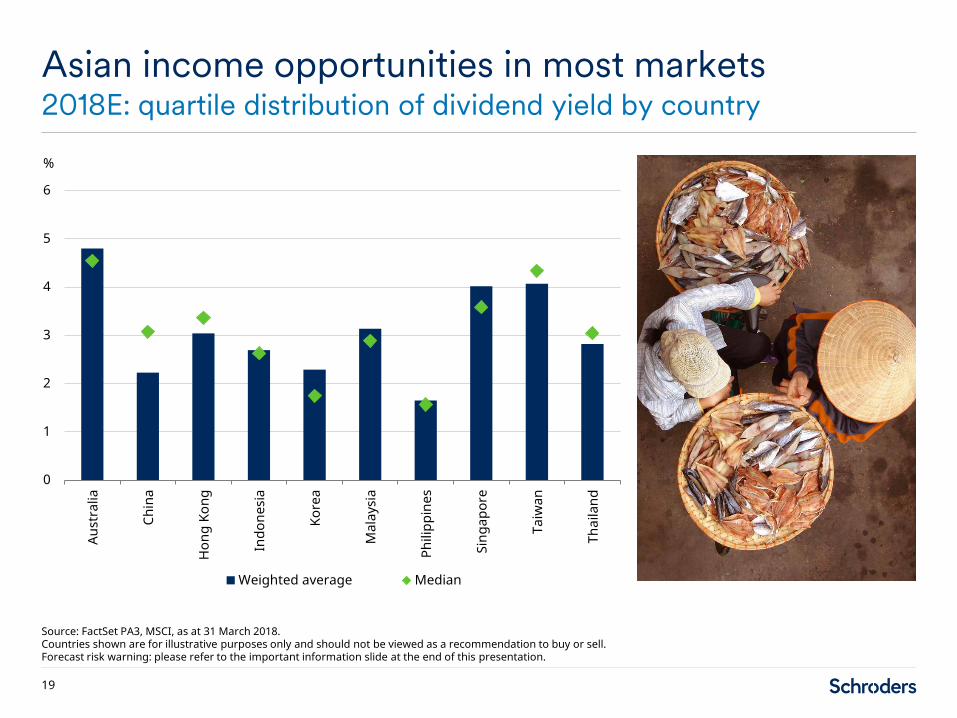
Asian income opportunities in most markets2018E: quartile distribution of dividend yield by country
19
Source: FactSet PA3, MSCI, as at 31 March 2018.Countries shown are for illustrative purposes only and should not be viewed as a recommendation to buy or sell. Forecast risk warning: please refer to the important information slide at the end of this presentation.
%
0
1
2
3
4
5
6
Aust
ralia
Chin
a
Hon
g Ko
ng
Indo
nesi
a
Kore
a
Mal
aysi
a
Phili
ppin
es
Sing
apor
e
Taiw
an
Thai
land
Weighted average Median

Returns to 31 March 2018 (£)
Schroder Oriental Income Fund LimitedNAV performance
20
Source: Schroders, Inception date 28 August 2005.Source for ratings: Morningstar and Fund Calibre, as at 30 April 2018.1Total Net Asset Value, as at 31 March 2018.2NAV Total Return, net of fees, GBP as at 31 March 2018.Performance shown is past performance. Past performance is not a guide to future performance. The value of investment can go down as well as up and is not guaranteed.Please refer to the Morningstar disclaimer at the end of this presentation.
Reference Index: MSCI AC Pacific ex Japan IndexCurrent value1: £619,683,791Inception date: 28 August 2005
Dividend per share
Year to August 2006 4.875p
Year to August 2007 4.95p
Year to August 2008 5.425p
Year to August 2009 5.50p
Year to August 2010 5.80p
Dividend per share
Year to August 2011 6.35p
Year to August 2012 6.80p
Year to August 2013 7.45p
Year to August 2014 7.65p
Year to August 2015 8.00p
Year to August 2016 8.50p
Year to August 2017 9.20p
3 months%
1 year%
3 years% p.a.
5 years% p.a.
Since inception2
% p.a.
Schroder Oriental Income Fund2 -2.9 4.6 11.0 8.8 12.0
MSCI AC Pacific ex Japan (NDR) -3.6 8.5 10.5 8.2 10.4
Relative performance 0.7 -3.9 0.5 0.6 1.6

Calendar year returns (£)
Schroder Oriental Income Fund LimitedNAV performance
21
Performance shown is past performance. Past performance is not a guide to future performance. The value of investment can go down as well as up and is not guaranteed.
Source: Schroders, Morningstar.1NAV Total Return, net of fees, GBP.
2017%
2016%
2015%
2014%
2013%
Schroder Oriental Income Fund1 16.0% 30.2% 0.3% 15.0% 0.9%
MSCI AC Pacific ex Japan (NDR) 25.1% 28.2% -4.4% 7.8% 2.0%
Relative performance -9.1% 2.0% 4.7% 7.2% -1.1%

– Performance shown is past performance. Past performance is not a guide to future performance and may not be repeated. The value of investments and the income from them may go down as well as up and investors may not get back the amounts originally invested
– Investors in the emerging markets and the Far East should be aware that this involves a high degree of risk and should be seen as long term in nature. Less developed markets are generally less well regulated than the UK, they may be less liquid and may have less reliable arrangements for trading and settlement of the underlying holdings
– The company invests in smaller companies that may be less liquid than in larger companies and price swings may therefore be greater than investment trusts, companies and funds that invest in larger companies
– The company holds investments denominated in currencies other than sterling, investors should note that exchange rates may cause the value of these investments, and the income from them, to rise or fall
– The company may borrow money to invest in further investments, this is known as gearing. Gearing will increase returns if the value of the investments purchased increase in value by more than the cost of borrowing, or reduce returns if they fail to do so
– Investment in warrants, participation certificates, guaranteed bonds, etc. will expose the fund to the risk of the issuer of these instruments defaulting. Deducting charges from capital can result in the income paid by the company being higher than would otherwise be the case and the growth in the capital sum being eroded
– As a result of the fees being charged partially to capital, the distributable income of the company may be higher, but the capital value of the company may be eroded
Schroder Oriental Income Fund LimitedRisk factors
22
Source: Schroders.

Schroder Oriental Income Fund LimitedCountry and sector positions vs. benchmark1
23
Source: Schroders. As at March 31, 2018. Fund position less benchmark weight. Based on unaudited data.1Includes gearing (-7.4% as at 31 March 2018).1Benchmark: MSCI AC Pacific ex Japan. Country and sector examples are for illustrative purposes only and are not a recommendation to buy or sell.
Underweight Overweight
17.6%
6.2%
5.3%
3.6%
2.8%
1.0%
0.0%
-1.0%
-1.1%
-1.7%
-2.0%
-5.9%
-17.4%
Hong Kong
Singapore
Thailand
Japan
Taiwan
New Zealand
India
Philippines
Australia
Indonesia
Malaysia
Korea
China
Country weights Sector weights
10.2%
7.7%
3.8%
2.2%
0.4%
0.2%
-1.2%
-1.3%
-3.0%
-3.7%
-8.4%
0.4%
Real Estate
Telecommunications
Materials
Consumer Discretionary
Energy
Financials
Utilities
Industrials
Consumer Staples
Health Care
Information Technology
Fixed Income

Top 20 holdings
Schroder Oriental Income Fund LimitedTop 20 holdings as at 31 March 2018
24
Source: Schroders. FactSet PA2. Based on unaudited data.Stock examples are for illustrative purposes only and are not a recommendation to buy or sell.
Company name Country % portfolio
TSMC Taiwan 5.4
Samsung Electronics (Prefs) Korea 4.4
HSBC Holdings Hong Kong 4.0
Fortune Real Estate Hong Kong 3.8
China Petroleum & Chemical China 3.2
Midea Group China 2.9
Venture Corp Singapore 2.6
BHP Billiton Australia 2.6
National Australia Bank Australia 2.4
Intouch Holdings Thailand 2.0
Company name Country % portfolio
China Construction Bank China 1.9
Standard Chartered Hong Kong 1.8
Swire Pacific Hong Kong 1.7
Hopewell Holdings Hong Kong 1.7
Kerry Properties Hong Kong 1.7
HKT Trust Hong Kong 1.6
Hon Hai Precision Industry Taiwan 1.6Australia and New Zealand Banking Australia 1.6
Oversea-Chinese Banking Singapore 1.6
Asustek Computer Taiwan 1.6
Total of top 20 50.2

Proportion of stocks outperforming last year relatively low1
Performance in contextMarket returns very concentrated in 2017
25
Performance shown is past performance. Past performance is not a guide to future performance. The value of investment can go down as well as up and is not guaranteed. Source: 1Factset, MSCI, Schroders. January 2018. 2Factset PA3, MSCI, Schroders. January 2018.
30%
40%
50%
60%
1998
1999
2000
2001
2002
2003
2004
2005
2006
2007
2008
2009
2010
2011
2012
2013
2014
2015
2016
2017
MSCI AC Pacific ex Japan – % of stocks outperforming
0
5
10
15
20
25
30
MSCI AC Pacific ex Japan
Index return % – 2017 calendar year
Contribution to 2017 index return2
Tencent and Alibaba
Next 3 largest contributors
716 stocks
21%
14%
65%

High yield has underperformed low yield in 2017
Performance in context Market environment a headwind for yield strategies
26
Performance shown is past performance. Past performance is not a guide to future performance. The value of investment can go down as well as up and is not guaranteed. Source: Schroders, FactSet, as at 31 March 2018.
0.70
0.75
0.80
0.85
0.90
0.95
1.00
1.05
1.10
1.15
Dec 12 Dec 13 Dec 14 Dec 15 Dec 16 Dec 17
Asian equities: dividend yield quintile 1 minus dividend yield quintile 5 performance
Index: 1=December 31, 2012
High yield outperforming
Low yield outperforming
Schroder Asian Income Fund

Returns to 29 March 2018 (£)1
Schroder Asian Income FundPerformance
28
Performance shown is past performance. Past performance is not a guide to future performance. The value of investment can go down as well as up and is not guaranteed. Source for ratings: Morningstar, Fund Calibre, Square Mile, City Financial, Rayner Spencer Mills, as at 30 April2018. Please refer to Morningstar disclaimer in the important information section.1Source: Schroders, bid to bid, net of fees, with net dividends reinvested, for the Z Acc share class, as at 29 March 2018. 2Income inception: 01 December 2006. Where a share class is created after the fund's launch date, a simulated past performance is used, based upon the performance of an existing share class within the fund. 3From 14 December 2009 reference benchmark MSCI AC Pacific ex Japan. Prior to this, benchmark was MSCI AC Pacific (Japan at 10%). 4Source: Schroders, as at 29 March 2018.
2011/12 2012/13 2013/14 2014/15 2015/16 2016/17 2017/18
Interim dividend declared (ex 15 July) – 1.2765p 1.3032p 1.1712p 1.2105p 1.2214p 1.5407p
Final dividend declared (ex 15 January) 1.0925p 1.1153p 1.1214p 1.2110p 1.2065p 1.3461p 1.2734p
Total annual dividend 2.3918p 2.4246p 2.3822p 2.4170p 2.5675p 2.8141p
Historic net yield currently 3.9%4
3 months%
1 year%
3 years%
5 years%
Since inception2
%
Asian Income Z Acc -3.0% 4.7% 36.0% 49.9% 249.4%
MSCI AC Pacific ex Japan (NDR)³ -3.7% 8.3% 34.6% 48.5% 179.5%
Relative performance 0.7% -3.6% 1.4% 1.4% 69.9%

Calendar year returns (£)1
Schroder Asian Income FundPerformance
29
Performance shown is past performance. Past performance is not a guide to future performance. The value of investment can go down as well as up and is not guaranteed.1Source: Schroders, bid to bid, net of fees, with net dividends reinvested, for the Z Acc share class. 2From 14 December 2009 reference benchmark MSCI AC Pacific ex Japan. Prior to this, benchmark was MSCI AC Pacific (Japan at 10%). The Z share class was launched in 2011. Where a share class is created after the fund's launch date, a simulated past performance is used, based upon the performance of an existing share class within the fund.
2017%
2016%
2015%
2014%
2013%
2012%
2011%
2010%
Asian Income Z Acc 18.1% 30.0% -2.5% 12.7% 2.0% 24.1% -9.1% 28.6%
MSCI AC Pacific ex Japan (NDR)² 25.1% 28.2% -4.4% 7.8% 2.0% 16.7% -13.0% 21.6%
Relative performance -7.0% 1.8% 1.9% 4.9% 0.0% 7.4% 3.9% 7.0%

– Performance shown is past performance. Past performance is not a guide to future performance and may not be repeated. The value of investments and the income from them may go down as well as up and investors may not get back the amounts originally invested
The following risks may affect fund performance
– China country risk: Changes in China's political, legal, economic or tax policies could cause losses or higher costs for the fund
– Currency risk: The fund can be exposed to different currencies. Changes in foreign exchange rates could create losses
– Emerging markets and frontier risk: Emerging markets, and especially frontier markets, generally carry greater political, legal, counterparty and operational risk
– Equity risk: Equity prices fluctuate daily, based on many factors including general, economic, industry or company news
– Liquidity risk: In difficult market conditions, the fund may not be able to sell a security for full value or at all. This could affect performance and could cause the fund to defer or suspend redemptions of its shares
– Operational risk: Failures at service providers could lead to disruptions of fund operations or losses
Schroder Asian Income FundRisk factors
30
Source: Schroders.
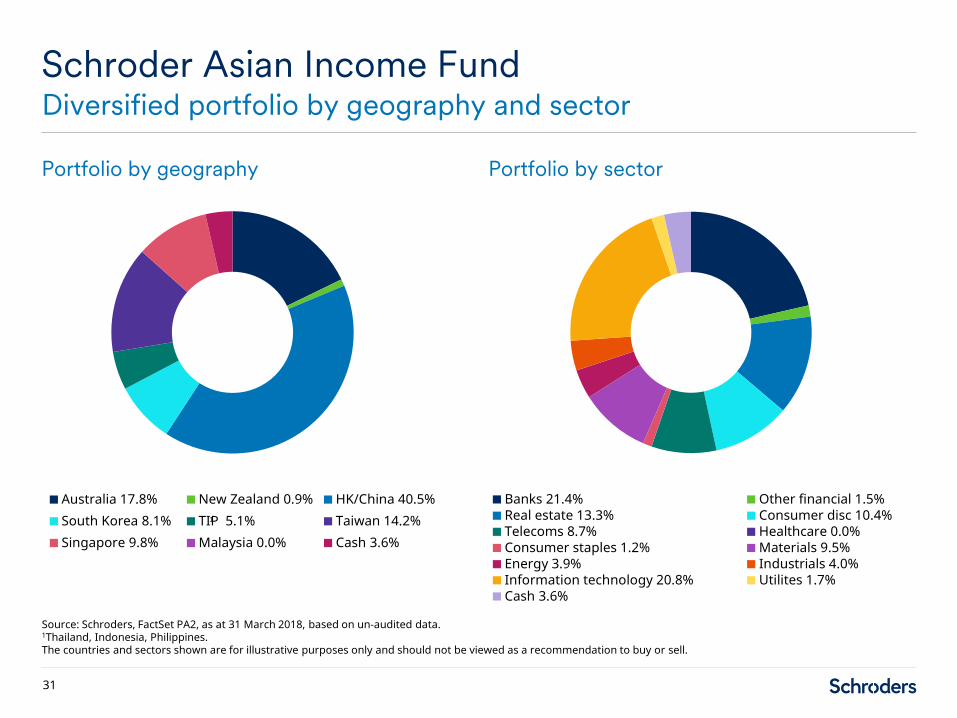
Portfolio by geography Portfolio by sector
Schroder Asian Income FundDiversified portfolio by geography and sector
31
Source: Schroders, FactSet PA2, as at 31 March 2018, based on un-audited data.1Thailand, Indonesia, Philippines.The countries and sectors shown are for illustrative purposes only and should not be viewed as a recommendation to buy or sell.
Australia 17.8% New Zealand 0.9% HK/China 40.5%South Korea 8.1% TIP 5.1% Taiwan 14.2%Singapore 9.8% Malaysia 0.0% Cash 3.6%
Banks 21.4% Other financial 1.5%Real estate 13.3% Consumer disc 10.4%Telecoms 8.7% Healthcare 0.0%Consumer staples 1.2% Materials 9.5%Energy 3.9% Industrials 4.0%Information technology 20.8% Utilites 1.7%Cash 3.6%
1
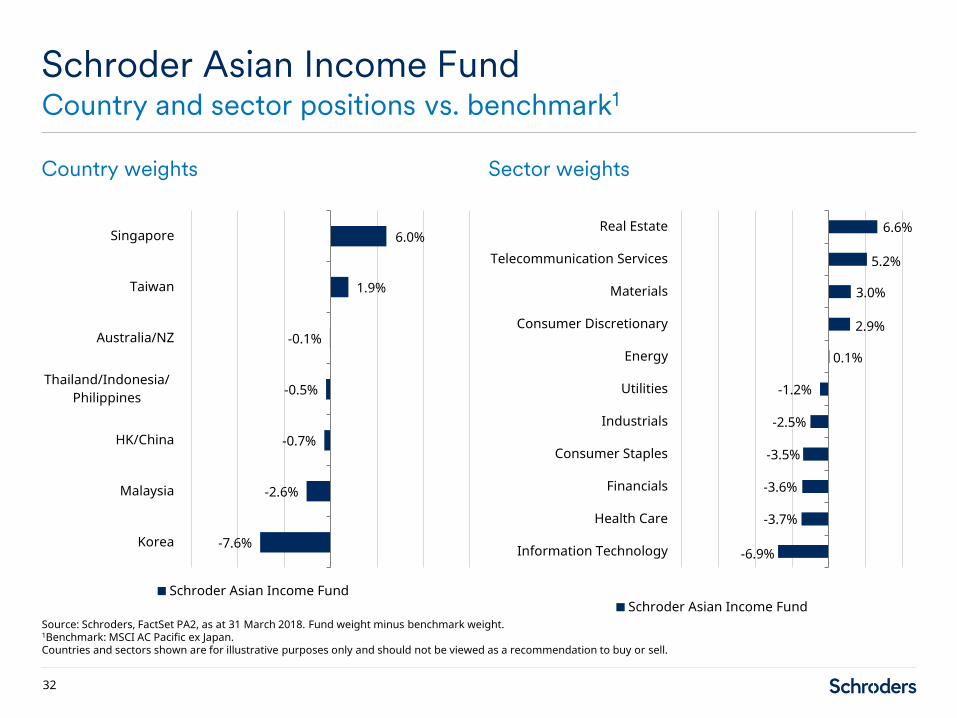
Country weights Sector weights
Schroder Asian Income FundCountry and sector positions vs. benchmark1
32
Source: Schroders, FactSet PA2, as at 31 March 2018. Fund weight minus benchmark weight.1Benchmark: MSCI AC Pacific ex Japan.Countries and sectors shown are for illustrative purposes only and should not be viewed as a recommendation to buy or sell.
-7.6%
-2.6%
-0.7%
-0.5%
-0.1%
1.9%
6.0%
Korea
Malaysia
HK/China
Thailand/Indonesia/Philippines
Australia/NZ
Taiwan
Singapore
Schroder Asian Income Fund
-6.9%
-3.7%
-3.6%
-3.5%
-2.5%
-1.2%
0.1%
2.9%
3.0%
5.2%
6.6%
Information Technology
Health Care
Financials
Consumer Staples
Industrials
Utilities
Energy
Consumer Discretionary
Materials
Telecommunication Services
Real Estate
Schroder Asian Income Fund

Top 10 holdings
Schroder Asian Income FundLargest stock positions
33
Source: Schroders, FactSet PA2, as at 31 March 2018.Countries, stocks and sectors shown are for illustrative purposes only and should not be viewed as a recommendation to buy or sell.
Company name Country Sector % portfolio
% in Schroder Asian Income Maximiser
Taiwan Semiconductor Taiwan I.T. 5.7 5.7
Samsung Electronics (Prefs) Korea I.T. 4.0 4.1
HSBC Hong Kong Banks 3.4 3.5
China Petroleum China Energy 2.9 2.9
BHP Billiton Australia Materials 2.9 2.9
Venture Corporation Singapore I.T. 2.8 2.6
Midea Group China Consumer Disc. 2.7 3.0
National Australia Bank Australia Banks 2.4 2.3
Bangkok Bank Thailand Banks 2.3 2.4
Hon Hai Precision Taiwan I.T. 2.1 2.1
Total of top 10 31.2 31.5

Schroder Small Cap Discovery Fund

40%
50%
60%
70%
80%
90%
0 50 100 150 200 250 300 350 400 450 500 550 600 650 700
Investment thesisThe ‘opportunity’ case
35
Source: S&P, Schroders, 31 December 2017.Index data calculated on an 80/20 split between Large and Small Cap stocks.Countries and securities shown are for illustrative purposes only and should not be viewed as a recommendation to buy or sell.
– Proportion of small caps as percentage of total listed companies in emerging markets has risen from 55.7% in 2001 to 75.9% in December 2017
– Scope of opportunity exhibits big variance by country
– Asia stands out, with Brazil the main contender in Latin America
– In other countries, stocks listed outside the region may provide better access
Opportunity set comparison% of companies in bottom 20%
Mexico
TaiwanChina
India
BrazilSouth Africa
Russia
Singapore
KoreaAustralia
Hong Kong
Number of companies in bottom 20%
Emerging ASEAN
MENA
Emerging Europe
LATAM ex Brazil and Mexico
31 December 2006 31 December 2017

Investment thesisThe ‘opportunity’ case
36
Source: S&P, Schroders, as at 31 December 2017.1Consumer Discretionary and Consumer Staples.Index data calculated on an 80/20 split between Large and Small Cap stocks.Sectors shown are for illustrative purposes only and should not be viewed as a recommendation to buy or sell.
– Small caps in smaller growth markets provide a genuinely ‘unique’ opportunity set
– Bigger exposure to heterogeneous (and attractive) sectors
– Lower exposure to mature utility like services and basic resources/extractive industries
– More domestically focused so less directly impacted by currency and global trade
Sector breakdown – S&P Emerging Markets
LargeMidCap
SmallCap
Consumer¹ Industrials
Healthcare I.T.
Financials+Real Estate Telcos+Utilities
Energy+Materials

Schroder Small Cap Discovery FundRisk aligned to target alpha, but not beta
37
Performance shown is past performance. Past performance is not a guide to future performance. The value of investment can go down as well as up and is not guaranteed.
Source: Schroders, PRISM. Based on unaudited data. Figures as at 31 March 2018.
Active Tracking error 4.81%
Stock driven Active share 97.1%
Appropriate diversification
92 stocksTop 10 stocks = 19.8% of Fund
Beta 0.83
Fund volatility 12.4%
Benchmark volatility 14.0%
Targeted characteristics
Factor Relative to
Growth Higher
Returns Higher
Financial strength Higher
Governance Superior
Valuation Similar

Top 10 holdingsPortfolio by geography Portfolio by sector
Schroder Small Cap Discovery FundPortfolio by geography and sector
38
Source: Schroders, FactSet, as at 31 March 2018, based on un-audited data. For illustrative purposes only and not a recommendation to buy or sell securities.Countries, sectors and securities shown are for illustrative purposes only and should not be viewed as a recommendation to buy or sell.
Argentina BrazilChina FranceHong Kong IndiaIndonesia KenyaKorea MalaysiaMexico NigeriaPeru PhilippinesPoland RussiaSingapore South AfricaSpain Sri LankaTaiwan ThailandUnited Kingdom VietnamCash
Consumer DiscretionaryConsumer StaplesEnergyFinancialsHealth CareIndustrialsInformation TechnologyMaterialsReal EstateTelecommunication ServicesUtilitiesCash
Company Country Weight %
Gourmet Master Taiwan 2.2
Dah Sing Banking Hong Kong 2.1
Chroma Ate Taiwan 2.0
ASM Pacific Hong Kong 2.0
TCS Group Russia 2.0
Dino Polska Poland 2.0
Alicorp SA Peru 1.9
Medy-Tox Inc. Korea 1.9
Netmarble Games Korea 1.9
Bursa Malaysia Malaysia 1.8
Total 19.8

Schroder Small Cap Discovery FundCountry weightings – 31 March 2018
39
Source: Schroders, FactSet, based on un-audited data. Reference benchmark is a blend of MSCI Small Cap indices (Emerging Markets, Hong Kong, Singapore).Countries are mentioned for illustrative purposes only and should not be viewed as a recommendation to buy/sell.
Fund (%)
Benchmark(%)
Hong Kong 11.8 5.8Philippines 3.3 0.8Peru 1.9 0.1United Kingdom 1.6 0.0Kenya 1.5 0.0Vietnam 1.4 0.0Sri Lanka 1.4 0.0Russia 2.0 0.6Argentina 1.2 0.0Poland 2.0 0.8Mexico 3.5 2.5France 0.4 0.0Spain 0.4 0.0India 12.2 11.9Nigeria 0.1 0.0Australia 0.0 0.0Czech Republic 0.0 0.1Hungary 0.0 0.1Colombia 0.0 0.3Qatar 0.0 0.4United Arab Emirates 0.0 0.5Egypt 0.0 0.5Greece 0.0 0.7Pakistan 0.0 0.7Malaysia 1.8 2.9Chile 0.0 1.1Turkey 0.0 1.2Thailand 2.0 3.2Indonesia 0.2 2.1Brazil 2.7 5.0Taiwan 13.3 15.7South Africa 2.5 5.0Singapore 2.0 4.9Korea 12.3 15.2China 14.3 18.1Cash 4.4 0.0Total 100 100
Underweight Overweight6.0
2.51.8
1.61.51.41.41.4
1.21.2
1.00.40.4
0.30.1
0.0-0.1-0.1-0.3
-0.4-0.5-0.5
-0.7-0.7
-1.1-1.1
-1.2-1.2
-1.9-2.3
-2.4-2.5
-2.9-2.9
-3.8
-6.0 -4.0 -2.0 0.0 2.0 4.0 6.0 8.0

Fund (%)
Benchmark(%)
Consumer Discretionary 30.7 16.6
Financials 11.8 8.9
Consumer Staples 7.8 6.6
Telecommunication Services 1.3 1.3
Industrials 13.5 14.1
Health Care 8.1 8.7
Energy 0.8 2.1
Utilities 1.8 3.5
Materials 6.0 10.4
Information Technology 10.3 16.2
Real Estate 3.5 11.5
Cash 4.4 0.0
Total 100 100
Schroder Small Cap Discovery FundSector weightings – 31 March 2018
40
Source: Schroders, FactSet, based on un-audited data. Reference benchmark is a blend of MSCI Small Cap indices (Emerging Markets, Hong Kong, Singapore).Sectors are mentioned for illustrative purposes only and should not be viewed as a recommendation to buy/sell.
Underweight Overweight
14.1
2.9
1.2
0.0
-0.6
-0.6
-1.3
-1.7
-4.4
-5.9
-8.0
4.4
-10.0 -5.0 0.0 5.0 10.0 15.0 20.0

Schroder Small Cap Discovery FundPerformance since launch
41
Performance shown is past performance. Past performance is not a guide to future performance. The value of investment can go down as well as up and is not guaranteed.
Source: Schroders, bid to bid, Z Acc, net of fees, net income reinvested in GBP.1Inception: 15 March 2012.2Reference benchmark is a blend of MSCI Small Cap indices (Emerging Markets, Hong Kong, Singapore) (NDR).
Periods ending 29 March 2018 (%)
3 months%
1 year%
3 years%
5 years%
Since inception2
%
Small Cap Discovery Z Acc -6.0% 0.4% 21.9% 47.7% 75.5%
Reference benchmark2 -3.6% 4.9% 27.1% 30.9% 45.9%
Relative performance -2.4% -4.5% -5.2% 16.8% 29.6%
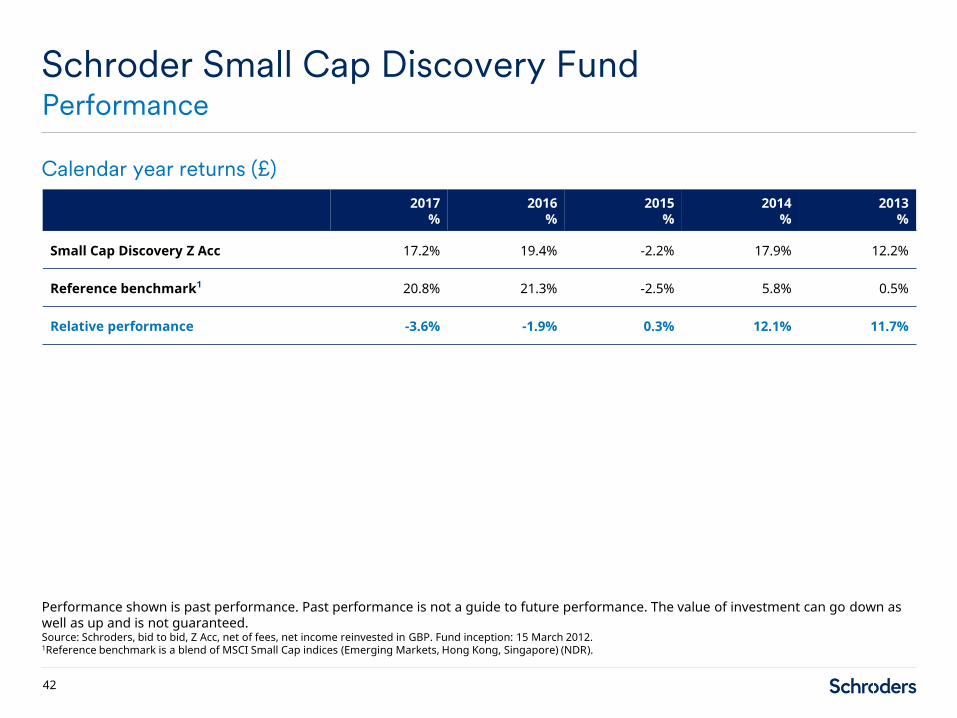
Schroder Small Cap Discovery FundPerformance
42
Performance shown is past performance. Past performance is not a guide to future performance. The value of investment can go down as well as up and is not guaranteed.Source: Schroders, bid to bid, Z Acc, net of fees, net income reinvested in GBP. Fund inception: 15 March 2012.1Reference benchmark is a blend of MSCI Small Cap indices (Emerging Markets, Hong Kong, Singapore) (NDR).
Calendar year returns (£)
2017%
2016%
2015%
2014%
2013%
Small Cap Discovery Z Acc 17.2% 19.4% -2.2% 17.9% 12.2%
Reference benchmark1 20.8% 21.3% -2.5% 5.8% 0.5%
Relative performance -3.6% -1.9% 0.3% 12.1% 11.7%

– Performance shown is past performance. Past performance is not a guide to future performance and may not be repeated. The value of investments and the income from them may go down as well as up and investors may not get back the amounts originally invested
The following risks may affect fund performance
– Counterparty risk: The counterparty to a derivative or other contractual agreement or synthetic financial product could become unable to honour its commitments to the fund, potentially creating a partial or total loss for the fund
– Currency risk: The fund can be exposed to different currencies. Changes in foreign exchange rates could create losses
– Derivatives risk: A derivative may not perform as expected, and may create losses greater than the cost of the derivative
– Emerging markets & frontier risk: Emerging markets, and especially frontier markets, generally carry greater political, legal, counterparty and operational risk
– Equity risk: Equity prices fluctuate daily, based on many factors including general, economic, industry or company news
– Leverage risk: The fund uses derivatives for leverage, which makes it more sensitive to certain market or interest rate movements and may cause above-average volatility and risk of loss
– Liquidity risk: In difficult market conditions, the fund may not be able to sell a security for full value or at all. This could affect performance and could cause the fund to defer or suspend redemptions of its shares
– Operational risk: Failures at service providers could lead to disruptions of fund operations or losses
Schroder Small Cap Discovery FundRisk factors
43
Source: Schroders.

Schroder Small Cap Discovery Fund: risk/return profile since 31 March 2012
Schroder Small Cap Discovery FundRisk/return
44
Performance shown is past performance. Past performance is not a guide to future performance. The value of investment can go down as well as up and is not guaranteed.Source: Schroders, Datastream, 31 March 2012 to 31 March 2018. Bid to bid, net of fees, with net dividends reinvested, for the Z Acc share class, in £.
Annualised return (% p.a.)
0%1%2%3%4%5%6%7%8%9%
10%11%12%13%14%15%16%17%
9% 10% 11% 12% 13% 14% 15%
MSCI World Small Cap
MSCI World
Schroder Small Cap Discovery Fund
MSCI Emerging Markets Small CapMSCI Emerging Markets
Standard deviation (% p.a.)

Thank you

DisclaimerMarketing material for professional investors or advisers only.
This information is not an offer, solicitation or recommendation to buy or sell any financial instrument or to adopt any investment strategy.
Past performance is not a guide to future performance and may not be repeated. The value of investments and the income from them may go down as well as up and investors may not get back the amount originally invested. Exchange rate changes may cause the value of any overseas investments to rise or fall.
Schroders has expressed its own views and opinions in this document and these may change.Any data has been sourced by us and is provided without any warranties of any kind. It should be independently verified before further publication or use. Third party data is owned or licenced by the data provider and may not be reproduced, extracted or used for any other purpose without the data provider’s consent. Neither we, nor the data provider, will have any liability in connection with the third party data.
The forecasts included in this presentation should not be relied upon, are not guaranteed and are provided only as at the date of issue. Our forecasts are based on our own assumptions which may change. We accept no responsibility for any errors of fact or opinion and assume no obligation to provide you with any changes to our assumptions or forecasts. Forecasts and assumptions may be affected by external economic or other factors.
The material is not intended to provide, and should not be relied on for accounting, legal or tax advice. Reliance should not be placed on any views or information in the material when taking individual investment and/or strategic decisions. No responsibility can be accepted for error of fact or opinion.Information herein is believed to be reliable but Schroder Unit Trusts Limited (Schroders) does not warrant its completeness or accuracy.
Any references to securities, sectors, regions and/or countries are for illustrative purposes only.
46

Disclaimer – Schroder Asian Alpha Plus Fund
Risk factors: Schroder Asian Alpha Plus Fund:
– China country risk: Changes in China's political, legal, economic or tax policies could cause losses or higher costs for the fund.
– Counterparty risk: The counterparty to a derivative or other contractual agreement or synthetic financial product could become unable to honour its commitments to the fund, potentially creating a partial or total loss for the fund.
– Currency risk: The fund can be exposed to different currencies. Changes in foreign exchange rates could create losses.
– Derivatives risk: A derivative may not perform as expected, and may create losses greater than the cost of the derivative.
– Emerging markets & frontier risk: Emerging markets, and especially frontier markets, generally carry greater political, legal, counterparty and operational risk.
– Equity risk: Equity prices fluctuate daily, based on many factors including general, economic, industry or company news.
– Leverage risk: The fund uses derivatives for leverage, which makes it more sensitive to certain market or interest rate movements and may cause above-average volatility and risk of loss.
– Liquidity risk: In difficult market conditions, the fund may not be able to sell a security for full value or at all. This could affect performance and could cause the fund to defer or suspend redemptions of its shares.
– Operational risk: Failures at service providers could lead to disruptions of fund operations or losses.
47

Disclaimer – Schroder Asian Alpha Plus Fund
Source for ratings: Morningstar, Rayner Spencer Mills, Fund Calibre, City Financial, Square Mile and Trustnet, as at 30 April 2018 and Citywire, as at 31 March 2018.
© 2018 Morningstar. All rights reserved. The information contained herein: (1) is proprietary to Morningstar and/or its content providers; (2) may not be copied or distributed; and (3) is not warranted to be accurate, complete, or timely. Neither Morningstar nor its content providers are responsible for any damages or losses arising from any use of this information. Past performance is no guarantee of future results. For more detailed information about Morningstar's Analyst Rating, including its methodology, please go to: http://corporate.morningstar.com/us/documents/MethodologyDocuments/AnalystRatingforFundsMethodology.pdf. For disclosure and detailed information about this fund please refer to full Morningstar Global Fund Report.
Issued in May 2018 by Schroder Unit Trusts Limited, 31 Gresham Street, London EC2V 7QA. Registered No: 4191730 England. Authorised and regulated by the Financial Conduct Authority. ASI00292
48

Disclaimer – Schroder AsiaPacific Fund plc
Risk factors: Schroder AsiaPacific Fund plc:
– Investors in the emerging markets and the Far East should be aware that this involves a high degree of risk and should be seen as long term in nature. Less developed markets are generally less well regulated than the UK, they may be less liquid and may have less reliable arrangements for trading and settlement of the underlying holdings.
– The trust holds investments denominated in currencies other than sterling, investors should note that exchange rates may cause the value of these investments, and the income from them, to rise or fall.
– The trust Invests in smaller companies that may be less liquid than in larger companies and price swings may therefore be greater than investment trusts that invest in larger companies.
– The trust may borrow money to invest in further investments, this is known as gearing. Gearing will increase returns if the value of the investments purchased increase in value by more than the cost of borrowing, or reduce returns if they fail to do so.
– Investments such as warrants, participation certificates, guaranteed bonds, etc. will expose the fund to the risk of the issuer of these instruments defaulting on paying the capital back to the fund.
Source for ratings: Morningstar, as at 30 April 2018. © 2018 Morningstar. All rights reserved. The information contained herein: (1) is proprietary to Morningstar and/or its content providers; (2) may not be copied or distributed; and (3) is not warranted to be accurate, complete, or timely. Neither Morningstar nor its content providers are responsible for any damages or losses arising from any use of this information. Past performance is no guarantee of future results. For more detailed information about Morningstar's Analyst Rating, including its methodology, please go to: http://corporate.morningstar.com/us/documents/MethodologyDocuments/AnalystRatingforFundsMethodology.pdf.For disclosure and detailed information about this fund please refer to full Morningstar Global Fund Report.
Issued in May 2018 by Schroder Unit Trusts Limited, 31 Gresham Street, London EC2V 7QA. Registered No: 4191730 England. Authorised and regulated by the Financial Conduct Authority. ASI00292
49

Disclaimer – Schroder Oriental Income Fund Limited
Risk factors: Schroder Oriental Income Fund Limited
– Investors in the emerging markets and the Far East should be aware that this involves a high degree of risk and should be seen as long term in nature. Less developed markets are generally less well regulated than the UK, they may be less liquid and may have less reliable arrangements for trading and settlement of the underlying holdings.
– The company invests in smaller companies that may be less liquid than in larger companies and price swings may therefore be greater than investment trusts, companies and funds that invest in larger companies.
– The company holds investments denominated in currencies other than sterling, investors should note that exchange rates may cause the value of these investments, and the income from them, to rise or fall.
– The company may borrow money to invest in further investments, this is known as gearing. Gearing will increase returns if the value of the investments purchased increase in value by more than the cost of borrowing, or reduce returns if they fail to do so.
– Investment in warrants, participation certificates, guaranteed bonds, etc. will expose the fund to the risk of the issuer of these instruments defaulting. Deducting charges from capital can result in the income paid by the company being higher than would otherwise be the case and the growth in the capital sum being eroded.
– As a result of the fees being charged partially to capital, the distributable income of the company may be higher, but the capital value of the company may be eroded.
Source for ratings: Morningstar and Fund Calibre , as at 30 April 2018. © 2018 Morningstar. All rights reserved. The information contained herein: (1) is proprietary to Morningstar and/or its content providers; (2) may not be copied or distributed; and (3) is not warranted to be accurate, complete, or timely. Neither Morningstar nor its content providers are responsible for any damages or losses arising from any use of this information. Past performance is no guarantee of future results. For more detailed information about Morningstar's Analyst Rating, including its methodology, please go to: http://corporate.morningstar.com/us/documents/MethodologyDocuments/AnalystRatingforFundsMethodology.pdf. For disclosure and detailed information about this fund please refer to full Morningstar Global Fund Report.
Issued in May 2018 by Schroder Unit Trusts Limited, 31 Gresham Street, London EC2V 7QA. Registered No: 4191730 England. Authorised and regulated by the Financial Conduct Authority. ASI00292
50

Disclaimer – Schroder Asian Income Fund
Risk factors: Schroder Asian Income Fund:
– China country risk: Changes in China's political, legal, economic or tax policies could cause losses or higher costs for the fund.
– Currency risk: The fund can be exposed to different currencies. Changes in foreign exchange rates could create losses.
– Emerging markets & frontier risk: Emerging markets, and especially frontier markets, generally carry greater political, legal, counterparty and operational risk.
– Equity risk: Equity prices fluctuate daily, based on many factors including general, economic, industry or company news.
– Liquidity risk: In difficult market conditions, the fund may not be able to sell a security for full value or at all. This could affect performance and could cause the fund to defer or suspend redemptions of its shares.
– Operational risk: Failures at service providers could lead to disruptions of fund operations or losses
Source for ratings: Morningstar, Fund Calibre, Square Mile, City Financial , Citywire, Rayner Spencer Mills, Trustnet as at 30 April 2018© 2018 Morningstar. All rights reserved. The information contained herein: (1) is proprietary to Morningstar and/or its content providers; (2) may not be copied or distributed; and (3) is not warranted to be accurate, complete, or timely. Neither Morningstar nor its content providers are responsible for any damages or losses arising from any use of this information. Past performance is no guarantee of future results. For more detailed information about Morningstar's Analyst Rating, including its methodology, please go to: http://corporate.morningstar.com/us/documents/MethodologyDocuments/AnalystRatingforFundsMethodology.pdf For disclosure and detailed information about this fund please refer to full Morningstar Global Fund ReportIssued in May 2018 by Schroder Unit Trusts Limited, 31 Gresham Street, London EC2V 7QA. Registered No: 4191730 England. Authorised and regulated by the Financial Conduct Authority. ASI00292
51

Disclaimer – Schroder Small Cap Discovery Fund
Risk factors: Schroder Small Cap Discovery Fund
– Counterparty risk: The counterparty to a derivative or other contractual agreement or synthetic financial product could become unable to honour its commitments to the fund, potentially creating a partial or total loss for the fund.
– Currency risk: The fund can be exposed to different currencies. Changes in foreign exchange rates could create losses.
– Derivatives risk: A derivative may not perform as expected, and may create losses greater than the cost of the derivative.
– Emerging markets & frontier risk: Emerging markets, and especially frontier markets, generally carry greater political, legal, counterparty and operational risk.
– Equity risk: Equity prices fluctuate daily, based on many factors including general, economic, industry or company news.
– Leverage risk: The fund uses derivatives for leverage, which makes it more sensitive to certain market or interest rate movements and may cause above-average volatility and risk of loss.
– Liquidity risk: In difficult market conditions, the fund may not be able to sell a security for full value or at all. This could affect performance and could cause the fund to defer or suspend redemptions of its shares.
– Operational risk: Failures at service providers could lead to disruptions of fund operations or losses
Issued in May 2018 by Schroder Unit Trusts Limited, 31 Gresham Street, London EC2V 7QA. Registered No: 4191730 England. Authorised and regulated by the Financial Conduct Authority. ASI00292
52

ContactAdvisory sales desk: +44 (0) 207 658 3894
Asset Manager sales desk: +44 (0) 207 658 3210
Schroder Investment Management Limited,
31 Gresham Street, London EC2V 7QA.
schroders.com