schumpeter discussion paperselpub.bib.uni-wuppertal.de › servlets › derivateserv... · although...
TRANSCRIPT

SCHUMPETER DISCUSSION PAPERS
Price Convergence in Euroland. Evidence from micro data without noise
Sophie-Charlotte Meyer
Ronald Schettkat
SDP 2013-005 ISSN 1867-5352
© by the author
1
Price Convergence in Euroland Evidence from micro data without noise
10.07.2013 Sophie-Charlotte Meyer Ronald Schettkat Schumpeter School of Economics Abstract Analyzing prices of truly homogenous consumer goods sold in Euroland, we find significant price convergence after the Euro cash changeover in 2002. The deviation of national log prices from the mean log price of the same product is much narrower with the Euro than before. We observe Sigma and Beta convergence, i.e. prices do not differ systematically between countries. Our result is in contrast to some other findings stating divergence rather than convergence but which do not control perfectly for heterogeneity of products. Because of information and transportation costs arbitrage is unlikely to occur in consumer items and reasons for convergence must therefore be sought in competition and advantages on the supplier’s side. If suppliers would minimize menu costs, price for the same item should be identical, which we do not observe. JEL classification: D4, E31, F36 Keywords: convergence, price setting, law of one price, Euro, homogenous products Sophie-Charlotte Meyer University of Wuppertal Rainer-Gruenter-Str. 21, 42119 Wuppertal Germany Tel.: +49-202-4391391 Email: [email protected]
Ronald Schettkat University of Wuppertal Gaußstr. 20, 42119 Wuppertal Germany Tel.: +49-202-4392859 Email: [email protected]
SCHUMPETER DISCUSSION PAPERS 2013-005
2
Price Convergence in Euroland? Evidence from micro data without noise Sophie-Charlotte Meyer Ronald Schettkat Schumpeter School of Economics 1. Introduction
Aside from political considerations, the economic integration of Europe was claimed to create
a market as big or even bigger than that of the US and therefore allows to raise productivity
through economies of scale (eos). The common market and finally the introduction of a
common currency initially among 11 countries1 -the Euro- in 19982 should create a higher
degree of market transparency, lower transaction costs3, more cross-border exchange, less
price discrimination and more competition. Convergence of prices among the Euro-countries
(Euroland in the following) was expected according to the law of one price (LOP or PPP)4
because in a market without trade barriers and a common currency –i.e., no risks related to
exchange rate variations- price differentials betweeen countries for identical products should
disappear or at least diminish.5 Especially the Euro cash change over in January 2002 made
prices more easily comparable, and may have pushed prices to converge among the EMU
member states. However, transport and information costs as well as national taxes, labor and
other costs may have prevented to achieve absolute PPP or the strong LOP (i.e. identical
prices in Euroland) through arbitrage.6 If the price-demand functions are (assumed to be)
similar across the countries, pricing to the market may not be as relevant as the reduction in
transaction costs achieved by setting a standard price.
1 Euroland (i.e. EU-countries using the Euro) first (January 1999) comprised: France, Spain, Italy, Austria, The Netherlands, Luxembourg, Belgium, Portugal, Germany, Ireland, and Finland. In 2001 Greece joined Euroland and later several other EU countries followed. 2 Since January 1999 the Euro is the single currency in Euroland, but national coins and banknotes were used until the cash change over in January 2002. 3 Some retail chains operating in several Euroland countries reduced transaction costs and started to use price-tags with unique prices for all countries, making the strong LOP obviously to hold despite different costs (labor costs, taxes). However, other price tags display country-specific Euro-prices, i.e. pricing to the market is applied although the consumer can easily identify price discrimination.
4 For an overview of the LOP literature, see Dornbusch 1987, Froot/Rogoff 1995, Rogoff 1996). 5 In a perfect market where absolute PPP holds, exchange variations are determined by the movement of relative prices (Dornbusch 1987). Or one may say, that exchange rates have been driven by price differentials in an integrating market. 6 Reasons why real exchange rates are not constant include: Barriers to trade (tariffs, transportation costs), different consumption preferences across countries, presence of non-traded goods in CPIs, prices which are sticky in terms of currency in which the good is consumed (see e.g. Krugman/Obstfeld 1991).
SCHUMPETER DISCUSSION PAPERS 2013-005

3
The PPPs7 for private consumption as published by the OECD for the initial Euroland
countries reveals strong convergence (see Figure 1). The coefficient of variation declined
from 1985 to 2009 by almost two thirds. Most of the convergence (about 90%), however, was
achieved by 1999 with the largest contribution (6% points or 75%) occurring before 1992, i.e.
before the so-called Maastricht treaty from 1991 could have affected convergence
substantially. In other words, by this aggregate metric level-convergence of prices was partly
achieved, but mainly in the period before the actual introduction of the Euro and before the
so-called convergence criteria (treaty of Maastricht 1992) were established. After 1999 the
coefficient of variation of consumer PPPs indicates roughly stability. This finding is very
much in line with several studies based on macro data or some aggregation of product to
groups (see e.g., Wolszczak-Derlacz 2006 Lein/ Nitsch 2008, Fritsche/ Kuzin 2011,
Fritsche/Lein/Weber 2009, Cuaresma/Egert/Silgoner 2007).
Figure 1: Coefficient of variation, PPPs private consumption
Note: Countries include: Austria, Belgium, Finland, France, Germany, Ireland, Italy, Netherlands, Portugal, Spain. Source: computations based on OECD’s Purchasing Power Parities for private consumption (PPPPRC), Stat OECD.
Paul de Grauwe (2009) emphasized that the Euro cash change over (2002) created a window
of opportunity and it seems that prices of frequently bought but low price items -such as
bread, meat etc. (de Grauwe 2009: Table 2)- rose substantially although more comprehensive
price indices do not show this effect. De Grauwe (2009: 10/11) argues that price convergence 7 PPPs are the rates of currency conversion that equalize the purchasing power of different countries by eliminating differences in price levels between countries.
0.00
1.00
2.00
3.00
4.00
5.00
6.00
7.00
8.00
9.00
SCHUMPETER DISCUSSION PAPERS 2013-005
4
in consumer items is unlikely because high transaction costs prevent arbitrage, therefore
differences in the national or regional cost structure of the retail sector can persist in a
common currency area. Furthermore, regulations, customs, and cultures are still very regional
(national). This reasoning is confirmed by the US-Canada comparison of Gopinath et al.
(2011) who found that national borders segment markets. I.e., retail prices react to price-
setting in neighboring stores within the same country but not across the national border.
However, the US and Canada are different currency areas which raises transaction costs and
make price comparisons difficult.8 A study of prices in Scandinavian duty-free shops also
argues that the reference price (i.e. the onshore price customers are used to) is most relevant
for consumers (see Asplund/Friberg, 2001 and below).
The price convergence shown in Figure 1. may have been caused by changes in national
prices and/or by variations of exchange rates. If national currency prices are expressed in a
common currency, convergence may result from convergence of national price levels or from
exchange rate adjustments.9 Table 1 displays inflation rates for private consumption as well as
exchange rates of the national currencies to the Deutsch-Mark (DM). For Italy, for example,
the cumulated inflation differential to Germany was almost 40% in the period 1985 to 2009
but until 1998 the inflation differential was compensated or even overcompensated (1992 to
1990) by a devalutation of the Lira against the DM. After the Euro introduction in 1999 the
exchange rates are equal to one and convergence could only be achieved through national
price adjustments (relativ to Germany in the example used here).
8 Engel (1993) found that relative prices within a country are much less volatile than the prices of specific goods in one country to the prices of similar goods in other countries. In a later paper Engel/Rogers (1996) argue that the distance between regions affects the price differences between similar goods. 9 Pcom = Pnat * Cref/Cnat where Pcom = common price, Pnat = price in national currency, Cref/Cnat = exchange rate EX And thus for differences over time: ∆ln Pcom = ln P com,t - ln Pcom,t-1 = ln P nat,t - ln Pnat,t-1 + ln EXt – ln EXt-1 = ∆ln(Pnat) + ∆ln(EX)
SCHUMPETER DISCUSSION PAPERS 2013-005

5
Table 1: National inflation rates (cumulated) and exchange rates (cumulated)
Country Inflation rate differential to Germany
(cumulated logs of annual inflation rates,
* 100)
Exchange rate to Germany
(cumulated logs of annual differences,
* 100)
1985-
2009
1985-
1991
1992-
1998
1999-
2009
1985-
2009
1985-
1991
1992-
1998
1999-
2009
Italy 39.7 22.9 8.6 7.8 -46.9 -19.1 -27.8 0
Spain 50.8 26.4 8.6 15.1 -40.7 -10.3 -30.4 0
France 2.9 7.5 -6.4 1.4 -8.8 -10.2 1.4 0
Belgium 5.1 2.9 -4.5 5.7 -1.6 -1.3 -0.2 0
Portugal 79.8 53.0 14.9 11.6 -68.8 -52.6 -16.2 0
Netherlands 1.4 -4.0 -1.6 6.8 0.0 0.1 -0.1 0
Austria 6.5 3.3 -1.3 3.9 -0.6 -0.1 0.0 0
Finland 11.5 17.7 -7.9 1.7 -36.33 -14.3 -22.0 0
Germany 0 0.0 0.0 0.0 0 0.0 0.0 0
Source: computations based on IMF data (exchange rates), OECD (inflation rates).
Summarizing the empirical results above and that of other studies using macro or aggregated
data one may conclude, that convergence within Euroland was strong, but that it was already
achieved before the introduction of the Euro in 1999. Even before the so-called Maastricht
criteria was effective substantial price convergence occurred but it was achieved mainly by
exchange rate adjustments. Aggregated price level data is based on a basket of goods, which
may be not comparable across the countries and heterogeneity may disturb hide similarities
but also differences between countries. To overcome heterogeneity problems some studies
restrict the analysis to single items (The Economist, BigMac, for example, see below).
In the following we first summarize studies investigating price convergence using micro data.
In the third section we present our analysis based on a unique data set using identical products
in a unique service environment in 8 initial Euroland countries. We make use of data collected
from IKEA catalogues before (1998) and twice after the introduction of the EURO (2001
when national banknotes were still used and after the Euro cash over, 2009). Thus, we analyze
price convergence of perfectly homogenous products within Euroland. We find significant
price convergence between 1998, 2001 and 2009.
SCHUMPETER DISCUSSION PAPERS 2013-005

6
Table 2: Measures to achieve European economic integration 2002, January 1st: Euro notes and coins introduced 1999, January 1st: Euro (EMU) established, exchange rates fixed, national currencies were
becoming denominations of the Euro (virtual Euro).
1998, May 2nd: Special European Council agreed that 11 member states (France, Belgium, Luxembourg, the Netherlands, Germany, Austria, Italy, Spain, Portugal, Finland, Ireland) joined Euroland (Britain, Denmark, Sweden and Greece (joined in 2002) did not join). ECB board appointed
1997, June: Stability and Growth Pact (SGP, Amsterdam) 1994, January 1st: European monetary integrations (EMI) set to work to prepare EMU 1993, July/ August: European Exchange rate mechanism (ERM) in critical stage, fluctuation band increased from 2.25% to 15% 1992, November: Treaty on the European Union came into effect 1991, September: British Pound and Italian Lira left the ERM after speculative attacs. 1991, December: Treaty of Maastricht, convergence to start stage 3 (the EMU) was defined in terms of monetary and fiscal stability:
- stable inflation rate (within 1,5% of the three best performing states) - low government deficit (no more than 3% of GDP) and government debt (below 60%
of GDP) - no devaluation of the currency within the previous 2 years - stable interest rates (within 2% of the three best performing states)
1989, November: Collapse of the Berlin wall, prospective German unification gave stimulus to EMU negotiations.
1989, April: Delors Report, a blueprint to implement EMU in 3 stages. June 1988: European Council (Hannover) moving ahead with EMU 1979: European Monetary System (EMS) launched (for details see: Dyson/Featherstone, 1999)
SCHUMPETER DISCUSSION PAPERS 2013-005

7
2. Micro data studies of price differentials The most famous individual item PPP is the McDonald’s Big-Mac regularly published in the
Economist, but also the Economist itself has been used in several studies (Knetter 1997,
Gosh/Wolf 1994). Gosh/Wolf (1994) found that cover prices of ‘The Economist’ in local
currency do not react to exchange rate variation, i.e. that the magazin is ‘priced to the market’
to long-term considerations (10 European countries and the US using the UK as reference).
Knetter (1997) used monthly cover prices of the Economist in 7 European countries and the
US in the period between 1966 and 1990. He found price rigidity in local prices, i.e. relative
prices expressed in a common currency price rise if the exchange rate appreciates. Engel and
Rogers (1999) analyzed price dispersion for similar goods across US cities but concluded that
sticky prices cannot explain price divergence within the US because nominal exchange rate
shocks cannot occur.
Parsley and Wei (1996) use quarterly prices of 51 final goods and services from 48 cities in
the US over the period 1975:1 through 1992:4 to investigate convergence to LOP. They find
that tradable goods converge fast to parity (the half-life of the price gap is about 4 to 5
quarters) but that services converge less fast (15 quarters half-life). The higher the price
differential the stronger the convergence in the Parsley/Wei data for the US. However, given
that the US was an intergrated market already before 1975, one may wonder why convergence
did not occur before.
Wolf (2000) uses prices for 42 goods and services within 211 US cities and investigates
possible hypotheses for the deviation from LOP. He found that the difference in traded and
non-traded goods is only marginal (slightly in favor of tradables) and that differences in prices
between city-pairs are consistently changing signs for various goods. Wolf concludes that
differences in (roughly constant) city-specific characteristics (such as taxes, median
household income, population, city government expenditures etc.) and distance between the
locations do not explain divergence from LOP.10 Differences in mark-ups also seem to be a
problematic explanation since price differences are not significantly influenced by proxies for
local competition. Average prices of the entire basket also seem to be unrelated to per capita
10 Measurement error may affect non-branded tradables more than branded tradables but Wolf (2000) actually found on average a higher coefficient of variation for branded (0.127) than for non-branded (0.117) tradables.
SCHUMPETER DISCUSSION PAPERS 2013-005
8
income and median household income variables which may serve as proxies for productivity
differentials.11
Among European countries Goldberg and Verboven (1998) found substantial and persisting
differences in quality-adjusted prices for cars in the period 1980 to 1993. Year-to-year
volatility in price differentials is strongly (although not completely) related to exchange rate
fluctuations (see also section 1 of this paper), i.e. local prices remain relatively stable despite
exchange rate variations. They conclude that exchange rates seem to be the main variable
driving any price conversion. In a later study Goldberg and Verboven (2001) also analyze the
European (5 countries) auto market applying hedonic price regressions to account for the
variations of models across countries (physical characteristics, market segments, brands). The
data covers the period 1970 to 2000 - a period when the European common market has been
developed – and this allows the authors to analyze the impact of dissolving trade barriers on
price convergence. They claim that the strength of their data (prices of individual car models
and their characteristics) allow them to compare prices of identical products across countries
and thus to investigate convergence not only to the relative LOP but also to the absolute LOP.
However, even controlling for characteristics, cars remain complex products and the service
environment may have a substantial impact on prices. Using similar data on car prices
provided by the European Commission for the period 1995 to 2005 Gil-Pareja and Sosvilla-
Rivero (2008) interpret their analysis as clear evidence of price convergence after 1999.
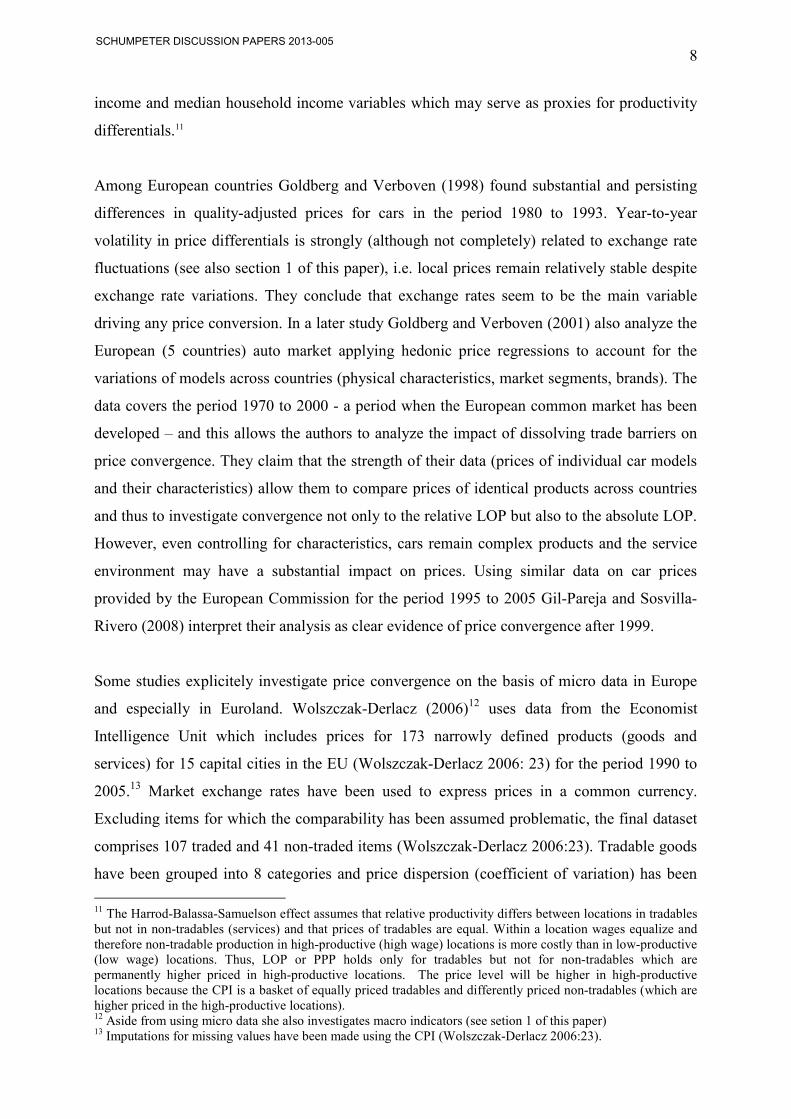
Some studies explicitely investigate price convergence on the basis of micro data in Europe
and especially in Euroland. Wolszczak-Derlacz (2006)12 uses data from the Economist
Intelligence Unit which includes prices for 173 narrowly defined products (goods and
services) for 15 capital cities in the EU (Wolszczak-Derlacz 2006: 23) for the period 1990 to
2005.13 Market exchange rates have been used to express prices in a common currency.
Excluding items for which the comparability has been assumed problematic, the final dataset
comprises 107 traded and 41 non-traded items (Wolszczak-Derlacz 2006:23). Tradable goods
have been grouped into 8 categories and price dispersion (coefficient of variation) has been
11 The Harrod-Balassa-Samuelson effect assumes that relative productivity differs between locations in tradables but not in non-tradables (services) and that prices of tradables are equal. Within a location wages equalize and therefore non-tradable production in high-productive (high wage) locations is more costly than in low-productive (low wage) locations. Thus, LOP or PPP holds only for tradables but not for non-tradables which are permanently higher priced in high-productive locations. The price level will be higher in high-productive locations because the CPI is a basket of equally priced tradables and differently priced non-tradables (which are higher priced in the high-productive locations). 12 Aside from using micro data she also investigates macro indicators (see setion 1 of this paper) 13 Imputations for missing values have been made using the CPI (Wolszczak-Derlacz 2006:23).
SCHUMPETER DISCUSSION PAPERS 2013-005

9
measured within these groups. The highest price difference has been observed for non-
tradables (hourly rate of domestic cleaning help) and the lowest for traded goods. Standard
deviations (sigma convergence) show a decline from 1990 to 1996 (19%) but some variations
after.
Most products (110 of 148) in the Wolszczak-Derlacz data set experienced price convergence
between 1990 and 2005. Calculating log price differences for all pairs of cities shows the
decline in dispersion between 1990 and 1995 and roughly stability after. Thus, the results
based on the less aggreagted micro data from the Economist Intelligence Unit over 15 years
confirm the findings made with more aggregated indicators: a decline in price dispersion
mainly in the period from 1990 to the mid 1990s and roughly stability after. One has to keep
in mind that the Wolszczak-Derlacz study includes not only Euroland countries but also
countries keeping their own national currencies. In addition, the convergence in prices before
the shift to the Euro in 1999 may be mainly caused by exchange rate adjustments rather than
by the movements of prices itself. Also based on data of the Economist Intelligence Unit,
Engel and Rogers (2004) find similar results as Wolszczak-Derlacz with a wider dispersion
among non-tradables than tradables and clearly lower price dispersion in the period 1998-
2003 than in earlier periods. However, in the latter period only prices of one product category
(alcoholic beverages) showed a further decline in price dispersion. In other categories it rose
slightly although insignificantly in most categories.
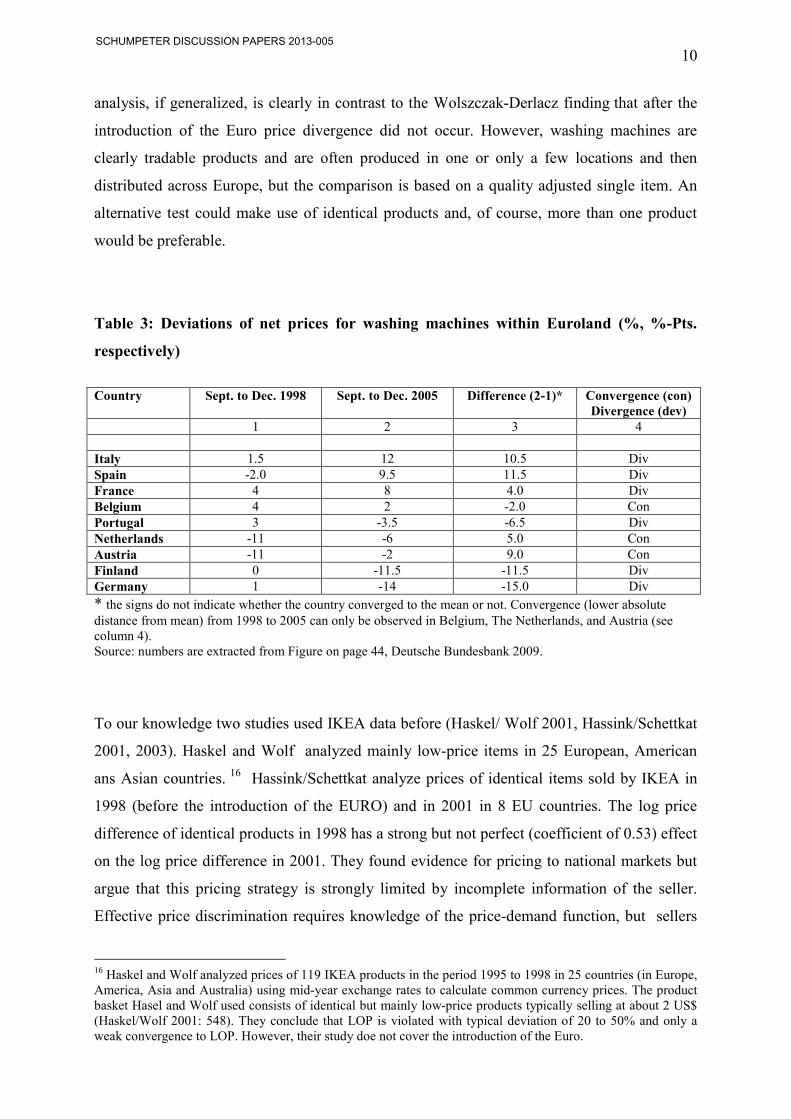
Probably the largest dataset (327,583 observations) was used in a Bundesbank analysis
(Fischer 2009) of prices of washing machines in 17 European countries for the period 1995 to
2005.14 Applying a hedonic price regression15 ‘controlling’ for specific features of the
machines and including firm and country dummies 88% of the net price variation of washing
machines is explained. All country and firm dummies are significant (Deutsche Bundesbank
2009: 43). Comparing net prices from September to December 1998 (just before the
introduction of the Euro) with prices from September to December 2005, the deviation from
the average of the Euroland countries (including Greece, but excluding Ireland and
Luxemburg) was higher in 2005 than before the introduction of the Euro. The Bundesbank
14 The Analysis include also non Euroland countries. 15 The equation estimated was: lnPikt = π0 + π’ϖϖk + πf + πit + εikt
where Pikt = price of model k in country i at time t, π0 = constant, π’ϖ = coefficient of model-specific features, ϖk = quality features of model k, πf = coefficient of a firm dummy, πit = coefficient of an interaction term of country and time, εikt = error term.
SCHUMPETER DISCUSSION PAPERS 2013-005
10
analysis, if generalized, is clearly in contrast to the Wolszczak-Derlacz finding that after the
introduction of the Euro price divergence did not occur. However, washing machines are
clearly tradable products and are often produced in one or only a few locations and then
distributed across Europe, but the comparison is based on a quality adjusted single item. An
alternative test could make use of identical products and, of course, more than one product
would be preferable.
Table 3: Deviations of net prices for washing machines within Euroland (%, %-Pts.
respectively)
Country Sept. to Dec. 1998 Sept. to Dec. 2005 Difference (2-1)* Convergence (con)
Divergence (dev) 1 2 3 4 Italy 1.5 12 10.5 Div Spain -2.0 9.5 11.5 Div France 4 8 4.0 Div Belgium 4 2 -2.0 Con Portugal 3 -3.5 -6.5 Div Netherlands -11 -6 5.0 Con Austria -11 -2 9.0 Con Finland 0 -11.5 -11.5 Div Germany 1 -14 -15.0 Div
* the signs do not indicate whether the country converged to the mean or not. Convergence (lower absolute distance from mean) from 1998 to 2005 can only be observed in Belgium, The Netherlands, and Austria (see column 4). Source: numbers are extracted from Figure on page 44, Deutsche Bundesbank 2009.
To our knowledge two studies used IKEA data before (Haskel/ Wolf 2001, Hassink/Schettkat
2001, 2003). Haskel and Wolf analyzed mainly low-price items in 25 European, American
ans Asian countries. 16 Hassink/Schettkat analyze prices of identical items sold by IKEA in
1998 (before the introduction of the EURO) and in 2001 in 8 EU countries. The log price
difference of identical products in 1998 has a strong but not perfect (coefficient of 0.53) effect
on the log price difference in 2001. They found evidence for pricing to national markets but
argue that this pricing strategy is strongly limited by incomplete information of the seller.
Effective price discrimination requires knowledge of the price-demand function, but sellers
16 Haskel and Wolf analyzed prices of 119 IKEA products in the period 1995 to 1998 in 25 countries (in Europe, America, Asia and Australia) using mid-year exchange rates to calculate common currency prices. The product basket Hasel and Wolf used consists of identical but mainly low-price products typically selling at about 2 US$ (Haskel/Wolf 2001: 548). They conclude that LOP is violated with typical deviation of 20 to 50% and only a weak convergence to LOP. However, their study doe not cover the introduction of the Euro.
SCHUMPETER DISCUSSION PAPERS 2013-005

11
know at best a few points of the function. If prices cannot be easily adjusted down and up –
because buyers resist price rises, e.g. –, the price-demand function is basically unknown to
the seller. Most of the inter-country price variation for identical products remains unexplained
in the Hassink/Schettkat study.
Absolutely identical products sold in the same place were analyzed by Marcus Asplund and
Richard Friberg (2001) in a study of Scandinavian duty-free shops with price tags in two
currencies. They offer two hypotheses why the seller uses two currencies on the price tags
although prices may deviate for the same product at the same location when expressed in a
common currency. First two rigid nominal prices may be convinient for the consumer because
this offers her the possbility to compare easily to prices at home and second the seller may
discriminate prices according to the onshore price level. However, difference in cost
components (labor costs, taxes etc.) cannot be the reason for deviation from the LOP and
transportation costs hindering arbitrage are nil. The only costs related to arbitrage for
consumers are related to the exchange of currencies. These, however, could be relatively high
especially if small amounts are changed as it will typically be the case for low price items sold
in Scandivian duty-free shops (such as alcoholics, cosmetics etc.). Thus, even for identical
products sold at the same place prices may deviate in a certain range.
SCHUMPETER DISCUSSION PAPERS 2013-005

12
3. Price convergence in Euroland: evidence from homogenous products
Why may prices converge? Price convergence may occur for several reasons: (1) arbitrage,
(2) convergence of the cost structure (VAT harmonization, labor costs, interest rates), (3)
declining transaction costs, (4) competition, (5) convergence of price demand functions.
Arbitrage by customers shopping in different countries, is unlikely to occur because
information and transportation costs will be high for individuals.17 Therefore, with imperfect
competition, sellers may discriminate between national markets. But pricing to the market, i.e.
regional price differentiation, requires sufficient knowledge about the national demand
functions.18 The cost structure is influenced by the product itself, which can be assumed to be
roughly identical everywhere (transportation costs per item are low) but the domestic cost
components may differ most obvious with VAT-rates and other taxes, but also rents, and
labor costs.
We analyse price convergence in Euroland based on a three-dimensional dataset of identical
products, countries and time covering the period before (1998) and after the introduction of
the Euro (2001 and 2009). Therefore, we are able to investigate prices in the currency area
when prices were still expressed in national currencies (although fixed to the Euro) countries
as well as after the cash change over to actual Euro-banknotes in 2002. The analysis is based
on national IKEA catalogues including 112 products19 priced at a minimum of 5.00 Euros.
The sample includes eight of the initially 11 EMU member states: Germany, Austria,
Netherland, France, Belgium, Italy, Spain and Finland (i.e., not including Luxemburg,
Portugal and Ireland).20 IKEA sets prices at the national level published in an annual
catalogue, the firm famously minimizes distribution costs, involves the customer who has to
collect the products in the store, arrange the transport and assemble the products. The stores
and catalogues are almost identical everywhere21, products are labelled identically with
Scandinavian names, i.e. IKEA products are thus truly homogeneous not only with respect to
the products themselves but also regarding the shopping and service environment. Therefore,
our cross-national analysis compares actually homogenous products.
17 In border regions it may well be the case that arbitrage is used especially in common currency areas, which does not necessarily contradict the Gopinath et al. (2011) finding for the US and Canada (see also above). IKEA stores make in border regions announcements in two languages (Wikipedia). 18 Helga Einecke (2010) reports that IKEA invested 130 Mill. Euro in lowering product prices (about 5% of the 2,670 Mill Euro turnover), that turnover increased by 11%, which implies a price elasticity of about 2 (assuming that lower prices caused the increase in turneover) in Germany. 19 With a few exceptions the products are available in all countries. 20 The first IKEA store in Ireland opened in 2009 (Wikipedia) 21 All catalogues are centrally designed in Sweden and apply the same production labels. Only prices may differ.
SCHUMPETER DISCUSSION PAPERS 2013-005

13
If Euroland were a perfect market, competition and arbitrage would enforce the LOP, prices
would be identical independent of national cost components. Actually, arbitrage is unlikely to
occur because for consumers information (they simply would not know about price
differences) and transportation costs are high for consumers. Competition could enforce
unique prices but although IKEA products are in the low price segment they have a
distinguished design and quality which may be an advantage over competitors. The IKEA-
world is highly standardized allowing IKEA to gain from economies of scale. Catalogues are
centrally designed and identical, suggesting that consumers are assumed to be similar with
respect to features like culture and tastes. Although catalogues are centrally designed, ‘pricing
to the market’ may still be attractive if price-demand functions and/or cost components differ
sufficiently. If IKEA applies a strict full cost principle and mark-up pricing, domestic cost
components will affect national prices, i.e. a higher VAT will translate into higher consumer
prices if costs are otherwise identical. This should be reflected in country-specific effects. If,
on the other hand, price-demand functions are sufficiently different between countries (and
IKEA knows about it) profit maximization may lead to price differentiation (pricing to the
market)22 IKEA clearly differentiates prices between countries but –at least for the outside
observer- in an unsystematic way (Hassink/Schettkat 2001, 2003).
Table 4: Two-sample Kolmogorov-Smirnov test for equality of distribution functions (log price deviations)
Test-Statistic D P-Value
1998 against 2001 0.0322 0.733
1998 against 2009 0.1417 0.000
2001 against 2009 0.1275 0.000 Source: IKEA-Prices collected by Hassink/Schettkat (cf. Hassink/Schettkat 2001), the authors.
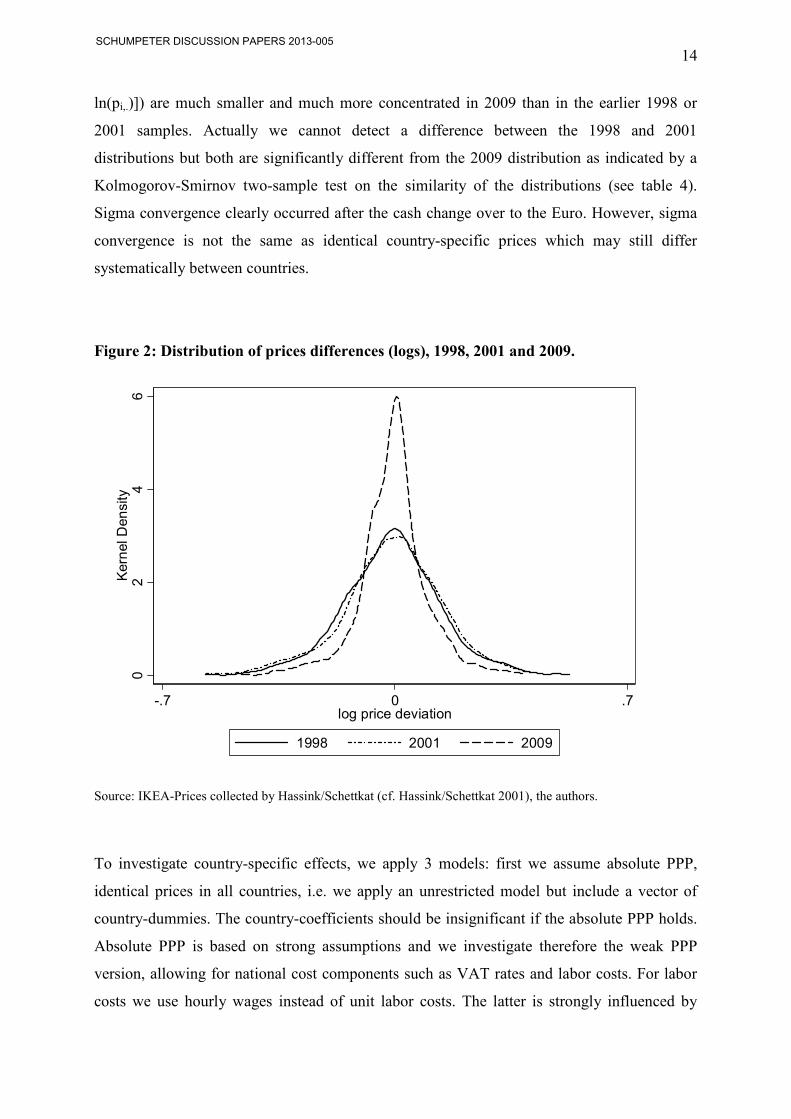
We use beta and sigma convergence to investigate whether prices of homogenous products
differ and whether they converged after the introduction of the EURO. As Figure 3.1 clearly
shows, The distribution of the log-price deviations (difference of country specific prices in
logs of each product [ln(pi,c)] from the mean price of the product in logs [ln(pi,.)], [ln(pi,c)-
22 For price discrimination see Varian (1989).
SCHUMPETER DISCUSSION PAPERS 2013-005
14
ln(pi,.)]) are much smaller and much more concentrated in 2009 than in the earlier 1998 or
2001 samples. Actually we cannot detect a difference between the 1998 and 2001
distributions but both are significantly different from the 2009 distribution as indicated by a
Kolmogorov-Smirnov two-sample test on the similarity of the distributions (see table 4).
Sigma convergence clearly occurred after the cash change over to the Euro. However, sigma
convergence is not the same as identical country-specific prices which may still differ
systematically between countries.
Figure 2: Distribution of prices differences (logs), 1998, 2001 and 2009.
Source: IKEA-Prices collected by Hassink/Schettkat (cf. Hassink/Schettkat 2001), the authors.
To investigate country-specific effects, we apply 3 models: first we assume absolute PPP,
identical prices in all countries, i.e. we apply an unrestricted model but include a vector of
country-dummies. The country-coefficients should be insignificant if the absolute PPP holds.
Absolute PPP is based on strong assumptions and we investigate therefore the weak PPP
version, allowing for national cost components such as VAT rates and labor costs. For labor
costs we use hourly wages instead of unit labor costs. The latter is strongly influenced by
02
46
Kernel Density
-.7 0 .7log price deviation
1998 2001 2009
SCHUMPETER DISCUSSION PAPERS 2013-005
15
aggregate productivity, but here we compare IKEA prices and since IKEA is organized
similarly everywhere it will have similar productivity but hourly labor costs may differ.
Model 1: country dummies
�1�ln���,� − ln���,.� = �� +��,� +��,
where i = product, c = country, β0 = constant, β1 = coefficient for country, ε= error term.
Model 2: country dummies plus VAT
�2� ln���,� − ln���,.� = �� +��,� +����� +��,
where ��= coefficient for Value Added Tax (VAT)
Model 3: country dummies plus VAT, plus hourly labor costs
�3� ln���,� − ln���,.� = �� +��,� +����� + ����� +��,
where ��= coefficient for hourly labor costs (HLC)
If the price deviations between EMU countries could be ascribed to different labor costs or
VAT alone, the coefficients for all country-dummies in model (2) or (3) should become zero
whereas the coefficients of the cost variables should differ significantly from zero. If price
deviations between countries still exist after controlling for these country-specific cost
components, other unobserved variables may determine prices. If price-demand functions are
sufficiently different between the countries (and IKEA knows about it) pricing to the market
may be applied.23
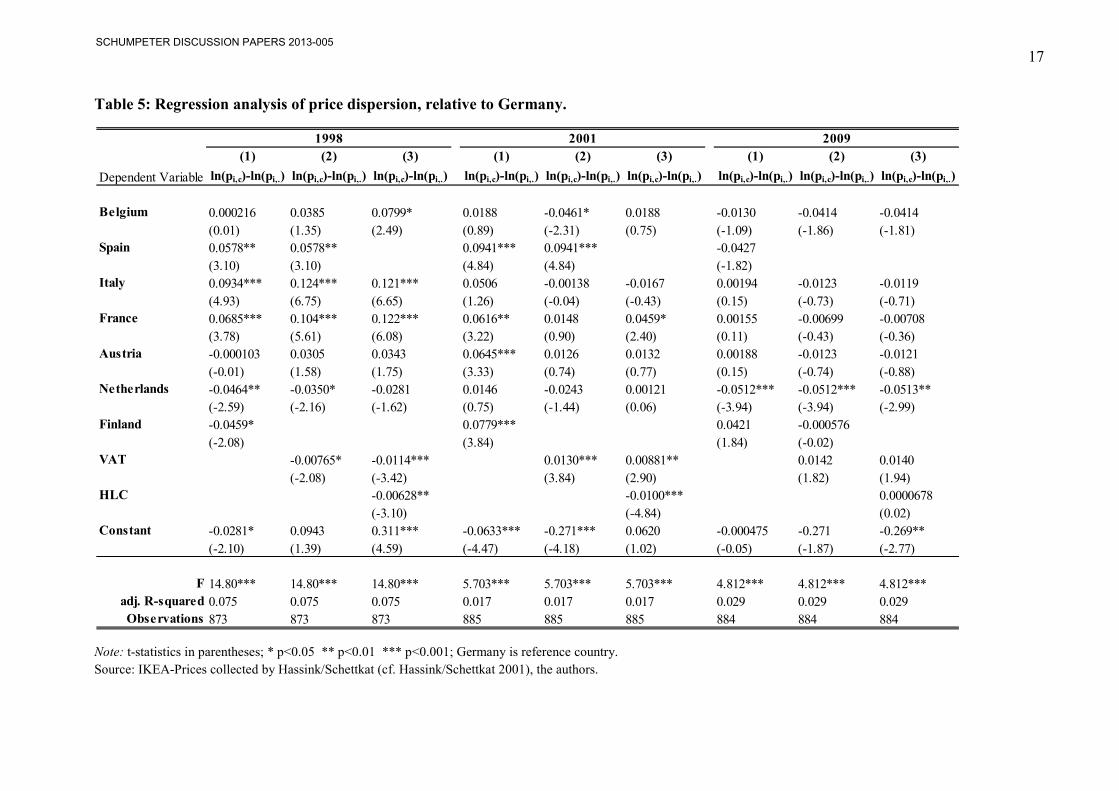
All models are significant although the R² are very low indicating a minor role or no role for
systematic country-specific effects on prices (Table 5). Actually, the coefficients for labor
costs and VAT24 have a significantly negative sign in 1998 but are both insignificant in 2009
(in 2001 the coefficient of the labor cost variable is significantly negative, but VAT is
positive). Thus, we cannot detect systematic effects of the variables proxying cost component.
In 2009 all country-coefficients (except for The Netherlands) are insiginificant, i.e. price
levels differ insignificantly from the reference country (Germany). In comparison to early
years we see clearly beta-convergence.
23 Most demand functions have varying elasticities (Appelbaum/Schettkat 1999) where price elasticities greater than 1 classify unsaturaed markets and elasticities smaller than one saturated markets. 24 VAT rates have converged (see Appendix Table A.1).
SCHUMPETER DISCUSSION PAPERS 2013-005
16
Why is the coefficient for NL significantly negative in 2009 even in the models with country-
specific cost components (models 2 and 3)? Actually the mean price across all products in the
2009 sample is not the lowest in The Netherlands25 but the country’s mean of the relative
deviation from the product-means [ln(piNL) –ln(pi.)] is substantially lower (about 5% whereas
most other countries are in the range of less than 1% up to 2%). In the Netherlands 81
products in the 2009 sample are priced below the mean and for 46 products the Dutch price is
the lowest. At the same time, the Dutch VAT rate in 2009 is lower than in many other
countries but not substantially (see Appendix Table A1). Assuming that the VAT translates
one-to-one into prices, the VAT rate in The Netherlands is 1%-pt. (5%) below the mean VAT
(20%) in the sample, but the same is true for Germany and Spain (see Appendix Table A.1)
and hourly wages in The Netherlands are not the lowest. Even if some unobserved cost
component is lower in The Netherlands, why would IKEA pass this advantage on to
consumers? Probably the Dutch price elasticity is higher but since not all products are lowest
priced in The Netherlands, IKEA must know product-specific price-demand functions.
Determining price-demand functions requires knowledge of prices and quantities, information
not available to outside observers and it is questionable whether IKEA has such information.
Determing price-demand functions requires at least two price-quantity combinations. In
principle IKEA could creat this information but if the store lowers the price, it will be difficult
to raise it again. Therefore, IKEA may guess the price-demand function but the company will
hardly know it.
IKEA uses blue and yellow to be identified as Swedish and actually the design center is
located in Sweden, but the parent company of the IKEA operations is INGKA Holding, which
in turn belongs to Stichting Ingka Foundation, a tax –exempt, non-profit entity under Dutch
law (Economist 2011). The IKEA conglomerat is obviously setup to minimize taxes but it
remains –for the outside observer- a conundrum why Dutch prices are on average lower than
in other countries.
25 Germany Belgium Spain Italy France Austria Netherlands Finland
Mean price (Euro) 2009 117.95 116.35 115.46 108.88 119.18 110.52 112.46 123.82
SCHUMPETER DISCUSSION PAPERS 2013-005
17
Table 5: Regression analysis of price dispersion, relative to Germany.
Note: t-statistics in parentheses; * p<0.05 ** p<0.01 *** p<0.001; Germany is reference country.
Source: IKEA-Prices collected by Hassink/Schettkat (cf. Hassink/Schettkat 2001), the authors.
(1) (2) (3) (1) (2) (3) (1) (2) (3)
Dependent Variable ln(pi,c)-ln(pi,.) ln(pi,c)-ln(pi,.) ln(pi,c)-ln(pi,.) ln(pi,c)-ln(pi,.) ln(pi,c)-ln(pi,.) ln(pi,c)-ln(pi,.) ln(pi,c)-ln(pi,.) ln(pi,c)-ln(pi,.) ln(pi,c)-ln(pi,.)
Belgium 0.000216 0.0385 0.0799* 0.0188 -0.0461* 0.0188 -0.0130 -0.0414 -0.0414
(0.01) (1.35) (2.49) (0.89) (-2.31) (0.75) (-1.09) (-1.86) (-1.81)Spain 0.0578** 0.0578** 0.0941*** 0.0941*** -0.0427
(3.10) (3.10) (4.84) (4.84) (-1.82)Italy 0.0934*** 0.124*** 0.121*** 0.0506 -0.00138 -0.0167 0.00194 -0.0123 -0.0119
(4.93) (6.75) (6.65) (1.26) (-0.04) (-0.43) (0.15) (-0.73) (-0.71)France 0.0685*** 0.104*** 0.122*** 0.0616** 0.0148 0.0459* 0.00155 -0.00699 -0.00708
(3.78) (5.61) (6.08) (3.22) (0.90) (2.40) (0.11) (-0.43) (-0.36)Austria -0.000103 0.0305 0.0343 0.0645*** 0.0126 0.0132 0.00188 -0.0123 -0.0121
(-0.01) (1.58) (1.75) (3.33) (0.74) (0.77) (0.15) (-0.74) (-0.88)Netherlands -0.0464** -0.0350* -0.0281 0.0146 -0.0243 0.00121 -0.0512*** -0.0512*** -0.0513**
(-2.59) (-2.16) (-1.62) (0.75) (-1.44) (0.06) (-3.94) (-3.94) (-2.99)Finland -0.0459* 0.0779*** 0.0421 -0.000576
(-2.08) (3.84) (1.84) (-0.02)VAT -0.00765* -0.0114*** 0.0130*** 0.00881** 0.0142 0.0140
(-2.08) (-3.42) (3.84) (2.90) (1.82) (1.94)HLC -0.00628** -0.0100*** 0.0000678
(-3.10) (-4.84) (0.02)Constant -0.0281* 0.0943 0.311*** -0.0633*** -0.271*** 0.0620 -0.000475 -0.271 -0.269**
(-2.10) (1.39) (4.59) (-4.47) (-4.18) (1.02) (-0.05) (-1.87) (-2.77)
F 14.80*** 14.80*** 14.80*** 5.703*** 5.703*** 5.703*** 4.812*** 4.812*** 4.812***adj. R-squared 0.075 0.075 0.075 0.017 0.017 0.017 0.029 0.029 0.029Observations 873 873 873 885 885 885 884 884 884
1998 2001 2009
SCHUMPETER DISCUSSION PAPERS 2013-005
18
4. Conclusion
Calculating the distributions of the deviations of national log prices from their mean in 8
Euroland countries (Germany, Belgium, Spain, Italy, Austria, France, Netherlands and
Finland) for 112 products in the year before the introduction of the Euro (1998), the year
before the change over to Euro banknotes and coins (2001), and a year when the Euro was
established for some time (2009), we find clear sigma convergence of prices for truly
homogeneous products sold by a globally acting furniture company (IKEA). I.e. in 2009 is the
distribution significantly more concentrated than in the earlier years. We observe Sigma
convergence, which does not necessarily mean that prices convergece to a perfect market
price. In 2009 only one country has a significantly lower coefficient whereas in 1998 and
2001 the country deviations are more common and more pronounced. I.e. we also observe
beta convergence. However, insignificant country coefficients simply mean that systematic
country-effects cannot be detected but prices do nevertheless differ.
Why does convergence occur? If Euroland were a perfect market, competition and arbitrage
would enforce the LOP, prices would be identical independent of country-specific cost
components. The use of a common currency potentially makes prices more transparent but it
is unlikely that consumers discover price differences between countries (or one may say that
information costs for consumers are too high) and furthermore transportation costs may
prevent consumers to engage in arbitrage. Competition could enforce unique prices but
although IKEA products are in the low price segment, they have a distinguished design.
Insofar they are ideosyncratric and have sufficient quality that they create their own market
niche. But keep the image of low prices the competitors need to be matched. Furthermore,
IKEA operates with declining marginal costs, which in addition give room for discretion in
price setting.26
Price convergence would have advantages for suppliers because it may reduce menu costs
(printing price tags or catalogues) but then one would expect products to be sold at exactly the
same price everywhere. This pattern does only occur for 1 product in our 2009 sample which
is sold at exactly the same price in all 8 countries. Two products are priced equally in 7
countries and eight products in 6 countries. These are roughtly 10% of the products in the
26 See Blinder et al. for price setting practices.
SCHUMPETER DISCUSSION PAPERS 2013-005
19
sample.27 Why do we then see may small deviations in prices but hardly any systematic,
significant effects? One answer may be that IKEA assumes the price-demand functions to be
similar in all countries but that small product-specific differences in price-demand functions
exists between countries. Whether such a pricing strategy is maximizing profits in praxis
remains unobservable. However, this would require substantial knowledge about the country
and product-specific demand functions unlikely to be present in the IKEA organization. The
answer may only be found if we “ask about prices” (Blinder1998).
27 This analysis applies to our 2009 dataset only, because in former years prices were expressed in national currencies (see above) and one cannot expect exactly the same price when expressed in a common currency.
SCHUMPETER DISCUSSION PAPERS 2013-005
20
References:
Appelbaum, E., Schettkat, R. (1999) Are Prices Unimportant? The Changing Structure of the Industrialized
Economies. Journal of Post Keynesian Economics, Volume 21, No. 3, 1999: 387-398.
Asplund, M., Friberg, R. (2001) The Law of One Price in Scandinavian Duty Free Stores. The American Economic Review, Vol. 91 No. 4, 1072-1083.
Blinder, A.S., Canetti, E.D., Lebow, D. E., Rudd, J.B. (1998) Asking about Prices. New York: Russel Sage Foundation.
Bundesbank (2009) Price Convergence in the Euro Area. Monthly Report March 2009.
Cuaresma, J.C., Egert, B, Silgoner, M.A. (2007) Price Level Convergence in Europe: Did the Introduction of the Euro Matter? Monetary Policy and the Economy Q1 (07), 100-113.
Dornbusch, R.. (1987) Purchasing Power Parity. Palgrave’s Dictionary of Economics, London: Macmillan.
Dyson, K., Featherstone, K. (1999) The Road to Maastricht. Oxford: Oxford University Press.
Economist (2011) Febr. 24. The secret of IKEA’s Success.
Einecke, H. (2010) Ikea heizt den Preiskampf an. Süddeutsche Zeitung, 19. Mai 2010.
Engel, C. (1993) Real exchange rates and relative prices : An empirical investigation, Journal of Monetary Economics, Vol. 32(1), 35-50.
Engel, C., Rogers, J.H. (1996) How wide is the border? The American Economic Review, 86, 1112-1125.
Engel, C., Rogers, J.H. (2004) European product market integration after the euro. Economic Policy, 19, 347-384.
Fischer, C. (2009) Price convergence in the EMU? Evidence from micro data. Deutsche Bundesbank Research Centre.
Fritsche, U., Kuzin, V. (2011) Analyzing convergence in Europe using the non-linear single factor model. Empirical Economics, 41, 343–369.
Fritsche, U., Lein, S., Weber, S. (2009) Do Prices in the EMU Converge (Non-linearly)? Hamburg University, Department Wirtschaft und Politik, http://EconPapers.repec.org/RePEc:hep:macppr:200904.
Froot, K., Kim, M., Rogoff, K. (1995) The law of one price over 700 years. NBER Working Paper 5132, May, Cambridge, Mass.: NBER.
Gil-Pareja, S., Sosvilla-Rivero, S. (2008) Price convergence in the European car market. Applied Economics, Vol. 40, 241-250.
Goldberg, P., Verboven, F. (1998) The Evolution of Price Dispersion in the European Car Market. NBER Working Paper 6818.
Goldberg, P., Verboven F. (2001) The Evolution of Price Dispersion in the European Car Market. Review of Economic Studies, 68(4), 811-848.
Gopinath, G., Gourinchas, P.O., Hsieh, C.T., Li, N. (2011) International Prices, Costs, and Markup Differences. American Economic Review, 101, 2450–2486.
Gosh, A.R., Wolf, H.C. (1994) Pricing in International Markets: Lessons from The Economist. NBER Working Paper No. 4806.
Grauwe, P. de (2009) The Euro at ten: achievements and challenges. Empirica, 36, 5–20.
Haskel, J., Wolf, H. (2001) The Law of One Price - A Case Study. NBER working paper 8112, National Bureau of Economic Research, Cambridge, Mass.
Hassink, W., Schettkat, R. (2001) On Price-Setting for Identical Products in Markets without Formal Trade Barriers. IZA Discussion paper series, No. 315, ZBW Bonn.
Hassink,W., Schettkat, R. (2003) Price Discrimination between EU-Regions. Journal of Economics and Social Geography, Regional Economics, Vol 94, 2, 2003, 258-264.
Knetter, M.M. (1997) The Segmentation of International Markets: Evidence from The Economist. NBER Working Paper 5878.
SCHUMPETER DISCUSSION PAPERS 2013-005

21
Lein, S., Nitsch, V. (2008) Spezialanalysen: Führt der Euro zu Preiskonvergenz? KOF Analysen, SA1, 21-32.
Parsley, D.C., Wei, S.J. (1996) Convergence to the Law of One Price without trade barriers or currency fluctuations. The Quarterly Journal of Economics, 111, pp. 1211-1236.
Rogoff, K. (1996) The Purchasing Power Parity Puzzle. Journal of Economic Literature, June 1996, 647-668.
Varian, H.R. (1989) Price Discrimination. In: Schmalensee, R., Willig, R., Handbook of Industrial Organization. Amsterdam: North Holland Press, 1989, 600-654.
Wolszczak-Derlacz, J. (2006) One Europe, one product, two prices – the price disparity in the EU. Katholieke Universiteit Leuven, Center for Economic Studies, Discussion Paper 06.14.
Wolf, H. (2000) (Why) Do Prices Differ Across US Cities? Center for German and European Studies, Department of Economics, Georgetown University.
SCHUMPETER DISCUSSION PAPERS 2013-005

22
Appendix
Table A.1: VAT-rates in Euroland-countries
1998 2001 2009
Deutschland 16.0 16.0 19.0
Belgien 21.0 21.0 21.0
Spanien 16.0 16.0 16.0
Italien 20.0 20.0 20.0
Frankreich 20.6 19.6 19.6
Österreich 20.0 20.0 20.0
Niederlande 17.5 19.0 19.0
Finnland 22.0 22.0 22.0 Portugal 17.0 17.0 20.0 Coeff. of variation (incl. Portugal) 0.121 0.114 0.084
Source: European Commission (2013).
SCHUMPETER DISCUSSION PAPERS 2013-005
23
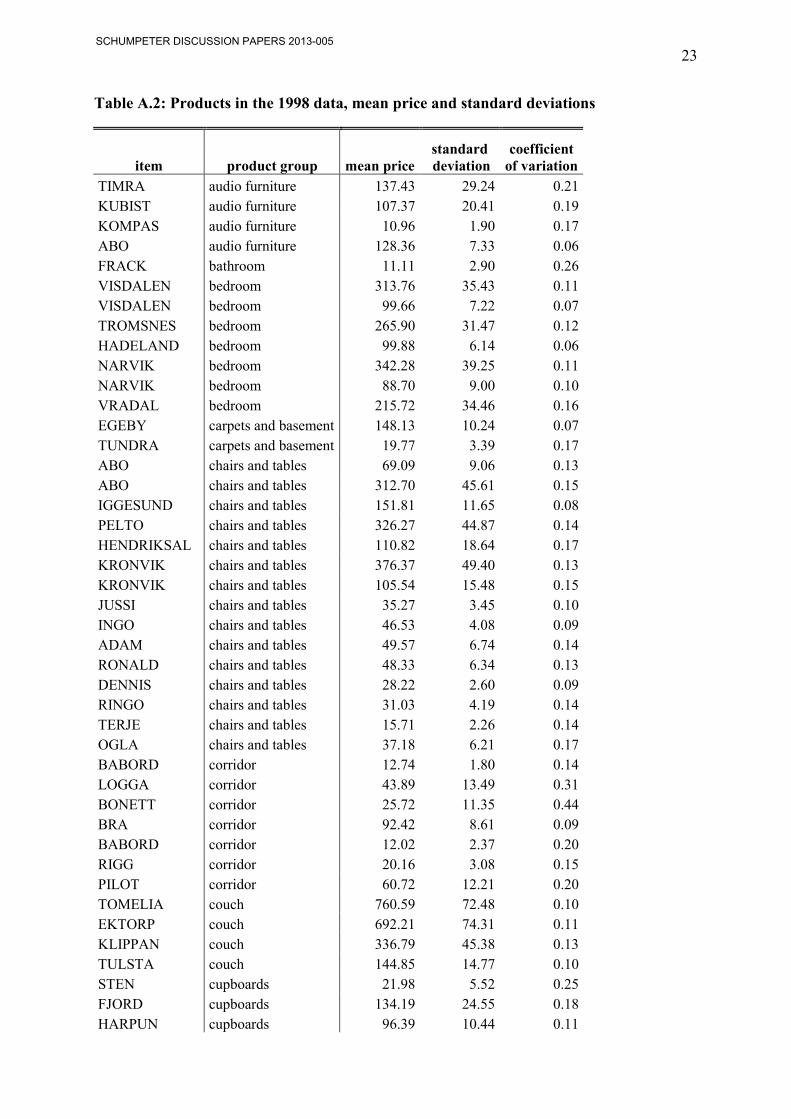
Table A.2: Products in the 1998 data, mean price and standard deviations
item product group mean price standard deviation
coefficient of variation
TIMRA audio furniture 137.43 29.24 0.21
KUBIST audio furniture 107.37 20.41 0.19
KOMPAS audio furniture 10.96 1.90 0.17
ABO audio furniture 128.36 7.33 0.06
FRACK bathroom 11.11 2.90 0.26
VISDALEN bedroom 313.76 35.43 0.11
VISDALEN bedroom 99.66 7.22 0.07
TROMSNES bedroom 265.90 31.47 0.12
HADELAND bedroom 99.88 6.14 0.06
NARVIK bedroom 342.28 39.25 0.11
NARVIK bedroom 88.70 9.00 0.10
VRADAL bedroom 215.72 34.46 0.16
EGEBY carpets and basement 148.13 10.24 0.07
TUNDRA carpets and basement 19.77 3.39 0.17
ABO chairs and tables 69.09 9.06 0.13
ABO chairs and tables 312.70 45.61 0.15
IGGESUND chairs and tables 151.81 11.65 0.08
PELTO chairs and tables 326.27 44.87 0.14
HENDRIKSAL chairs and tables 110.82 18.64 0.17
KRONVIK chairs and tables 376.37 49.40 0.13
KRONVIK chairs and tables 105.54 15.48 0.15
JUSSI chairs and tables 35.27 3.45 0.10
INGO chairs and tables 46.53 4.08 0.09
ADAM chairs and tables 49.57 6.74 0.14
RONALD chairs and tables 48.33 6.34 0.13
DENNIS chairs and tables 28.22 2.60 0.09
RINGO chairs and tables 31.03 4.19 0.14
TERJE chairs and tables 15.71 2.26 0.14
OGLA chairs and tables 37.18 6.21 0.17
BABORD corridor 12.74 1.80 0.14
LOGGA corridor 43.89 13.49 0.31
BONETT corridor 25.72 11.35 0.44
BRA corridor 92.42 8.61 0.09
BABORD corridor 12.02 2.37 0.20
RIGG corridor 20.16 3.08 0.15
PILOT corridor 60.72 12.21 0.20
TOMELIA couch 760.59 72.48 0.10
EKTORP couch 692.21 74.31 0.11
KLIPPAN couch 336.79 45.38 0.13
TULSTA couch 144.85 14.77 0.10
STEN cupboards 21.98 5.52 0.25
FJORD cupboards 134.19 24.55 0.18
HARPUN cupboards 96.39 10.44 0.11
SCHUMPETER DISCUSSION PAPERS 2013-005

24
IVAR cupboards 63.05 13.28 0.21
IVAR cupboards 12.93 2.31 0.18
BILLY cupboards 60.04 6.69 0.11
BENNO cupboards 56.18 3.70 0.07
LIO cupboards 48.10 4.52 0.09
BONDE cupboards 226.70 25.25 0.11
KUBUS cupboards 199.55 23.74 0.12
AKROBAT cupboards 88.26 9.85 0.11
NARTORP cupboards 150.56 20.03 0.13
KRONVIK cupboards 453.59 38.75 0.09
KRYSS cupboards 85.00 8.86 0.10
SKANDOR cupboards 147.14 5.86 0.04
ABO cupboards 340.63 45.49 0.13
NARVIK cupboards 195.14 8.57 0.04
BIALITT cupboards 104.93 18.21 0.17
FJORD cupboards 107.82 13.58 0.13
KURS cupboards 93.29 4.27 0.05
RAST cupboards 40.82 5.91 0.14
PRAGEL kitchen 70.69 17.81 0.25
EDSVIK kitchen 53.43 8.18 0.15
HAGGVINK kitchen 60.30 9.73 0.16
FACTUM kitchen 98.22 16.94 0.17
PERFECT kitchen 82.26 9.92 0.12
ANTOFINO lamp 51.13 12.24 0.24
KVINTOL lamp 29.59 5.58 0.19
TERTIAL lamp 14.42 2.62 0.18
ERBIUM lamp 39.36 6.17 0.16
NORSSKEN lamp 52.96 9.36 0.18
NORSSKEN lamp 12.37 3.58 0.29
ANTILOP nursery 14.78 2.38 0.16
GOK nursery 63.10 18.81 0.30
TROFAST nursery 103.28 10.53 0.10
TROFAST nursery 75.88 6.16 0.08
GLIS nursery 12.13 1.50 0.12
VIKARE nursery 134.50 15.27 0.11
DUKTIG nursery 8.25 2.79 0.34
DUKTIG nursery 15.41 1.92 0.12
MAMMUT nursery 12.55 1.67 0.13
PANTER nursery 18.23 2.71 0.15
MAMMUT nursery 228.98 28.33 0.12
GLIS nursery 7.71 1.07 0.14
HELMER office 65.06 11.24 0.17
EFFECTIV office 191.27 22.88 0.12
OPERATIV office 271.13 20.48 0.08
EFFECTIV office 194.86 40.29 0.21
MAXIMAL office 163.62 12.94 0.08
MAXIMAL office 165.09 14.36 0.09
SCHUMPETER DISCUSSION PAPERS 2013-005

25
TORE office 119.55 11.91 0.10
BRA office 37.09 6.04 0.16
BERTIL office 37.89 3.85 0.10
FRASSE office 23.29 2.91 0.13
ANTONIUS organizing 47.35 17.29 0.37
MOPPE organizing 15.34 2.09 0.14
LACK storage 19.72 1.17 0.06
JUSSI tables 60.94 13.20 0.22
KROKSHULT tables 149.24 10.21 0.07
TIMBRA tables 91.34 7.09 0.08
LACK tables 37.80 6.12 0.16
DRAGON textile and accessory 33.19 5.37 0.16
AGEN textile and accessory 26.15 2.17 0.08
INDEX textile and accessory 9.78 2.75 0.28
RESLIG wall decoration 21.66 1.59 0.07
NYTTJA wall decoration 6.12 1.18 0.19
HAPPEN wardrobe 44.92 10.84 0.24
KOMPLEMENT wardrobe 9.19 2.75 0.30
ASKEDAL wardrobe 211.86 29.84 0.14
VISDALEN wardrobe 356.29 35.07 0.10
BIALITT wardrobe 178.55 16.77 0.09
TROGEN wardrobe 137.73 17.94 0.13
SCHUMPETER DISCUSSION PAPERS 2013-005

26
Table A.3: Products in the 2001 data, mean price and standard deviations
item product group mean price standard deviation
coefficient of variation
TIMRA audio furniture 65.31 62.46 0.96
KUBIST audio furniture 49.18 50.40 1.02
KOMPAS audio furniture 4.90 5.25 1.07
ABO audio furniture 47.53 70.01 1.47
FRACK bathroom 5.63 4.75 0.84
VISDALEN bedroom 127.35 161.44 1.27
VISDALEN bedroom 37.25 54.05 1.45
TROMSNES bedroom 109.07 135.82 1.25
HADELAND bedroom 37.37 54.14 1.45
NARVIK bedroom 137.40 177.49 1.29
NARVIK bedroom 35.06 46.46 1.33
VRADAL bedroom 94.29 105.16 1.12
EGEBY carpets and basement 56.14 79.66 1.42
TUNDRA carpets and basement 8.64 9.65 1.12
ABO chairs and tables 27.99 35.63 1.27
ABO chairs and tables 134.62 154.22 1.15
IGGESUND chairs and tables 58.37 80.92 1.39
PELTO chairs and tables 135.26 165.49 1.22
HENDRIKSAL chairs and tables 49.25 53.33 1.08
KRONVIK chairs and tables 158.19 188.95 1.19
KRONVIK chairs and tables 44.82 52.59 1.17
JUSSI chairs and tables 14.06 18.37 1.31
INGO chairs and tables 17.96 24.75 1.38
ADAM chairs and tables 20.89 24.84 1.19
RONALD chairs and tables 19.76 24.75 1.25
DENNIS chairs and tables 11.03 14.89 1.35
RINGO chairs and tables 13.02 15.60 1.20
TERJE chairs and tables 6.73 7.77 1.15
OGLA chairs and tables 16.52 17.89 1.08
BABORD corridor 5.44 6.32 1.16
LOGGA corridor 22.88 18.22 0.80
BONETT corridor 15.87 8.54 0.54
BRA corridor 36.55 48.39 1.32
BABORD corridor 5.49 5.65 1.03
RIGG corridor 8.77 9.86 1.12
PILOT corridor 28.10 28.24 1.00
TOMELIA couch 301.84 397.29 1.32
EKTORP couch 279.20 357.68 1.28
KLIPPAN couch 142.26 168.46 1.18
TULSTA couch 57.54 75.62 1.31
STEN cupboards 10.99 9.52 0.87
FJORD cupboards 60.94 63.44 1.04
HARPUN cupboards 38.82 49.85 1.28
SCHUMPETER DISCUSSION PAPERS 2013-005

27
IVAR cupboards 29.76 28.83 0.97
IVAR cupboards 5.81 6.17 1.06
BILLY cupboards 24.47 30.80 1.26
BENNO cupboards 21.19 30.30 1.43
LIO cupboards 19.00 25.20 1.33
BONDE cupboards 92.34 116.35 1.26
KUBUS cupboards 82.21 101.62 1.24
AKROBAT cupboards 35.71 45.51 1.27
NARTORP cupboards 63.31 75.56 1.19
KRONVIK cupboards 177.01 239.53 1.35
KRYSS cupboards 34.24 43.96 1.28
SKANDOR cupboards 52.82 81.68 1.55
ABO cupboards 143.70 170.55 1.19
NARVIK cupboards 70.76 107.72 1.52
BIALITT cupboards 46.84 50.30 1.07
FJORD cupboards 43.98 55.31 1.26
KURS cupboards 33.87 51.46 1.52
RAST cupboards 17.45 20.24 1.16
PRAGEL kitchen 35.44 30.53 0.86
EDSVIK kitchen 23.04 26.32 1.14
HAGGVINK kitchen 26.26 29.48 1.12
FACTUM kitchen 43.21 47.65 1.10
PERFECT kitchen 33.80 41.97 1.24
ANTOFINO lamp 25.20 22.46 0.89
KVINTOL lamp 13.54 13.91 1.03
TERTIAL lamp 6.35 7.00 1.10
ERBIUM lamp 17.23 19.17 1.11
NORSSKEN lamp 23.45 25.56 1.09
NORSSKEN lamp 6.46 5.12 0.79
ANTILOP nursery 6.52 7.16 1.10
GOK nursery 33.56 25.59 0.76
TROFAST nursery 41.44 53.55 1.29
TROFAST nursery 29.40 40.26 1.37
GLIS nursery 5.05 6.14 1.22
VIKARE nursery 55.01 68.84 1.25
DUKTIG nursery 4.61 3.15 0.68
DUKTIG nursery 6.41 7.79 1.21
MAMMUT nursery 5.21 6.36 1.22
PANTER nursery 7.76 9.07 1.17
MAMMUT nursery 94.61 116.37 1.23
GLIS nursery 3.26 3.85 1.18
HELMER office 28.12 32.03 1.14
EFFECTIV office 78.34 97.80 1.25
OPERATIV office 103.12 145.51 1.41
EFFECTIV office 91.76 89.29 0.97
MAXIMAL office 62.87 87.25 1.39
MAXIMAL office 64.26 87.33 1.36
SCHUMPETER DISCUSSION PAPERS 2013-005

28
TORE office 47.00 62.84 1.34
BRA office 16.33 17.98 1.10
BERTIL office 15.15 19.69 1.30
FRASSE office 9.67 11.79 1.22
ANTONIUS organizing 27.17 17.48 0.64
MOPPE organizing 6.50 7.66 1.18
LACK storage 7.35 10.72 1.46
JUSSI tables 28.44 28.16 0.99
KROKSHULT tables 56.55 80.28 1.42
TIMBRA tables 34.76 49.00 1.41
LACK tables 16.65 18.32 1.10
DRAGON textile and accessory 14.60 16.10 1.10
AGEN textile and accessory 10.15 13.86 1.37
INDEX textile and accessory 4.92 4.22 0.86
RESLIG wall decoration 8.23 11.63 1.41
NYTTJA wall decoration 2.80 2.87 1.02
HAPPEN wardrobe 21.51 20.30 0.94
KOMPLEMENT wardrobe 4.87 3.74 0.77
ASKEDAL wardrobe 87.41 107.88 1.23
VISDALEN wardrobe 139.83 187.49 1.34
BIALITT wardrobe 69.52 94.44 1.36
TROGEN wardrobe 57.20 69.75 1.22
SCHUMPETER DISCUSSION PAPERS 2013-005
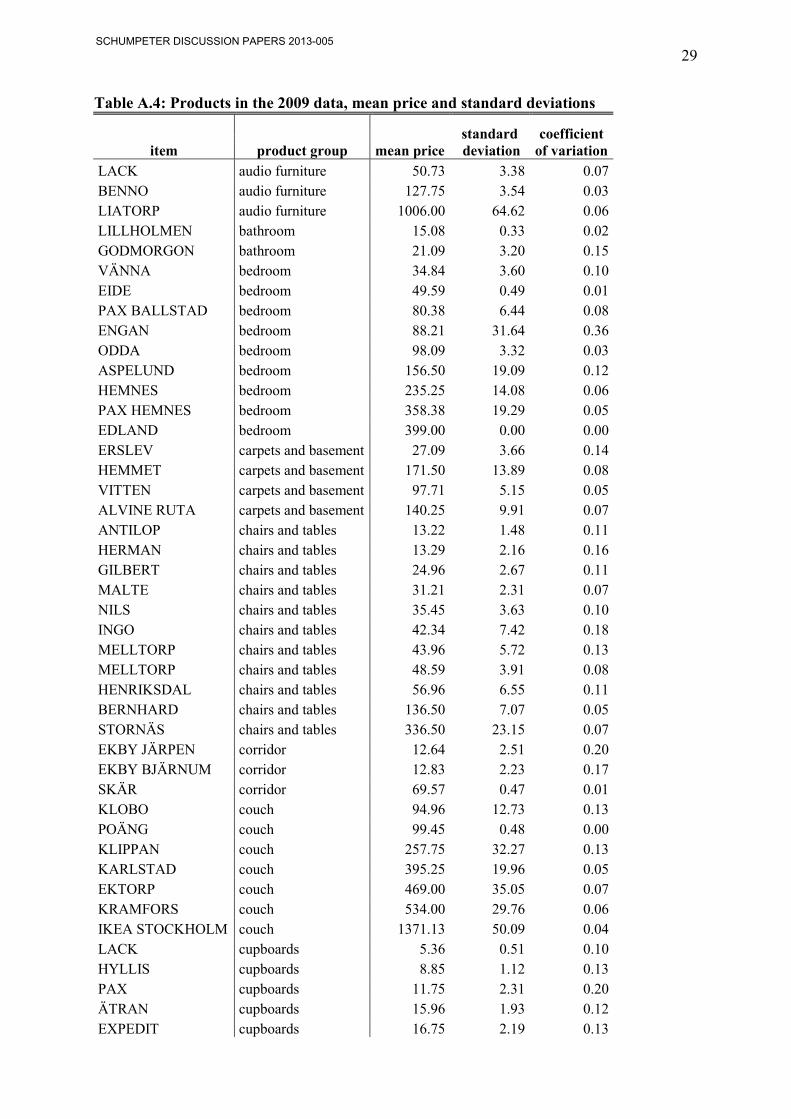
29
Table A.4: Products in the 2009 data, mean price and standard deviations
item product group mean price standard deviation
coefficient of variation
LACK audio furniture 50.73 3.38 0.07
BENNO audio furniture 127.75 3.54 0.03
LIATORP audio furniture 1006.00 64.62 0.06
LILLHOLMEN bathroom 15.08 0.33 0.02
GODMORGON bathroom 21.09 3.20 0.15
VÄNNA bedroom 34.84 3.60 0.10
EIDE bedroom 49.59 0.49 0.01
PAX BALLSTAD bedroom 80.38 6.44 0.08
ENGAN bedroom 88.21 31.64 0.36
ODDA bedroom 98.09 3.32 0.03
ASPELUND bedroom 156.50 19.09 0.12
HEMNES bedroom 235.25 14.08 0.06
PAX HEMNES bedroom 358.38 19.29 0.05
EDLAND bedroom 399.00 0.00 0.00
ERSLEV carpets and basement 27.09 3.66 0.14
HEMMET carpets and basement 171.50 13.89 0.08
VITTEN carpets and basement 97.71 5.15 0.05
ALVINE RUTA carpets and basement 140.25 9.91 0.07
ANTILOP chairs and tables 13.22 1.48 0.11
HERMAN chairs and tables 13.29 2.16 0.16
GILBERT chairs and tables 24.96 2.67 0.11
MALTE chairs and tables 31.21 2.31 0.07
NILS chairs and tables 35.45 3.63 0.10
INGO chairs and tables 42.34 7.42 0.18
MELLTORP chairs and tables 43.96 5.72 0.13
MELLTORP chairs and tables 48.59 3.91 0.08
HENRIKSDAL chairs and tables 56.96 6.55 0.11
BERNHARD chairs and tables 136.50 7.07 0.05
STORNÄS chairs and tables 336.50 23.15 0.07
EKBY JÄRPEN corridor 12.64 2.51 0.20
EKBY BJÄRNUM corridor 12.83 2.23 0.17
SKÄR corridor 69.57 0.47 0.01
KLOBO couch 94.96 12.73 0.13
POÄNG couch 99.45 0.48 0.00
KLIPPAN couch 257.75 32.27 0.13
KARLSTAD couch 395.25 19.96 0.05
EKTORP couch 469.00 35.05 0.07
KRAMFORS couch 534.00 29.76 0.06
IKEA STOCKHOLM couch 1371.13 50.09 0.04
LACK cupboards 5.36 0.51 0.10
HYLLIS cupboards 8.85 1.12 0.13
PAX cupboards 11.75 2.31 0.20
ÄTRAN cupboards 15.96 1.93 0.12
EXPEDIT cupboards 16.75 2.19 0.13
SCHUMPETER DISCUSSION PAPERS 2013-005

30
LERBERG cupboards 17.39 2.35 0.13
LACK cupboards 20.20 2.19 0.11
BILLY cupboards 20.56 2.84 0.14
UDDEN cupboards 22.48 4.57 0.20
EXPEDIT cupboards 26.63 2.26 0.09
BILLY cupboards 27.24 2.18 0.08
BILLY BYOM cupboards 28.38 2.13 0.08
BILLY cupboards 36.87 2.04 0.06
EXPEDIT cupboards 58.95 5.60 0.09
LACK cupboards 99.45 11.85 0.12
EXPEDIT cupboards 139.75 16.35 0.12
MARKÖR cupboards 271.50 13.89 0.05
RINGSKÄR kitchen 90.84 7.96 0.09
UDDEN kitchen 98.36 10.77 0.11
RATIONELL kitchen 111.25 22.00 0.20
OXSKÄR kitchen 221.00 17.34 0.08
STORNÄS kitchen 315.25 23.26 0.07
DATID OV10 kitchen 423.50 58.57 0.14
NUTID HF560 kitchen 631.00 38.59 0.06
KVART lamp 16.34 1.30 0.08
ARSTID lamp 19.21 1.99 0.10
GRUNDTAL lamp 19.34 1.77 0.09
FORSA lamp 19.71 0.71 0.04
JANSJÖ lamp 46.71 4.50 0.10
IKEA 365+ BRASA lamp 49.71 0.44 0.01
DIODER lamp 57.08 4.42 0.08
MAMMUT nursery 19.96 0.02 0.00
JULES nursery 41.69 3.79 0.09
HENSVIK nursery 64.07 4.94 0.08
HENSVIK nursery 80.94 3.64 0.05
HENSVIK nursery 93.21 14.85 0.16
MAMMUT nursery 99.46 0.49 0.00
HENSVIK nursery 109.23 8.99 0.08
MAMMUT nursery 111.11 41.56 0.37
LEKSVIK nursery 112.98 20.37 0.18
LEKSVIK nursery 116.23 21.00 0.18
LEKSVIK nursery 141.50 7.07 0.05
MAMMUT nursery 146.50 12.82 0.09
LEKSVIK nursery 202.25 10.90 0.05
ANDY office 19.60 0.50 0.03
DAVE office 20.83 3.76 0.18
SNILLE office 21.13 1.97 0.09
KOLON office 23.71 5.18 0.22
MIKAEL office 37.09 6.94 0.19
JULES office 59.57 5.60 0.09
SMADAL office 64.57 5.48 0.08
ASPVIK office 79.57 0.47 0.01
SCHUMPETER DISCUSSION PAPERS 2013-005

31
VIKA AMON office 83.86 11.36 0.14
FREDERIK office 94.46 5.12 0.05
ALEX office 99.46 0.49 0.00
GALANT office 137.25 8.38 0.06
KOMPLEMENT organizing 7.68 1.44 0.19
KASSETT organizing 7.74 1.31 0.17
BENNO organizing 36.33 3.50 0.10
KOMPLEMENT storage 20.37 1.92 0.09
LACK tables 6.73 1.98 0.29
RÖRBERG tables 57.18 4.59 0.08
KLUBBO tables 76.95 7.27 0.09
VEJMON tables 151.50 7.07 0.05
MARKÖR tables 157.75 6.41 0.04
LUPIN textile and accessory 10.79 1.26 0.12
RATIONELL textile and accessory 21.09 2.80 0.13
IKEA STOCKHOLM textile and accessory 26.71 2.44 0.09
BIGARRA textile and accessory 28.70 2.31 0.08
RIBBA wall decoration 10.24 1.16 0.11
SLÄTTHULT wall decoration 10.86 1.79 0.17
IKEA PS wall decoration 31.84 3.72 0.12
SKÄR wardrobe 98.21 3.37 0.03
SCHUMPETER DISCUSSION PAPERS 2013-005