science and the university: challenges for research paula stephan andrew young school georgia state...
TRANSCRIPT

Science and the University: Challenges for Research
Paula StephanAndrew Young School
Georgia State University & NBERPecs 2009

Background
Science has long played a critical role in the life of the university.
While much remains the same in this relationship, certain dimensions are changing
Talk about three of these today; in process talk about consequences for university as well as questions of research interest for those interested in higher education and economics of science

Three Changes
Increased incentives to publish Changes in the reward system Increased reliance by governments
and communities on universities and institutes as a source of economic growth

First Change: Increased Incentives to Publish
Occurs at both the system level and at the individual level
Budgets of universities and departments in many countries depend increasingly on publication and citation counts.
Funding for research of individual scientists depends increasingly on publication track record.
Bonus payments based on publications.

Examples
UK—ranking of departments and allocation of funds based in part on publications and citations. (Research Assessment Exercise).
Australia—funding of departments based in part on publications/citations.
Netherlands publications key in determining reputation of department – do not figure directly in resource allocation.
Chinese researchers who place in top half of colleagues in terms of bibliometric measures can earn three to four times salaries of co-workers. Some institutes pay cash bonus for publishing in Science, Nature or Cell. Magnitude is in $14,000 range.
Korea—publishing in a top journal can be accompanied by a bonus of up to $100,000.
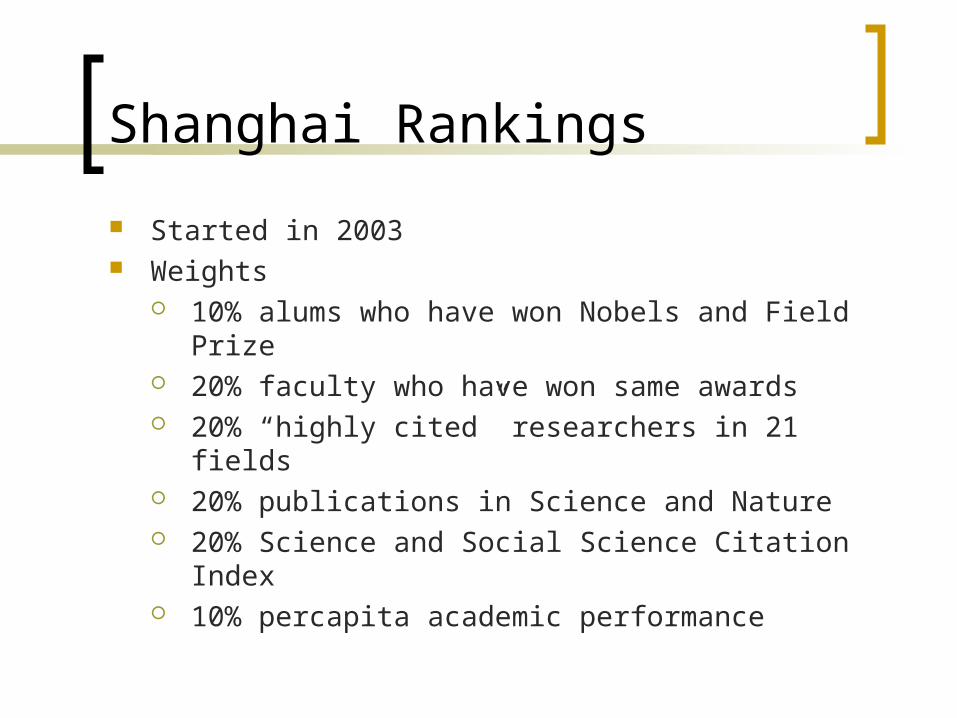
Shanghai Rankings
Started in 2003 Weights
10% alums who have won Nobels and Field Prize
20% faculty who have won same awards 20% “highly cited” researchers in 21 fields 20% publications in Science and Nature 20% Science and Social Science Citation Index 10% percapita academic performance

Examples continued…
U.S.: publishing record key in getting research funds In medical schools funding crucial for
salary: 35% tenure has no guarantee of salary; 39% a salary is guaranteed that is less than the “total.”
59% of faculty at medical schools eligible for “bonus” pay

Consequences: Publication strategy of faculty is changing
Where to submit Who to co-author with How many to co-author with How to “carve” up a piece of
research—lpu’s Whether to engage in “gift-giving”
Chinese example

Another reason for trends in authorship
Increase in collaboration and number of coauthors likely related to these changing incentives

Evidence Concerning Teams
Figure 4--Mean Number of Authors per Paper, for PapersWith at Least One Author In the Top 110 U.S. Universities, 1981-1999:
Adams et al 2002
2.40
2.80
3.20
3.60
4.00
4.40
81 84 87 90 93 96 99
Year
Aut
hors
Per
Pap
er

Consequences: labor market
Market for stars (especially just before the evaluation of departments and programs) is fierce. “Just in time” hiring. Between 2002 & 2006 number of faculty earning
more than l00,000 pounds in UK grew by 169% Age distribution of faculty changing: emphasis
(at least in U.S.) is on hiring senior faculty at expense of younger researchers.
Senior faculty (with their records) have ability to bring in larger grants and thus offset some of the growing research costs.

Tenure Track Biomedical Faculty by Age
0
5,000
10,000
15,000
20,000
25,000
30,000
35,000
1993 1995 1997 1999 2001 2003
G 55
51-55
46-50
41-45
35-40
LE 35
Stephan Georgia State UniversitySource: Survey of Doctorate Recipients, NSF. The use of NSF data does not imply NSF endorsement of the research methods or conclusions contained in this report.

DISTRIBUTION OF INVESTIGATOR AGES
NIH Competing R01 Equivalent Awardees
6.4% 6.4% 6.2% 4.8% 4.0% 3.8% 4.5% 3.5% 3.8%
18.4% 17.1% 16.5% 15.6% 14.1% 13.8% 13.0% 13.1% 12.9%
24.9% 23.9% 24.6% 23.1%22.4%
21.4% 21.7% 20.9% 20.0% 20.1% 19.6%
20.8% 20.3% 20.3%20.5%
21.4%22.1% 21.7% 21.7% 21.1% 21.1% 22.2%
14.6% 15.2% 14.6% 15.7% 16.4%16.6% 16.3% 16.0% 17.4% 18.1% 18.2%
14.5% 15.8% 17.0% 17.9% 19.6% 21.7% 22.7% 23.9% 24.9% 27.5% 27.6%
3.4%6.2%
12.0%19.0%
1995 1996 1997 1998 1999 2000 2001 2002 2003 2004 2005
Fiscal Year
Per
cen
t o
f To
tal
35 and Younger 36 - 40 41 - 45 46 - 50 51 - 55 Over 55
NIH, OER for AIRI

Consequences for Young
Increased emphasis on graduate students/postdocs and “temporary” workers staff faculty research labs See in postdoc data in the U.S. See in habilitation data in Germany

In U.S.
30,000 postdoctorates in 2001, up from 23,000 in 1991 (30%)
Ratio postdocs/tenured faculty positions grew from .54 to .77 between 1987-1999 (43% increase).
And most think that there is a serious undercount issue—probably as high as 50,000

In Germany--Habilitationen
1992 approximately 1300 Habilitationen per year
2004—grown to 2200 per year. In terms of Habilitationen per 100
professors, there has been more than a 66% increase (Schulze and Warning)

Consequences
Certain journals (Science, Nature, Cell) are experiencing an increase in number of submissions.
Number of journals is growing; Need for referees is growing. Problems recruiting referees: Journals
(and funding agencies) report a “shortage” of knowledgeable reviewers.
Consequence: Change in distribution of output across countries
Major news in 2004 (front page headlines in the New York Times) was decline in article counts by U.S. scientists and engineers.
9% decline between 1992 and 1999. Hicks (and others) have argued that decline
relates to changing incentive structure: U.S. scientists now face considerably more competition than in the past as incentives to publish have grown outside U.S.
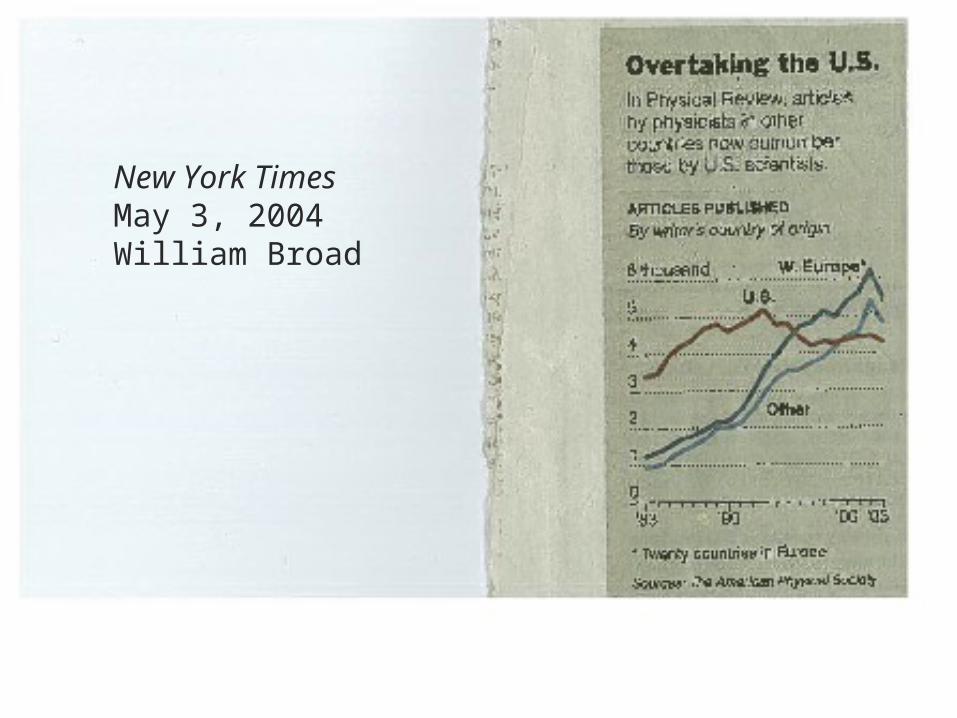
New York TimesMay 3, 2004William Broad

Source Links:Source data
Close window
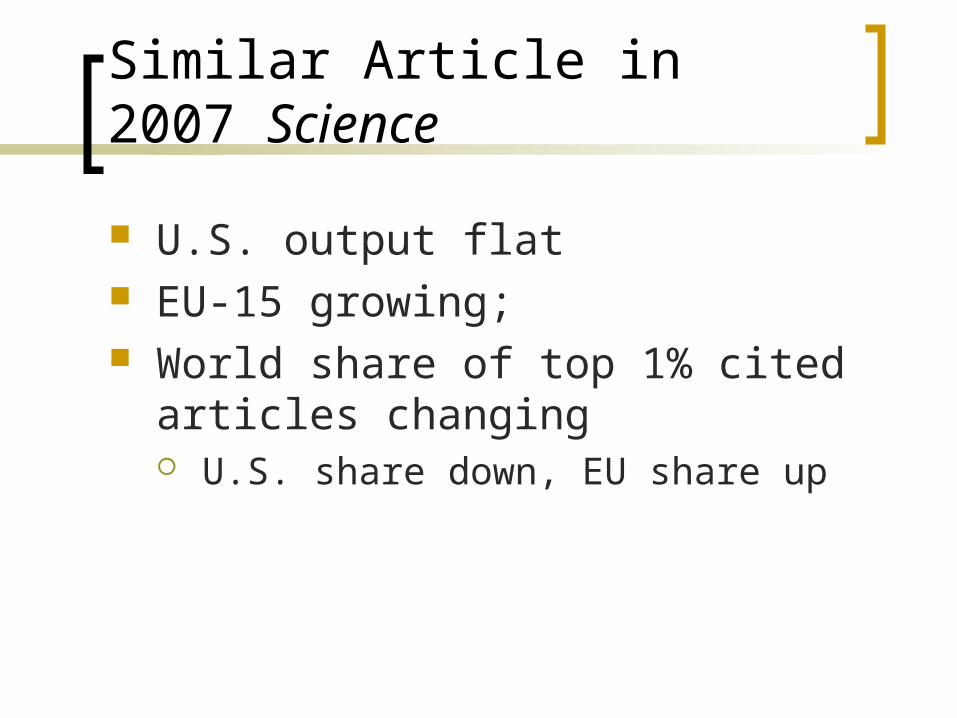
Similar Article in 2007 Science
U.S. output flat EU-15 growing; World share of top 1% cited articles
changing U.S. share down, EU share up

Changing incentives to publish
90
95
100
105
110
115
120
125
130
2003 2004 2005 2006 2007
USA
EUROPE
EAST ASIA
JAPAN
OTHER
Research questions
Observations are hypotheses supported by anecdotal evidence
Need for systematic research Submission records for journals; how
composition relates to changes in incentives Hiring analysis—how important is “just-in-time”
hiring; how much has age distribution changed Analysis of referee recruitment How are universities evaluating co-authorship?

Second: Change in reward system for university scientists
Earnings profiles of university scientists have been quite flat. (Average salary of full professor 70% more than assistant in physics and life sciences--Ehrenberg)
Shape arguably relates to monitoring problems and need to compensate scientists for risky nature of work.
Flat profile einforced in countries where scientists are civil-service employees.

Scientists increasingly have opportunities to enhance salaries
Consultants to industry Royalty payments Start-up companies Serving on a Scientific Advisory
Boards Plus emphasis on publishing by
universities leads to higher pay for extremely productive scientists.
Royalty payments
Faculty increasingly “disclose”: Thursby and Thursby find that 10% of U.S. faculty at top universities disclosed to their university.
Not all disclosures are patented, of course, but many are.
Common for faculty to patent in Europe; difficult to count because in cases of professor privilege not attributed to the university.
Most patents produce modest royalties at best; in some cases they produce substantial sums; rare cases extraordinary sums.

Royalty continued
U.S. annual royalty payments received by universities went from $195 to $1,715 million during 1993-2007.
Faculty receive a portion: varies across universities as to percent 50% receive a flat rate; average is 41% Other 50% use a regressive formula; starts
at high percent; average over $1 million is 31%.

Blockbuster patents
Cohen-Boyer first “big” patent in 1980. Inventors’ shares about $85 million
July 2005 Gilead Sciences, Inc. and Royalty Pharma bought Emory’s royalty interest in emtricitabine, also known as Emtriva® used in treatment of HIV for $525 million in cash Prior to deal, Emory had been receiving royalty income since licensing
the drug in 1996 3 Emory scientists involved: Dr. Dennis C. Liotta, Dr.
Raymond Schinazi and Dr. Woo-Baeg Choi Emory’s intellectual property policy in effect at the time
awards something like 40% of the amount to the three inventors.

Northwestern
Similar deal; receive $700 million in 2007 for a drug
Two inventors get 25% according to Northwester policy
Silverman (one of the inventors) has given an undisclosed amount for a building at Northwestern.

NYU
Similar arrangement with Royalty Pharma
$650 million Two university inventors Vilcek (one of the inventors) just made
gift of $105 million to NYU

Scope
On more than half research-intensive campuses in the U.S. there are a handful of faculty who earn more than their salary each year from royalties.
For every one of these there are 13 times as many faculty who have patented and have hopes that they, too, may reap such large rewards

Do they do it for money?
Cohen, Sauermann & Stephan’s research using SDR
Collects information on motives: challenge, contribute to society, money, advancement
For life scientists, contribution to society predicts patenting; for physical scientists, the predictor is interest in money; for engineers it is advancement and challenge.
Recent studies of German scientists find somewhat similar results—money not key motive.

Start-up companies
Some faculty involved in start-up companies Greatest rewards come when company goes
public. Extreme examples:
Eric Brewer—computer scientist at UC Berkeley listed on Fortune magazine’s list of 40 richest Americans under 40 in 1999 with net worth of $800 million from company he founded that went public.
Robert Tjian, the new President of Howard Hughes Medical Institute, received millions in 2004 when Tularik, a company he co-founded when he was a faculty member at University of California Berkeley, was sold to Amgen for $1.3 billion
Start-ups continued
Murray and coauthors document that faculty involved in initial public offerings in biotechnology capture over $5 million in form of equities.
Stephan and Everhart find similar but slightly lower values for initial public offerings during 1991-1992 period ($3 to $4 million median)
Scientific Advisory Boards (SABs)
Incidence of serving on one is non-trivial Murray and coauthors identify 785 scientists
who are members of one or more boards. Stephan and Everhart find 420 university
scientists working with 52 biotech firms that made an initial public offering in early 1990s.
Bonus Pay
When grants and publishing are important, universities sometimes adopt bonus pay Examples already given for publishing In U.S. medical schools 59% of basic
science faculty are eligible for bonus pay; 20% actually received it according to a 2005 survey

Faculty Assuming More Risk, as well as receiving higher pay
Tenure, at least in U.S. no longer always equates with financial security 35% of basic science faculty at U.S.
medical institutions in tenured positions have positions that come with no financial guarantee
36% guarantee some base salary

Reasons for change in reward structure
Research opportunities are changing—opportunities to work in “Pasteur’s Quadrant” where one can do “dual research” that is both “use inspired” and inspired by quest for fundamental knowledge.
Laws are changing—Bayh Dole in the U.S., along with court decisions such as Diamond v. Chakrabarty (1980)
Industry support of faculty research growing Funding from grants is more volatile Expectations of community are changing.

Change in reward structure has consequences
For research Access to materials and information
For education of students

Access to research materials
19% percent of material requests made by Cohen et al sample were denied.
Competition among researchers played major role in refusal.
Cost of providing the material also important.
Whether the material in question was a drug or whether the potential supplier had a history of commercial activity were also relevant factors in refusal.
Access to information
Research suggests that process of technology transfer can delay speed with which faculty publish and willingness to talk openly about research. (Blumenthal et al. )

Anticommons
Multiple property rights—sometimes in the 100’s (as in case of genes) can dampen research by requiring researchers to bargain across multiple players to gain access to foundational, upstream discoveries (Heller and Eisenberg).

Consequences for Students
Changing nature can have positive effects: Faculty involvement with industry can
provide job opportunities Faculty involvement with industry can
create research opportunities and influence curriculum.

Consequences for students…
Changing nature of reward system can also have negative impact on students Credit for innovation/conflict with faculty? Peer learning: considerable evidence students
learn from students. Faculty focus on patenting can inhibit peer learning.
Example: PI tells an undergraduate that for patent purposes she should not identify the compound. “Oh, I know that. In the lab I worked in last summer we didn’t talk about anything!”
Research Questions
Some of these consequences have been investigated already—such as access to information and cell lines
But other questions remain wide open such as Changes in the shape the earnings profile Change in distribution of faculty
earnings/rewards; Degree to which technology transfer affects peer
learning

Three: Increased emphasis on universities as a source of growth
Considerable evidence that science is a source of economic growth (Adams)
Also evidence that knowledge spillovers are geographically bounded (Jaffe; Acs, Audretch, Feldman).
Has led governments and communities to invest in universities with expectations that they will create more Silicon Valleys and Route 128’s

Examples
News from Texas August 2006 was that the state had decided to invest $2.5 billion for science teaching and research in the University of Texas system.
Primary focus building research capacity at San Antonio, El Paso and Arlington.
Goal: turn these into next Austin.

Texas not alone
University of California system built new campus at Merced
State biotech initiatives Many examples in Europe Outside of Europe as well—Singapore
is a case in point. Building frenzy in U.S. in response to
opportunities in life science research

New Construction
NSF reports greatest number of institutions began construction in fields of biological and medical sciences in FY2002 or FY2003.
56% of newly constructed space to be used for these 2 fields

S&E Research Space: Academic Institutions
0
5
10
15
20
25
30
35
40
1988 1990 1992 1994 1996 1998 1999 2001 2003
Year
Net
Ass
ign
able
Sq
. Ft.
(m
illio
ns)
Agricultural sciences
Biological sciences
Computer sciences
Earth and Ocean
Engineering
Mathematics
Medical sciences
Physical sciences
Consequences
Competition for stars Building of facilities that university may not
be able to pay for: fallacy of composition. Over promised? Can universities deliver the
level of regional economic growth that the public is anticipating?
Will this affect ability of universities to garner resources in the future?
Consequences…
Possibility exists that states (and nations) have overreacted in belief that centers of knowledge excellence lead to local economic development.
Time horizon is definitely too short: Adams finds extremely long lags between research and economic growth.
Research Questions
Need for more than anecdotal evidence regarding the local growth story
Need for more than spillover research Need to create systematic databases to
track the economic development associated with these initiatives; how much is “local” vs. national vs. international
Need to follow some of these initiatives for a considerable period of time to see consequences in relationship to costs

Summary: Identified Three Changes
Increased incentives to publish Changes in the reward system Increased reliance by governments
and communities on universities and institutes as a source of economic growth
Consequences include
Changes in hiring practices Changes in opportunities for younger
researchers Changes in availability of materials and
information used in research Changes in peer learning environment Changes in publication practices Change in public expectations regarding
what science can contribute to local economy

Research questions include
How changing incentives affect co-authorship patterns; submission behavior; referee behavior
How changing practices in compensation affect shape of earnings profiles
Degree to which distribution of faculty salaries is changing—the market for stars
Challenge for Researchers
Need to investigate these changes systematically
Guide the collection of data that will facilitate this
