science article.pdf
TRANSCRIPT
Seediscussions,stats,andauthorprofilesforthispublicationat:https://www.researchgate.net/publication/262876332
SlowingAmazonDeforestationThroughPublicPolicyandInterventionsinBeefandSoySupplyChains
ARTICLEinSCIENCE·JUNE2014
ImpactFactor:33.61·DOI:10.1126/science.1248525
CITATIONS
70
READS
341
17AUTHORS,INCLUDING:
DavidGMcGrath
WoodsHoleResearchCenter
51PUBLICATIONS1,191CITATIONS
SEEPROFILE
EricArmijo
UniversidadAutónomaGabrielRenéMoreno
6PUBLICATIONS389CITATIONS
SEEPROFILE
PauloMBrando
WoodsHoleResearchCenter-IPAM
54PUBLICATIONS1,936CITATIONS
SEEPROFILE
OswaldoDeCarvalhoJr.
AmazonEnvironmentalResearchInstitute(I…
9PUBLICATIONS287CITATIONS
SEEPROFILE
Availablefrom:MariaDiGiano
Retrievedon:18January2016
DOI: 10.1126/science.1248525, 1118 (2014);344 Science
et al.Daniel Nepstadinterventions in beef and soy supply chainsSlowing Amazon deforestation through public policy and
This copy is for your personal, non-commercial use only.
clicking here.colleagues, clients, or customers by , you can order high-quality copies for yourIf you wish to distribute this article to others
here.following the guidelines
can be obtained byPermission to republish or repurpose articles or portions of articles
): June 5, 2014 www.sciencemag.org (this information is current as of
The following resources related to this article are available online at
http://www.sciencemag.org/content/344/6188/1118.full.htmlversion of this article at:
including high-resolution figures, can be found in the onlineUpdated information and services,
http://www.sciencemag.org/content/suppl/2014/06/04/344.6188.1118.DC1.html can be found at: Supporting Online Material
http://www.sciencemag.org/content/344/6188/1118.full.html#relatedfound at:
can berelated to this article A list of selected additional articles on the Science Web sites
http://www.sciencemag.org/content/344/6188/1118.full.html#ref-list-1, 18 of which can be accessed free:cites 40 articlesThis article
http://www.sciencemag.org/cgi/collection/sci_policyScience and Policy
http://www.sciencemag.org/cgi/collection/ecologyEcology
subject collections:This article appears in the following
registered trademark of AAAS. is aScience2014 by the American Association for the Advancement of Science; all rights reserved. The title
CopyrightAmerican Association for the Advancement of Science, 1200 New York Avenue NW, Washington, DC 20005. (print ISSN 0036-8075; online ISSN 1095-9203) is published weekly, except the last week in December, by theScience
on
June
5, 2
014
ww
w.s
cien
cem
ag.o
rgD
ownl
oade
d fr
om
on
June
5, 2
014
ww
w.s
cien
cem
ag.o
rgD
ownl
oade
d fr
om
on
June
5, 2
014
ww
w.s
cien
cem
ag.o
rgD
ownl
oade
d fr
om
on
June
5, 2
014
ww
w.s
cien
cem
ag.o
rgD
ownl
oade
d fr
om
on
June
5, 2
014
ww
w.s
cien
cem
ag.o
rgD
ownl
oade
d fr
om
on
June
5, 2
014
ww
w.s
cien
cem
ag.o
rgD
ownl
oade
d fr
om
on
June
5, 2
014
ww
w.s
cien
cem
ag.o
rgD
ownl
oade
d fr
om
REVIEW
Slowing Amazon deforestation throughpublic policy and interventions in beefand soy supply chainsDaniel Nepstad,1* David McGrath,1,2 Claudia Stickler,1 Ane Alencar,3 Andrea Azevedo,3
Briana Swette,1 Tathiana Bezerra,1 Maria DiGiano,1 João Shimada,1
Ronaldo Seroa da Motta,4 Eric Armijo,1 Leandro Castello,5 Paulo Brando,3,6
Matt C. Hansen,7 Max McGrath-Horn,1 Oswaldo Carvalho,1 Laura Hess8
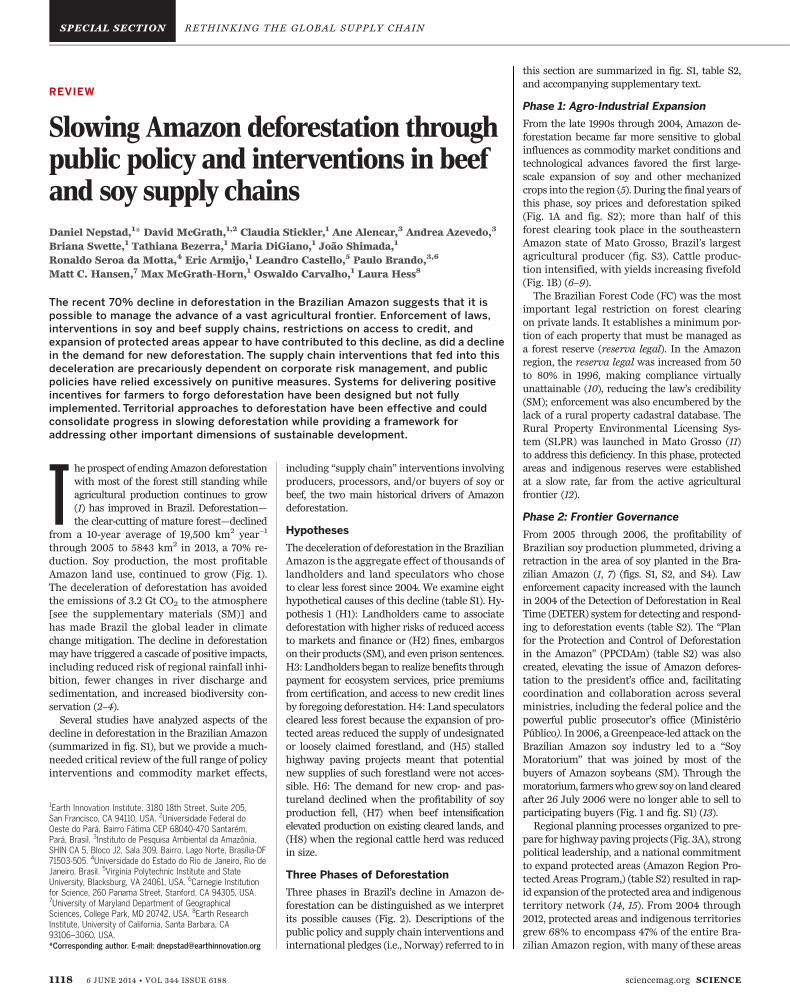
The recent 70% decline in deforestation in the Brazilian Amazon suggests that it ispossible to manage the advance of a vast agricultural frontier. Enforcement of laws,interventions in soy and beef supply chains, restrictions on access to credit, andexpansion of protected areas appear to have contributed to this decline, as did a declinein the demand for new deforestation. The supply chain interventions that fed into thisdeceleration are precariously dependent on corporate risk management, and publicpolicies have relied excessively on punitive measures. Systems for delivering positiveincentives for farmers to forgo deforestation have been designed but not fullyimplemented. Territorial approaches to deforestation have been effective and couldconsolidate progress in slowing deforestation while providing a framework foraddressing other important dimensions of sustainable development.
Theprospect of endingAmazondeforestationwith most of the forest still standing whileagricultural production continues to grow(1) has improved in Brazil. Deforestation—the clear-cutting of mature forest—declined
from a 10-year average of 19,500 km2 year−1
through 2005 to 5843 km2 in 2013, a 70% re-duction. Soy production, the most profitableAmazon land use, continued to grow (Fig. 1).The deceleration of deforestation has avoidedthe emissions of 3.2 Gt CO2 to the atmosphere[see the supplementary materials (SM)] andhas made Brazil the global leader in climatechange mitigation. The decline in deforestationmay have triggered a cascade of positive impacts,including reduced risk of regional rainfall inhi-bition, fewer changes in river discharge andsedimentation, and increased biodiversity con-servation (2–4).Several studies have analyzed aspects of the
decline in deforestation in the Brazilian Amazon(summarized in fig. S1), but we provide a much-needed critical review of the full range of policyinterventions and commodity market effects,
including “supply chain” interventions involvingproducers, processors, and/or buyers of soy orbeef, the two main historical drivers of Amazondeforestation.
Hypotheses
The deceleration of deforestation in the BrazilianAmazon is the aggregate effect of thousands oflandholders and land speculators who choseto clear less forest since 2004. We examine eighthypothetical causes of this decline (table S1). Hy-pothesis 1 (H1): Landholders came to associatedeforestation with higher risks of reduced accessto markets and finance or (H2) fines, embargoson their products (SM), and evenprison sentences.H3: Landholders began to realize benefits throughpayment for ecosystem services, price premiumsfrom certification, and access to new credit linesby foregoing deforestation. H4: Land speculatorscleared less forest because the expansion of pro-tected areas reduced the supply of undesignatedor loosely claimed forestland, and (H5) stalledhighway paving projects meant that potentialnew supplies of such forestland were not acces-sible. H6: The demand for new crop- and pas-tureland declined when the profitability of soyproduction fell, (H7) when beef intensificationelevated production on existing cleared lands, and(H8) when the regional cattle herd was reducedin size.
Three Phases of Deforestation
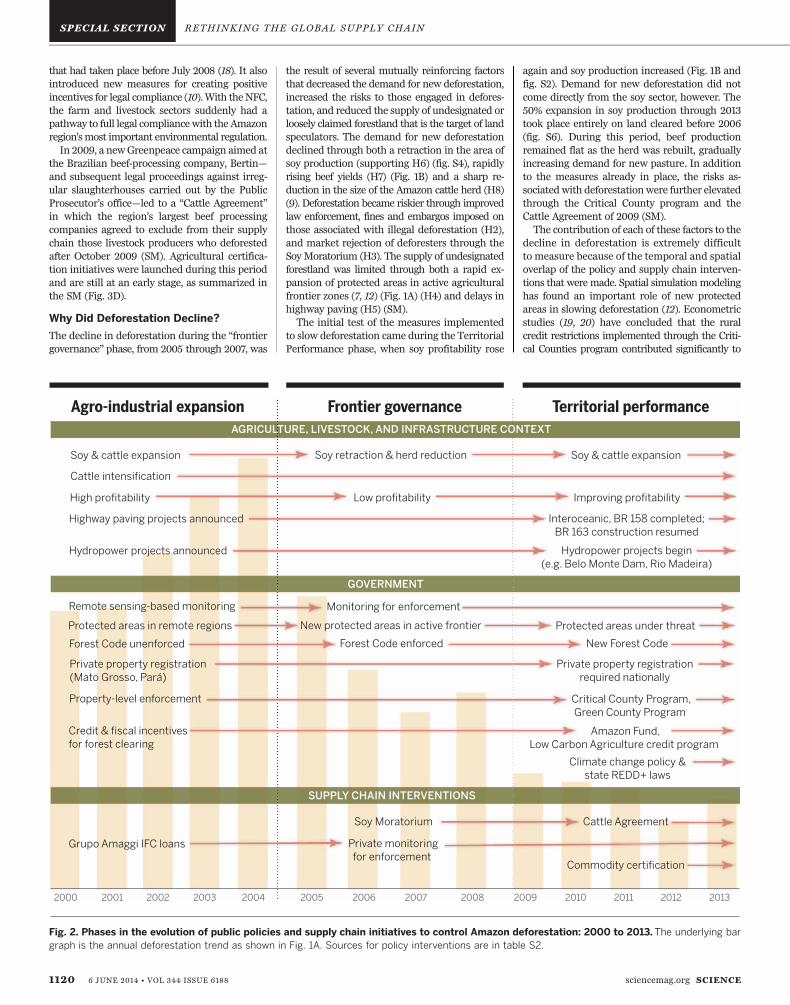
Three phases in Brazil’s decline in Amazon de-forestation can be distinguished as we interpretits possible causes (Fig. 2). Descriptions of thepublic policy and supply chain interventions andinternational pledges (i.e., Norway) referred to in
this section are summarized in fig. S1, table S2,and accompanying supplementary text.
Phase 1: Agro-Industrial Expansion
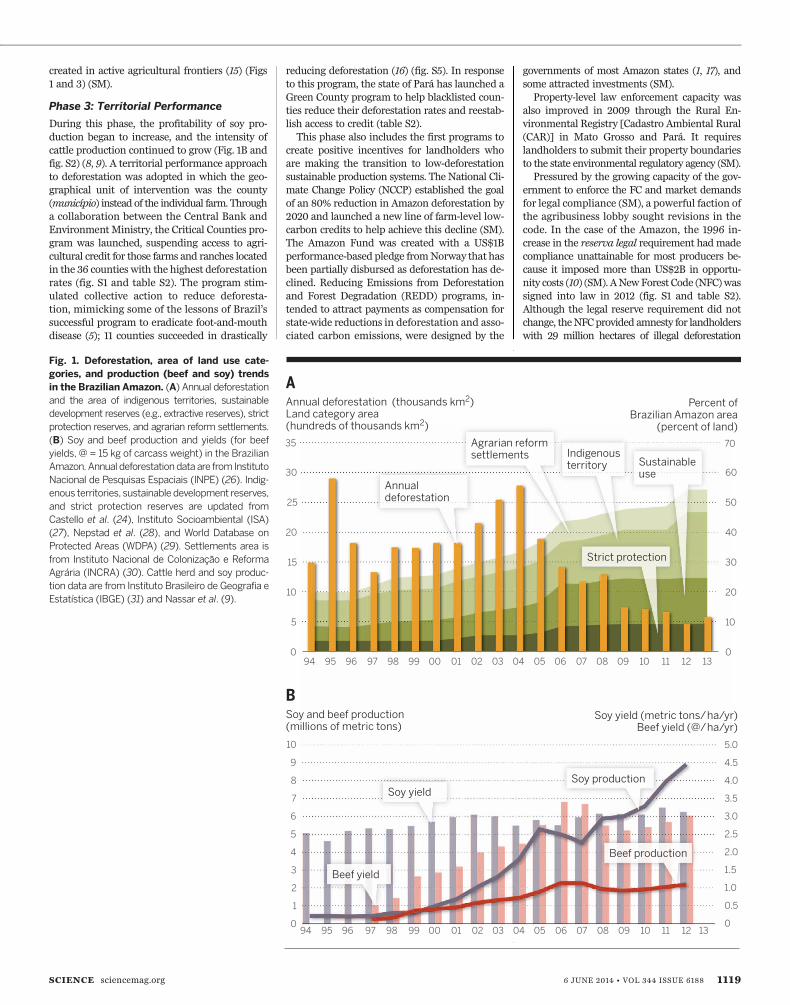
From the late 1990s through 2004, Amazon de-forestation became far more sensitive to globalinfluences as commodity market conditions andtechnological advances favored the first large-scale expansion of soy and other mechanizedcrops into the region (5). During the final years ofthis phase, soy prices and deforestation spiked(Fig. 1A and fig. S2); more than half of thisforest clearing took place in the southeasternAmazon state of Mato Grosso, Brazil’s largestagricultural producer (fig. S3). Cattle produc-tion intensified, with yields increasing fivefold(Fig. 1B) (6–9).The Brazilian Forest Code (FC) was the most
important legal restriction on forest clearingon private lands. It establishes a minimum por-tion of each property that must be managed asa forest reserve (reserva legal). In the Amazonregion, the reserva legal was increased from 50to 80% in 1996, making compliance virtuallyunattainable (10), reducing the law’s credibility(SM); enforcement was also encumbered by thelack of a rural property cadastral database. TheRural Property Environmental Licensing Sys-tem (SLPR) was launched in Mato Grosso (11)to address this deficiency. In this phase, protectedareas and indigenous reserves were establishedat a slow rate, far from the active agriculturalfrontier (12).
Phase 2: Frontier Governance
From 2005 through 2006, the profitability ofBrazilian soy production plummeted, driving aretraction in the area of soy planted in the Bra-zilian Amazon (1, 7) (figs. S1, S2, and S4). Lawenforcement capacity increased with the launchin 2004 of the Detection of Deforestation in RealTime (DETER) system for detecting and respond-ing to deforestation events (table S2). The “Planfor the Protection and Control of Deforestationin the Amazon” (PPCDAm) (table S2) was alsocreated, elevating the issue of Amazon defores-tation to the president’s office and, facilitatingcoordination and collaboration across severalministries, including the federal police and thepowerful public prosecutor’s office (MinistérioPúblico). In 2006, a Greenpeace-led attack on theBrazilian Amazon soy industry led to a “SoyMoratorium” that was joined by most of thebuyers of Amazon soybeans (SM). Through themoratorium, farmerswhogrewsoyon land clearedafter 26 July 2006 were no longer able to sell toparticipating buyers (Fig. 1 and fig. S1) (13).Regional planning processes organized to pre-
pare for highwaypaving projects (Fig. 3A), strongpolitical leadership, and a national commitmentto expand protected areas (Amazon Region Pro-tected Areas Program,) (table S2) resulted in rap-id expansion of the protected area and indigenousterritory network (14, 15). From 2004 through2012, protected areas and indigenous territoriesgrew 68% to encompass 47% of the entire Bra-zilian Amazon region, with many of these areas
1Earth Innovation Institute, 3180 18th Street, Suite 205,San Francisco, CA 94110, USA. 2Universidade Federal doOeste do Pará, Bairro Fátima CEP 68040-470 Santarém,Pará, Brasil. 3Instituto de Pesquisa Ambiental da Amazônia,SHIN CA 5, Bloco J2, Sala 309, Bairro, Lago Norte, Brasília-DF71503-505. 4Universidade do Estado do Rio de Janeiro, Rio deJaneiro, Brasil. 5Virginia Polytechnic Institute and StateUniversity, Blacksburg, VA 24061, USA. 6Carnegie Institutionfor Science, 260 Panama Street, Stanford, CA 94305, USA.7University of Maryland Department of GeographicalSciences, College Park, MD 20742, USA. 8Earth ResearchInstitute, University of California, Santa Barbara, CA93106–3060, USA.*Corresponding author. E-mail: [email protected]
1118 6 JUNE 2014 • VOL 344 ISSUE 6188 sciencemag.org SCIENCE
created in active agricultural frontiers (15) (Figs1 and 3) (SM).
Phase 3: Territorial Performance
During this phase, the profitability of soy pro-duction began to increase, and the intensity ofcattle production continued to grow (Fig. 1B andfig. S2) (8, 9). A territorial performance approachto deforestation was adopted in which the geo-graphical unit of intervention was the county(município) instead of the individual farm. Througha collaboration between the Central Bank andEnvironmentMinistry, the Critical Counties pro-gram was launched, suspending access to agri-cultural credit for those farms and ranches locatedin the 36 counties with the highest deforestationrates (fig. S1 and table S2). The program stim-ulated collective action to reduce deforesta-tion, mimicking some of the lessons of Brazil’ssuccessful program to eradicate foot-and-mouthdisease (5); 11 counties succeeded in drastically
reducing deforestation (16) (fig. S5). In responseto this program, the state of Pará has launched aGreen County program to help blacklisted coun-ties reduce their deforestation rates and reestab-lish access to credit (table S2).This phase also includes the first programs to
create positive incentives for landholders whoare making the transition to low-deforestationsustainable production systems. The National Cli-mate Change Policy (NCCP) established the goalof an 80% reduction in Amazon deforestation by2020 and launched a new line of farm-level low-carbon credits to help achieve this decline (SM).The Amazon Fund was created with a US$1Bperformance-based pledge fromNorway that hasbeen partially disbursed as deforestation has de-clined. Reducing Emissions from Deforestationand Forest Degradation (REDD) programs, in-tended to attract payments as compensation forstate-wide reductions in deforestation and asso-ciated carbon emissions, were designed by the
governments of most Amazon states (1, 17), andsome attracted investments (SM).Property-level law enforcement capacity was
also improved in 2009 through the Rural En-vironmental Registry [Cadastro Ambiental Rural(CAR)] in Mato Grosso and Pará. It requireslandholders to submit their property boundariesto the state environmental regulatory agency (SM).Pressured by the growing capacity of the gov-
ernment to enforce the FC and market demandsfor legal compliance (SM), a powerful faction ofthe agribusiness lobby sought revisions in thecode. In the case of the Amazon, the 1996 in-crease in the reserva legal requirement hadmadecompliance unattainable for most producers be-cause it imposed more than US$2B in opportu-nity costs (10) (SM). ANewForest Code (NFC)wassigned into law in 2012 (fig. S1 and table S2).Although the legal reserve requirement did notchange, theNFCprovided amnesty for landholderswith 29 million hectares of illegal deforestation
Fig. 1. Deforestation, area of land use cate-gories, and production (beef and soy) trendsin the Brazilian Amazon. (A) Annual deforestationand the area of indigenous territories, sustainabledevelopment reserves (e.g., extractive reserves), strictprotection reserves, and agrarian reform settlements.(B) Soy and beef production and yields (for beefyields, @ = 15 kg of carcass weight) in the BrazilianAmazon.Annual deforestationdata are from InstitutoNacional de Pesquisas Espaciais (INPE) (26). Indig-enous territories, sustainable development reserves,and strict protection reserves are updated fromCastello et al. (24), Instituto Socioambiental (ISA)(27), Nepstad et al. (28), and World Database onProtected Areas (WDPA) (29). Settlements area isfrom Instituto Nacional de Colonização e ReformaAgrária (INCRA) (30). Cattle herd and soy produc-tion data are from Instituto Brasileiro de Geografia eEstatística (IBGE) (31) and Nassar et al. (9).
94 95 96 97 98 99 00 01 02 03 04 05 06 07 08 09 10 11 12 130
Annual deforestation
Agrarian reform settlements
Strict protection
Beef production
Soy production
Beef yield
Soy yield
Sustainable use
Indigenous territory
10
9
8
7
6
5
4
3
2
1
0
BSoy and beef production(millions of metric tons)
94 95 96 97 98 99 00 01 02 03 04 05 06 07 08 09 10 11 12 13
70
60
50
40
30
20
10
Percent ofBrazilian Amazon area
(percent of land)
AAnnual deforestation (thousands km2)Land category area (hundreds of thousands km2)
35
30
25
20
15
10
5
0
Soy yield (metric tons/ ha/yr) Beef yield (@/ ha/yr)
5.0
4.5
4.0
3.5
3.0
2.5
2.0
1.5
0.5
0
1.0
SCIENCE sciencemag.org 6 JUNE 2014 • VOL 344 ISSUE 6188 1119
that had taken place before July 2008 (18). It alsointroduced new measures for creating positiveincentives for legal compliance (10).With theNFC,the farm and livestock sectors suddenly had apathway to full legal compliancewith the Amazonregion’smost important environmental regulation.In 2009, a newGreenpeace campaign aimed at
the Brazilian beef-processing company, Bertin—and subsequent legal proceedings against irreg-ular slaughterhouses carried out by the PublicProsecutor’s office—led to a “Cattle Agreement”in which the region’s largest beef processingcompanies agreed to exclude from their supplychain those livestock producers who deforestedafter October 2009 (SM). Agricultural certifica-tion initiatives were launched during this periodand are still at an early stage, as summarized inthe SM (Fig. 3D).
Why Did Deforestation Decline?
The decline in deforestation during the “frontiergovernance” phase, from 2005 through 2007, was
the result of several mutually reinforcing factorsthat decreased the demand for new deforestation,increased the risks to those engaged in defores-tation, and reduced the supply of undesignated orloosely claimed forestland that is the target of landspeculators. The demand for new deforestationdeclined through both a retraction in the area ofsoy production (supporting H6) (fig. S4), rapidlyrising beef yields (H7) (Fig. 1B) and a sharp re-duction in the size of the Amazon cattle herd (H8)(9). Deforestation became riskier through improvedlaw enforcement, fines and embargos imposed onthose associated with illegal deforestation (H2),and market rejection of deforesters through theSoy Moratorium (H3). The supply of undesignatedforestland was limited through both a rapid ex-pansion of protected areas in active agriculturalfrontier zones (7, 12) (Fig. 1A) (H4) and delays inhighway paving (H5) (SM).The initial test of the measures implemented
to slow deforestation came during the TerritorialPerformance phase, when soy profitability rose
again and soy production increased (Fig. 1B andfig. S2). Demand for new deforestation did notcome directly from the soy sector, however. The50% expansion in soy production through 2013took place entirely on land cleared before 2006(fig. S6). During this period, beef productionremained flat as the herd was rebuilt, graduallyincreasing demand for new pasture. In additionto the measures already in place, the risks as-sociatedwith deforestationwere further elevatedthrough the Critical County program and theCattle Agreement of 2009 (SM).The contribution of each of these factors to the
decline in deforestation is extremely difficultto measure because of the temporal and spatialoverlap of the policy and supply chain interven-tions that weremade. Spatial simulationmodelinghas found an important role of new protectedareas in slowing deforestation (12). Econometricstudies (19, 20) have concluded that the ruralcredit restrictions implemented through the Criti-cal Counties program contributed significantly to
2000 2001 2002 2003 2004 2005 2006 2007 2008 2009 2010 2011 2012 2013
AGRICULTURE, LIVESTOCK, AND INFRASTRUCTURE CONTEXT
Soy & cattle expansion
Cattle intensification
High profitability
Highway paving projects announced
Low profitability Improving profitability
Interoceanic, BR 158 completed;BR 163 construction resumed
Hydropower projects announced Hydropower projects begin(e.g. Belo Monte Dam, Rio Madeira)
Soy retraction & herd reduction Soy & cattle expansion
Agro-industrial expansion Frontier governance Territorial performance
SUPPLY CHAIN INTERVENTIONS
GOVERNMENT
Remote sensing-based monitoring
Protected areas in remote regions Protected areas under threat
Forest Code unenforced
Private property registration(Mato Grosso, Pará)
Private property registrationrequired nationally
Property-level enforcement
Credit & fiscal incentivesfor forest clearing
Grupo Amaggi IFC loans
Forest Code enforced
New protected areas in active frontier
New Forest Code
Critical County Program,Green County Program
Climate change policy & state REDD+ laws
Amazon Fund, Low Carbon Agriculture credit program
Monitoring for enforcement
Private monitoringfor enforcement
Cattle Agreement
Commodity certification
Soy Moratorium
Fig. 2. Phases in the evolution of public policies and supply chain initiatives to control Amazon deforestation: 2000 to 2013. The underlying bargraph is the annual deforestation trend as shown in Fig. 1A. Sources for policy interventions are in table S2.
1120 6 JUNE 2014 • VOL 344 ISSUE 6188 sciencemag.org SCIENCE
the decline in deforestation during this phase(table S1) (SM).
Discussion
Is the decline in deforestation sustainable, with80% of the forest still standing? The long-termtrend in deforestation will depend, in part, oncontinuing increases in livestock yields on exist-ing cleared land. Cattle pasture is themain use ofcleared land, and beef production has the great-est potential for yield increases compared withcropping systems (6). Amazon deforestation isnot “decoupled” from expansion in crop and beefproduction, as Macedo et al. have concluded,unless beef yields climb fast enough to open uppastureland for soy expansion, which is a plau-sible scenario through 2020 (7, 9). Eventually,
cleared land that is suitable for soy production—the most profitable use of cleared land—will be-come scarce. As this scarcity sets in, the 120,000km2
of forests that could be profitably converted tosoy in the Brazilian Amazon and that lie outsideof protected areas (4) will become the target ofdeforestation pressure. Alternatively, expansionof crop and beef production could shift moreheavily to the Cerrado biome to the south of theAmazon, where deforestation rates have beenclimbing since 2010 (18).Future trends in Amazon deforestation will
also depend on a continued perception of riskassociatedwith deforestation. An important sourceof market access risk for soy producers is the SoyMoratorium, which is scheduled to end in 2014because of the large number of legal soy producers
who have been cut off from the market (SM). Thegovernment’s command-and-control measuresto fine and embargo illegal deforesters, and cutentire counties off from public agricultural cred-it, is precariously dependent upon the politicalwill of government to impose these measures,which may be weakening in the face of a stag-nant national economy (21). One early sign of ashift in political will is the reduction in size ofsome protected areas (22).As demand for new deforestation increases, as
supply chain interventions to discourage defor-estation weaken, and if deforestation policiesandprograms lose politicalwill, positive incentivesfor farmers, counties, and states that are forgoingor reducing deforestation will grow in impor-tance. Systems for delivering these incentives are
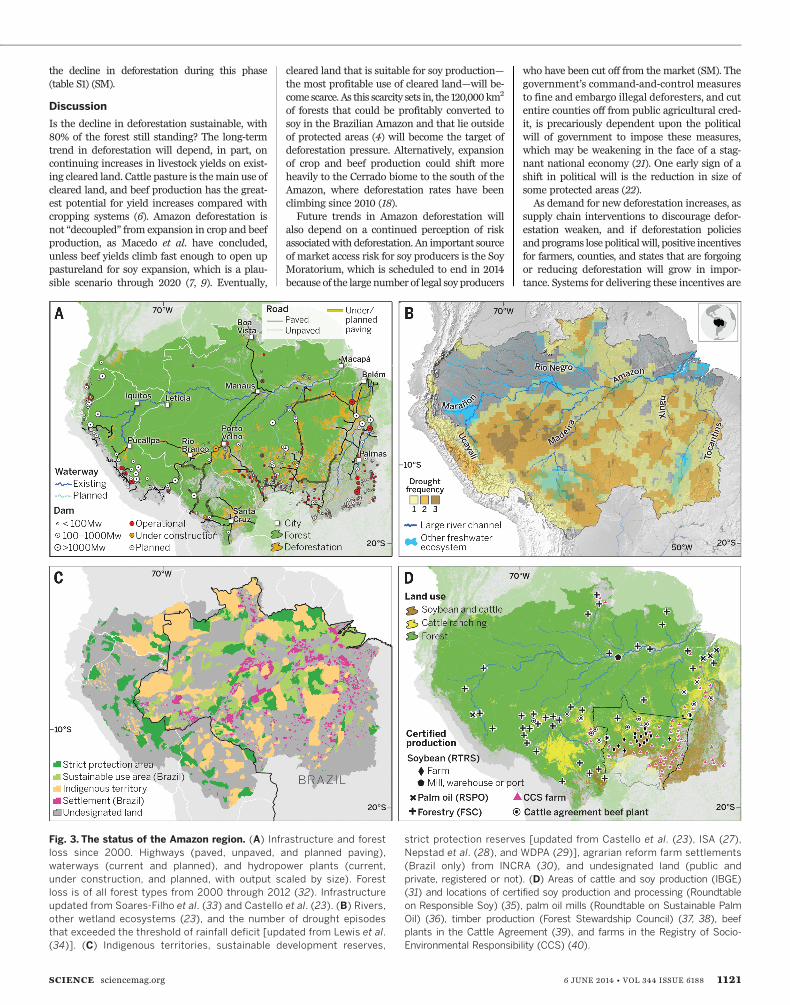
Fig. 3. The status of the Amazon region. (A) Infrastructure and forestloss since 2000. Highways (paved, unpaved, and planned paving),waterways (current and planned), and hydropower plants (current,under construction, and planned, with output scaled by size). Forestloss is of all forest types from 2000 through 2012 (32). Infrastructureupdated from Soares-Filho et al. (33) and Castello et al. (23). (B) Rivers,other wetland ecosystems (23), and the number of drought episodesthat exceeded the threshold of rainfall deficit [updated from Lewis et al.(34)]. (C) Indigenous territories, sustainable development reserves,
strict protection reserves [updated from Castello et al. (23), ISA (27),Nepstad et al. (28), and WDPA (29)], agrarian reform farm settlements(Brazil only) from INCRA (30), and undesignated land (public andprivate, registered or not). (D) Areas of cattle and soy production (IBGE)(31) and locations of certified soy production and processing (Roundtableon Responsible Soy) (35), palm oil mills (Roundtable on Sustainable PalmOil) (36), timber production (Forest Stewardship Council) (37, 38), beefplants in the Cattle Agreement (39), and farms in the Registry of Socio-Environmental Responsibility (CCS) (40).
SCIENCE sciencemag.org 6 JUNE 2014 • VOL 344 ISSUE 6188 1121
Incentives without territorial approach
Incentives with territorial approach
A
B
Risks
Demands
Financeinstitutions
Commoditybuyers
Farmer
Farmers ingreen country
Regulatoryagencies
Benefits
Regulatoryagencies
Commoditybuyers
Financeinstitutions
License to operate
Bur
eaucratic rules
So
y, beef
Repu
tatio
nal damage
$, inputs, calv
es
Loan
sRepaym
ent
Large-scalenon-compliancePublic interests defended
Easier rules
Non-compliancedefended more effectively
Public interests
Legalit
y,
zero defore
stat
ion
Lega
lity,
zero defo
rest
io
nReputational dam
age
Default,
Easier license to operate Less
risk
Better terms
$, inputs with better
ter
ms
Public inte
rest
s
“Cle
an” soy, beef
Simpler d
eman
ds
Less
ris
k
Hig
h re
pay
men
t ra
te
Loans
wit
h be
tter
term
s
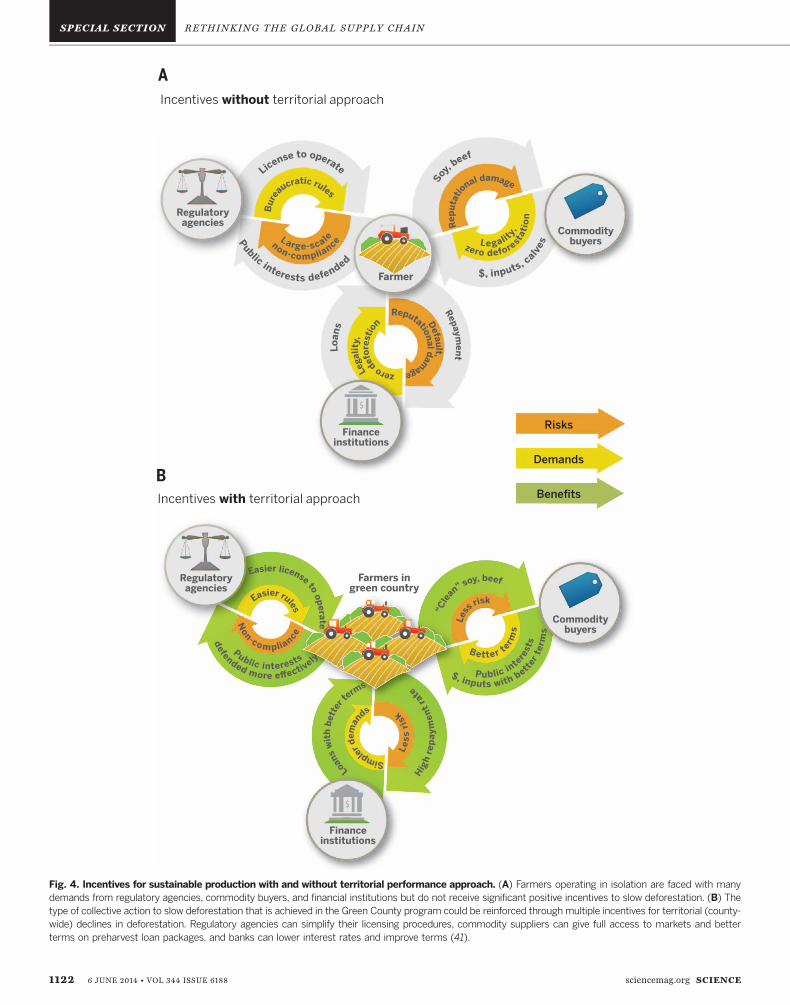
Fig. 4. Incentives for sustainable production with and without territorial performance approach. (A) Farmers operating in isolation are faced with manydemands from regulatory agencies, commodity buyers, and financial institutions but do not receive significant positive incentives to slow deforestation. (B) Thetype of collective action to slow deforestation that is achieved in the Green County program could be reinforced through multiple incentives for territorial (county-wide) declines in deforestation. Regulatory agencies can simplify their licensing procedures, commodity suppliers can give full access to markets and betterterms on preharvest loan packages, and banks can lower interest rates and improve terms (41).
1122 6 JUNE 2014 • VOL 344 ISSUE 6188 sciencemag.org SCIENCE
not yet operating at scale and appear to havecontributed little to the decline in deforestation(H3) even though considerable progress hasbeenmade toward establishing legal frameworksand farm-level approaches for eventually de-livering these incentives (SM). Some immediateand simple positive incentives for farmers whoforgo deforestation and invest in more intensive,sustainable production systems could be estab-lished without major new policies or markets forecosystem services (Fig. 4A). Regulatory agenciescould simplify their regulatory requirements orgive discounts on their environmental licensingprocedures, commodity suppliers could give bet-ter terms on preharvest packages, and bankscould give lower interest rates or better terms onloans to legally compliant landholders. Theseincentives could increase for farmers in countiesthat have come off the Critical County black listor that are making measurable progress towardsustainable development in other ways (Fig. 4B),building on the early success of the Critical Coun-ties program. Climate finance programs, such asthe Amazon Fund, could establish innovative,competitive funding mechanisms for deliveringfinance to regional consortia that are ready tomake the transition to low-deforestation, high-production land use systems. The new ForestCode establishes a policy framework for creatingpositives (10).Supply chain and public policy initiatives could
also become better aligned through a shared setof performance targets for further reducing de-forestation that are accompanied by commitmentsfrom the relevant institutions and actors to helpachieve these targets. For example, farmers; com-panies that produce, process, or purchase soy andbeef; finance institutions; regulatory agencies; andenvironmental groupsmight agree that if counties,states, or the entire Brazilian Amazon achieve an80% reduction in deforestation below the 10-yearaverage, they should be considered “low defor-estation” counties, conferring on the farmers inthe successful territory the benefits described inFig. 4B, including full access tomarkets. The targetmay increase to a 90% reduction in 2018. Thisapproach could lower the costs of tracking theforest-clearing activities of millions of individualfarms and ranches, which is required in the sup-ply chain approach to deforestation. A criticalissue is whether companies that have Amazonproducers in their beef and soy supply chainswill accept a deforestation agreement that is notabsolute “zero” deforestation but that is more inline with a regional development strategy.In the Amazon deforestation debate, little at-
tention is paid to mechanisms for attracting in-vestors into the Amazon region to sustainablydevelop its forests, fisheries, and agriculturalpotential. Advances in frontier governance, lawenforcement, and mechanisms for punishingdeforesters through restrictions on access tomarkets and finance succeeded in deceleratingdeforestation but failed to address the region’sneed for private investment, innovation, andenterprise. Land titling, which is fundamentalto the landholder’s ability to access credit,
continues to progress slowly. Instead, effectivecampaigns by Greenpeace and others haveincreased the reputational risk of companiesthat do business in the Amazon, scaring awaypotential investors and market players. Conse-quently, the responsible agricultural and live-stock companies and individuals who are neededto consolidate the progress made in reducingdeforestation in the Brazilian Amazon may bedriven away by the success of these campaigns.Deforestation is only one of the threats to the
Amazon region. Extensive forest fires during se-vere drought episodes kill mature trees, openingstanding forests up to invasion by grasses andrecurrent burning (Fig. 3B) (4, 23). Hydropowerdams, waterways (Fig. 3A), and overfishingthreaten the fisheries, river ecosystems, and as-sociated wetlands of the region, which are criticalto the regional economies and to the livelihoodsof indigenous and traditional communities (SM)(24). In addition, mining continues to degradestreams and forests through both physical distur-bance and chemical pollution (25).
Conclusion
Brazil’s remarkable decline in deforestation pro-vides valuable lessons on the importance ofpublic policies, monitoring systems, and supplychain interventions in slowing the advance of avast, complex agricultural frontier. The challengenow is to build upon this progress to construct astrategy for promoting a new model of ruraldevelopment in which punitive measures arecomplemented by positive incentives and financeat scale for landholders, indigenous communities,counties, and states tomake the transition to low-deforestation, productive, sustainable rural devel-opment. Deforestation is only one dimension ofthe health of the Amazon Basin.
REFERENCES AND NOTES
1. D. Nepstad et al., Science 326, 1350–1351 (2009).2. E. A. Davidson et al., Nature 481, 321–328 (2012).3. P. M. Brando, M. T. Coe, R. DeFries, A. A. Azevedo,
Philos. Trans. R. Soc. Lond. B Biol. Sci. 368, 20120152(2013).
4. D. C. Nepstad, C. M. Stickler, B. S. Filho, F. Merry, Philos. Trans.R. Soc. Lond. B Biol. Sci. 363, 1737–1746 (2008).
5. D. C. Nepstad, C. M. Stickler, O. T. Almeida, Conserv. Biol. 20,1595–1603 (2006).
6. A. S. Cohn et al., Proc. Natl. Acad. Sci. U.S.A. (2014).7. M. N. Macedo et al., Proc. Natl. Acad. Sci. U.S.A. 109,
1341–1346 (2012).8. G. L. Galford, J. Melillo, J. F. Mustard, C. E. P. Cerri, C. C. Cerri,
Earth Interact. 14, 1–24 (2010).9. A. Nassar et al., “Brazil’s pathway to low-emission rural
development” (AgroIcone and Earth Innovation Institute,São Paulo, 2014); http://earthinnovation.org/wp-content/uploads/2014/05/Nassar_etal_2014.pdf.
10. C. M. Stickler, D. C. Nepstad, A. A. Azevedo, D. G. McGrath,Philos. Trans. R. Soc. Lond. B Biol. Sci. 368, 20120160(2013).
11. R. Rajão, A. Azevedo, M. C. C. Stabile, Public Adm. Dev. 32,229–244 (2012).
12. B. Soares-Filho et al., Proc. Natl. Acad. Sci. U.S.A. 107,10821–10826 (2010).
13. B. F. T. Rudorff et al., Remote Sens. 3, 185–202 (2011).14. M. T. Campos, D. C. Nepstad, Conserv. Biol. 20,
1553–1556 (2006).15. S. Schwartzman, A. Alencar, H. Zarin, A. P. Santos Souza,
J. Environ. Dev. 19, 274 (2010).16. Ministerio do Meio Ambiente, Lista de Municípios
Prioritários da Amazônia, (Ministerio do Meio Ambiente,
Brasília, Brasil, 2014). http://www.mma.gov.br/florestas/controle-e-prevenčão-do-desmatamento/plano-de-ação-para-amazônia-ppcdam/lista-de-municípios-prioritários-da-amazônia
17. D. Nepstad, W. Boyd, C. M. Stickler, T. Bezerra, A. Azevedo,Philos. Trans. R. Soc. B. 368, 20120167 (2013).
18. B. Soares-Filho et al., Science 344, 363–364(2014).
19. J. Assunção, C. Gandour, R. Rocha, R. Rocha,“Does Credit Affect Deforestation? Evidence froma Rural Credit Policy in the Brazilian Amazon”(Climate Policy Institute, Rio de Janeiro, 2013);www.climatepolicyinitiative.org.
20. J. Hargrave, K. Kis-Katos, Environ. Resour. Econ. 54, 471–494(2013).
21. H. Joyce, Economist (28 September 2013).22. H. Martins, E. Araujo, M. Vedoveto, D. Monteiro, P. Barreto,
“Desmatamento em Áreas Protegidas Reduzidas na Amazônia”(IMAZON, Belém, 2013).
23. P. M. Brando et al., Proc. Natl. Acad. Sci. U.S.A. 111, 6347–6352(2014).
24. L. Castello et al., Conservation Letters 6, 217–229(2013).
25. G. P. Asner, W. Llactayo, R. Tupayachi, E. R. Luna, Proc. Natl.Acad. Sci. U.S.A. 110, 18454–18459 (2013).
26. Instituto Nacional de Pesquisas Espaciais (INPE, São Paulo,Brasil, 2013); www.obt.inpe.br/prodes/.
27. Instituto Socioambiental, Áreas Protegidas da Amazônia(São Paulo, Brasil, June 2011).
28. D. Nepstad et al., Conserv. Biol. 20, 65–73 (2006).29. WDPA, 2013. World Database on Protected Areas. Database
accessed in February 2013 from www.protectedplanet.net/.30. Imazon, Desmatamento nos Assentamentos de Reforma
Agrária na Amazônia; available at: www.imazon.org.br/publicacoes/o-estado-da-amazonia/desmatamento-nos-assentamentos-de-reforma-agraria-na-amazonia(2011).
31. Instituto Brasileiro de Geografia e Estatística, ProduçãoAgricola Municipal (IBGE, Rio de Janeiro, Brasil,2013).
32. M. C. Hansen et al., Science 342, 850–853 (2013).33. B. S. Soares-Filho et al., Nature 440, 520–523
(2006).34. S. L. Lewis, P. M. Brando, O. L. Phillips, G. M. F. van der Heijden,
D. Nepstad, Science 331, 554 (2011).35. Roundtable on Responsible Soy (RTRS, Buenos Aires,
Argentina, 2013).36. Roundtable on Sustainable Palm Oil (RSPO), (RSPO, Kuala
Lumpur, Malaysia, 2013).37. D. Santos, D. Pereira, A. Veríssimo, “O Estado da Amazônia:
Uso da Terra” (Instituto do Homem e Meio Ambiente daAmazônia, Belém, 2013.
38. Certificación Forestal Voluntaria, Operaciones forestalescertificadas. Consejo Boliviano para la Certificación ForestalVoluntaria (CFV) (2011).
39. ABIEC, Associação Brasileira das IndústriasExportadoras de Carne, Mapa das Plantas Frigoríficas;available from www.abiec.com.br/2_mapa.asp,(2012).
40. Aliança da Terra, Mapa Geral do CCS (Aliança da Terra,Goiânia, Brasil, 2014).
41. D. C. Nepstad et al., Carbon Management 4, 639(2013).
ACKNOWLEDGMENTS
K. Schwalbe helped with text editing and formatting;M. Nepstad designed Fig. 4. This work was funded throughgrants from the Norwegian Agency for DevelopmentCooperation (QZA-0186, QZA-13/0548), the U.S. NationalScience Foundation (1146206), the Gordon and Betty MooreFoundation (3980), the Linden Conservation Trust, andRoger and Vicki Sant to the Earth Innovation Institute,Instituto de Pesquisa Ambiental da Amazônia InternationalProgram, or the Woods Hole Research Center.
SUPPLEMENTARY MATERIALS
www.sciencemag.org/content/344/6188/1118/suppl/DC1Supplementary TextFigs. S1 to S4Tables S1 and S2References (42–76)
10.1126/science.1248525
SCIENCE sciencemag.org 6 JUNE 2014 • VOL 344 ISSUE 6188 1123