science community quantifying the evolution of … · roberta sinatra, dashun wang, pierre ... the...
TRANSCRIPT
RESEARCH ARTICLE SUMMARY◥
SCIENCE COMMUNITY
Quantifying the evolutionof individual scientific impactRoberta Sinatra, Dashun Wang, Pierre Deville,Chaoming Song, Albert-László Barabási*
INTRODUCTION: In most areas of humanperformance, from sport to engineering, thepath to a major accomplishment requires asteep learning curve and long practice. Scienceis not that different: Outstanding discoveriesare often preceded by publications of less mem-orable impact. However, despite the increas-ing desire to identify early promising scientists,the temporal career patterns that character-ize the emergence of scientific excellence remainunknown.
RATIONALE: How do impact and productiv-ity change over a scientific career? Does im-pact, arguably the most relevant performancemeasure, follow predictable patterns? Canwe predict the timing of a scientist’s out-standing achievement? Can we model, inquantitative and predictive terms, scientificcareers? Driven by these questions, here wequantify the evolution of impact and pro-ductivity throughout thousands of scientificcareers. We do so by reconstructing the publi-
cation record of scientists from seven disci-plines, associating to each paper its long-termimpact on the scientific community, as quan-tified by citation metrics.
RESULTS: We find that the highest-impactwork in a scientist’s career is randomly dis-tributed within her body of work. That is, thehighest-impact work can be, with the sameprobability, anywhere in the sequence of paperspublished by a scientist—it could be the firstpublication, could appear mid-career, or could
be a scientist’s last publica-tion. This random-impactrule holds for scientists indifferent disciplines, withdifferent career lengths,working in different dec-ades, and publishing solo
or with teams and whether credit is assigneduniformly or unevenly among collaborators.The random-impact rule allows us to dev-
elop a quantitative model, which systematicallyuntangles the role of productivity and luckin each scientific career. The model assumesthat each scientist selects a project with arandom potential p and improves on it witha factor Qi, resulting in a publication of im-pact Qip. The parameter Qi captures theability of scientist i to take advantage of theavailable knowledge in a way that enhances(Qi > 1) or diminishes (Qi < 1) the potentialimpact p of a paper. The model predicts thattruly high-impact discoveries require a combi-nation of highQ and luck (p) and that increasedproductivity alone cannot substantially enhancethe chance of a very high impact work. Wealso show that a scientist’s Q, capturing hersustained ability to publish high-impact papers,is independent of her career stage. This is incontrast with all current metrics of excellence,from the total number of citations to the h-index, which increase with time. The Qmodelprovides an analytical expression of these tra-ditional impact metrics and allows us topredict their future time evolution for eachindividual scientist, being also predictive ofindependent recognitions, like Nobel prizes.
CONCLUSION: The random-impact ruleand the Q parameter, representing two fun-damental characteristics of a scientific career,offer a rigorous quantitative framework to ex-plore the evolution of individual careers andunderstand the emergence of scientific excel-lence. Such understanding could help us bettergauge scientific performance and offers a pathtoward nurturing high-impact scientists, po-tentially informing future policy decisions.▪
RESEARCH
596 4 NOVEMBER 2016 • VOL 354 ISSUE 6312 sciencemag.org SCIENCE
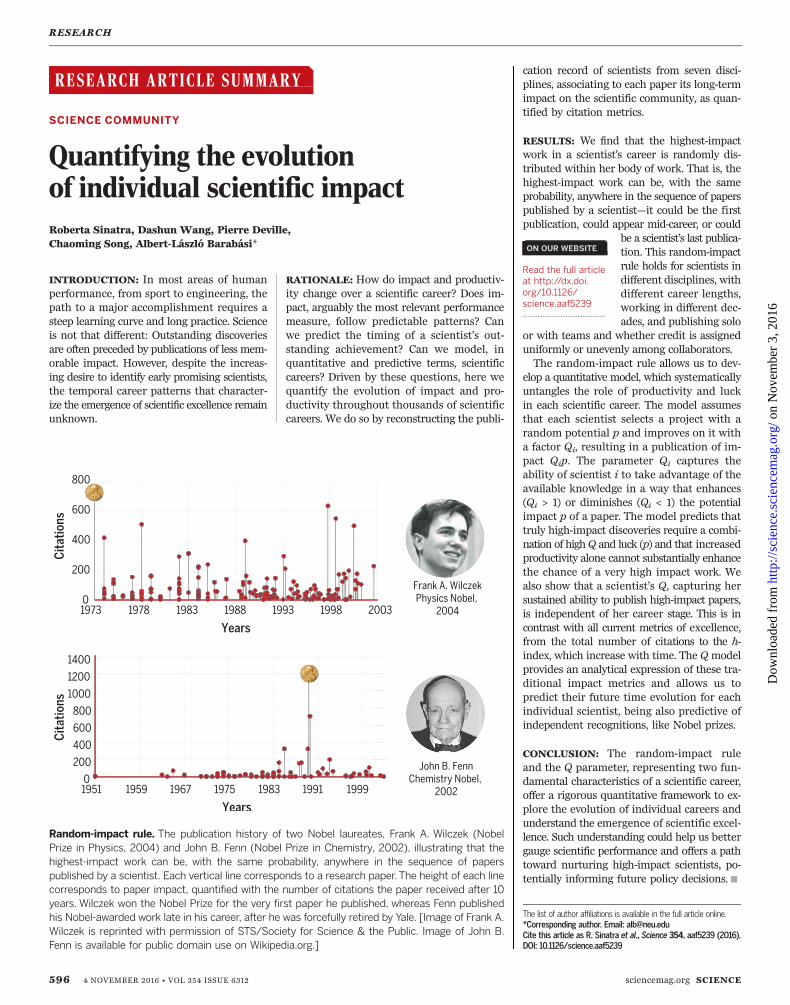
Random-impact rule. The publication history of two Nobel laureates, Frank A. Wilczek (NobelPrize in Physics, 2004) and John B. Fenn (Nobel Prize in Chemistry, 2002), illustrating that thehighest-impact work can be, with the same probability, anywhere in the sequence of paperspublished by a scientist. Each vertical line corresponds to a research paper.The height of each linecorresponds to paper impact, quantified with the number of citations the paper received after 10years. Wilczek won the Nobel Prize for the very first paper he published, whereas Fenn publishedhis Nobel-awarded work late in his career, after he was forcefully retired by Yale. [Image of Frank A.Wilczek is reprinted with permission of STS/Society for Science & the Public. Image of John B.Fenn is available for public domain use on Wikipedia.org.]
The list of author affiliations is available in the full article online.*Corresponding author. Email: [email protected] this article as R. Sinatra et al., Science 354, aaf5239 (2016).DOI: 10.1126/science.aaf5239
ON OUR WEBSITE◥
Read the full articleat http://dx.doi.org/10.1126/science.aaf5239..................................................
on
Nov
embe
r 3,
201
6ht
tp://
scie
nce.
scie
ncem
ag.o
rg/
Dow
nloa
ded
from

RESEARCH ARTICLE◥
SCIENCE COMMUNITY
Quantifying the evolutionof individual scientific impactRoberta Sinatra,1,2 Dashun Wang,3,4 Pierre Deville,1,5
Chaoming Song,6 Albert-László Barabási1,7,8,9*
Despite the frequent use of numerous quantitative indicators to gauge the professionalimpact of a scientist, little is known about how scientific impact emerges and evolves intime. Here, we quantify the changes in impact and productivity throughout a career inscience, finding that impact, as measured by influential publications, is distributedrandomly within a scientist’s sequence of publications. This random-impact rule allows usto formulate a stochastic model that uncouples the effects of productivity, individualability, and luck and unveils the existence of universal patterns governing the emergence ofscientific success.The model assigns a unique individual parameter Q to each scientist, whichis stable during a career, and it accurately predicts the evolution of a scientist’s impact, fromthe h-index to cumulative citations, and independent recognitions, such as prizes.
Productivity, representing the number ofpublications authored by a scientist overtime, and impact, often approximated bythe number of citations a publication re-ceives (1–4), are frequently used metrics
to gauge a scientist’s performance. Despite theirwidespread use, we lack a quantitative understand-ing of the patterns these metrics follow duringa scientist’s career (5). This is particularly alarm-ing (6–11), given that they are increasingly adoptedfor academic assessment (4, 11) and serve asthe input for numerous indicators, like the h-index and its variants, which are frequentlyused to compare individual performance (12–14).Given the increasing interest in predicting thevalue of these indicators (5, 15), here we ask:How do impact and productivity change overa typical scientific career? Does impact, arguablythe most relevant performance measure, followpredictable patterns? Can we predict the timingof a scientist’s outstanding achievement? Can weuntangle the role of impact, productivity, and luckwithin a scientific career?To address these questions, we reconstruct the
publication profile of scientists from multipledisciplines and associate each of their publica-
tions with an impact, as captured by c10, thenumber of citations 10 years after publication(Fig. 1A; see Methods and section S1).Motivated partly by the exceptional aware-
ness of a scientist’s highest-impact work (16, 17),like radioactivity for Marie Curie and the doublehelix for Watson and Crick, we identified foreach researcher her most-cited paper, c10* , that is,the paper with the highest number of citations10 years after its publication. The distributionPðc10* Þ for the studied scientists indicates thatonly 5% have c10* ≥ 200; hence, most scientificcareers have limited maximal impact. To system-atically distinguish the careers on the basis oftheir peak impact, we group each scientist in-to high maximum impact (top 5%, c10* ≥ 200),low maximum impact (bottom 20%, c10* ≤ 20),and medium maximum impact (middle 75%,20 < c10* < 200) categories (Fig. 1B and section S2).
Productivity and impact patternsin scientific careers
The total number of papers scientist i publishesup to time t after her first publication, Ni(t),asymptotically follows NiðtÞ ∼ tgi (Fig. 1C) (18).Hence, yearly productivity, ni(t), follows thesame scaling with exponent (gi − 1) (fig. S5).Yet, the scaling exponent is different for low-,medium-, and high-impact scientists (Fig. 1C).We find that for low-impact scientists, hgi =1.55, indicating on average a steady increasein their productivity. The increase is muchfaster for high-impact researchers, for whomhgi = 2.05 (Fig. 1D). These trends are also con-firmed by changes in the yearly productivityhn(t)i: For high-impact scientists, productivityincreases almost threefold during their career,whereas the increase is modest for low-impactscientists (Fig. 1E). Together, Fig. 1 (D and E)indicates that productivity changes through-out a scientific career. We find, however, that
this trend is modulated by impact: Productivitygrowth is more pronounced for high-impact sci-entists and is modest for low-impact scientists(Fig. 1, C to E).As Fig. 2A indicates, impact appears to follow
similar patterns to productivity (Fig. 1E): Althoughc10 increases during a high-impact scientist’scareer, an increase is hardly noticeable for av-erage and low-impact individuals. Yet, we ob-serve a markedly different pattern if we examinethe impact in the vicinity of t*, the publicationtime of the most-cited work c10* . Plotting hc10i forthe sequence of papers before and after an in-dividual’s most-cited paper, c10* (Fig. 2B), we donot see a gradual increase in impact as a sci-entist approaches t*, nor do we observe elevatedcitations after this breakthrough. Instead, theobserved pattern exhibits a singular behavior.This singularity could be a simple result ofaveraging random-impact fluctuations presentin careers. We find, however, that the result isrobust if we use a moving average or consideronly the publication with maximum impact in arolling window (section S2.1 and fig. S6) and isvalidated using the fitting hypothesis ci10ðtÞ ∼ ait,lacking differences in ai before or after t* (sectionS2.2 and fig. S7) (19). Also, the papers publishedbefore and after t* show no discernible differencesin their average number of citations (Fig. 2C).Finally, we randomize each career by leaving allproductivity measures [total number of papers,Ni, and ni(t)] unchanged but shuffling the impactof each paper within each career (Fig. 2C). Thelack of differences between the original andthe randomized careers supports our overall con-clusion: There are no detectable changes in im-pact leading up to or following a scientist’shighest-impact work. We tested the robustnessof this measure for different samples of scientists(figs. S8 and S9), for different definitions of im-pact (section S1.6 and fig. S10), and in data setswhere we attribute different impact shares toeach author of a paper (section S6 and fig. S11),arriving at the same conclusion. Yet, we can-not exclude that there are other choices of im-pact variables or data-set selection that can detectpatterns before or after the highest-impact paper.To understand when a scientist publishes her
most important work, we measured the proba-bility P(t*) that the highest-impact paper is pub-lished at time t* after a scientist’s first publication(Fig. 2D). The high P(t*) between 0 and 20 yearsindicates that most scientists publish their highest-impact paper early or midcareer. The drop inP (t*) after 20 years suggests that it is unlikelythat a scientist’s most-cited work will come latein her career, a result well documented by theliterature about creativity (see section S3.1) (20, 21).To understand the origin of this pattern, weshuffled c10 among all papers published by thesame scientist, preserving the scientist’s time-dependent productivity and paper-by-paper im-pact and randomizing only the order of herpublications. The fact that P(t*) for these syntheticcareers is indistinguishable from the original data(Fig. 2D) indicates that variations in P(t*) are notdue to specific impact sequences or other features
RESEARCH
SCIENCE sciencemag.org 4 NOVEMBER 2016 • VOL 354 ISSUE 6312 aaf5239-1
1Center for Complex Network Research and PhysicsDepartment, Northeastern University, Boston, MA 02115,USA. 2Center for Network Science and Math Department,Central European University, Budapest, Hungary. 3KelloggSchool of Management, Northwestern University, Evanston,IL 60208, USA. 4Northwestern Institute on ComplexSystems, Northwestern University, Evanston, IL 60208,USA. 5Department of Applied Mathematics, Universitécatholique de Louvain, Louvain-la-Neuve, Belgium.6Department of Physics, University of Miami, Coral Gables,FL 33124, USA. 7Department of Medicine, Brigham andWomen’s Hospital, Harvard Medical School, Boston, MA02115, USA. 8Center for Network Science, Central EuropeanUniversity, Budapest, Hungary. 9Center for CancerSystems Biology, Dana-Farber Cancer Institute, Boston,MA 02115, USA.*Corresponding author. Email: [email protected]
on
Nov
embe
r 3,
201
6ht
tp://
scie
nce.
scie
ncem
ag.o
rg/
Dow
nloa
ded
from

but are entirely explained by year-by-year var-iations in productivity throughout a career (fig.S12) (20, 21).These results prompted us to explore the po-
sition N* of the highest-impact paper in thesequence of N publications of a scientist bymeasuring P(N*/N), that is, the probability thatthe most-cited work is early (N*/N small) or late(N*/N ≃ 1) within the sequence of papers pub-lished by a scientist. We find that P(N*/N) is flat(Fig. 2E, inset), a finding supported by the cu-mulative P(≥N*/N) (Fig. 2E), which decreasesindependently of impact as (N*/N)−1, in linewith a uniform P(N*/N). Together, we arriveat a rather unexpected conclusion, representingour main empirical finding: Impact is randomlydistributed within a scientist’s body of work,regardless of publication time or order in thesequence of publications. We call this therandom-impact rule because it indicates thatthe highest-impact work can be, with the sameprobability, anywhere in the sequence of N paperspublished by a scientist. We find that the random-impact rule holds for scientists in different dis-ciplines, with different career lengths, working indifferent decades, and publishing solo or withteams and whether credit is assigned uniformlyor unevenly among collaborators (sections S1.4and S6.1) (22).The random-impact rule can explain the grow-
ing impact during a scientist’s career (Fig. 2A).To see this, we again randomly shuffle the im-pact of the papers within each career, leaving theindividual productivity unchanged. The variations
of impact of the randomized careers are indis-tinguishable from the original data for both high-and low-impact individuals (Fig. 2A). Hence, thegrowing average impact documented in Fig. 2A isthe result of combining the increasing averageproductivity (Fig. 1E) with the heavy-tailed natureof the citation distribution (6, 23–25). hc10i is notstable but increases with the number of publica-tions, resulting in the observed growing impact(Fig. 2A). Hence, growing productivity, ratherthan increasing ability or excellence, can accountfor the growth in average impact during a careerin science.The defining role of productivity in the timing
of the highest-impact work persists if we extendthe analysis to different samples of scientists,not only those with at least 20 years of pub-lication record. We considered different selec-tions of scientists, such as (i) grouping themby different career lengths (figs. S13 andS14), (ii) grouping them by decade of activecareer (figs. S15 and S16), (iii) removing multi-authored papers (fig. S17), (iv) including onlypapers published in one subarea of physics(fig. S38), (v) creating no filter and includingall scientists (figs. S18 and S19), (vi) usingdifferent definitions of impact (figs. S20, S21,and S37), or (vii) considering the six differentdisciplines in data set (ii) (figs. S22 and S23). Inall these cases, the location of the peak of thehighest-impact work probability changes, butwe never observe a difference with the random-ized careers. Hence, the specific shape of P(t*) isonly a function of the selection of scientists and
of their temporal productivity patterns, whereasimpact is always randomly distributed within ascientist’s sequence of publications.The documented random-impact rule raises
an important question: What is the role of aresearcher’s own ability, if any, in scientific ex-cellence? We propose two quantitative modelsto answer this question.
Random-impact model (R-model)
We can rely on the random impact rule to builda null model of scientific careers: We assumethat each scientist publishes a sequence of pa-pers whose impact is randomly chosen from thesame impact distribution P(c10). Consequently,the only difference between two scientists is theiroverall productivity N. With the observed P(c10)and P(N) distributions (Fig. 3, A and B) as input,the obtained R-model (section S4.2) accuratelyreproduces the randomness of the impact se-quence P (N*/N) (Fig. 2E), but it also makestwo predictions that are at odds with the data.(a) Productivity alone begets success: If
each paper’s impact is randomly drawn fromthe same P(c10), a productive scientist (high N)will more likely score a high c10* (see eqs. S7 andS18) (26, 27). However, the R-model does notcorrectly reproduce the observed increase of hc10* ias a function of N (Fig. 3C).(b) Divergent impact: The higher the aver-
age impact of a scientist’s publications with-out the most-cited publication hc10−* i (Fig. 1A), thehigher the impact of the most-cited paper, c10*
(Fig. 3D). Hence, papers with truly high impact
aaf5239-2 4 NOVEMBER 2016 • VOL 354 ISSUE 6312 sciencemag.org SCIENCE
Fig. 1. Patterns ofproductivity during ascientific career.(A) Publication history ofKenneth G.Wilson (NobelPrize in Physics, 1982).Horizontal axis indicatesthe number of yearsafter the scientist’s firstpublication, and eachvertical line correspondsto a research paper. Theheight of each line cor-responds to c10, that is,the number of citationsthe paper received after10 years (sections S1.3and S1.6). The highest-impact paper of Wilsonwas published in 1974,9 years after his firstpublication, and it is the17th of his 48 papers;hence, t* = 9, N* = 17,and N = 48. (B) Distri-bution of the highest-
impact paper Pðc10� Þ across all scientists.We highlight in blue the bottom 20% ofthe area, corresponding to low maximum impact scientists ðc10� ≤ 20Þ; red areaindicates the high maximum impact scientists (top 5%, c10
� ≥ 200); yellow cor-responds to the remaining 75% medium maximum impact scientists ð20 <
c10� < 200Þ. These cutoffs do not change if we exclude review papers from our
analysis (see figs. S4 and S36). (C) Number of papersN(t) published up to time t
for three scientists with low, medium, and high impact but with comparable finalnumber of papers throughout their career. (D) Distribution of the productivityexponents g (18). The productivity of high-impact scientists grows faster than doesthat of low-impact scientists. (E) Dynamics of productivity, as captured by theaverage number of papers hn(t)i published each year for high-, average-, and low-impact scientists. t = 0 corresponds to the year of a scientist’s first publication.
A B
EC D
RESEARCH | RESEARCH ARTICLE
on
Nov
embe
r 3,
201
6ht
tp://
scie
nce.
scie
ncem
ag.o
rg/
Dow
nloa
ded
from

are published by scientists with a consistent rec-ord of high impact. The R-model cannot accountfor this behavior, predicting that hc10* i divergeswhen h log ðc10−* Þi→1:97 (Fig. 3D), a consequenceof the log-normal nature of P(c10) (section S4.1and fig. S27).Failures (a) and (b) prompt us to abandon our
hypothesis that research papers are all drawnfrom the same impact distribution and henceresearchers have no distinguishable individualimpact, forcing us to explore more closely the rela-tionship betweenproductivity, impact, and chance.
Q-model
Crucially, in the R-model, scientists with similarproductivity have indistinguishable impact. Inreality, impact varies greatly between scientists(Fig. 3E), suggesting the existence of a hiddenparameter Qi that modulates impact, which hasa unique value for each scientist i.The log-normal nature of P(c10) (Fig. 3A) (24)
indicates the presence of multiplicative processes,prompting us to write the impact c10,ia of paper apublished by scientist i as
c10;ia ¼ Qipa ð1Þwhere pa is the potential impact of paper a inthe sequence of papers published by scientist i.
The parameter Qi captures the ability of scientist ito take advantage of the available knowledge in away that enhances (Qi > 1) or diminishes (Qi < 1)the potential impact of paper a. We take the valueof this parameter Qi to be constant throughout ascientist’s career, a hypothesis we validate later(Fig. 5 and section S4.9). The obtained model as-sumes that each scientist randomly selects aproject with potential pa and improves on it witha factor Qi that is unique to the scientist, resultingin a paper of impact (Eq. 1). Truly high-impactpublications are therefore the result of a highQi scientist selecting by chance a high pa project;any scientist, independently of her parameter Qi,can publish low-impact papers by selecting alow pa.The stochastic process behind the model
(Eq. 1) is determined by the joint probabilityP(p, Q, N), with unknown correlations betweenp, Q, and N. The log-normal nature of P(c10) (Fig.3A) allows us to measure P(p), finding that itcan also be fitted with a log-normal function(Fig. 3F). Assuming that Q is also a log-normal(confirmed later), we denote with p^ ¼ log p;Q^ ¼ logQ;N
^ ¼ logN , obtaining the trivariatenormal distribution Pðp^; Q
^; N
^ Þ ¼ N (m, S).Using a maximum-likelihood approach (seesection S4.4), we estimate from the data the
mean m ≡ (mp,mQ,mN) = (0.92,0.93,3.34) and thecovariance matrix
X≡
s2p sp;Q sp;Nsp;Q s2Q sQ;Nsp;N sQ;N s2N
0@
1A
¼0:930:000:00
0:000:210:09
0:000:090:33
0@
1A ð2Þ
The matrix (Eq. 2) leads to two key predictions:(i) sp,N = sp,Q ≃ 0 indicates that the paper
potential impact pa is independent of a scientist’sproductivity Ni and her hidden parameter Qi.Therefore, scientists select the potential impactof each paper randomly from a P(p) distributionthat is the same for all individuals, being inde-pendent of Q and N, capturing a universal—thatis, scientist-independent—luck component behindimpact.(ii) The nonzero sQ,N indicates that the hidden
parameter Q and productivity N do depend oneach other (section S4.4), but its small valuealso shows that high Q is only slightly associatedwith higher productivity.The lack of correlations between p and (Q,N)
allows us to analytically calculate the dependenceof the highest-impact paper hlog c10* i on productivity
SCIENCE sciencemag.org 4 NOVEMBER 2016 • VOL 354 ISSUE 6312 aaf5239-3
Fig. 2. Patterns ofimpact during ascientific career.(A) Dynamics of impactcaptured by the yearlyaverage impact ofpapers hc10(t)i forhigh, medium, and lowmaximum impact sci-entists, where t = 0corresponds to theyear of a scientist’sfirst publications. Thesymbols correspond tothe data, whereas theshaded area indicatesthe 95% confidencelimit of careers wherethe impact of the pub-lications is randomlypermuted within eachcareer. (B) Averageimpact hc10i of paperspublished before andafter the highest-
impact paper c10� of
high-, middle-, and low-impact scientists. The plot indicates that there are nodiscernible changes in impact before or after a scientist’s highest-impact work.(C) hc10� i and hc10i before and after a scientist’s most-cited paper. For eachgroup, we calculate the average impact of the most-cited paper, hc10� i, as wellas the average impact of all papers before and after the most-cited paper. Wealso report the same measures obtained in publication sequences for whichthe impact c10
� is fixed, whereas the impact of all other papers is randomlypermuted. (D) Distribution of the publication time t* of the highest-impactpaper for scientists’ careers (black circles) and for randomized-impact careers(gray circles). The lack of differences between the two curves (P = 0.70 for theMann-Whitney U test between the two distributions) supports the random-impact rule; that is, impact is random within a scientist’s sequence of pub-
lication. Note that the drop after 20 years is partly because we focus oncareers that span at least 20 years (see fig. S22). (E) Cumulative distributionP(≥N*/N) for scientists with N ≃ 50, where N*/N denotes the order N of thehighest-impact paper in a scientist’s career, varying between 1/N and 1. Thecumulative distribution of N*/N is a straight line with slope 1, indicatingthat N has the same probability to occur anywhere in the sequence of paperspublished by a scientist. The flatness of P(N*/N) (all scientists, inset) sup-ports the conclusion that the timing of the highest-impact paper is uniform.The small differences between the three curves are due to different numberof publications N in the three groups of scientists [see fig. S24 for the plotof P(≥N*/N) for other values of N and figs. S25 and S26 for the impactautocorrelation throughout a scientific career].
A B
C D E
RESEARCH | RESEARCH ARTICLE
on
Nov
embe
r 3,
201
6ht
tp://
scie
nce.
scie
ncem
ag.o
rg/
Dow
nloa
ded
from

N (section S4.10) and on the average impact ofthe other papers published by the same sci-entist hc10−*i (see S4.10). The model prediction forhlog c10* iðNÞ and hlog c10* iðhc10−*iÞ is in excellentagreement with the data (Fig. 3, C and D, andfig. S30), indicating that the hidden parameterQ and variations in the productivity N can ex-plain the empirically observed impact differencesbetween scientists, correcting the shortcomingsof the R-model.In summary, the Q-model allows us to generate
synthetic sequences of publications, by assigningto each scientist an individual parameter Q anda productivity N, extracted from the distributionP (Q, N). Each paper in the sequence is assignedan impact calculated as p × Q, where p is ran-domly drawn from the distribution P(p), identi-cal for all scientists.
The measurement and accuracyof the hidden parameter Q
The model allows us to calculate the parameterQi from the sequence of publications c10,ia of eachscientist (section S4.5), obtaining for large Ni
(see eq. S28 for finite Ni and fig. S28 for therelation between the two estimations of the Qparameter)
Qi ¼ eh log c10;ii−mp ð3Þ
Given its dependence on log c10,ia, Q is notdominated by a single high-impact (or low-
impact) discovery but captures instead a sci-entist’s sustained ability to systematically turnher projects into high-impact (or low-impact)publications. For example, although the threescientists in Fig. 3E have the same productivityN ≃ 100, Eq. 3 predicts widely different Q valuesfor them, namely, Q = 9.99, 3.31, and 1.49. Thesevalues accurately reflect persistent differences intheir sequence of publications: The Q = 9.99researcher consistently publishes high-impactpapers, whereas the publications of the Q = 1.49researcher are consistently of limited impact.Hence, the parameter Q captures a scientist’sdifferentiating ability to take random projectsp and systematically turn them into high-impact(or low-impact) publications.The Q-model makes the unexpected predic-
tion that despite the obvious differences in in-dividual career paths, differences in the impactof individual papers should disappear if we usethe reduced variable pa = c10,ia/Qi, a rescalingstandard in statistical physics (28, 29). Althoughthe individual P(c10,ia) distributions differ greatly,the P(c10,ia/Qi) distributions for all scientists collapseinto a single universal curve P(p) (Fig. 4B), confirm-ing the universal nature of impact across allcareers (30). Finally, the log-normal P (Q) (Fig.3G) confirms the model’s mathematical self-consistency.A fundamental limitation of all metrics used
in science is their nonstationarity: Productivity,the cumulative number of citations, and the h-
index all grow in time, making it difficult tocompare individuals at different stages oftheir career. In contrast, we find that the Qparameter is independent of the career stage.To show this, we used a DN = 30 paper windowto measure changes in Q during the career of ascientist, observing that the Q parameter fluc-tuates narrowly throughout each career, withoutsystematic changes (Fig. 5A). The magnitude ofthese fluctuations is explained for 75% ofscientists by the stochastic nature of Q (sectionS4.9), because the estimated Q parameter lieswithin the uncertainty envelope provided by themodel. In the remaining 25% of the cases, thevariation in Q is slightly higher than the vari-ation predicted by the stochastic nature of themodel (Fig. 5B). However, the magnitude of thissurplus variation never exceeds 15%, and the aver-age relative error is always below 10% (sectionS4.9 and figs. S31 and S32).Finally, to test the stability of the Q param-
eter throughout the overall career, and not as afunction of productivity, N, we consider careerswith at least 50 papers and calculate their earlyand late Q parameters (Qearly and Qlate, respec-tively) using Eq. 3 on the first and second half oftheir papers, respectively. In this case, the sto-chastic uncertainty explains the differences be-tween Qearly and Qlate for the large majority ofscientists (95.1%, Fig. 5C). Together, these mea-surements indicate that the Q parameter isgenerally stable throughout a career, allowing
aaf5239-4 4 NOVEMBER 2016 • VOL 354 ISSUE 6312 sciencemag.org SCIENCE
Fig. 3. The Q-model.(A) Distribution of thepaper impact c10 acrossall publications in thedata set. The gray linecorresponds to alog-normal functionwith average m = 1.93and SD s2 = 1.05 (R2 =0.98). (B) Distributionof the total numberof papers published bya scientist (productivity).The gray line is a log-normal with m = 3.6and s2 = 0.57 [weightedKolmogorov-Smirnov(KS) test, P = 0.70].(C) Citations of thehighest-impact paper,
c10� , versus the number
of publications N duringa scientist’s career. Each gray point of the scatterplot corresponds to a scientist.The circles are the logarithmic binning of the scattered data. The cyan curverepresents the prediction of the R-model, assuming that the impact of eachpaper is extracted randomly from the distribution P(c10) of Fig. 2A.The red curvecorresponds to the analytical prediction (see eq. S35) of the Q-model (R2 =0.97; see section S4.6 and fig. S29 for goodness of the fit). (D) logc10� ver-sus hlog c10
−* i. Each gray point in the scatterplot corresponds to a scien-tist, where hlog c10
−* i is the average logarithm of her paper impact, excludingthe most-cited paper c10* . We report in cyan the R-model prediction and in redthe analytical prediction (see eq. S36) of the Q-model (R2 = 0.99; see sectionS4.6 and fig. S29 for goodness of the fit). (E) Cumulative impact distribution
of all papers published by three scientists with the same productivity, N ≃ 100,but different Q. (F) Distribution Pðp^Þ across all publications. For each paper aof scientist i, we have log pa = log c10,ia − log Qi, where log Qi ¼ hc10;ii − hp^i.Therefore, the distribution of p^ ¼ log p, except for a common translationalfactor mp, corresponds to the distribution of log c10,ia − h log c10,ii, which isa normal with m = 0 and s2 = 0.95 (KS test, p = 0.48). (G) Distribution ofparameter Q, P(Q), for all scientists. The gray line corresponds to a log-normal function with m = 0.93 and s2 = 0.46 (weighted KS test, p = 0.59).(H) Cumulative distribution of the rescaled impact c10,ia/Qi for the threescientists in (E). The black line corresponds to the universal distribution P(p).The collapse is predicted by Eq. 1.
A B C D
E F G H
RESEARCH | RESEARCH ARTICLE
on
Nov
embe
r 3,
201
6ht
tp://
scie
nce.
scie
ncem
ag.o
rg/
Dow
nloa
ded
from

us to offer quantitative predictions on the evo-lution of a scientific career.
The predictive power of the hiddenparameter Q
The true value of the Q parameter comes in itspredictive power:(i) The Q parameter allows us to estimate the
number of papers a scientist needs to write sothat her highest-impact paper gathers c10* cita-tions (Fig. 6B). We find that scientists with lowQ (≃1.2) must write at least 100 papers so thatone of them gathers on average 30 citations.Yet, a scientist with the same productivity butQ = 10 is expected to author a c10* = 250 paper.Doubling productivity will enhance only withseven citations the highest-impact paper of thelow-Q scientist (Q = 1.2), whereas it will boostwith more than 50 citations c10* for the high-Qscientist. Overall, Fig. 6B documents that forlow-Q scientists, increased productivity cannotboost substantially the chance of publishing a
high-impact work; hence, it is very unlikely thatthey “get lucky.”(ii) A scientist’s h-index, indicating that her
h most-cited papers gather at least h citations(12, 15), is jointly determined by the Q param-eter and the productivity N (section S4.11). Thisanalytical prediction reproduces not only theobserved h-index of all scientists (fig. S33B) butalso the evolution of the h-index during a sci-entist’s career (Fig. 6, C and D, and fig. S34A).Similar equations describe the cumulative num-ber of citations (Fig. 6D and figs. S33, D to F,and S34B) and the g-index (section S4.11), indi-cating that the traditional performance measuresare uniquely determined by Q. Given that Q isconstant in time, we conclude that productivityonly can account for career-wide changes in thesemeasures (Fig. 6, C and D).(iii) By determining the value of Q during the
early stages of a scientific career, we can use itto predict future career impact. The estimationerror DQ of Q decreases with the number of pub-
lished papers N and drops below 10% alreadyafter N = 20 publications (section S4.12). We cantherefore estimate Q based on a scientist’s firstN0 published papers in Eq. 3 and then use theanalytical expression of the h-index and of thetotal number of citations to predict the futureimpact of a scientist (section S4.12 and fig. S35).Given the stochastic nature of the Q-model, anuncertainty envelope accompanies the most likelyvalue of each impact metric. In Fig. 6E, for twoscientists, we show the h-index prediction up toN = 150 after we estimated Q from the first N0 =20 (top) and N0 = 50 (bottom) papers. Althoughthe initial h-index overlaps for the two scientists,their long-term impact diverges, a difference ac-curately predicted by the Q-model. Generalizingfor a larger sample of scientists, we find a strongcorrelation between the predicted and observedh-index (Fig. 6F). To quantify the Q model’s over-all predictive accuracy, we measured the fractionof times that the h-index falls within the envelopefor scientists with at least 100 papers. The zN
SCIENCE sciencemag.org 4 NOVEMBER 2016 • VOL 354 ISSUE 6312 aaf5239-5
Fig. 4. Careers andtheir Q parameter.(A) Left: Analyticallypredicted cumulativeimpact distributionsfor different Q. Theplot also highlightsthe impact distributionof the three scientistsshown in Fig. 2E. Thedetailed publicationrecord of each scientistis reported on theright, documenting thenotable differencesbetween them, giventheir different Q.(B) Left: Individualcumulative impactdistributions P(c10,i).Given the modestnumber of pub-lications N character-izing most scientistsand the impossibilityto compute statisti-cally meaningful dis-tributions for many ofthem, each distributionis computed acrossall publications of allscientists with thesame Qi.The color codecaptures their Qparameter, as shown in(A). Right: Cumulativedistributions of therescaled impact c10,i/Qi
for the scientists, indi-cating that the individ-ual distributionscollapse on the univer-sal distribution P(p).
A
B
RESEARCH | RESEARCH ARTICLE
on
Nov
embe
r 3,
201
6ht
tp://
scie
nce.
scie
ncem
ag.o
rg/
Dow
nloa
ded
from

score for each scientist captures the numberof SDs the real h-index deviates from the mostlikely h-index after N publications. We findthat 71% of scientists have z40 ≤ 2 based on N0 =20, which improves to 81% for N0 = 50 and z70(Fig. 6G). Together, we conclude that the es-timation of the Q parameter at early stageshas the capability to unveil the long-term careerimpact.(iv) To test whether Qi correlates with out-
standing impact, we ranked scientists on thebasis of Q, N, Ctot, c10* , and their h-index. To val-idate these rankings, we use a receiver operat-ing characteristic (ROC) plot that measures thefraction of Nobel laureates at the top of theranked list (Fig. 6A). We find that the Q-basedranking predicts Nobel-winning careers mostaccurately, offering the highest area of all rank-ing measures (Fig. 6A) and the highest precisionand recall (section S7 and fig. S45). Equally no-table is the finding that the predictive powers ofCtot, c10* , and the h-index are indistinguishablefrom each other and that the productivity N isthe least predictive. Similar results are obtainedif we use Qi to detect Dirac and Boltzmannmedalists (figs. S46 and S47). The early-careerQ has also the best accuracy in predicting Nobellaureates (section S7.1 and fig. S48).High-impact discoveries often result from col-
laborative work (31–33), mixing scientists withdifferent Qi. To explore the influence of collab-orators (34, 35), we used a credit allocation al-gorithm (22, 36) to attribute different impactshares to each author. We then repeated ourentire analysis, finding that the Q-model, withslightly revised parameters, can explain the re-sults (section S6.1 and figs. S40 to S43). Further,we find that Qi is robust to the omission of in-dividual collaborators (section S6.2 and fig. S44).Hence, although collaborative and team effectsmodulate the success of a particular publication,
individual collaborators have only limited influ-ence on Qi.
Summary and discussion
In summary, we offer empirical evidence thatimpact is randomly distributed within the se-quence of papers published by a scientist, im-plying that temporal changes in impact duringa scientific career can be explained by temporalchanges in productivity, luck, and the heavy-tailed nature of a scientist’s individual impactdistribution. This finding allowed us to system-atically untangle the role of productivity, luck,and a scientist’s Q, predicting that truly high-impact papers require a combination of highQ and luck (high p) and that high productivityalone has only a limited effect on the like-lihood of high-impact work in a scientific career,if it is not associated with high Q. The mea-surable Q parameter represents a scientist’ssustained ability to publish high-impact (orlow-impact) papers.Virtually, all currently used metrics of per-
formance change during the career of a scien-tist, capturing progression, not sustained ability.In contrast, Q is constant throughout a scientist’scareer for most scientists (76%), and it is not dom-inated by a single paper or collaborator, beinga measure intrinsically linked to an individual.The fundamental nature of the Q parameter issupported by the fact that the currently usedmetrics of success, from the h-index to cumulativecitations, can be calculated from it. Q predicts notonly the value but also the time evolution of thetraditional impact metrics (Fig. 6, C to F).All findings presented above are based on a
subset of 2887 physicists with a career spanningat least 20 years and a persistent publicationrecord. These scientists have reached a mid- orlate-career stage and hence can be consideredsuccessful as they survived many selection pro-
cesses in academia. Although our findings holdin at least six more different disciplines (seesection S1.2) and are robust to relaxing the se-lection criteria (see section S1.4), the studied datasets do not feature young scientists who have leftacademia early and hence have published only afew papers.Throughout this work, we have treated long-
term impact, as captured by c10* , as an exogenousvariable. It seems reasonable, however, that pro-ductivity and impact could influence each other.From amechanistic perspective, for example, someearly promising publications might help attract theresources leading to further productivity growth.Early-career impact, quantified with the averagehc10i for the first 10 papers of a scientist, is as-sociated with career longevity, indicating thatthe probability to stay in academia is slightlyinfluenced by the impact of a scientist’s earlypublications (fig. S49). The Q-model also indi-cates that the overall number of papers in acareer weakly correlates with high Q (Eq. 2).Although the Q-model and the predictions pro-vided here are immune from a possible couplingbetween early impact and overall productivity(section S5), these preliminary findings call formore measurements and models that can accu-rately capture the coevolution of short-term earlyimpact and productivity (37).Although Q can accurately predict a career
impact, the dependence of Q on exogenous fac-tors, such as the quality of the education and cur-rent institution (38, 39), size of the researchcommunity (24, 40), gender (41, 42), dynamicsof subfields (43, 44), or publication habits, re-mains unknown. Mathematically speaking, themodel remains the same if the Q parameter re-flects other factors that characterize a scientist.The various robustness checks we performed todiscover possible confounding factors, such ascareer length, decade, team effects, and the analysis
aaf5239-6 4 NOVEMBER 2016 • VOL 354 ISSUE 6312 sciencemag.org SCIENCE
Fig. 5. Stability ofthe Q parameter.(A) Time variation ofthe Q parameter duringindividual careers. Forscientists with at least100 papers and Q ≃1.2, Q ≃ 3.8, and Q ≃6.5, we report Q(DN),measured in a movingwindow of DN = 30papers. For 75% ofthe scientists, thefluctuations arebecause we have afinite number of papers in the moving window, the magnitude of thechanges being comparable to that predicted by the model with a constantQ (section S4.9). (B) Fluctuations of the Q parameter in model and data.
We study the distribution of the uncertainty,QðDNÞ
Q, in both data and syn-
thetic careers with constant Q (DN = 5). For 74.7% of the scientists, thefluctuations are comparable to those of the model. For the remaining 25.3%,the SD is slightly higher than the one predicted by the model. (C) Comparisonbetween early and late Q parameter.We compare the Q parameter at early-
career (Qearly) and late-career (Qlate) stage of 823 scientists with at least50 papers. We measured the two values of the parameters using only thefirst and second half of published papers, respectively. We perform thesemeasurements on the real data (circles) and on randomized careers, wherethe order of papers is shuffled (gray shaded areas). For most of the careers,95.1%, the changes between early- and late-career stages fall within thefluctuations predicted by the null model with randomized paper order, indicatingthat the Q parameter is stable throughout a career. The observed fluctuationsare explained by the finite number of papers in a scientist’s career.
A B C
RESEARCH | RESEARCH ARTICLE
on
Nov
embe
r 3,
201
6ht
tp://
scie
nce.
scie
ncem
ag.o
rg/
Dow
nloa
ded
from

of different disciplines and data sets, have failed tooffer a simple, straightforward explanation forthe origin of the different Q values scientistshave. Most likely, the Q parameter is affected bymultiple factors, rather than a single one, andmore information about its nature might be un-veiled once other detailed career information,such as grants and awards, will be available andincluded in the analysis. Nevertheless, the keydifferentiating factor of Q from luck is that ithas to be sustained. Q is not determined by asingle paper, a lucky draw, but by a sustainedhigh performance, throughout the scientist’scareer. This is reflected in the hlog c10i term in
Eq. 3, indicating that a single very high impactpaper has only a small impact on Q. A scientistneeds multiple high c10 papers to ensure a highQ. Uncovering the origin of the Q parameter is apromising future goal, which not only could offera better understanding of the emergence andevolution of scientific excellence but also mightimprove our ability to train and nurture high-impact scientists.
MethodsData sets
We explore two types of data sets: (i) the pub-lication record of 236,884 physicists publishing
in the journal family Physical Review from 1893to 2010 [American Physical Society (APS) dataset, see section S1.1 and figs. S1 and S2] and (ii)the combination of 24,630 Google Scholar ca-reer profiles with Web of Science (WoS) data,covering 514,896 publications in biology, chem-istry, cognitive sciences, ecology, economics, andneuroscience (WoS data set, described in sectionS1.2 and fig. S3). The results shown in this articlerefer to 2887 scientists, whose publication recordspans at least 20 years, who have at least 10 pub-lications and have authored at least one paperevery 5 years, derived from the APS data set (seesection S1.3).
SCIENCE sciencemag.org 4 NOVEMBER 2016 • VOL 354 ISSUE 6312 aaf5239-7
Fig. 6. Relationbetween Q and otherimpact indicators.(A) ROC plotcapturing the rankingof scientists based onQ, Ctot, h-index, c10* ,
and N. Each curverepresents the frac-tion of Nobel lau-reates versus thefraction of other sci-entists for a givenrank threshold. Thediagonal (no-discrimination line)corresponds to ran-dom ranking; the areaunder each curve pro-vides our accuracy torank high Nobel lau-reates. The rankingaccuracy is reported inthe legend, 1 being themaximum. Precisionand recall as a functionof rank are discussedin section S7. (B)Expected citations tothe highest-impact
paper, c10* , for a scien-tist with parameter Qand N publications.Theplot illustrates the verylow chance of a low Qresearcher to publish ahigh-impact paper. (C)Observed versus pre-dicted growth of the h-index for scientists with different Q. The plot documents the agreementbetween the analytically predicted h-index (eq. S38, continuous line) andthe observed value ⟨h(N)⟩, obtained by averaging the h-index for scientistswith the same Q (circles). (D) Top: Growth of the h-index for two scientistswith at least 200 papers and different Q as a function of the productivity N(blue circles), compared with the prediction of eq. S38 (red line). Bottom: Forthe two scientists in the top panels, we measure the cumulative number ofcitations as a function of N, Ctot (N), and compare with the prediction of eq.S39. The close agreement between observation and prediction in (C) and(D) shows that the time-independent Q captures an intrinsic property of ascientist and that other indicators, like the h-index or cumulative citations,are uniquely determined by Q and productivity. (E) For two scientists, we show
the h-index prediction as a function of N using only early-career information,namely, N0 = 20 (top) and N0 = 50 (bottom), to estimate the Q parameter.Although the initial h-index up to N0 = 20 highly overlaps for the twoscientists, their long-term impact diverges, a difference accurately predictedby the Q-model. (F) Scatterplots of predicted and real h-index at N = 60based on Q estimated at N0 = 20. The error bars indicate predictionquartiles (25 and 75%) in each bin and are colored green if y = x lies betweenthe two quartiles in that bin and red otherwise. The circles correspond tothe average h-index in that bin. (G) The zN score for each scientist cap-tures the number of SDs the real h-index deviates from the most likelyh-index after N publications. zN ≤ 2 indicates that the real data are within theprediction envelope.
C
D
A B
E F
G
RESEARCH | RESEARCH ARTICLE
on
Nov
embe
r 3,
201
6ht
tp://
scie
nce.
scie
ncem
ag.o
rg/
Dow
nloa
ded
from

Note that the APS data set contains only cita-tions within the Physical Review corpus (see sectionS1.1); for this reason, the specific number citationnumbers are systematically smaller compared tothe citations reported by the WoS database.Our findings are also supported by the anal-
ysis of different samples of scientists in the APSdata set, selected using a number of differentcriteria (see section S1.4), and by the analysis ofall other disciplines in the WoS data set, whichare reported in the Supplementary Materialsand referenced throughout the article.
Citation measures
Citation-based measures of impact are affectedby three major problems: (i) citations follow dif-ferent dynamics for different papers (6, 45), (ii)the average number of citations changes over time(24) and (iii) citation count is subfield-dependent(24). To overcome (i) for each paper, we use thecumulative number of citations the paper received10 years after its publication, c10, as a measureof its scientific impact (6, 45). We can correct for(ii) and (iii) by normalizing c10 by the average hc10iof papers published in the same year. Becausethese corrections do not alter our conclusionsfor the APS data set, we report results withoutnormalization. For the WoS data set, we insteadused normalized citation counts.
Q-model
The stochastic process behind the Q-model isdetermined by the joint probability P (p,Q,N).The model assumes that a scientist i has a pro-ductivity Ni and a parameter Qi sampled fromthe marginal distribution P (Q,N), and then ex-tracts Ni values of p from the conditional dis-tribution P(p|Q,N). By assuming that P (p,Q,N)follows a trivariate log-normal distribution withparameters m and S, we can write the likelihoodfunction Li that a scientist i with Qi and Ni hasa sequence of papers {a} with impact {Qipa}(see Eq. 1). Finally, with numerical optimizationmethods, we identify the maximum of the over-all log-likelihood function log L = Si Li, whichprovides the numerical estimate of m and S re-ported in Eq. 2 (see also sections S4.3 and S4.4).This approach also estimates Qi, obtained bymaximizing the likelihood function Li for eachscientist. The maximization provides an analyticalexpression for Qi, which, for large productivityNi, converges to Eq. 3 (see section S4.5)This procedure and the measured parame-
ters allow us to generate synthetic sequencesof publications: We first extract an individualparameter Q and a productivity N from thedistribution P (Q,N). Then, each paper in thesynthetic sequence is assigned an impact pQ,where p is randomly drawn from the distributionP(p), identical for all scientists.
REFERENCES AND NOTES
1. I. Fuyuno, D. Cyranoski, Cash for papers: Putting a premium onpublication. Nature 441, 792 (2006). doi: 10.1038/441792b;pmid: 16778850
2. J. A. Evans, J. Reimer, Open access and global participation inscience. Science 323, 1025 (2009). doi: 10.1126/science.1154562; pmid: 19229029
3. P. Azoulay, Research efficiency: Turn the scientific method onourselves. Nature 484, 31–32 (2012). doi: 10.1038/484031a;pmid: 22481340
4. B. Owens, Research assessments: Judgement day. Nature 502,288–290 (2013). doi: 10.1038/502288a; pmid: 24132272
5. O. Penner, R. K. Pan, A. M. Petersen, K. Kaski, S. Fortunato, Onthe predictability of future impact in science. Sci. Rep. 3, 3052(2013). doi: 10.1038/srep03052; pmid: 24165898
6. D. Wang, C. Song, A.-L. Barabási, Quantifying long-termscientific impact. Science 342, 127–132 (2013). doi: 10.1126/science.1237825; pmid: 24092745
7. J. A. Evans, Future science. Science 342, 44–45 (2013).doi: 10.1126/science.1245218; pmid: 24092715
8. S. Lehmann, A. D. Jackson, B. E. Lautrup, Measures ofmeasures. Nature 444, 1003–1004 (2006). doi: 10.1038/4441003a; pmid: 17183295
9. S. Lehmann, A. D. Jackson, B. E. Lautrup, A quantitativeanalysis of indicators of scientific performance. Scientometrics76, 369–390 (2008). doi: 10.1007/s11192-007-1868-8
10. F. Radicchi, S. Fortunato, B. Markines, A. Vespignani,Diffusion of scientific credits and the ranking of scientists.Phys. Rev. E 80, 056103 (2009). doi: 10.1103/PhysRevE.80.056103; pmid: 20365039
11. D. Hicks, P. Wouters, L. Waltman, S. de Rijcke, I. Rafols,Bibliometrics: The Leiden Manifesto for research metrics.Nature 520, 429–431 (2015). doi: 10.1038/520429a;pmid: 25903611
12. J. E. Hirsch, An index to quantify an individual’s scientific researchoutput. Proc. Natl. Acad. Sci. U.S.A. 102, 16569–16572 (2005).doi: 10.1073/pnas.0507655102; pmid: 16275915
13. S. Alonso, F. J. Cabrerizo, E. Herrera-Viedma, F. Herrera,h-Index: A review focused in its variants, computation andstandardization for different scientific fields. J. Informet. 3,273–289 (2009). doi: 10.1016/j.joi.2009.04.001
14. L. Bornmann, R. Mutz, S. E. Hug, H.-D. Daniel, A multilevelmeta-analysis of studies reporting correlations between the hindex and 37 different h index variants. J. Informet. 5, 346–359(2011). doi: 10.1016/j.joi.2011.01.006
15. D. E. Acuna, S. Allesina, K. P. Kording, Future impact:Predicting scientific success. Nature 489, 201–202 (2012).doi: 10.1038/489201a; pmid: 22972278
16. B. F. Jones, B. A. Weinberg, Age dynamics in scientificcreativity. Proc. Natl. Acad. Sci. U.S.A. 108, 18910–18914(2011). doi: 10.1073/pnas.1102895108; pmid: 22065777
17. P. Azoulay, J. S. Graff Zivin, G. Manso, Incentives and creativity:Evidence from the academic life sciences. RAND J. Econ. 42,527–554 (2011). doi: 10.1111/rand.2011.42.issue-3
18. A. M. Petersen, M. Riccaboni, H. E. Stanley, F. Pammolli,Persistence and uncertainty in the academic career. Proc. Natl.Acad. Sci. U.S.A. 109, 5213–5218 (2012). doi: 10.1073/pnas.1121429109
19. C.-K. Peng et al., Long-range correlations in nucleotidesequences. Nature 356, 168–170 (1992). doi: 10.1038/356168a0; pmid: 1301010
20. D. K. Simonton, Career landmarks in science: Individualdifferences and interdisciplinary contrasts. Dev. Psychol. 27,119–130 (1991). doi: 10.1037/0012-1649.27.1.119
21. D. K. Simonton, Creative productivity: A predictive andexplanatory model of career trajectories and landmarks.Psychol. Rev. 104, 66–89 (1997). doi: 10.1037/0033-295X.104.1.66
22. H.-W. Shen, A.-L. Barabási, Collective credit allocation inscience. Proc. Natl. Acad. Sci. U.S.A. 111, 12325–12330 (2014).doi: 10.1073/pnas.1401992111; pmid: 25114238
23. D. de Solla Price, Little Science, Big Science… and Beyond(Columbia University, 1963).
24. F. Radicchi, S. Fortunato, C. Castellano, Universality of citationdistributions: Toward an objective measure of scientific impact.Proc. Natl. Acad. Sci. U.S.A. 105, 17268–17272 (2008).doi: 10.1073/pnas.0806977105; pmid: 18978030
25. M. J. Stringer, M. Sales-Pardo, L. A. Nunes Amaral, Statisticalvalidation of a global model for the distribution of theultimate number of citations accrued by papers published in ascientific journal. J. Am. Soc. Inf. Sci. Technol. 61, 1377–1385(2010). doi: 10.1002/asi.v61:7; pmid: 21858251
26. E. J. Gumbel, Statistics of Extremes (Dover Publications, 1958).27. S. Coles, An Introduction to Statistical Modeling of Extreme
Values (Springer-Verlag, 2001).28. D. Rybski, S. V. Buldyrev, S. Havlin, F. Liljeros, H. A. Makse, Scaling
laws of human interaction activity. Proc. Natl. Acad. Sci. U.S.A. 106,12640–12645 (2009). doi: 10.1073/pnas.0902667106; pmid: 19617555
29. D. Garlaschelli, G. Caldarelli, L. Pietronero, Universal scalingrelations in food webs. Nature 423, 165–168 (2003).doi: 10.1038/nature01604; pmid: 12736684
30. T. Vicsek, A question of scale. Nature 411, 421 (2001).doi: 10.1038/35078161; pmid: 11373653
31. S. Wuchty, B. F. Jones, B. Uzzi, The increasing dominanceof teams in production of knowledge. Science 316, 1036–1039(2007). doi: 10.1126/science.1136099; pmid: 17431139
32. B. F. Jones, S. Wuchty, B. Uzzi, Multi-university researchteams: Shifting impact, geography, and stratification inscience. Science 322, 1259–1262 (2008). doi: 10.1126/science.1158357; pmid: 18845711
33. J. A. Evans, J. G. Foster, Metaknowledge. Science 331, 721–725(2011). doi: 10.1126/science.1201765; pmid: 21311014
34. J. Moody, D. R. White, Structural cohesion and embeddedness:A hierarchical concept of social groups. Am. Soc. Rev. 68,103–127 (2003).
35. R. D. Malmgren, J. M. Ottino, L. A. N. Amaral, The role ofmentorship in protégé performance. Nature 465, 622–626(2010). doi: 10.1038/nature09040; pmid: 20520715
36. C.-T. Zhang, A proposal for calculating weighted citationsbased on author rank. EMBO Rep. 10, 416–417 (2009).doi: 10.1038/embor.2009.74
37. K. Börner, J. T. Maru, R. L. Goldstone, The simultaneous evolutionof author and paper networks. Proc. Natl. Acad. Sci. U.S.A. 101,5266 (2004). doi: 10.1073/pnas.0307625100; pmid: 14976254
38. P. Deville et al., Career on the move: Geography, stratification,and scientific impact. Sci. Rep. 4, 4770 (2014). doi: 10.1038/srep04770
39. A. Clauset, S. Arbesman, D. B. Larremore, Systematic inequalityand hierarchy in faculty hiring networks. Sci. Adv. 1,e1400005(2015). doi: 10.1126/sciadv.1400005; pmid: 26601125
40. J. Kaur, F. Radicchi, F. Menczer, Universality of scholarlyimpact metrics. J. Informet. 7, 924–932 (2013).doi: 10.1016/j.joi.2013.09.002
41. V. Larivière, C. Ni, Y. Gingras, B. Cronin, C. R. Sugimoto,Bibliometrics: Global gender disparities in science. Nature 504,211–213 (2013). doi: 10.1038/504211a; pmid: 24350369
42. S. F. Way, D. B. Larremore, A. Clauset, Proceedings of the 25thInternational Conference on World Wide Web, Geneva,Switzerland, 11 to 15 April 2016.
43. K. K. Mane, K. Börner, Mapping topics and topic bursts inPNAS. Proc. Natl. Acad. Sci. U.S.A. 101, 5287–5290 (2004).doi: 10.1073/pnas.0307626100; pmid: 14978278
44. R. Sinatra, P. Deville, M. Szell, D. Wang, A.-L. Barabási,A century of physics. Nat. Phys. 11, 791–796 (2015).doi: 10.1038/nphys3494
45. S. Redner, Citation statistics from 110 years of Physical Review.Phys. Today 58, 49–54 (2005). doi: 10.1063/1.1996475
ACKNOWLEDGMENTS
The Physical Review data set can be requested from the APS at http://journals.aps.org/datasets. Data with the result of the disambiguationprocedure, described in section S1.1, can be found as supplementarymaterials. An interactive visualization of the data sets, focusing on therandom-impact rule, can be found at www.barabasilab.com/scienceofsuccess/. We thank J. A. Evans, S. Fortunato, S. Lehmann,B. Uzzi, B. Coutinho, S. Gil, E. Guney, J. Huang, J. Menche, F. Simini,M. Szell, and all other colleagues at the Center for Complex NetworkResearch (CCNR) for the valuable discussions and comments. Wethank H. Shen for the help with the credit share analysis. R.S. andA.-L.B. were supported by Air Force Office of Scientific Research(AFOSR) grants FA9550-15-1-0077 and FA9550-15-1-0364. A.-L.B. wasalso supported by the Future and Emerging Technologies Project 317532 “Multiplex” financed by the European Commission. D.W. wassupported by AFOSR grant FA9550-15-1-0162 and a Young InvestigatorAward. P.D. acknowledges support by the National Foundation forScientific Research and the Research Department of the Communautéfrançaise de Belgique (Large Graph Concerted Research Action).R.S. developed the majority of this work during her stay at the CCNR,supported by the J. S. McDonnell Foundation. All authors designed anddid the research. R.S. analyzed the empirical data, developed themodels and controls, and performed the calculations. A.-L.B. was thelead writer of the manuscript.
SUPPLEMENTARY MATERIALS
www.sciencemag.org/content/354/6312/aaf5239/suppl/DC1Materials and MethodsSupplementary TextFigs. S1 to S49Supplementary dataReferences
1 November 2014; resubmitted 22 February 2016Accepted 29 September 201610.1126/science.aaf5239
aaf5239-8 4 NOVEMBER 2016 • VOL 354 ISSUE 6312 sciencemag.org SCIENCE
RESEARCH | RESEARCH ARTICLE
on
Nov
embe
r 3,
201
6ht
tp://
scie
nce.
scie
ncem
ag.o
rg/
Dow
nloa
ded
from

(6312), . [doi: 10.1126/science.aaf5239]354Science Albert-László Barabási (November 3, 2016) Roberta Sinatra, Dashun Wang, Pierre Deville, Chaoming Song andQuantifying the evolution of individual scientific impact
Editor's Summary
, this issue p. 596Scienceeach scientist and remains constant during the scientist's career.
that is particular toQmodel of impact, based on an element of randomness, productivity, and a factor generating a high-impact paper is not an entirely random one. The authors developed a quantitativepaper with the greatest impact occurs randomly in a scientist's career. However, the process of productivity (which is usually greatest early in the scientist's professional life) is accounted for, thepublications of 2887 physicists, as well as data on scientists publishing in a variety of fields. When
analyzed theet al.Are there quantifiable patterns behind a successful scientific career? Sinatra Qthat is the −−Scientific impact
This copy is for your personal, non-commercial use only.
Article Tools
http://science.sciencemag.org/content/354/6312/aaf5239article tools: Visit the online version of this article to access the personalization and
Permissionshttp://www.sciencemag.org/about/permissions.dtlObtain information about reproducing this article:
is a registered trademark of AAAS. ScienceAdvancement of Science; all rights reserved. The title Avenue NW, Washington, DC 20005. Copyright 2016 by the American Association for thein December, by the American Association for the Advancement of Science, 1200 New York
(print ISSN 0036-8075; online ISSN 1095-9203) is published weekly, except the last weekScience
on
Nov
embe
r 3,
201
6ht
tp://
scie
nce.
scie
ncem
ag.o
rg/
Dow
nloa
ded
from