science notebook layout don’t copy underlined text mrs. aguirre’s webpage: density of solids...
TRANSCRIPT
QuickTime™ and aTIFF (LZW) decompressor
are needed to see this picture.
Science Notebook Layout DON’T COPY UNDERLINED TEXTMrs. Aguirre’s Webpage: http://www.quia.com/profiles/caguirre
Density of Solids Introduction to DensityWhich weighs more, a pound of feathers or a pound of
bricks? Explain.Data Table:
2524
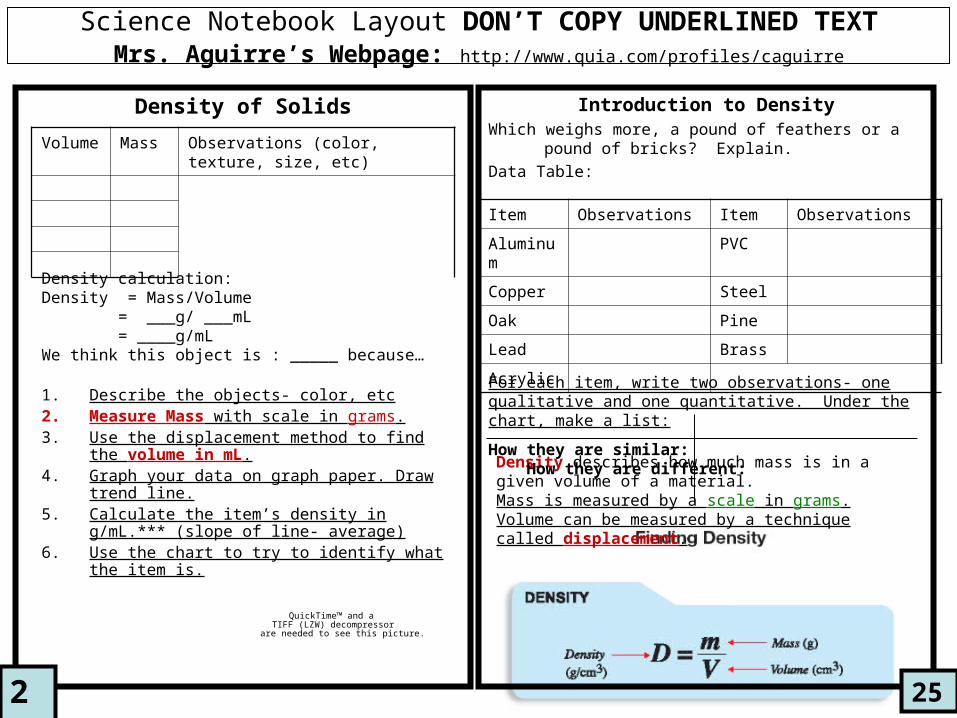
Density describes how much mass is in a given volume of a material.Mass is measured by a scale in grams.Volume can be measured by a technique called displacement.
Item Observations Item Observations
Aluminum PVC
Copper Steel
Oak Pine
Lead Brass
Acrylic
For each item, write two observations- one qualitative and one quantitative. Under the chart, make a list:
How they are similar: How they are different:
Volume Mass Observations (color, texture, size, etc)
Density calculation: Density = Mass/Volume
= ___g/ ___mL = ____g/mL
We think this object is : _____ because…
1. Describe the objects- color, etc2. Measure Mass with scale in grams.3. Use the displacement method to find the volume
in mL.4. Graph your data on graph paper. Draw trend line.5. Calculate the item’s density in g/mL.*** (slope of
line- average)6. Use the chart to try to identify what the item is.

Science Notebook Layout DON’T COPY UNDERLINED TEXTMrs. Aguirre’s Webpage: http://www.quia.com/profiles/caguirre
Conclusion :Label paper cups: R and B for red and blue. Mark a line about 1/3 of the
way from bottomPut 1 level tsp of each mix in your cups. Test the aroma (use correct technique) and appearance of each. Record
ratings.Use the toothpick to taste each dry mix. Record ratings.Mix with water: Recipe Don't mix up the spoons.1 level tsp. powder + 1/3 of
the small cup of warm water. STIR WITH TOOTHPICK!!
Analysis of cocoa lab
1. The experimental variable is __________
2. Variables we Made the Test
Controlled: Unfair:
3. How could bias influence the outcome of the cocoa lab?
4. Assume 2 brands of cocoa-explain how we could have done an experiment that was not biased.
A. List at least 3 things we SHOULD have done so as not to be biased
B. Include ways to make it a “blind taste test”.
C. PICTURES!!
Tape in Cocoa Lab WS
2322
QuickTime™ and a decompressor
are needed to see this picture.
Use 6 lines ONLY!!

Science Notebook Layout DON’T COPY UNDERLINED TEXTMrs. Aguirre’s Webpage: http://www.quia.com/profiles/caguirre
Graph of Data My job: _________
Investigation 2B: Making PredictionsRead page 8 of the Lab Manual
1. What is a model? 2. What will we use the model we create for?
3. QUESTION: ______________________________
4. Independent (experimental ) Variable: _________
5. Dependent (measured) Variable: _______________
6. Controlled Variables:•• (List at least 4)••
2120
Distance of Photogates (cm)
Time (seconds)
10
20
30
50
60
DATA TABLE: COPY FROM PAGE 9
Predictions:
I predict that it will take ___ sec for it to go 80 cm.
I predict that it will take it ___ seconds to go 90 cm.
0
0.1
0.2
0.3
0.4
0.5
0.6
0.7
0.8
0.9
0 10 20 30 40 50 60 70 80 90 100
Distance of Photogates (cm)
Time (seconds)

0.100
0.150
0.200
0.250
0.300
0.350
0.400
0.450
0.500
0 1 2 3
Marbles Added to Car
Time (seconds)
Science Notebook Layout DON’T COPY UNDERLINED TEXTMrs. Aguirre’s Webpage: http://www.quia.com/profiles/caguirre
Conclusion Paragraph:
Topic sentence and conclusion
Answer the question
Did data support hypothesis?
Explain using Supporting data (averages)
Why do you think the hypothesis was correct or not ?
What variables did you have to control to make it a fair test?
Graph of Data
My job: _________Problem:Does increasing the mass of a car make it go down a ramp
faster? Skip 1 lineHypothesis:If we increase the mass of the car, it will …………….
Skip 1 lineProcedure:1. Ramp- which hole?2. Photogates- where? A,B?, interval?3. Clay4. Roll car 3 times to get similar time (0.001 accuracy)5. Add weight?Experimental Variable: Weight of car
1918
Controlled Variable How controlled
1.Height of ramp Everyone place at 9th hole
2. Photogates Everyone place at outer black rings
3.
4.
Weights in car Time (seconds)
no marble
1 weight
2 weights
3 weights
Data Table:
Materials List:

QuickTime™ and a decompressor
are needed to see this picture.
Science Notebook Layout DON’T COPY UNDERLINED TEXTMrs. Aguirre’s Webpage: http://www.quia.com/profiles/caguirre
Discussion for Lab 2A1. Hypothesis: Cars on steep ramps have
shorter times between photogates.2. Do the results of the 2nd trial agree with
the hypothesis better than the 1st trial?Explain why..
3. Draw a graph of your data for trial 2 4. Draw a picture of the proper setup of
ramps to control variables- do not forget labels!!
• Move the photogates to the 2 higher black circles.
• Unscrew the starting bolt all the way.
• Release car “other man” style, no push
• Release the car until you get 3 runs with the time within .001 sec of each other.
My job: _________
1716
Steepness Graph
0.2000
0.2500
0.3000
0.3500
0.4000
0.4500
0.5000
0.5500
0.6000
3 5 7 9 11 13
Number of Holes
Time (seconds)

Science Notebook Layout DON’T COPY UNDERLINED TEXTMrs. Aguirre’s Webpage: http://www.quia.com/profiles/caguirre
pg 14: Name at top of page.
Measurements have two parts: the number and the unit.
– The number or quantity answers the questions, “How much?” or “How many?”
– The unit is the way the number is measured.
Make a detailed drawing of the ramp:
Tape in WS 1B
1514
QuickTime™ and aTIFF (Uncompressed) decompressor
are needed to see this picture.
QuickTime™ and a decompressor
are needed to see this picture.
Use 10Lines
•Label photogates correctly "A" & "B".•Show wires hooked up to timer correctly (color red or blue)(Use Red for A and Blue for B•Draw cars going through photogates, tell what happens to timer.•Below picture: Answer questions with a paragraph:•1. Should timer be set for "stopwatch" or "interval"? Why?•2. Which lights should be on, A, B, or both? Why?•3. Describe what will happen to time when a car rolls down

Science Notebook Layout DON’T COPY UNDERLINED TEXTMrs. Aguirre’s Webpage: http://www.quia.com/profiles/caguirre
Science Lab Safety Poster– Neat
– Colored
– Safety slogan
– Pictures
– (due Tuesday 10/6/09) Safety Problems - color coded to picture12345678910. 1312
Tape in Prof. I Furgot handout
Science Notebook Layout DON’T COPY UNDERLINED TEXTMrs. Aguirre’s Webpage: http://www.quia.com/profiles/caguirre
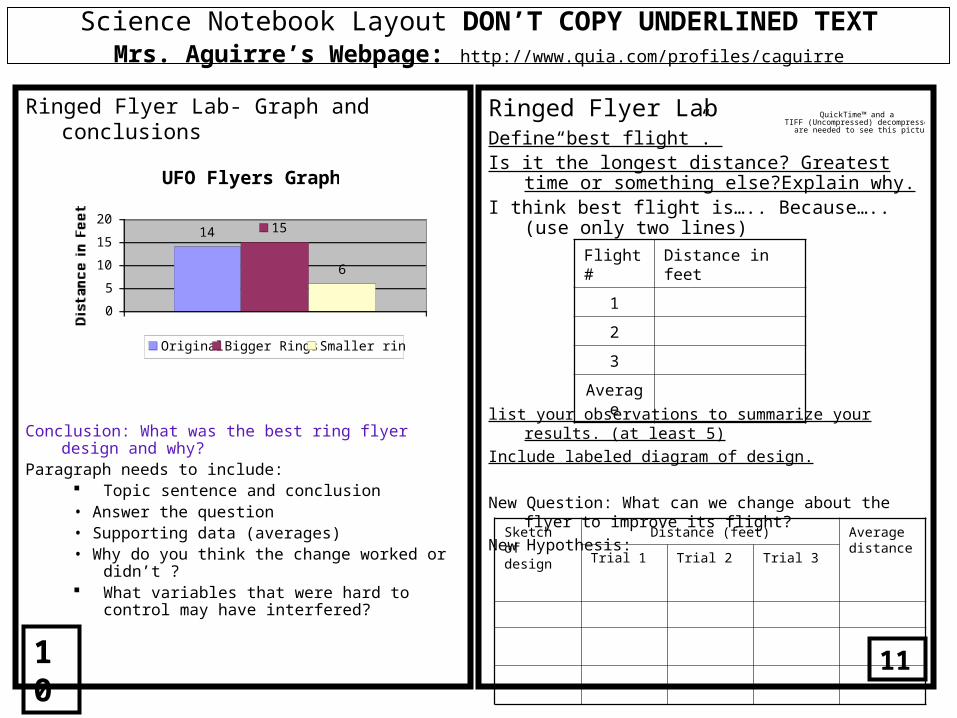
Ringed Flyer Lab- Graph and conclusions
Conclusion: What was the best ring flyer design and why?Paragraph needs to include:
Topic sentence and conclusion• Answer the question• Supporting data (averages)• Why do you think the change worked or didn’t ? What variables that were hard to control may have
interfered?
Ringed Flyer LabDefine“best flight”. Is it the longest distance? Greatest time or something
else?Explain why. I think best flight is….. Because…..(use only two lines)
list your observations to summarize your results. (at least 5)
Include labeled diagram of design.
New Question: What can we change about the flyer to improve its flight?
New Hypothesis:
1110
Sketchof design
Distance (feet) Averagedistance
Trial 1 Trial 2 Trial 3
QuickTime™ and aTIFF (Uncompressed) decompressor
are needed to see this picture.
Flight # Distance in feet
1
2
3
Average
UFO Flyers Graph
14 15
6
0
5
10
15
20
Distance in Feet
Original Bigger Rings Smaller rings

Science Notebook Layout DON’T COPY UNDERLINED TEXTMrs. Aguirre’s Webpage: http://www.quia.com/profiles/caguirre
Cartesian Diver Activity- p.8
6. What makes the cartesian diver sink?
What is it about squeezing the bottle that suddenly makes something that floats sink?
7. Write a new question and hypothesis involving the air in the diver. What combination of air and water is best to make a cartesian diver sink and float easily? Can you make a diver out of other materials?
Cartesian Diver
1. Question: What makes the diver go up and down?
Skip 1 line
2. Hypothesis: The magnet attracts the diver and makes it sink. Skip 1 line
3.Record basic observations of the behavior of the diver.
Record at least three questions about the diver.
98
We know Questions
Use no more than 7 lines
4. Was hypothesis correct?
5. Write and draw out your explanation of how the diver works
use the rest of the page- put a box around your drawing and explanation
QuickTime™ and aTIFF (LZW) decompressor
are needed to see this picture.

Science Notebook Layout DON’T COPY UNDERLINED TEXTMrs. Aguirre’s Webpage: http://www.quia.com/profiles/caguirre
Leave blank for now Leave blank for now
76

QuickTime™ and a decompressor
are needed to see this picture.
Science Notebook Layout DON’T COPY UNDERLINED TEXTMrs. Aguirre’s Webpage: http://www.quia.com/profiles/caguirre
Leave blank • RAT for pages 37-42 of textbook
54
QuickTime™ and a decompressor
are needed to see this picture.
Science Notebook Layout DON’T COPY UNDERLINED TEXTMrs. Aguirre’s Webpage: http://www.quia.com/profiles/caguirre
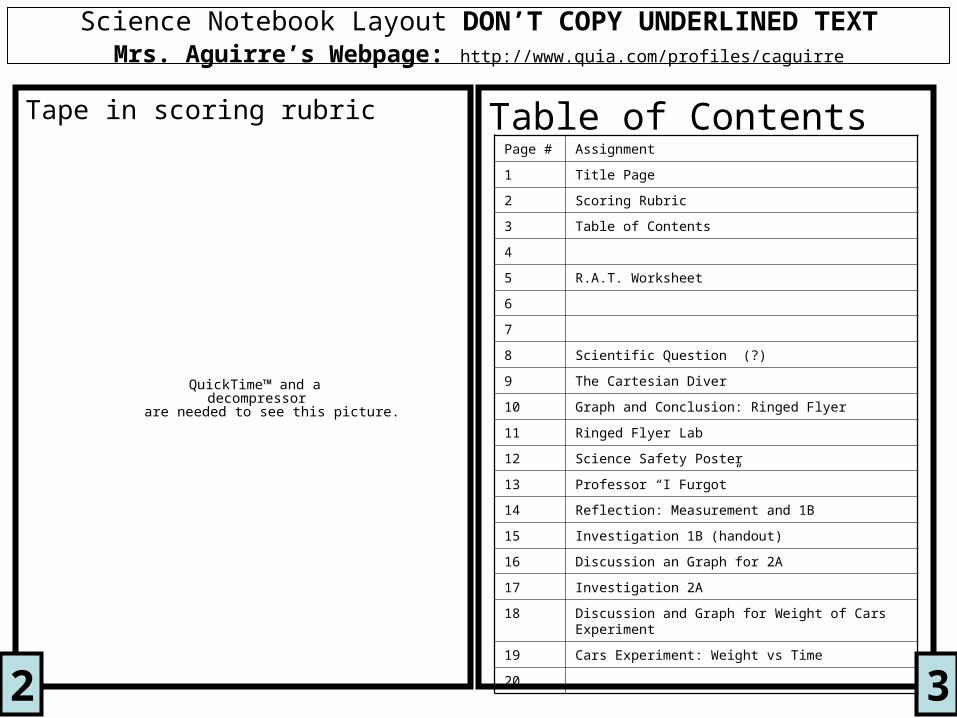
Tape in scoring rubric Table of Contents
32
Page # Assignment
1 Title Page
2 Scoring Rubric
3 Table of Contents
4
5 R.A.T. Worksheet
6
7
8 Scientific Question (?)
9 The Cartesian Diver
10 Graph and Conclusion: Ringed Flyer
11 Ringed Flyer Lab
12 Science Safety Poster
13 Professor “I Furgot”
14 Reflection: Measurement and 1B
15 Investigation 1B (handout)
16 Discussion an Graph for 2A
17 Investigation 2A
18 Discussion and Graph for Weight of Cars Experiment
19 Cars Experiment: Weight vs Time
20

Science Notebook Layout DON’T COPY UNDERLINED TEXTMrs. Aguirre’s Webpage: http://www.quia.com/profiles/caguirre
Inside cover Title page:
Totally covered with:�colored pictures,
�your name in block letters,
�Your period
1