science, research and innovation performance of the eu 2018
TRANSCRIPT

CHAPTER I.4
SCIENTIFIC, TECHNOLOGICAL AND INNOVATION PRODUCTIONScientific and technological production is the very basis of innovation outputs and reflects the efficiency and effectiveness of a research system in transforming investment in knowledge-creation activities into tangible and intangible assets that enable higher value-added activities. For innovation, the quest for excellence in scientific and technological activities is particularly important to ensure high-impact innovations, as well as favourable conditions for a thick weave of knowledge to flow.
Against this backdrop, and using a set of different measures, this chapter assesses the EU’s scientific, technological and innovation performance in an international context as well as the robustness of knowledge flows across different innovation stakeholders.
154
CHAPTER I.4-A SCIENTIFIC PRODUCTION AND SCIENTIFIC EXCELLENCE
Science is recognised at the global scale as an indispensable asset to understand and address today's economic and societal challenges, em-brace emerging opportunities, and create tech-nologies and innovations that benefit humanity and create wealth.
In terms of overall scientific production, Eu-rope is in the lead, ahead of the United States and China; a lead that has been maintained over time despite the emergence of an in-creasingly multipolar scientific landscape.
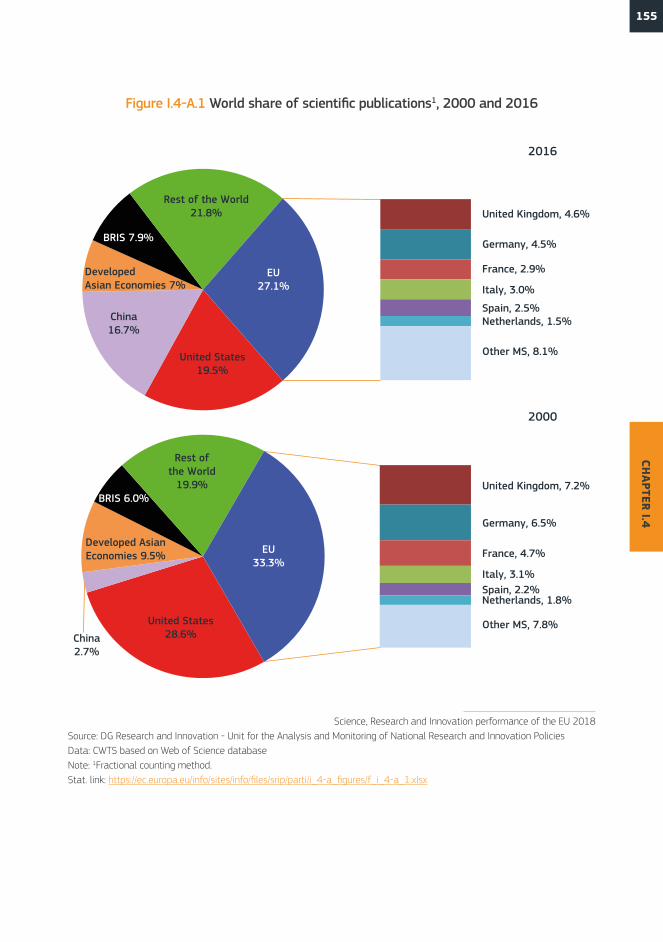
Back in 2000, the EU and the United States dominated global knowledge production, to-gether being the home for almost two-thirds of
scientific publications worldwide. However, Chi-na’s significant investment in science over the last two decades has started to pay off and the country’s world share of scientific publications has risen exponentially from 2.7 % in 2000 to 16.7 % in 2016. This has assured China a solid third position in the global ranking. Simultane-ously, the United States’ world share of scien-tific publications shrank from 28.6 % in 2000 to 19.5 % in 2016, increasing the gap with the EU, which managed to preserve its global lead-ership with over 27 % of the world's knowledge production (see Figure I.4-A.1).
155CH
APTER I.4
France, 2.9%
United Kingdom, 4.6%
Italy, 3.0%
Spain, 2.5%Netherlands, 1.5%
Germany, 4.5%
Other MS, 8.1%
France, 4.7%
United Kingdom, 7.2%
Italy, 3.1%Spain, 2.2%Netherlands, 1.8%
Germany, 6.5%
Other MS, 7.8%
Rest of the World 21.8%
Rest of the World
19.9%
BRIS 7.9%
BRIS 6.0%
Developed AsianEconomies 9.5%
DevelopedAsian Economies 7%
China 16.7%
China 2.7%
United States 19.5%
United States 28.6%
EU 27.1%
EU 33.3%
2016
2000
Figure I.4-A.1 World share of scientific publications1, 2000 and 2016
Science, Research and Innovation performance of the EU 2018Source: DG Research and Innovation - Unit for the Analysis and Monitoring of National Research and Innovation PoliciesData: CWTS based on Web of Science databaseNote: 1Fractional counting method.Stat. link: https://ec.europa.eu/info/sites/info/files/srip/parti/i_4-a_figures/f_i_4-a_1.xlsx
156
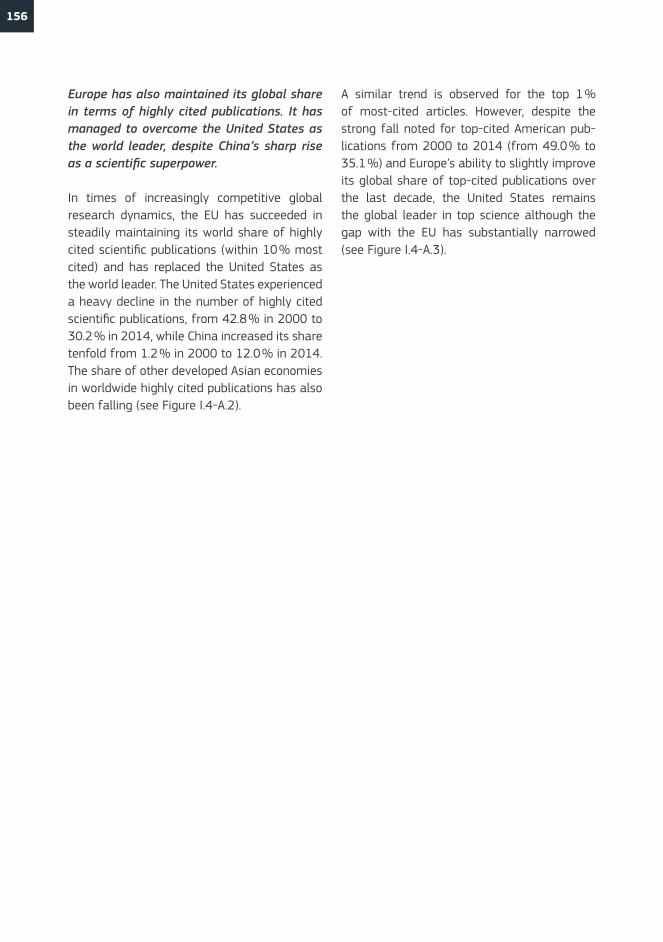
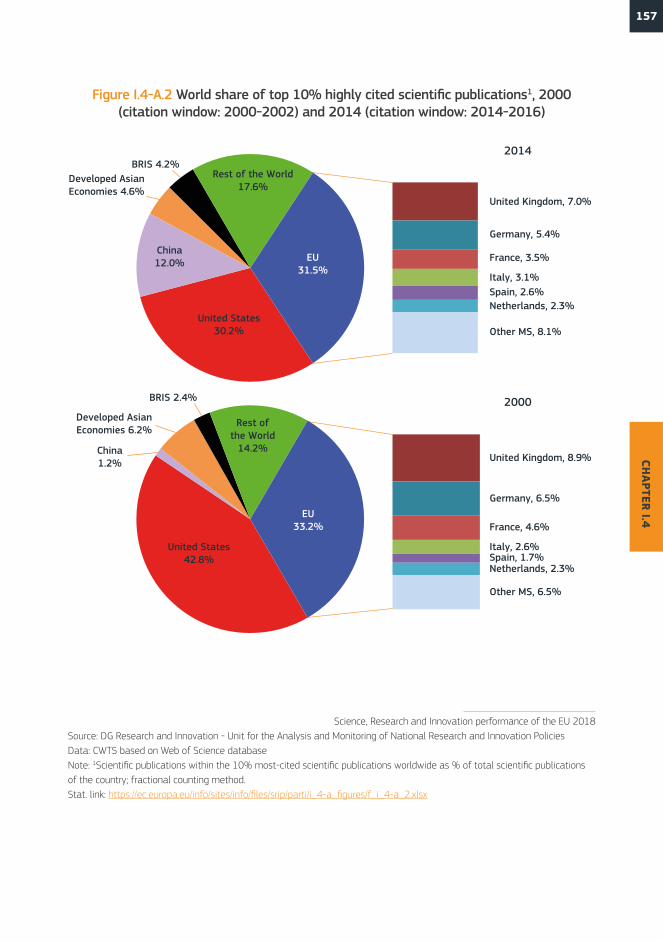
Europe has also maintained its global share in terms of highly cited publications. It has managed to overcome the United States as the world leader, despite China’s sharp rise as a scientific superpower.
In times of increasingly competitive global research dynamics, the EU has succeeded in steadily maintaining its world share of highly cited scientific publications (within 10 % most cited) and has replaced the United States as the world leader. The United States experienced a heavy decline in the number of highly cited scientific publications, from 42.8 % in 2000 to 30.2 % in 2014, while China increased its share tenfold from 1.2 % in 2000 to 12.0 % in 2014. The share of other developed Asian economies in worldwide highly cited publications has also been falling (see Figure I.4-A.2).
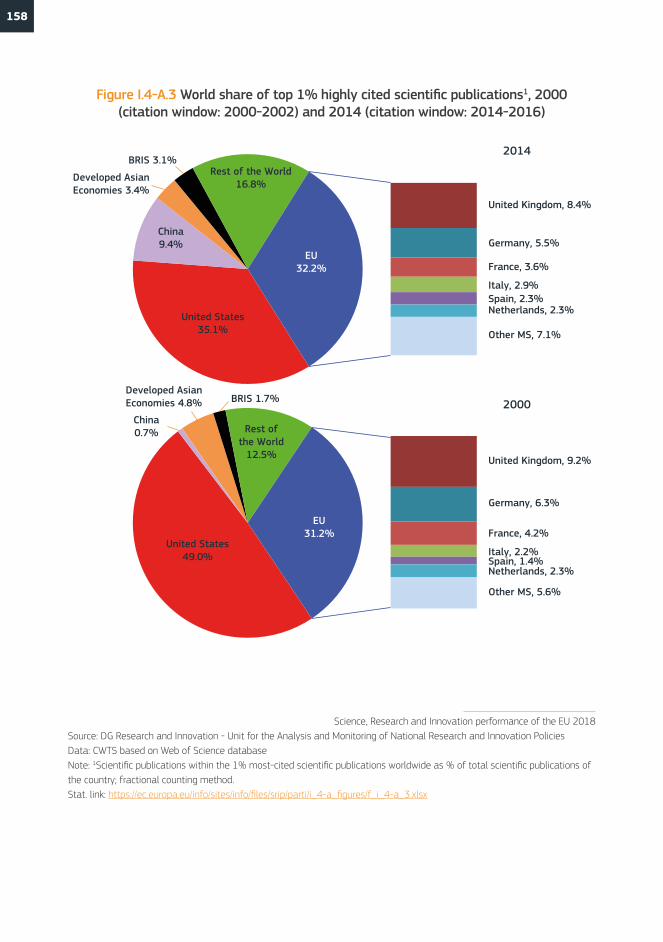
A similar trend is observed for the top 1 % of most-cited articles. However, despite the strong fall noted for top-cited American pub-lications from 2000 to 2014 (from 49.0 % to 35.1 %) and Europe’s ability to slightly improve its global share of top-cited publications over the last decade, the United States remains the global leader in top science although the gap with the EU has substantially narrowed (see Figure I.4-A.3).
157CH
APTER I.4
China 16,7%
China 1.2%
United States 30.2%
United States 42.8%
Rest of the World 17.6%
Rest of the World
14.2%
EU 31.5%
EU 33.2%
Developed AsianEconomies 6.2%
Developed AsianEconomies 4.6%
BRIS 2.4%
BRIS 4.2%
China 12.0% France, 3.5%
United Kingdom, 7.0%
Italy, 3.1%Spain, 2.6%Netherlands, 2.3%
Germany, 5.4%
Other MS, 8.1%
France, 4.6%
United Kingdom, 8.9%
Italy, 2.6%Spain, 1.7%Netherlands, 2.3%
Germany, 6.5%
Other MS, 6.5%
2014
2000
Figure I.4-A.2 World share of top 10% highly cited scientific publications1, 2000 (citation window: 2000-2002) and 2014 (citation window: 2014-2016)
Science, Research and Innovation performance of the EU 2018Source: DG Research and Innovation - Unit for the Analysis and Monitoring of National Research and Innovation PoliciesData: CWTS based on Web of Science databaseNote: 1Scientific publications within the 10% most-cited scientific publications worldwide as % of total scientific publications of the country; fractional counting method. Stat. link: https://ec.europa.eu/info/sites/info/files/srip/parti/i_4-a_figures/f_i_4-a_2.xlsx
158
United States 35.1%
Rest of the World 16.8%
EU 32.2%
Developed AsianEconomies 3.4%
BRIS 3.1%
China 9.4%
United States 49.0%
Rest ofthe World
12.5%
EU 31.2%
Developed AsianEconomies 4.8% BRIS 1.7%
China 0.7%
France, 3.6%
United Kingdom, 8.4%
Italy, 2.9%Spain, 2.3%Netherlands, 2.3%
Germany, 5.5%
Other MS, 7.1%
France, 4.2%
United Kingdom, 9.2%
Italy, 2.2%Spain, 1.4%Netherlands, 2.3%
Germany, 6.3%
Other MS, 5.6%
2014
2000
Figure I.4-A.3 World share of top 1% highly cited scientific publications1, 2000 (citation window: 2000-2002) and 2014 (citation window: 2014-2016)
Science, Research and Innovation performance of the EU 2018Source: DG Research and Innovation - Unit for the Analysis and Monitoring of National Research and Innovation PoliciesData: CWTS based on Web of Science databaseNote: 1Scientific publications within the 1% most-cited scientific publications worldwide as % of total scientific publications of the country; fractional counting method. Stat. link: https://ec.europa.eu/info/sites/info/files/srip/parti/i_4-a_figures/f_i_4-a_3.xlsx
159CH
APTER I.4
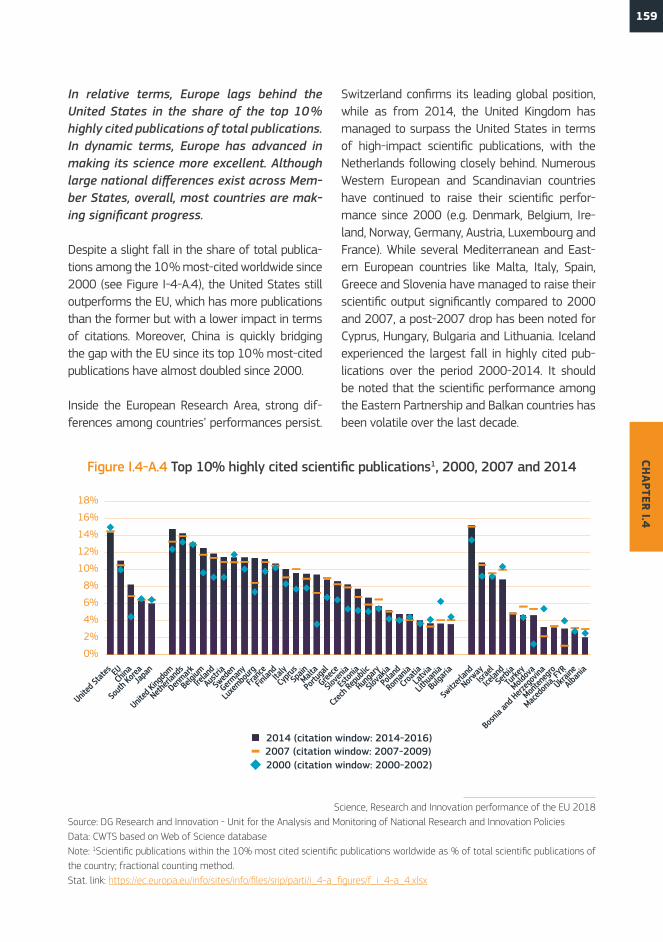
In relative terms, Europe lags behind the United States in the share of the top 10 % highly cited publications of total publications. In dynamic terms, Europe has advanced in making its science more excellent. Although large national differences exist across Mem-ber States, overall, most countries are mak-ing significant progress.
Despite a slight fall in the share of total publica-tions among the 10 % most-cited worldwide since 2000 (see Figure I-4-A.4), the United States still outperforms the EU, which has more publications than the former but with a lower impact in terms of citations. Moreover, China is quickly bridging the gap with the EU since its top 10 % most-cited publications have almost doubled since 2000.
Inside the European Research Area, strong dif-ferences among countries’ performances persist.
Switzerland confirms its leading global position, while as from 2014, the United Kingdom has managed to surpass the United States in terms of high-impact scientific publications, with the Netherlands following closely behind. Numerous Western European and Scandinavian countries have continued to raise their scientific perfor-mance since 2000 (e.g. Denmark, Belgium, Ire-land, Norway, Germany, Austria, Luxembourg and France). While several Mediterranean and East-ern European countries like Malta, Italy, Spain, Greece and Slovenia have managed to raise their scientific output significantly compared to 2000 and 2007, a post-2007 drop has been noted for Cyprus, Hungary, Bulgaria and Lithuania. Iceland experienced the largest fall in highly cited pub-lications over the period 2000-2014. It should be noted that the scientific performance among the Eastern Partnership and Balkan countries has been volatile over the last decade.
0%
2%
4%
6%
8%
10%
12%
14%
16%
18%
United
State
s EUCh
ina
South
KoreaJa
pan
United
King
dom
Netherl
ands
Denmark
BelgiumIre
land
Austri
a
Swed
en
German
y
Luxe
mbourgFra
nce
Finlan
dIta
lyCy
prusSp
ainMalt
a
Portu
gal
Greece
Slove
nia
Eston
ia
Czech
Repu
blic
Hunga
ry
Slova
kiaPo
land
Roman
ia
Croati
aLa
tvia
Lithu
ania
Bulgari
a
Switz
erlan
d
NorwayIsr
ael
Icelan
dSe
rbia
Turke
y
Moldov
a
Bosnia
and H
erzeg
ovina
Monten
egro
Maced
onia,
FYR
Ukraine
Albania
2014 (citation window: 2014-2016)2007 (citation window: 2007-2009)2000 (citation window: 2000-2002)
Figure I.4-A.4 Top 10% highly cited scientific publications1, 2000, 2007 and 2014
Science, Research and Innovation performance of the EU 2018Source: DG Research and Innovation - Unit for the Analysis and Monitoring of National Research and Innovation PoliciesData: CWTS based on Web of Science databaseNote: 1Scientific publications within the 10% most cited scientific publications worldwide as % of total scientific publications of the country; fractional counting method. Stat. link: https://ec.europa.eu/info/sites/info/files/srip/parti/i_4-a_figures/f_i_4-a_4.xlsx
160
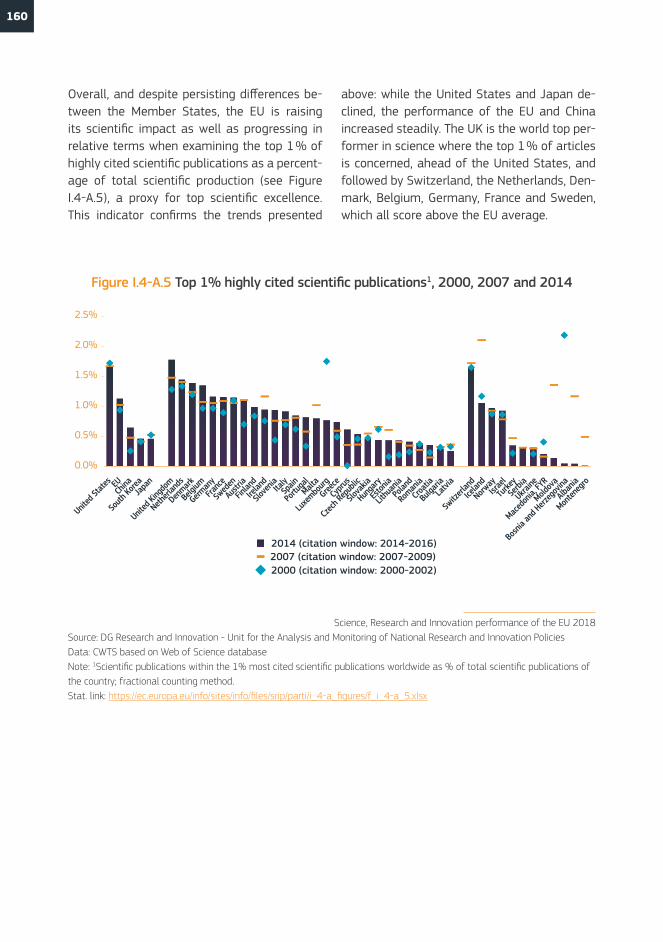
Overall, and despite persisting differences be-tween the Member States, the EU is raising its scientific impact as well as progressing in relative terms when examining the top 1 % of highly cited scientific publications as a percent-age of total scientific production (see Figure I.4-A.5), a proxy for top scientific excellence. This indicator confirms the trends presented
above: while the United States and Japan de-clined, the performance of the EU and China increased steadily. The UK is the world top per-former in science where the top 1 % of articles is concerned, ahead of the United States, and followed by Switzerland, the Netherlands, Den-mark, Belgium, Germany, France and Sweden, which all score above the EU average.
0.0%
0.5%
1.0%
1.5%
2.0%
2.5%
2014 (citation window: 2014-2016)2007 (citation window: 2007-2009)2000 (citation window: 2000-2002)
United
State
s EUCh
ina
South
KoreaJa
pan
United
King
dom
Netherl
ands
Denmark
Belgium
German
yFra
nce
Swed
en
Austri
a
Finlan
d
Irelan
d
Slove
niaItalySp
ain
Portu
gal
Malta
Luxe
mbourgGree
ceCy
prus
Czech
Repu
blic
Slova
kia
Hunga
ry
Eston
ia
Lithu
aniaPo
land
Roman
ia
Croati
a
Bulgari
aLa
tvia
Switz
erlan
d
Icelan
d
NorwayIsr
ael
Turke
ySe
rbia
Ukraine
Maced
onia,
FYR
Moldov
a
Bosnia
and H
erzeg
ovina
Albania
Monten
egro
Figure I.4-A.5 Top 1% highly cited scientific publications1, 2000, 2007 and 2014
Science, Research and Innovation performance of the EU 2018Source: DG Research and Innovation - Unit for the Analysis and Monitoring of National Research and Innovation PoliciesData: CWTS based on Web of Science databaseNote: 1Scientific publications within the 1% most cited scientific publications worldwide as % of total scientific publications of the country; fractional counting method. Stat. link: https://ec.europa.eu/info/sites/info/files/srip/parti/i_4-a_figures/f_i_4-a_5.xlsx
161CH
APTER I.4
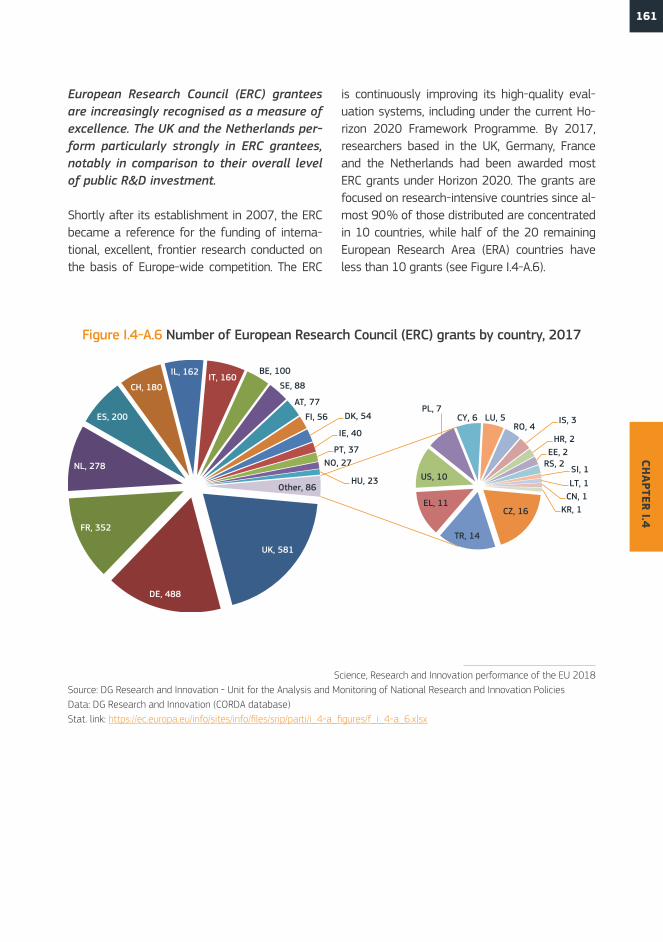
European Research Council (ERC) grantees are increasingly recognised as a measure of excellence. The UK and the Netherlands per-form particularly strongly in ERC grantees, notably in comparison to their overall level of public R&D investment.
Shortly after its establishment in 2007, the ERC became a reference for the funding of interna-tional, excellent, frontier research conducted on the basis of Europe-wide competition. The ERC
is continuously improving its high-quality eval-uation systems, including under the current Ho-rizon 2020 Framework Programme. By 2017, researchers based in the UK, Germany, France and the Netherlands had been awarded most ERC grants under Horizon 2020. The grants are focused on research-intensive countries since al-most 90 % of those distributed are concentrated in 10 countries, while half of the 20 remaining European Research Area (ERA) countries have less than 10 grants (see Figure I.4-A.6).
UK, 581
DE, 488
FR, 352
NL, 278
ES, 200
CH, 180
IL, 162IT, 160
BE, 100
SE, 88
AT, 77
FI, 56 DK, 54
IE, 40
PT, 37NO, 27
HU, 23
CZ, 16
TR, 14
EL, 11
US, 10
PL, 7CY, 6 LU, 5
RO, 4IS, 3
HR, 2EE, 2
RS, 2SI, 1LT, 1
CN, 1KR, 1
Other, 86
Figure I.4-A.6 Number of European Research Council (ERC) grants by country, 2017
Science, Research and Innovation performance of the EU 2018Source: DG Research and Innovation - Unit for the Analysis and Monitoring of National Research and Innovation PoliciesData: DG Research and Innovation (CORDA database)Stat. link: https://ec.europa.eu/info/sites/info/files/srip/parti/i_4-a_figures/f_i_4-a_6.xlsx
162
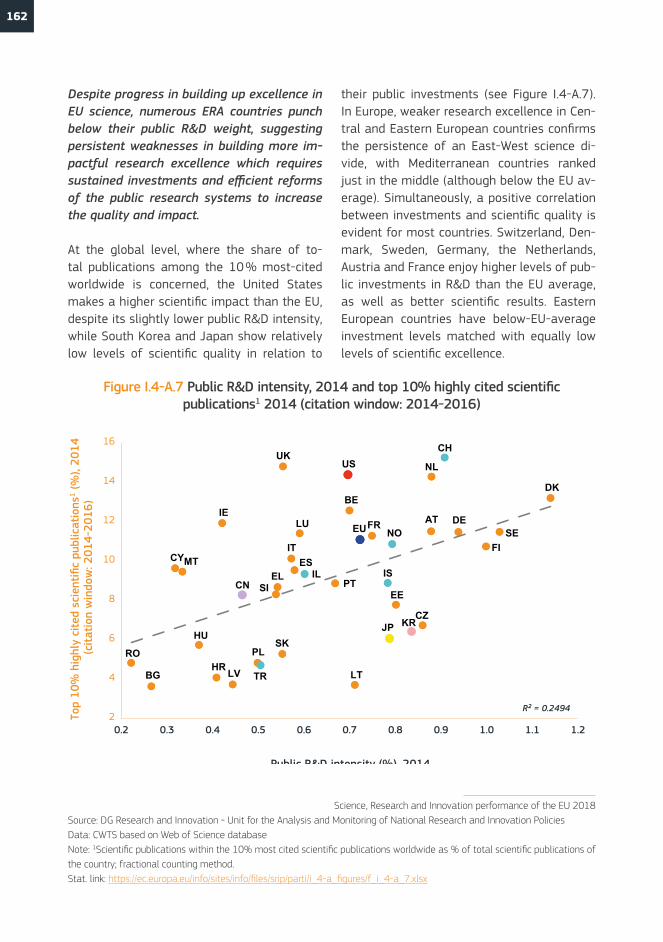
Despite progress in building up excellence in EU science, numerous ERA countries punch below their public R&D weight, suggesting persistent weaknesses in building more im-pactful research excellence which requires sustained investments and efficient reforms of the public research systems to increase the quality and impact.
At the global level, where the share of to-tal publications among the 10 % most-cited worldwide is concerned, the United States makes a higher scientific impact than the EU, despite its slightly lower public R&D intensity, while South Korea and Japan show relatively low levels of scientific quality in relation to
their public investments (see Figure I.4-A.7). In Europe, weaker research excellence in Cen-tral and Eastern European countries confirms the persistence of an East-West science di-vide, with Mediterranean countries ranked just in the middle (although below the EU av-erage). Simultaneously, a positive correlation between investments and scientific quality is evident for most countries. Switzerland, Den-mark, Sweden, Germany, the Netherlands, Austria and France enjoy higher levels of pub-lic investments in R&D than the EU average, as well as better scientific results. Eastern European countries have below-EU-average investment levels matched with equally low levels of scientific excellence.
KRJP
EU
US
CN
DK
SEFI
DE
NL
AT
CZ
EE
FR
LT
BE
PT
LU
ESIT
UK
SK
ELSI
PL
LV
IE
HR
HU
MTCY
BG
RO
CH
NO
ISIL
TR
R² = 0.24942
4
6
8
10
12
14
16
0.2 0.3 0.4 0.5 0.6 0.7 0.8 0.9 1.0 1.1 1.2
Top
10%
hig
hly
cite
d sc
ient
ific
publ
icat
ions
1 (%
), 20
14 (c
itat
ion
win
dow
: 201
4-20
16)
Public R&D intensity (%), 2014
Figure I.4-A.7 Public R&D intensity, 2014 and top 10% highly cited scientific publications1 2014 (citation window: 2014-2016)
Science, Research and Innovation performance of the EU 2018Source: DG Research and Innovation - Unit for the Analysis and Monitoring of National Research and Innovation PoliciesData: CWTS based on Web of Science databaseNote: 1Scientific publications within the 10% most cited scientific publications worldwide as % of total scientific publications of the country; fractional counting method. Stat. link: https://ec.europa.eu/info/sites/info/files/srip/parti/i_4-a_figures/f_i_4-a_7.xlsx
163CH
APTER I.4
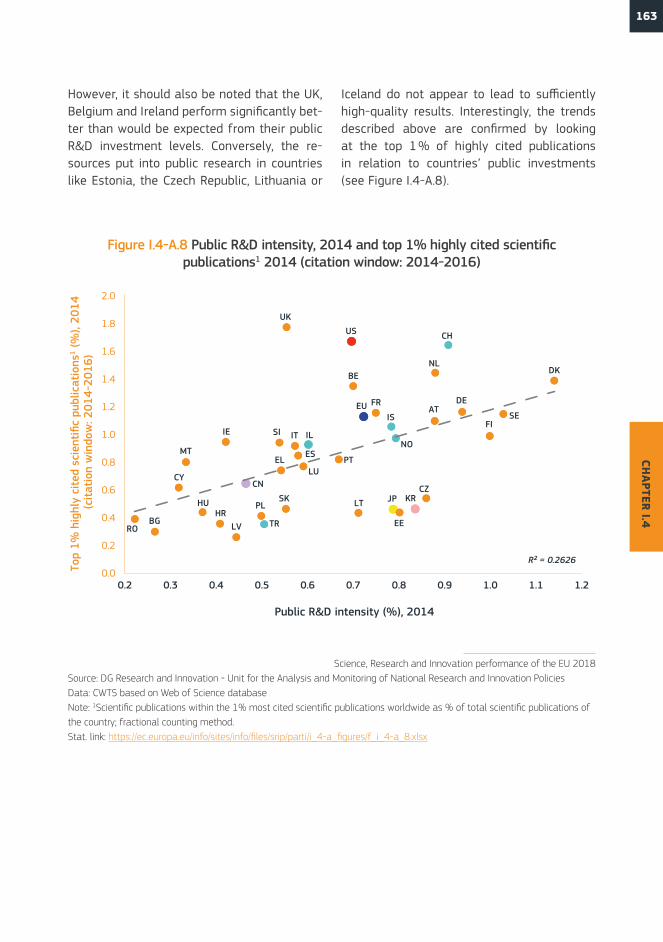
However, it should also be noted that the UK, Belgium and Ireland perform significantly bet-ter than would be expected from their public R&D investment levels. Conversely, the re-sources put into public research in countries like Estonia, the Czech Republic, Lithuania or
Iceland do not appear to lead to sufficiently high-quality results. Interestingly, the trends described above are confirmed by looking at the top 1 % of highly cited publications in relation to countries’ public investments (see Figure I.4-A.8).
KRJP
EU
US
CN
DK
SEFI
DE
NL
AT
CZ
EE
FR
LT
BE
PTLU
ES
IT
UK
SK
EL
SI
PL
LV
IE
HRHU
MT
CY
BGRO
CH
NO
IS
IL
TR
R² = 0.26260.0
0.2
0.4
0.6
0.8
1.0
1.2
1.4
1.6
1.8
2.0
0.2 0.3 0.4 0.5 0.6 0.7 0.8 0.9 1.0 1.1 1.2
Top
1% h
ighl
y ci
ted
scie
ntifi
c pu
blic
atio
ns1
(%),
2014
(cit
atio
n w
indo
w: 2
014-
2016
)
Public R&D intensity (%), 2014
Figure I.4-A.8 Public R&D intensity, 2014 and top 1% highly cited scientific publications1 2014 (citation window: 2014-2016)
Science, Research and Innovation performance of the EU 2018Source: DG Research and Innovation - Unit for the Analysis and Monitoring of National Research and Innovation PoliciesData: CWTS based on Web of Science databaseNote: 1Scientific publications within the 1% most cited scientific publications worldwide as % of total scientific publications of the country; fractional counting method. Stat. link: https://ec.europa.eu/info/sites/info/files/srip/parti/i_4-a_figures/f_i_4-a_8.xlsx
164
The diversity of the European research land-scape is explained not only by the levels of na-tional R&D investment but also by their effec-tiveness. Countries which systematically pursue a better quality and impact of their public sci-ence base through sustained public investments and structural reforms of their national science and innovation systems1 tend to be those that extract the maximum from their public R&D investments. The Horizon 2020 Policy Support Facility supports the design, evaluation and im-plementation of such national reforms2.
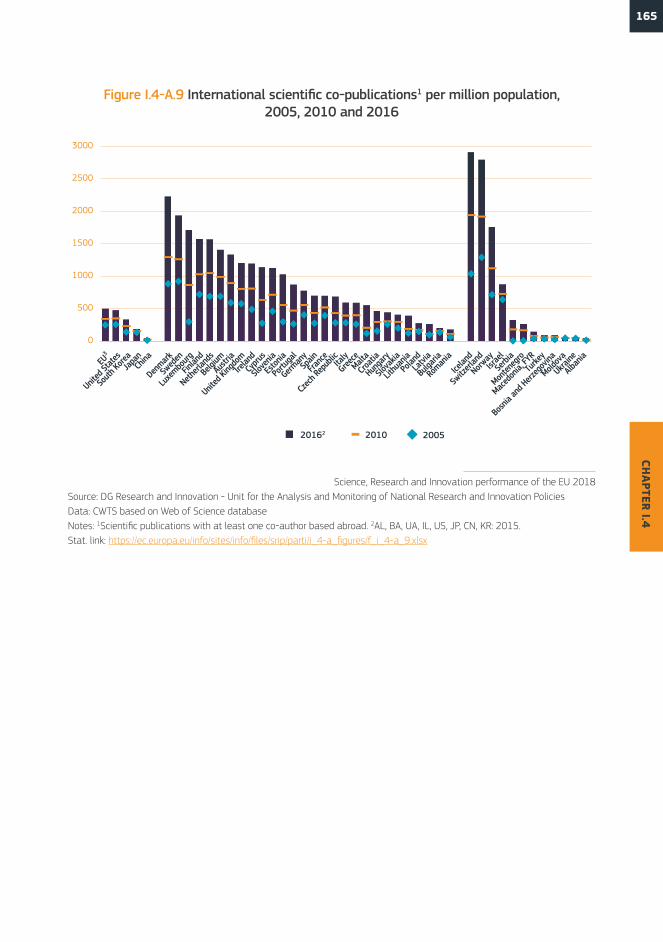
Since the globalisation of research has inten-sified over the last decade, particularly col-laborative research, international co-publi-cations are becoming increasingly significant in fostering the production of new knowledge worldwide and stimulating positive impacts in scientific performance.
All ERA countries have steadily increased their share of international co-publications since 2000, a trend that is also confirmed at the global level for the United States and Asian economies (see Figure I.4-A.9). Several Eastern European coun-tries (Poland, Slovakia, Romania and Bulgaria)
1 Such reforms include aspects such as: the establishment of adequate mechanisms to reward, through public funding, a higher research performance by institutions; effective incentives for researchers and institutions to perform high-qual-ity and impactful research; policies that combat the fragmentation of national science and higher education systems; optimisation of the institutional environment of public institutions performing R&D to facilitate collaborative research and cooperation with industry; strategies to improve international scientific collaboration and researcher mobility; and public action in support of knowledge transfer.
2 The Horizon 2020 Policy Support Facility (PSF) gives Member States and countries associated to Horizon 2020 practical support to design, implement and evaluate reforms that enhance the quality of their R&I investments, policies and sys-tems (https://rio.jrc.ec.europa.eu/en/policy-support-facility).
have lower levels of international exposure and collaboration, and some of their researchers en-joy less international mobility. While the low level of excellence in some of these countries does not provide opportunities for international collabora-tion, it is also clear that the low level of interna-tionalisation has an impact on the level of scien-tific excellence, leading to lower scores in highly cited scientific publications in these countries. On the other hand, research-intensive countries, both large (such as the United States, UK, Germa-ny and France) and small (like the Netherlands, Switzerland and Denmark) enjoy higher levels of international collaboration coupled with higher scores in quality science. In short, open research systems perform better in scientific quality since scientists achieve greater impact from their in-ternational collaborations.
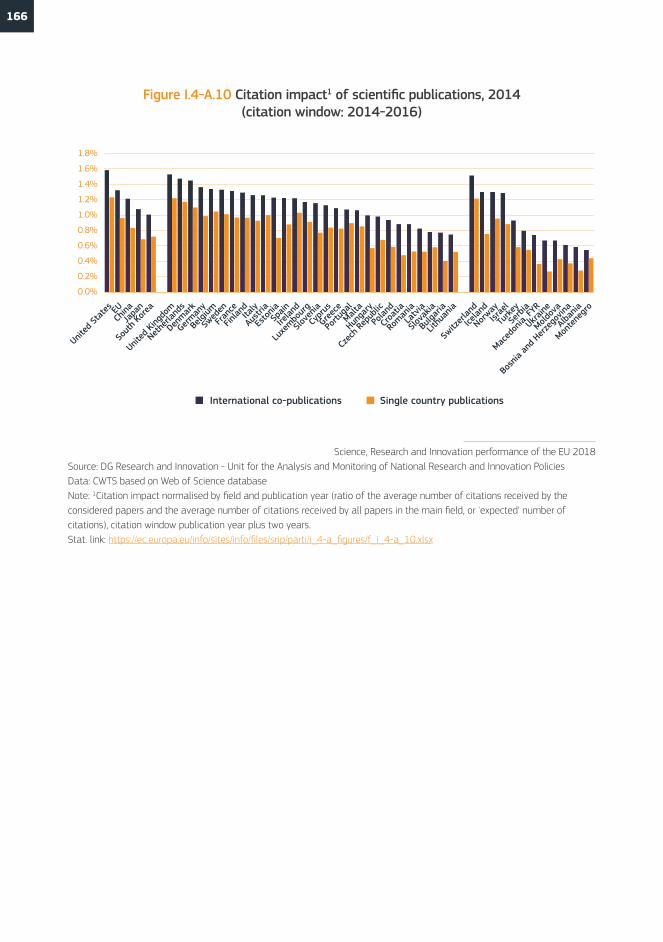
International collaboration in science is be-coming increasingly important and leads to improved scientific quality, as measured by the publications’ citation impact. This is confirmed by the fact that the citation impact of inter-national co-publications is greater than that of single-country publications for all countries (see Figure I.4-A.10).
165CH
APTER I.4
0
500
1000
1500
2000
2500
3000
EU3
United
State
s
South
KoreaJa
panCh
ina
Denmark
Swed
en
Luxe
mbourg
Finlan
d
Netherl
ands
BelgiumAus
tria
United
King
dom
Irelan
dCy
prus
Slove
nia
Eston
ia
Portu
gal
German
ySp
ainFra
nce
Czech
Repu
blicIta
ly
GreeceMalt
a
Croati
a
Hunga
ry
Slova
kia
Lithu
aniaPo
land
Latvi
a
Bulgari
a
Roman
ia
Icelan
d
Switz
erlan
d
NorwayIsr
ael
Serbi
a
Monten
egro
Maced
onia,
FYR
Turke
y
Bosnia
and H
erzeg
ovina
Moldov
a
Ukraine
Albania
20162 2010 2005
Figure I.4-A.9 International scientific co-publications1 per million population, 2005, 2010 and 2016
Science, Research and Innovation performance of the EU 2018Source: DG Research and Innovation - Unit for the Analysis and Monitoring of National Research and Innovation PoliciesData: CWTS based on Web of Science databaseNotes: 1Scientific publications with at least one co-author based abroad. 2AL, BA, UA, IL, US, JP, CN, KR: 2015.Stat. link: https://ec.europa.eu/info/sites/info/files/srip/parti/i_4-a_figures/f_i_4-a_9.xlsx
166
0.0%
0.2%
0.4%
0.6%
0.8%
1.0%
1.2%
1.4%
1.6%
1.8%
United
Stat
es EUCh
inaJa
pan
Sout
h Kor
ea
United
King
dom
Nethe
rland
s
Denmar
k
German
y
Belgi
um
Swed
en
Fran
ce
Finlan
dIta
ly
Austr
ia
Esto
niaSp
ain
Irelan
d
Luxe
mbour
g
Slove
nia
Cypr
us
Greec
e
Portu
gal
Malta
Hunga
ry
Czec
h Rep
ublic
Polan
d
Croa
tia
Roman
ia
Latv
ia
Slova
kia
Bulga
ria
Lithu
ania
Switz
erlan
d
Icelan
d
Norway
Israe
l
Turke
y
Serb
ia
Maced
onia,
FYR
Ukraine
Moldov
a
Bosn
ia an
d Her
zego
vina
Alban
ia
Monte
negr
o
International co-publications Single country publications
Figure I.4-A.10 Citation impact1 of scientific publications, 2014 (citation window: 2014-2016)
Science, Research and Innovation performance of the EU 2018Source: DG Research and Innovation - Unit for the Analysis and Monitoring of National Research and Innovation PoliciesData: CWTS based on Web of Science databaseNote: 1Citation impact normalised by field and publication year (ratio of the average number of citations received by the considered papers and the average number of citations received by all papers in the main field, or 'expected' number of citations), citation window publication year plus two years.Stat. link: https://ec.europa.eu/info/sites/info/files/srip/parti/i_4-a_figures/f_i_4-a_10.xlsx
167CH
APTER I.4
Global higher education rankings are increa-singly perceived and used as the international measure of impactful scientific research and teaching quality. The EU has more ‘world-class’ universities among the top 500 institutions while the United States still leads in the top 100, as measured by the two most popular rankings.
After periods of strong massification of higher ed-ucation institutions, and with the advance of their globalisation and marketization, over the last 15 years, more and more attention has been paid to their internationally measured performance. The Academic Ranking of World Universities3 (ARWU), also called the Shanghai Ranking, and the Times Higher Education (THE) ranking are currently the most-quoted university rankings in the world.
Although the validity and impact of a growing number of league tables with international uni-versity rankings is still being debated, many high-er education institutions use them to inform stra-tegic decisions or shape priorities, and being in the ‘top 100’ is widely defined as a national or institu-tional strategy. Visibility in international rankings is naturally associated with universities’ capability to conduct globally impactful, excellent scientific research, and gives them ‘world-class’ status.
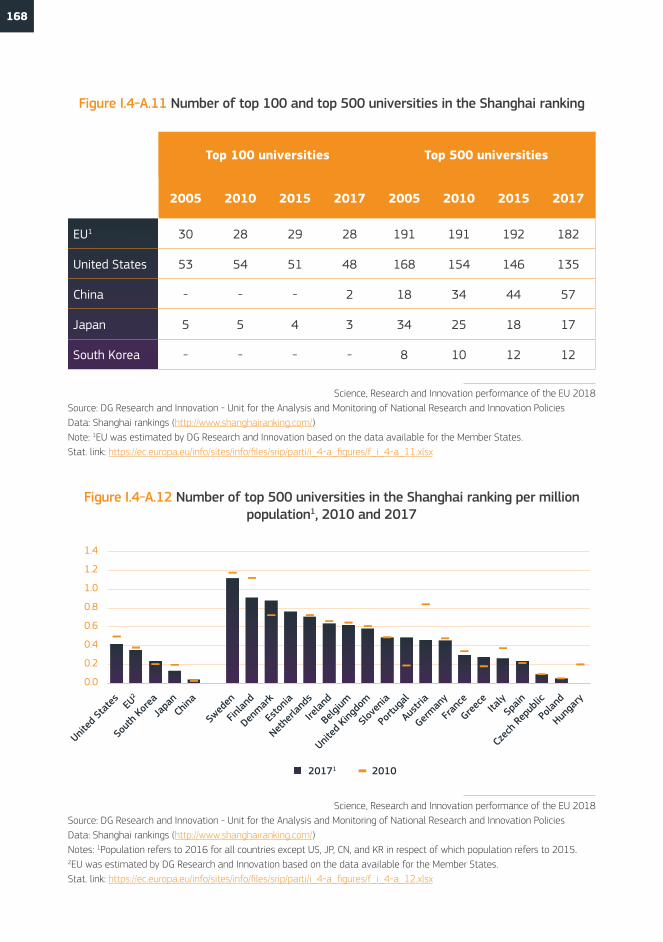
According to ARWU, which is based on six indi-cators mainly related to an institution’s scientific output (number of Nobel Prizes and Fields Medals, highly cited researchers, papers published), the EU has more universities (182) in the top 500 than the United States (135), a number which has been stable since 2005 (see Figure I.4-A.11). Howev-er, the United States still slightly outperforms the EU in the top 500 universities per million popu-lation, has a higher number of universities in the top 100, and holds 8 of the top 10 ranks. The EU, on the other hand, outperforms South Korea, Ja-
3 The Academic Ranking of World Universities (ARWU) was first published by the Graduate School of Education of the Shanghai Jiao Tong University in June 2003 and has been updated since on an annual basis.
4 It should be noted that Malta and Luxembourg have only one university (Malta has two higher education institutions). In total, there are about 3300 higher education institutions in the EU.
pan and China (which in the ARWU includes Hong Kong, Macao and Taiwan) in terms of top institu-tions per million population (see Figure I.4-A.12). Leading EU countries in terms of the ARWU top 500 institutions per million inhabitants are Swe-den, Finland and Denmark. Portugal has improved its performance most since 2010, while the per-formance of Finland, Austria, Italy and Hungary has declined. The Baltic States (except Estonia), Bulgaria, Romania, Croatia, Cyprus, Luxembourg, Malta4 and Slovakia do not have a university among the top 500 worldwide, while Romania, Croatia, Luxembourg, Slovakia and Lithuania have institutions ranked in the top 800 of the ARWU.
The THE, established in 2004, has a broader scope and also includes indicators on teaching, interna-tional outlook and industry income (and hence knowledge transfer). As regards research, it in-cludes subjective factors, too, such as reputation. As a result, while international performance pat-terns are broadly similar compared to the ARWU, the EU comes out better than the United States in areas like teaching and internationalisation.
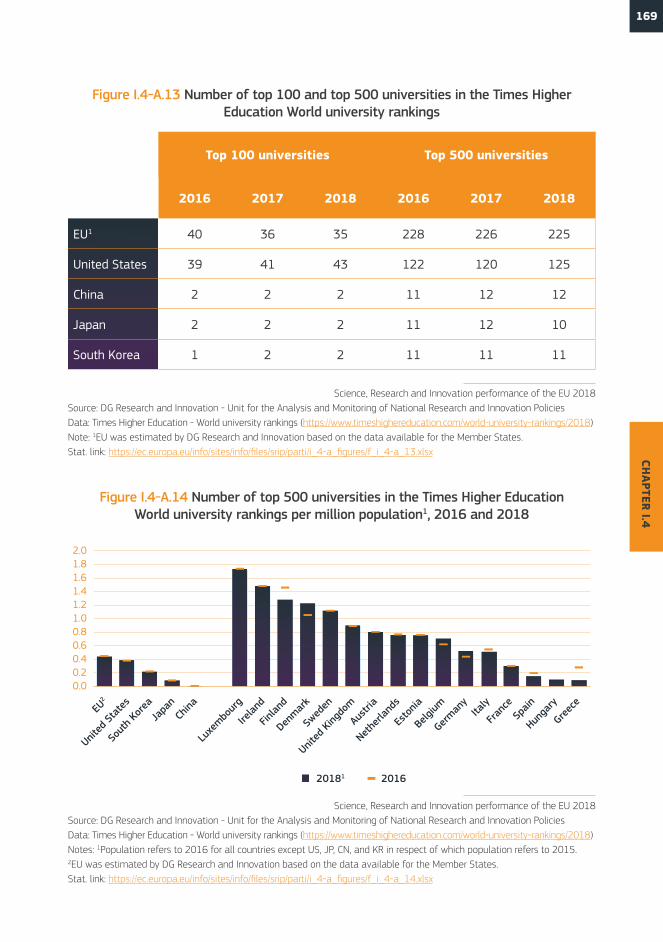
In the THE ranking, the EU has nearly twice as many top 500 institutions as the United States which still outperforms the EU in the top 100 of the ranking (see Figure I.4-A.13). However, while two American institutions (Harvard and Stanford) are in the lead in the ARWU, the THE ranking lists Oxford and Cambridge as the world’s top universities.
According to the THE ranking, Luxembourg is the best EU performer in the top 500 universities per million population (with one institution), fol-lowed by Ireland, Finland, Denmark and Sweden (see Figure I.4-A.14). The majority of Central and Eastern European Member States do not have universities in the THE top 500 (Estonia and Hungary being the only exceptions).
168
Figure I.4-A.11 Number of top 100 and top 500 universities in the Shanghai ranking
Science, Research and Innovation performance of the EU 2018Source: DG Research and Innovation - Unit for the Analysis and Monitoring of National Research and Innovation PoliciesData: Shanghai rankings (http://www.shanghairanking.com/)Note: 1EU was estimated by DG Research and Innovation based on the data available for the Member States.Stat. link: https://ec.europa.eu/info/sites/info/files/srip/parti/i_4-a_figures/f_i_4-a_11.xlsx
Top 100 universities Top 500 universities
2005 2010 2015 2017 2005 2010 2015 2017
EU1 30 28 29 28 191 191 192 182
United States 53 54 51 48 168 154 146 135
China - - - 2 18 34 44 57
Japan 5 5 4 3 34 25 18 17
South Korea - - - - 8 10 12 12
20171 2010
0.0
0.2
0.4
0.6
0.8
1.0
1.2
1.4
United
Stat
es EU2
Sout
h Kor
eaJa
panCh
ina
Swed
en
Finlan
d
Denmar
k
Esto
nia
Nethe
rland
s
Irelan
d
Belgi
um
United
King
dom
Slove
nia
Portu
gal
Austr
ia
German
y
Fran
ce
Greec
eIta
lySp
ain
Czec
h Rep
ublic
Polan
d
Hunga
ry
Figure I.4-A.12 Number of top 500 universities in the Shanghai ranking per million population1, 2010 and 2017
Science, Research and Innovation performance of the EU 2018Source: DG Research and Innovation - Unit for the Analysis and Monitoring of National Research and Innovation PoliciesData: Shanghai rankings (http://www.shanghairanking.com/)Notes: 1Population refers to 2016 for all countries except US, JP, CN, and KR in respect of which population refers to 2015. 2EU was estimated by DG Research and Innovation based on the data available for the Member States.Stat. link: https://ec.europa.eu/info/sites/info/files/srip/parti/i_4-a_figures/f_i_4-a_12.xlsx
169CH
APTER I.4
Figure I.4-A.13 Number of top 100 and top 500 universities in the Times Higher Education World university rankings
Science, Research and Innovation performance of the EU 2018Source: DG Research and Innovation - Unit for the Analysis and Monitoring of National Research and Innovation PoliciesData: Times Higher Education - World university rankings (https://www.timeshighereducation.com/world-university-rankings/2018)Note: 1EU was estimated by DG Research and Innovation based on the data available for the Member States.Stat. link: https://ec.europa.eu/info/sites/info/files/srip/parti/i_4-a_figures/f_i_4-a_13.xlsx
Top 100 universities Top 500 universities
2016 2017 2018 2016 2017 2018
EU1 40 36 35 228 226 225
United States 39 41 43 122 120 125
China 2 2 2 11 12 12
Japan 2 2 2 11 12 10
South Korea 1 2 2 11 11 11
0.00.20.40.60.81.01.21.41.61.82.0
EU2
United
Stat
es
Sout
h Kor
eaJa
pan
China
Luxe
mbour
g
Irelan
d
Finlan
d
Denmar
k
Swed
en
United
King
dom
Austr
ia
Nethe
rland
s
Esto
nia
Belgi
um
German
yIta
ly
Fran
ceSp
ain
Hunga
ry
Greec
e
20181 2016
Figure I.4-A.14 Number of top 500 universities in the Times Higher Education World university rankings per million population1, 2016 and 2018
Science, Research and Innovation performance of the EU 2018Source: DG Research and Innovation - Unit for the Analysis and Monitoring of National Research and Innovation PoliciesData: Times Higher Education - World university rankings (https://www.timeshighereducation.com/world-university-rankings/2018)Notes: 1Population refers to 2016 for all countries except US, JP, CN, and KR in respect of which population refers to 2015. 2EU was estimated by DG Research and Innovation based on the data available for the Member States.Stat. link: https://ec.europa.eu/info/sites/info/files/srip/parti/i_4-a_figures/f_i_4-a_14.xlsx
170
Automobiles
Bioeconomy
Biotechnology
Climate
Construction
Energy
Health
Humanities
ICT
Materials
Nano
New productiontecnologies
Other transporttechnologies
Security
Socio-economicsciences
Space
JapanEU ChinaUnited States South Korea
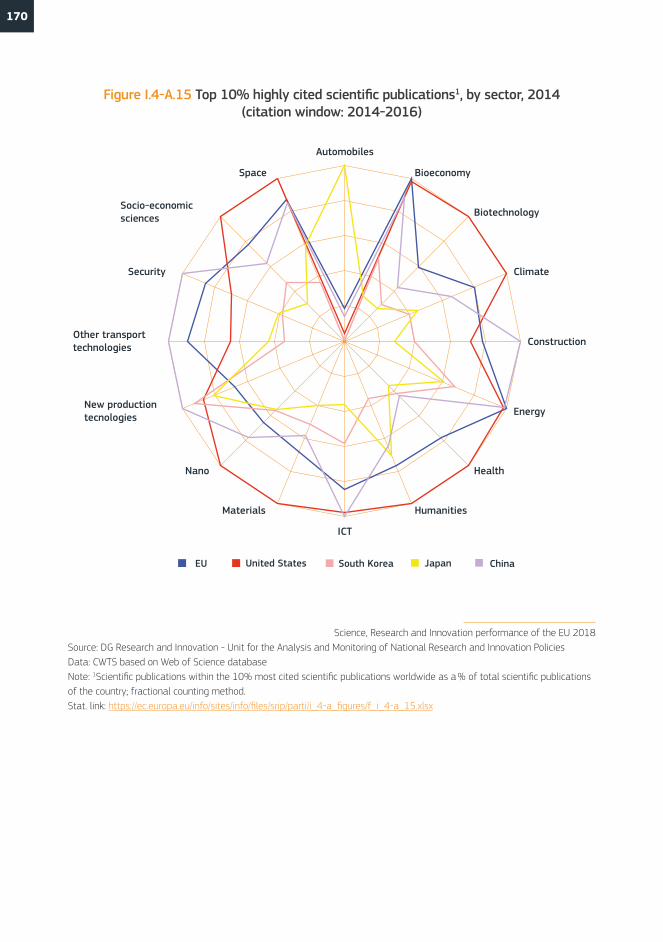
Figure I.4-A.15 Top 10% highly cited scientific publications1, by sector, 2014 (citation window: 2014-2016)
Science, Research and Innovation performance of the EU 2018Source: DG Research and Innovation - Unit for the Analysis and Monitoring of National Research and Innovation PoliciesData: CWTS based on Web of Science databaseNote: 1Scientific publications within the 10% most cited scientific publications worldwide as a % of total scientific publications of the country; fractional counting method.Stat. link: https://ec.europa.eu/info/sites/info/files/srip/parti/i_4-a_figures/f_i_4-a_15.xlsx
171CH
APTER I.4
Automobiles
Bioeconomy
Biotechnology
Climate
Construction
Energy
Health
Humanities
ICT
Materials
Nano
New productiontecnologies
Other transporttechnologies
Security
Socio-economicsciences
Space
JapanEU ChinaUnited States South Korea
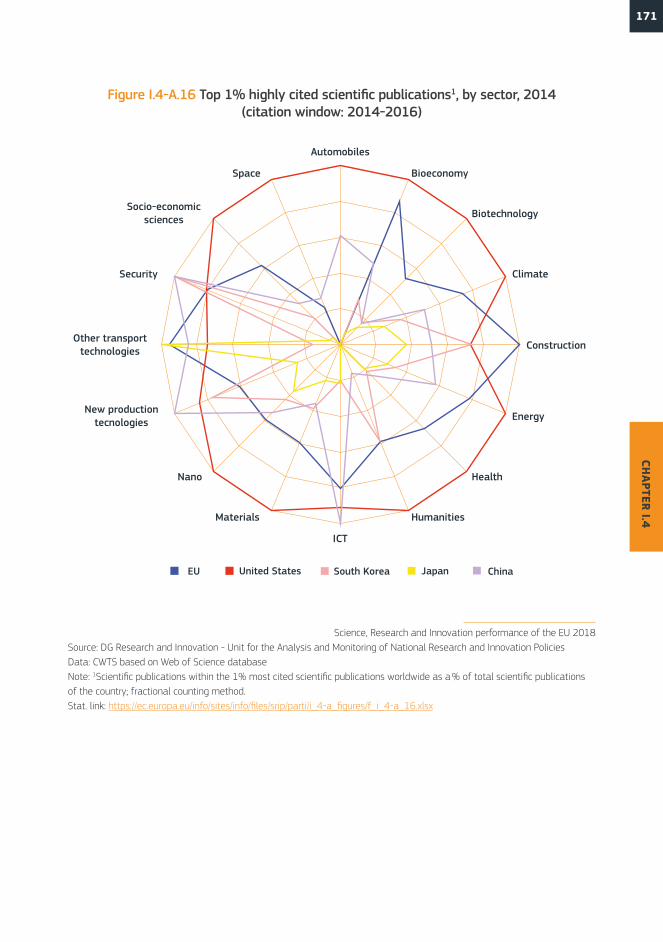
Figure I.4-A.16 Top 1% highly cited scientific publications1, by sector, 2014 (citation window: 2014-2016)
Science, Research and Innovation performance of the EU 2018Source: DG Research and Innovation - Unit for the Analysis and Monitoring of National Research and Innovation PoliciesData: CWTS based on Web of Science databaseNote: 1Scientific publications within the 1% most cited scientific publications worldwide as a % of total scientific publications of the country; fractional counting method.Stat. link: https://ec.europa.eu/info/sites/info/files/srip/parti/i_4-a_figures/f_i_4-a_16.xlsx
172
CHAPTER I.4-B: KNOWLEDGE FLOWS
5 OECD (2015), The Future of Productivity, OECD Publishing, Paris. See also, Chapter II.1 of this report for a recent update on the work by the OECD in this field.
6 European Commission (2016a). Open Innovation, Open Science, Open to the World - a Vision for Europe. DG Research and Innovation.
7 http://europa.eu/rapid/press-release_SPEECH-11-872_en.htm?locale=en
Knowledge diffusion has always been crucial to support the creation and dissemination of in-novation across companies, sectors and coun-tries. Against a backdrop where innovation diffusion from leading to laggard firms seems to stall our economies’ productivity, knowledge flows become even more important.
Recent work by the OECD (2015)5 shows that over the past decade the productivity gap be-tween frontier and laggard firms has widened. One of the main reasons for this is the per-sistently insufficient diffusion of technologies and innovations across firms and countries, both between and within sectors. Consequent-ly, understanding the dynamics of knowledge diffusion is critical to make a proper assess-ment of innovation performance.
Innovation diffusion depends on three prin-ciples: (i) Open Science (ii) Open Innovation and (iii) Open to the World.
This chapter analyses how knowledge is dis-seminated in the EU through different chan-nels. More precisely, innovation diffusion depends on three principles: (1) Open Sci-ence, with scientific outputs being used and integrated more and more widely to produce faster and more impactful scientific advanc-es; (2) Open Innovation, with robust and strong science-business linkages; and (3) Open to the
World, with knowledge flowing freely and not limited to territorial boundaries. These princi-ples guide the European research6 policy and will form the basis of the analyses of know-ledge flows presented in this chapter.
Open Science
This section looks at the progress achieved in making science more open in Europe, notably through better open access to scientific pub-lications and greater mobility of researchers across institutions. In an ever-more globalised and knowledge-driven world, in which data is increasingly valuable and considered as a competitive advantage7, it is key to ensure that advances in science and technology are open as far as possible. This makes the scien-tific discovery process increasingly robust as, for example, it allows for an easier verification and replication of research results.
Overall, and despite still lagging behind the United States, European science is becoming increasingly more open-access oriented, with significant progress across all Member States.
The trend towards providing a wider audi-ence with access to scientific output has con-tinued for decades, driven by the growth of ICT, amongst others, making data and knowl-edge increasingly accessible beyond national
173CH
APTER I.4
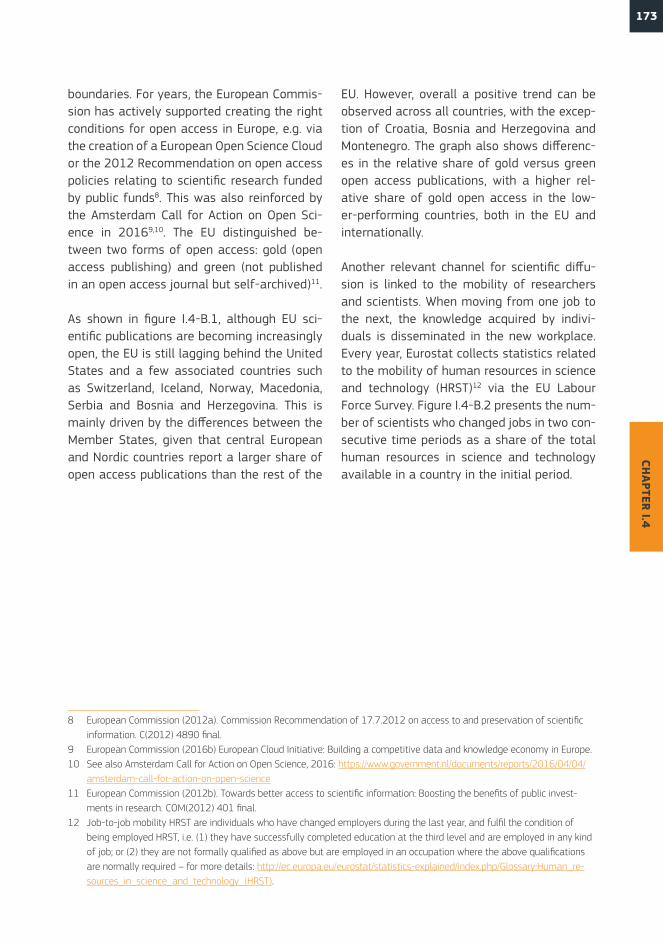
boundaries. For years, the European Commis-sion has actively supported creating the right conditions for open access in Europe, e.g. via the creation of a European Open Science Cloud or the 2012 Recommendation on open access policies relating to scientific research funded by public funds8. This was also reinforced by the Amsterdam Call for Action on Open Sci-ence in 20169,10. The EU distinguished be-tween two forms of open access: gold (open access publishing) and green (not published in an open access journal but self-archived)11.
As shown in figure I.4-B.1, although EU sci-entific publications are becoming increasingly open, the EU is still lagging behind the United States and a few associated countries such as Switzerland, Iceland, Norway, Macedonia, Serbia and Bosnia and Herzegovina. This is mainly driven by the differences between the Member States, given that central European and Nordic countries report a larger share of open access publications than the rest of the
8 European Commission (2012a). Commission Recommendation of 17.7.2012 on access to and preservation of scientific information. C(2012) 4890 final.
9 European Commission (2016b) European Cloud Initiative: Building a competitive data and knowledge economy in Europe.10 See also Amsterdam Call for Action on Open Science, 2016: https://www.government.nl/documents/reports/2016/04/04/
amsterdam-call-for-action-on-open-science11 European Commission (2012b). Towards better access to scientific information: Boosting the benefits of public invest-
ments in research. COM(2012) 401 final.12 Job-to-job mobility HRST are individuals who have changed employers during the last year, and fulfil the condition of
being employed HRST, i.e. (1) they have successfully completed education at the third level and are employed in any kind of job; or (2) they are not formally qualified as above but are employed in an occupation where the above qualifications are normally required – for more details: http://ec.europa.eu/eurostat/statistics-explained/index.php/Glossary:Human_re-sources_in_science_and_technology_(HRST).
EU. However, overall a positive trend can be observed across all countries, with the excep-tion of Croatia, Bosnia and Herzegovina and Montenegro. The graph also shows differenc-es in the relative share of gold versus green open access publications, with a higher rel-ative share of gold open access in the low-er-performing countries, both in the EU and internationally.
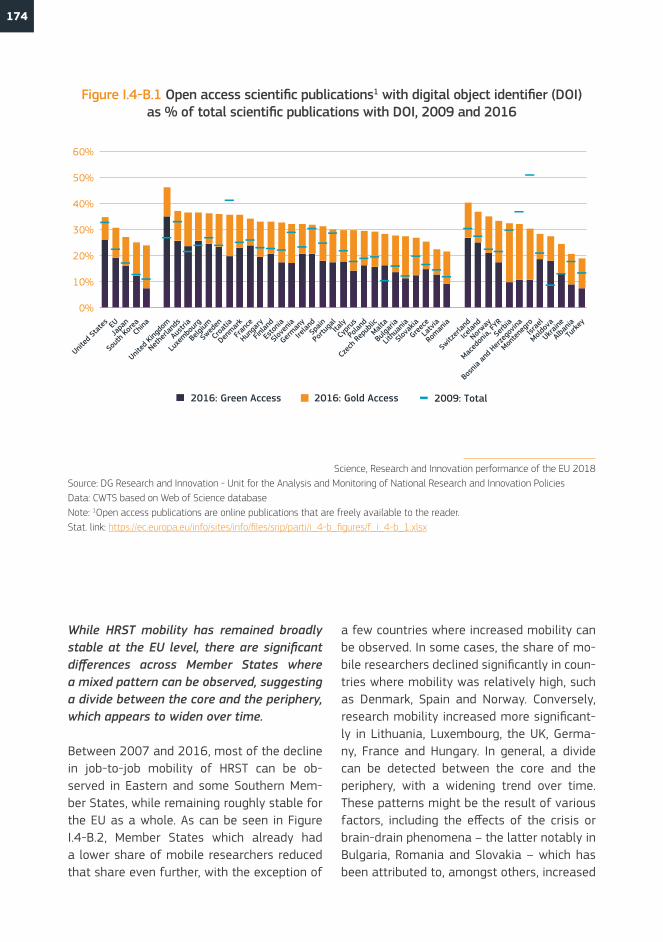
Another relevant channel for scientific diffu-sion is linked to the mobility of researchers and scientists. When moving from one job to the next, the knowledge acquired by indivi-duals is disseminated in the new workplace. Every year, Eurostat collects statistics related to the mobility of human resources in science and technology (HRST)12 via the EU Labour Force Survey. Figure I.4-B.2 presents the num-ber of scientists who changed jobs in two con-secutive time periods as a share of the total human resources in science and technology available in a country in the initial period.
174
Figure I.4-B.1 Open access scientific publications1 with digital object identifier (DOI) as % of total scientific publications with DOI, 2009 and 2016
Science, Research and Innovation performance of the EU 2018Source: DG Research and Innovation - Unit for the Analysis and Monitoring of National Research and Innovation PoliciesData: CWTS based on Web of Science databaseNote: 1Open access publications are online publications that are freely available to the reader. Stat. link: https://ec.europa.eu/info/sites/info/files/srip/parti/i_4-b_figures/f_i_4-b_1.xlsx
0%
10%
20%
30%
40%
50%
60%
United
Stat
es EUJa
pan
Sout
h Kor
eaCh
ina
United
King
dom
Nethe
rland
s
Austr
ia
Luxe
mbour
g
Belgi
um
Swed
en
Croa
tia
Denmar
k
Fran
ce
Hunga
ry
Finlan
d
Esto
nia
Slove
nia
German
y
Irelan
dSp
ain
Portu
galIta
ly
Cypr
us
Polan
d
Czec
h Rep
ublicMalt
a
Bulga
ria
Lithu
ania
Slova
kia
Greec
e
Latv
ia
Roman
ia
Switz
erlan
d
Icelan
d
Norway
Maced
onia,
FYR
Serb
ia
Bosn
ia an
d Her
zego
vina
Monte
negr
oIsr
ael
Moldov
a
Ukraine
Alban
ia
Turke
y
2016: Green Access 2016: Gold Access 2009: Total
While HRST mobility has remained broadly stable at the EU level, there are significant differences across Member States where a mixed pattern can be observed, suggesting a divide between the core and the periphery, which appears to widen over time.
Between 2007 and 2016, most of the decline in job-to-job mobility of HRST can be ob-served in Eastern and some Southern Mem-ber States, while remaining roughly stable for the EU as a whole. As can be seen in Figure I.4-B.2, Member States which already had a lower share of mobile researchers reduced that share even further, with the exception of
a few countries where increased mobility can be observed. In some cases, the share of mo-bile researchers declined significantly in coun-tries where mobility was relatively high, such as Denmark, Spain and Norway. Conversely, research mobility increased more significant-ly in Lithuania, Luxembourg, the UK, Germa-ny, France and Hungary. In general, a divide can be detected between the core and the periphery, with a widening trend over time. These patterns might be the result of various factors, including the effects of the crisis or brain-drain phenomena – the latter notably in Bulgaria, Romania and Slovakia – which has been attributed to, amongst others, increased
175CH
APTER I.4
competition linked to the opening of labour markets13,14. Thus, finding a good balance be-tween flexible and secure labour markets is an important precondition to enable workers to overcome obstacles to mobility between jobs and sectors, as well as creating attractive conditions for research and science to encour-age mobile workers to return to their home countries to take full advantage of this ex-change of knowledge. Public policy has proven
13 Doria Arrieta, O., Pammolli, F. and Petersen, A. (2017). Quantifying the negative impact of brain drain on the integration of European science. Science Advances. 3. 10.1126/sciadv.1602232.
14 European Commission (2016c). European Research Area Progress Reports: Technical Report. DG Research and Innovation.
to be a catalyst of such mobility, as discussed in Chapter I.5. on Framework Conditions.
At the European level, the Marie Skłodows-ka-Curie Actions (MSCA) are relevant in supporting the attraction and mobility of highly skilled researchers by providing more high-quality training and career development for researchers and their career mobility be-tween academia and non-academia.
Figure I.4-B.2 Job-to-job mobility1 of human resources in science and technology (HRST)2 as % of total HRST, 2007 and 2016
Science, Research and Innovation performance of the EU 2018Source: DG Research and Innovation - Unit for the Analysis and Monitoring of National Research and Innovation PoliciesData: EurostatNotes: 1The movement of individuals between one job and another from one year to the next. It does not include inflows into the labour market from a situation of unemployment or inactivity. 2HRST: Persons with tertiary education and/or employed in science and technology. 3CH: 2015. 4BG: 2008.Stat. link: https://ec.europa.eu/info/sites/info/files/srip/parti/i_4-b_figures/f_i_4-b_2.xlsx
20163 20074
EU
Denmar
k
Lithu
ania
United
King
dom
Luxe
mbour
g
Cypr
us
Nethe
rland
s
German
y
Finlan
d
Polan
d
Esto
niaMalt
a
Austr
ia
Fran
ceSp
ain
Portu
gal
Belgi
um
Croa
tia
Swed
en
Hunga
ry
Latv
ia
Slove
niaItaly
Czec
h Rep
ublic
Greec
e
Slova
kia
Bulga
ria
Roman
ia
Icelan
d
Switz
erlan
d
Norway
Turke
y
0%
5%
10%
15%
20%
25%
30%
176
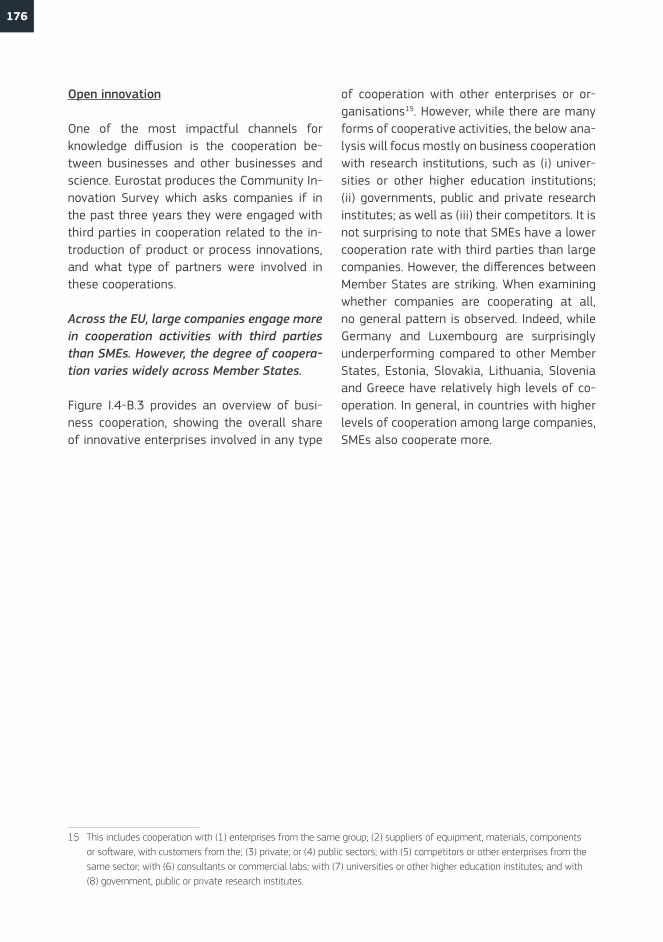
Open innovation
One of the most impactful channels for knowledge diffusion is the cooperation be-tween businesses and other businesses and science. Eurostat produces the Community In-novation Survey which asks companies if in the past three years they were engaged with third parties in cooperation related to the in-troduction of product or process innovations, and what type of partners were involved in these cooperations.
Across the EU, large companies engage more in cooperation activities with third parties than SMEs. However, the degree of coopera-tion varies widely across Member States.
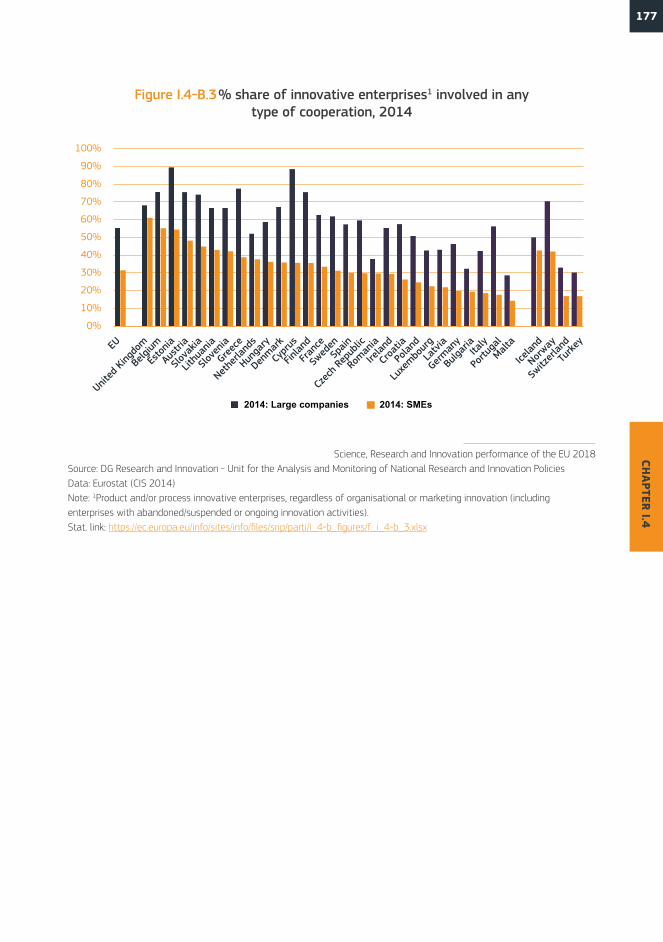
Figure I.4-B.3 provides an overview of busi-ness cooperation, showing the overall share of innovative enterprises involved in any type
15 This includes cooperation with (1) enterprises from the same group; (2) suppliers of equipment, materials, components or software, with customers from the; (3) private; or (4) public sectors; with (5) competitors or other enterprises from the same sector; with (6) consultants or commercial labs; with (7) universities or other higher education institutes; and with (8) government, public or private research institutes.
of cooperation with other enterprises or or-ganisations15. However, while there are many forms of cooperative activities, the below ana-lysis will focus mostly on business cooperation with research institutions, such as (i) univer-sities or other higher education institutions; (ii) governments, public and private research institutes; as well as (iii) their competitors. It is not surprising to note that SMEs have a lower cooperation rate with third parties than large companies. However, the differences between Member States are striking. When examining whether companies are cooperating at all, no general pattern is observed. Indeed, while Germany and Luxembourg are surprisingly underperforming compared to other Member States, Estonia, Slovakia, Lithuania, Slovenia and Greece have relatively high levels of co-operation. In general, in countries with higher levels of cooperation among large companies, SMEs also cooperate more.
177CH
APTER I.4
Figure I.4-B.3 % share of innovative enterprises1 involved in any type of cooperation, 2014
Science, Research and Innovation performance of the EU 2018Source: DG Research and Innovation - Unit for the Analysis and Monitoring of National Research and Innovation PoliciesData: Eurostat (CIS 2014)Note: 1Product and/or process innovative enterprises, regardless of organisational or marketing innovation (including enterprises with abandoned/suspended or ongoing innovation activities).Stat. link: https://ec.europa.eu/info/sites/info/files/srip/parti/i_4-b_figures/f_i_4-b_3.xlsx
2014: Large companies 2014: SMEs
EU
United
King
dom
Belgi
um
Esto
nia
Austr
ia
Slova
kia
Lithu
ania
Slove
nia
Greec
e
Nethe
rland
s
Hunga
ry
Denmar
k
Cypr
us
Finlan
d
Fran
ce
Swed
enSp
ain
Czec
h Rep
ublic
Roman
ia
Irelan
d
Croa
tia
Polan
d
Luxe
mbour
g
Latv
ia
German
y
Bulga
riaItaly
Portu
gal
Malta
Icelan
d
Norway
Switz
erlan
d
Turke
y0%
10%
20%
30%
40%
50%
60%
70%
80%
90%
100%
178
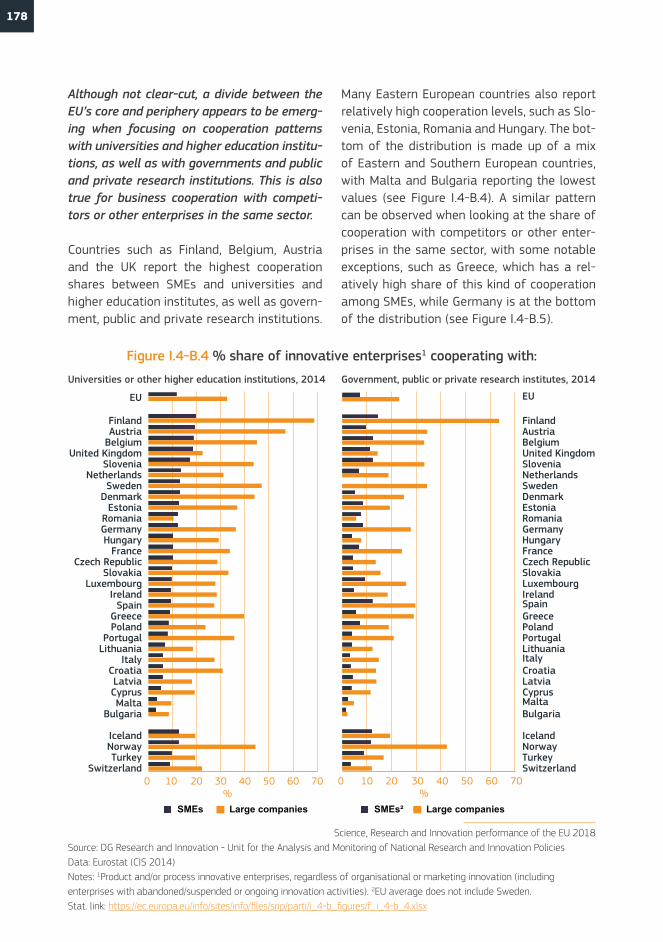
Although not clear-cut, a divide between the EU’s core and periphery appears to be emerg-ing when focusing on cooperation patterns with universities and higher education institu-tions, as well as with governments and public and private research institutions. This is also true for business cooperation with competi-tors or other enterprises in the same sector.
Countries such as Finland, Belgium, Austria and the UK report the highest cooperation shares between SMEs and universities and higher education institutes, as well as govern-ment, public and private research institutions.
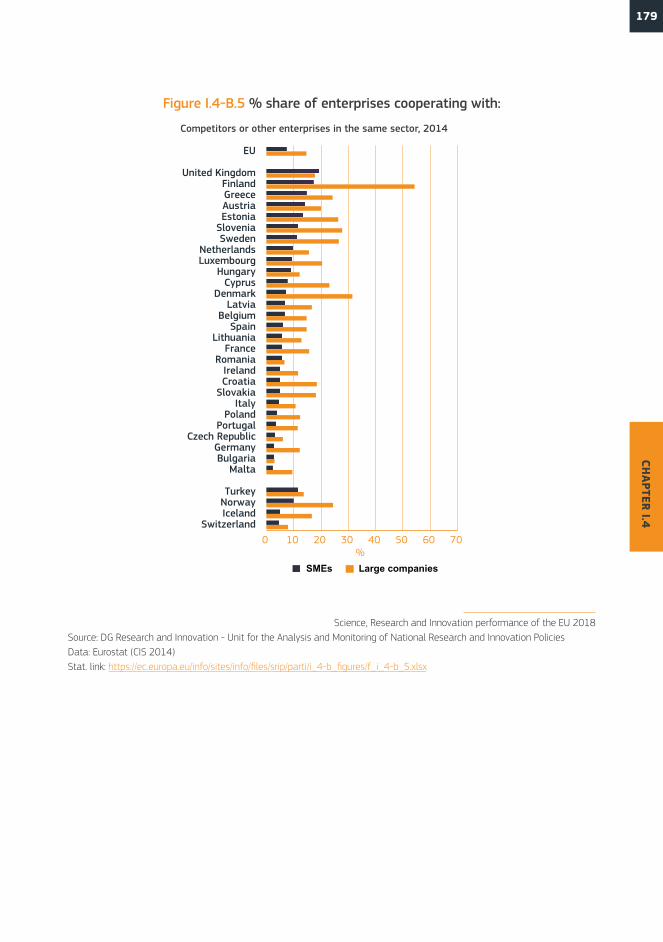
Many Eastern European countries also report relatively high cooperation levels, such as Slo-venia, Estonia, Romania and Hungary. The bot-tom of the distribution is made up of a mix of Eastern and Southern European countries, with Malta and Bulgaria reporting the lowest values (see Figure I.4-B.4). A similar pattern can be observed when looking at the share of cooperation with competitors or other enter-prises in the same sector, with some notable exceptions, such as Greece, which has a rel-atively high share of this kind of cooperation among SMEs, while Germany is at the bottom of the distribution (see Figure I.4-B.5).
Figure I.4-B.4 % share of innovative enterprises1 cooperating with:
Science, Research and Innovation performance of the EU 2018Source: DG Research and Innovation - Unit for the Analysis and Monitoring of National Research and Innovation PoliciesData: Eurostat (CIS 2014)Notes: 1Product and/or process innovative enterprises, regardless of organisational or marketing innovation (including enterprises with abandoned/suspended or ongoing innovation activities). 2EU average does not include Sweden.Stat. link: https://ec.europa.eu/info/sites/info/files/srip/parti/i_4-b_figures/f_i_4-b_4.xlsx
EU
United
King
dom
Belgi
um
Esto
nia
Austr
ia
Slova
kia
Lithu
ania
Slove
nia
Greec
e
Nethe
rland
s
Hunga
ry
Denmar
k
Cypr
us
Finlan
d
Fran
ce
Swed
enSp
ain
Czec
h Rep
ublic
Roman
ia
Irelan
d
Croa
tia
Polan
d
Luxe
mbour
g
Latv
ia
German
y
Bulga
riaItaly
Portu
gal
Malta
Icelan
d
Norway
Switz
erlan
d
Turke
y
0 10 20 30 40 50 60 70%
0 10 20 30 40 50 60 70SwitzerlandTurkeyNorwayIceland
BulgariaMaltaCyprusLatviaCroatiaItalyLithuaniaPortugalPolandGreeceSpainIrelandLuxembourgSlovakiaCzech RepublicFranceHungaryGermanyRomaniaEstoniaDenmarkSwedenNetherlandsSloveniaUnited KingdomBelgiumAustriaFinland
EU
SwitzerlandTurkey
NorwayIceland
BulgariaMalta
CyprusLatvia
CroatiaItaly
LithuaniaPortugal
PolandGreece
SpainIreland
LuxembourgSlovakia
Czech RepublicFrance
HungaryGermanyRomania
EstoniaDenmarkSweden
NetherlandsSlovenia
United KingdomBelgiumAustriaFinland
EU
%SMEs Large companies SMEs² Large companies
Universities or other higher education institutions, 2014 Government, public or private research institutes, 2014
179CH
APTER I.4
Figure I.4-B.5 % share of enterprises cooperating with:
Science, Research and Innovation performance of the EU 2018Source: DG Research and Innovation - Unit for the Analysis and Monitoring of National Research and Innovation PoliciesData: Eurostat (CIS 2014)Stat. link: https://ec.europa.eu/info/sites/info/files/srip/parti/i_4-b_figures/f_i_4-b_5.xlsx
%SMEs Large companies
0 10 20 30 40 50 60 70Switzerland
IcelandNorwayTurkey
MaltaBulgariaGermany
Czech RepublicPortugal
PolandItaly
SlovakiaCroatiaIreland
RomaniaFrance
LithuaniaSpain
BelgiumLatvia
DenmarkCyprus
HungaryLuxembourgNetherlands
SwedenSloveniaEstoniaAustriaGreeceFinland
United Kingdom
EU
Competitors or other enterprises in the same sector, 2014
180
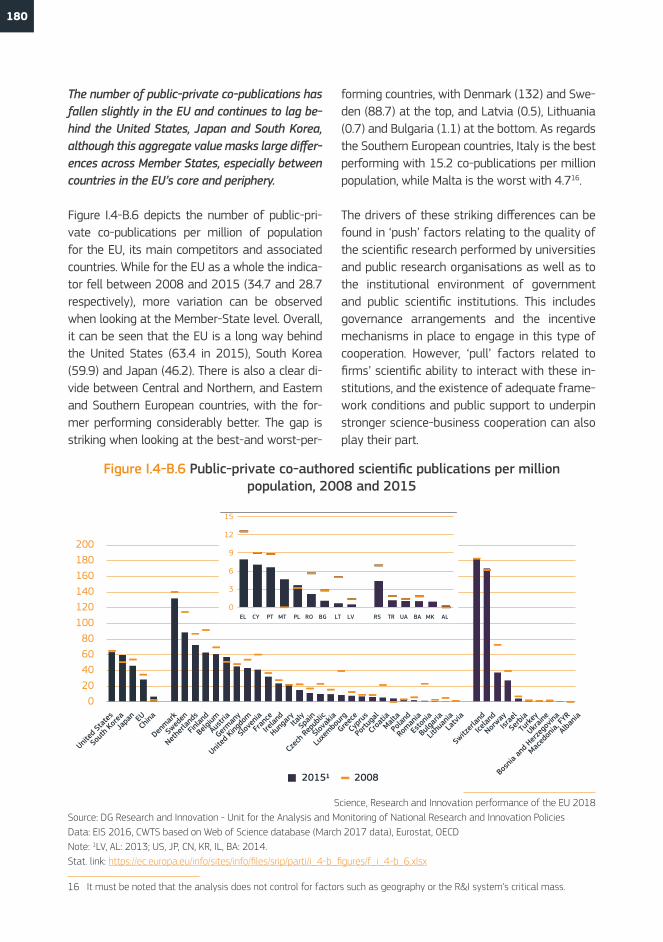
The number of public-private co-publications has fallen slightly in the EU and continues to lag be-hind the United States, Japan and South Korea, although this aggregate value masks large differ-ences across Member States, especially between countries in the EU’s core and periphery.
Figure I.4-B.6 depicts the number of public-pri-vate co-publications per million of population for the EU, its main competitors and associated countries. While for the EU as a whole the indica-tor fell between 2008 and 2015 (34.7 and 28.7 respectively), more variation can be observed when looking at the Member-State level. Overall, it can be seen that the EU is a long way behind the United States (63.4 in 2015), South Korea (59.9) and Japan (46.2). There is also a clear di-vide between Central and Northern, and Eastern and Southern European countries, with the for-mer performing considerably better. The gap is striking when looking at the best-and worst-per-
16 It must be noted that the analysis does not control for factors such as geography or the R&I system’s critical mass.
forming countries, with Denmark (132) and Swe-den (88.7) at the top, and Latvia (0.5), Lithuania (0.7) and Bulgaria (1.1) at the bottom. As regards the Southern European countries, Italy is the best performing with 15.2 co-publications per million population, while Malta is the worst with 4.716.
The drivers of these striking differences can be found in ‘push’ factors relating to the quality of the scientific research performed by universities and public research organisations as well as to the institutional environment of government and public scientific institutions. This includes governance arrangements and the incentive mechanisms in place to engage in this type of cooperation. However, ‘pull’ factors related to firms’ scientific ability to interact with these in-stitutions, and the existence of adequate frame-work conditions and public support to underpin stronger science-business cooperation can also play their part.
Figure I.4-B.6 Public-private co-authored scientific publications per million population, 2008 and 2015
Science, Research and Innovation performance of the EU 2018Source: DG Research and Innovation - Unit for the Analysis and Monitoring of National Research and Innovation PoliciesData: EIS 2016, CWTS based on Web of Science database (March 2017 data), Eurostat, OECDNote: 1LV, AL: 2013; US, JP, CN, KR, IL, BA: 2014.Stat. link: https://ec.europa.eu/info/sites/info/files/srip/parti/i_4-b_figures/f_i_4-b_6.xlsx
20151 2008
United
Stat
es
Sout
h Kor
eaJa
pan EU
China
Denmar
k
Swed
en
Nethe
rland
s
Finlan
d
Belgi
um
Austr
ia
German
y
United
King
dom
Slove
nia
Fran
ce
Irelan
d
Hunga
ryIta
lySp
ain
Czec
h Rep
ublic
Slova
kia
Luxe
mbour
g
Greec
e
Cypr
us
Portu
gal
Croa
tiaMalt
a
Polan
d
Roman
ia
Esto
nia
Bulga
ria
Lithu
ania
Latv
ia
Switz
erlan
d
Icelan
d
Norway
Israe
l
Serb
ia
Turke
y
Ukraine
Bosn
ia an
d Her
zego
vina
Maced
onia,
FYR
Alban
ia
020406080
100120140160180200
0
3
6
9
12
15
EL CY PT MT PL RO BG LT LV RS TR UA BA MK AL
181CH
APTER I.4
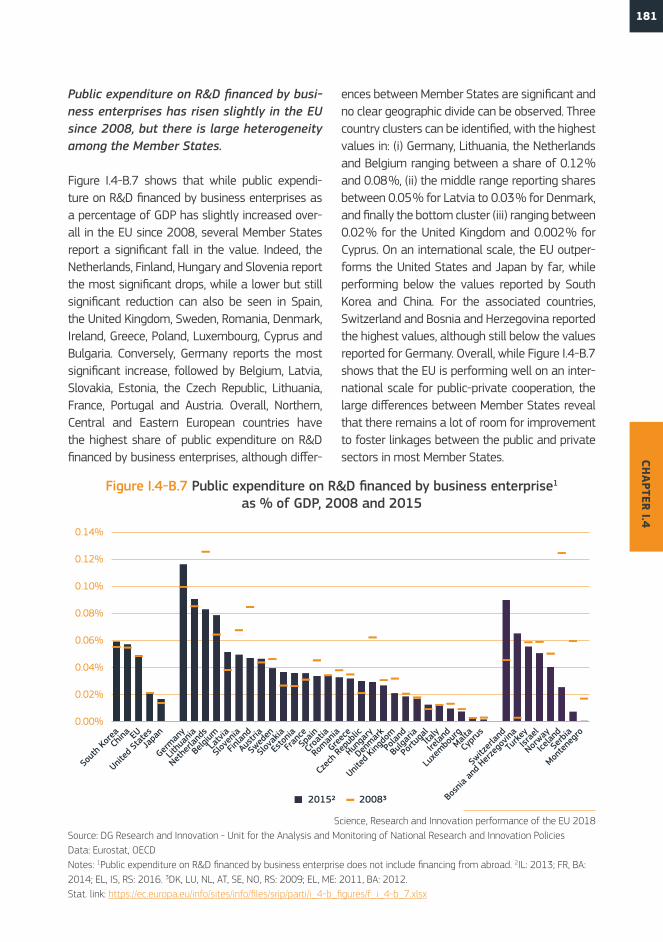
Public expenditure on R&D financed by busi-ness enterprises has risen slightly in the EU since 2008, but there is large heterogeneity among the Member States.
Figure I.4-B.7 shows that while public expendi-ture on R&D financed by business enterprises as a percentage of GDP has slightly increased over-all in the EU since 2008, several Member States report a significant fall in the value. Indeed, the Netherlands, Finland, Hungary and Slovenia report the most significant drops, while a lower but still significant reduction can also be seen in Spain, the United Kingdom, Sweden, Romania, Denmark, Ireland, Greece, Poland, Luxembourg, Cyprus and Bulgaria. Conversely, Germany reports the most significant increase, followed by Belgium, Latvia, Slovakia, Estonia, the Czech Republic, Lithuania, France, Portugal and Austria. Overall, Northern, Central and Eastern European countries have the highest share of public expenditure on R&D financed by business enterprises, although differ-
ences between Member States are significant and no clear geographic divide can be observed. Three country clusters can be identified, with the highest values in: (i) Germany, Lithuania, the Netherlands and Belgium ranging between a share of 0.12 % and 0.08 %, (ii) the middle range reporting shares between 0.05 % for Latvia to 0.03 % for Denmark, and finally the bottom cluster (iii) ranging between 0.02 % for the United Kingdom and 0.002 % for Cyprus. On an international scale, the EU outper-forms the United States and Japan by far, while performing below the values reported by South Korea and China. For the associated countries, Switzerland and Bosnia and Herzegovina reported the highest values, although still below the values reported for Germany. Overall, while Figure I.4-B.7 shows that the EU is performing well on an inter-national scale for public-private cooperation, the large differences between Member States reveal that there remains a lot of room for improvement to foster linkages between the public and private sectors in most Member States.
Figure I.4-B.7 Public expenditure on R&D financed by business enterprise1 as % of GDP, 2008 and 2015
Science, Research and Innovation performance of the EU 2018Source: DG Research and Innovation - Unit for the Analysis and Monitoring of National Research and Innovation Policies Data: Eurostat, OECDNotes: 1Public expenditure on R&D financed by business enterprise does not include financing from abroad. 2IL: 2013; FR, BA: 2014; EL, IS, RS: 2016. 3DK, LU, NL, AT, SE, NO, RS: 2009; EL, ME: 2011, BA: 2012.Stat. link: https://ec.europa.eu/info/sites/info/files/srip/parti/i_4-b_figures/f_i_4-b_7.xlsx
0.00%
0.02%
0.04%
0.06%
0.08%
0.10%
0.12%
0.14%
20152 20083
Sout
h Kor
eaCh
ina EU
United
Stat
esJa
pan
German
y
Lithu
ania
Nethe
rland
s
Belgi
umLa
tvia
Slove
nia
Finlan
d
Austr
ia
Swed
en
Slova
kia
Esto
nia
Fran
ceSp
ain
Croa
tia
Roman
ia
Greec
e
Czec
h Rep
ublic
Hunga
ry
Denmar
k
United
King
dom
Polan
d
Bulga
ria
Portu
galIta
ly
Irelan
d
Luxe
mbour
gMalt
a
Cypr
us
Switz
erlan
d
Bosn
ia an
d Her
zego
vina
Turke
yIsr
ael
Norway
Icelan
d
Serb
ia
Monte
negr
o
182
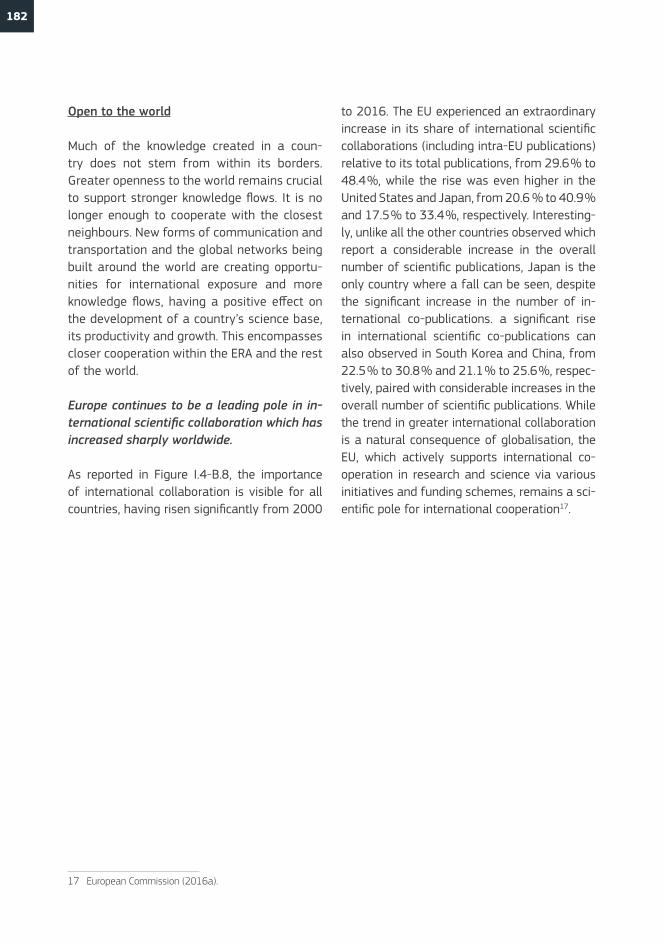
Open to the world
Much of the knowledge created in a coun-try does not stem from within its borders. Greater openness to the world remains crucial to support stronger knowledge flows. It is no longer enough to cooperate with the closest neighbours. New forms of communication and transportation and the global networks being built around the world are creating opportu-nities for international exposure and more knowledge flows, having a positive effect on the development of a country’s science base, its productivity and growth. This encompasses closer cooperation within the ERA and the rest of the world.
Europe continues to be a leading pole in in-ternational scientific collaboration which has increased sharply worldwide.
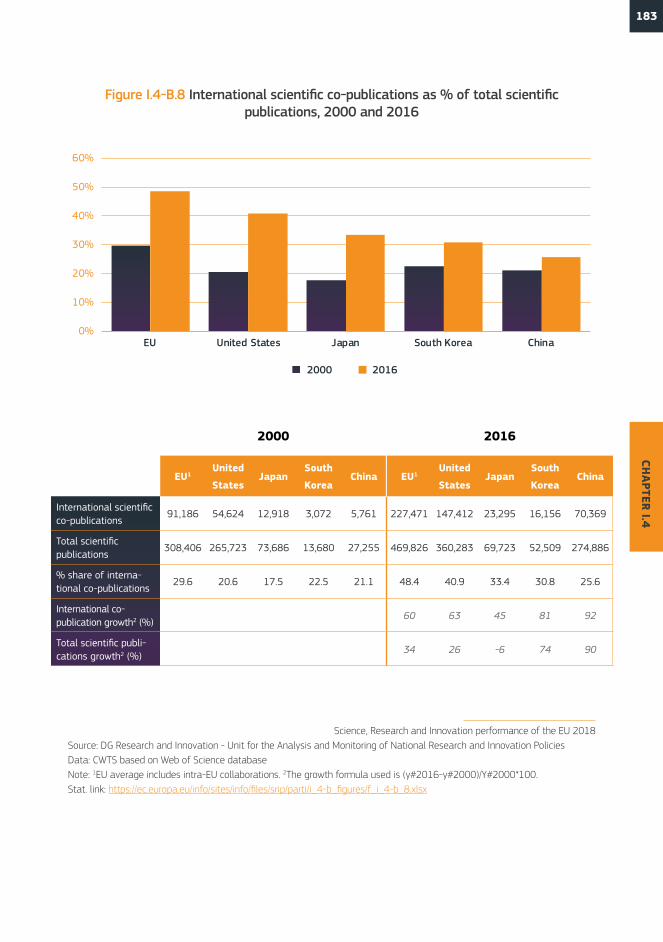
As reported in Figure I.4-B.8, the importance of international collaboration is visible for all countries, having risen significantly from 2000
17 European Commission (2016a).
to 2016. The EU experienced an extraordinary increase in its share of international scientific collaborations (including intra-EU publications) relative to its total publications, from 29.6 % to 48.4 %, while the rise was even higher in the United States and Japan, from 20.6 % to 40.9 % and 17.5 % to 33.4 %, respectively. Interesting-ly, unlike all the other countries observed which report a considerable increase in the overall number of scientific publications, Japan is the only country where a fall can be seen, despite the significant increase in the number of in-ternational co-publications. a significant rise in international scientific co-publications can also observed in South Korea and China, from 22.5 % to 30.8 % and 21.1 % to 25.6 %, respec-tively, paired with considerable increases in the overall number of scientific publications. While the trend in greater international collaboration is a natural consequence of globalisation, the EU, which actively supports international co-operation in research and science via various initiatives and funding schemes, remains a sci-entific pole for international cooperation17.
183CH
APTER I.4
Figure I.4-B.8 International scientific co-publications as % of total scientific publications, 2000 and 2016
Science, Research and Innovation performance of the EU 2018Source: DG Research and Innovation - Unit for the Analysis and Monitoring of National Research and Innovation PoliciesData: CWTS based on Web of Science databaseNote: 1EU average includes intra-EU collaborations. 2The growth formula used is (y#2016-y#2000)/Y#2000*100.Stat. link: https://ec.europa.eu/info/sites/info/files/srip/parti/i_4-b_figures/f_i_4-b_8.xlsx
0%
10%
20%
30%
40%
50%
60%
EU United States Japan South Korea China
2000 2016
2000
EU1United
StatesJapan
South
KoreaChina
International scientific co-publications
91,186 54,624 12,918 3,072 5,761
Total scientific publications
308,406 265,723 73,686 13,680 27,255
% share of interna-tional co-publications
29.6 20.6 17.5 22.5 21.1
International co- publication growth2 (%)
Total scientific publi-cations growth2 (%)
2016
EU1United
StatesJapan
South
KoreaChina
227,471 147,412 23,295 16,156 70,369
469,826 360,283 69,723 52,509 274,886
48.4 40.9 33.4 30.8 25.6
60 63 45 81 92
34 26 -6 74 90
184
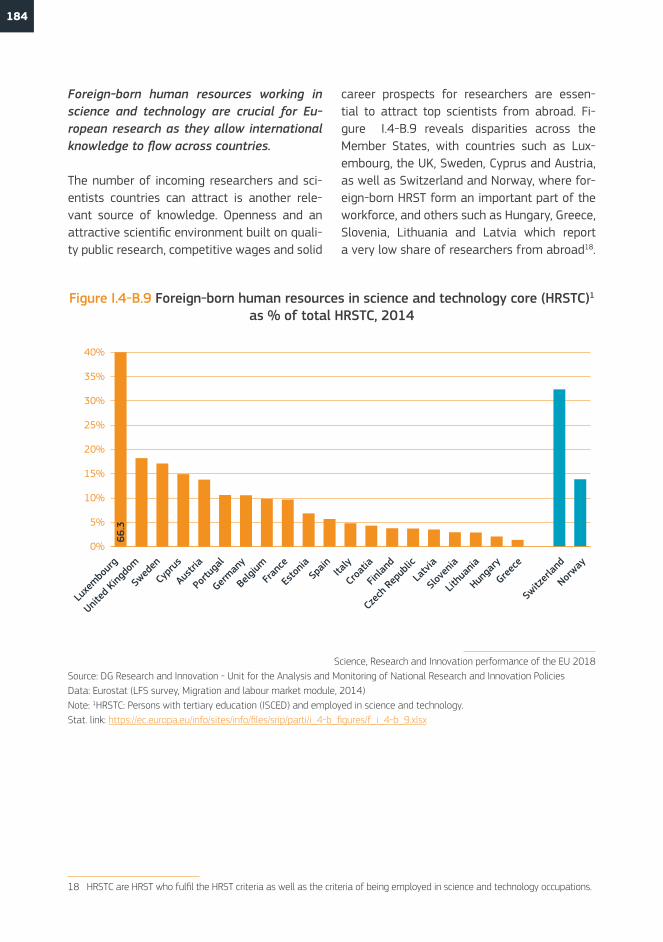
Foreign-born human resources working in science and technology are crucial for Eu-ropean research as they allow international knowledge to flow across countries.
The number of incoming researchers and sci-entists countries can attract is another rele-vant source of knowledge. Openness and an attractive scientific environment built on quali-ty public research, competitive wages and solid
18 HRSTC are HRST who fulfil the HRST criteria as well as the criteria of being employed in science and technology occupations.
career prospects for researchers are essen-tial to attract top scientists from abroad. Fi- gure I.4-B.9 reveals disparities across the Member States, with countries such as Lux-embourg, the UK, Sweden, Cyprus and Austria, as well as Switzerland and Norway, where for-eign-born HRST form an important part of the workforce, and others such as Hungary, Greece, Slovenia, Lithuania and Latvia which report a very low share of researchers from abroad18.
Figure I.4-B.9 Foreign-born human resources in science and technology core (HRSTC)1 as % of total HRSTC, 2014
Science, Research and Innovation performance of the EU 2018Source: DG Research and Innovation - Unit for the Analysis and Monitoring of National Research and Innovation PoliciesData: Eurostat (LFS survey, Migration and labour market module, 2014)Note: 1HRSTC: Persons with tertiary education (ISCED) and employed in science and technology. Stat. link: https://ec.europa.eu/info/sites/info/files/srip/parti/i_4-b_figures/f_i_4-b_9.xlsx
Luxe
mbour
g
United
King
dom
Swed
en
Cypr
us
Austr
ia
Portu
gal
German
y
Belgi
umFr
ance
Esto
niaSp
ain Italy
Croa
tia
Finlan
d
Czec
h Rep
ublic
Latv
ia
Slove
nia
Lithu
ania
Hunga
ry
Greec
e
Switz
erlan
d
Norway
66.3
0%
5%
10%
15%
20%
25%
30%
35%
40%
185CH
APTER I.4
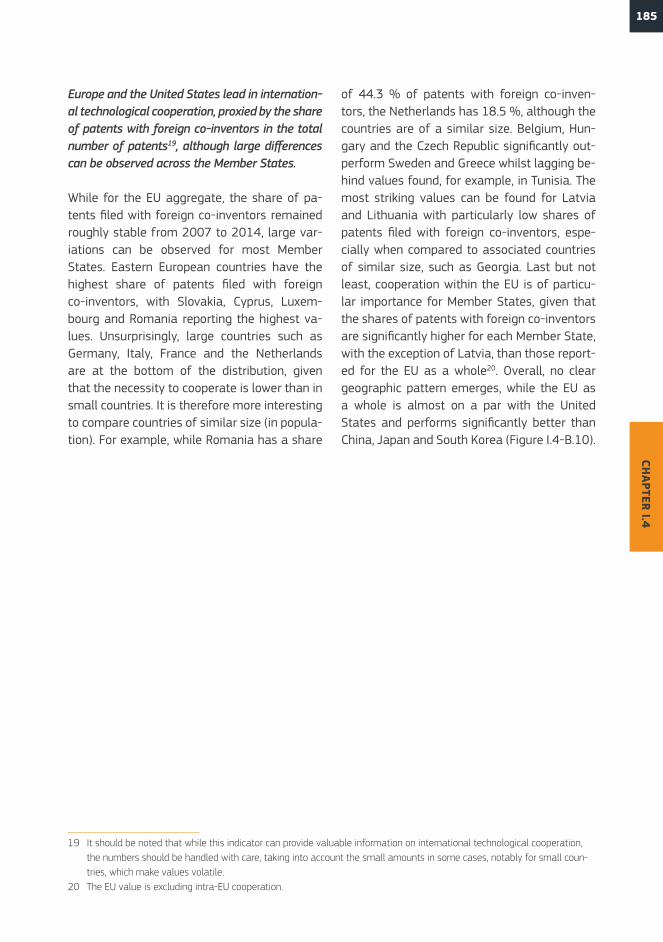
Europe and the United States lead in internation-al technological cooperation, proxied by the share of patents with foreign co-inventors in the total number of patents19, although large differences can be observed across the Member States.
While for the EU aggregate, the share of pa-tents filed with foreign co-inventors remained roughly stable from 2007 to 2014, large var-iations can be observed for most Member States. Eastern European countries have the highest share of patents filed with foreign co-inventors, with Slovakia, Cyprus, Luxem-bourg and Romania reporting the highest va-lues. Unsurprisingly, large countries such as Germany, Italy, France and the Netherlands are at the bottom of the distribution, given that the necessity to cooperate is lower than in small countries. It is therefore more interesting to compare countries of similar size (in popula-tion). For example, while Romania has a share
19 It should be noted that while this indicator can provide valuable information on international technological cooperation, the numbers should be handled with care, taking into account the small amounts in some cases, notably for small coun-tries, which make values volatile.
20 The EU value is excluding intra-EU cooperation.
of 44.3 % of patents with foreign co-inven-tors, the Netherlands has 18.5 %, although the countries are of a similar size. Belgium, Hun-gary and the Czech Republic significantly out-perform Sweden and Greece whilst lagging be-hind values found, for example, in Tunisia. The most striking values can be found for Latvia and Lithuania with particularly low shares of patents filed with foreign co-inventors, espe-cially when compared to associated countries of similar size, such as Georgia. Last but not least, cooperation within the EU is of particu-lar importance for Member States, given that the shares of patents with foreign co-inventors are significantly higher for each Member State, with the exception of Latvia, than those report-ed for the EU as a whole20. Overall, no clear geographic pattern emerges, while the EU as a whole is almost on a par with the United States and performs significantly better than China, Japan and South Korea (Figure I.4-B.10).
186
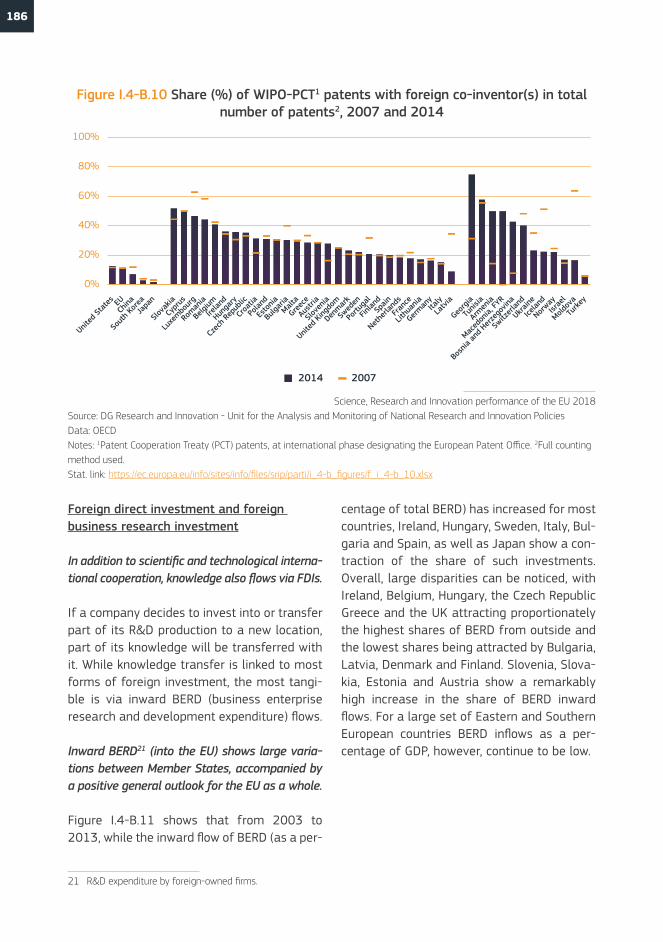
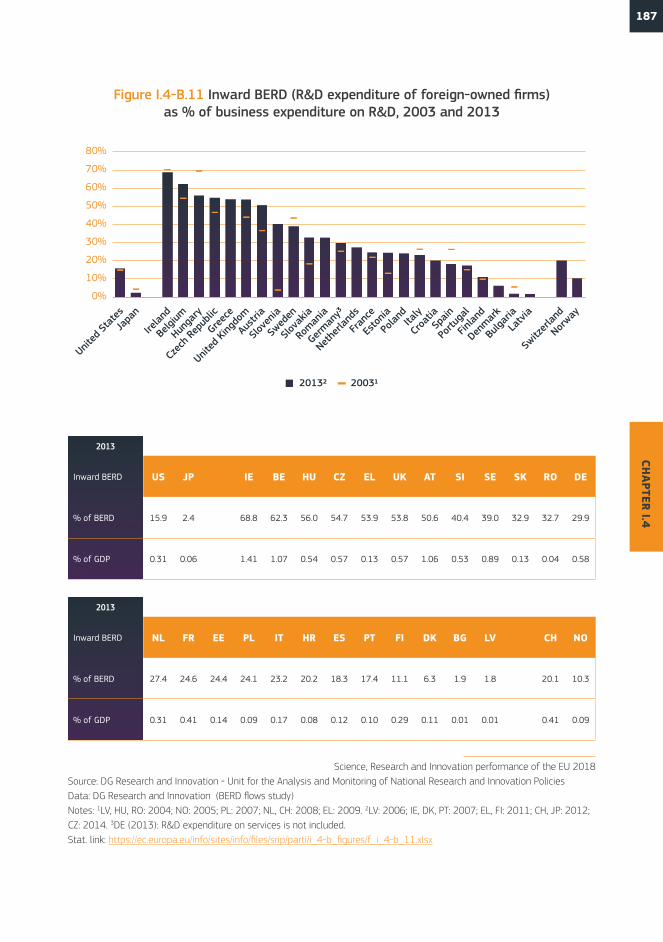
Foreign direct investment and foreign business research investment
In addition to scientific and technological interna-tional cooperation, knowledge also flows via FDIs.
If a company decides to invest into or transfer part of its R&D production to a new location, part of its knowledge will be transferred with it. While knowledge transfer is linked to most forms of foreign investment, the most tangi-ble is via inward BERD (business enterprise research and development expenditure) flows.
Inward BERD21 (into the EU) shows large varia-tions between Member States, accompanied by a positive general outlook for the EU as a whole.
Figure I.4-B.11 shows that from 2003 to 2013, while the inward flow of BERD (as a per-
21 R&D expenditure by foreign-owned firms.
centage of total BERD) has increased for most countries, Ireland, Hungary, Sweden, Italy, Bul-garia and Spain, as well as Japan show a con-traction of the share of such investments. Overall, large disparities can be noticed, with Ireland, Belgium, Hungary, the Czech Republic Greece and the UK attracting proportionately the highest shares of BERD from outside and the lowest shares being attracted by Bulgaria, Latvia, Denmark and Finland. Slovenia, Slova-kia, Estonia and Austria show a remarkably high increase in the share of BERD inward flows. For a large set of Eastern and Southern European countries BERD inflows as a per-centage of GDP, however, continue to be low.
Figure I.4-B.10 Share (%) of WIPO-PCT1 patents with foreign co-inventor(s) in total number of patents2, 2007 and 2014
Science, Research and Innovation performance of the EU 2018Source: DG Research and Innovation - Unit for the Analysis and Monitoring of National Research and Innovation PoliciesData: OECDNotes: 1Patent Cooperation Treaty (PCT) patents, at international phase designating the European Patent Office. 2Full counting method used.Stat. link: https://ec.europa.eu/info/sites/info/files/srip/parti/i_4-b_figures/f_i_4-b_10.xlsx
2014 2007
United
Stat
es EUCh
ina
Sout
h Kor
eaJa
pan
Slova
kia
Cypr
us
Luxe
mbour
g
Roman
ia
Belgi
um
Irelan
d
Hunga
ry
Czec
h Rep
ublic
Croa
tia
Polan
d
Esto
nia
Bulga
riaMalt
a
Greec
e
Austr
ia
Slove
nia
United
King
dom
Denmar
k
Swed
en
Portu
gal
Finlan
dSp
ain
Nethe
rland
s
Fran
ce
Lithu
ania
German
yIta
ly
Latv
ia
Georg
ia
Tunis
ia
Armen
ia
Maced
onia,
FYR
Bosn
ia an
d Her
zego
vina
Switz
erlan
d
Ukraine
Icelan
d
Norway
Israe
l
Moldov
a
Turke
y
0%
20%
40%
60%
80%
100%
187CH
APTER I.4
Figure I.4-B.11 Inward BERD (R&D expenditure of foreign-owned firms) as % of business expenditure on R&D, 2003 and 2013
20132 20031
United
Stat
esJa
pan
Irelan
d
Belgi
um
Hunga
ry
Czec
h Rep
ublic
Greec
e
United
King
dom
Austr
ia
Slove
nia
Swed
en
Slova
kia
Roman
ia
German
y3
Nethe
rland
s
Fran
ce
Esto
nia
Polan
dIta
ly
Croa
tiaSp
ain
Portu
gal
Finlan
d
Denmar
k
Bulga
ria
Latv
ia
Switz
erlan
d
Norway
0%
10%
20%
30%
40%
50%
60%
70%
80%
2013
Inward BERD US JP IE BE HU CZ EL UK AT SI SE SK RO DE
% of BERD 15.9 2.4 68.8 62.3 56.0 54.7 53.9 53.8 50.6 40.4 39.0 32.9 32.7 29.9
% of GDP 0.31 0.06 1.41 1.07 0.54 0.57 0.13 0.57 1.06 0.53 0.89 0.13 0.04 0.58
2013
Inward BERD NL FR EE PL IT HR ES PT FI DK BG LV CH NO
% of BERD 27.4 24.6 24.4 24.1 23.2 20.2 18.3 17.4 11.1 6.3 1.9 1.8 20.1 10.3
% of GDP 0.31 0.41 0.14 0.09 0.17 0.08 0.12 0.10 0.29 0.11 0.01 0.01 0.41 0.09
Science, Research and Innovation performance of the EU 2018Source: DG Research and Innovation - Unit for the Analysis and Monitoring of National Research and Innovation Policies Data: DG Research and Innovation (BERD flows study) Notes: 1LV, HU, RO: 2004; NO: 2005; PL: 2007; NL, CH: 2008; EL: 2009. 2LV: 2006; IE, DK, PT: 2007; EL, FI: 2011; CH, JP: 2012; CZ: 2014. 3DE (2013): R&D expenditure on services is not included.Stat. link: https://ec.europa.eu/info/sites/info/files/srip/parti/i_4-b_figures/f_i_4-b_11.xlsx
188
Trade
Finally, knowledge can be transferred via trade, especially in the form of exports of high-tech and medium-high-tech goods (MHT) and services. However, to adequately assess how much of a country's knowledge has been transferred, it is important to compute the amount of knowledge (proxied here by the value added) that was added by the country itself versus how much knowledge stemmed from foreign contributions. a high share of foreign value added would indicate how much knowledge has flown into the country, while a high share of domestic value added paired with high shares of exports would indicate an outflow of knowledge, which means both can be evaluated positively. Figure I.4-B.12 shows the evolution of foreign value added in high-tech and MHT exports between 2000 and 2011 as a percentage of total exports, as well as now-cast values for 2014.
The importance of foreign created value added in high-tech and MHT exports is crucial in Europe, notably for several Central, Eastern and Southern European countries, for which it is a particularly important source of technological inflows.
The foreign value added of gross exports in high-tech and MHT sectors, presented in Figure I.4-B.12, shows that China (with 43.6 % in 2014) and South Korea (38.4 %), as well as the East-ern European countries (59.7 % for Hungary and 59.3 % for Slovakia), report high shares of foreign value added, while also enjoying both high shares of high-tech and medium high-tech exports (see figure I.4-C.4 for Hungary and Slo-vakia). In general, an increase in foreign value added in high-tech and MHT goods can be ob-served for most countries, with the exception of e.g. China, several the Eastern European coun-tries, Greece and to a lesser extent Spain. For highly exporting countries such as China and South Korea, as well as Eastern European coun-tries, around half of the value was added to the
goods before entering the country, indicating a large inflow of knowledge. This contrasts with the considerably lower, share of foreign value added in Germany, Denmark, France, the UK, Austria and Sweden, which are thereby export-ing their knowledge. China has decreased its foreign value added considerably, which might suggests that it increased its in-house expertise over the past decade and also its production.
This chapter has aimed at analysing the evo-lution of knowledge flows in and out of the EU. The objective has been to provide nuances to the discussion on why productivity is slowing down and to see whether trends in knowledge flows contribute to the slowdown of innovation diffusion. In general, the flow of knowledge is less smooth in the EU than its international counterparts, and notably the United States.
A lack of open innovation can be observed in the EU, as measured by the knowledge transferred between the public and the pri-vate sector in the form of public-private co- publications and the share of public R&D expenditure funded by the private sector. The EU lags considerably behind the United States, South Korea and Japan, with no sig-nificant evolution in recent years. More posi-tive patterns emerge when the focus is on the openness of the EU to the world. As a conse-quence of globalisation, international scientif-ic collaboration has increased worldwide. The EU continues to act as scientific pole and has been increasing its shares since the 2000s, although during that period the United States experienced a significantly higher rise in in-ternational collaborations. This might indicate that the EU is not taking enough advantage of international dynamics. Similarly, it can be ob-served that, when looking at output as prox-ied by patents with foreign co-inventors, the EU is not yet taking sufficient advantage of international advances, and still lags behind the United States in spite of a positive trend to close the gap. Overall, while the EU has
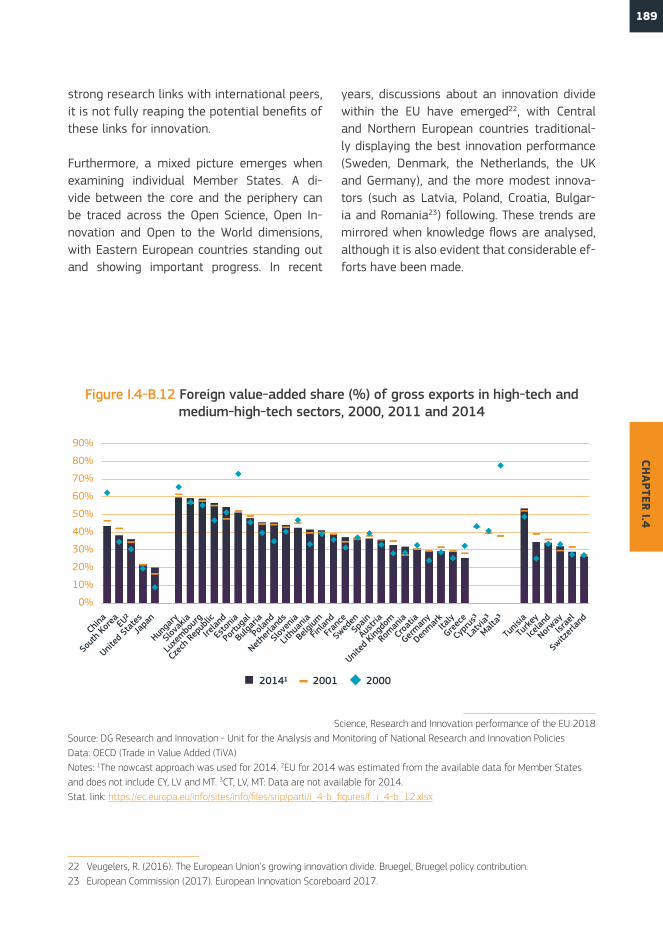
189CH
APTER I.4
strong research links with international peers, it is not fully reaping the potential benefits of these links for innovation.
Furthermore, a mixed picture emerges when examining individual Member States. A di-vide between the core and the periphery can be traced across the Open Science, Open In-novation and Open to the World dimensions, with Eastern European countries standing out and showing important progress. In recent
22 Veugelers, R. (2016). The European Union's growing innovation divide. Bruegel, Bruegel policy contribution.23 European Commission (2017). European Innovation Scoreboard 2017.
years, discussions about an innovation divide within the EU have emerged22, with Central and Northern European countries traditional-ly displaying the best innovation performance (Sweden, Denmark, the Netherlands, the UK and Germany), and the more modest innova-tors (such as Latvia, Poland, Croatia, Bulgar-ia and Romania23) following. These trends are mirrored when knowledge flows are analysed, although it is also evident that considerable ef-forts have been made.
Figure I.4-B.12 Foreign value-added share (%) of gross exports in high-tech and medium-high-tech sectors, 2000, 2011 and 2014
Science, Research and Innovation performance of the EU 2018Source: DG Research and Innovation - Unit for the Analysis and Monitoring of National Research and Innovation PoliciesData: OECD (Trade in Value Added (TiVA)Notes: 1The nowcast approach was used for 2014. 2EU for 2014 was estimated from the available data for Member States and does not include CY, LV and MT. 3CT, LV, MT: Data are not available for 2014.Stat. link: https://ec.europa.eu/info/sites/info/files/srip/parti/i_4-b_figures/f_i_4-b_12.xlsx
China
Sout
h Kor
ea EU2
United
Stat
esJa
pan
Hunga
ry
Slova
kia
Luxe
mbour
g
Czec
h Rep
ublic
Irelan
d
Esto
nia
Portu
gal
Bulga
ria
Polan
d
Nethe
rland
s
Slove
nia
Lithu
ania
Belgi
um
Finlan
d
Fran
ce
Swed
enSp
ain
Austr
ia
United
King
dom
Roman
ia
Croa
tia
German
y
Denmar
kIta
ly
Greec
e
Cypr
us3
Latv
ia3
Malta3
Tunis
ia
Turke
y
Icelan
d
Norway
Israe
l
Switz
erlan
d
0%
10%
20%
30%
40%
50%
60%
70%
80%
90%
20141 2001 2000
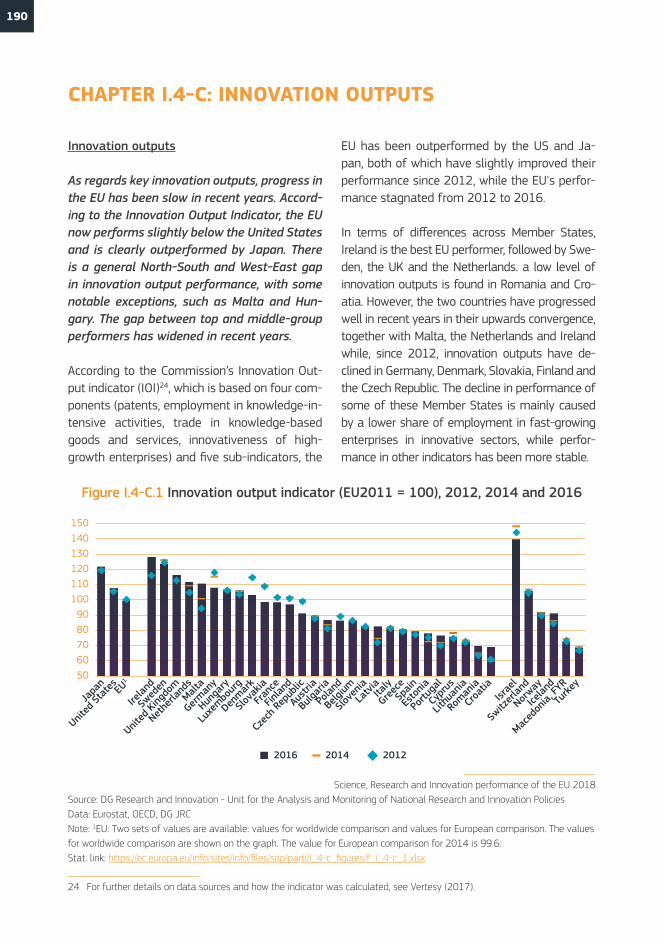
190
CHAPTER I.4-C: INNOVATION OUTPUTS
24 For further details on data sources and how the indicator was calculated, see Vertesy (2017).
Innovation outputs
As regards key innovation outputs, progress in the EU has been slow in recent years. Accord-ing to the Innovation Output Indicator, the EU now performs slightly below the United States and is clearly outperformed by Japan. There is a general North-South and West-East gap in innovation output performance, with some notable exceptions, such as Malta and Hun-gary. The gap between top and middle-group performers has widened in recent years.
According to the Commission’s Innovation Out-put indicator (IOI)24, which is based on four com-ponents (patents, employment in knowledge-in-tensive activities, trade in knowledge-based goods and services, innovativeness of high-growth enterprises) and five sub-indicators, the
EU has been outperformed by the US and Ja-pan, both of which have slightly improved their performance since 2012, while the EU's perfor-mance stagnated from 2012 to 2016.
In terms of differences across Member States, Ireland is the best EU performer, followed by Swe-den, the UK and the Netherlands. a low level of innovation outputs is found in Romania and Cro-atia. However, the two countries have progressed well in recent years in their upwards convergence, together with Malta, the Netherlands and Ireland while, since 2012, innovation outputs have de-clined in Germany, Denmark, Slovakia, Finland and the Czech Republic. The decline in performance of some of these Member States is mainly caused by a lower share of employment in fast-growing enterprises in innovative sectors, while perfor-mance in other indicators has been more stable.
Figure I.4-C.1 Innovation output indicator (EU2011 = 100), 2012, 2014 and 2016
Science, Research and Innovation performance of the EU 2018Source: DG Research and Innovation - Unit for the Analysis and Monitoring of National Research and Innovation PoliciesData: Eurostat, OECD, DG JRCNote: 1EU: Two sets of values are available: values for worldwide comparison and values for European comparison. The values for worldwide comparison are shown on the graph. The value for European comparison for 2014 is 99.6.Stat. link: https://ec.europa.eu/info/sites/info/files/srip/parti/i_4-c_figures/f_i_4-c_1.xlsx
2016 2014 2012
Japa
n
United
Stat
es EU1
Irelan
d
Swed
en
United
King
dom
Nethe
rland
sMalt
a
German
y
Hunga
ry
Luxe
mbour
g
Denmar
k
Slova
kia
Fran
ce
Finlan
d
Czec
h Rep
ublic
Austr
ia
Bulga
ria
Polan
d
Belgi
um
Slove
nia
Latv
iaIta
ly
Greec
eSp
ain
Esto
nia
Portu
gal
Cypr
us
Lithu
ania
Roman
ia
Croa
tiaIsr
ael
Switz
erlan
d
Norway
Icelan
d
Maced
onia,
FYR
Turke
y5060708090
100110120130140150
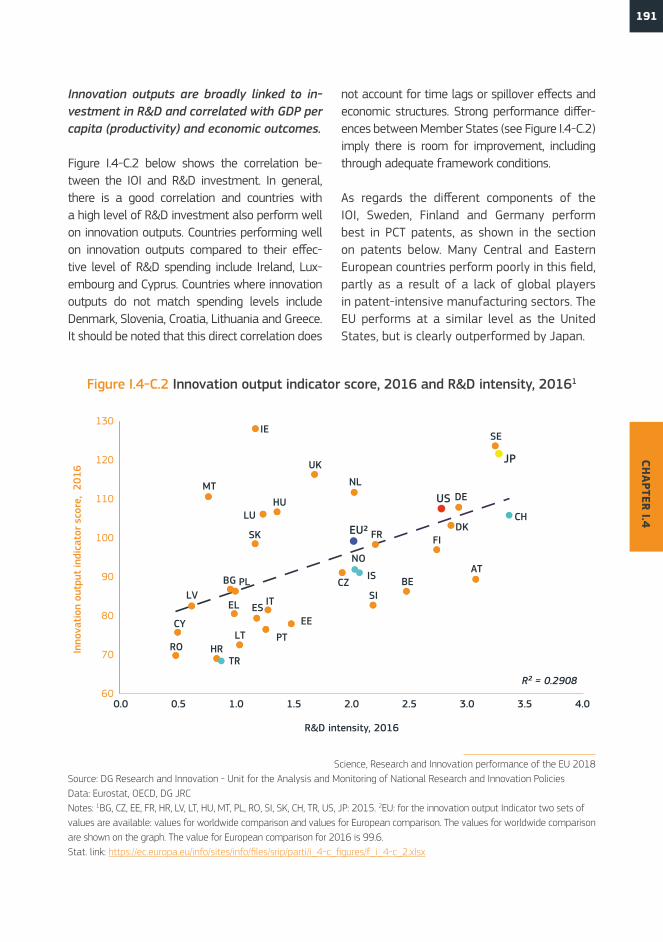
191CH
APTER I.4
Innovation outputs are broadly linked to in-vestment in R&D and correlated with GDP per capita (productivity) and economic outcomes.
Figure I.4-C.2 below shows the correlation be-tween the IOI and R&D investment. In general, there is a good correlation and countries with a high level of R&D investment also perform well on innovation outputs. Countries performing well on innovation outputs compared to their effec-tive level of R&D spending include Ireland, Lux-embourg and Cyprus. Countries where innovation outputs do not match spending levels include Denmark, Slovenia, Croatia, Lithuania and Greece. It should be noted that this direct correlation does
not account for time lags or spillover effects and economic structures. Strong performance differ-ences between Member States (see Figure I.4-C.2) imply there is room for improvement, including through adequate framework conditions.
As regards the different components of the IOI, Sweden, Finland and Germany perform best in PCT patents, as shown in the section on patents below. Many Central and Eastern European countries perform poorly in this field, partly as a result of a lack of global players in patent-intensive manufacturing sectors. The EU performs at a similar level as the United States, but is clearly outperformed by Japan.
Figure I.4-C.2 Innovation output indicator score, 2016 and R&D intensity, 20161
Science, Research and Innovation performance of the EU 2018Source: DG Research and Innovation - Unit for the Analysis and Monitoring of National Research and Innovation PoliciesData: Eurostat, OECD, DG JRCNotes: 1BG, CZ, EE, FR, HR, LV, LT, HU, MT, PL, RO, SI, SK, CH, TR, US, JP: 2015. 2EU: for the innovation output Indicator two sets of values are available: values for worldwide comparison and values for European comparison. The values for worldwide comparison are shown on the graph. The value for European comparison for 2016 is 99.6.Stat. link: https://ec.europa.eu/info/sites/info/files/srip/parti/i_4-c_figures/f_i_4-c_2.xlsx
EU2
JP
SE
AT
DKCH
FI
DEUS
BE
FR
SI
IS
NL
CZ
NO
UK
IE
EE
HU
IT
LU
PT
ES
SK
LT
TR
PL
EL
BG
HR
MT
LV
RO
CY
R² = 0.290860
70
80
90
100
110
120
130
0.0 0.5 1.0 1.5 2.0 2.5 3.0 3.5 4.0
Inno
vati
on o
utpu
t in
dica
tor
scor
e, 2
016
R&D intensity, 2016
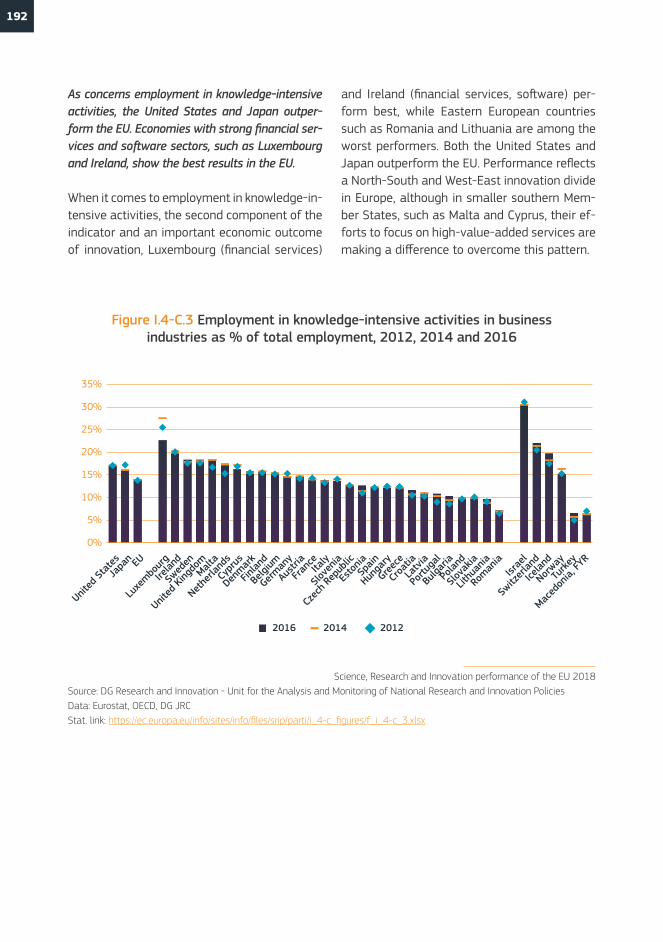
192
As concerns employment in knowledge-intensive activities, the United States and Japan outper-form the EU. Economies with strong financial ser-vices and software sectors, such as Luxembourg and Ireland, show the best results in the EU.
When it comes to employment in knowledge-in-tensive activities, the second component of the indicator and an important economic outcome of innovation, Luxembourg (financial services)
and Ireland (financial services, software) per-form best, while Eastern European countries such as Romania and Lithuania are among the worst performers. Both the United States and Japan outperform the EU. Performance reflects a North-South and West-East innovation divide in Europe, although in smaller southern Mem-ber States, such as Malta and Cyprus, their ef-forts to focus on high-value-added services are making a difference to overcome this pattern.
Figure I.4-C.3 Employment in knowledge-intensive activities in business industries as % of total employment, 2012, 2014 and 2016
Science, Research and Innovation performance of the EU 2018Source: DG Research and Innovation - Unit for the Analysis and Monitoring of National Research and Innovation PoliciesData: Eurostat, OECD, DG JRCStat. link: https://ec.europa.eu/info/sites/info/files/srip/parti/i_4-c_figures/f_i_4-c_3.xlsx
0%
5%
10%
15%
20%
25%
30%
35%
2016 2014 2012
United
Stat
esJa
pan EU
Luxe
mbour
g
Irelan
d
Swed
en
United
King
domMalt
a
Nethe
rland
s
Cypr
us
Denmar
k
Finlan
d
Belgi
um
German
y
Austr
ia
Fran
ceIta
ly
Slove
nia
Czec
h Rep
ublic
Esto
niaSp
ain
Hunga
ry
Greec
e
Croa
tia
Latv
ia
Portu
gal
Bulga
ria
Polan
d
Slova
kia
Lithu
ania
Roman
iaIsr
ael
Switz
erlan
d
Icelan
d
Norway
Turke
y
Maced
onia,
FYR
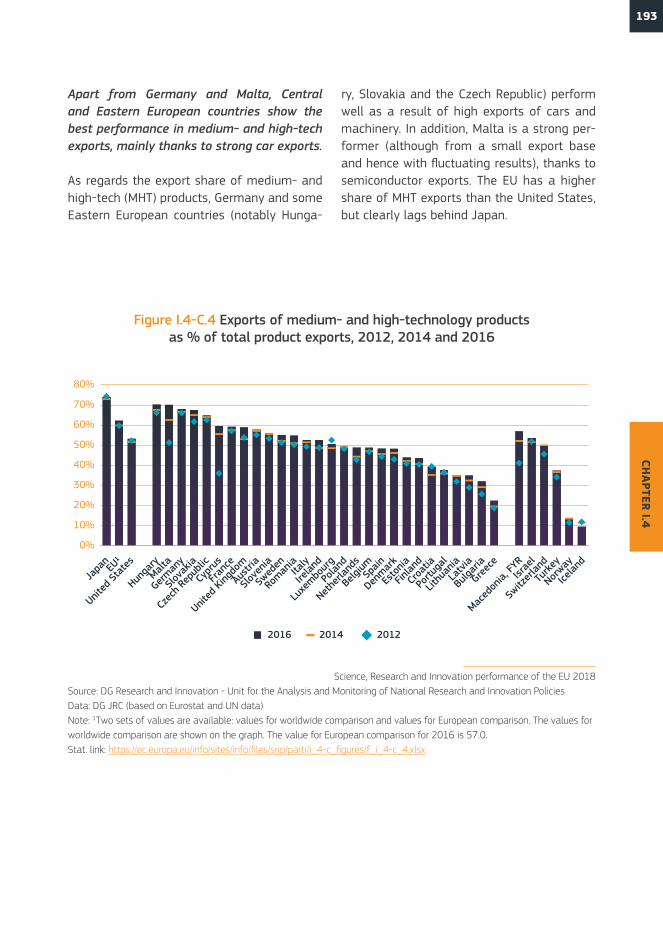
193CH
APTER I.4
Apart from Germany and Malta, Central and Eastern European countries show the best performance in medium- and high-tech exports, mainly thanks to strong car exports.
As regards the export share of medium- and high-tech (MHT) products, Germany and some Eastern European countries (notably Hunga-
ry, Slovakia and the Czech Republic) perform well as a result of high exports of cars and machinery. In addition, Malta is a strong per-former (although from a small export base and hence with fluctuating results), thanks to semiconductor exports. The EU has a higher share of MHT exports than the United States, but clearly lags behind Japan.
Figure I.4-C.4 Exports of medium- and high-technology products as % of total product exports, 2012, 2014 and 2016
Science, Research and Innovation performance of the EU 2018Source: DG Research and Innovation - Unit for the Analysis and Monitoring of National Research and Innovation PoliciesData: DG JRC (based on Eurostat and UN data)Note: 1Two sets of values are available: values for worldwide comparison and values for European comparison. The values for worldwide comparison are shown on the graph. The value for European comparison for 2016 is 57.0.Stat. link: https://ec.europa.eu/info/sites/info/files/srip/parti/i_4-c_figures/f_i_4-c_4.xlsx
2016 2014 2012
Japa
nEU
1
United
Stat
es
Hunga
ryMalt
a
German
y
Slova
kia
Czec
h Rep
ublic
Cypr
us
Fran
ce
United
King
dom
Austr
ia
Slove
nia
Swed
en
Roman
iaIta
ly
Irelan
d
Luxe
mbour
g
Polan
d
Nethe
rland
s
Belgi
umSp
ain
Denmar
k
Esto
nia
Finlan
d
Croa
tia
Portu
gal
Lithu
ania
Latv
ia
Bulga
ria
Greec
e
Maced
onia,
FYRIsr
ael
Switz
erlan
d
Turke
y
Norway
Icelan
d
0%
10%
20%
30%
40%
50%
60%
70%
80%
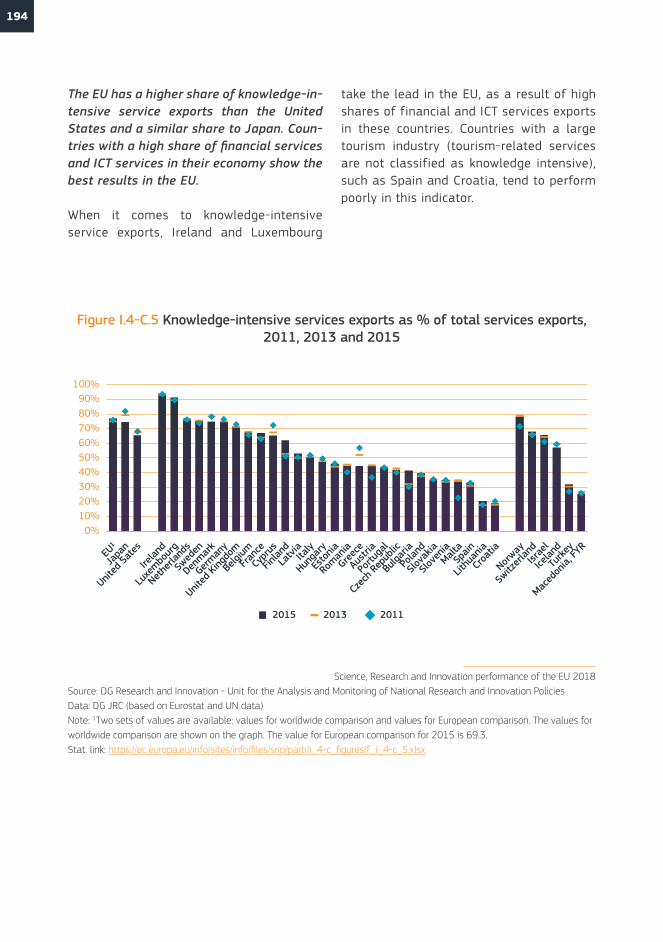
194
The EU has a higher share of knowledge-in-tensive service exports than the United States and a similar share to Japan. Coun-tries with a high share of financial services and ICT services in their economy show the best results in the EU.
When it comes to knowledge-intensive service exports, Ireland and Luxembourg
take the lead in the EU, as a result of high shares of financial and ICT services exports in these countries. Countries with a large tourism industry (tourism-related services are not classified as knowledge intensive), such as Spain and Croatia, tend to perform poorly in this indicator.
Figure I.4-C.5 Knowledge-intensive services exports as % of total services exports, 2011, 2013 and 2015
Science, Research and Innovation performance of the EU 2018Source: DG Research and Innovation - Unit for the Analysis and Monitoring of National Research and Innovation PoliciesData: DG JRC (based on Eurostat and UN data)Note: 1Two sets of values are available: values for worldwide comparison and values for European comparison. The values for worldwide comparison are shown on the graph. The value for European comparison for 2015 is 69.3.Stat. link: https://ec.europa.eu/info/sites/info/files/srip/parti/i_4-c_figures/f_i_4-c_5.xlsx
0%10%20%30%40%50%60%70%80%90%
100%
2015 2013 2011
EU1
Japa
n
United
Sate
s
Irelan
d
Luxe
mbour
g
Nethe
rland
s
Swed
en
Denmar
k
German
y
United
King
dom
Belgi
umFra
nce
Cypr
us
Finlan
dLa
tviaIta
ly
Hunga
ry
Esto
nia
Roman
ia
Greec
e
Austr
ia
Portu
gal
Czec
h Rep
ublic
Bulga
ria
Polan
d
Slova
kia
Slove
niaMalt
aSp
ain
Lithu
ania
Croa
tia
Norway
Switz
erlan
dIsr
ael
Icelan
d
Turke
y
Maced
onia,
FYR
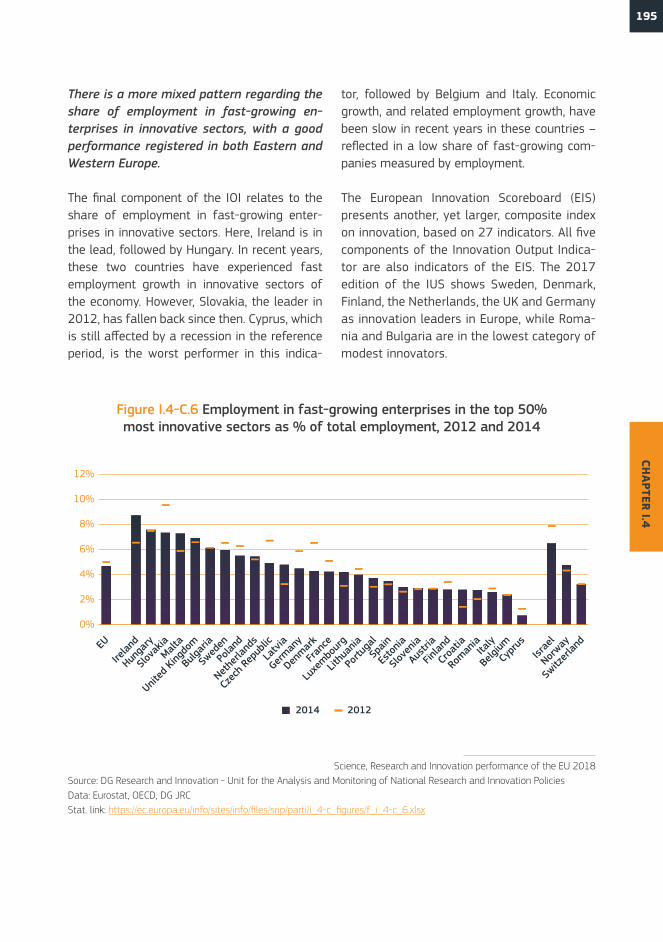
195CH
APTER I.4
There is a more mixed pattern regarding the share of employment in fast-growing en-terprises in innovative sectors, with a good performance registered in both Eastern and Western Europe.
The final component of the IOI relates to the share of employment in fast-growing enter-prises in innovative sectors. Here, Ireland is in the lead, followed by Hungary. In recent years, these two countries have experienced fast employment growth in innovative sectors of the economy. However, Slovakia, the leader in 2012, has fallen back since then. Cyprus, which is still affected by a recession in the reference period, is the worst performer in this indica-
tor, followed by Belgium and Italy. Economic growth, and related employment growth, have been slow in recent years in these countries – reflected in a low share of fast-growing com-panies measured by employment.
The European Innovation Scoreboard (EIS) presents another, yet larger, composite index on innovation, based on 27 indicators. All five components of the Innovation Output Indica-tor are also indicators of the EIS. The 2017 edition of the IUS shows Sweden, Denmark, Finland, the Netherlands, the UK and Germany as innovation leaders in Europe, while Roma-nia and Bulgaria are in the lowest category of modest innovators.
Figure I.4-C.6 Employment in fast-growing enterprises in the top 50% most innovative sectors as % of total employment, 2012 and 2014
Science, Research and Innovation performance of the EU 2018Source: DG Research and Innovation - Unit for the Analysis and Monitoring of National Research and Innovation PoliciesData: Eurostat, OECD, DG JRCStat. link: https://ec.europa.eu/info/sites/info/files/srip/parti/i_4-c_figures/f_i_4-c_6.xlsx
0%
2%
4%
6%
8%
10%
12%
2014 2012
EU
Irelan
d
Hunga
ry
Slova
kiaMalt
a
United
King
dom
Bulga
ria
Swed
en
Polan
d
Nethe
rland
s
Czec
h Rep
ublic
Latv
ia
German
y
Denmar
k
Fran
ce
Luxe
mbour
g
Lithu
ania
Portu
galSp
ain
Esto
nia
Slove
nia
Austr
ia
Finlan
d
Croa
tia
Roman
iaIta
ly
Belgi
umCy
prus
Israe
l
Norway
Switz
erlan
d
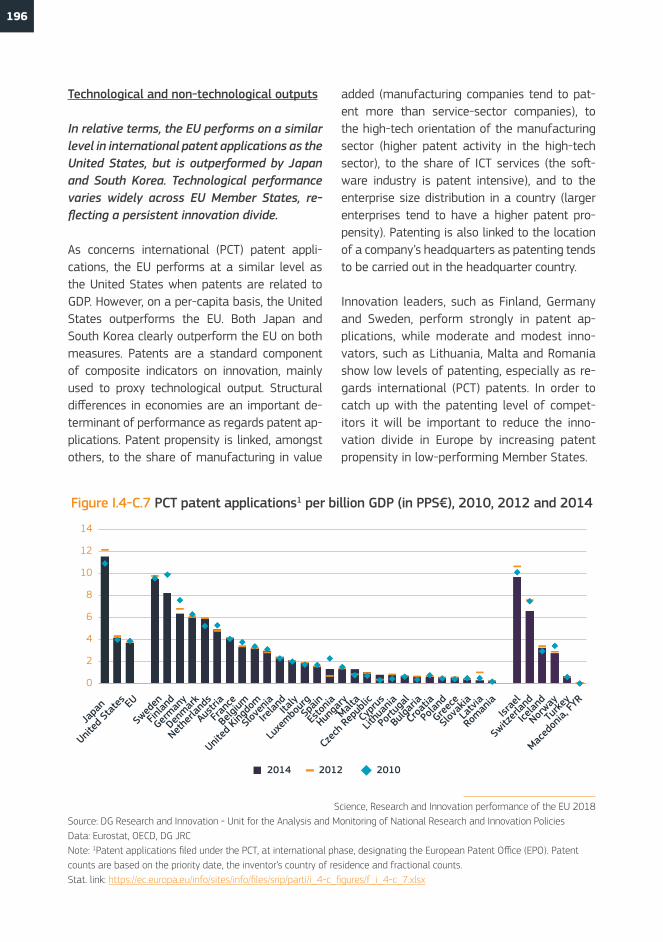
196
Technological and non-technological outputs
In relative terms, the EU performs on a similar level in international patent applications as the United States, but is outperformed by Japan and South Korea. Technological performance varies widely across EU Member States, re-flecting a persistent innovation divide.
As concerns international (PCT) patent appli-cations, the EU performs at a similar level as the United States when patents are related to GDP. However, on a per-capita basis, the United States outperforms the EU. Both Japan and South Korea clearly outperform the EU on both measures. Patents are a standard component of composite indicators on innovation, mainly used to proxy technological output. Structural differences in economies are an important de-terminant of performance as regards patent ap-plications. Patent propensity is linked, amongst others, to the share of manufacturing in value
added (manufacturing companies tend to pat-ent more than service-sector companies), to the high-tech orientation of the manufacturing sector (higher patent activity in the high-tech sector), to the share of ICT services (the soft-ware industry is patent intensive), and to the enterprise size distribution in a country (larger enterprises tend to have a higher patent pro-pensity). Patenting is also linked to the location of a company’s headquarters as patenting tends to be carried out in the headquarter country.
Innovation leaders, such as Finland, Germany and Sweden, perform strongly in patent ap-plications, while moderate and modest inno-vators, such as Lithuania, Malta and Romania show low levels of patenting, especially as re-gards international (PCT) patents. In order to catch up with the patenting level of compet-itors it will be important to reduce the inno-vation divide in Europe by increasing patent propensity in low-performing Member States.
Figure I.4-C.7 PCT patent applications1 per billion GDP (in PPS€), 2010, 2012 and 2014
Science, Research and Innovation performance of the EU 2018Source: DG Research and Innovation - Unit for the Analysis and Monitoring of National Research and Innovation PoliciesData: Eurostat, OECD, DG JRCNote: 1Patent applications filed under the PCT, at international phase, designating the European Patent Office (EPO). Patent counts are based on the priority date, the inventor’s country of residence and fractional counts.Stat. link: https://ec.europa.eu/info/sites/info/files/srip/parti/i_4-c_figures/f_i_4-c_7.xlsx
0
2
4
6
8
10
12
14
2014 2012 2010
Japa
n
United
Stat
es EU
Swed
en
Finlan
d
German
y
Denmar
k
Nethe
rland
s
Austr
ia
Fran
ce
Belgi
um
United
King
dom
Slove
nia
Irelan
dIta
ly
Luxe
mbour
gSp
ain
Esto
nia
Hunga
ryMalt
a
Czec
h Rep
ublic
Cypr
us
Lithu
ania
Portu
gal
Bulga
ria
Croa
tia
Polan
d
Greec
e
Slova
kia
Latv
ia
Roman
iaIsr
ael
Switz
erlan
d
Icelan
d
Norway
Turke
y
Maced
onia,
FYR

197CH
APTER I.4
While Europe’s share in international patent applications is declining, Asian countries, notably China, are catching up.
In many European countries, the number of international and national patent applications has declined recently, while patenting has been
expanding quickly in East Asian countries. As a result, these countries, especially China, are catching up in world patent shares, while Eu-rope’s share is falling. The United States’ share, which has long been in decline, stabilised in re-cent years before falling again in 2014.
Figure I.4-C.8 World share (%) of PCT patent applications1, 2000-2014
Science, Research and Innovation performance of the EU 2018Source: DG Research and Innovation - Unit for the Analysis and Monitoring of National Research and Innovation PoliciesData: OECDNote: 1Patent applications filed under the PCT, at international phase, designating the European Patent Office (EPO). Patent counts are based on the priority date, the inventor’s country of residence and fractional counts.Stat. link: https://ec.europa.eu/info/sites/info/files/srip/parti/i_4-c_figures/f_i_4-c_8.xlsx
Japan
South Korea
United States
EU
China
0%
5%
10%
15%
20%
25%
30%
35%
40%
45%
2000 2001 2002 2003 2004 2005 2006 2007 2008 2009 2010 2011 2012 2013 2014
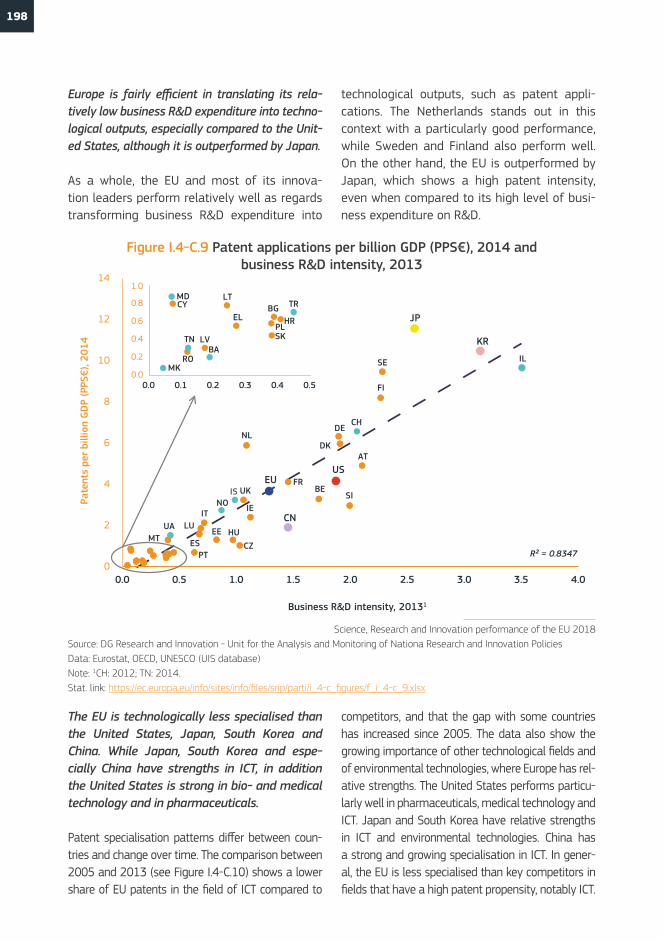
198
The EU is technologically less specialised than the United States, Japan, South Korea and China. While Japan, South Korea and espe-cially China have strengths in ICT, in addition the United States is strong in bio- and medical technology and in pharmaceuticals.
Patent specialisation patterns differ between coun-tries and change over time. The comparison between 2005 and 2013 (see Figure I.4-C.10) shows a lower share of EU patents in the field of ICT compared to
competitors, and that the gap with some countries has increased since 2005. The data also show the growing importance of other technological fields and of environmental technologies, where Europe has rel-ative strengths. The United States performs particu-larly well in pharmaceuticals, medical technology and ICT. Japan and South Korea have relative strengths in ICT and environmental technologies. China has a strong and growing specialisation in ICT. In gener-al, the EU is less specialised than key competitors in fields that have a high patent propensity, notably ICT.
Europe is fairly efficient in translating its rela-tively low business R&D expenditure into techno-logical outputs, especially compared to the Unit-ed States, although it is outperformed by Japan.
As a whole, the EU and most of its innova-tion leaders perform relatively well as regards transforming business R&D expenditure into
technological outputs, such as patent appli-cations. The Netherlands stands out in this context with a particularly good performance, while Sweden and Finland also perform well. On the other hand, the EU is outperformed by Japan, which shows a high patent intensity, even when compared to its high level of busi-ness expenditure on R&D.
Figure I.4-C.9 Patent applications per billion GDP (PPS€), 2014 and business R&D intensity, 2013
Science, Research and Innovation performance of the EU 2018Source: DG Research and Innovation - Unit for the Analysis and Monitoring of Nationa Research and Innovation PoliciesData: Eurostat, OECD, UNESCO (UIS database)Note: 1CH: 2012; TN: 2014.Stat. link: https://ec.europa.eu/info/sites/info/files/srip/parti/i_4-c_figures/f_i_4-c_9.xlsx
JP
KR
USEU
CN
SE
FI
DE
DKNL
AT
FRBEUK SI
IEITLU
ESEE HU
MTCZ
PT
IL
CH
ISNO
UA
R² = 0.83470
2
4
6
8
10
12
14
0.0 0.5 1.0 1.5 2.0 2.5 3.0 3.5 4.0
Pate
nts
per
billi
on G
DP
(PPS
€), 2
014
Business R&D intensity, 20131
CYLT
BGHR
PLEL
SKLV
RO
MDTR
TNBA
MK0.0
0.2
0.4
0.6
0.8
1.0
0.0 0.1 0.2 0.3 0.4 0.5
EU
Swed
en
Aus
tria
Ger
many
Den
mark
Finla
nd
Belg
ium
Fran
ce
Slov
enia
Net
herla
nds
Czec
h Rep
ublic
Unit
ed K
ingdo
m
Esto
nia
Hun
gary
Italy
Portu
gal4
Luxe
mbour
g(5)
Spain
Irela
nd6
Slov
akia
Lith
uania
Polan
d
Gre
ece
Bulg
aria
Croa
tia
Malt
a
Latv
ia
Cypr
us
Roman
ia
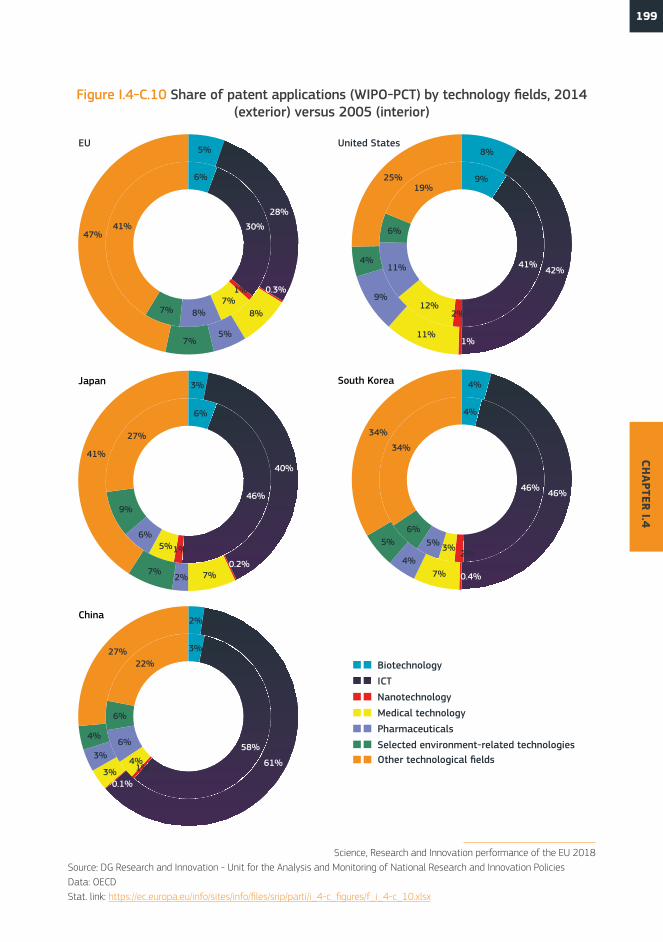
199CH
APTER I.4
Figure I.4-C.10 Share of patent applications (WIPO-PCT) by technology fields, 2014 (exterior) versus 2005 (interior)
Science, Research and Innovation performance of the EU 2018Source: DG Research and Innovation - Unit for the Analysis and Monitoring of National Research and Innovation PoliciesData: OECDStat. link: https://ec.europa.eu/info/sites/info/files/srip/parti/i_4-c_figures/f_i_4-c_10.xlsx
BiotechnologyICTNanotechnologyMedical technologyPharmaceuticalsSelected environment-related technologiesOther technological fields
6%
30%
1%7%
8%7%
41%
5%
28%
0.3%
8%
5%7%
47%
9%
41%
2%12%
11%
6%
19%
8%
42%
1%11%
9%
4%
25%
6%
46%
1%5%6%
9%
27%
3%
40%
0.2%7%2%
7%
41%
4%
46%
2%3%5%
6%
34%
4%
46%
0.4%7%4%
5%
34%
3%
58%
1%4%
6%
6%
22%
2%
61%
0.1%3%
3%
4%
27%
EU United States
Japan South Korea
China
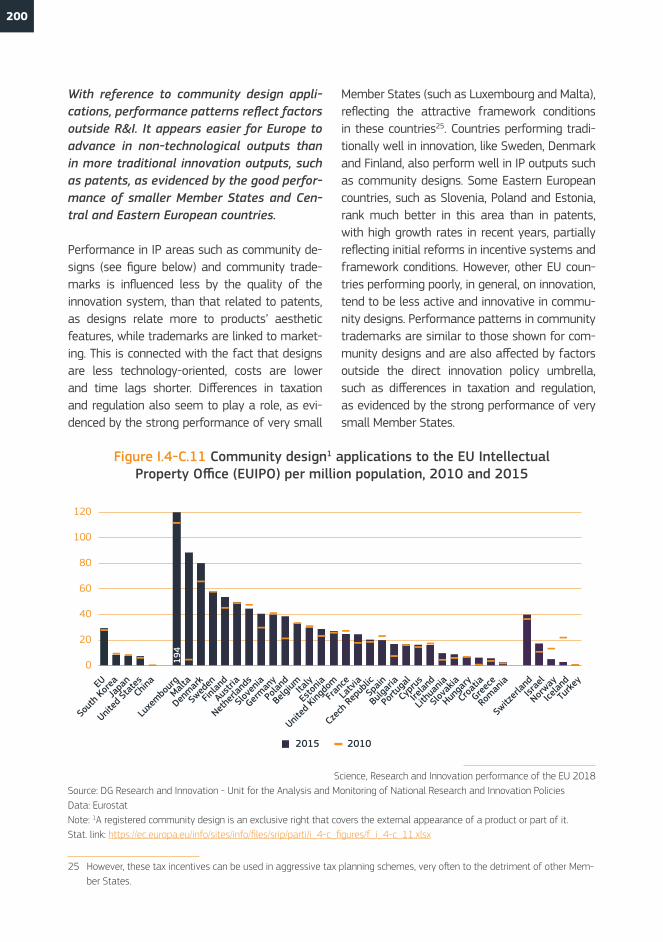
200
With reference to community design appli-cations, performance patterns reflect factors outside R&I. It appears easier for Europe to advance in non-technological outputs than in more traditional innovation outputs, such as patents, as evidenced by the good perfor-mance of smaller Member States and Cen-tral and Eastern European countries.
Performance in IP areas such as community de-signs (see figure below) and community trade-marks is influenced less by the quality of the innovation system, than that related to patents, as designs relate more to products’ aesthetic features, while trademarks are linked to market-ing. This is connected with the fact that designs are less technology-oriented, costs are lower and time lags shorter. Differences in taxation and regulation also seem to play a role, as evi-denced by the strong performance of very small
25 However, these tax incentives can be used in aggressive tax planning schemes, very often to the detriment of other Mem-ber States.
Member States (such as Luxembourg and Malta), reflecting the attractive framework conditions in these countries25. Countries performing tradi-tionally well in innovation, like Sweden, Denmark and Finland, also perform well in IP outputs such as community designs. Some Eastern European countries, such as Slovenia, Poland and Estonia, rank much better in this area than in patents, with high growth rates in recent years, partially reflecting initial reforms in incentive systems and framework conditions. However, other EU coun-tries performing poorly, in general, on innovation, tend to be less active and innovative in commu-nity designs. Performance patterns in community trademarks are similar to those shown for com-munity designs and are also affected by factors outside the direct innovation policy umbrella, such as differences in taxation and regulation, as evidenced by the strong performance of very small Member States.
Figure I.4-C.11 Community design1 applications to the EU Intellectual Property Office (EUIPO) per million population, 2010 and 2015
Science, Research and Innovation performance of the EU 2018Source: DG Research and Innovation - Unit for the Analysis and Monitoring of National Research and Innovation PoliciesData: EurostatNote: 1A registered community design is an exclusive right that covers the external appearance of a product or part of it.Stat. link: https://ec.europa.eu/info/sites/info/files/srip/parti/i_4-c_figures/f_i_4-c_11.xlsx
2015 2010
EUSo
uth
Kore
aJa
pan
United
Stat
esCh
ina
Luxe
mbour
gMalt
a
Denmar
k
Swed
en
Finlan
d
Austr
ia
Nethe
rland
s
Slove
nia
German
y
Polan
d
Belgi
umItaly
Esto
nia
United
King
dom
Fran
ce
Latv
ia
Czec
h Rep
ublicSp
ain
Bulga
ria
Portu
gal
Cypr
us
Irelan
d
Lithu
ania
Slova
kia
Hunga
ry
Croa
tia
Greec
e
Roman
ia
Switz
erlan
dIsr
ael
Norway
Icelan
d
Turke
y
EU
Sout
h Kor
eaJa
pan
United
Stat
esCh
ina
Luxe
mbour
gMalt
a
Denmar
k
Swed
en
Finlan
d
Austr
ia
Nethe
rland
s
Slove
nia
German
y
Polan
d
Belgi
umItaly
Esto
nia
United
King
domFr
ance
Latv
ia
Czec
h Rep
ublicSp
ain
Bulga
ria
Portu
gal
Cypr
us
Irelan
d
Lithu
ania
Slova
kia
Hunga
ry
Croa
tia
Greec
e
Roman
ia
Switz
erlan
dIsr
ael
Norway
Icelan
d
Turke
y
194
0
20
40
60
80
100
120
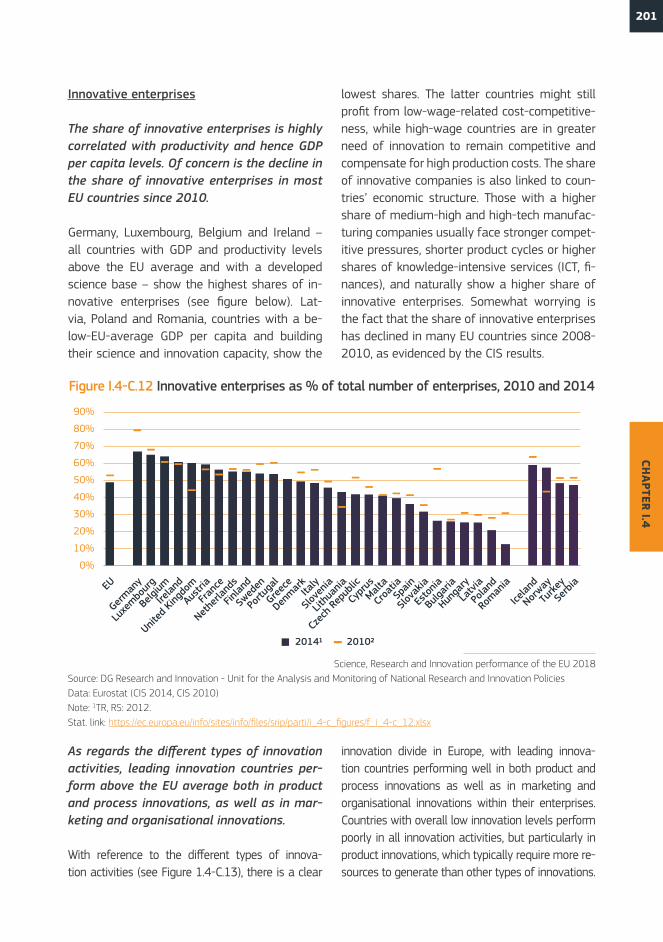
201CH
APTER I.4
Innovative enterprises
The share of innovative enterprises is highly correlated with productivity and hence GDP per capita levels. Of concern is the decline in the share of innovative enterprises in most EU countries since 2010.
Germany, Luxembourg, Belgium and Ireland – all countries with GDP and productivity levels above the EU average and with a developed science base – show the highest shares of in-novative enterprises (see figure below). Lat-via, Poland and Romania, countries with a be-low-EU-average GDP per capita and building their science and innovation capacity, show the
lowest shares. The latter countries might still profit from low-wage-related cost-competitive-ness, while high-wage countries are in greater need of innovation to remain competitive and compensate for high production costs. The share of innovative companies is also linked to coun-tries’ economic structure. Those with a higher share of medium-high and high-tech manufac-turing companies usually face stronger compet-itive pressures, shorter product cycles or higher shares of knowledge-intensive services (ICT, fi-nances), and naturally show a higher share of innovative enterprises. Somewhat worrying is the fact that the share of innovative enterprises has declined in many EU countries since 2008-2010, as evidenced by the CIS results.
Figure I.4-C.12 Innovative enterprises as % of total number of enterprises, 2010 and 2014
Science, Research and Innovation performance of the EU 2018Source: DG Research and Innovation - Unit for the Analysis and Monitoring of National Research and Innovation PoliciesData: Eurostat (CIS 2014, CIS 2010)Note: 1TR, RS: 2012.Stat. link: https://ec.europa.eu/info/sites/info/files/srip/parti/i_4-c_figures/f_i_4-c_12.xlsx
20141 20102
0%
10%
20%
30%
40%
50%
60%
70%
80%
90%
EU
German
y
Luxe
mbour
g
Belgi
um
Irelan
d
United
King
dom
Austr
ia
Fran
ce
Nethe
rland
s
Finlan
d
Swed
en
Portu
gal
Greec
e
Denmar
kIta
ly
Slove
nia
Lithu
ania
Czec
h Rep
ublic
Cypr
usMalt
a
Croa
tiaSp
ain
Slova
kia
Esto
nia
Bulga
ria
Hunga
ry
Latv
ia
Polan
d
Roman
ia
Icelan
d
Norway
Turke
y
Serb
ia
As regards the different types of innovation activities, leading innovation countries per-form above the EU average both in product and process innovations, as well as in mar-keting and organisational innovations.
With reference to the different types of innova-tion activities (see Figure 1.4-C.13), there is a clear
innovation divide in Europe, with leading innova-tion countries performing well in both product and process innovations as well as in marketing and organisational innovations within their enterprises. Countries with overall low innovation levels perform poorly in all innovation activities, but particularly in product innovations, which typically require more re-sources to generate than other types of innovations.
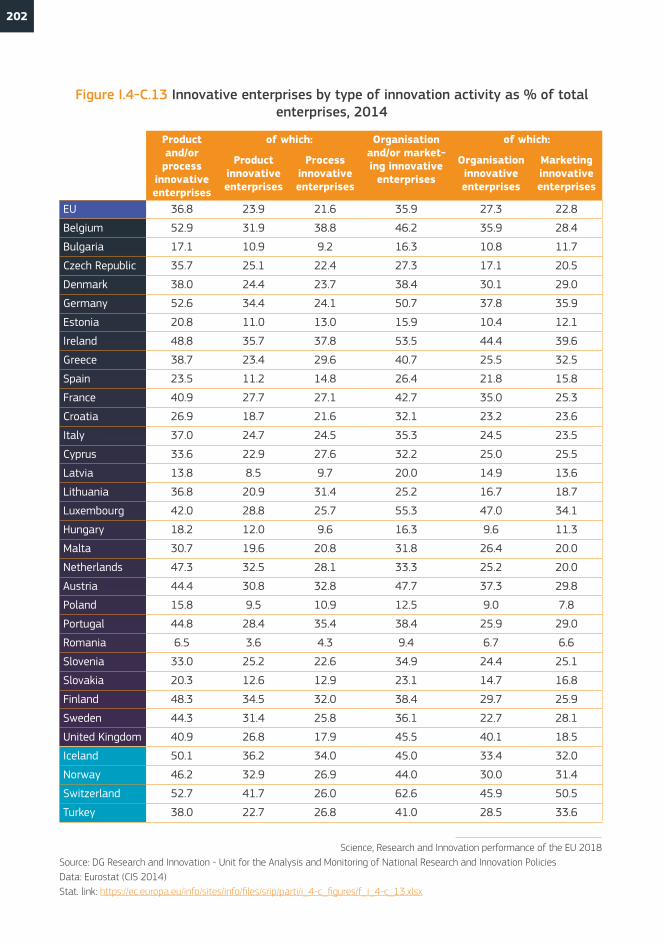
202
Product and/or process
innovative enterprises
of which: Organisation and/or market-ing innovative
enterprises
of which:
Product innovative enterprises
Process innovative enterprises
Organisation innovative enterprises
Marketing innovative enterprises
EU 36.8 23.9 21.6 35.9 27.3 22.8
Belgium 52.9 31.9 38.8 46.2 35.9 28.4
Bulgaria 17.1 10.9 9.2 16.3 10.8 11.7
Czech Republic 35.7 25.1 22.4 27.3 17.1 20.5
Denmark 38.0 24.4 23.7 38.4 30.1 29.0
Germany 52.6 34.4 24.1 50.7 37.8 35.9
Estonia 20.8 11.0 13.0 15.9 10.4 12.1
Ireland 48.8 35.7 37.8 53.5 44.4 39.6
Greece 38.7 23.4 29.6 40.7 25.5 32.5
Spain 23.5 11.2 14.8 26.4 21.8 15.8
France 40.9 27.7 27.1 42.7 35.0 25.3
Croatia 26.9 18.7 21.6 32.1 23.2 23.6
Italy 37.0 24.7 24.5 35.3 24.5 23.5
Cyprus 33.6 22.9 27.6 32.2 25.0 25.5
Latvia 13.8 8.5 9.7 20.0 14.9 13.6
Lithuania 36.8 20.9 31.4 25.2 16.7 18.7
Luxembourg 42.0 28.8 25.7 55.3 47.0 34.1
Hungary 18.2 12.0 9.6 16.3 9.6 11.3
Malta 30.7 19.6 20.8 31.8 26.4 20.0
Netherlands 47.3 32.5 28.1 33.3 25.2 20.0
Austria 44.4 30.8 32.8 47.7 37.3 29.8
Poland 15.8 9.5 10.9 12.5 9.0 7.8
Portugal 44.8 28.4 35.4 38.4 25.9 29.0
Romania 6.5 3.6 4.3 9.4 6.7 6.6
Slovenia 33.0 25.2 22.6 34.9 24.4 25.1
Slovakia 20.3 12.6 12.9 23.1 14.7 16.8
Finland 48.3 34.5 32.0 38.4 29.7 25.9
Sweden 44.3 31.4 25.8 36.1 22.7 28.1
United Kingdom 40.9 26.8 17.9 45.5 40.1 18.5
Iceland 50.1 36.2 34.0 45.0 33.4 32.0
Norway 46.2 32.9 26.9 44.0 30.0 31.4
Switzerland 52.7 41.7 26.0 62.6 45.9 50.5
Turkey 38.0 22.7 26.8 41.0 28.5 33.6
Science, Research and Innovation performance of the EU 2018Source: DG Research and Innovation - Unit for the Analysis and Monitoring of National Research and Innovation PoliciesData: Eurostat (CIS 2014)Stat. link: https://ec.europa.eu/info/sites/info/files/srip/parti/i_4-c_figures/f_i_4-c_13.xlsx
Figure I.4-C.13 Innovative enterprises by type of innovation activity as % of total enterprises, 2014
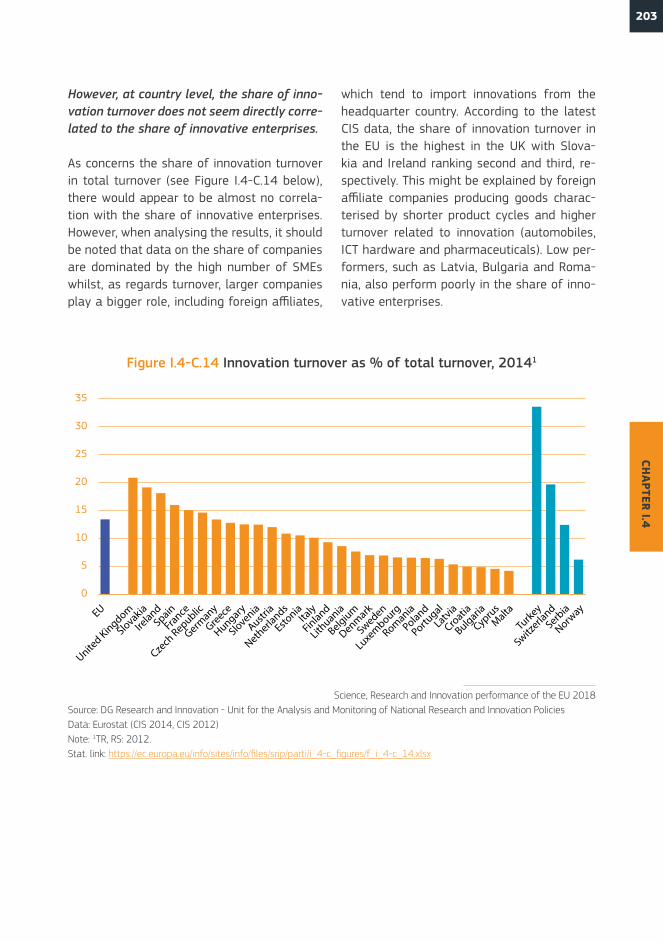
203CH
APTER I.4
However, at country level, the share of inno-vation turnover does not seem directly corre-lated to the share of innovative enterprises.
As concerns the share of innovation turnover in total turnover (see Figure I.4-C.14 below), there would appear to be almost no correla-tion with the share of innovative enterprises. However, when analysing the results, it should be noted that data on the share of companies are dominated by the high number of SMEs whilst, as regards turnover, larger companies play a bigger role, including foreign affiliates,
which tend to import innovations from the headquarter country. According to the latest CIS data, the share of innovation turnover in the EU is the highest in the UK with Slova-kia and Ireland ranking second and third, re-spectively. This might be explained by foreign affiliate companies producing goods charac-terised by shorter product cycles and higher turnover related to innovation (automobiles, ICT hardware and pharmaceuticals). Low per-formers, such as Latvia, Bulgaria and Roma-nia, also perform poorly in the share of inno-vative enterprises.
Figure I.4-C.14 Innovation turnover as % of total turnover, 20141
Science, Research and Innovation performance of the EU 2018Source: DG Research and Innovation - Unit for the Analysis and Monitoring of National Research and Innovation PoliciesData: Eurostat (CIS 2014, CIS 2012)Note: 1TR, RS: 2012.Stat. link: https://ec.europa.eu/info/sites/info/files/srip/parti/i_4-c_figures/f_i_4-c_14.xlsx
0
5
10
15
20
25
30
35
EU
United Kingdom
Slovakia
Ireland
Spain
France
Czech
Republic
Germany
Greece
Hungary
Slovenia
Austria
Netherla
nds
Estonia
Italy
Finland
Lithuania
Belgium
Denmark
Sweden
Luxembourg
Romania
Poland
Portugal
Latvia
Croatia
Bulgaria
CyprusMalta
Turkey
Switzerla
ndSerb
ia
Norway
204
References
Doria Arrieta, O., Pammolli, F. and Petersen, A. (2017). Quantifying the negative impact of brain drain on the integration of Europe-an science. Science Advances. 3.10.1126/sci-adv.1602232.
European Commission (2012a). Commission Recommendation of 17.7.2012 on access to and preservation of scientific information. C(2012) 4890 final.
European Commission (2012b). Towards bet-ter access to scientific information: Boosting the benefits of public investments in research. COM(2012) 401 final.
European Commission (2016a). Open Innova-tion, Open Science, Open to the World - a Vision for Europe. DG Research and Innovation.
European Commission (2016b). European Cloud Initiative: Building a competitive data and knowledge economy in Europe.
European Commission (2016c). European Re-search Area Progress Reports: Technical Report. DG Research and Innovation.
European Commission (2017). European In-novation Scoreboard 2017. DG Research and Innovation.
OECD (2015). The Future of Productivity, OECD Publishing, Paris.
Vertesy, D. (2017) The Innovation Output Indi-cator 2017: Methodology Report. JRC Technical Reports, JRC 108942, Luxembourg Publica-tions Office of the European Union.
Veugelers, R. The European Union’s growing innovation divide. Bruegel, Bruegel policy con-tribution.

205CH
APTER I.4