scientific committee tenth regular session [skj assessment... · 5.1 developments from the 2011...
TRANSCRIPT

SCIENTIFICCOMMITTEETENTHREGULARSESSION
Majuro,RepublicoftheMarshallIslands
6‐14August2014
STOCKASSESSMENTOFSKIPJACKTUNAINTHEWESTERNANDCENTRALPACIFICOCEAN
WCPFC‐SC10‐2014/SA‐WP‐05
Rev125July
JoelRice,SheltonHarley,NickDaviesandJohnHampton
OceanicFisheriesProgramme
SecretariatofthePacificCommunity,Noumea,NewCaledonia
i
TABLEOFCONTENTSExecutivesummary.............................................................................................................................................1
1 Introduction...................................................................................................................................................3
2 Background.....................................................................................................................................................3
2.1 Stockstructure....................................................................................................................................3
2.2 Lifehistorycharacteristics............................................................................................................3
2.2.1 Growth,NaturalMortality,LongevityandAgeatMaturity......................................3
2.3 Fisheries.................................................................................................................................................4
3 Datacompilation..........................................................................................................................................5
3.1 Spatialstratification..........................................................................................................................5
3.2 Temporalstratification...................................................................................................................5
3.3 Definitionoffisheries.......................................................................................................................5
3.4 Catchandeffortdata........................................................................................................................6
3.4.1 PurseSeine......................................................................................................................................6
3.4.2 Longline............................................................................................................................................7
3.4.3 Pole‐and‐line...................................................................................................................................7
3.4.4 OtherFisheries..............................................................................................................................7
3.5 SizeData.................................................................................................................................................7
3.5.1 Purseseine.......................................................................................................................................8
3.5.2 Longline............................................................................................................................................8
3.5.3 Pole‐and‐line...................................................................................................................................8
3.5.4 Otherfisheries................................................................................................................................8
3.6 Taggingdata.........................................................................................................................................9
4 Modeldescription–structuralassumptions,parameterisation,andpriors...................9
4.1 Populationdynamics........................................................................................................................9
4.1.1 Recruitment..................................................................................................................................10
4.1.2 Initialpopulation........................................................................................................................10
4.1.3 Ageandgrowth...........................................................................................................................10
4.1.4 Movement......................................................................................................................................11
4.1.5 Naturalmortality........................................................................................................................11
4.1.6 Sexualmaturity...........................................................................................................................11
4.2 Fisherydynamics.............................................................................................................................11
4.2.1 Selectivity.......................................................................................................................................11
4.2.2 Catchability....................................................................................................................................12
4.2.3 Effortdeviations..........................................................................................................................12
4.3 Dynamicsoftaggedfish................................................................................................................12
4.3.1 Initialtagmixing.........................................................................................................................12
4.3.2 Tagreporting................................................................................................................................13
ii
4.4 Likelihoodcomponents.................................................................................................................13
4.5 Parameterestimationanduncertainty..................................................................................14
4.6 Stockassessmentinterpretationmethods...........................................................................15
4.6.1 Referencepoints.........................................................................................................................15
4.6.2 Fisheryimpact.............................................................................................................................15
4.6.3 Yieldanalysis................................................................................................................................15
5 ModelRuns...................................................................................................................................................16
5.1 Developmentsfromthe2011assessment...........................................................................16
5.2 Sensitivityanalyses.........................................................................................................................16
5.3 StructuralUncertainty...................................................................................................................16
6 RESULTS.........................................................................................................................................................17
6.1 ModelDiagnostics(referencecase)........................................................................................17
6.2 ModelParameterestimates(referencecase).....................................................................18
6.2.1 TagReportingRates..................................................................................................................18
6.2.2 Selectivity.......................................................................................................................................18
6.2.3 Catchabilty.....................................................................................................................................19
6.2.4 Movement......................................................................................................................................19
6.3 Stockassessmentresults..............................................................................................................19
6.3.1 Recruitment..................................................................................................................................19
6.3.2 Biomass...........................................................................................................................................19
6.3.3 Fishingmortality........................................................................................................................19
6.3.4 Fisheryimpact.............................................................................................................................20
6.3.5 Yieldanalysis................................................................................................................................20
6.4 Stockstatus.........................................................................................................................................20
6.4.1 StockstatusbasedonthetraditionalKobeplot..........................................................20
6.4.2 Spawningbiomassinrelationtolimitreferencepoint............................................20
6.4.3 Spawningbiomassinrelationtopotentialtargetreferencepoints...................21
6.5 Sensitivityofthereferencecase...............................................................................................21
6.5.1 Impactofkeymodeldevelopments...................................................................................21
6.5.2 One‐offchangestothereferencecase..............................................................................21
6.5.3 Growth(G).....................................................................................................................................22
6.5.4 Weighttothesizedata(SZ_dw)..........................................................................................22
6.5.5 Steepness(h)................................................................................................................................22
6.5.6 Tagmixing.....................................................................................................................................23
6.5.7 Structuraluncertaintyanalysis............................................................................................23
6.5.8 Othermodelruns........................................................................................................................23
7 Discussionandconclusions...................................................................................................................23
7.1 Changesfromthe2011assessment........................................................................................23
7.2 Sourcesofuncertainty...................................................................................................................24
iii
7.3 Recommendationsforfurtherwork.......................................................................................25
7.4 MainConclusions.............................................................................................................................26
8 Acknowledgements...................................................................................................................................27
9 References.....................................................................................................................................................28
10 Annex..........................................................................................................................................................85
10.1 Likelihoodprofile........................................................................................................................85
10.2 Retrospectiveanalyses.............................................................................................................86
10.2.1 Removalofrecentyearsfrom2014updateddata...................................................86
10.2.2 Retrospectiveexaminationofpreviousassessments.............................................87
10.3 Stepwisemodeldevelopments.............................................................................................90
10.4 doitall.skj.........................................................................................................................................92
10.5 Initialization(ini)file.............................................................................................................102

1
EXECUTIVESUMMARYThis paper presents the 2014 assessment of skipjack tuna in thewestern and central
PacificOcean.Thisassessment is supportedbyseveralotheranalyseswhicharedocumentedseparately,butshouldbeconsideredaspartof thisassessmentas theyunderpinmanyof thefundamental inputs to the models. The updated assessment addresses many of therecommendationsprovidedinthereportofthe“IndependentReviewofthe2011bigeyetunastockassessment”(Ianellietal.,2012)thatpertaintoskipjack.Otherkeypapersdocument:themethods used in producing the purse seine size data (Abascal et al. 2014), and tagging data(Bergeretal.2014); revisions tothe fisheriesandspatialdefinitions(McKechnieetal.2014);andtheguidanceofthePre‐AssessmentWorkshop(PAW)heldinApril,2014(SPC2014).
Someofthemainimprovementsinthe2014assessmentare:
Increases in the number of spatial regions to better model the tagging and size data;
Improved modelling of recruitment to ensure that uncertain estimates do not influence key stock status outcomes; and
A large amount of new tagging data corrected for differential post‐release mortality and other tag loss.
Thelargenumberofchangessincethe2011assessment(someofwhicharedescribedabove),andthenatureofsomeofthesechanges,meansthatfullconsiderationoftheimpactsofindividualchanges isnotpossible.Nevertheless, thereportdetailssomeofthesteps fromthe2011referencecasetothe2014referencecase(Run012_L0W0T0M0).Distinguishingfeaturesofthe2014referencecasemodelinclude:
The steepness parameter of the stock recruitment relationship is fixed at 0.8.
Growth fixed according to 2010 estimates used in the last two assessments.
The likelihood function weighting of the size data is determined using an effective sample size for each fishing observation of one‐twentieth of the actual sample size, with a maximum effective sample size of 50.
For modelling the tagging data, a mixing period of 1 quarter (including the quarter of release) is applied.
The last four quarterly recruitments aggregated over regions are assumed to lie on the stock‐recruitment curve.
The rationale for these choices, which comprise the key areas of uncertainty for theassessment, is described in detail in the report.We report the results of “one‐off” sensitivitymodels to explore the impact of these choices for the reference case model on the stockassessmentresults.Asub‐setofkey,plausiblemodelrunswastakenfromthesesensitivitiestoincludeinastructuraluncertaintyanalysis(grid)forconsiderationindevelopingmanagementadvice.
Themainconclusionsofthecurrentassessmentareconsistentwithrecentassessmentspresentedin2010and2011.Themainconclusionsareasfollows:
1. A fluctuating but consistently high level of recruitment since the early 1970s hassupportedarobustfisheryinallregions.Theanalysissuggeststhattheregionaldeclinesin spawning potential, in all regions except region 1, are being driven primarily by thefishingimpacts.
2. Although the ratio of exploited to unexploited spawning potential is estimated to havedeclined,withsomefluctuations,throughoutthemodelperiod,theaveragetotalbiomassof the last fiveyears isestimated tobeabove theaverage totalbiomassof the first fiveyearsofthemodel.
3. Latestcatchesslightlyexceedthemaximumsustainableyield(MSY).

2
4. Fishing mortality for adult and juvenile skipjack tuna is estimated to have increasedcontinuously since the beginning of industrial tuna fishing, but fishing mortality stillremainsbelowthelevelthatwouldresultintheMSY.
5. RecentlevelsofspawningpotentialarewellabovethelevelthatwillsupporttheMSY.
6. The estimated 2011 level of spawning potential represents approximately 52% of theunfishedlevel,andiswellabovethelimitreferencepointof20%SBF=0agreedbyWCPFC.
7. Recentlevelsofspawningpotentialareinthemiddleoftherangeofcandidatebiomass‐related target reference points currently under consideration for skipjack tuna, i.e., 40‐60%SBF=0.
8. Stock status conclusions were most sensitive to alternative assumptions regardingsteepnessandgrowth.Howeverthemainconclusionsoftheassessmentarerobusttotherangeofuncertaintythatwasexplored.
Thereportalsoincludesrecommendationsforfuturestockassessmentsofbigeyetuna,includingresearchactivitiestoimprovemodelinputs.

3
1 INTRODUCTIONThispaperpresentsthe2014stockassessmentofskipjacktuna(Katsuwonuspelamis)in
thewesternandcentralPacificOcean(WCPO,westof150W).Since2000,theassessmenthasbeen conducted regularly and the most recent assessments are documented in Bigelow etal.(2000); Hampton and Fournier 2001a; Hampton 2002; Langley et al. 2003; Langley et al.(2005); Langley and Hampton (2008); Hoyle et al. (2010), and Hoyle et al. (2011). Theindependent review of the 2011 bigeye tuna assessment (Ianelli et al., 2012) had severalrecommendations for improvement that apply equally to the skipjack assessment, and thesehavebeenincorporatedintothecurrentassessmentwhereverpossible.
This assessment is supported by several other analyses which are documentedseparately, but should be considered in reviewing this assessment. These include: improvedpurse seine catch estimates (Lawson 2013; Lawson & Sharples 2011), reviews of the catchstatisticsofthecomponentfisheries(Williams2014;Williams&Terawasi2014),standardisedCPUEanalysesof Japanesepole‐and‐lineoperational level catchandeffortdata (Kyofuji et al.2014), size data inputs from the purse seine fishery (Abascal et al., 2014), revised regionalstructures and fisheries definitions (McKechnie et al., 2014), and preparation of tagging dataand reporting rate information (Berger et al., 2014). Finally, many of these issues werediscussedindetailatPre‐AssessmentWorkshopheldinNoumeainApril,2014(OFP2014).
2 BACKGROUND
2.1 Stockstructure
Surface‐schooling, adult skipjack tuna (greater than 40 cm fork length, FL) arecommonlyfoundintropicalandsubtropicalwatersofthePacificOcean(Figure1).Skipjackinthe western and central Pacific Ocean (WCPO) are considered a single stock for assessmentpurposes(WildandHampton1994).InthewesternPacific,warm,poleward‐flowingcurrentsnear northern Japan and southernAustralia seasonally extend their distribution to 40°N and40°S. These limits roughly correspond to the 20°C surface isotherm. A substantial amount ofinformation on skipjack movement is available from tagging programmes, which havedocumented some large‐scale movement within the Pacific (Figure 2). In general, skipjackmovement ishighlyvariable(Sibertetal.1999)but isthoughttobe influencedby large‐scaleoceanographicvariability(Lehodeyetal.1997).
2.2 Lifehistorycharacteristics
2.2.1 Growth,NaturalMortality,LongevityandAgeatMaturitySkipjack growth is rapid compared to yellowfin and bigeye tuna. In the Pacific,
approximateageestimatesfromcountingdailyringsonotolithssuggestthatgrowthmayvarybetweenareas.At150,200,300and400days,forklengths(FLs)of30,33,40,and46cmwereestimated for fish sampled mostly in the north Pacific (Tanabe et al. 2003), but growthestimateswerefaster(42,47,55,and60cm)forfishsampledclosetotheequator(Leroy2000).Growth has been found to vary spatially in the eastern Pacific (Maunder 2001) and in theAtlantic(Gaertneretal.2008),basedonanalysesoftaggingdata.
Estimates of natural mortality rate have been obtained using a size‐structured tagattritionmodel(Hampton2000),whichindicatedthatnaturalmortalitywassubstantiallylargerfor small skipjack (21–30 cm FL, M=0.8 mo‐1) compared to larger skipjack (51–70 cm FL,M=0.12–0.15mo‐1).The longestperiodat liberty fora taggedskipjackwas4.5years.Skipjacktunareachsexualmaturityatabout40cmFL.
4
2.3 Fisheries
Skipjack tuna, the largest component of tuna fisheries throughout the WCPO, areharvestedwithawidevarietyofgeartypes.FisheriescanbeclassifiedintotheJapanpole‐and‐line fleets (both distant‐water and offshore), domestic pole‐and‐line fleets based in islandcountries,artisanalfleetsbasedinthePhilippines,easternIndonesiaandthePacificIslands,anddistant‐waterandPacific‐Island‐basedpurseseinefleets.
TheJapanesepole‐and‐linefleetsoperateoveralargeregionintheWCPO.Adomesticpole‐and‐linefisheryoccurredinPNGfrom1970to1985andactivefisherieshaveoccurredinFijiandtheSolomonIslandssince1974(nowdiscontinued)and1971(operatingatalowlevel),respectively.
Avarietyofgear types(e.g.gillnet,hookand line, longline,purseseine, ringnet,pole‐and‐lineandunclassified) capture skipjack in thePhilippinesand Indonesia. Smallbut locallyimportantartisanal fisheriesforskipjackandothertuna(usingmainlytrollingandtraditionalmethods)alsooccurinmanyofthePacificIslands.
Purse seine fleets usually operate in equatorialwaters from10N to 10S; although aJapan offshore purse seine fleet operates in the temperate North Pacific. The distant‐waterfleetsfromJapan,Korea,ChineseTaipeiandtheUSAcapturemostoftheskipjackintheWCPO,although catches by fleets flagged to or chartered by Pacific Island countries have increasedconsiderablyinrecentyears.Thepurseseinefisheryisusuallyclassifiedbysettypecategories setson floatingobjects suchas logsand fish aggregationdevices (FADs),whichare termed“associated sets” and sets on free‐swimming schools, termed “unassociated sets”. Thesedifferent set typeshave somewhatdifferent spatialdistributions, catchperuniteffort (CPUE)andcatchdifferentsizesofskipjackandothertuna.
Skipjack tuna catches in theWCPO increased steadily after 1970,more than doublingduringthe1980s.Thecatchwasrelativelystableduringtheearly1990s,approaching1,000,000mtperannum.Catches increasedagain fromthe late1990sandhavevariedbetween1.5and1.8 million mt1 since 2007. Pole‐and‐line fleets, primarily Japanese, initially dominated thefishery,withthecatchpeakingat380,000mtin1984,buttherelativeimportanceofthisfisheryhasdeclinedsteadilyforeconomicreasons.Annualskipjacktunacatchesincreasedduringthe1980sduetogrowthintheinternationalpurse‐seinefleet,combinedwithincreasedcatchesbydomesticfleetsfromthePhilippinesandIndonesia(whichhavemadeupto20–25%ofthetotalskipjacktunacatchinWCPOinrecentyears).
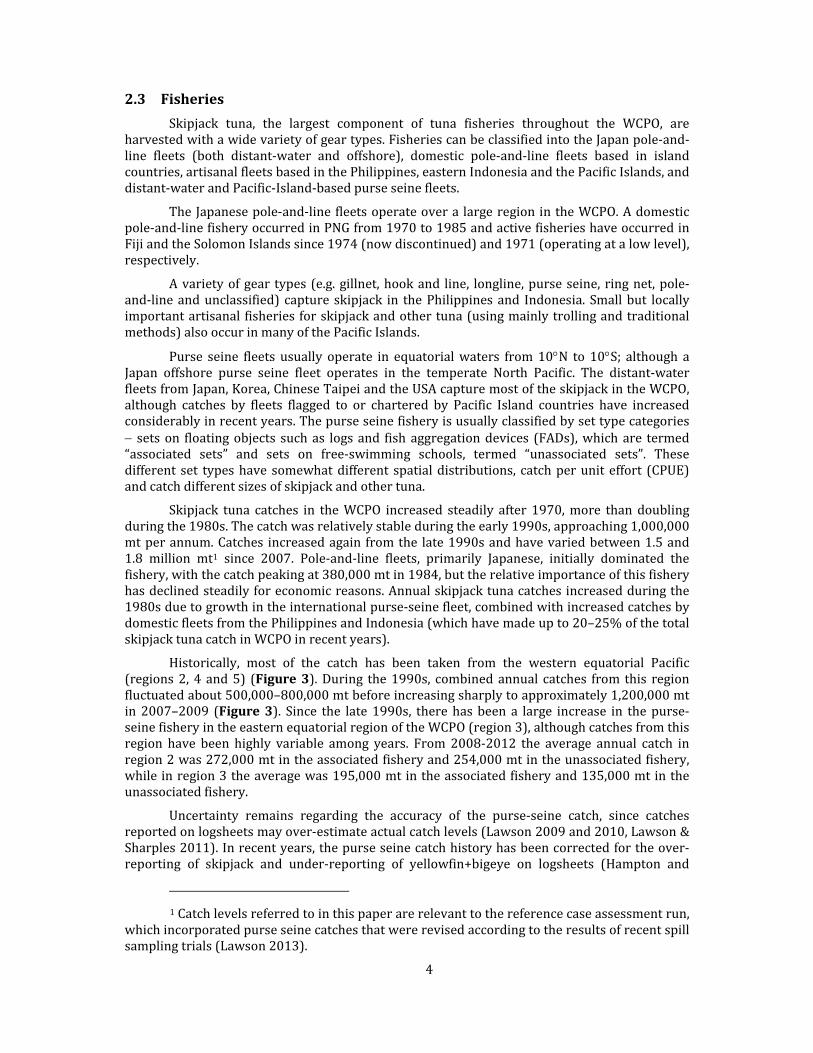
Historically, most of the catch has been taken from the western equatorial Pacific(regions2, 4 and5) (Figure3).During the1990s, combinedannual catches from this regionfluctuatedabout500,000–800,000mtbeforeincreasingsharplytoapproximately1,200,000mtin2007–2009 (Figure3). Since the late 1990s, therehasbeen a large increase in thepurse‐seinefisheryintheeasternequatorialregionoftheWCPO(region3),althoughcatchesfromthisregion have been highly variable among years. From2008‐2012 the average annual catch inregion2was272,000mtintheassociatedfisheryand254,000mtintheunassociatedfishery,whileinregion3theaveragewas195,000mtintheassociatedfisheryand135,000mtintheunassociatedfishery.
Uncertainty remains regarding the accuracy of the purse‐seine catch, since catchesreportedonlogsheetsmayover‐estimateactualcatchlevels(Lawson2009and2010,Lawson&Sharples2011).Inrecentyears,thepurseseinecatchhistoryhasbeencorrectedfortheover‐reporting of skipjack and under‐reporting of yellowfin+bigeye on logsheets (Hampton and
1Catchlevelsreferredtointhispaperarerelevanttothereferencecaseassessmentrun,whichincorporatedpurseseinecatchesthatwererevisedaccordingtotheresultsofrecentspillsamplingtrials(Lawson2013).
5
Williams2011)and for theselectionbias ingrabsamples(spill‐samplecorrectedpurseseineestimates) taken by observers. These corrected catches represent the primary catch dataincorporatedinthestockassessmentandarethebasisofquotedcatchestimatesinthispaperunlessotherwisenoted.
3 DATACOMPILATIONDatausedintheMULTIFAN‐CLskipjackassessmentconsistofcatch,effortandlength‐
frequencydataforthefisheriesdefinedintheanalysis,andtag‐recapturedata.Therehavebeensignificant improvement to these data inputs since the 2011 assessment based onimplementationofskipjack‐relevantrecommendationsfromtheindependentreview(Ianellietal., 2012) and the 2014 PAW (SPC‐OFP, 2014). These analyses are the subject of detailedworking and information papers. We will not repeat the full details of these analyses here,ratherwewillprovideabriefoverviewofthekeyfeaturesanddirectinterestedreaderstotherelevantpaperswhicharereferencedthroughoutthissection.
3.1 Spatialstratification
The geographical area considered in the assessment corresponds to thewestern andcentral Pacific Ocean from 50°N to 20°S and from oceanic waters adjacent to the east Asiancoast(110°Ebetween20°Nand20°S;120°Enorthof20°N) to150°W.Theassessmentmodelareacomprisesfiveregions(Figure1),withasingleregionnorthof20°N(Region1),andfourequatorialregionsbetween20°Sto20°N.Thewesternequatorialregionisfrom110°Eto140°E(Region 4), and eastern equatorial from170°E to 150°W (Region 3). Region 2 comprises theareabetween140°Eand170°Wwith theexceptionof thearea southof theequatorbetween140°E and 155°E along with the area south of 5°S between 155°E and 160°E. The southernregionsaresimilartothebigeyeandyellowfintunaregionalstructure,thedifferencebeingtheinclusion of 10°S to 20°S in the skipjack regions. The assessment area covers practically theentire skipjack fishery in theWCPO, with the exception of relatively minor catches south of20S.The easternboundary for the assessment regionswas150°Wand as such excludes theWCPFCConventionareacomponentthatoverlapswiththeIATTCarea.
3.2 Temporalstratification
Thetimeperiodcoveredbytheassessmentis19722012.Withinthisperiod,datawerecompiledintoquarters(JanMar,AprJun,JulSep,OctDec).AsagreedatSC9,theassessmentdid not include data from themost recent calendar year. This is because these data are onlyfinalizedverylateandoftensubjecttosignificantrevisionpost‐SC.Thisyearthe2013datawasnotfinalizeduntiltheendofthefirstweekofJuly–fartoolatetobeincludedinassessmentsdue only two weeks later. In the discussion section we consider potential mechanisms toaddressthismatter.
3.3 Definitionoffisheries
MULTIFAN‐CL requires the definition of “fisheries” that consist of relativelyhomogeneous fishingunits. Ideally, the defined fisherieswill have selectivity and catchabilitycharacteristicsthatdonotvarygreatlyovertimeandspace,althoughinthecaseofcatchabilitysomeallowancecanbemadefortime‐seriesvariation.Formostpelagicfisheriesassessments,fisheriesaredefinedaccordingtogeartype,fishingmethodandregion.
Equatorial purse seine fishing activity was aggregated over all nationalities, butstratified by region and set type, in order to sufficiently capture the variability in fishingoperations.Settypesweregroupedintoassociated(log,FAD,whale,dolphin,andunknownsettypes)andunassociated(school)sets.Furtherfisheriesweredefinedforpole‐and‐linefisheriesin each region and miscellaneous fisheries (gillnets, ringnets, handlines etc.) in the western
6
equatorialarea.AresearchlonglinefisherywasdefinedtoholdthelongtimeseriesofskipjacksizefrequencydatafromJapaneseresearchlonglinecruisesintheWCPO.
Multiple changesweremade to the fisherydefinitions from the2011assessment,duelargelytotherevisedregionalstructure.TheJapaneseoffshoreanddistant‐waterpole‐and‐linefisheries in region1were pooledbecause although these fisheries have different operationalcharacteristicsandmainlyoccupydifferentareas(withinregion1),theyaredatadeficientandassuchsharekeyparameterizationssuchasselectivityandreportingrate.Thedisparatepole‐and‐line fisheries in regions 2 and 3 were likewise combined into individual region‐specificpole‐and‐line fisheries. New fisheries for regions 4 and 5 were defined from fisheriespreviouslyinregion2ofthe2011assessment(seeTable1.A).NewdatafromVietnamhasledto theadditionofadomesticVietnamese fleet in thenewregion4.Overall,23 fisheriesweredefinedintheanalysis(Table1)comparedtothe18fisheriesdefinedinthe2011assessment.AgraphicalsummaryoftheavailabilityofdataforeachfisheryisprovidedinFigure4.
3.4 Catchandeffortdata
Catch and effort data were compiled by year and quarter according to the fisheriesdefinedabove.Thecatchesofall fisheries,with theexceptionof theresearch longline fishery,wereexpressed inweightof fish.Research longlinecatches,whichareverysmallandsetatanominallevel,wereexpressedinnumbersoffish.
TotalannualcatchesbymajorgearcategoriesfortheWCPOareshowninFigure5andaregionalbreakdownisprovidedinFigure6.ThespatialdistributionofcatchesoverthepasttenyearsinprovidedinFigure3.
Discardedcatchesareestimatedtobeminor(SPC‐OFP2014)andwerenotincludedintheanalysis.
Catches in the northern region are highly seasonal, as are the domestic pole‐and‐linefisheriesoperatingintheregions2and3.Anumberofsignificanttrendsinthefisherieshaveoccurredoverthemodelperiod,specifically:
ThedevelopmentoftheJapaneseoff‐shorepurse‐seinefisheryinregion1sincethemid‐1990s;
Thevirtualcessationofthedomesticpole‐and‐linefisheriesinPapuaNewGuineaandFijiandtherecentlowcatchesfromtheSolomonIslandsfishery;
ThegeneraldeclineintheJapanesedistant‐waterpole‐and‐linefisheriesintheequatorialregions,particularlyregion3;
The development of the equatorial purse‐seine fisheries from the mid‐1970s and thewidespreaduseofFADs since themid‐1990s, allowinganexpansionof thepurse‐seinefisheryinregion3;
Largechanges in thepurseseine fleetcompositionand increasingsizeandefficiencyofthefleet.
ThesteadyincreaseincatchforthedomesticfisheriesofIndonesiaandthePhilippines.
3.4.1 PurseSeinePreviousassessmentshaveconsideredtwosetsofpurse‐seineinputcatchdata,butthe
problems surrounding logbook report of skipjack catches and grab‐sample bias have beenclearlydemonstratedandonlyasinglesetofpurseseinecatchestimateshavebeenincludedinthecurrentassessment.Detailsoftheanalyses,includingtheindependentreviewandresponseareprovidedinLawson(2013),Cordue(2013).
7
Briefly, catchdataareestimatedby1° latitude, 1° longitude,month flag, and set‐type.Thoughtheexactalgorithmdependsontheyearanddataavailable,totalcatchesaretakenfromthe logsheet declared totals and then the grab samples are corrected for bias based on theestimatesofthecorrectionfactorsfromthepairedspillandgrabsamplingtrials.Forsomefleetsfor which there is greater confidence in species‐based reporting (e.g. Spanish and Japanesefleets),weusereportedcatchbyspeciesratherthanestimatingit.
As in previous assessments, effort data units for purse seine fisheries are defined asdays fishingand/orsearching, andareallocated toset typesbasedon theproportionof totalsetsattributedtoaspecifiedsettype(associatedorunassociatedsets)inlogbookdata.Recentlyithasbeendiscoveredthatsomefleetshavechangedtheirreportingpractices(OFP2013)suchthat far fewsearchingdaysarereportedandtheseare insteadreportedasnon‐fishingtransitdays.Thispracticeessentiallyrepresentseffortcreepandwehavenotyetspecificallycorrectedrecentdatatoensureconsistencyofreporting.Thereforetheimpactofthisisnotknown,butitwillbeminimizedbythepracticeofestimatingfrequenttime‐basedchangesincatchability.
Catch‐per‐unit‐effortforthePhilippinesdomesticpurseseinewasanalysedusingaGLMforCPUEindicesbyBigelowetal(2014)(Figure7).TheseindiceswereappliedtothecatchesoftheS‐ID.PH‐4fisheryfortheyears2005‐2012andlackedestimatesoftime‐variantprecision.
Catch‐per‐unit‐effort for the purse seine fishery operating largely within the PNGarchipelagicwaterswasanalysed for standardised indicesusing theGLM(Pillinget al. 2014)(Figure7). These indiceswere applied to the catchesof the S‐ASS‐All‐8 fishery for theyears1997‐2012andincludedestimatesoftime‐variantprecision.
3.4.2 LonglineResearch longline fisherieswere included to utilise the available size frequency data.
LonglinefisheriestypicallydonottargetskipjackhoweverJapaneseresearchvesselsroutinelycollectmeasurementsofthelengthofskipjackcaught.
3.4.3 Pole‐and‐lineStandardisedeffortseriesforfisheries1,4,and12werebasedonJapanesepole‐and‐line
fisheries in region 1, 2, and 3, respectively. These the standardized effort time series wereestimatedusinggeneralized linearmodels(GLM)analysesoftheoperationalcatchandeffortdata(Kiyofujietal2014).Separateanalysesweredoneforeachregion.Theuncertaintyineachpole‐and‐lineCPUEestimate,byfisheryandtime,wasincludedinthemodelbywayofascaledpenaltyweightfortheeffortdeviations.RegionalscalingfactorswerenotappliedtotheCPUEestimatesfromthedifferentregions.Pole‐and‐linecatchabilitieswereestimatedindependently,so that the relative regionalweightingswereestimatedby themodel.Nominal fishing‐vessel‐daywasusedastheunitofeffortforthedomesticpole‐and‐linefisheriesofPapuaNewGuinea,SolomonIslands,andFiji.
3.4.4 OtherFisheriesEffort data for the Philippines and Indonesian surface fisheries and research longline
fisherieswereunavailable.Where effort data areabsent, themodeldirectly computes fishingmortalityconsistentwiththeobservedcatchusingaNewton‐Raphsonprocedure..
3.5 SizeData
Availablelength‐frequencydataforeachofthedefinedfisherieswerecompiledinto542‐cm size classes (2–4 cm to 108–110 cm). Length‐frequency observations consisted of theactualnumberofskipjackmeasuredineachfishery/quarter.AgraphicalrepresentationoftheavailabilityoflengthsamplesisprovidedinFigure8.
8
3.5.1 PurseseineOnlylengthfrequencysamplesareusedintheassessmentsandthepreviousassessment
used only observer samples which had been corrected for grab sample bias. As observercoveragehadbeenverylowandunrepresentativeinearlyyears,thereweremanygapsandthetimeseriesofsizedatadidnotshowevidenceofmodelprogression.Twomajorchangesweremade for thecurrentassessmentandaredescribed indetail inAbascaletal. (2014): first thelong time series of port sampling data fromPagoPagowas included, and second all sampleswereweightedbythecatch–bothatthesetandstratalevel,withthresholdsappliedtoensurethatsmallsamplesfromimportantcatchstratadidnotgettoomuchweight(aswasdoneforthelongline fishery).Unfortunately fullPagoPagodataarenot available since2008as theyhavenotyetbeenfullyprocessed(V.Chanpers.comm.).
3.5.2 Longline
Longline fisheries principally catch small amounts of large skipjack,within the 5090length range, and the catch isusuallydiscarded.Weutilise a long time seriesof longline sizedataobtained from Japanese trainingand research longline vessels toprovide information tothemodelontheexistenceof these largersizedskipjackrarelycaught inpurseseineorpole‐and‐linefisheries.Thedataareimportant,becauseitallowsselectivityofsurfacefisheriestobemeasuredagainsttheselarger‐sizedskipjack.
3.5.3 Pole‐and‐lineSizecompositionforpoleandlinefisheriesarelargelyreliantonobserverdatawiththe
exception of region 1 and 2 where length data is available from the Japanese off shore anddistantwater fleet(sourcedfromNRIFSF)fromthebeginningofthemodelperioduntil2009.For theequatorial (excluding region2)‐and‐line fishery, lengthdatawereavailable from theJapanese distant‐water fleet and from the domestic fleets. The data from the pole and linefisheryinregion3(P‐ALL‐3)wasdominatedbyobservertheJapanesefleets(1974‐2004)withadditionaldatafromFijiinthe1990’s.Lengthdatafromthepoleandlinefisheryinregion4(P‐All‐4) consists of mostly Japanese data from the 1972‐2009, with significant data fromIndonesiaintheyears2009‐2012.Thedatafromthepoleandlinefisheryinregion5(P‐ALL‐5)isalargemultiplecountriesdominatedbytheUSintheyears1988‐1997andPNGintheyears1998‐2012.Thepole‐and‐linefisheriesinthenorthernregiongenerallycatchsmallerfishthantheequatorialfisheries(regions2‐5),(Figure13)althoughoverthemodelperiod,therewasageneralincreaseinthelengthoffishsampledfromthepole‐and‐linefisheriesinregions1and2,whilevariationinthesamplesizesisevident,nosystematictrendinthesizecompositionwasevidentinregions3,4,or5(Figure14).
3.5.4 OtherfisheriesSizecompositiondataforthePhilippinesdomesticfisheries(Z‐PH‐4)werecollectedby
asamplingprogrammeconductedinthePhilippinesin199394andaugmentedwithdatafromthe 1980s and from 1995. In addition, data collected during 19972006 under the NationalStockAssessmentProjectandinmorerecentyearsundertheGEF‐WPEAprojectwereincludedinthecurrentassessment.DespitethelargecatchtakenbytheIndonesiandomesticfishery(Z‐ID‐4),only limited lengthsamples fromtherecentsamplingunder theGEF‐WPEAprojectareavailable for the fisheryand theselectivity for this fisherywas linked toZ‐PH‐4.Nosizedatawere available for the Vietnamdomestic fishery (Z‐VN‐4) and selectivity for this fisherywasalso linkedtoZ‐PH‐4.FewusablesizedatawereavailableforthePH‐IDdomesticpurseseinefisheryinregion4(S‐ID.PH‐4),andthisfishery’sselectivitywaslinkedtotheassociatedpurseseinefisheryinregion2(S‐ASS‐ALL‐2).
9
3.6 Taggingdata
Alargeamountoftaggingdatawasavailableforincorporationintotheassessment.Thedata used consisted of the OFP’s Skipjack Survey and Assessment Project (SSAP) carried outduring 1977–80, the Regional Tuna Tagging Project (RTTP) during 1989–92 and in‐countryprojects in the Solomon Islands (1989–90), Kiribati (1991), Fiji (1992) and the Philippines(1992). Tagging data from regular Japanese research cruises were available for the period19882012.TaggingdatafromthePacificTunaTaggingProgramme(PTTP)wereavailablefortheperiod2006untilthe2ndquarterof2012.
Tagswere releasedusingstandard tuna taggingequipmentand techniquesby trainedscientists and technicians. Tags have been returned mostly from purse seine vessels viaprocessingandunloadingfacilitiesthroughouttheAsia‐Pacificregion.
In thecurrentassessment, thenumbersof tagreleases input to theassessmentmodelwere adjusted for a number of sources of tag loss – unusable recaptures due to lack ofadequatelyresolvedrecapturedata,estimatesoftagloss(sheddingandinitialmortality)duetovariable skill of taggers, and estimates of base levels of tag shedding/tag mortality. Theproceduresused in re‐scaling the releases aredescribed in detail inBerger et al. (2014), butessentiallythere‐scalingpreservestherecoveryratesoftagsfromtheindividualtaggroupsasifnoneofthetaglosshadoccurred.TheseprocesseswereabletobeappliedonlytotheRTTPandPTTPreleases.
For incorporation into the assessment, tag releaseswere stratified by release region,timeperiodofrelease(quarter)andthesamesizeclassesusedtostratifythelength‐frequencydata.Atotalof314,555effectivereleaseswereclassifiedinto251tagreleasegroups(Table2).Thereturnsfromeachsize‐classofeachtagreleasegroup(50,087effectivetagreturnsintotal)werethenclassifiedbyrecapturefisheryandrecapturetimeperiod(quarter).
Because tag returns by purse seiners were often not accompanied by informationconcerning the set type, tag returndatawereaggregated across set types for thepurse seinefisheries in each region. The population dynamics model was in turn configured to predictequivalentestimatedtagrecapturesbythesegroupedfisheries.
4 MODELDESCRIPTION–STRUCTURALASSUMPTIONS,PARAMETERISATION,ANDPRIORS
Themodelcanbeconsideredtoconsistofseveralcomponents,(i)thedynamicsofthefish population; (ii) the fishery dynamics; (iii) the dynamics of tagged fish; (iv) observationmodels for the data; (v) parameter estimation procedure; and (vi) stock assessmentinterpretations.Detailed technicaldescriptionsofcomponents(i) (iv)aregiven inHamptonand Fournier (2001b) and Kleiber et al. (2013). Brief descriptions of the various processes,includinginformationonstructuralassumptions,estimatedparameters,priorsandothertypesofpenaltiesusedtoconstraintheparameterisationwereprovidedinHoyleetal.(2011–Table2)andonlychangestotheseassumptionsarereportedhereTable3 .Inaddition,wedescribetheproceduresfollowedforestimatingtheparametersofthemodelandthewayinwhichstockassessmentconclusionsaredrawnusingaseriesofreferencepoints.
4.1 Populationdynamics
The model partitions the population into five spatial regions and 16 quarterly age‐classes.Thelastage‐classcomprisesa“plusgroup”inwhichmortalityandothercharacteristicsareassumedtobeconstant.Thepopulationis“monitored”inthemodelatquarterlytimesteps,extendingthroughatimewindowof19722012.Themainpopulationdynamicsprocessesareasfollows:
10
4.1.1 RecruitmentRecruitment isdefinedas theappearanceof age‐class1 fish (i.e. fishaveraging10cm
given the current growth curve) in thepopulation. Tropical tuna spawningdoesnot followaclearseasonalpatternbutoccurssporadicallywhenfoodsuppliesareplentiful(Itano2000).Itwasassumedthatrecruitmentoccursinstantaneouslyatthebeginningofeachquarter.Thisisadiscreteapproximationtocontinuousrecruitment,butprovidessufficient flexibilitytoallowarangeofvariabilitytobeincorporatedintotheestimatesasappropriate.
Theproportionoftotalrecruitmentoccurringineachregionwasinitiallysetrelativetothe variation in recruitment predictions fromLehodey (2001) and then estimated during thelaterphasesofthefittingprocedure.Thedistributionofrecruitmentamongthemodelregionswas estimatedwithin themodel and allowed to vary over time in a relatively unconstrainedfashion. The time‐series variation in spatially‐aggregated recruitment was somewhatconstrained by a lognormal prior. The variance of the prior was set such that spatiallyaggregatedrecruitmentsofaboutthreetimesandonethirdoftheaveragerecruitmentwouldoccuraboutonceevery25yearsonaverage
Spatially‐aggregated recruitment was assumed to have a weak relationship with thespawningbiomass via a Beverton andHolt stock‐recruitment relationship (SRR)with a fixedvalueofsteepness(h).Steepnessisdefinedastheratiooftheequilibriumrecruitmentproducedby20%oftheequilibriumunexploitedspawningbiomasstothatproducedbytheequilibriumunexploitedspawningbiomass(Francis1992;MaunderandWatters2003).
TheSRRwas incorporatedmainlysothatyieldanalysiscouldbeundertakenforstockassessmentpurposes,particularlythedeterminationofequilibriumbasedreferencepoints.WethereforeoptedtoapplyarelativelyweakpenaltyfordeviationfromtheSRRsothatitwouldhavenegligibleeffectontherecruitmentandothermodelestimates(seeHamptonandFournier2001,AppendixD).
Typically,fisheriesdataarenotveryinformativeaboutthesteepnessparameteroftheSRRparameters;hence,thesteepnessparameterwasfixedatamoderatevalue(0.80)andthesensitivity of themodel results to the value of steepnesswas explored via a range ofmodelsensitivities with lower (0.65) and higher (0.95) values of steepness. Model options thatestimated the value of steepness internally in themodelwere also explored. In this case, anuninformative(uniform)priorwasassumedonsteepnessoftheSRR.
4.1.2 InitialpopulationThepopulationagestructureintheinitialtimeperiodineachregionisdeterminedasa
function of the average total mortality during the first 20 quarters. This assumption avoidshavingtotreat the initialagestructure,whichisgenerallypoorlydetermined,as independentparameters in the model. The initial age structure was applied to the initial recruitmentestimatestoobtaintheinitialpopulationsineachregion.
4.1.3 AgeandgrowthThe standardassumptionsmade concerningage andgrowthare (i) the lengths‐at‐age
arenormallydistributedforeachage‐class;(ii)themeanlengths‐at‐agefollowavonBertalanffygrowthcurve;(iii)thestandarddeviationsoflengthforeachage‐classarealog‐linearfunctionof the mean lengths‐at‐age; and (iv) the probability distributions of weights‐at‐age are adeterministic function of the lengths‐at‐age and a specified weight‐length relationship (seetable).Theseprocessesareassumedtoberegionallyinvariant.Fortheresultspresentedhere,16quarterlyage‐classeshavebeenassumed.Growthwasnotestimatedinthemodel,exceptforonesensitivityanalysis(Figure9).
As noted above, the population is partitioned into quarterly age‐classes with anaggregateclassforthemaximumage(plus‐group).Theaggregateageclassmakespossiblethe
11
accumulation of old and large fish, which is likely in the early years of the fishery whenexploitationrateswerelow.
4.1.4 MovementMovement was assumed to be time invariant and to occur instantaneously at the
beginningofeachquarterbetweenregionssharingacommonboundary.Notehoweverthatfishcanmovebetweennon‐contiguousregionsinasingletimestepduetothe“implicittransition”computationalalgorithmemployed (seeHamptonandFournier2001c;Kleiberetal.2013 fordetails).Movementisparameterisedastheproportionoffishinagivenregionthatmovetotheadjacent region. Across each inter‐regional boundary in themodel, movement is possible inboth directions for the four quarters, each with their own movement coefficients. Thus thenumber of movement parameters is 2×no.regions×4quarters. The seasonal pattern ofmovementpersistsfromyeartoyearwithnoallowanceforlonger‐termvariationinmovement.Usuallythereare limiteddataavailabletoestimateage‐specificmovementandthemovementcoefficients are normally invariant with respect to age. A prior of 0.1 is assumed for allmovementcoefficients,inferringarelativelyhighmixingratebetweenregions.
4.1.5 NaturalmortalityNaturalmortalitywasestimatedandassumedtobeage‐specific,butinvariantovertime
andregion.Penaltiesonthefirstdifference,adjacentageclasses,anddeviationsfromthemeanwereappliedtorestricttheage‐specificvariabilitytoacertainextent.TheestimatedM‐at‐ageforthereferencecasemodelisshowninFigure10.
4.1.6 SexualmaturitySexualmaturitywas estimated and assumed to be age‐specific, nearly knife edge and
invariantovertimeandregion.Theonsetofsexualmaturitywasassumedtooccuratage‐class3 (6‐9months of age). The adult component of the populationwas defined as the 316 ageclasses. Unlike in Thunnus species, sex ratio does not appear to vary with size for skipjack.Maturity and fecundity at size were not included in the maturity parameter, so in thisassessment the term ‘spawning biomass’ refers to the biomass of adult fish, rather thanspawningpotentialasintheyellowfin,bigeye,andalbacorestockassessments.
4.2 Fisherydynamics
The interaction of the fisheries with the population occurs through fishingmortality.Fishingmortality is assumed to be a composite of several separable processes ‐ selectivity,whichdescribes theage‐specificpatternof fishingmortality; catchability,whichscales fishingefforttofishingmortality;andeffortdeviations,whicharearandomeffectinthefishingeffort‐fishingmortalityrelationship.
4.2.1 SelectivityInmany stock assessmentmodels, selectivity ismodelled as a functional relationship
withage, e.g. using a logistic curve tomodelmonotonically increasing selectivity andvariousdome‐shaped curves to model fisheries that select neither the youngest nor oldest fish.Modelling selectivitywith separateage‐specific coefficients (witha rangeof0‐1), constrainedwith smoothing penalties, has the disadvantage of requiring a large number of parameters.Instead, we have used a method based on a cubic spline interpolation. This is a form ofsmoothing,butthenumberofparametersforeachfisheryisthenumberofcubicspline“nodes”that are deemed to be sufficient to characterise selectivity over the age range.We chose fivenodes,which seems to be sufficient to allow for reasonably complex selectivity patterns. Forparticularfisheriesalternativefunctionswereemployed,includinglogisticandnon‐decreasing.In all cases, selectivity is assumed to be fishery‐specific and time‐invariant. However, it ispossible for a single selectivity function to be “shared” among a group of fisheries that have
12
similar operational characteristics and/or exist in similar areas and with similar sizecompositions.Thisgroupingfacilitatesareductioninthenumberparametersbeingestimated.
The selectivities of the longline fisheries were assumed to increase with age and toremainatthemaximumonceattained.Twopole‐and‐lineselectivitycurveswereestimated:onefor region 1 and one for the equatorial fisheries (regions 2‐5). Selectivity for the equatorialpurse seine fisheries were grouped by set type, with the exception of region 3 which wasindependentlyestimated.TheIndonesian,PhilippinesandVietnamdomesticfisheriesinregion4(Z‐..‐4)werealsogrouped.
4.2.2 CatchabilityConstant catchability (time‐invariant) was estimated for all fisheries for which
standardised indices of relative abundancewere available (P‐ALL‐1, P‐ALL‐2, P‐ALL‐3 and S‐ASS‐ALL‐5).ThisassumptionissimilartoassumingthattheCPUEforthesefisheriesindexestheexploitableabundanceovertime.Nogroupingofcatchabilityforthesefisherieswasemployed,andthereforetherelativeCPUEwasnotusedtoscaletherelativeexploitablebiomassinregions1,2and3–themodelreliesonotherdata,sizeandtagging,toestimatetheregionaldistributionofabundance.
For all other fisheries, catchability was allowed to vary slowly over time (akin to arandomwalk) using a structural time‐series approach. Randomwalk stepswere taken everytwo years, and the deviations were constrained by prior distributions of mean zero andvariancespecifiedforthedifferentfisheriesaccordingtoourpriorbeliefregardingtheextenttowhichcatchabilitymayhavechanged.Forfisherieshavingnoavailableeffortestimates(e.g.thePhilippines and Indonesian surface fisheries), partial fishing mortalities were estimatedconsistent with the observed catches using a Newton‐Raphson procedure. Therefore,catchability deviations (and effort deviations) are not estimated for these fisheries. For theotherfisherieswithtime‐seriesvariabilityincatchability,thecatchabilitydeviationpriorswereassignedavarianceapproximatingaCVof0.10.
Apart from those fisheries for which the data were based on annual estimates, thecatchabilitiesofallotherfisherieswereallowedtovaryseasonally.
4.2.3 EffortdeviationsEffort deviations were used to model the random variation in the effort – fishing
mortality relationship, and are constrained by pre‐specified prior distributions. In thisassessmentthepriorwassettohaveameanofzeroandfortheabundanceindexfisheriestheCVwastime‐varyingandbasedonthevarianceestimatesfromtheGLMs.Forallotherfisheries,theCVwassetto0.2.
4.3 Dynamicsoftaggedfish
4.3.1 InitialtagmixingThe population dynamics of the fully recruited tagged and untagged populations are
governedbythesamemodelstructuresandparameters.Thepopulationsdifferinrespectoftherecruitment process, which for the tagged population is the release of tagged fish, i.e. anindividual tag and release event is the recruitment for that tagged population. Implicitly, weassumethattheprobabilityofrecapturingagiventaggedfishisthesameastheprobabilityofcatchinganygivenuntaggedfishinthesameregionandtimeperiod.Forthisassumptiontobevalid either the distribution of fishing effort must be random with respect to tagged anduntagged fish and/or the tagged fish must be randomly mixed with the untagged fish. Theformer condition is unlikely to be met because fishing effort is almost never randomlydistributedinspace.Thesecondconditionisalsounlikelytobemetsoonafterreleasebecauseof insufficient time formixing to takeplace.Depending on thedisposition of fishing effort inrelationtotagreleasesites,theprobabilityofcaptureoftaggedfishsoonafterreleasemaybe
13
different to that for theuntagged fish. It is thereforedesirable todesignateoneormore timeperiodsafterreleaseas“pre‐mixed”andcomputefishingmortalityforthetaggedfishbasedonthe actual recaptures, corrected for tag reporting (see below), rather than use fishingmortalities based on the general population parameters. This in effect de‐sensitises thelikelihood function to tagrecaptures in thepre‐mixedperiodswhilecorrectlydiscounting thetaggedpopulationfortherecapturesthatoccurred.
We assume that tagged skipjack gradually mix with the untagged population at theregionlevelandthatthismixingprocessiscompletebytheendofthefirstquarterafterrelease.
4.3.2 TagreportingIn principal, tag‐reporting rates can be estimated internally within the model. In
practice,experiencehasshownthatindependentinformationontag‐reportingratesforatleastsome fisheries tends to be required for reasonably precise estimates to be obtained. Weprovided reporting rate priors for all fisheries that reflect our prior opinion regarding thereportingrateandtheconfidencewehaveinthatopinion.
Previous assessmentshave assumed fishery‐specific reporting rates are constant overtime.Thisassumptionwasreasonablewhenmostofthetagdatawereassociatedwithasingletagging programme. However, tag reporting rates may vary considerably between taggingprogrammes due to changes in the composition and operation of individual fisheries change,anddifferentlevelsofpublicityandfollow‐up.Consequently,fishery‐specifictagreportingrateswere estimated that are also specific to individual tagging programmes, i.e. a reporting ratematrix.TagrecaptureandreportingrategroupingsareprovidedinTable4.
The estimation of the reporting rates included penalty terms in respect of pre‐determined priors. These were derived from analyses of tag seeding experiments and otherinformation(Hampton1997)andweremodifiedbytheestimatesoftagger‐specificmortalityoftagged fish (Abascal et al. 2014). For the RTTP and PTTP, relatively informative priorswereformulated for the equatorial purse seine fisheries given the larger extent of informationavailable.
Allreportingrateswereassumedtobestableovertime.
4.4 Likelihoodcomponents
There are four data components that contribute to the log‐likelihood function— thetotalcatchdata,thelength‐frequencydata,theweight‐frequencydataandthetaggingdata.Theobserved total catch data are assumed to be unbiased and relatively precise, with the SD ofresidualsonthelogscalebeing0.007.
The probability distributions for the length‐frequency proportions are assumed to beapproximated by robust normal distributions, with the variance determined by the effectivesample size and the observed length‐frequency proportion. A similar likelihood functionwasusedfortheweight‐frequencydata.
Thesize frequencydata isassignedaneffectivesamplesize lowerthanthenumberoffish sampled. Reduction of the effective sample size recognises that (i) length‐ and weight‐frequencysamplesarenottrulyrandom(becauseofclumpinginthepopulationwithrespecttosize)andwouldhavehighervarianceasaresult;and(ii)themodeldoesnotincludeallpossibleprocesserror,resultinginfurtherunder‐estimationofvariances.
The size data were considered to be moderately informative and were assignedmoderateweightinthelikelihoodfunction;suchthatindividuallengthfrequencydistributionswere assigned an effective sample size of 0.2 times the actual sample size, with amaximumeffectivesamplesizeof50.

14
A log‐likelihood component for the tag datawas computed using a negative binomialdistribution. The negative binomial is preferred over the more commonly used Poissondistributionbecause taggingdataoften exhibitmorevariability than canbe attributedby thePoisson.Wehave employed a parameterisation of the variance parameters such that as theyapproach infinity, the negative binomial approaches the Poisson. Therefore, if the tag returndata showhighvariability (for example, due to contagionornon‐independenceof tags), thenthe negative binomial is able to recognise this. This should then provide a more realisticweightingofthetagreturndataintheoveralllog‐likelihoodandallowthevariabilitytoimpactthe confidence intervals of estimated parameters. However, early attempts at estimatingfishery‐specific varianceparameters from thedata yieldedvalues at eitherbound, suggestinginsufficientinformationwasavailable.Afixedvalueatthemidpointofthevariancerangewastherefore assumed for all fisheries. A complete derivation and description of the negativebinomial likelihood function for tagging data is provided in Hampton and Fournier (2001)(AppendixC).
4.5 Parameterestimationanduncertainty
Theparametersof themodelwereestimatedbymaximizing the log‐likelihoodsof thedata plus the log of the probability density functions of the priors and smoothing penaltiesspecifiedinthemodel.Themaximizationtoapointofmodelconvergencewasperformedbyanefficient optimization using exact derivatives with respect to the model parameters (auto‐differentiation, Fournier 2012). Estimation was conducted in a series of phases, the first ofwhichused arbitrary starting values formost parameters. A bash shell script, doitall, (Annex10.5)implementsthephasedprocedureforfittingthemodel.Someparameterswereassignedspecified starting values consistentwith available biological information. The values of theseparametersareprovidedintheskj.inifile(Annex10.4)2.
Inthisassessmenttwoapproacheswereusedtodescribetheuncertaintyinkeymodeloutputs. The first estimates the statistical variationwithin a given assessment run,while thesecond focuses on the structural uncertainty in the assessment by considering the variationamongmodelruns.Forthefirstapproach,theHessianmatrixwascalculatedforthereferencecasemodelruntoobtainestimatesofthecovariancematrix,whichisusedincombinationwiththeDeltamethodtocomputeapproximateconfidenceintervalsforparametersofinterest(thebiomassandrecruitmenttrajectories).Forthesecondapproach,acrosswisegridofmodelrunswas undertakenwhich incorporatedmany of the options of uncertainty explored by the keymodel runs and one‐off sensitivity analyses. This procedure attempts to describe the mainsourcesofstructuralanddatauncertaintyintheassessment.
Forhighlycomplexpopulationmodelsfittedtolargeamountsofoftenconflictingdata,itis common for there to be difficulties in estimating absolute abundance. Therefore, a profilelikelihoodanalysiswasundertakenof themarginalposterior likelihood inrespectof thetotalpopulation scaling parameter. Reasonable contrast in the profile was taken as indicatingsufficient informationexisted in thedata for estimatingabsolute abundance, andalsoofferedconfirmationoftheglobalminimumobtainedbythemaximumlikelihoodestimate.
Duetothelownumberofobservationsforrecentcohorts,recruitmentestimatesintheterminal model time periods may be poorly estimated. This was investigated usingretrospective analysiswheredata from the terminal timeperiods (the last three years)weresuccessivelyremovedandthemodelfittedtoeachcase.Theterminalrecruitmentsandbiomassestimateswere compared among the retrospectivemodels for their robustness to the loss ofdata.Whethertoestimatetheterminalrecruitmentsornotwasbasedupontheoutcomeofthisanalysis.
2Detailsofelementsofthedoitalland.inifilesaswellasotherinputfilesthatstructureaMULTIFAN‐CLrunaregiveninKleiberetal.(2013).
15
4.6 Stockassessmentinterpretationmethods
Several ancillary analyses using the converged model were conducted in order tointerpret the results for stock assessment purposes. The methods involved are summarizedbelow and the details can be found in Kleiber et al. (2013). Note that, in each case, theseancillaryanalysesarecompletelyintegratedintothemodel,andthereforeconfidenceintervalsforquantitiesofinterestareavailableusingtheHessian‐Deltaapproach.
4.6.1 ReferencepointsThe unfished spawning biomass (SBF=0) in each time period was calculated given the
estimatedrecruitmentsandtheBeverton‐Holtspawner‐recruitrelationship.Thisoffersabasisforcomparing theexploitedpopulationrelative to thepopulationsubject tonaturalmortalityonly.WCPFCadopted20%SBF=0asa limitreferencepointfortheskipjackstockwhereSBF=0 iscalculatedastheaverageovertheperiod2002‐2011.
4.6.2 FisheryimpactManyassessmentsestimatetheratioofrecent to initialbiomassasan indexof fishery
depletion. The problem with this approach is that recruitment may vary considerablythroughout the time series, and if either the initial or recent biomass estimates (orboth) are“non‐representative”becauseof recruitmentvariabilityoruncertainty, thentheratiomaynotmeasurefisherydepletion,butsimplyreflectrecruitmentvariability.
Weapproachthisproblembycomputingbiomasstimeseries(attheregionlevel)usingtheestimatedmodelparameters,butassumingthatfishingmortalitywaszero.BecauseboththerealbiomassBtandtheunexploitedbiomassB0tincorporaterecruitmentvariability,theirratioateachtimestepoftheanalysisBt/Bt0canbeinterpretedasanindexoffisherydepletion.Thecomputationofunexploitedbiomassincludesanadjustmentinrecruitmenttoacknowledgethepossibility of reduction of recruitment in exploited populations through stock‐recruitmenteffects. This analysis was conducted in respect of groups of fisheries so as to describe therelativefishingimpactsofeachgrouponthepopulation.
4.6.3 YieldanalysisThe yield analysis consists of computing equilibrium catch (or yield) and biomass,
conditionalonaspecifiedbasal levelofage‐specific fishingmortality(Fa)fortheentiremodeldomain, a series of fishingmortalitymultipliers, fmult, the naturalmortality‐at‐age (Ma), themeanweight‐at‐age (Wa) and the SRRparameters. All of these parameters, apart from fmult,whichisarbitrarilyspecifiedoverarangeof050inincrementsof0.1,areavailablefromtheparameter estimates of the model. The maximum yield with respect to fmult can easily bedeterminedandisequivalenttotheMSY.SimilarlythespawningbiomassatMSY(SBMSY)canalsobe determined. The ratios of the current (or recent average) levels of fishing mortality andbiomasstotheirrespectivelevelsatMSYarecommonlyusedasreferencepoints.TheseratioswerealsodeterminedwithalternativevaluesofsteepnessassumedfortheSRR.
Forthestandardyieldanalysis,theFaaredeterminedastheaverageoversomerecentperiodoftime.Inthisassessment,weusetheaverageovertheperiod20082011.Thelastyearinwhichacompletesetofcatchandeffortdataisavailableforallfisheriesis2011.Wedonotinclude2012intheaverageasfishingmortalitytendstohavehighuncertaintyfortheterminaldata year of the analysis and the catch and effort data for this terminal year are usuallyincomplete.
TheMSYbasedreferencepointswerealsocomputedusingtheaverageannualFafromeachyear included in themodel (19722012).Thisenabled temporal trends in the referencepoints to be assessed and a consideration of the differences in MSY levels under historicalpatternsofage‐specificexploitation.
16
5 MODELRUNS
5.1 Developmentsfromthe2011assessment
There are six main differences in the input data and structural assumptions of thecurrentassessmentcomparedtothereferencecasefromthe2011assessment.
i. Updatedcatch,sizeandtaggingdatatotheendof2012.
ii. Expandedthenumberofregionsfrom3to5.
iii. Anadditional5fisheriesaddedtoaccommodatethe5regionstructure,bringingthenumberto23from18.
iv. UpdatedCPUE indicesderived fromoperational catchandeffortdata fromJapanesepole‐and‐linefisheries.
v. Set‐basedweightingofpurse‐seinelengthfrequencysamplestoenhancerepresentativenessofthesedata(Abascal2014).
vi. Exclusionofthefourterminalspatially‐aggregatedrecruitmentdeviatesfromtheparameterestimationprocess.
For comparison to the 2011 stock assessment, a step‐wise sequence of models wasformulatedthatmodifiedthe2011referencecasemodeltosequentiallyincorporateeachofthechangesidentifiedabove.Asummaryofthesequentialchanges(Table3) isalsopresentedintheAnnexsection10.3.
5.2 Sensitivityanalyses
The key uncertainties identified in the current assessment are the assumed level ofsteepnessoftheSRR,thegrowthcurve,theweightingofthelengthsamplesandthetagmixingperiod(Table5).
The reference model assumed a value of 0.80 for the steepness of the SRR; modelsensitivitiesincludedalternativevaluesof0.65and0.95.
Duetothelackofstronglengthmodesinthelengthfrequencydata,growthwasfixedatthelevelestimatedinthe2010stockassessment(Hoyleetal.2010),andtwoalternativeswereused ‐oneestimating thegrowthcurvewithin thecurrentmodelandoneusingafixed growthcurveobtained fromdailygrowth ringsonotoliths sampling conducted inthewesternnorthPacific(Tanabe,Kayama,andOgura2003).
The reference model assumed a mixing period of 1 quarter between the taggedpopulationandthepopulationatlarge,asensitivityof2quarterswastested.
The influenceof the sizedatawasexploredbyhalving the relativeweightbyassigninglower (n/50) effective sample sizes,with amaximum sample size of 20, across all sizedata.
5.3 StructuralUncertainty
The interactions between each of the principal models and the various modelsensitivitieswereassessedbyconductingmodelrunsthatcombinedthevariousmodeloptionsdescribed above. This represented a grid of 36 combinations of the following factors: thesteepnessof theSRR (0.65,0.80,or0.95), and thegrowthmodel (2010estimate, estimateorTanabe growth curve), and sample sizeweighting (20, 50).mixing period (1, 2 quarters). Aseparatemodelwasrunforeachofthecombinationsinthegrid.
17
6 RESULTSThis section provides a detailed summary of the results from the reference case
assessment. A general summary of the sequential changes made during model development(AnnexTable10.3.1)isalsopresented.
6.1 ModelDiagnostics(referencecase)
Abriefreviewfollowsofthefitofthemodeltothethreepredicteddataclasses:thetotalcatch data, the length frequency data and the tagging data. In addition, the estimated effortdeviations provide an indication of the consistency of the model with the effort data. Thefollowingobservationsaremadeconcerningthevariousfitdiagnostics:
A high penalty was applied to the catch deviations in the model likelihood andconsequentlythecatchresidualswereverysmallforallfisheries.
The model estimates of pole‐and‐line exploitable biomass trends were generallyconsistentwiththeobservedpole‐and‐lineCPUEindices(Figure11).Despitetheshortertimeseries,themodelpredictedCPUEwasalsoconsistentwiththeobservedindicesforthepurseseinefisheriesinregions4and5,(S‐ASS‐ALL‐5andS‐ID.PH‐4).Inallcasesthemodelpredictionstracedthetemporalvariationandlong‐termtrendsinobservedCPUE.StandardisedCPUEforthepole‐and‐linefisherieswereseasonallydiscontinuousineitherthe later part (P‐ALL‐2) or the entirety of the series (P‐ALL‐1 and P‐ALL‐3). A lowerpenalty was assumed for these data, and consequently the model predictions and theobservations were not closely consistent, however, the general trends are similar. Thedeclines in the standardised purse seine CPUE were also adequately predicted by themodel. An increasing trend in the effort deviations exists for fishery S‐ASS‐ALL‐5,particularly for theperiod laterperiod, indicating that the trends innominal catch ratewere unable to be well predicted by the model (Figure 12). However, this has littleinfluencegivenitsrelativelyshorterduration,thesmallregionsizeandthefactthatintheadjacentregions2and3,theeffortdeviationsaresmallandappeargenerallymorestable.
For most fisheries, there is a reasonable fit to the length data as revealed from acomparison of the observed and predicted proportions at length (Figure 13). TheapparentlackoffittoamodeofsmallfishintheZ‐PH‐4andZ‐ID‐4fisheriesisduetothenearlackofdatainZ‐ID‐4andashiftintheobservedlengthfrequencyinfisheryZ‐PH‐4from the early period (not well fit) to the late period, which was better fit. Closeconsistency between the model and observed length frequencies was obtained for therelativelylargesamplesfromthepurseseinefisheriesinregions1,2,3,and5.Generallythe model adequately describes the variability in catch length frequencies observedamongtheregions(Figure13).
The generally good fit to the size data was also revealed from a comparison of theobserved and predicted median lengths over time (Figure 14). Model predictions inmediansizethroughtimewereareasonablereflectionoftheobservedtrendsinsizeforthepurseseinefisheriesinregions3,4and5;andthepole‐and‐linefisheriesinregions1,2and3.However,forfisheriesinwhichtherearefewrecent(L‐ALL‐5,S‐ID.PH‐4,Z‐ID‐4,Z‐PH‐4,S‐ASS‐DW‐4,L‐JPN‐4,S‐UNA‐DW‐4)thereisanincreasedlackoffit.
Generally the model predictions of the movement of tagged fish among the regionsreflectedtheobservedrecapturesoftaggedfishbytimeperiodatliberty(quarter)fromtheregionofreleasetotheregionofrecapture(Figure15).Region5hasthemajorityofobserved tag recaptures (n=27,452;Table2), followed by region 4(n=9,650;Table2),andtherelativelyequalmovementoftaggedfishintotheseregionswaswelldescribedbythemodelpredictions.Thisrelativestationaritywasalsoadequatelydescribedforregions1,4,and3.Reasonableestimatesofthemovementoftaggedfishoutofthemostrelease
18
regions were obtained, but poorly estimated for movements that lacked long termrecaptures(5to1,1to4,3to4,3to5,4to1,3to1(Figure15).
Thefitofthemodeltothetotalnumbersobservedrecapturesoftaggedfishbycalendartime isshown inFigure16 (recapturesplotted in log‐space).Theobservedrecaptureshave relatively low variability through the recovery phase, and the model predictionswerebroadlyconsistentwiththeobservations,includingthehighnumbersobtainedfromthePTTP in2008‐12.Modelpredicted recapturesexceeded thoseobserved for someofthelateryearsoftheJPandRTTPprograms,butoverallthemodelfittothesedatawasgood.
The overall good fit to the tagging data is also reflected in the predicted recaptures inrespectof timeat libertycloselymatching theobservations (Figure17), indicating thatmodelestimatesoftagattritionduetofishingandnaturalmortalityadequatelydescribethat observed over all tag release programmers. A steep decline in recaptures wasobservedinthefirst4quartersfollowingrelease,butasustainednumberoftaggedfishwererecapturedupto13quartersatliberty.
6.2 ModelParameterestimates(referencecase)
6.2.1 TagReportingRatesEstimatedtag‐reportingratesbyfisheryareshowninFigure18.Ascouldbeexpected,
tag reporting rates for individual fisheries differed both among fisheries and taggingprogrammes.ThegroupingsassumedamongfisheriesandprogrammesareshowninTable4and essentially entails the grouping of pole‐and‐line and longline fisheries (1:4, 7,8,11,12,15,19,23)overallthetaggingprograms,whileotherfisheriesretainedthesamefishery‐specificgrouping,butaprogram‐specificratewasestimatedforeachgroup.Informativepriorsforthetagreportingrateswereavailableforanumberofthemainfisheries,mostnotablythetagrecoveriesbythepurse‐seinefisheriesfromtheRTTPandPTTPprogrammes.
Forallprogrammes,someofthereportingrateestimateswereestimatedtobehigherthanthemodeoftheirpriordistributionsandtendedtovaryconsiderablybetweenregions.Theestimateforthelargestpurseseinefishery(regions2,3,4and5)groupwasabovethepriorfortheSSAP,RTTPandPTTP(region4and5),whileforthePTTPregion2and3andJPprogramsthereportingrate in thepurseseine fisheriesapproachednearzero.Theestimatedreportingrates from the longline fisheries are based on a very small number of tag recoveries and,consequently,thetagrecoverydatafromthesefisheriesarenotveryinformative.
6.2.2 SelectivityThe estimated selectivity coefficients are generally consistent with expectations such
that the longline fisheries principally select larger, older fish and themiscellaneous domesticgearsandassociatedpurse‐seinesets(FADandlogsets)catchingsmallerskipjack(Figure19).Unassociatedpurse‐seinesetsgenerallyselectlargerfishthanassociatedsetswithamoderateselectivityfortheolderageclasses.TheselectivityofthemiscellaneousPhilippines,Indonesiaand Vietnamese fisheries have the highest coefficients for the age‐class 3 quarter with asubsequentdecrease..
TheJapanesepole‐and‐linefishery(P‐ALL‐1)andtheequatorialpole‐and‐linefisheriesP‐All‐2,P‐All‐3,P‐ALL‐4andP‐All‐5)areestimatedtoselectfishofapproximatelythesamesize,althoughthewesternmostregion(region4)hasamuchbroaderselectivityforthesamegear.However, there are also some observations of larger fish in the catch and higher variabilityobservedthatresultsinthehigherselectivitiesforthenorthernpole‐and‐linefisheries.
For the principal purse seine fisheries: S‐ASS‐ALL 2,3,5 and S‐ASS‐ALL 2,3,5, theselectivityisestimatedtobehighestforage‐classes4‐6withlowerselectivityoftheyoungestfishcomparedtotheoldestfish.
19
6.2.3 CatchabiltyModel estimations of the fishery‐specific catchability (Figure 20) show a generally
increasingtrendinallfleetswherecatchabilityisallowedtovary,exceptS‐ALL‐1andP‐All‐5.
6.2.4 MovementThe estimatedmovement coefficients for adjacentmodel regionsare shown inFigure
21. Themodel estimates substantiallymore east‐west than north‐southmovement, althoughthereisstrongmovementfromregion1toregion2inthethirdquarter.
Thedistributionofregionalbiomassbysourceregionderivedfromasimulationusingthemovementcoefficients ispresented inFigure22.For regions1,3and4, a relativelyhighproportionofthebiomassispredictedtobesourcedfromwithinthoseregions.
6.3 Stockassessmentresults
SymbolsusedinthefollowingdiscussionaredefinedinTable6andthekeyresultsareprovidedinTable7.
6.3.1 RecruitmentThe reference case recruitment estimates (aggregatedby year for ease of display) for
each region and the entire WCPO are shown in Figure 23. A key feature of previousassessmentshasbeenthelowrecruitmentduringtheearlypartoftheassessmentfollowedbyanincreasing,butfluctuatingrecruitment.Thisfeaturepersistsinthecurrentassessmentandissimilar to the two previous assessments in this respect (Annex Figure 10.2.3). As noted inSection4.1.1,thelastfourrecruitmentdeviateswerenotestimatedandinsteadsettozero.Thiswasbecausetheretrospectiveanalysisshowedthatthesewerepoorlyestimated(AnnexFigure10.2.2).ThiswillhavenoimpactthespawningbiomassestimatesorreferencepointsasthesecohortsdonotcontributetoSBlatestorSBcurr,andminimalimpactonFcurr/FMSYasweignoreFintheterminalyearalready.
The estimated distribution of recruitment across regions should be interpreted withcaution as MULTIFAN‐CL can use a combination of movement and regional recruitment todistribute fish.Generally theregionalrecruitmentpatternsaresimilartothosefromthe2011assessment.
6.3.2 BiomassTheestimatedspawningpotentialtrajectoryforeachregionandfortheentireWCPOfor
thereferencecaseareshowninFigure24andFigure25.Theeasternequatorialregion(region3) remains the regionwith the greatest spawningpotential and the central equatorial region(region2)isthesecondlargestwiththesinglenorthernregionthethirdlargest.Thespawningpotentialinthewesternequatorialregions4and5aresimilar.
WCPOspawningpotentialisestimatedtohavebeenrelativelystableduringthe1970s,beforeincreasingintheearly1980’sduetohigherrecruitment,beforedecliningoverthepastdecadeduetofishing.
6.3.3 FishingmortalityAverage fishingmortality rates for juvenile and adult age‐classes increase throughout
thetimeseriesforallmodelrunsandinallcases(Figure26).Changesinfishingmortality‐at‐ageandpopulationagestructureareshownfordecadaltimeintervalsinFigure27.Sincethe1980s,theincreaseoffishingmortalitytothecurrentlevelsisduetotheincreaseofcatchesofbothjuvenileandadultfishbeginningatthattimefrombothassociatedpurseseinesetsandthemixedgearfisheriesinthePhilippinesandIndonesia.Fishingmortalityonintermediateages(5‐8quarters)isalsoincreasingthroughtimeconsistentwiththeincreasedfishingmortalityfromthepurseseinefishery.

20
6.3.4 FisheryimpactWemeasure fishery impact at each time step as the ratio of the estimated spawning
potentialtothatwhichwouldhaveoccurredinthehistoricalabsenceoffishing.Thisisausefulvariabletomonitor,asitcanbecomputedbothattheregionlevelandfortheWCPOasawhole.This information is plotted in two ways, first the fished and unfished spawning potentialtrajectories(Figure28)andsecondasthedepletionratiosthemselves(Figure29).ThelatterisrelevantfortheagreedlimitreferencepointanddiscussedinmoredetailinSection7.
The analysis suggests that the declines in spawning potential in regions 1 and 3 arebeing driven primarily by the estimated recruitment, while fishery impacts are greatest inregions4,5andtoacertainextentinregion2.
Itispossibletoascribethefisheryimpacttospecificfisherycomponentsinordertoseewhichtypesof fishingactivityhavethelargestimpactonthespawningpotential(Figure30).The early impacts on the population were primarily driven by pole‐and‐line fishing, but inrecent years, at theWCPO level themost significant impacts havebeen from the purse seinefisheriesandinregion4themiscellaneousdomesticgears.
6.3.5 YieldanalysisTheyieldanalyses conducted in thisassessment incorporate the spawner recruitment
relationship(Figure31) intotheequilibriumbiomassandyieldcomputations. Importantly inthereferencecasemodelthesteepnessoftheSRRwasfixedat0.8soonlythescalingparameterwasestimated.
The equilibrium unfished spawning potential was estimated at 5,940,000mt and thespawningpotentialthatwouldsupporttheMSYwasestimatedtobe1,683,000or28.3%ofSB0(Figure32).Thetotalequilibriumunfishedbiomasswasestimatedtobe6,281,000mt.
The yield analysis also enables an assessment of the MSY level that would betheoreticallyachievableunderthedifferentpatternsofage‐specificfishingmortalityobservedthrough thehistoryof the fishery (Figure33).Prior to1980, theWCPOskipjack fisherywasalmostexclusivelyconductedusingpole‐and‐line,withalowexploitationofsmallskipjack.Theassociatedage‐specificselectivityresultedinasimilarhigher levelofMSY (>1,500,000mtperannum)totherecentestimatesofMSY.
6.4 Stockstatus
6.4.1 StockstatusbasedonthetraditionalKobeplotForcontinuitywithpreviouspractice,andwhiletheSCandWCPFCconsidertheuseof
target and limit reference points, we have included the traditional Kobe plot for spawningpotential versus fishingmortality (Figure34).We have included both SBcurrent and SBlatest forreference on this figure. SBcurrent (2008‐2011 average) and SBlatest (2011) are estimated to be1.94and1.8timeSBMSY, respectively.AsnotedinSection6.3.3, fishingmortalityhasgenerallybeen increasing through time Fcurrent (2008‐2011 average) is estimated to be 0.62 times thefishingmortalitythatwillsupporttheMSY(Table7).
6.4.2 SpawningbiomassinrelationtolimitreferencepointSBF=0calculated fortheperiod2002‐2011isthebasisforthe limitreferencepointand
this is a spawning potential of 6,303,358mt, which is 6.1% higher than SB0 (Table7). Thisindicates that recruitment has been slightly above the estimated spawner recruitment curveduringthisrecentperiod.Thelimitreferencepointis20%SBF=0andthisisaspawningpotentialof1,260,672mt.SBcurrent(2008‐11average)andSBlatest(2011)areestimatedtobe52%and48%respectivelyofSBF=0.AnexploratorygraphicalrepresentationofthisisshowninFigure36.
21
6.4.3 SpawningbiomassinrelationtopotentialtargetreferencepointsTheWCPFChas requested investigationof spawningpotential in the rangeof40‐60%
SBF=0 for skipjack for potential biomass‐related target reference points. As SBcurr (2008‐2011average)andSBlatest(2011)areestimatedtobe52%and48%,respectivelyofSBF=0,theselevelsare within the range of candidate biomass‐related target reference points currently underconsideration.
6.5 Sensitivityofthereferencecase
6.5.1 ImpactofkeymodeldevelopmentsDetailed results of the stepwise changes are provided in Section Error! Reference
sourcenotfound.,whichcanbefoundintheAnnex.
NewMultifan‐CLexecutable
Arepeatofthe2011referencecaseusingtheupdatedversionofMULTIFAN‐CL(version1.1.5.6)was undertaken to ensure the integrity of themodel estimates and to determine thecausesofdifferences,ifanyexisted.Estimateswereidenticaltothoseobtainedin2011(AnnexFigure10.3.1,andFigure10.3.2).
Updatecatch,effortandsizedata
Updatingthedatato2014hadavery largeeffectontheoverallbiomasstrend(AnnexFigure10.3.1),mostlyduetotherevisionsandextensionsofthecatchhistory,inclusionofnewCPUEtimeseries,andupdatedcatchatlengthdata.Theestimatedbiomassfollowednearlythesame trajectory, however it was lower throughout the time series. Recruitment was lowerthroughoutthetimeseries,howeverthefluctuationswerenearlythesame.
Updateto2014region/fisherystructure
Changing to the new region/fishery structure had a smaller effect on the model’sbiomasstrendsthandidtheinclusionofnewdata.Ingeneralthechangetothe2014structureshowed similar but higher biomass throughout the time series until 2000, when the trenddecreasedbelowthepreviousstepwisechange.
Updatetoreferencecase
Thelastmajorupdatetothemodelthatresultedinthereferencecasewasthecessationof estimating the last 4 recruitment deviates,with recruitment for these periods determineddirectly from the stock recruitment relationship. This resulted in a nearly identical biomasstrajectoryasthepreviousstep,withtheexceptionthatrecruitmentandbiomass ‘spike’attheendwhenthelastfourrecruitmentdeviatesareestimated.
6.5.2 One‐offchangestothereferencecaseComparisons of the recruitment and spawning potential trajectories for the reference
caseandone‐changesensitivity runs from the structuraluncertainty analysis areprovided inFigure37.ThekeyreferencepointsandlikelihoodcomponentsarecomparedinTable7and
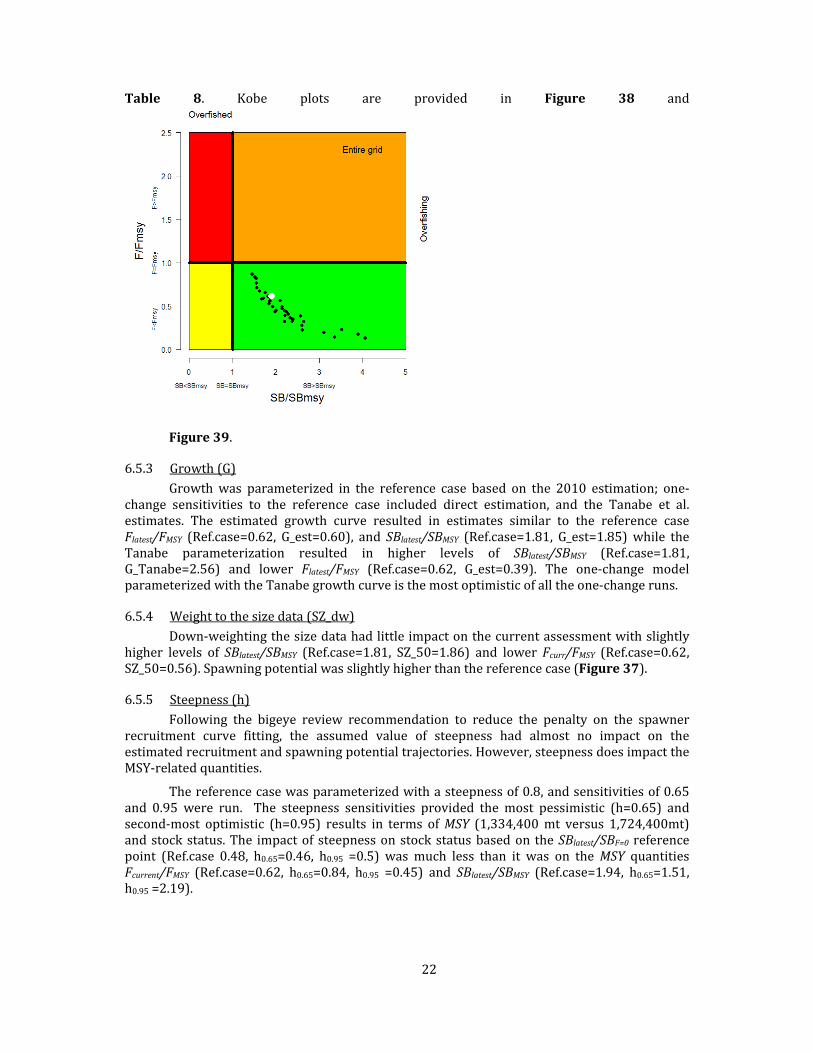
22
Table 8. Kobe plots are provided in Figure 38 and
Figure39.
6.5.3 Growth(G)Growthwas parameterized in the reference case based on the 2010 estimation; one‐
change sensitivities to the reference case included direct estimation, and the Tanabe et al.estimates. The estimated growth curve resulted in estimates similar to the reference caseFlatest/FMSY (Ref.case=0.62, G_est=0.60), and SBlatest/SBMSY (Ref.case=1.81, G_est=1.85) while theTanabe parameterization resulted in higher levels of SBlatest/SBMSY (Ref.case=1.81,G_Tanabe=2.56) and lower Flatest/FMSY (Ref.case=0.62, G_est=0.39). The one‐change modelparameterizedwiththeTanabegrowthcurveisthemostoptimisticofalltheone‐changeruns.
6.5.4 Weighttothesizedata(SZ_dw)Down‐weightingthesizedatahadlittleimpactonthecurrentassessmentwithslightly
higher levels of SBlatest/SBMSY (Ref.case=1.81, SZ_50=1.86) and lower Fcurr/FMSY (Ref.case=0.62,SZ_50=0.56).Spawningpotentialwasslightlyhigherthanthereferencecase(Figure37).
6.5.5 Steepness(h)Following the bigeye review recommendation to reduce the penalty on the spawner
recruitment curve fitting, the assumed value of steepness had almost no impact on theestimatedrecruitmentandspawningpotentialtrajectories.However,steepnessdoesimpacttheMSY‐relatedquantities.
Thereferencecasewasparameterizedwithasteepnessof0.8,andsensitivitiesof0.65and 0.95 were run. The steepness sensitivities provided the most pessimistic (h=0.65) andsecond‐most optimistic (h=0.95) results in terms ofMSY (1,334,400mt versus 1,724,400mt)andstockstatus.The impactof steepnessonstockstatusbasedon theSBlatest/SBF=0 referencepoint (Ref.case 0.48, h0.65=0.46, h0.95 =0.5) was much less than it was on theMSY quantitiesFcurrent/FMSY (Ref.case=0.62, h0.65=0.84, h0.95 =0.45) and SBlatest/SBMSY (Ref.case=1.94, h0.65=1.51,h0.95=2.19).
23
6.5.6 TagmixingOne alternative tag mixing scenario was examined – comparing tag mixing of two
quarterswiththeRef.caseofonequarter.
ThelongertagmixingperiodhadminimalimpactonMSY,butresultedinaslightlymoreoptimistic stock status indicators, with slightly higher levels of SBlatest/SBMSY (Ref.case=1.81,Mix_2=1.84)andlowerFcurr/FMSY(Ref.case=0.62,Mix_2=0.53).
6.5.7 StructuraluncertaintyanalysisComparisonsof the impactsofdifferentaxesof thestructuraluncertaintyanalysisare
shownintwoways,firstthroughaseriesofKobeplotswhichshowFcurrent/FMSYandSBlatest/SBMSYwithcolourcodingforeachoptionwithintheaxes(Figure40),andsecondthroughaseriesofboxandwhiskerplots(Figure41andFigure42).
Thegeneralpatterns foreachoptionwithinthe fiveaxesarethesameasdescribedinSection5.3sowedonotrepeat themhere.Thepositive(ornegative) impactsof thedifferentoptions were found to be somewhat additive, e.g., model runs with more options thatindividuallygavebetteroutcomesgaveevenbetteroutcomeswhencombined.
6.5.8 OthermodelrunsAsanexploratoryrun,analternativemodelformulationusingage‐andseason‐specific
movement rates based on SEAPODYM (Lehodey et al, 2001) was undertaken to test theplausibility of using ecosystem model output in the place of internal estimation. The modelusing SEAPODYM input results in similar terminal biomass levels (Figure43) and referencequantities(SBlatest/SBMSY:Ref.case=1.81,SEAPODYM=1.82,Fcurr/FMSY:Ref.case=0.62,SEAPODYM=0.77). However, the run using the SEAPODYM output indicated a >50% reduction in thespawning potential since 1999. The use of the SEAPODYM movement parameters greatlydegraded the likelihood and so this model was not included in the uncertainty grid. It is,however,anareaforcontinuedresearch.
7 DISCUSSIONANDCONCLUSIONSThegapbetweenthe2014and2011assessments is the longestgapbetweenskipjack
assessmentsinthepasttenyears(assessmentswerecompletedin2005,2007,2008,2010and2011).Significantchangesandimprovementshavebeenmadetothe2014assessmentbasedonmany of the skipjack‐relevant recommendations from the Independent Review of the 2011bigeyeassessment (Ianelliet al.,2012),. InSection7.1wewill commentonsomeof themostsignificantchangestotheassessment,andsomeofthesimilarities.Wewillalsotouchbrieflyonsomeof theproblemsencounteredorareasofuncertainty,but thesewillbecovered inmoredetailinSections7.2and7.3.
7.1 Changesfromthe2011assessment
The2010and2011assessmentsconcludedthat theskipjackstockwasnotoverfishedwith Fcurrent/FMSY in the order of 0.34 and 0.37, respectively, while the current assessmentestimates Fcurrent/FMSY = 0.62. All three assessments were characterized with an increase inrecruitmentaround1980andapproximatelythesametrajectoryofthespawningpotential.Ingeneral the conclusions from the 2014 stock assessment are consistent with those frompreviousassessments.
The biggest change to the 2014 assessment was the subdivision of model regions tobringtheassessmenttoa5regionmodelwith23fisheries.Thiswasdoneinresponsetoseveralrecommendations of the bigeye review that had relevance for skipjack and to address dataconflicts that had been noted in the 2011 assessment. Given the uncertainty, and oftensignificantrevisionsthatoccurwithcatchstatistics fromIndonesia, thePhilippines,andlikely
24
Vietnaminthefuture,separationofthisareashouldhelpisolatetheimpactofthesechangesontheestimateddynamicsinotherregions.
The separation of the region that generally encompasses the Coral, Bismarck andSolomon Sea’s (region 5)was done partly in response to the analysis of Hoyle et al. (2013)whichfoundthatskipjacktaggedinthisareaappearedtomixlessthanfishtaggedinthewiderregion2area.Anothermotivationforsplittingwasbecausethepurseseinefisheryinregion5has clearly different fishing power to the region fisheries, complicating the analysis ofmanagementoptionswhenthesefisheriesarecombined.
ConsiderableimprovementsweremadetothesizeandCPUEinputsinresponsetotheindependentreview.TwonewstandardisedCPUEseriesforregion4and5(Bigelowetal.2014;Pillingetal.2014)wereusetoinformbiomasstrendsintheseregions.Thepurseseinesizedatawere subject to considerable improvements and, alongwith the additional subregions, likelyreducedtheconflictinthesedatasuchthatthesensitivityanalysiswiththedatadownweightedhadmuchlessimpactontheresults.Thereweresomeexamplesoflackoffittosizedata,suchasthepoorfittosizedatafromthelonglineandmiscellaneousfisheries,whichwewilldiscussinthefollowingsections.
Following the detailed evaluation of the tagging data andmodelling requirements byHoyleetal.,(2013),considerableeffortwasdirectedatallaspectsofthetaggingdatafromtheinitialdataselectioncriteriatothereportingratepriors.Thisworkwillneedtocontinue.
FourmajorstructuralmodellingchangesweremadewithrespecttorecruitmentandtheSRRinthecurrentassessment,thoughonlytworeflectrecommendationsfromtheindependentreview and the other two relate to issues that became apparent during the assessment. Theapplicationof the lognormalbias correction to the estimateof the SRR lead to an increase inMSYandaslightdecreaseinFcurrent/FMSY,butbecauseitalsoincreasestheestimateofSB0,stockstatus in relation to SBMSY is worse. We also reduced the weight on fitting the SRR asrecommendedbythereviewersandthiswhytheestimatedrecruitmentandspawningpotentialtrends do not differ across the assumed values of steepness. The estimation of very largeterminal recruitment deviates in earlymodel runs,withno singleobviousdatadriving them,combined with the results of the retrospective analyses lead to us not estimate recruitmentdeviatesforthelastfourquarters.Notestimatingrecruitmentdeviateswhendataaredeficient,suchaswithterminalrecruitmentdeviates,isapracticesometimesusedinNewZealandstockassessments (N.Daviespers. comm.).Weconsider this a goodgeneraldevelopment as itwillreduce the impact that suchpoorly estimated recruitments haveonprojections –we alreadyexcludefishingmortalityestimatesduringthefinalyearfromtheMSYcalculations.
7.2 Sourcesofuncertainty
Inthissectionwecommentonsomeofthedifficultiesencounteredintheassessmentorissues that arose in the modelling which led to potential uncertainty. This will includediscussionofsomeofthefactorsthatwereincludedintheuncertaintyframeworkusedintheassessment,i.e.,sensitivityanalysesandthestructuraluncertaintyanalysis(grid).
Due to delays in the finalization of data from themost recent year, the three tropicaltunaassessmentsuseddataupuntil2012 insteadof2013aswouldnormallybethepractice.Forsuchshortlivedspeciessuchastunas,thiscanleadtoamismatchbetweeninformationonstockstatusfromtheassessment,managementactions,andtheactualstockstatusonthewater.Thisyearthe2013datawasonly‘finalized’attheendofthefirstweekofJulyandisexpectedtobesubjecttorevisionafterSC10(P.Williamspers.comm.).Purseseinecatchestimates,whichdepend on observer data, are also impacted by incomplete data and subject to revision. It isimportant tonote that the longlinedataused for the final year of the2011 assessmentswassubsequentlyrevisedconsiderably,buttheassessments,withincorrectdata,hadtobeusedforevaluationofmanagementoptions.

25
IntheSectionbelowwewillmakearecommendationregardingtheimportanceofsomeofthe ‘electronic’orE‐reportinginitiativescurrentlyunderwayintheregion,butherewetalkabout how we have used the results from retrospective analyses to come up with a betterreference point for spawning potential depletion. Previous assessments typically use theestimateofspawningpotentialforthe‘current’periodwhichexcludesthemostrecentyear,andtakes the averageof the four yearsbefore that, e.g., in this assessment current is2008‐2011.Whilethisapproachmightbesuitableforfishingmortality,especiallywhereitcanchangefromyeartoyearwiththemixofFADandfreeschoolsets,itisnotassensibleforspawningpotentialdepletion, which retrospective analyses demonstrate is generally well estimated even in theterminalyearoftheassessment.WehavethereforedefinedSBlatestasthepenultimateyearofthemodel(i.e.,2011)andrecommendthatconclusionsonstockstatusbebasedonthisFcurrent/FMSYandSBlatest/SBF=0.
Pole‐and‐line CPUE data are one of the most important drivers of the skipjack stockassessment;howeverwiththecontinuingdeclineoftheJapanesepole‐and‐linefleetparticularlyinthetropicalregions,theongoingrelianceonthisfleettoprovideasuitableindexofskipjackabundancewillbecomeincreasinglyproblematic.
Thecurrentassessmenthadthegreatestupdateoftaggingdatainmanyyearsandthelimitedsensitivityanalysesdemonstratedthatkeymodeloutputsarelightlysensitivetotaggingdataassumptionssuchastheassumedmixingperiod.Atthesametimethesedataallowedtheestimation of naturalmortality and providing ‘absolute abundance’ scaling information to gowiththe‘relativeabundance’informationprovidedbylonglineCPUE.
Finally,oneareaof reduceduncertainty in thecurrentassessmenthasbeen impactofsteepness on the spawning potential reference point. The previously used reference point ofSB/SBMSYwasextremelysensitivetotheassumedvalueofsteepness,butthenewlimitreferencepoint 20%SBF=0, is far less sensitive to this (Table 7). There is however a new issue to beaddressed,which is that of how to present stock status information in the light of thenewlyadopted limit reference point. The terms of overfished and overfishing are also open toreconsideration,asistheKobeplot.WeseethisasanimportanttaskfortheSCindetermininghow best to communicate stock assessment results to the Commission. This issue was firstraised at MOW2 in the paper also submitted to SC10 (McDonald 2014) and we attempt tofurtherstimulatediscussiononthisissuewithournewfigureprovidedasFigure36.
7.3 Recommendationsforfurtherwork
As discussed in the sections above, there are areas of uncertainty in the currentassessments,andmanyofthesecanbeaddressedbyfurtherwork.Thissectionoutlinessomerecommendations,somedirectedatthoseundertakingfutureassessments,andsomeattheSCandWCPFCitself.
WCPFCrecommendations
WCPFC continue the evaluation of E‐reporting initiatives for both logbook and observerdataandimplementthesewithurgencywhereitisfoundtobepracticalandcost‐effective.Thiswillallowstockassessmentstobeundertakenwithuptodatedata;
WCPFCshouldconsiderthepotentialimpactsofchangesinpurseseineeffortreportingbysome fleetson:stockassessments,evaluationofmanagementmeasures,andtheabilityofmanagementmeasurestoachievetheirdesiredoutcomes.
Biologicalstudies
Growthinvestigation:Modellingfisheriesatasmallerspatialandtemporalscalemayallowbetter estimation of growth rates from length frequencymodes, and potentially regionalpatterns in growthwhere samples are sufficient. Analyses of length increment data from

26
tagging may provide information about spatial and temporal growth variation, and theintegrationofsuchdataintoMULTIFAN‐CLmayassistinbetterestimationofgrowth.
Continued taggingacross the range of the stock (associatedwith tag seedingworkwherenecessary) to support the ability of tagging data to improve estimates of growth, naturalmortality,movement,andfishingmortality.Analysesofthesedatatoinformmixingperiodsandspatialstructureshouldcontinue.
MULTIFAN‐CL/Modelling
Examine the potential for orthogonal recruitment structure to reduce the number ofrecruitmentparametersestimatedtosimplifytheobjectivefunctionsolutionsurface.
Furtherinvestigateselectivityfunctionalforms,includinglength‐basedselectivityforpurseseine and other small‐fish fisheries. Careful examination will be required of impacts ongrowthestimatesandthisworkmaynotbepossibleuntil improveddataareavailable forgrowthestimation.
Likelihood profiling on the population scaling parameter and other important modelquantities,e.g.,growthparameters,shouldberoutineinallassessments(Leeetal.2014).
Futureassessmentsshouldconsiderawiderrangeofuncertaintyaroundthe taggingdataincludingreportingrates,dataweighting,andmixingperiods.
CPUE
ReviewtherecommendationsofHoyleetal.(2014a;2014b)inthefuturedevelopmentandpresentationofCPUEanalysis.
As noted in the 2011 assessment this and recent skipjack assessments have usedstandardizedCPUE from the Japanesepole‐and‐line fisheries as the key index that drivesestimated abundance trends. This fishery nowmakes up less than 4%of the totalWCPOskipjackcatch,andanevensmallerpercentageinthemainequatorialzone,butremainstheonlyfisherythatcanprovidelong‐terminformationonrelativebiomasslevels.Westillhavea limitedunderstandingof the factorsdriving thepatternsobserved in thesedata.Recentanalyses have made significant progress and we encourage further analysis as a highpriority.Theaimshouldbetoworktowardsastableprotocolthatcanbecarriedforwardwithlittleextracost.
Asnotedinthe2011assessmentthepurseseinefisherydominatesequatorialcatches,butprogress has been slow in understanding the factors impacting its CPUE. An index ofabundancebasedonthismajorfisheryisdesirable,buttherearedifficulties.Technologieschangeconstantly,catchabilityincreasesrapidly,anditisdifficulttodefinetheunitofeffortwhenfishaggregatingdevicesareinvolved.Researchinthisareawouldbeveryrewardingifsuccessful,butishighriskandwouldbedifficulttoapplytolongtermabundanceindices.This assessment uses two shorter purse seine CPUE series for the additional regions andcontinuedworkontheseCPUEseriesiswarranted.
Referencepoints
SCshouldconsiderthebestwaytosummariseandpresent informationonstockstatus inthelightoftheadoptionofalimitreferencepointandstepstowardstargetreferencepointsandeventuallyharvestcontrolrules.
7.4 MainConclusions.
Themainconclusionsofthecurrentassessmentareconsistentwithrecentassessmentspresentedin2010and2011.Themainconclusionsareasfollows:

27
1. Afluctuatingbutconsistentlyhighlevelofrecruitmentsincetheearly1970shassupportedarobustfisheryinallregions.Theanalysissuggeststhattheregionaldeclinesinspawningpotential,inallregionsexceptregion1,arebeingdrivenprimarilybythefishingimpacts.
2. Although the ratio of exploited to unexploited spawning potential is estimated to havedeclined,withsomefluctuations,throughoutthemodelperiod,theaveragetotalbiomassofthelastfiveyearsisestimatedtobeabovetheaveragetotalbiomassofthefirstfiveyearsofthemodel.
3. Latestcatchesslightlyexceedthemaximumsustainableyield(MSY).
4. Fishing mortality for adult and juvenile skipjack tuna is estimated to have increasedcontinuously since the beginning of industrial tuna fishing, but fishing mortality stillremainsbelowthelevelthatwouldresultintheMSY.
5. RecentlevelsofspawningpotentialarewellabovethelevelthatwillsupporttheMSY.
6. The estimated 2011 level of spawning potential represents approximately 52% of theunfishedlevel,andiswellabovethelimitreferencepointof20%SBF=0agreedbyWCPFC.
7. Recent levels of spawning potential are in themiddle of the range of candidate biomass‐relatedtargetreferencepointscurrentlyunderconsiderationforskipjacktuna,i.e.,40‐60%SBF=0.
8. Stock status conclusions were most sensitive to alternative assumptions regardingsteepnessandgrowth.However themainconclusionsof theassessmentarerobust to therangeofuncertaintythatwasexplored.
8 ACKNOWLEDGEMENTSWe thank the various fisheries agencies, in particularNRIFSF for theprovision of the
catch,effortandsizecompositiondatausedinthisanalysis.Wealsothankparticipantsatthepreparatory stock assessmentworkshop (Noumea, April 2014) for their contributions to theassessment.
28
9 REFERENCESAbascal, F., Lawson, T., andWilliams, P. 2014. Analysis of purse seine size data for skipjack,
bigeye and yellowfin tunas. WCPFC SC10‐ SA‐IP‐05, Majuro, Republic of the MarshallIslands,6–14August2014.
Berger,A.,McKechnie,S.,Abascal,F.,Kumasi,B.,Usu,T.,andNicol,S.2014.Analysisoftaggingdata for the 2014 tropical tuna assessments: data quality rules, tagger effects, andreportingrates.WCPFCSC10‐SA‐IP‐06,Majuro,RepublicoftheMarshall Islands,6–14August2014.
Bigelow,K.,Garvilles,E.andBarut,N.2014.Relativeabundanceofskipjackandyellowfin tunaintheMoroGulf(PhilippineRegion12),WCPFCSC10‐SA‐WP‐09,Majuro,RepublicoftheMarshallIslands,6‐14August2014.SA‐WP‐09
Bigelow,K.,Hampton,J.,andFournier,D.PreliminaryapplicationoftheMULTIFAN‐CLmodeltoskipjack tuna in the tropicalWCPO. 2000. Working Paper SKJ‐ 2, 13thMeeting of theStanding Committee on Tuna and Billfish, 5‐ 12 July 2000, Noumea, New Caledonia.RefType:ConferenceProceeding
Cadigan,N.G.,andFarrell,P.J.2005.Localinfluencediagnosticsfortheretrospectiveprobleminsequentialpopulationanalysis.ICESJournalofMarineScience,62:256‐265.
Cadrin,S.X.,andVaughan,D.S.1997.RetrospectiveanalysisofvirtualpopulationestimatesforAtlanticmenhadenstockassessment.Fish.Bull.(U.S.)95(3):445‐455
Cordue, P. L. 2013. Review of species and size composition estimation for the western andcentralPacificpurseseinefishery.WCPFCSC9‐2013‐ST‐IP‐02,Pohnpei,FederatedStatesofMicronesia,6–14August2013
Davies,N.,Fournier,D.,Hampton,J.,Bouyé,F.,andHarley,S.2014.RecentdevelopmentsintheMULTIFAN‐CLstockassessmentsoftware.WCPFCSC10‐SA‐IP‐08,Majuro,RepublicoftheMarshallIslands,6–14August2014.
Davies,N.,Harley,S.,Hampton,J.,andMcKechnie,S.2014.Stockassessmentofyellowfintunainthewestern and central Pacific Ocean.WCPFC SC10‐SA‐WP‐04,Majuro, Republic of theMarshallIslands,6–14August2014.
Fournier,D.A.,H.J.Skaug,J.Ancheta,J.Ianelli,A.Magnusson,M.N.Maunder,A.Nielsen,andJ.Sibert.2012.ADModelBuilder:usingautomaticdifferentiationforstatisticalinferenceofhighly parameterized complex nonlinear models. Optimization Methods & Software 27(2),233–249.
Fournier,D.A.,Hampton,J., and Sibert,J.R. 1998.MULTIFAN‐CL: a length‐based, age‐structuredmodelforfisheriesstockassessment,withapplicationtoSouthPacificalbacore,Thunnusalalunga.Can.J.Fish.Aquat.Sci.55:2105‐2116.
Francis,R.I.C.C.1992.Useofriskanalysistoassessfisherymanagementstrategies:Acasestudyusing orange roughy (Hoplostethus atlanticus) on the Chatham Rise, New Zealand.Can.J.Fish.Aquat.Sci.49:922‐930.
Gaertner,D.,gadodeMolina,A.,Ariz,J.,Pianet,R.,andHallier,J.P.2008.Variabilityof thegrowthparameters of the skipjack tuna (Katsuwonus pelamis) among areas in the easternAtlantic:analysisfromtaggingdatawithinameta‐analysisapproach.Aquat.LivingResour.21:349‐356.
Hampton,J.1997.Estimatesoftag‐reportingandtag‐sheddingratesinalarge‐scaletunataggingexperimentinthewesterntropicalPacificOcean.Fish.Bull.95:68‐79.
Hampton,J. 2000. Natural mortality rates in tropical tunas: size really does matter.Can.J.Fish.Aquat.Sci.57:1002‐1010.

29
Hampton,J. 2002. Stockassessmentof skipjack tuna in thewesternand centralPacificOcean.WorkingPaper1:36.
Hampton, J. and Fournier, D. 2001a. Stock assessment of skipjack tuna in the western andcentralPacificOcean[SKJ‐1].SPC,SecretariatofthePacificCommunityNo.[SKJ‐1].
Hampton,J. and Fournier,D. 2001b. Stock assessment of yellowfin tuna in the western andcentral Pacific Ocean. 14th Meeting of the Standing Committee on Tuna and Billfish,August.
Hampton,J. and Fournier,D.A. 2001c. A spatially disaggregated, length‐based, age‐structuredpopulationmodelofyellowfintuna(Thunnusalbacares)inthewesternandcentralPacificOcean.Mar.Freshwat.Res.52:937‐963.
Hampton,JohnandWilliams,Peter2011.Analysisofpurseseinesettypebehaviourin2009and2010.No.WCPFC‐SC7‐2011/MI‐WP‐01.
Harley,S.J.2011.Apreliminaryinvestigationofsteepnessintunasbasedonstockassessmentresults.No.WCPFC‐SC7‐2011/IP‐08.
Harley,S.,Davies,N.,Hampton, J.,andMcKechnie,S.2014.Stockassessmentofbigeyetuna inthewesternandcentralPacificOcean.WCPFCSC10‐SA‐WP‐01,Majuro,Republicof theMarshallIslands,6–14August2014.
Hoyle, S. D. 2011. Tag reporting rate prior distributions for the 2011 bigeye, yellowfin, andskipjackstockassessments.No.WCPFCSC7SAIP‐10.
Hoyle,S.,Kleiber,P.,Davies,N.,Harley,S.,andHampton, J.2010.StockassessmentofskipjacktunainthewesternandcentralPacificOcean.No.WCPFC‐SC6‐2010/SA‐WP‐10.
Hoyle,S.,Kleiber,P.,Davies,N.,Harley,S.,andHampton, J.2011.StockassessmentofskipjacktunainthewesternandcentralPacificOcean.No.WCPFC‐SC7‐2011/SA‐WP‐04REV1
Hoyle, Simon D. and Langley, Adam D. 2011. Spatial size data stratification for length‐basedstockassessments.WesternandCentralPacificFisheriesCommissionNo.WCPFC‐SC7‐SA‐IP‐09.
Ianelli,J.,Maunder,M.,andPunt,A.E.2012.Independentreviewofthe2011WCPObigeyetunaassessment.WCPFCSC8‐SA‐WP‐01,Busan,RepublicofKorea,7‐15August2012.
Itano,D.G.2000.Thereproductivebiologyofyellowfin tuna (Thunnusalbacares) inHawaiianwaters and the western tropical Pacific Ocean: project summary. SOEST 00‐01, JIMARContribution00‐328.75p.
Kiyofuji,H,Uosaki,K,andHoyle,S.2011.UpdatedCPUEforskipjackcaughtbyJapanesedistantwaterandoffshorepoleandlineinthewesternandcentralPacificOcean.No.WCPFC‐SC7‐2011/SA‐IP‐13.
Kiyofuji,H.andOkamoto,H.2014.Anupdateofthestandardizedabundanceindexofskipjackby the Japanese pole‐and‐line fisheries in the WCPO. WCPFC SC10‐ SA‐IP‐16, Majuro,RepublicoftheMarshallIslands,6‐14August2014..
Kleiber,P.M.,Hampton,W.J.,andFournier,D.A.2003.MULTIFAN‐CLUser'sGuide.
Langley,A.,Hampton,J.,andOgura,M.2005.StockassessmentofskipjacktunainthewesternandcentralPacificOcean.
Langley,A.,Ogura,M.,andHampton,J.2003.Stockassessmentofskipjacktunainthewesternandcentral Pacific Ocean. 16th Standing Committee on Tuna and Billfish. Oceanic FisheriesProgram,SecretariatofthePacificCommunity,Noumea,NewCaledonia.
Langley, A. D. and Hampton, J. 2008. Stock assessment of skipjack tuna in theWestern andCentralPacificOcean.WesternandCentralPacificFisheriesCommission(WCPFC).
30
Lawson,T2011.Purse‐Seine length frequenciescorrected for selectivitybias ingrabsamplescollectedbyobservers.No.WCPFC‐SC‐ST‐IP‐2.
Lawson,TandSharples,P2011.ReportonProject60:Collectionandevaluationofpurseseinespeciescompositiondata.No.WCPFC‐SC7‐ST‐WP‐3.
Lawson,Timothy.2009.Selectivitybiasingrabsamplesandotherfactorsaffectingtheanalysisof speciescompositiondatacollectedbyobserversonpurseseiners in theWesternandCentralPacificOcean.WesternandCentralPacificFisheriesCommissionNo.WCPFC‐SC5‐2009/ST‐WP‐03.
Lawson,Timothy.2010.Updateontheestimationofselectivitybiasbasedonpairedspillandgrabsamplescollectedbyobserversonpurseseiners intheWesternandCentralPacificOcean.WesternandCentralPacificFisheriesCommissionNo.WCPFC‐SC6‐2010/ST‐WP‐02
Lehodey,P.2001.ThepelagicecosystemofthetropicalPacificOcean:dynamicspatialmodellingandbiologicalconsequencesofENSO.ProgressinOceanography49:439‐468.
Lehodey,P.,Bertignac,M.,Hampton,J.,Lewis,A.,andPicaut,J.1997.ElNi±oSouthernOscillationandtunainthewesternPacific.Nature389:715‐718.
Leroy, B. Preliminary results on skipjack (Katsuwonus pelamis) growth, SCTB13 WorkingPaper,SKJ‐1.13thMeetingoftheStandingCommitteeonTunaandBillfish.13.2000.5‐7‐2000.RefType:ConferenceProceeding
Mace,P.M. andDoonan,I.J. 1988. Biomass and yield estimates for North ChathamRise orangeroughy. 42 p.(Draft report prepared for the Standing Committee on orange roughy.)UnpublishedreportheldinNIWAlibrary.POBox14:901.
Maunder,M.N.2001.Growthofskipjacktuna(Katsuwonuspelamis)intheeasternPacificOcean,as estimated from tagging data. Bulletin.Inter‐American Tropical TunaCommission/Boletin.Comision Interamericana del Atun Tropical.La Jolla CA[Bull.IATTC/Bol.CIAT].Vol.22no.
Maunder,M.N.2011.UpdatedindicatorsofstockstatusforskipjacktunaintheeasternPacificOcean.InterAmericanTropicalTunaCommissiondocumentSAC0208.
Maunder,M.N.,Watters,G.M.,andInter‐AmericanTropicalTunaCommission2003.A‐SCALA:AnAge‐structured Statistical Catch‐at‐length Analysis for Assessing Tuna Stocks in theEasternPacificOcean.Inter‐AmericanTropicalTunaCommission.
McDonald,A.2014.Representinguncertainty, riskandperformance indicatorsagainst fisherymanagement objectives and reference points (MOW2‐WP/05). WCPFC SC10‐ MI‐IP‐02,Majuro,RepublicoftheMarshallIslands,6–14August2014.
McKechnie,S.,Harley,S.,Davies,N.,Rice,J.,andHampton,J.2014.Basisforregionalstructuresusedinthe2014tropicaltunaassessments,includingregionalweights.WCPFCSC10‐SA‐IP‐02,Majuro,RepublicoftheMarshallIslands,6–14August2014.
Pilling,G.M.,Usu,T.,Kumasi,B.,Harley,S.,andHampton,J2014.PurseseineCPUEforskipjackandyellowfininthePNGpurseseinefisheryWCPFCSC10‐SA‐WP‐03,Majuro,RepublicoftheMarshallIslands,6–14August2014.
Sibert,J.R.,Hampton,J.,Fournier,D.A.,andBills,P.J.1999.Anadvection‐diffusion‐reactionmodelfor the estimation of fishmovement parameters from tagging data, with application toskipjacktuna(Katsuwonuspelamis).Can.J.Fish.Aquat.Sci.56:925‐938.
SPC‐OFP.2013.Purseseineeffort:arecent issue in logbookreporting.WCPFC‐TCC9‐2013‐18,Pohnpei,FederatedStatesofMicronesia,25September–1October2013.

31
SPC‐OFP. 2014. Report from the 2014 pre‐assessment workshop. WCPFC SC10‐SA‐IP‐07,Majuro,RepublicoftheMarshallIslands,6–14August2014
Tanabe,T.,Kayama,S.,andOgura,M.Preciseagedeterminationofyoungtoadultskipjacktuna(Katsuwonus pelamis) with validation of otolith daily increment. 16th Meeting of theStandingCommitteeonTunaandBillfish,916July2003,Mooloolaba,Australia.WorkingPaperSKJ8.2003.2003.RefType:Case
Wild, A. and Hampton,J. 1994. A review of the biology and fisheries for skipjack tuna,Katsuwonuspelamis,inthePacificOcean.FAOFisheriesTechnicalPaper(FAO).
Williams, P. 2014. Major changes in data available for the 2014 tropical tuna assessments.WCPFCSC10‐SA‐IP‐04,Majuro,RepublicoftheMarshallIslands,6–14August2014
WilliamsP., andTerawasi,P.2014.Overviewof the tuna fisheries in thewestern and centralPacific Ocean, including economic conditions – 2013. WCPFC‐SC10‐2011/GN‐WP‐01,Majuro,RepublicoftheMarshallIslands,6–14August2014.

32
Table1.Definitionof fisheries for theMULTIFAN‐CLskipjackanalysis.Gears:PL=pole‐and‐line;PS=purseseineunspecifiedset type; LL= longline;DOM= therangeofartisanalgeartypesoperatinginthedomesticfisheriesofPhilippinesandIndonesia.Flag/fleets:JPN=JapanPH=Philippines;ID=Indonesia;ALL=allnationalities.
Fishery Nationality Gear Region
1.P‐ALL‐1 Japan Pole‐and‐line 1
2.S‐ALL‐1 Japan Purseseine 1
3.L‐JPN‐1 Japan Longline 1
4.P‐ALL‐2 All Pole‐and‐line 2
5.S‐ASS‐ALL‐2 All Purseseine,log/FADsets 2
6.S‐UNA‐ALL‐2 All Purseseine,schoolsets 2
7.L‐JPN‐2 Japan Longline 2
8.P‐ALL‐5 All Pole‐and‐line 5
9.S‐ASS‐ALL‐5 All Purseseine,log/FADsets 5
10.S‐UNA‐ALL‐5 All Purseseine,schoolsets 5
11.L‐JPN‐5 Japan Longline 5
12.P‐ALL‐3 All Pole‐and‐line 3
13.S‐ASS‐ALL‐3 All Purseseine,log/FADsets 3
14.S‐UNA‐ALL‐3 All Purseseine,schoolsets 3
15.L‐JPN‐3 Japan Longline 3
16.Z‐PH‐4 PH MiscellaneoussmallscalegearswithinPHarchipelagicwaters 4
17.Z‐ID‐4 ID Miscellaneoussmall‐scalegearswithinIDarchipelagicwaters 4
18.S‐ID.PH‐4 PH,ID PurseseineoperatinginPH,IDwaters,allsets 4
19.P‐ALL‐4 All Pole‐and‐line 4
20.S‐ASS‐DW‐4 All Purseseine,log/FADsets 4
21.S‐UNA‐DW‐4 All Purseseine,schoolsets 4
22.Z‐VN‐4 Vietnam Miscellaneous,includingsmallpurseseineandgillnetwithinVNwaters 4
23.L‐JPN‐4 Japan Longline 4
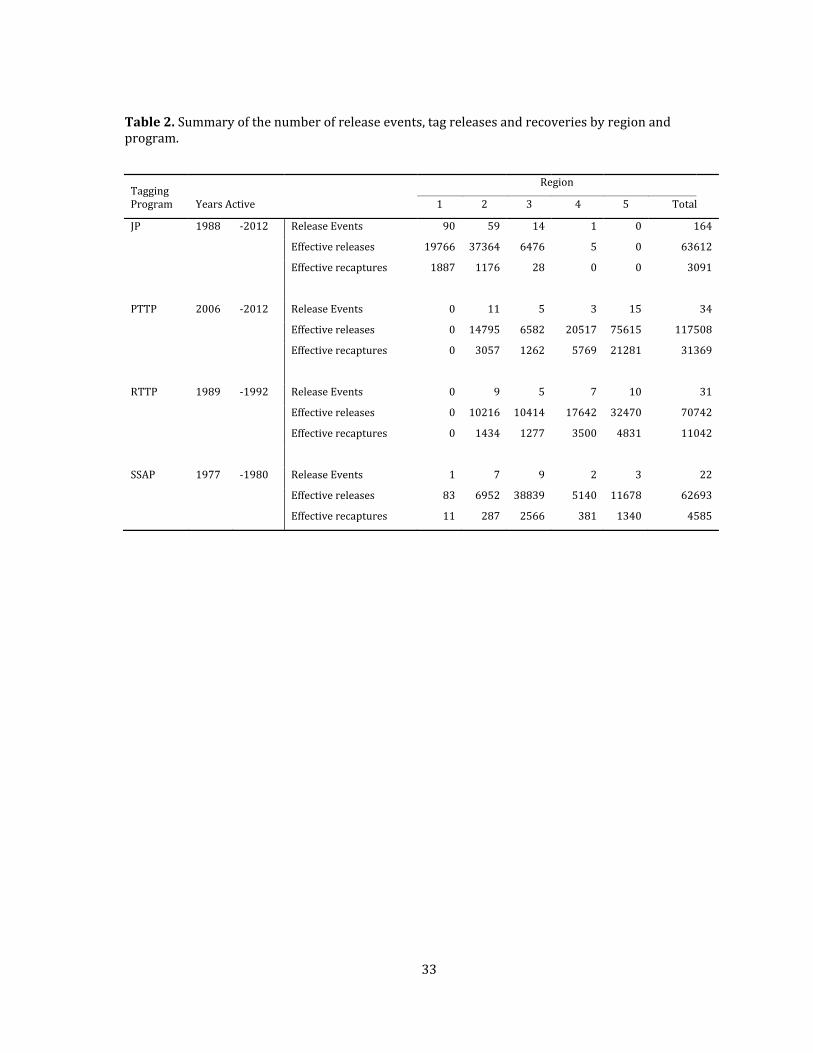
33
Table2.Summaryofthenumberofreleaseevents,tagreleasesandrecoveriesbyregionandprogram.
TaggingProgram
Region
YearsActive 1 2 3 4 5 Total
JP 1988 ‐2012 ReleaseEvents 90 59 14 1 0 164
Effectivereleases 19766 37364 6476 5 0 63612
Effectiverecaptures 1887 1176 28 0 0 3091
PTTP 2006 ‐2012 ReleaseEvents 0 11 5 3 15 34
Effectivereleases 0 14795 6582 20517 75615 117508
Effectiverecaptures 0 3057 1262 5769 21281 31369
RTTP 1989 ‐1992 ReleaseEvents 0 9 5 7 10 31
Effectivereleases 0 10216 10414 17642 32470 70742
Effectiverecaptures 0 1434 1277 3500 4831 11042
SSAP 1977 ‐1980 ReleaseEvents 1 7 9 2 3 22
Effectivereleases 83 6952 38839 5140 11678 62693
Effectiverecaptures 11 287 2566 381 1340 4585
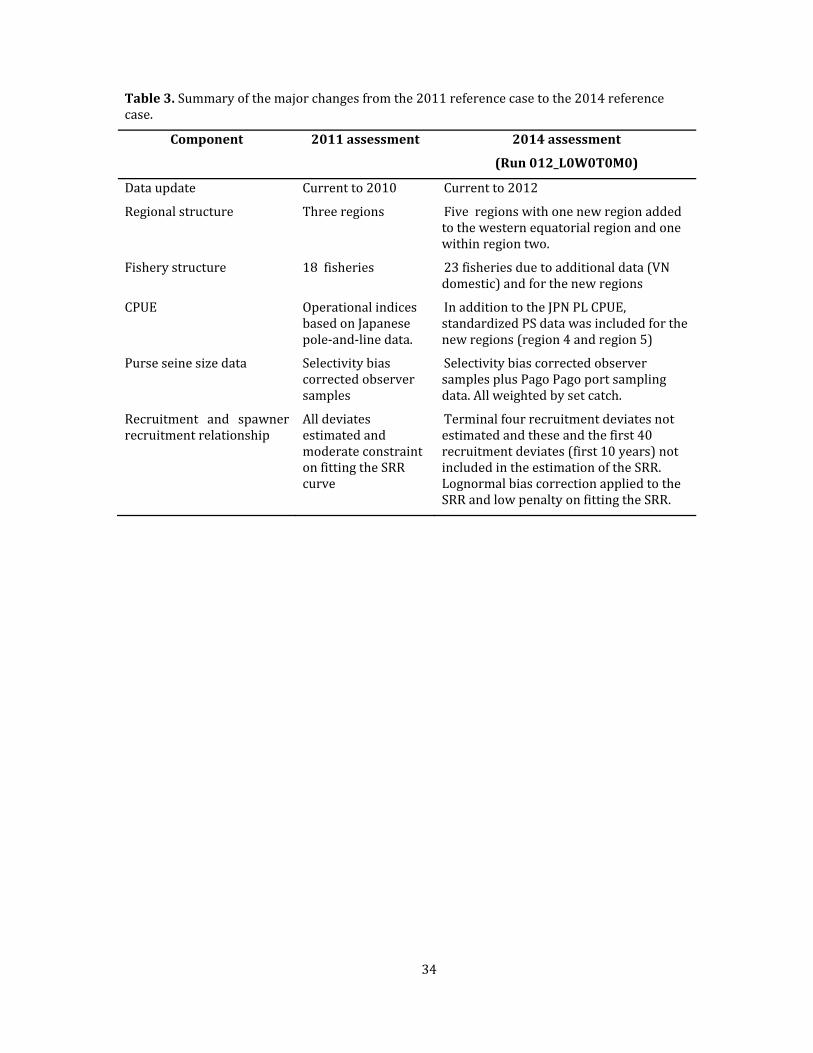
34
Table3.Summaryofthemajorchangesfromthe2011referencecasetothe2014referencecase.
Component 2011assessment
2014assessment
(Run012_L0W0T0M0)
Dataupdate Currentto2010 Currentto2012
Regionalstructure Threeregions Fiveregionswithonenewregionaddedtothewesternequatorialregionandonewithinregiontwo.
Fisherystructure 18fisheries 23fisheriesduetoadditionaldata(VNdomestic)andforthenewregions
CPUE OperationalindicesbasedonJapanesepole‐and‐linedata.
InadditiontotheJPNPLCPUE,standardizedPSdatawasincludedforthenewregions(region4andregion5)
Purseseinesizedata Selectivitybiascorrectedobserversamples
SelectivitybiascorrectedobserversamplesplusPagoPagoportsamplingdata.Allweightedbysetcatch.
Recruitment and spawnerrecruitmentrelationship
AlldeviatesestimatedandmoderateconstraintonfittingtheSRRcurve
Terminalfour recruitmentdeviatesnotestimatedandtheseandthefirst40recruitmentdeviates(first10years)notincludedintheestimationoftheSRR.LognormalbiascorrectionappliedtotheSRRandlowpenaltyonfittingtheSRR.

35
Table 4. Summary of the groupings of fisheries within the assessment for selectivity curve,catchability (used for the implementation of regional weights), tag recaptures (typically forpurse seine fisheries within a region), and tag reporting rates. Note for the latter, for somefisherygroupsdifferent reporting rateswereestimated fordifferent tag releaseprogrammes.SeeTable1forfurtherdetailsoneachfishery.
# Fishery Region Selectivity Catchability Tagrecaptures Tagreporting
1 P‐ALL‐1 1 1 1 1 1
2 S‐ALL‐1 1 2 2 2 1
3 L‐JPN‐1 1 3 3 3 1
4 P‐ALL‐2 2 4 4 4 1
5 S‐ASS‐ALL‐2 2 5 5 5 2
6 S‐UNA‐ALL‐2 2 6 6 5 2
7 L‐JPN‐2 2 7 7 6 1
8 P‐ALL‐5 5 4 8 7 1
9 S‐ASS‐ALL‐5 5 5 9 8 3
10 S‐UNA‐ALL‐5 5 6 10 8 3
11 L‐ALL‐5 5 8 11 9 1
12 P‐ALL‐3 3 4 12 10 1
13 S‐ASS‐ALL‐3 3 9 13 11 4
14 S‐UNA‐ALL‐3 3 10 14 11 4
15 L‐JPN‐3 3 11 15 12 1
16 Z‐PH‐4 4 12 16 13 5
17 Z‐ID‐4 4 12 17 14 6
18 S‐ID.PH‐4 4 5 18 15 7
19 P‐ALL‐4 4 4 19 16 1
20 S‐ASS‐DW‐4 4 5 20 17 8
21 S‐UNA‐DW‐4 4 6 21 17 8
22 Z‐VN‐4 4 12 22 18 9
23 L‐JPN‐4 4 13 23 19 1
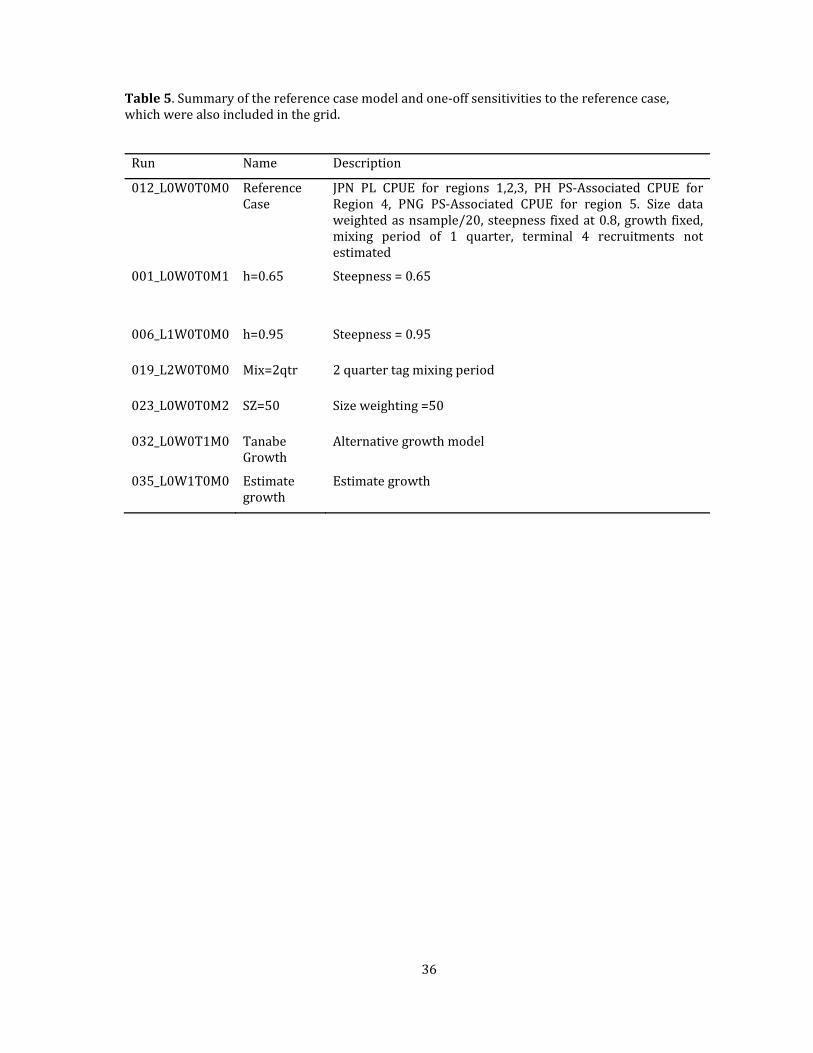
36
Table5.Summaryofthereferencecasemodelandone‐offsensitivitiestothereferencecase,whichwerealsoincludedinthegrid.
Run Name Description
012_L0W0T0M0 ReferenceCase
JPN PL CPUE for regions 1,2,3, PH PS‐Associated CPUE forRegion 4, PNG PS‐Associated CPUE for region 5. Size dataweightedasnsample/20,steepness fixedat0.8,growthfixed,mixing period of 1 quarter, terminal 4 recruitments notestimated
001_L0W0T0M1 h=0.65 Steepness =0.65
006_L1W0T0M0 h=0.95 Steepness=0.95
019_L2W0T0M0 Mix=2qtr 2quartertagmixingperiod
023_L0W0T0M2 SZ=50 Sizeweighting=50
032_L0W0T1M0 TanabeGrowth
Alternativegrowthmodel
035_L0W1T0M0 Estimategrowth
Estimategrowth
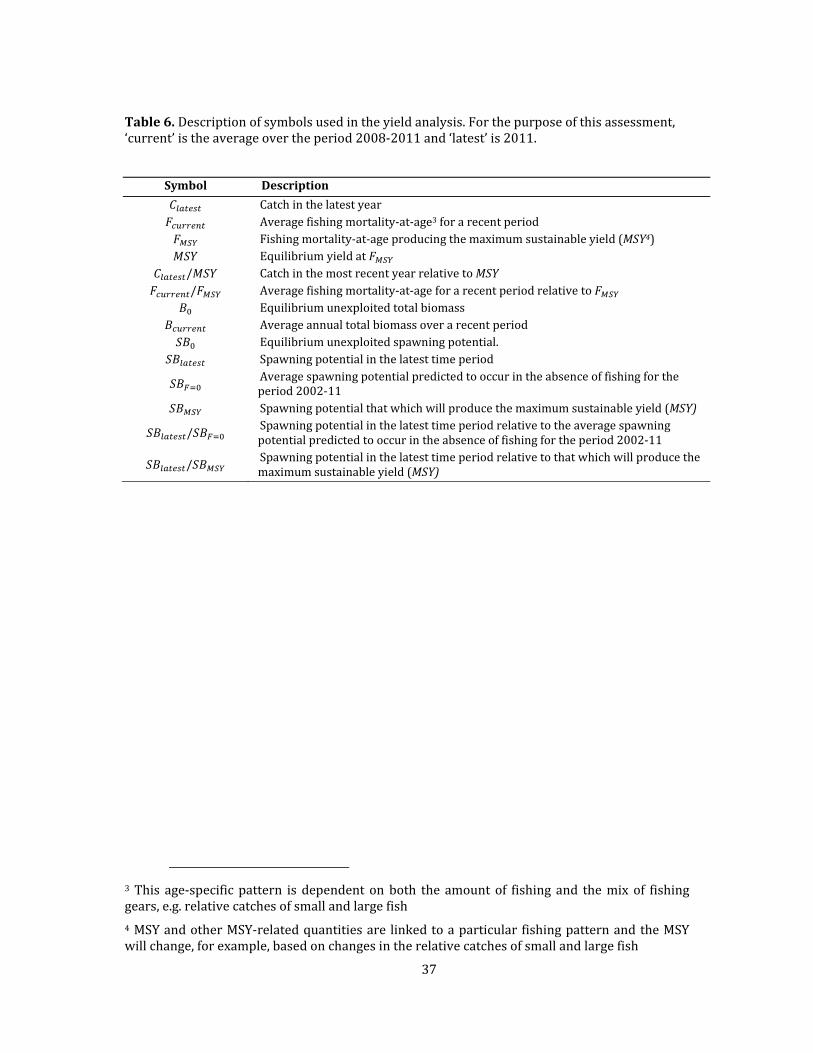
37
Table6.Descriptionofsymbolsusedintheyieldanalysis.Forthepurposeofthisassessment,‘current’istheaverageovertheperiod2008‐2011and‘latest’is2011.
Symbol Description
Catchinthelatest year Averagefishingmortality‐at‐age3 forarecentperiod
Fishingmortality‐at‐ageproducingthemaximumsustainableyield(MSY4) Equilibriumyieldat
/ CatchinthemostrecentyearrelativetoMSY/ Averagefishingmortality‐at‐ageforarecentperiodrelativeto Equilibriumunexploitedtotalbiomass Averageannualtotalbiomassoverarecentperiod
Equilibriumunexploitedspawningpotential. Spawningpotentialinthelatesttimeperiod
Averagespawningpotentialpredictedtooccurintheabsenceoffishingfortheperiod2002‐11
Spawningpotentialthatwhichwillproducethemaximumsustainableyield(MSY)
/ Spawningpotentialinthelatesttimeperiodrelativetotheaveragespawningpotentialpredictedtooccurintheabsenceoffishingfortheperiod2002‐11
/ Spawningpotentialinthelatesttimeperiodrelativetothatwhichwillproducethemaximumsustainableyield(MSY)
3 This age‐specific pattern is dependenton both the amountof fishing and themix of fishinggears,e.g.relativecatchesofsmallandlargefish
4MSYandotherMSY‐relatedquantitiesare linkedtoaparticular fishingpatternandtheMSYwillchange,forexample,basedonchangesintherelativecatchesofsmallandlargefish
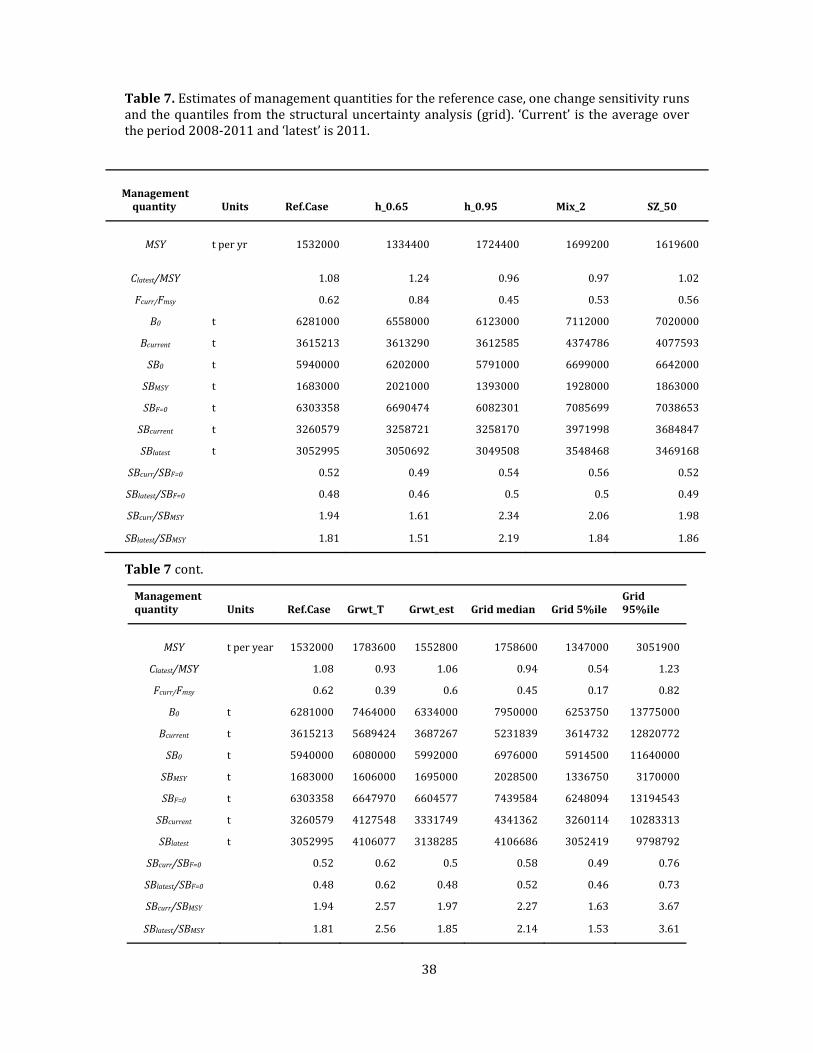
38
Table7.Estimatesofmanagementquantitiesforthereferencecase,onechangesensitivityrunsandthequantiles fromthestructuraluncertaintyanalysis(grid). ‘Current’ istheaverageovertheperiod2008‐2011and‘latest’is2011.
Managementquantity Units Ref.Case h_0.65 h_0.95 Mix_2 SZ_50
MSY tperyr 1532000 1334400 1724400 1699200 1619600
Clatest/MSY 1.08 1.24 0.96 0.97 1.02
Fcurr/Fmsy 0.62 0.84 0.45 0.53 0.56
B0 t 6281000 6558000 6123000 7112000 7020000
Bcurrent t 3615213 3613290 3612585 4374786 4077593
SB0 t 5940000 6202000 5791000 6699000 6642000
SBMSY t 1683000 2021000 1393000 1928000 1863000
SBF=0 t 6303358 6690474 6082301 7085699 7038653
SBcurrent t 3260579 3258721 3258170 3971998 3684847
SBlatest t 3052995 3050692 3049508 3548468 3469168
SBcurr/SBF=0 0.52 0.49 0.54 0.56 0.52
SBlatest/SBF=0 0.48 0.46 0.5 0.5 0.49
SBcurr/SBMSY 1.94 1.61 2.34 2.06 1.98
SBlatest/SBMSY 1.81 1.51 2.19 1.84 1.86
Table7cont.
Managementquantity Units Ref.Case Grwt_T Grwt_est Gridmedian Grid5%ile
Grid95%ile
MSY tperyear 1532000 1783600 1552800 1758600 1347000 3051900
Clatest/MSY 1.08 0.93 1.06 0.94 0.54 1.23
Fcurr/Fmsy 0.62 0.39 0.6 0.45 0.17 0.82
B0 t 6281000 7464000 6334000 7950000 6253750 13775000
Bcurrent t 3615213 5689424 3687267 5231839 3614732 12820772
SB0 t 5940000 6080000 5992000 6976000 5914500 11640000
SBMSY t 1683000 1606000 1695000 2028500 1336750 3170000
SBF=0 t 6303358 6647970 6604577 7439584 6248094 13194543
SBcurrent t 3260579 4127548 3331749 4341362 3260114 10283313
SBlatest t 3052995 4106077 3138285 4106686 3052419 9798792
SBcurr/SBF=0 0.52 0.62 0.5 0.58 0.49 0.76
SBlatest/SBF=0 0.48 0.62 0.48 0.52 0.46 0.73
SBcurr/SBMSY 1.94 2.57 1.97 2.27 1.63 3.67
SBlatest/SBMSY 1.81 2.56 1.85 2.14 1.53 3.61
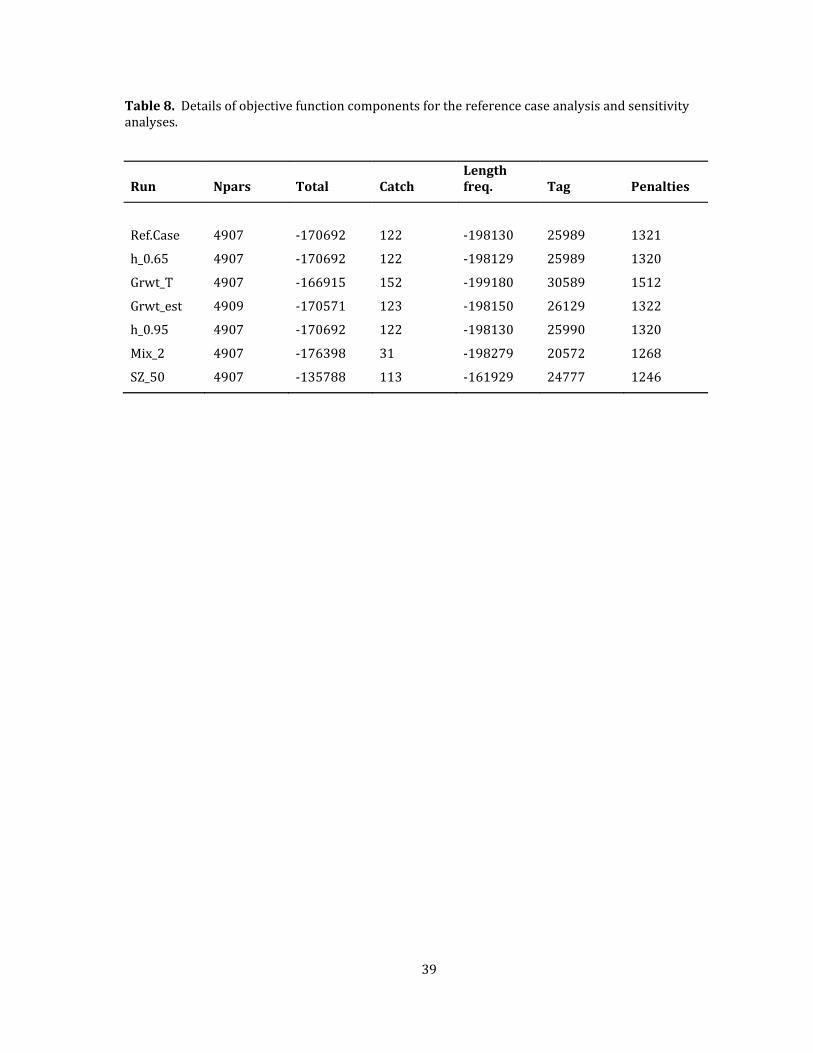
39
Table8.Detailsofobjectivefunctioncomponentsforthereferencecaseanalysisandsensitivityanalyses.
Run Npars Total CatchLengthfreq. Tag Penalties
Ref.Case 4907 ‐170692 122 ‐198130 25989 1321
h_0.65 4907 ‐170692 122 ‐198129 25989 1320
Grwt_T 4907 ‐166915 152 ‐199180 30589 1512
Grwt_est 4909 ‐170571 123 ‐198150 26129 1322
h_0.95 4907 ‐170692 122 ‐198130 25990 1320
Mix_2 4907 ‐176398 31 ‐198279 20572 1268
SZ_50 4907 ‐135788 113 ‐161929 24777 1246
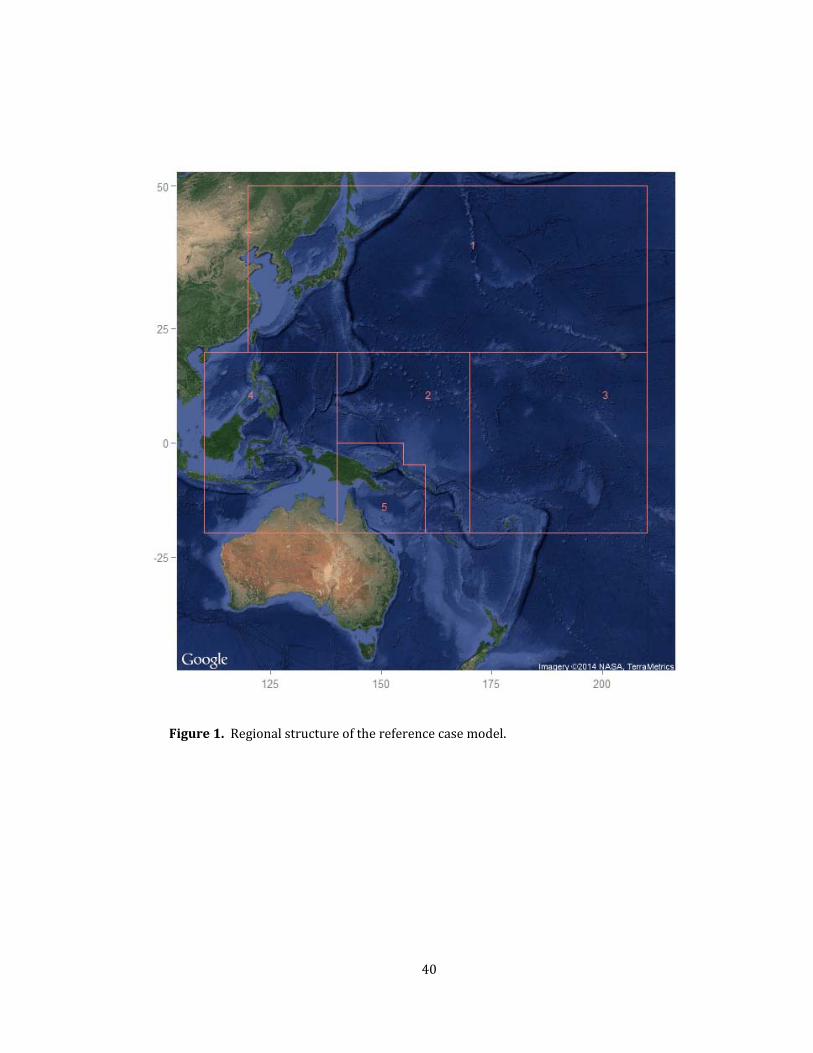
40
Figure1.Regionalstructureofthereferencecasemodel.
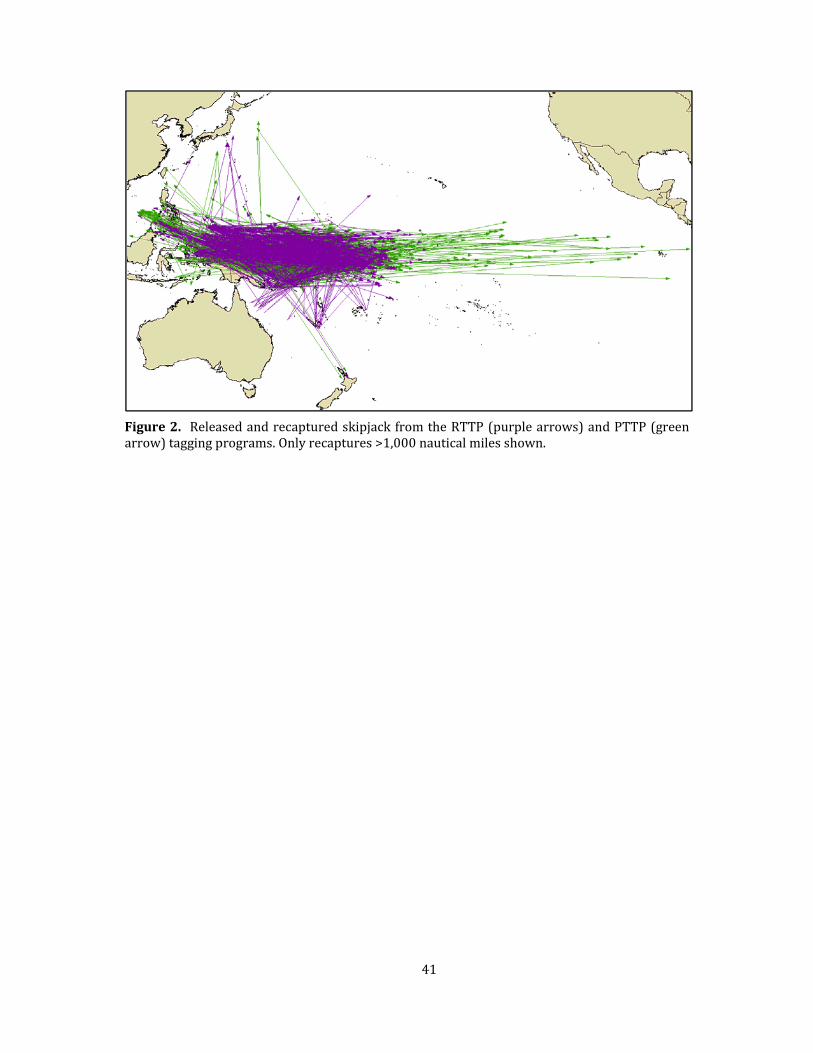
41
Figure2. ReleasedandrecapturedskipjackfromtheRTTP(purplearrows)andPTTP(greenarrow)taggingprograms.Onlyrecaptures>1,000nauticalmilesshown.

42
Figure3.Catchdistribution(2003‐2012)by5degreesquaresoflatitudeandlongitudeandfishingmethod:longline(green),purse‐seine(blue),pole‐and‐line(red),andother(yellow).Overlayedarethesubregionsfortheassessmentmodel.Notethebreakat170EinRegion1isincorrect–pleaseseeFigure1forthecorrectboundary.
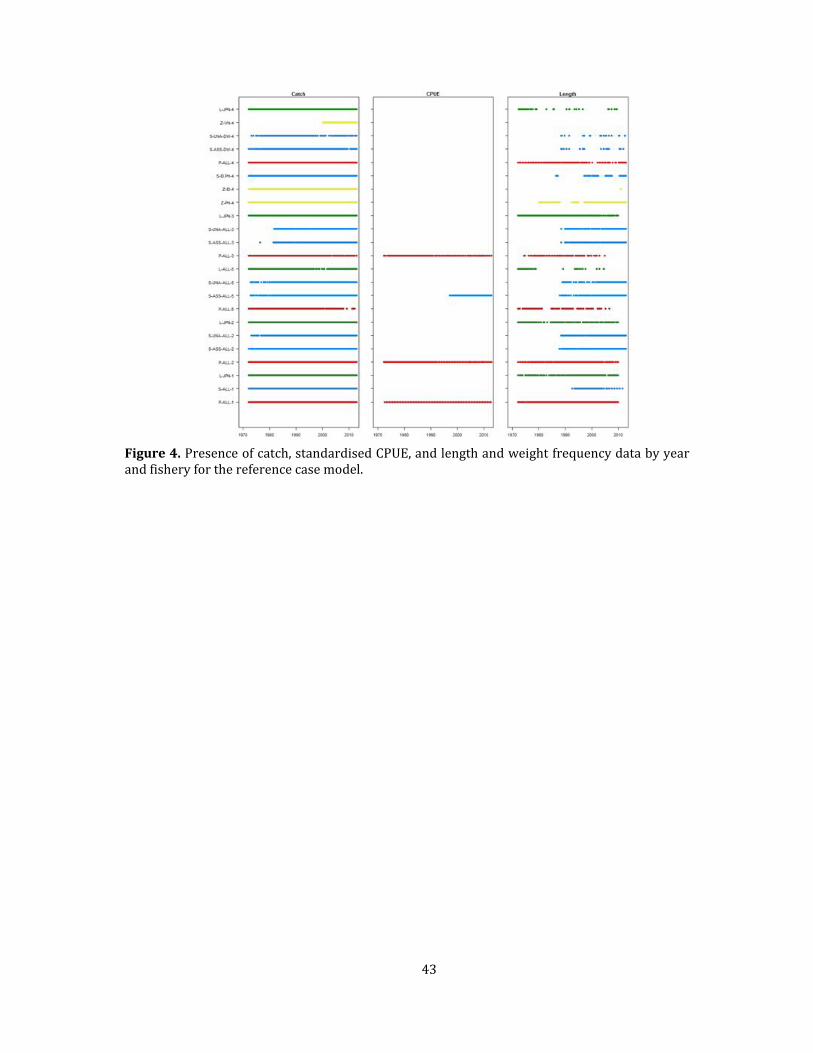
43
Figure4.Presenceofcatch,standardisedCPUE,andlengthandweightfrequencydatabyyearandfisheryforthereferencecasemodel.
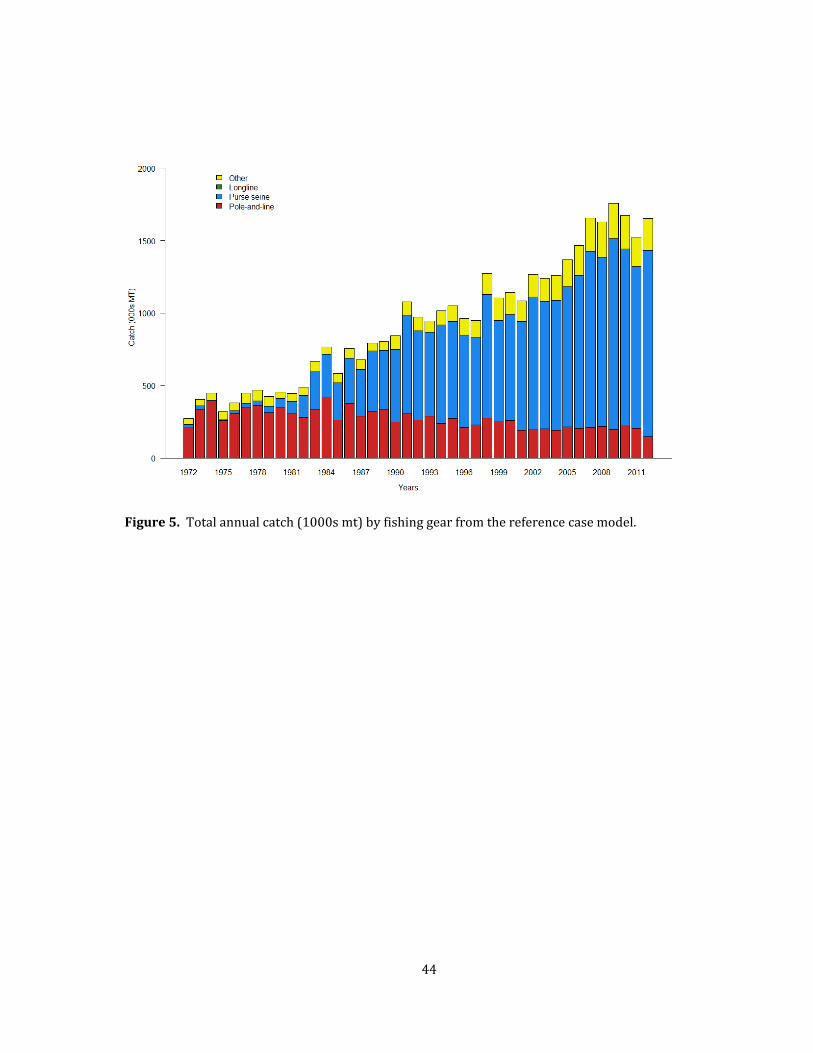
44
Figure5.Totalannualcatch(1000smt)byfishinggearfromthereferencecasemodel.
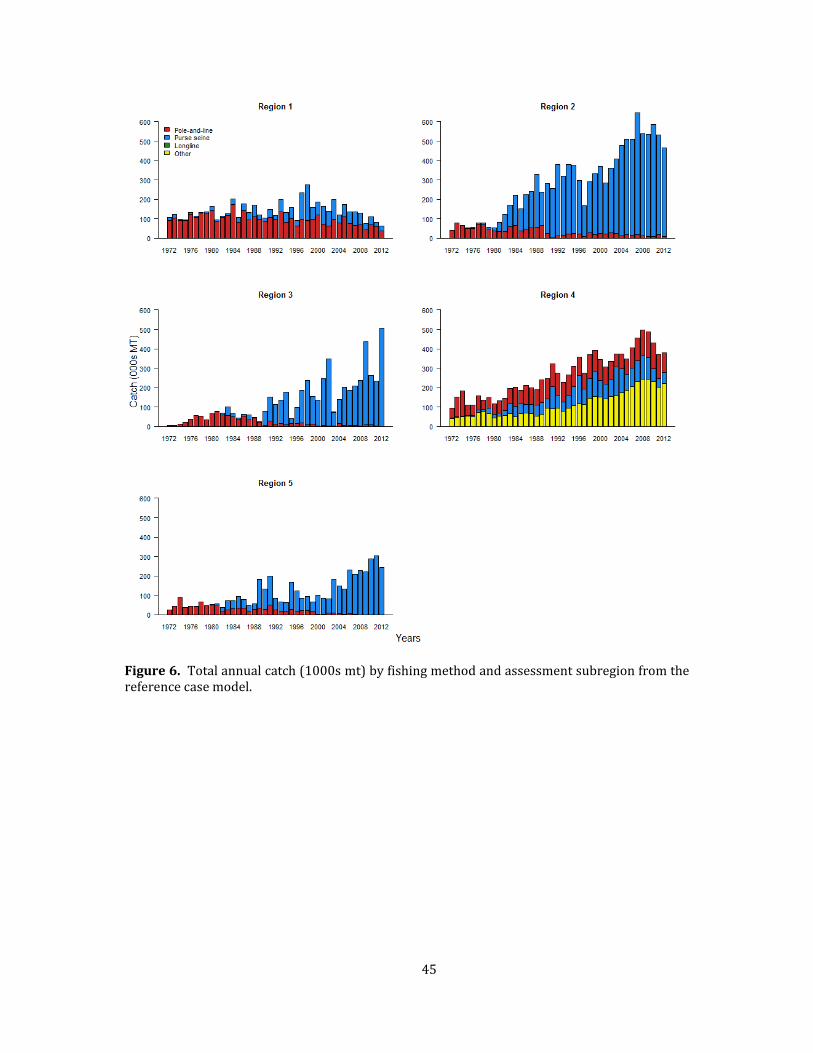
45
Figure6.Totalannualcatch(1000smt)byfishingmethodandassessmentsubregionfromthereferencecasemodel.
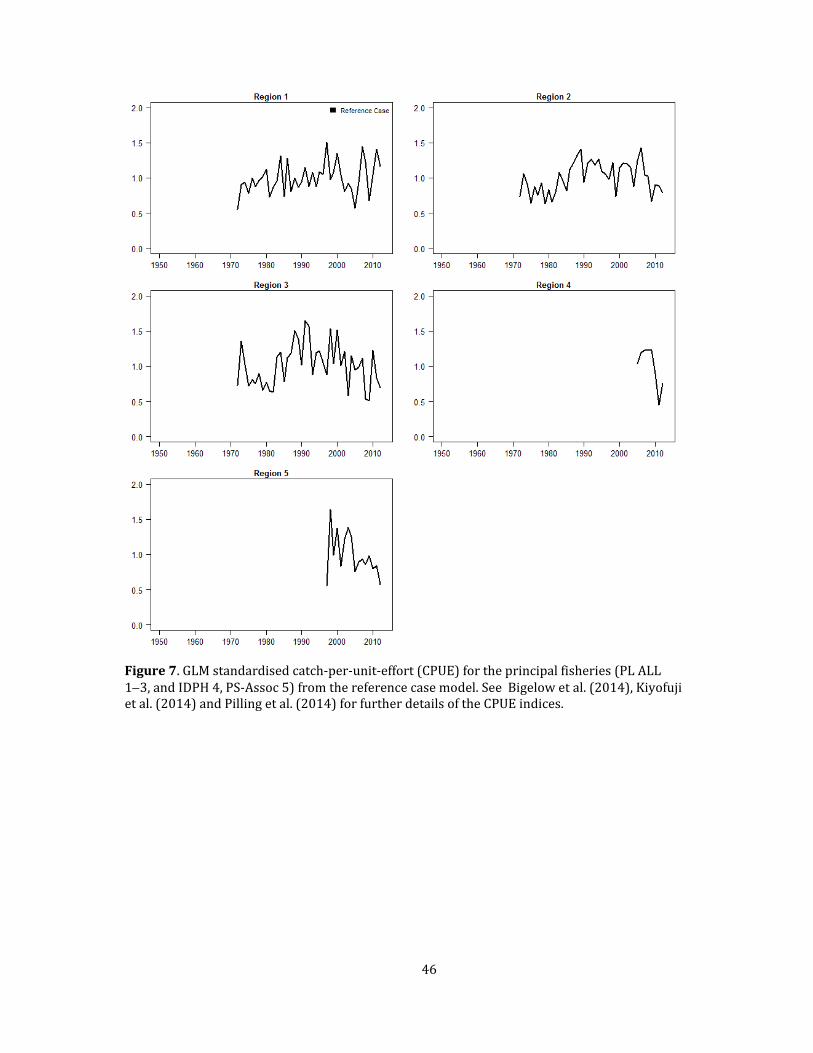
46
Figure7.GLMstandardisedcatch‐per‐unit‐effort(CPUE)fortheprincipalfisheries(PLALL13,andIDPH4,PS‐Assoc5)fromthereferencecasemodel.SeeBigelowetal.(2014),Kiyofujietal.(2014)andPillingetal.(2014)forfurtherdetailsoftheCPUEindices.
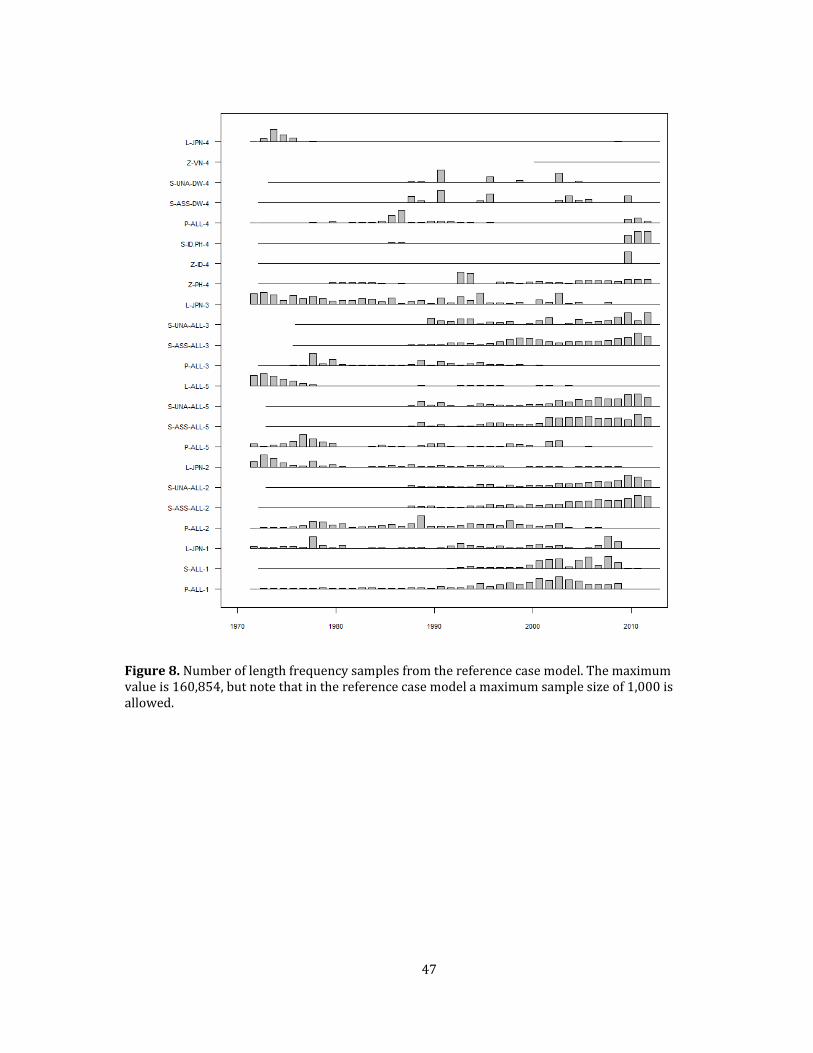
47
Figure8.Numberoflengthfrequencysamplesfromthereferencecasemodel.Themaximumvalueis160,854,butnotethatinthereferencecasemodelamaximumsamplesizeof1,000isallowed.
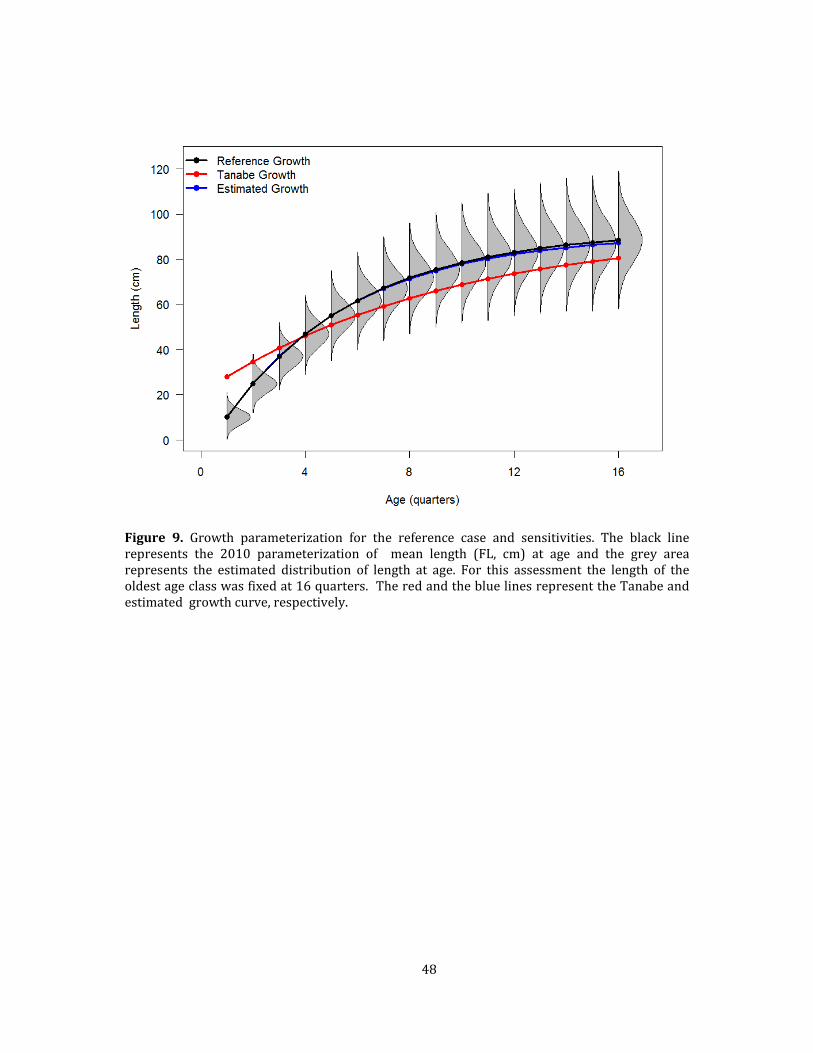
48
Figure 9. Growth parameterization for the reference case and sensitivities. The black linerepresents the 2010 parameterization of mean length (FL, cm) at age and the grey arearepresents the estimated distribution of length at age. For this assessment the length of theoldestageclasswasfixedat16quarters.TheredandthebluelinesrepresenttheTanabeandestimatedgrowthcurve,respectively.
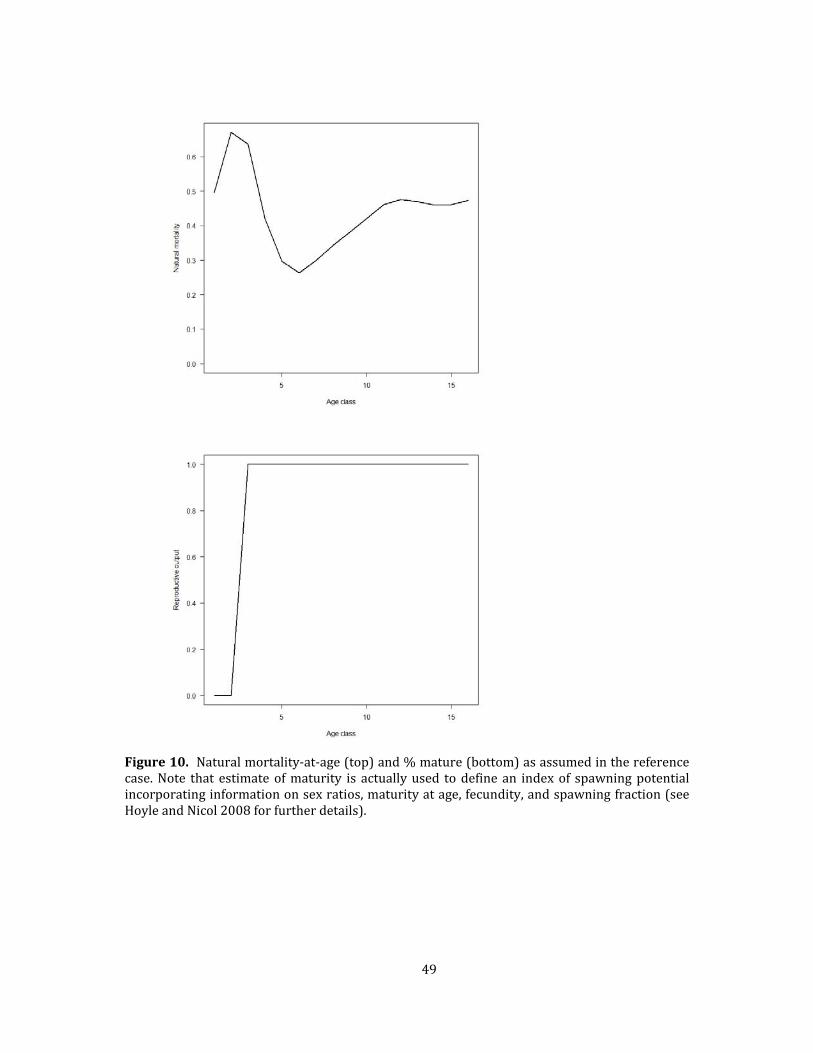
49
Figure10.Naturalmortality‐at‐age(top)and%mature(bottom)asassumedinthereferencecase.Note that estimateofmaturity is actuallyused todefinean indexof spawningpotentialincorporatinginformationonsexratios,maturityatage,fecundity,andspawningfraction(seeHoyleandNicol2008forfurtherdetails).
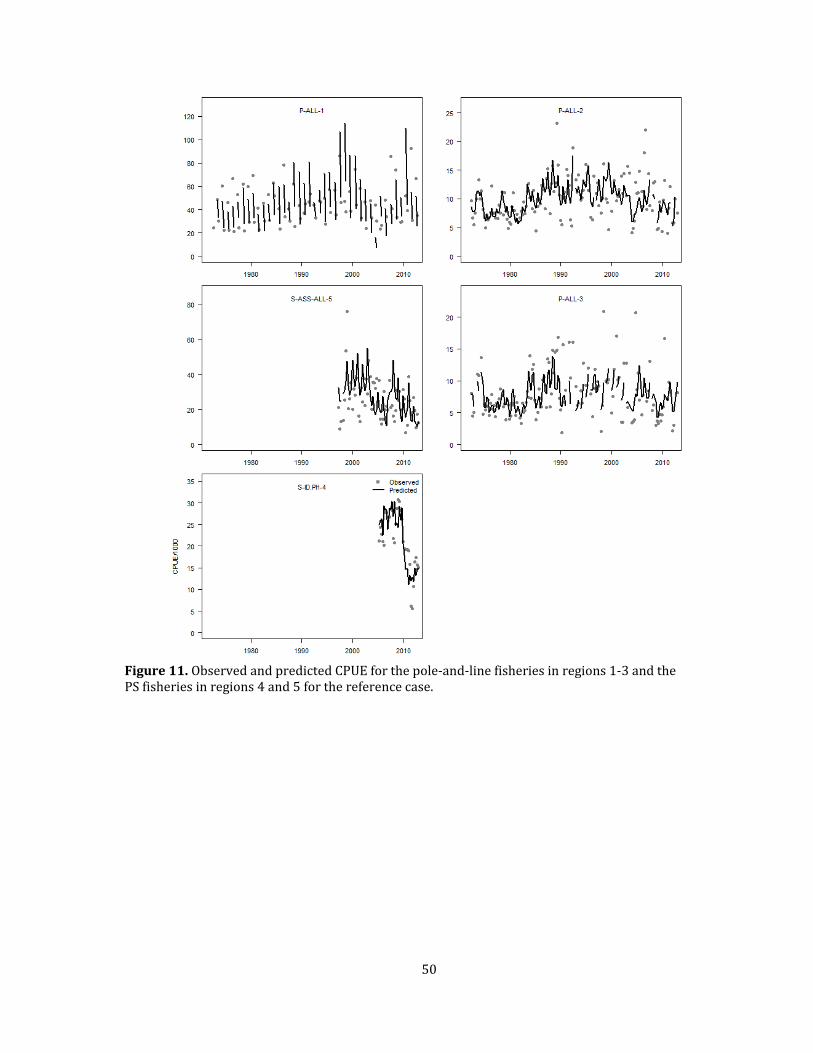
50
Figure11.ObservedandpredictedCPUEforthepole‐and‐linefisheriesinregions1‐3andthePSfisheriesinregions4and5forthereferencecase.

51
Figure12.EffortdeviationsbytimeperiodforeachLL‐ALLfisheryforthereferencecase.Thedarklinerepresentsalowesssmoothedfittotheeffortdeviations.NotethatRegion4didnothaveenoughpointstofitthelowesssmoother.
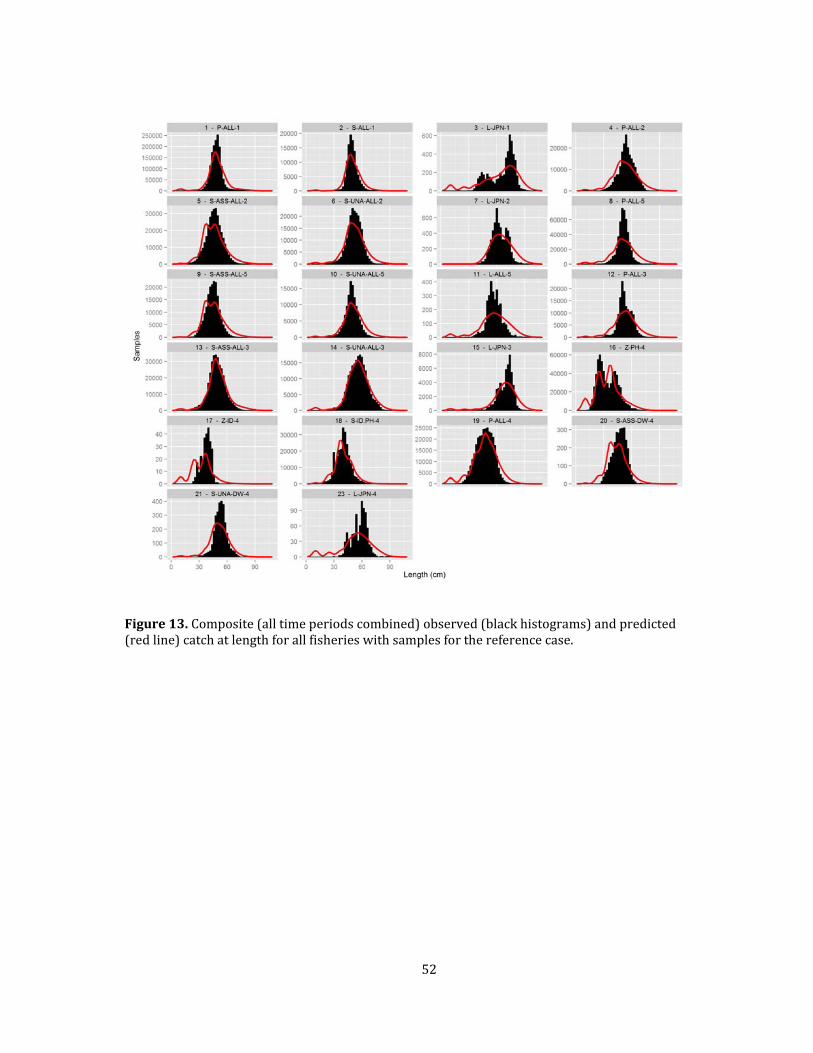
52
Figure13.Composite(alltimeperiodscombined)observed(blackhistograms)andpredicted(redline)catchatlengthforallfisherieswithsamplesforthereferencecase.
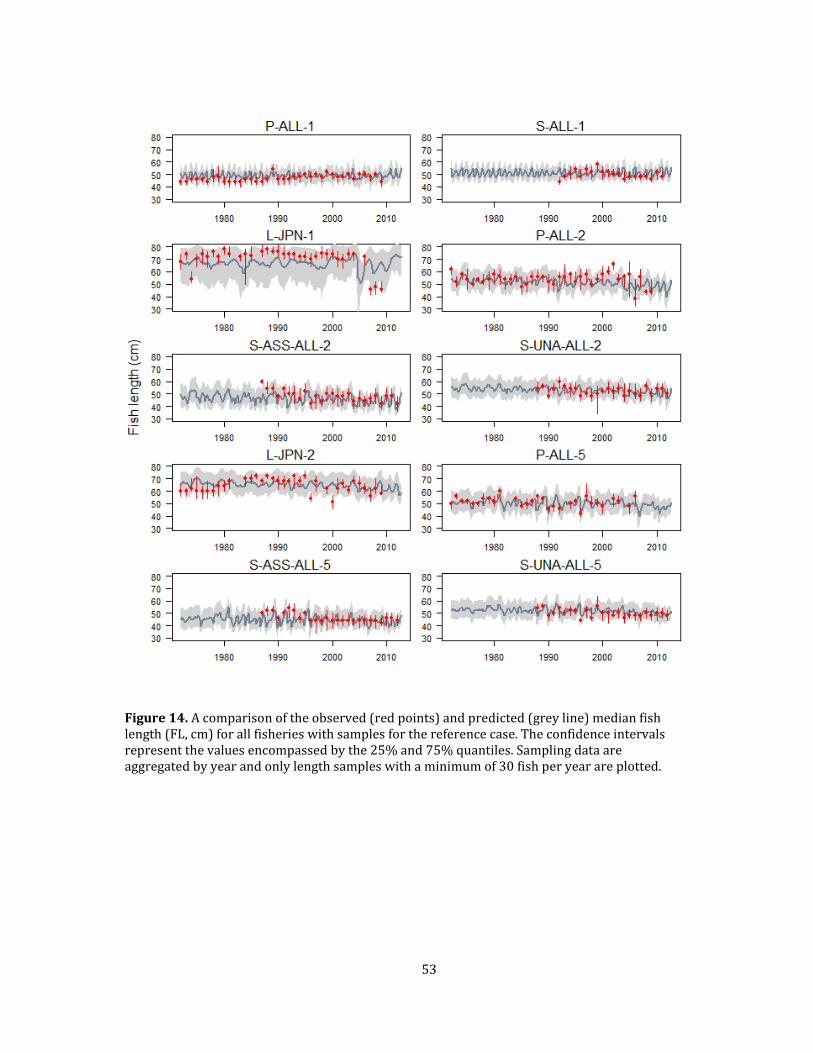
53
Figure14.Acomparisonoftheobserved(redpoints)andpredicted(greyline)medianfishlength(FL,cm)forallfisherieswithsamplesforthereferencecase.Theconfidenceintervalsrepresentthevaluesencompassedbythe25%and75%quantiles.Samplingdataareaggregatedbyyearandonlylengthsampleswithaminimumof30fishperyearareplotted.

54
Figure14.Cont.

55
Figure15.Predictedandobservedrecapturesoftaggedfishbytimeperiodatliberty(quarter)fromtheregionofreleasetotheregionofrecapture.

56
Figure16.Observedrecaptures for thereferencecaseby timeperiodspecific toeachreleaseprogram shown by coloured dots: green = RTTP, blue = PTTP red = SSAP, light blue JP. Themodel(blackline)isfittedtothetotalobservedrecapturesinatimeperiod(blackcircles),thataremadeupofthesumoftheprogram‐specificrecapturesoccurringinthattimeperiod,henceadotandcirclewillcoincideifrecapturesarederivedfromonlyoneprogram.
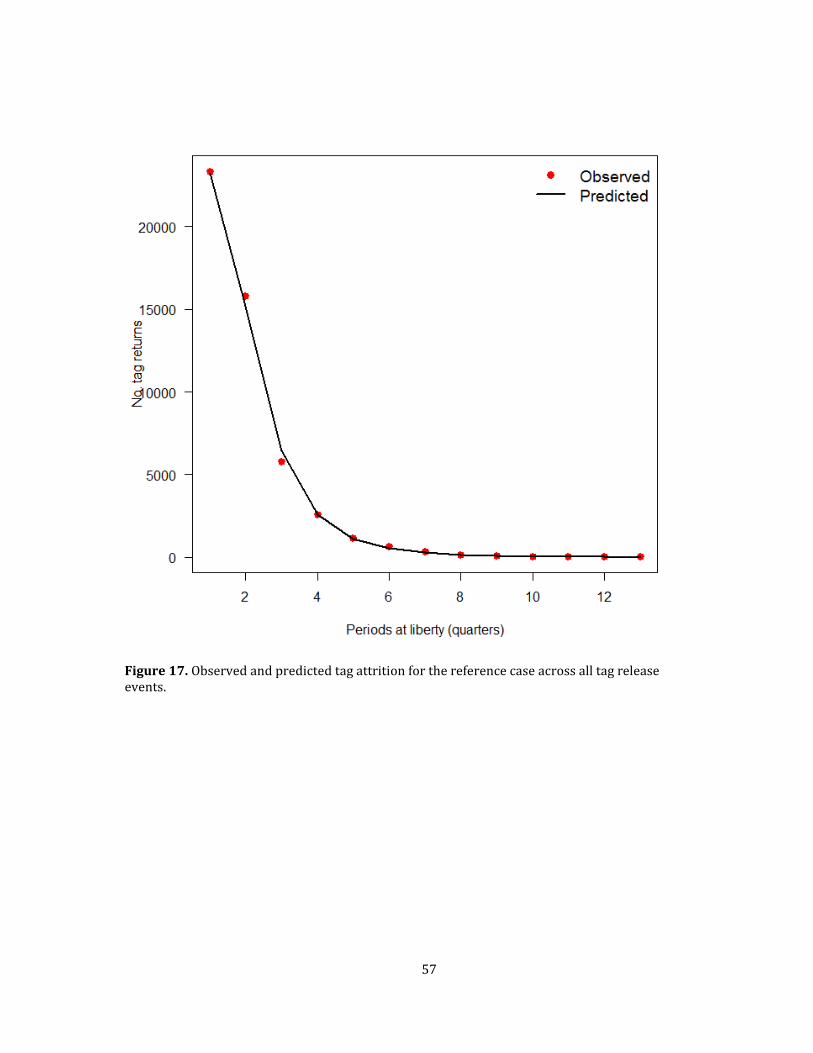
57
Figure17.Observedandpredictedtagattritionforthereferencecaseacrossalltagreleaseevents.
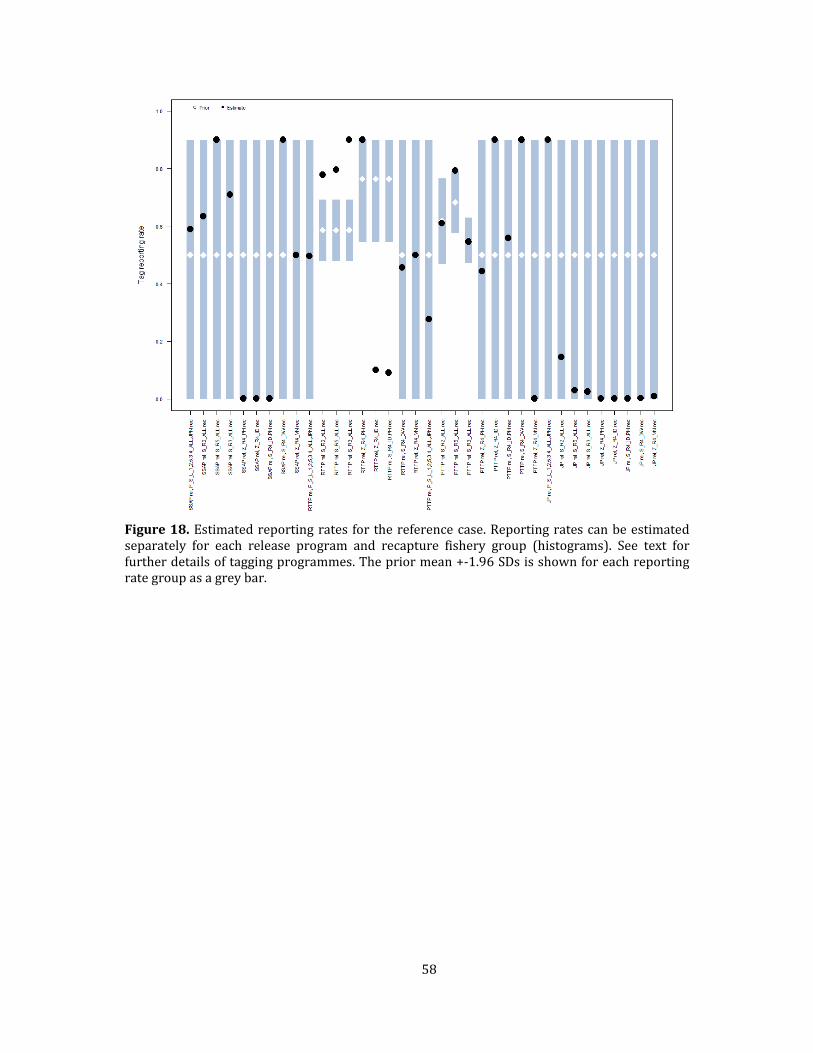
58
Figure18.Estimatedreportingrates for thereferencecase.Reportingratescanbeestimatedseparately for each release program and recapture fishery group (histograms). See text forfurtherdetailsoftaggingprogrammes.Thepriormean+‐1.96SDsisshownforeachreportingrategroupasagreybar.

59
Figure19.Selectivitycoefficientsbyfishery.
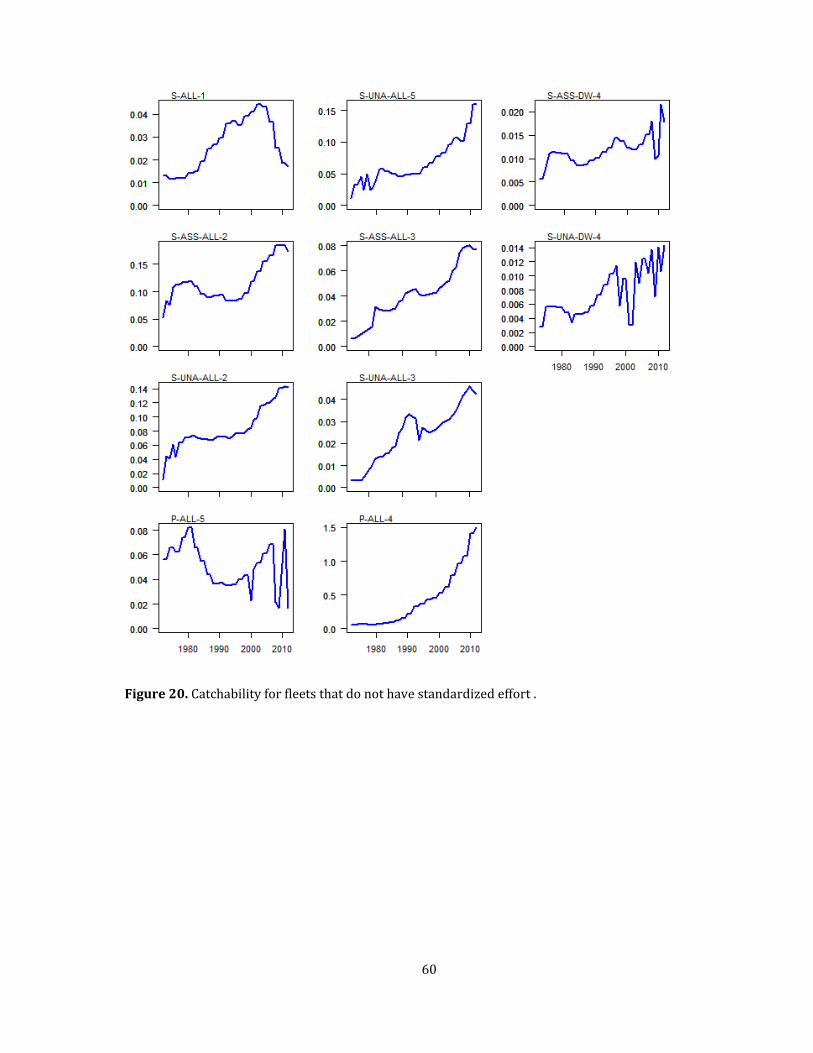
60
Figure20.Catchabilityforfleetsthatdonothavestandardizedeffort.
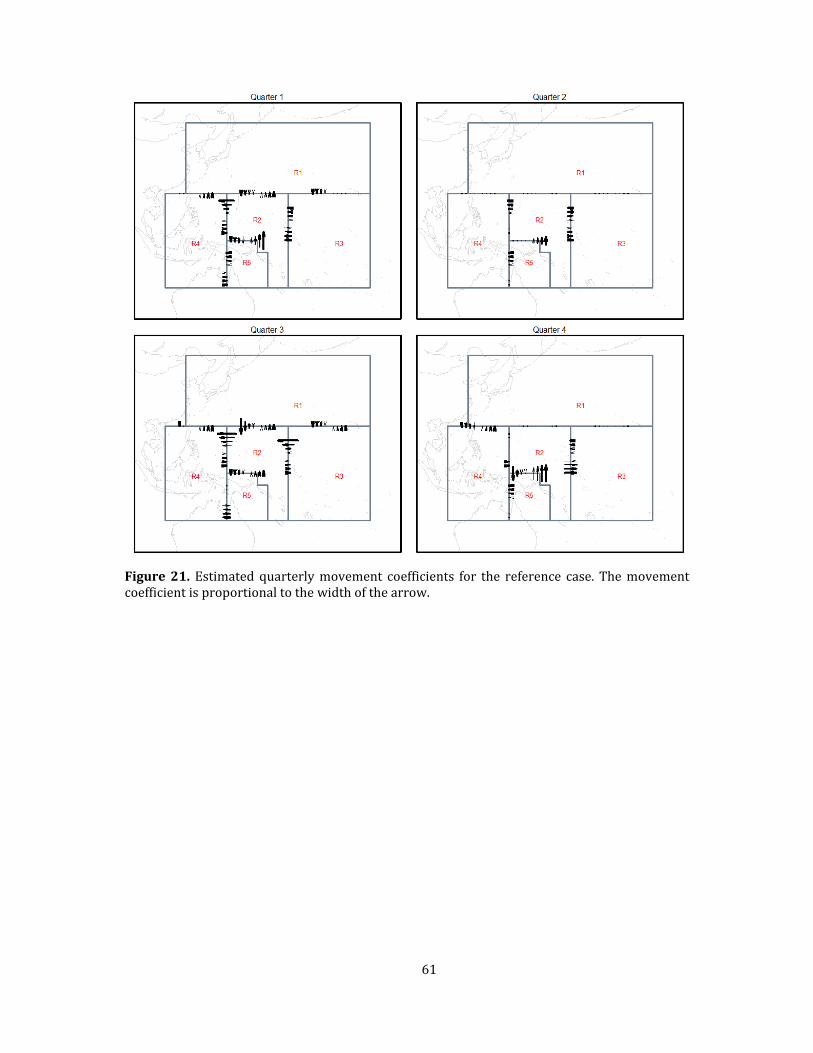
61
Figure21. Estimated quarterlymovement coefficients for the reference case. Themovementcoefficientisproportionaltothewidthofthearrow.
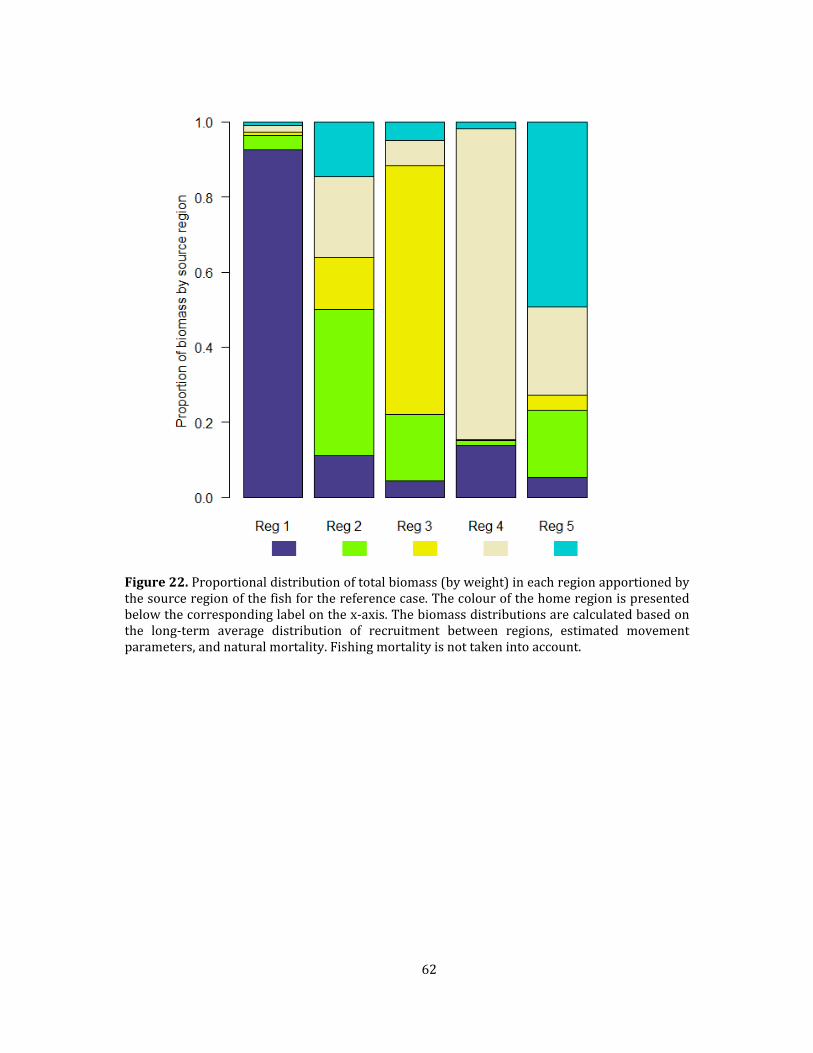
62
Figure22.Proportionaldistributionoftotalbiomass(byweight)ineachregionapportionedbythesourceregionofthefishforthereferencecase.Thecolourofthehomeregionispresentedbelowthecorrespondinglabelonthex‐axis.Thebiomassdistributionsarecalculatedbasedonthe long‐term average distribution of recruitment between regions, estimated movementparameters,andnaturalmortality.Fishingmortalityisnottakenintoaccount.
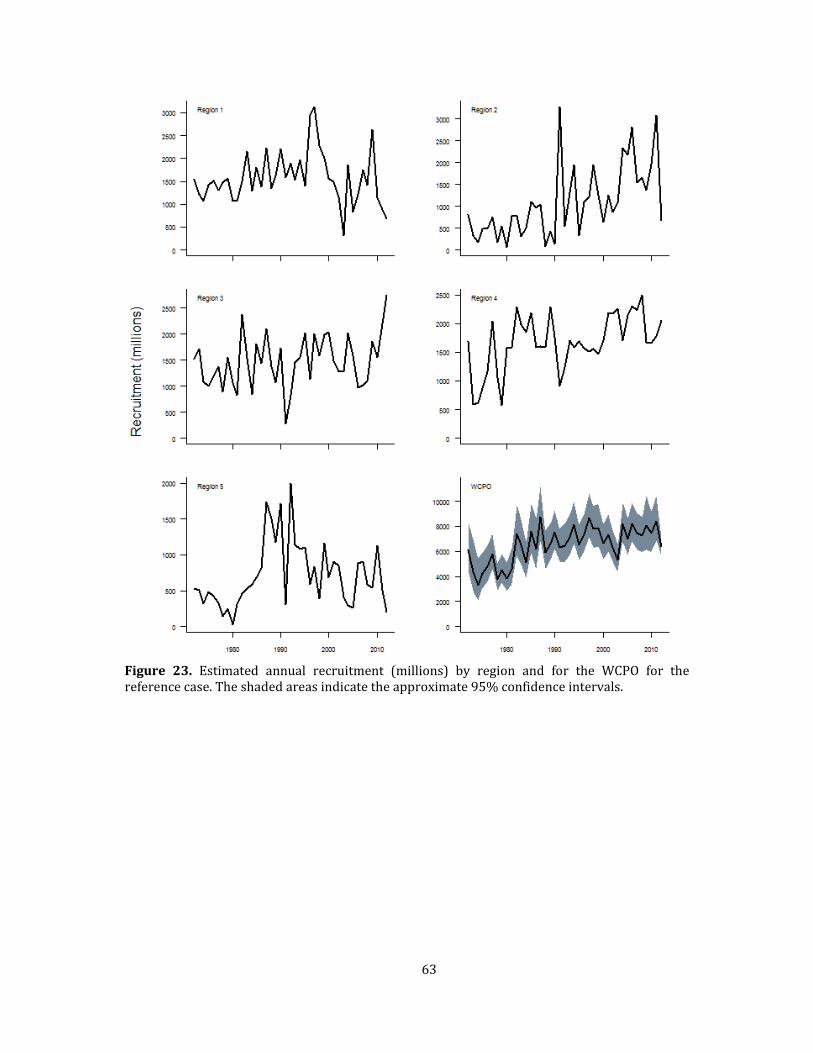
63
Figure 23. Estimated annual recruitment (millions) by region and for the WCPO for thereferencecase.Theshadedareasindicatetheapproximate95%confidenceintervals.
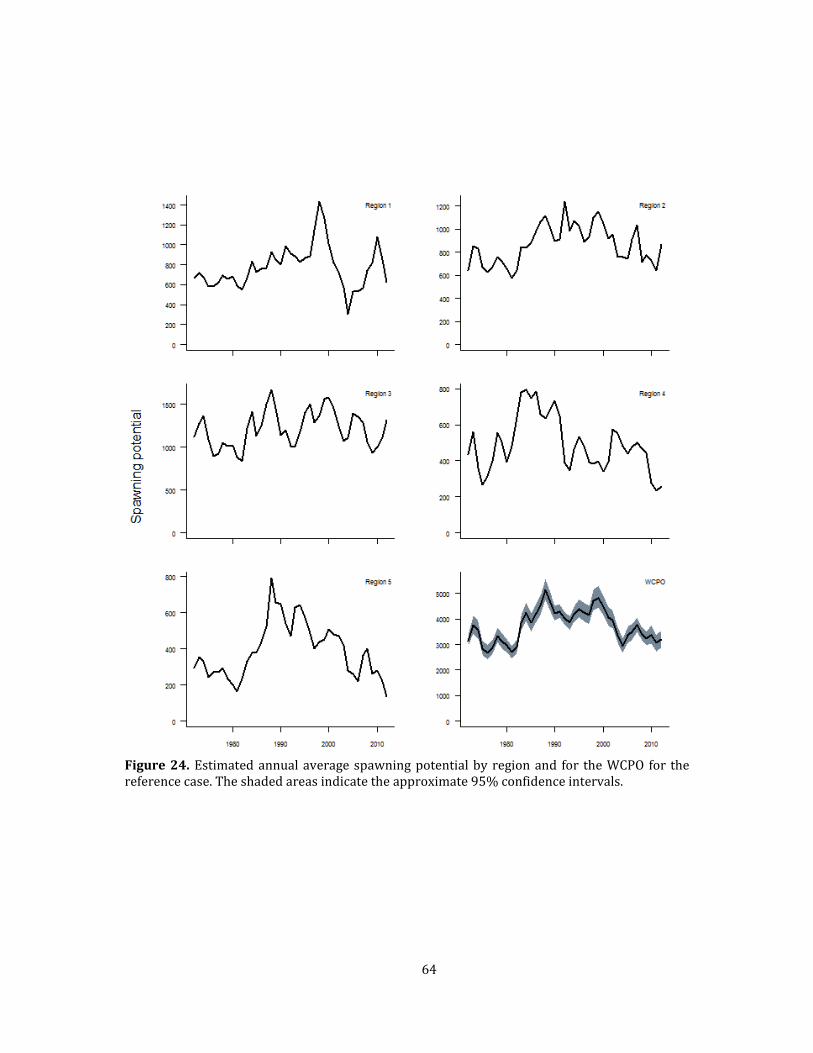
64
Figure24.Estimatedannualaveragespawningpotentialbyregionand for theWCPO for thereferencecase.Theshadedareasindicatetheapproximate95%confidenceintervals.
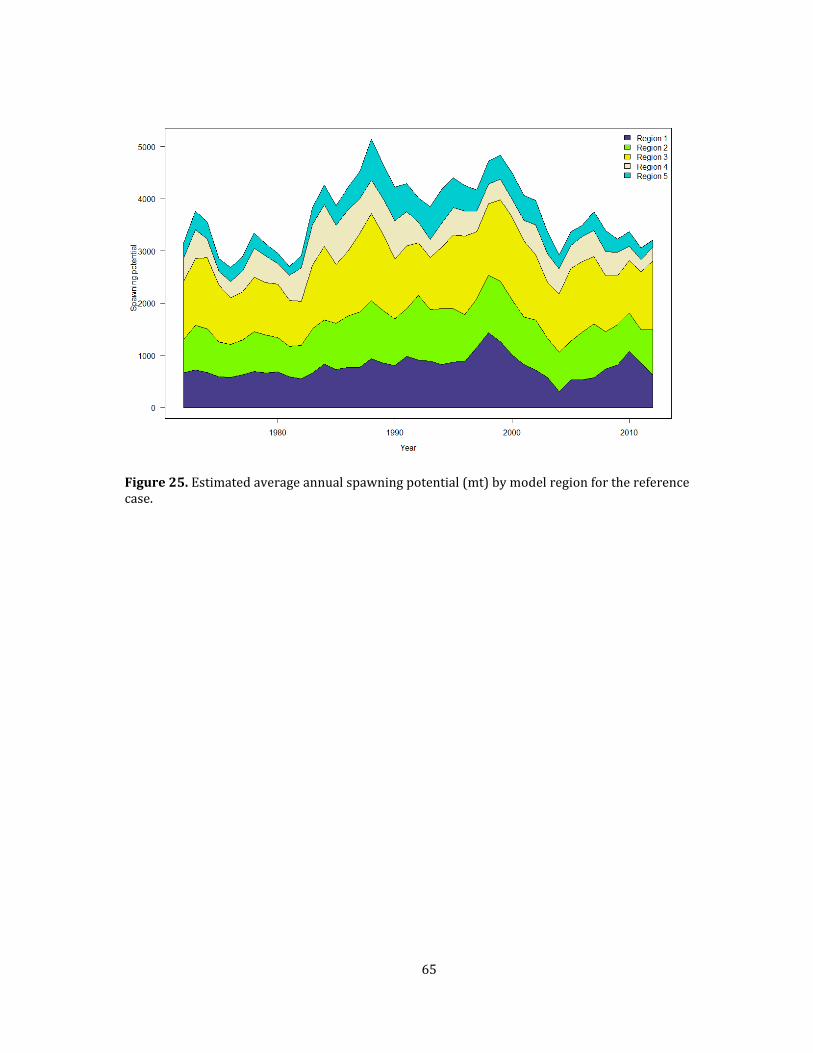
65
Figure25.Estimatedaverageannualspawningpotential(mt)bymodelregionforthereferencecase.

66
Figure26.EstimatedannualaveragejuvenileandadultfishingmortalityfortheWCPOforthereferencecase.
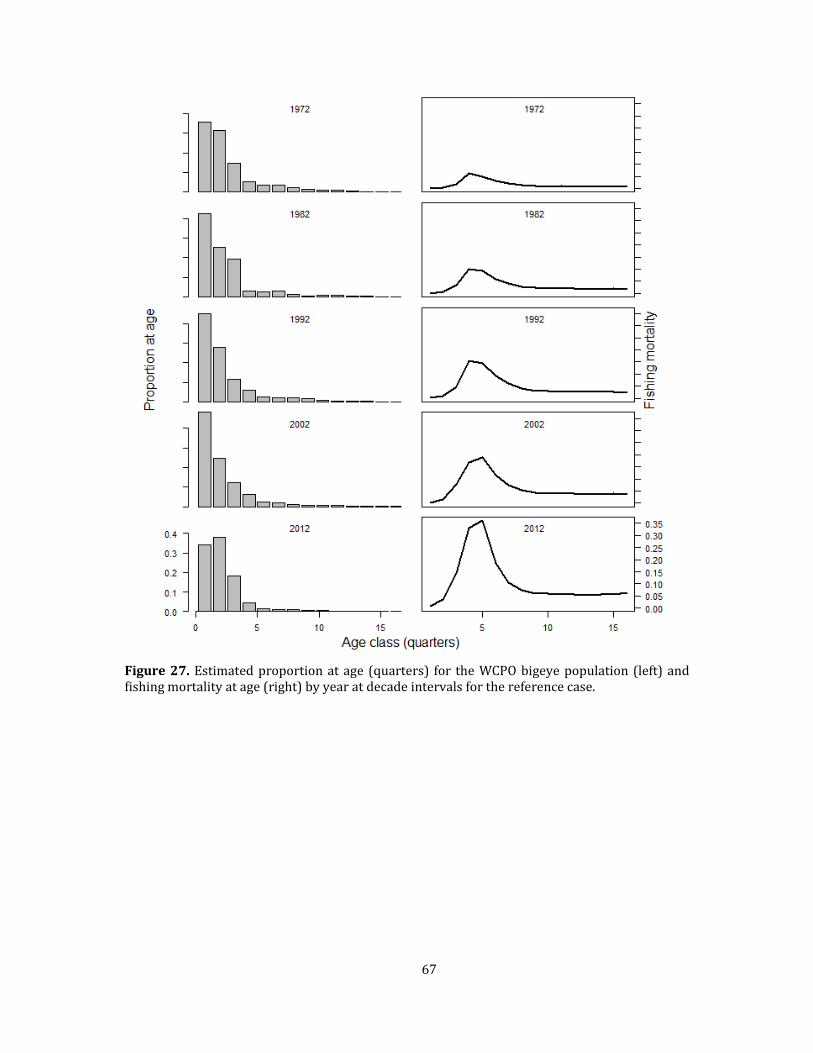
67
Figure27.Estimatedproportionatage (quarters) for theWCPObigeyepopulation(left)andfishingmortalityatage(right)byyearatdecadeintervalsforthereferencecase.
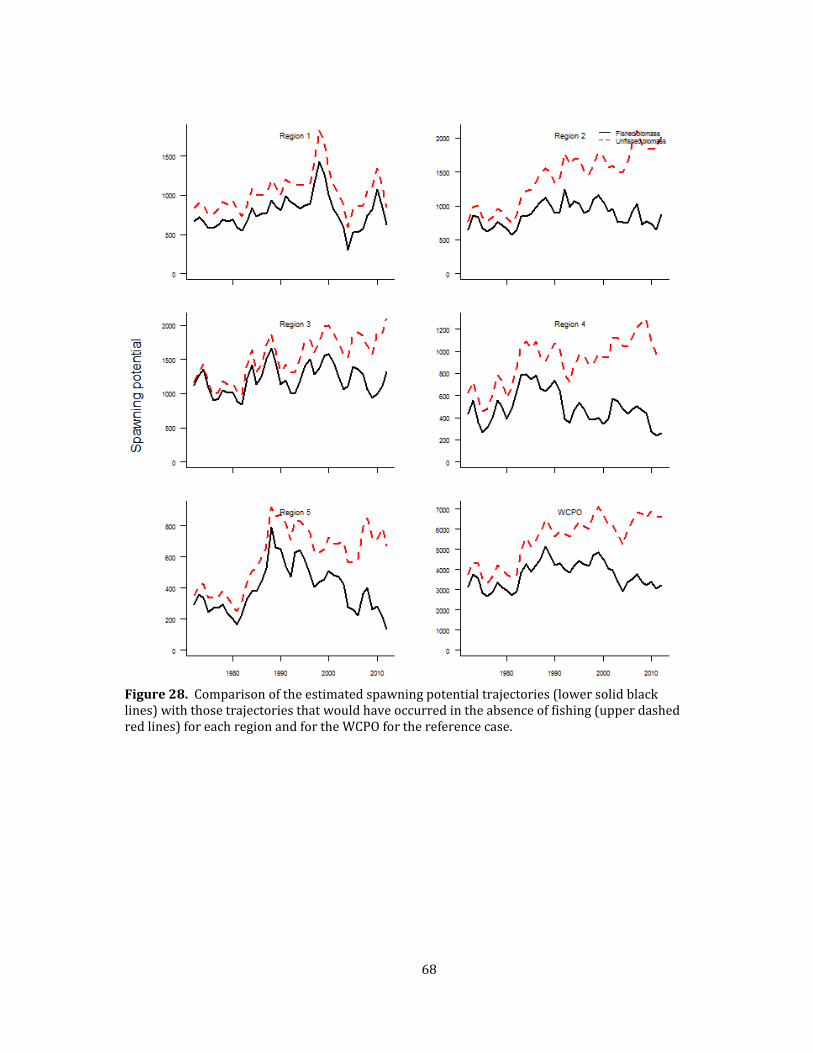
68
Figure28.Comparisonoftheestimatedspawningpotentialtrajectories(lowersolidblacklines)withthosetrajectoriesthatwouldhaveoccurredintheabsenceoffishing(upperdashedredlines)foreachregionandfortheWCPOforthereferencecase.

69
Figure29.Ratiosofexploitedtounexploitedspawningpotential / foreachregionandtheWCPOforthereferencecase.
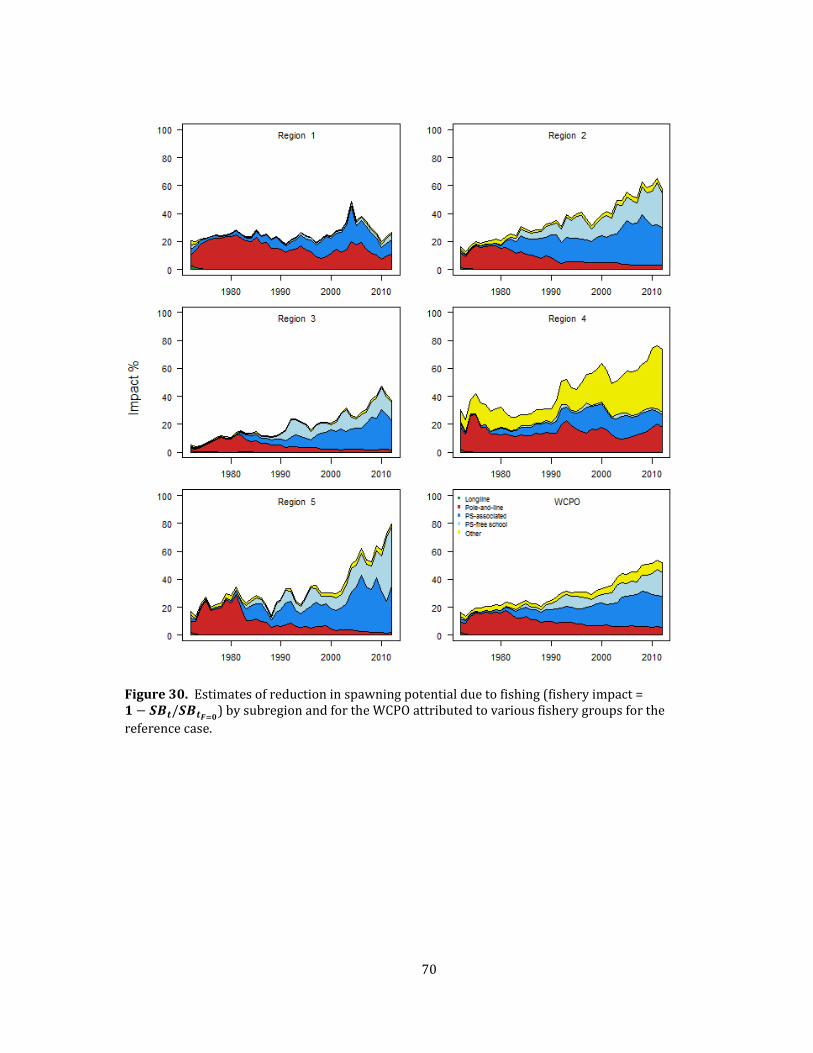
70
Figure30.Estimatesofreductioninspawningpotentialduetofishing(fisheryimpact=/ )bysubregionandfortheWCPOattributedtovariousfisherygroupsforthe
referencecase.
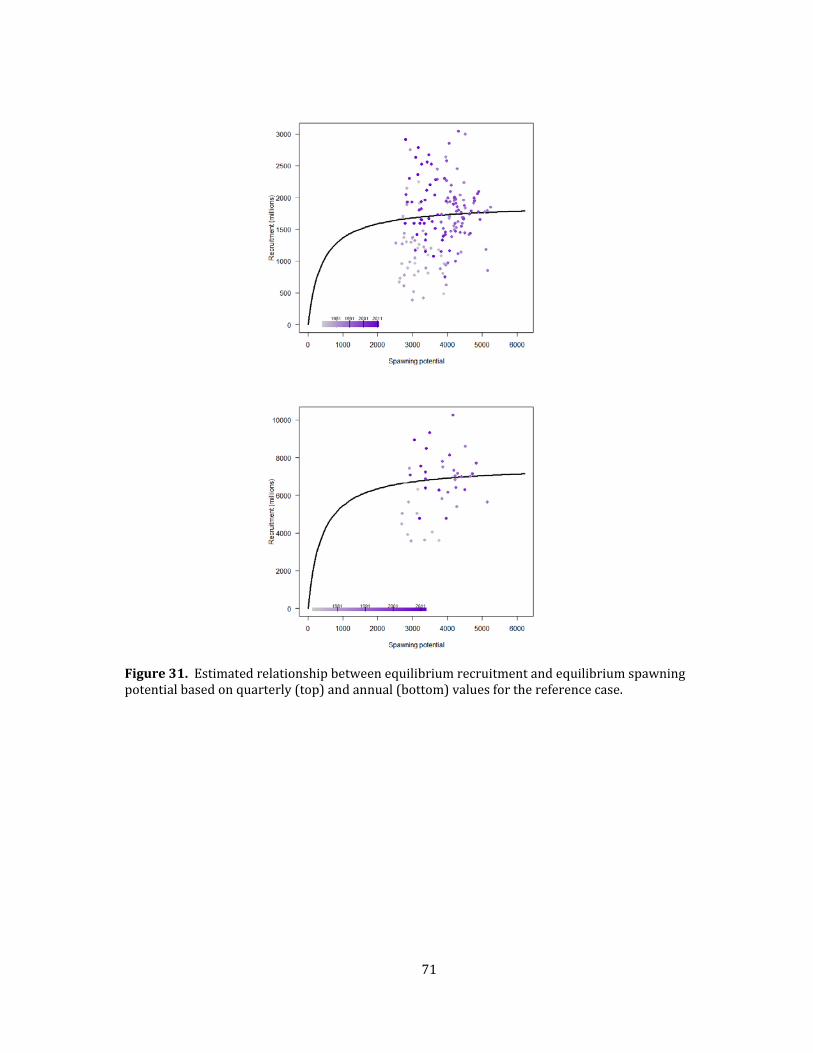
71
Figure31.Estimatedrelationshipbetweenequilibriumrecruitmentandequilibriumspawningpotentialbasedonquarterly(top)andannual(bottom)valuesforthereferencecase.
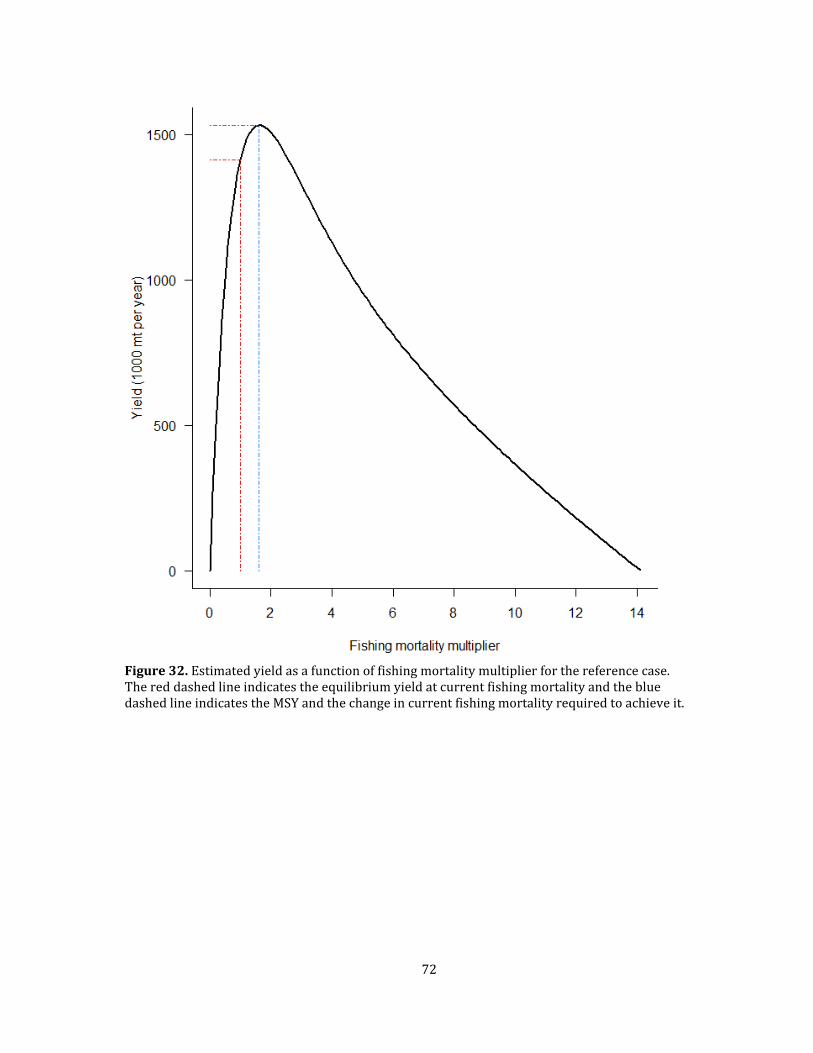
72
Figure32.Estimatedyieldasafunctionoffishingmortalitymultiplierforthereferencecase.ThereddashedlineindicatestheequilibriumyieldatcurrentfishingmortalityandthebluedashedlineindicatestheMSYandthechangeincurrentfishingmortalityrequiredtoachieveit.

73
Figure33.HistoryoftheannualestimatesofMSY(redline)comparedwithannualcatchsplitintothreesectorsforthereferencecase.
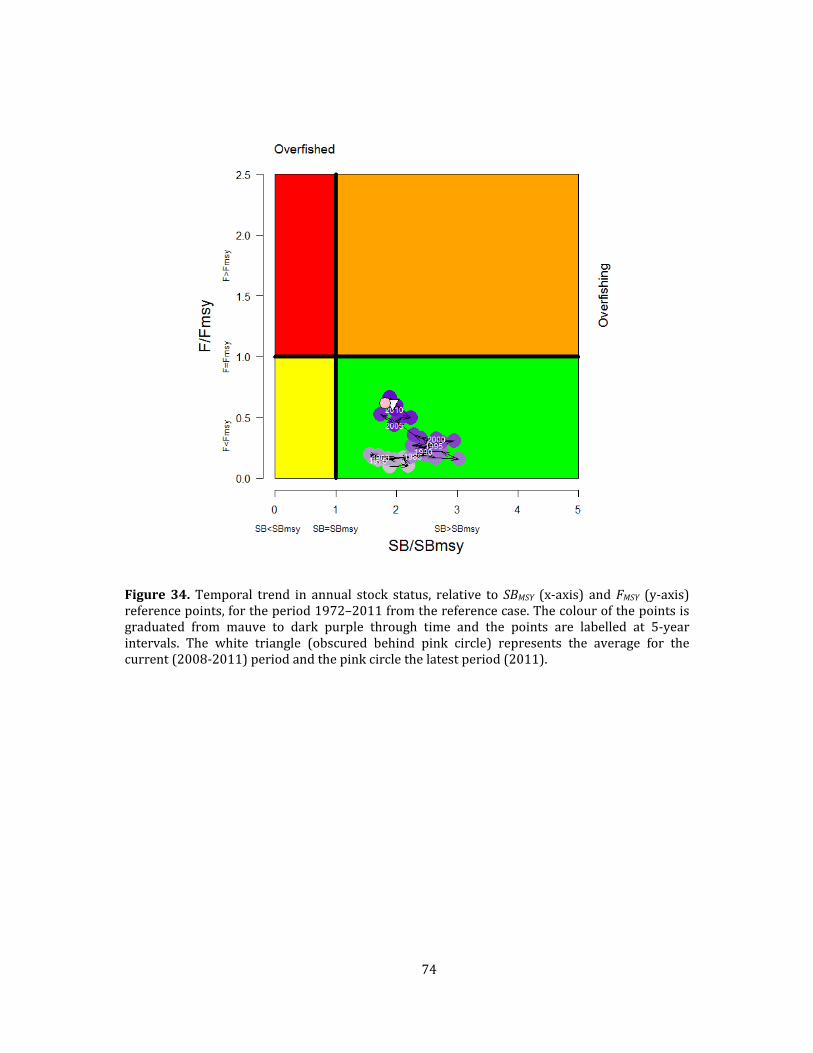
74
Figure34. Temporal trend in annual stock status, relative to SBMSY (x‐axis) andFMSY (y‐axis)referencepoints,fortheperiod1972–2011fromthereferencecase.Thecolourofthepointsisgraduated from mauve to dark purple through time and the points are labelled at 5‐yearintervals. The white triangle (obscured behind pink circle) represents the average for thecurrent(2008‐2011)periodandthepinkcirclethelatestperiod(2011).
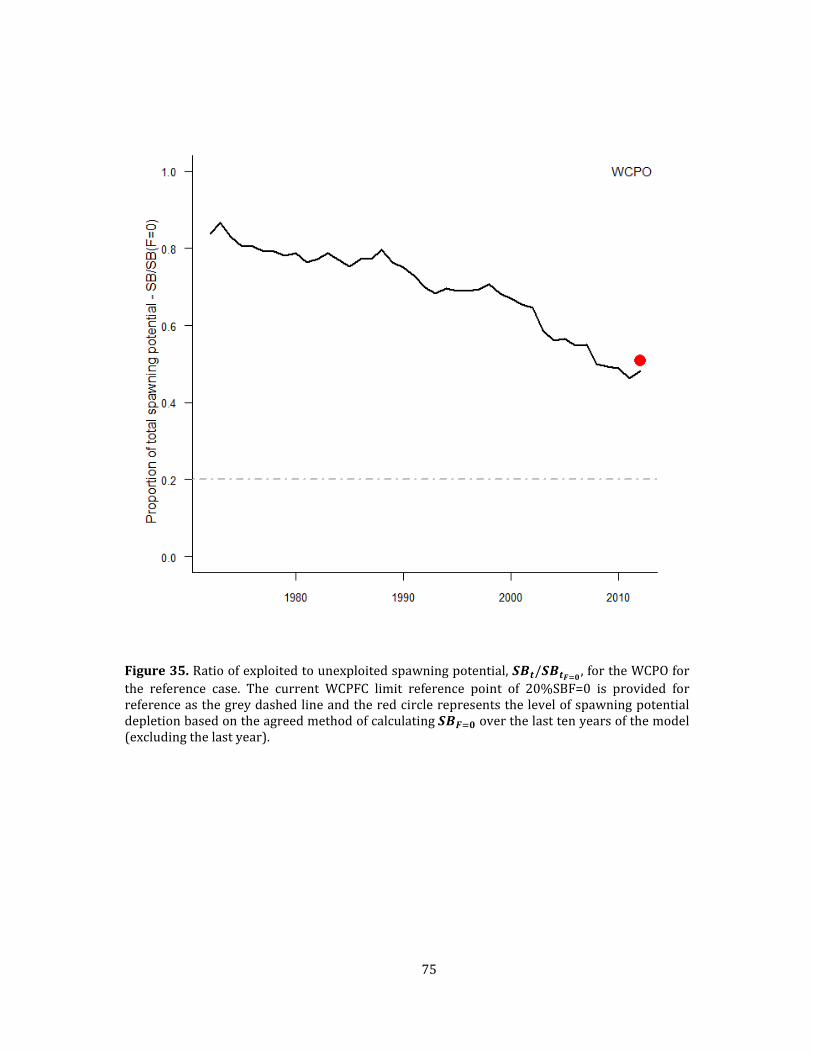
75
Figure35.Ratioofexploitedtounexploitedspawningpotential, / ,fortheWCPOforthe reference case. The current WCPFC limit reference point of 20%SBF=0 is provided forreferenceasthegreydashedlineandtheredcirclerepresentsthelevelofspawningpotentialdepletionbasedontheagreedmethodofcalculating overthelasttenyearsofthemodel(excludingthelastyear).
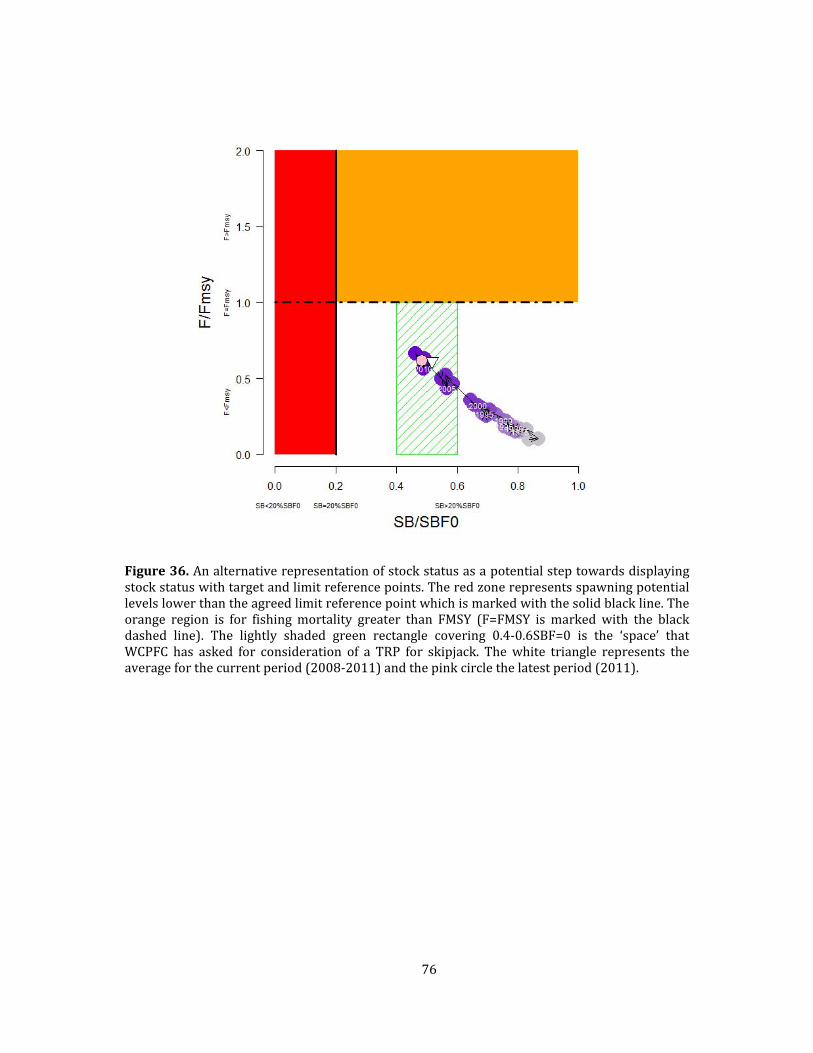
76
Figure36.Analternativerepresentationofstockstatusasapotentialsteptowardsdisplayingstockstatuswithtargetandlimitreferencepoints.Theredzonerepresentsspawningpotentiallevelslowerthantheagreedlimitreferencepointwhichismarkedwiththesolidblackline.Theorange region is for fishingmortality greater than FMSY (F=FMSY ismarked with the blackdashed line). The lightly shaded green rectangle covering 0.4‐0.6SBF=0 is the ‘space’ thatWCPFC has asked for consideration of a TRP for skipjack. Thewhite triangle represents theaverageforthecurrentperiod(2008‐2011)andthepinkcirclethelatestperiod(2011).
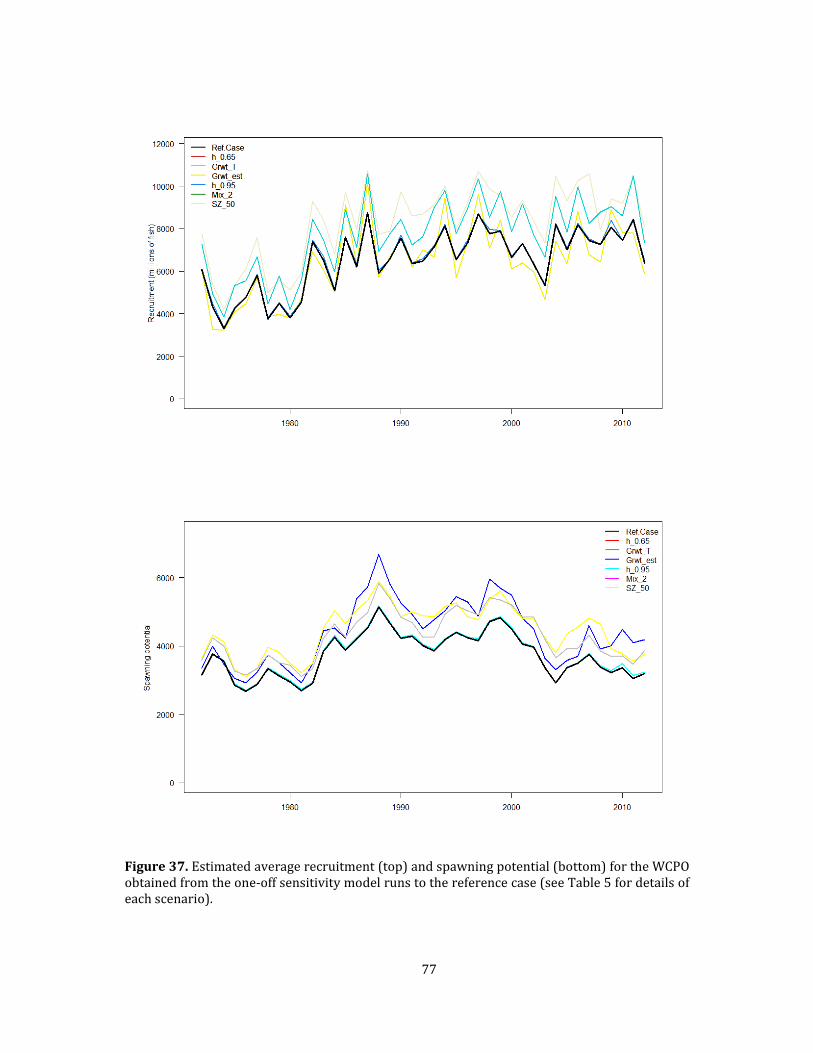
77
Figure37.Estimatedaveragerecruitment(top)andspawningpotential(bottom)fortheWCPOobtainedfromtheone‐offsensitivitymodelrunstothereferencecase(seeTable5fordetailsofeachscenario).
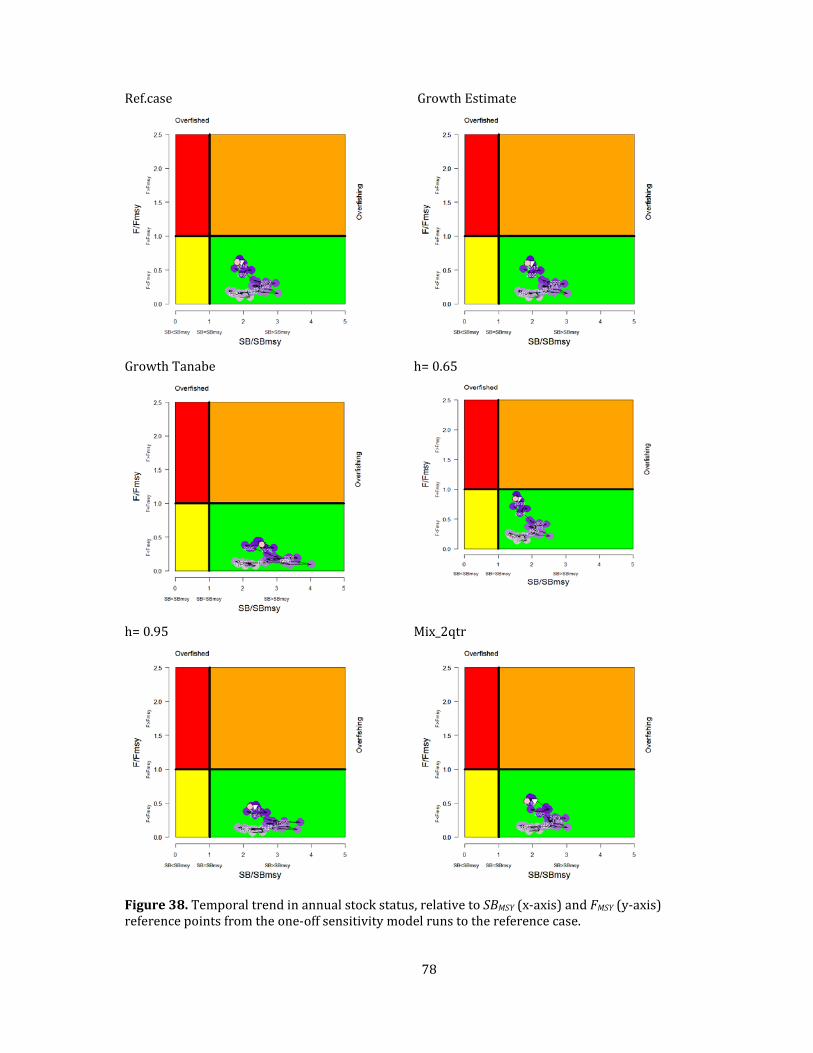
78
Ref.case
GrowthEstimate
GrowthTanabe
h=0.65
h=0.95
Mix_2qtr
Figure38.Temporaltrendinannualstockstatus,relativetoSBMSY(x‐axis)andFMSY(y‐axis)referencepointsfromtheone‐offsensitivitymodelrunstothereferencecase.
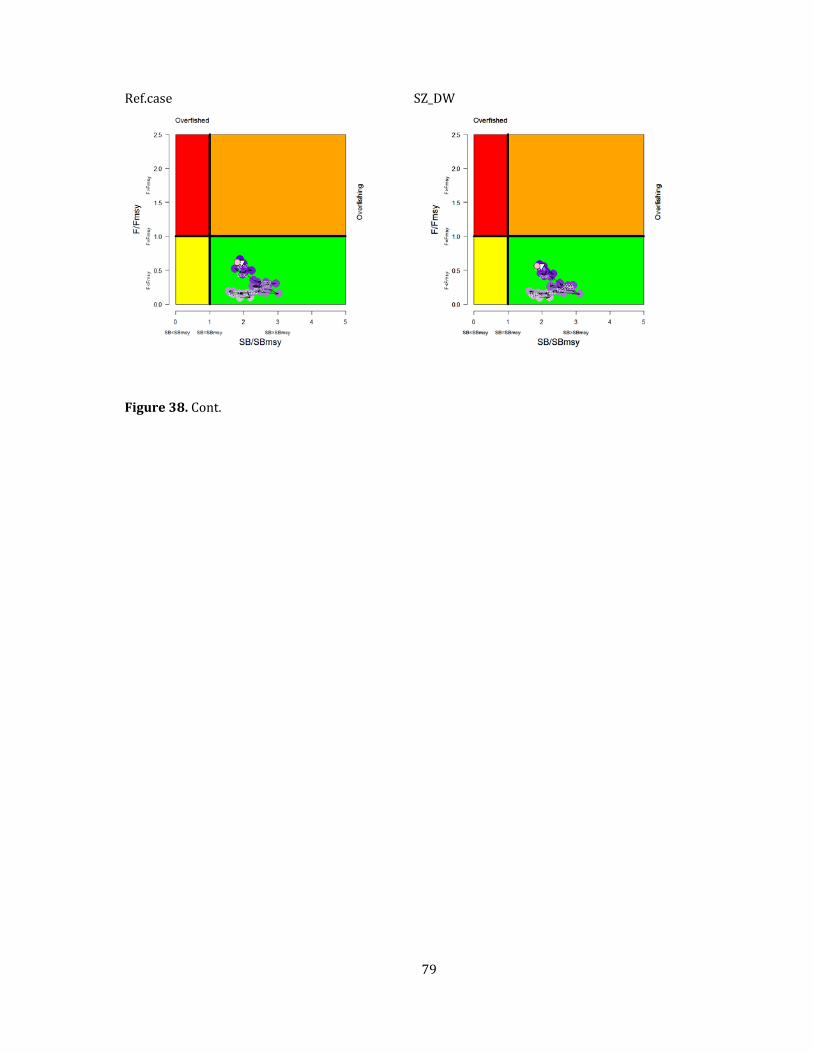
79
Ref.case
SZ_DW
Figure38.Cont.
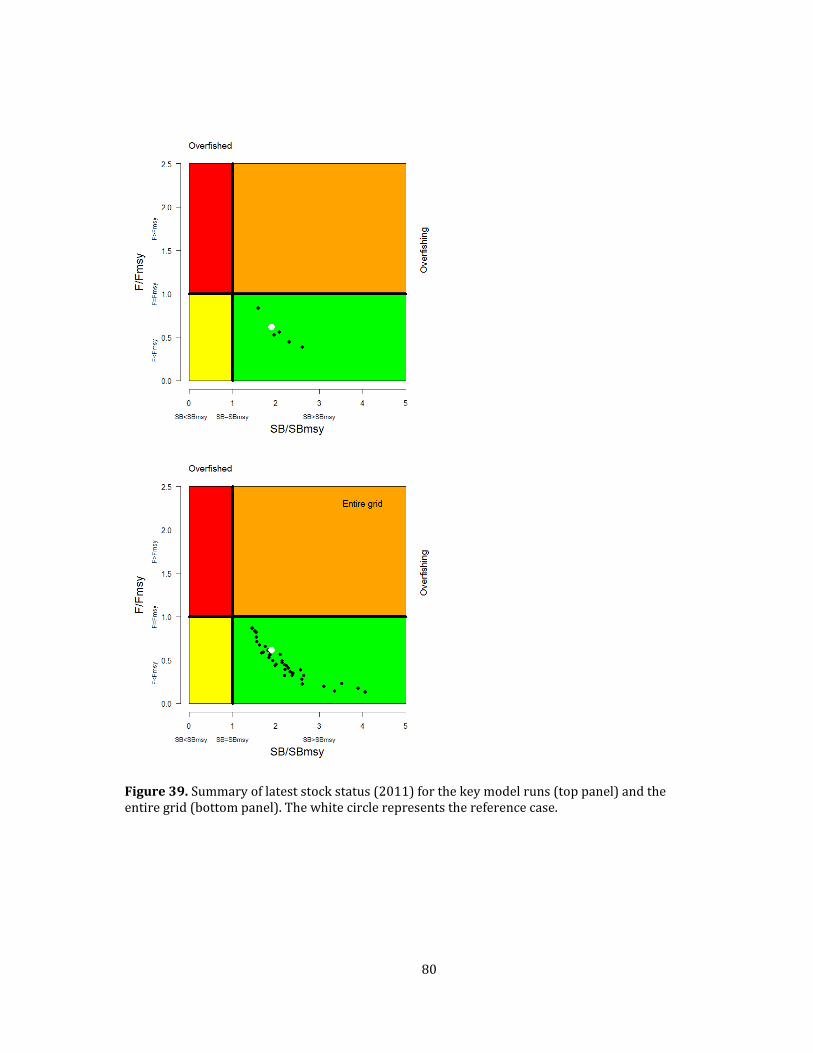
80
Figure39.Summaryoflateststockstatus(2011)forthekeymodelruns(toppanel)andtheentiregrid(bottompanel).Thewhitecirclerepresentsthereferencecase.
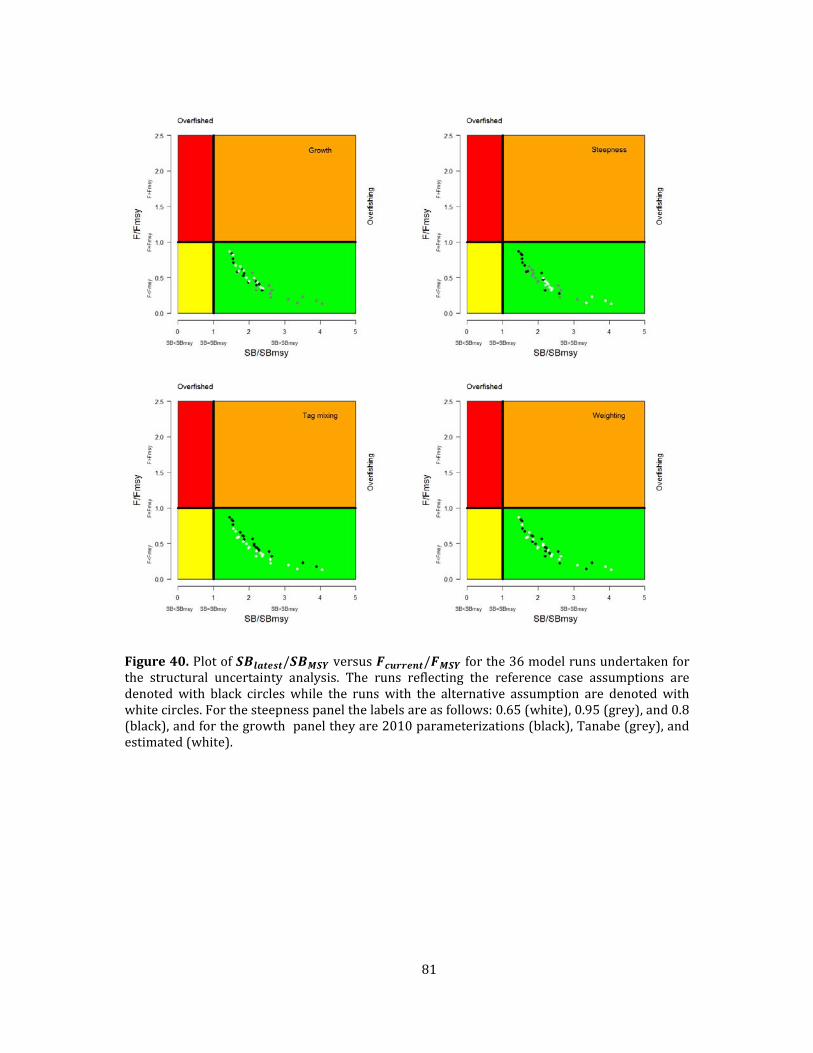
81
Figure40.Plotof / versus / forthe36modelrunsundertakenforthe structural uncertainty analysis. The runs reflecting the reference case assumptions aredenoted with black circleswhile the runs with the alternative assumption are denoted withwhitecircles.Forthesteepnesspanelthelabelsareasfollows:0.65(white),0.95(grey),and0.8(black),andforthegrowthpaneltheyare2010parameterizations(black),Tanabe(grey),andestimated(white).

82
Figure 41. Box plots showing of the effects of the different factors within the structuraluncertaintyanalysisgridon / .

83
Figure 42. Box plots showing of the effects of the different factors within the structuraluncertaintyanalysisgridon / .
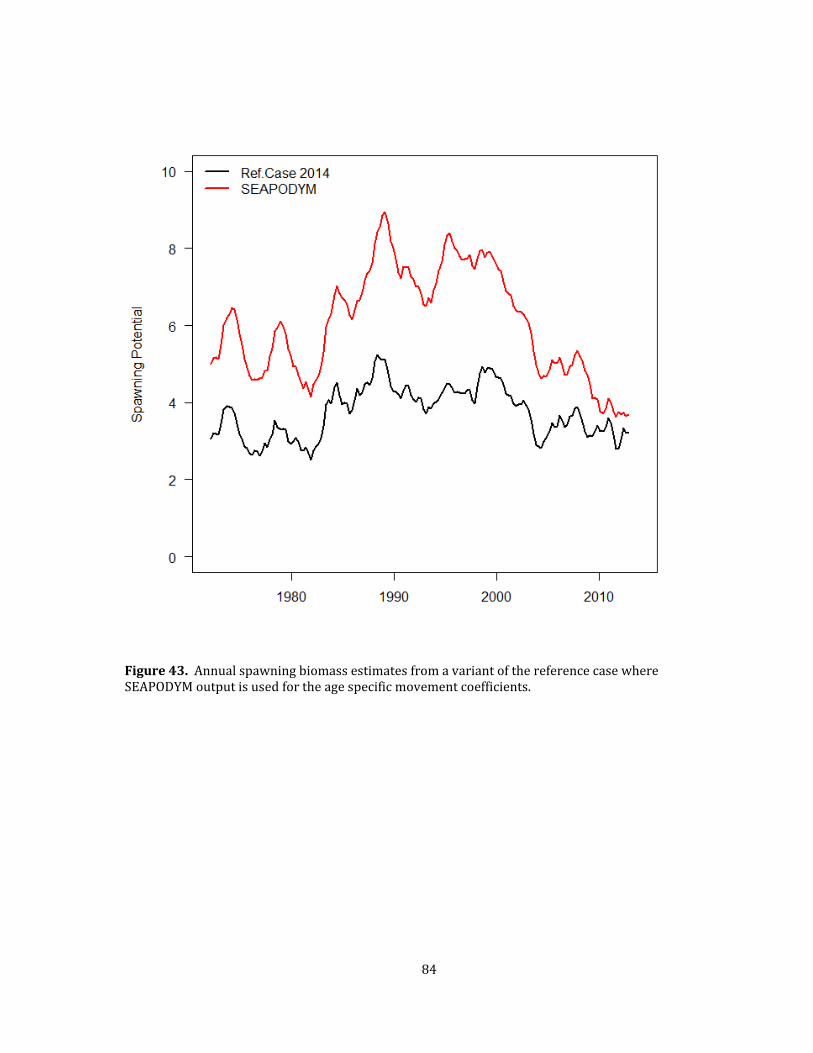
84
Figure43.AnnualspawningbiomassestimatesfromavariantofthereferencecasewhereSEAPODYMoutputisusedfortheagespecificmovementcoefficients.
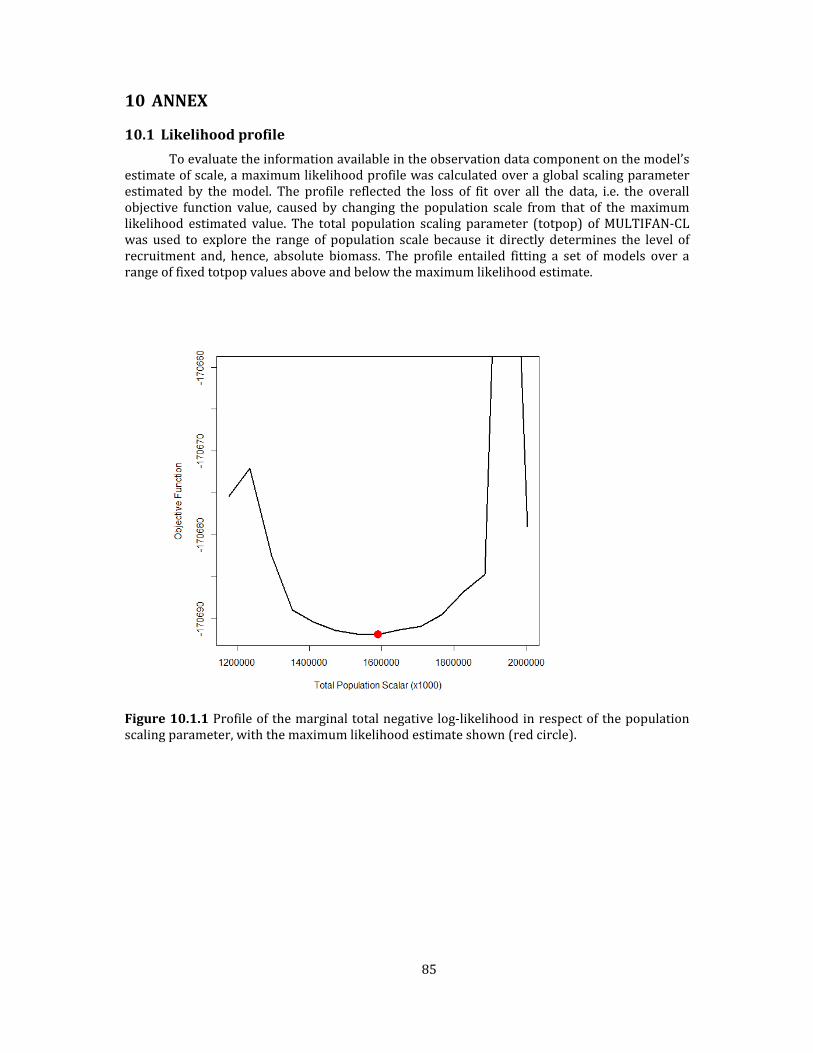
85
10 ANNEX
10.1 Likelihoodprofile
Toevaluatetheinformationavailableintheobservationdatacomponentonthemodel’sestimateofscale,amaximumlikelihoodprofilewascalculatedoveraglobalscalingparameterestimated by themodel. The profile reflected the loss of fit over all the data, i.e. the overallobjective function value, caused by changing the population scale from that of themaximumlikelihood estimated value. The total population scaling parameter (totpop) ofMULTIFAN‐CLwasused to explore the range of population scale because it directly determines the level ofrecruitment and, hence, absolute biomass. The profile entailed fitting a set ofmodels over arangeoffixedtotpopvaluesaboveandbelowthemaximumlikelihoodestimate.
Figure10.1.1Profileofthemarginaltotalnegativelog‐likelihoodinrespectofthepopulationscalingparameter,withthemaximumlikelihoodestimateshown(redcircle).
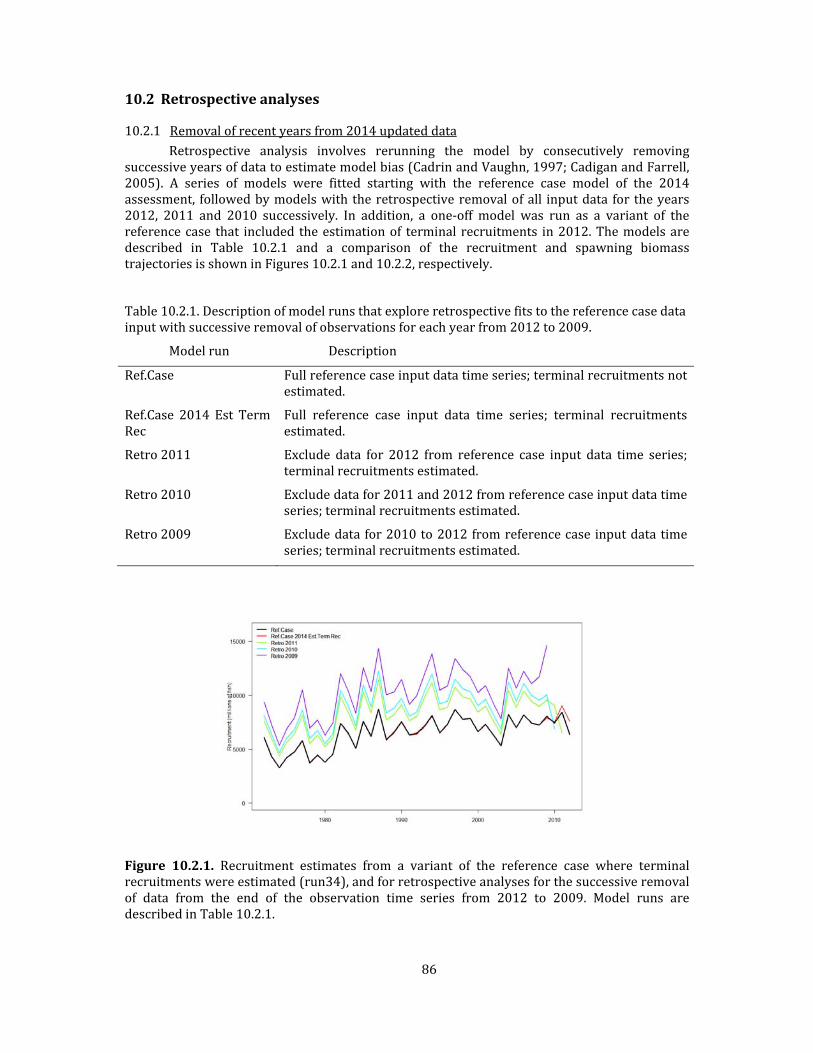
86
10.2 Retrospectiveanalyses
10.2.1 Removalofrecentyearsfrom2014updateddataRetrospective analysis involves rerunning the model by consecutively removing
successiveyearsofdatatoestimatemodelbias(CadrinandVaughn,1997;CadiganandFarrell,2005). A series of models were fitted starting with the reference case model of the 2014assessment, followedbymodelswiththeretrospectiveremovalofall inputdata for theyears2012, 2011 and 2010 successively. In addition, a one‐off model was run as a variant of thereferencecase that included theestimationof terminal recruitments in2012.Themodelsaredescribed in Table 10.2.1 and a comparison of the recruitment and spawning biomasstrajectoriesisshowninFigures10.2.1and10.2.2,respectively.
Table10.2.1.Descriptionofmodelrunsthatexploreretrospectivefitstothereferencecasedatainputwithsuccessiveremovalofobservationsforeachyearfrom2012to2009.
Modelrun Description
Ref.Case Fullreferencecaseinputdatatimeseries;terminalrecruitmentsnotestimated.
Ref.Case 2014 Est TermRec
Full reference case input data time series; terminal recruitmentsestimated.
Retro2011 Exclude data for 2012 from reference case input data time series;terminalrecruitmentsestimated.
Retro2010 Excludedatafor2011and2012fromreferencecaseinputdatatimeseries;terminalrecruitmentsestimated.
Retro2009 Excludedatafor2010to2012fromreferencecase inputdatatimeseries;terminalrecruitmentsestimated.
Figure 10.2.1. Recruitment estimates from a variant of the reference case where terminalrecruitmentswereestimated(run34),andforretrospectiveanalysesforthesuccessiveremovalof data from the end of the observation time series from 2012 to 2009. Model runs aredescribedinTable10.2.1.

87
Figure10.2.2.Annualspawningbiomassestimatesfromavariantofthereferencecasewhereterminalrecruitmentswereestimated(run34),andforretrospectiveanalysesforthesuccessiveremovalofdatafromtheendoftheobservationtimeseriesfrom2012to2010.ModelrunsaredescribedinTable10.2.1.
10.2.2 RetrospectiveexaminationofpreviousassessmentsThe reference case model for the current (2014) assessment was compared
retrospectivelytothoseforthepasttwoassessmentsdonein2011and2010.Keymanagementquantities for the models are listed in Table 10.2.2, a comparison of the recruitment andspawningbiomasstrajectoriesisshowninFigure10.2.3,andacomparisonoftheKobeplotsofestimatedstockstatusrelativetotheMSYreferencepointsisshowninFigure10.2.4.
Table10.2.2.KeymanagementquantitiesforthereferencecasemodelsusedfortheWCPOyellowfintunastockassessmentsin2009,2011,andthecurrentassessment(2014).
Managementquantity 2010 2011 2014
MSY 1,375,600 1,503,600 1,532,400
Fcurrent/FMSY 0.34 0.37 0.62
SBlatest/SBF=0 0.48 0.55 0.48
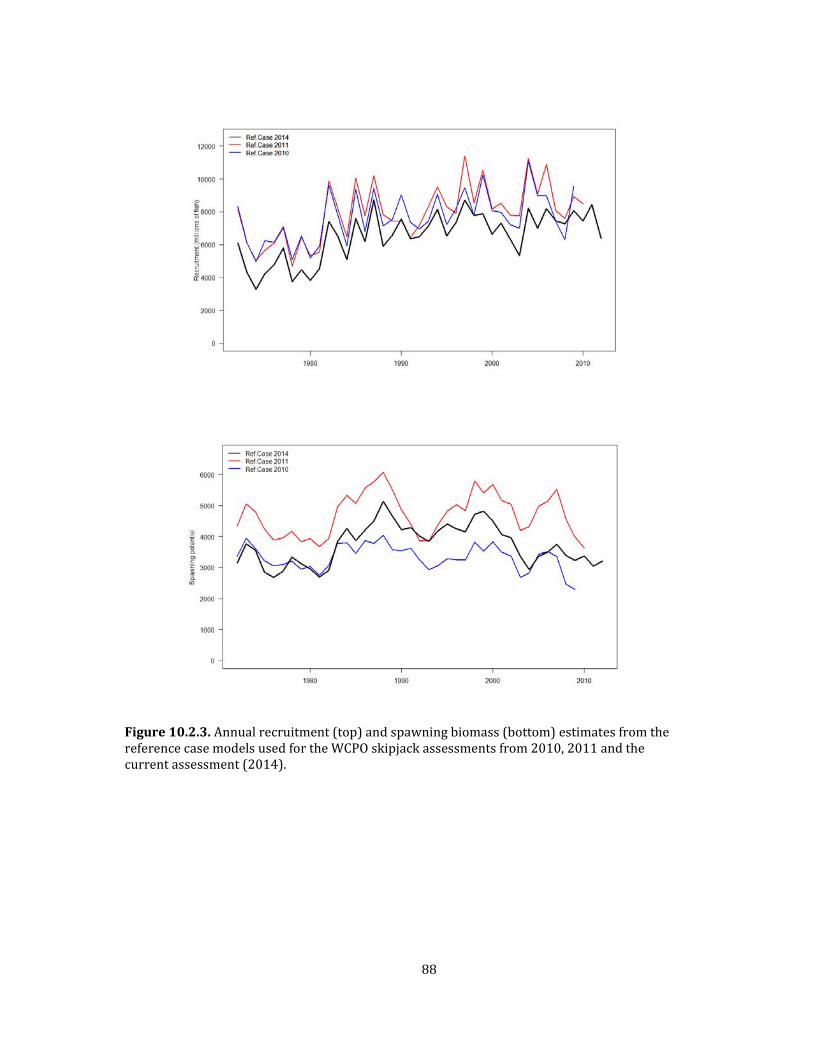
88
Figure10.2.3.Annualrecruitment(top)andspawningbiomass(bottom)estimatesfromthereferencecasemodelsusedfortheWCPOskipjackassessmentsfrom2010,2011andthecurrentassessment(2014).
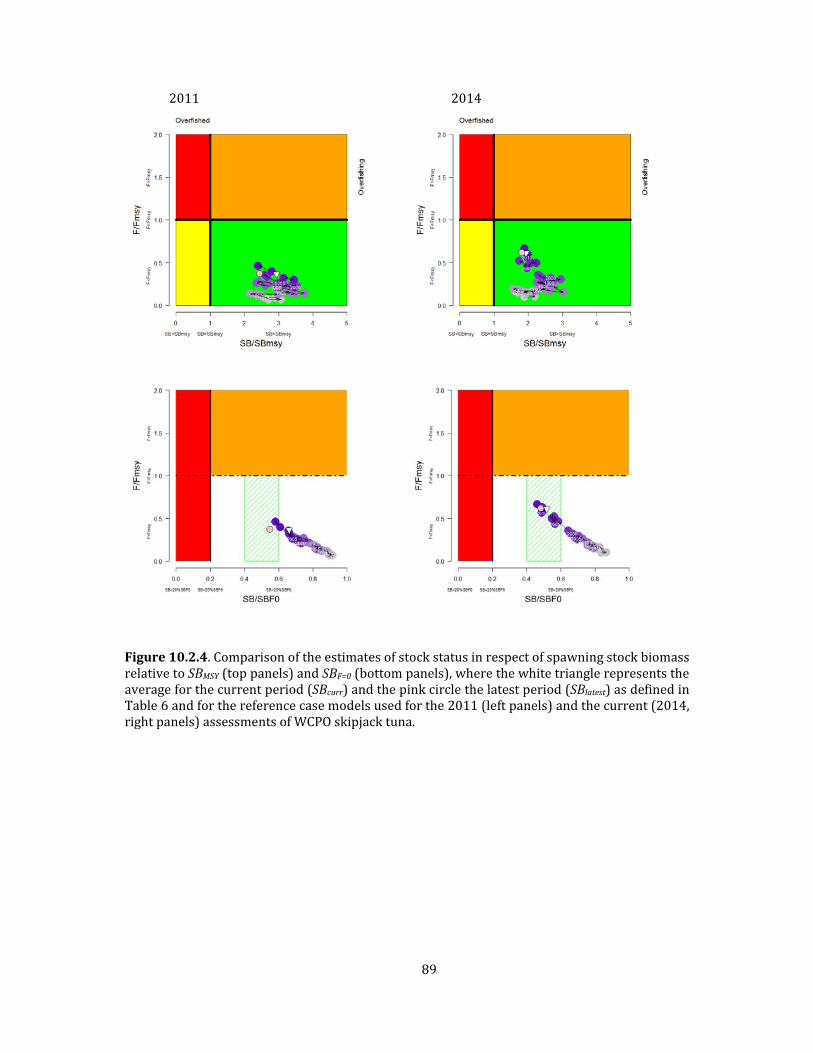
89
2011
2014
Figure10.2.4.ComparisonoftheestimatesofstockstatusinrespectofspawningstockbiomassrelativetoSBMSY(toppanels)andSBF=0(bottompanels),wherethewhitetrianglerepresentstheaverageforthecurrentperiod(SBcurr)andthepinkcirclethelatestperiod(SBlatest)asdefinedinTable6andforthereferencecasemodelsusedforthe2011(leftpanels)andthecurrent(2014,rightpanels)assessmentsofWCPOskipjacktuna.
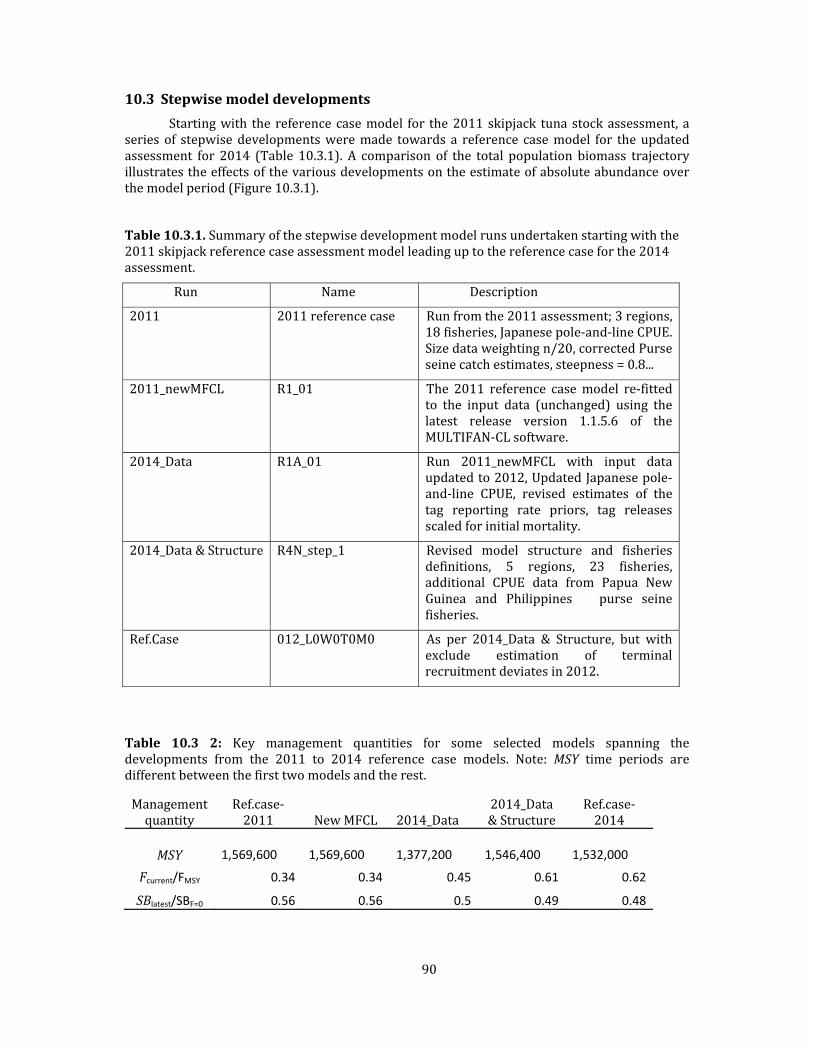
90
10.3 Stepwisemodeldevelopments
Startingwith the referencecasemodel for the2011skipjack tunastockassessment, aseries of stepwisedevelopmentsweremade towards a reference casemodel for theupdatedassessment for 2014 (Table 10.3.1). A comparison of the total population biomass trajectoryillustratestheeffectsofthevariousdevelopmentsontheestimateofabsoluteabundanceoverthemodelperiod(Figure10.3.1).
Table10.3.1.Summaryofthestepwisedevelopmentmodelrunsundertakenstartingwiththe2011skipjackreferencecaseassessmentmodelleadinguptothereferencecaseforthe2014assessment.
Run Name Description
2011 2011referencecase Runfromthe2011assessment;3regions,18fisheries,Japanesepole‐and‐lineCPUE.Sizedataweightingn/20,correctedPurseseinecatchestimates,steepness=0.8...
2011_newMFCL R1_01 The 2011 reference casemodel re‐fittedto the input data (unchanged) using thelatest release version 1.1.5.6 of theMULTIFAN‐CLsoftware.
2014_Data R1A_01 Run 2011_newMFCL with input dataupdatedto2012,UpdatedJapanesepole‐and‐line CPUE, revised estimates of thetag reporting rate priors, tag releasesscaledforinitialmortality.
2014_Data&Structure R4N_step_1 Revised model structure and fisheriesdefinitions, 5 regions, 23 fisheries,additional CPUE data from Papua NewGuinea and Philippines purse seinefisheries.
Ref.Case 012_L0W0T0M0 As per 2014_Data & Structure, but withexclude estimation of terminalrecruitmentdeviatesin2012.
Table 10.3 2: Key management quantities for some selected models spanning thedevelopments from the 2011 to 2014 reference case models. Note: MSY time periods aredifferentbetweenthefirsttwomodelsandtherest.
Managementquantity
Ref.case‐2011 NewMFCL 2014_Data
2014_Data&Structure
Ref.case‐2014
MSY 1,569,600
1,569,600
1,377,200
1,546,400
1,532,000
Fcurrent/FMSY 0.34 0.34 0.45 0.61 0.62
SBlatest/SBF=0 0.56 0.56 0.5 0.49 0.48
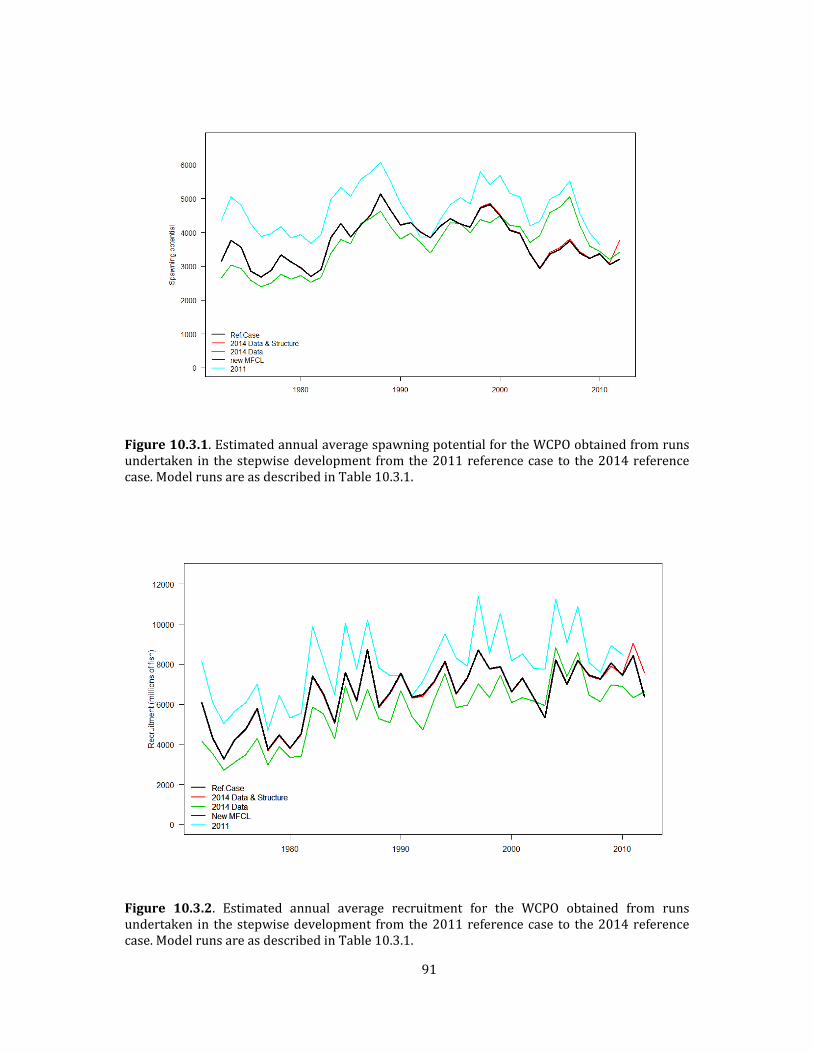
91
Figure10.3.1.EstimatedannualaveragespawningpotentialfortheWCPOobtainedfromrunsundertaken in thestepwisedevelopment fromthe2011referencecase to the2014referencecase.ModelrunsareasdescribedinTable10.3.1.
Figure 10.3.2. Estimated annual average recruitment for the WCPO obtained from runsundertaken in thestepwisedevelopment fromthe2011referencecase to the2014referencecase.ModelrunsareasdescribedinTable10.3.1.
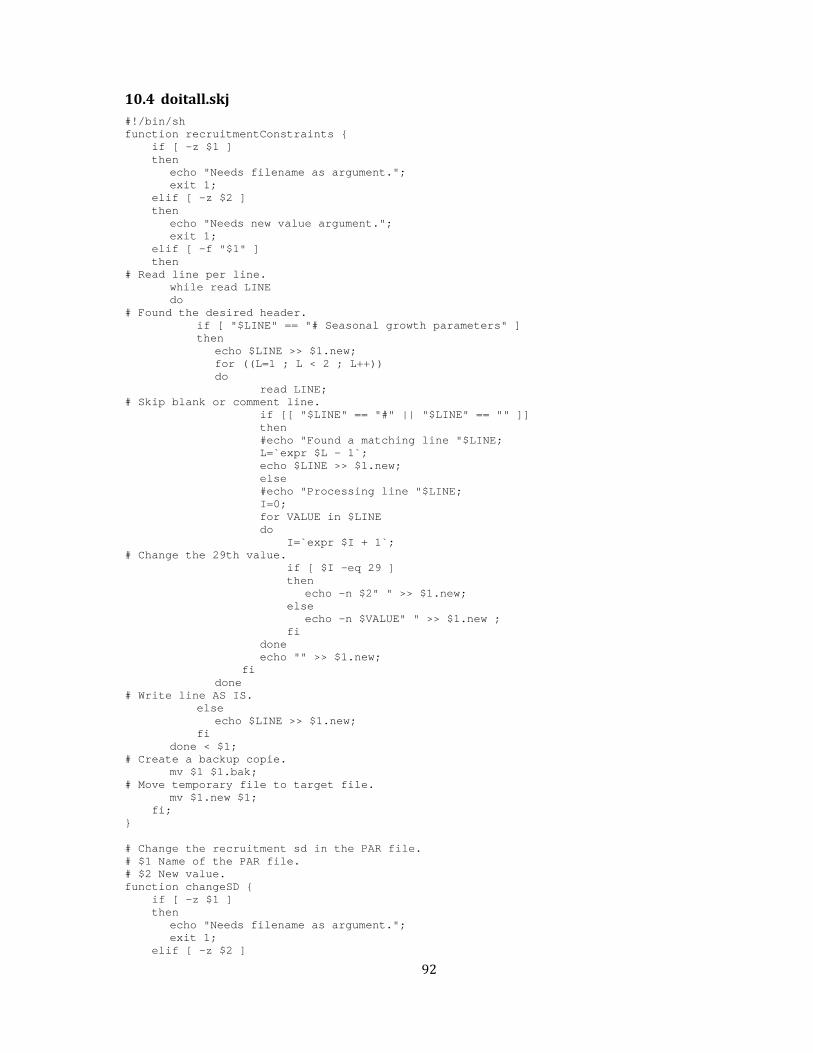
92
10.4 doitall.skj#!/bin/sh function recruitmentConstraints { if [ -z $1 ] then echo "Needs filename as argument."; exit 1; elif [ -z $2 ] then echo "Needs new value argument."; exit 1; elif [ -f "$1" ] then # Read line per line. while read LINE do # Found the desired header. if [ "$LINE" == "# Seasonal growth parameters" ] then echo $LINE >> $1.new; for ((L=1 ; L < 2 ; L++)) do read LINE; # Skip blank or comment line. if [[ "$LINE" == "#" || "$LINE" == "" ]] then #echo "Found a matching line "$LINE; L=`expr $L - 1`; echo $LINE >> $1.new; else #echo "Processing line "$LINE; I=0; for VALUE in $LINE do I=`expr $I + 1`; # Change the 29th value. if [ $I -eq 29 ] then echo -n $2" " >> $1.new; else echo -n $VALUE" " >> $1.new ; fi done echo "" >> $1.new; fi done # Write line AS IS. else echo $LINE >> $1.new; fi done < $1; # Create a backup copie. mv $1 $1.bak; # Move temporary file to target file. mv $1.new $1; fi; } # Change the recruitment sd in the PAR file. # $1 Name of the PAR file. # $2 New value. function changeSD { if [ -z $1 ] then echo "Needs filename as argument."; exit 1; elif [ -z $2 ]
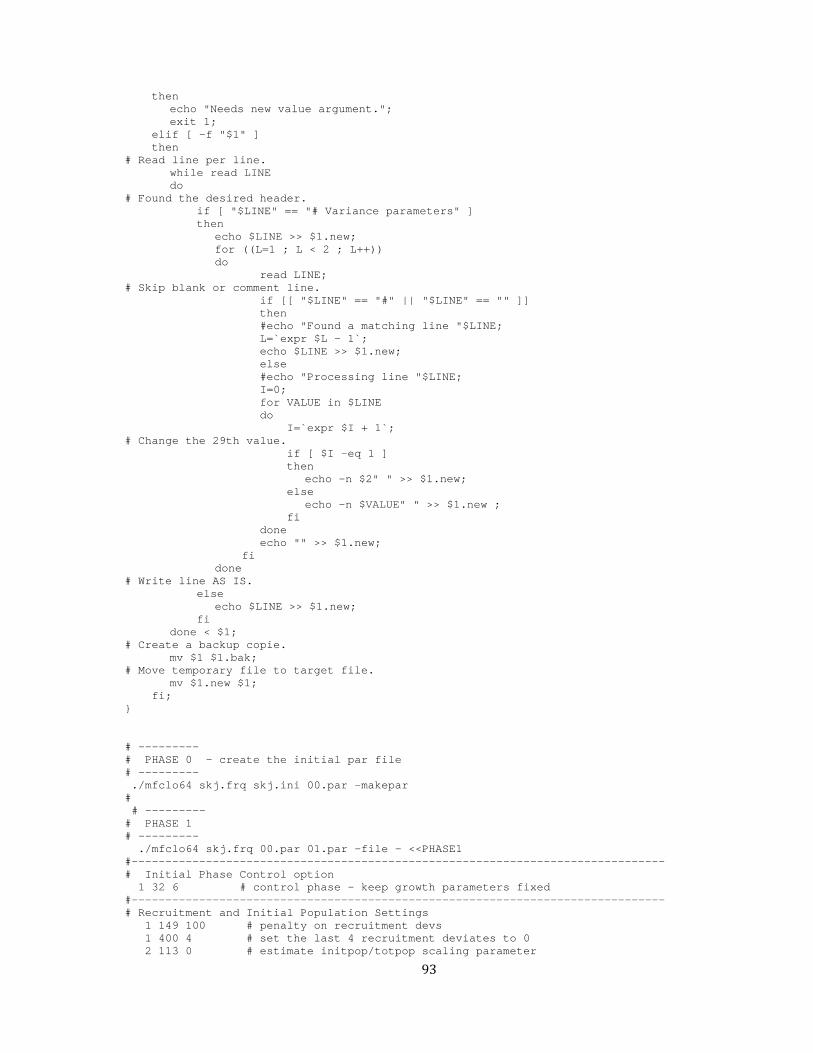
93
then echo "Needs new value argument."; exit 1; elif [ -f "$1" ] then # Read line per line. while read LINE do # Found the desired header. if [ "$LINE" == "# Variance parameters" ] then echo $LINE >> $1.new; for ((L=1 ; L < 2 ; L++)) do read LINE; # Skip blank or comment line. if [[ "$LINE" == "#" || "$LINE" == "" ]] then #echo "Found a matching line "$LINE; L=`expr $L - 1`; echo $LINE >> $1.new; else #echo "Processing line "$LINE; I=0; for VALUE in $LINE do I=`expr $I + 1`; # Change the 29th value. if [ $I -eq 1 ] then echo -n $2" " >> $1.new; else echo -n $VALUE" " >> $1.new ; fi done echo "" >> $1.new; fi done # Write line AS IS. else echo $LINE >> $1.new; fi done < $1; # Create a backup copie. mv $1 $1.bak; # Move temporary file to target file. mv $1.new $1; fi; } # --------- # PHASE 0 - create the initial par file # --------- ./mfclo64 skj.frq skj.ini 00.par -makepar # # --------- # PHASE 1 # --------- ./mfclo64 skj.frq 00.par 01.par -file - <<PHASE1 #------------------------------------------------------------------------------- # Initial Phase Control option 1 32 6 # control phase - keep growth parameters fixed #------------------------------------------------------------------------------- # Recruitment and Initial Population Settings 1 149 100 # penalty on recruitment devs 1 400 4 # set the last 4 recruitment deviates to 0 2 113 0 # estimate initpop/totpop scaling parameter
94
2 177 1 # use old totpop scaling method 2 32 1 # totpop estimated from this phase 2 57 4 # 4 recruitments per year 2 93 4 # 4 recruitments per year 2 94 2 # Use equilibium initial population 2 95 20 # Use average Z for first 20 periods for equil. init. pop. 2 116 70 # value for rmax This is the maximum instantaneous fishing mortality in any one yr qtr, per fishery/region. 70 = 0.70 = F #------------------------------------------------------------------------------- # Likelihood Component 1 141 3 # Robust normal likelihood function for LF data 1 111 4 # Negative binomial likelihood function for tags -999 49 20 # Divisor for LF sample sized effective sample size #------------------------------------------------------------------------------- # Tagging Related Flags # -9999 1 1 # Tag returns for first period after release disregarded -9999 2 0 # Zero means applying the tag_rep_rate in the tag catch calculation; 1 means we are excluding it 1 33 90 # maximum tag reporting rate for all fisheries is 0.9 2 198 1 # turn on release group reporting rates -999 43 0 # var parameter estimated. -999 44 0 # all fisheries grouped for estimating tag neg bin var parameter. 2 96 12 # Tag are pooled across release groups after 12 periods #------------------------------------------------------------------------------- # Estimate movement coefficients 2 68 1 # Estimate movement coefficients 2 69 1 # Use generalized movement model 1 173 0 # growth deviates #------------------------------------------------------------------------------- # Selectivity Settings -3 16 1 -3 3 15 #.. -7 16 1 -7 3 15 #.. -11 16 1 -11 3 15 #.. -15 16 1 -15 3 15 #.. -23 16 1 -23 3 15 #.. # ------------------------------------------------------------------------------ # Selectivity grouping and form 1=logistic 2=doublenormal 3=cubic spine or length specific -1 24 1 -1 57 3 # cubic spline selectivity -1 61 5 # with 5 parameters #.. -2 24 2 -2 57 3 # cubic spline selectivity -2 61 5 # with 5 parameters #.. -3 24 3 -3 57 3 # cubic spline selectivity -3 61 5 # with 5 parameters #.. -4 24 4 -4 57 3 # cubic spline selectivity -4 61 5 # with 5 parameters

95
#.. -5 24 5 -5 57 3 # cubic spline selectivity -5 61 5 # with 5 parameters #.. -6 24 6 -6 57 3 # cubic spline selectivity -6 61 5 # with 5 parameters #.. -7 24 7 -7 57 3 # cubic spline selectivity -7 61 5 # with 5 parameters #.. -8 24 4 -8 57 3 # cubic spline selectivity -8 61 5 # with 5 parameters #.. -9 24 5 -9 57 3 # cubic spline selectivity -9 61 5 # with 5 parameters #.. -10 24 6 -10 57 3 # cubic spline selectivity -10 61 5 # with 5 parameters #.. -11 24 8 -11 57 3 # cubic spline selectivity -11 61 5 # with 5 parameters #.. -12 24 4 -12 57 3 # cubic spline selectivity -12 61 5 # with 5 parameters #.. -13 24 9 -13 57 3 # cubic spline selectivity -13 61 5 # with 5 parameters #.. -14 24 10 -14 57 3 -14 61 5 # cubic spline selectivity with 5 parameters #.. -15 24 11 -15 57 3 # cubic spline selectivity -15 61 5 # with 5 parameters #.. -16 24 12 -16 57 3 # cubic spline selectivity -16 61 5 # with 5 parameters #.. -17 24 12 -17 57 3 # cubic spline selectivity -17 61 5 # with 5 parameters #.. -18 24 5 -18 57 3 # cubic spline selectivity -18 61 5 # with 5 parameters #.. -19 24 4 -19 57 3 # cubic spline selectivity -19 61 5 # with 5 parameters #.. -20 24 5 -20 57 3 # cubic spline selectivity -20 61 5 # with 5 parameters #.. -21 24 6 -21 57 3 # cubic spline selectivity -21 61 5 # with 5 parameters

96
#.. -22 24 12 -22 57 3 # cubic spline selectivity -22 61 5 # with 5 parameters #.. -23 24 13 -23 57 3 # cubic spline selectivity -23 61 5 # with 5 parameters -999 26 2 # Use length-based selectivity #------------------------------------------------------------------------------- # Grouping of fisheries with common catchability -1 29 1 -2 29 2 -3 29 3 -4 29 4 -5 29 5 -6 29 6 -7 29 7 -8 29 8 -9 29 9 -10 29 10 -11 29 11 -12 29 12 -13 29 13 -14 29 14 -15 29 15 -16 29 16 -17 29 17 -18 29 18 -19 29 19 -20 29 20 -21 29 21 -22 29 22 -23 29 23 #------------------------------------------------------------------------------- # Initial catchability -1 60 1 -2 60 2 -3 60 3 -4 60 4 -5 60 5 -6 60 6 -7 60 7 -8 60 8 -9 60 9 -10 60 10 -11 60 11 -12 60 12 -13 60 13 -14 60 14 -15 60 15 -16 60 16 -17 60 17 -18 60 18 -19 60 19 -20 60 20 -21 60 21 -22 60 22 -23 60 23 #------------------------------------------------------------------------------- # Penalties for effort deviations # Fishery groupings for tag return data -1 32 1 -2 32 2 -3 32 3 -4 32 4 -5 32 5
97
-6 32 5 -7 32 6 -8 32 7 -9 32 8 -10 32 8 -11 32 9 -12 32 10 -13 32 11 -14 32 11 -15 32 12 -16 32 13 -17 32 14 -18 32 15 -19 32 16 -20 32 17 -21 32 17 -22 32 18 -23 32 19 #- Penalties for effort deviations (fsh 13 ) -999 13 -3 # fisheries with No effort # JPN LL -3 13 10 -7 13 10 -11 13 10 -15 13 10 -23 13 10 # Domestic PH VN and ID fisheries -16 13 10 -17 13 10 -22 13 10 # # Fisheries with Standardized effort 1,4, 9, 12, 18 -1 13 1 -4 13 1 -9 13 1 -12 13 1 -18 13 10 #--- FSH 66 is time-varying effort wt (set internally) -999 66 0 -1 66 1 -4 66 1 -9 66 1 -12 66 1 -18 66 0 #--- # Estimation of mixture pars (for additional zeros ) in the likelihood- -1 46 0 -2 46 0 -3 46 0 -4 46 0 -5 46 0 -6 46 0 -8 46 0 -9 46 0 -10 46 0 -11 46 0 -12 46 0 -13 46 0 -14 46 0 -16 46 0 -17 46 0 -18 46 0 PHASE1 # changeSD 01.par 5.074696 # #
98
# --------- # PHASE 2 # --------- ./mfclo64 skj.frq 01.par 02.par -file - <<PHASE2 1 1 500 # Sets no. of function evaluations for this phase 1 50 -1 # convergence criterion is 1E+1 2 35 12 # Effort deviate boundary 2 34 1 # est. effort devs (in general) -999 4 4 # Estimate effort deviates 2 144 100000 # catch likelihood penalty PHASE2 # # --------- ------------ ---------- --------- -------- -------- recruitmentConstraints 02.par 0.8 # sets the steepness to 0.8 # # # # PHASE 3 # --------- ./mfclo64 skj.frq 02.par 03.par -file - <<PHASE3 1 190 1 # Write plot.rep PHASE3 # # # --------- # PHASE 4 # --------- ./mfclo64 skj.frq 03.par 04.par -file - <<PHASE4 2 70 1 # Estimate time-series changes in recruitment distribution 2 71 1 # est. time series of reg recruitment 2 178 1 # constraint on regional recruitments PHASE4 # # --------- # PHASE 5 # --------- ./mfclo64 skj.frq 04.par 05.par -file - <<PHASE5 # Estimate seasonal catchability for all fisheries -999 27 1 # excepth the JPN LL/RES fisheries -3 27 0 -7 27 0 -11 27 0 -15 27 0 -23 27 0 # except for fisheries with annual catch 16, 17, 18 -16 27 0 -17 27 0 -18 27 0 -22 27 0 PHASE5 # # --------- # PHASE 6 # --------- ./mfclo64 skj.frq 05.par 06.par -file - <<PHASE6 2 82 45 # Prior for average M is 45/100 per quarter 2 84 2 # Penalty weight 2 33 1 # Estimate average M PHASE6 # # ---------- # PHASE 7 # ---------- ./mfclo64 skj.frq 06.par 07.par -file - <<PHASE7 # set up for estimation of growth ----LATER ON. # 1 184 1 # Activate length estimation of independent age classes

99
# 1 14 1 # Estimate von Bertalanffy K # 1 12 1 # Estimate mean length of age 11 # 1 13 1 # Estimate mean length of largest age class # Sets variable catchability, periodicity, and penalty -1 10 0 # JP PL Reg1 -1 15 0 # catchability devs fsh(,15) don't matter when we actually hav an index -1 23 0 #.. -2 10 1 # catchability -2 15 0 # penalty -2 23 23 # periodicity #.. -3 10 0 -3 15 0 -3 23 23 #.. -4 10 0 # JP PL Reg2 -4 15 0 -4 23 0 #.. -5 10 1 -5 15 0 -5 23 23 #.. -6 10 1 -6 15 0 -6 23 23 #.. -7 10 0 -7 15 0 -7 23 23 #.. -8 10 1 -8 15 0 -8 23 23 #.. -9 10 0 # PNG purse seine -9 15 0 -9 23 0 #.. -10 10 1 -10 15 0 -10 23 23 #.. -11 10 0 -11 15 0 -11 23 23 #.. -12 10 0 # PL-All-3
100
-12 15 0 -12 23 0 #.. -13 10 1 -13 15 0 -13 23 23 #.. -14 10 1 -14 15 0 -14 23 23 #.. -15 10 0 -15 15 0 -15 23 23 #.. -16 10 0 -16 15 0 -16 23 23 #.. -17 10 0 -17 15 0 -17 23 23 #.. -18 10 0 # IDID_PHPH region 4 Seine - CPUE from K.B. -18 15 0 -18 23 0 #.. -19 10 1 -19 15 0 -19 23 23 #.. -20 10 1 -20 15 0 -20 23 23 #.. -21 10 1 -21 15 0 -21 23 23 #.. -22 10 0 -22 15 0 -22 23 23 #..
101
-23 10 0 -23 15 0 -23 23 23 PHASE7 # # ---------- # PHASE 8 # ---------- ./mfclo64 skj.frq 07.par 08.par -file - <<PHASE8 2 88 1 # Estimate age-dependent movement 2 89 1 # Use age-dependent movement pars PHASE8 # # ---------- # PHASE 9 # ---------- ./mfclo64 skj.frq 08.par 09.par -file - <<PHASE9 2 73 1 # Estimate age-dependent M # 2 77 50 # penalty on 2nd derivative of Ma 2 78 100 # Increase penalty on differences between M(a) and M(a+1) (1st derivative) 2 79 1 # Minimize penalty be M(average) and M(a). 2 171 1 # Include SRR-based equilibrium recruitment to compute unfished biomass PHASE9 # ---------- # PHASE 10 # ---------- ./mfclo64 skj.frq 09.par 10.par -file - <<PHASE10 # Estimate regional distribution of recruitment -100000 1 1 -100000 2 1 -100000 3 1 -100000 4 1 -100000 5 1 #-------------------------------optimize the period over which the SRR is to be fitted 2 199 124 # start time period for yield calculation [4.5.11] 2 200 4 # end time period for yield calculation [4.5.11] PHASE10 # # --------- # PHASE 11 # --------- ./mfclo64 skj.frq 10.par 11.par -file - <<PHASE11 2 145 -1 # penalty wt. for SRR 2 146 1 # make SRR parameters active 2 147 1 # no. time periods for recruitment lag 2 148 20 # years (year quarters) from last year for avg. F 2 155 4 # but not including last 4 1 149 0 # turn off recruitment penalties against mean 2 162 0 # Estimate steepness 0 IS THE DEFAULT meaning not estimated 2 163 0 # BH-SRR is parameterised using steepness. Value of 0 IS THE DEFAULT meaning it is parameterized with steepness -999 55 1 # turn off fisheries for impact analysis [4.5.14] 2 193 1 # Consider initial fishing effort in calculating initial conditions 1 1 3000 # how many function evaluations 1 50 -3 # CONVERGENCE CRITERIA 2 171 1 # unfished calculations by estimated recruitment or SRR [4.5.14] PHASE11

102
10.5 Initialization(ini)file# ini version number 1001 # number of age classes 16 # tag fish rep 0.5 0.5 0.5 0.5 0.5 0.5 0.5 0.5 0.5 0.5 0.5 0.5 0.5 0.5 0.5 0.5 0.5 0.5 0.5 0.5 0.5 0.5 0.5 0.5 0.5 0.5 0.5 0.5 0.5 0.5 0.5 0.5 0.5 0.5 0.5 0.5 0.5 0.5 0.5 0.5 0.5 0.5 0.5 0.5 0.5 0.5 0.5 0.5 0.5 0.5 0.5 0.5 0.5 0.5 0.5 0.5 0.5 0.5 0.5 0.5 0.5 0.5 0.5 0.5 0.5 0.5 0.5 0.5 0.5 0.5 0.5 0.5 0.5 0.5 0.5 0.5 0.5 0.5 0.5 0.5 0.5 0.5 0.5 0.5 0.5 0.5 0.5 0.5 0.5 0.5 0.5 0.5 0.5 0.5 0.5 0.5 0.5 0.5 0.5 0.5 0.5 0.5 0.5 0.5 0.5 0.5 0.5 0.5 0.5 0.5 0.5 0.5 0.5 0.5 0.5 0.5 0.5 0.5 0.5 0.5 0.5 0.5 0.5 0.5 0.5 0.5 0.5 0.5 0.5 0.5 0.5 0.5 0.5 0.5 0.5 0.5 0.5 0.5 0.5 0.5 0.5 0.5 0.5 0.5 0.5 0.5 0.5 0.5 0.5 0.5 0.5 0.5 0.5 0.5 0.5 0.5 0.5 0.5 0.5 0.5 0.5 0.5 0.5 0.5 0.5 0.5 0.5 0.5 0.5 0.5 0.5 0.5 0.5 0.5 0.5 0.5 0.5 0.5 0.5 0.5 0.5 0.5 0.5 0.5 0.5 0.5 0.5 0.5 0.586 0.586 0.5 0.5 0.586 0.586 0.5 0.5 0.586 0.586 0.5 0.764 0.764 0.764 0.5 0.5 0.5 0.5 0.5 0.5 0.5 0.5 0.5 0.586 0.586 0.5 0.5 0.586 0.586 0.5 0.5 0.586 0.586 0.5 0.764 0.764 0.764 0.5 0.5 0.5 0.5 0.5 0.5 0.5 0.5 0.5 0.586 0.586 0.5 0.5 0.586 0.586 0.5 0.5 0.586 0.586 0.5 0.764 0.764 0.764 0.5 0.5 0.5 0.5 0.5 0.5 0.5 0.5 0.5 0.586 0.586 0.5 0.5 0.586 0.586 0.5 0.5 0.586 0.586 0.5 0.764 0.764 0.764 0.5 0.5 0.5 0.5 0.5 0.5 0.5 0.5 0.5 0.586 0.586 0.5 0.5 0.586 0.586 0.5 0.5 0.586 0.586 0.5 0.764 0.764 0.764 0.5 0.5 0.5 0.5 0.5 0.5 0.5 0.5 0.5 0.586 0.586 0.5 0.5 0.586 0.586 0.5 0.5 0.586 0.586 0.5 0.764 0.764 0.764 0.5 0.5 0.5 0.5 0.5 0.5 0.5 0.5 0.5 0.586 0.586 0.5 0.5 0.586 0.586 0.5 0.5 0.586 0.586 0.5 0.764 0.764 0.764 0.5 0.5 0.5 0.5 0.5 0.5 0.5 0.5 0.5 0.586 0.586 0.5 0.5 0.586 0.586 0.5 0.5 0.586 0.586 0.5 0.764 0.764 0.764 0.5 0.5 0.5 0.5 0.5 0.5 0.5 0.5 0.5 0.586 0.586 0.5 0.5 0.586 0.586 0.5 0.5 0.586 0.586 0.5 0.764 0.764 0.764 0.5 0.5 0.5 0.5 0.5 0.5 0.5 0.5 0.5 0.617594 0.617594 0.5 0.5 0.682725 0.682725 0.5 0.5 0.550997 0.550997 0.5 0.5 0.5 0.5 0.5 0.5 0.5 0.5 0.5 0.5 0.5 0.5 0.5 0.617594 0.617594 0.5 0.5 0.682725 0.682725 0.5 0.5 0.550997 0.550997 0.5 0.5 0.5 0.5 0.5 0.5 0.5 0.5 0.5 0.5 0.5 0.5 0.5 0.617594 0.617594 0.5 0.5 0.682725 0.682725 0.5 0.5 0.550997 0.550997 0.5 0.5 0.5 0.5 0.5 0.5 0.5 0.5 0.5 0.5 0.5 0.5 0.5 0.617594 0.617594 0.5 0.5 0.682725 0.682725 0.5 0.5 0.550997 0.550997 0.5 0.5 0.5 0.5 0.5 0.5 0.5 0.5 0.5 0.5 0.5 0.5 0.5 0.617594 0.617594 0.5 0.5 0.682725 0.682725 0.5 0.5 0.550997 0.550997 0.5 0.5 0.5 0.5 0.5 0.5 0.5 0.5 0.5 0.5 0.5 0.5 0.5 0.617594 0.617594 0.5 0.5 0.682725 0.682725 0.5 0.5 0.550997 0.550997 0.5 0.5 0.5 0.5 0.5 0.5 0.5 0.5 0.5 0.5 0.5 0.5 0.5 0.617594 0.617594 0.5 0.5 0.682725 0.682725 0.5 0.5 0.550997 0.550997 0.5 0.5 0.5 0.5 0.5 0.5 0.5 0.5 0.5 0.5 0.5 0.5 0.5 0.617594 0.617594 0.5 0.5 0.682725 0.682725 0.5 0.5 0.550997 0.550997 0.5 0.5 0.5 0.5 0.5 0.5 0.5 0.5 0.5 0.5 0.5 0.5 0.5 0.617594 0.617594 0.5 0.5 0.682725 0.682725 0.5 0.5 0.550997 0.550997 0.5 0.5 0.5 0.5 0.5 0.5 0.5 0.5 0.5 0.5 0.5 0.5 0.5 0.617594 0.617594 0.5 0.5 0.682725 0.682725 0.5 0.5 0.550997 0.550997 0.5 0.5 0.5 0.5 0.5 0.5 0.5 0.5 0.5 0.5 0.5 0.5 0.5 0.617594 0.617594 0.5 0.5 0.682725 0.682725 0.5 0.5 0.550997 0.550997 0.5 0.5 0.5 0.5 0.5 0.5 0.5 0.5 0.5 0.5 0.5 0.5 0.5 0.5 0.5 0.5 0.5 0.5 0.5 0.5 0.5 0.5 0.5 0.5 0.5 0.5 0.5 0.5 0.5 0.5 0.5 0.5 0.5 0.5 0.5 0.5 0.5 0.5 0.5 0.5 0.5 0.5 0.5 0.5 0.5 0.5 0.5 0.5 0.5 0.5 0.5 0.5 0.5 0.5 0.5
103
0.5 0.5 0.5 0.5 0.5 0.5 0.5 0.5 0.5 0.5 0.5 0.5 0.5 0.5 0.5 0.5 0.5 0.5 0.5 0.5 0.5 0.5 0.5 0.5 0.5 0.5 0.5 0.5 0.5 0.5 0.5 0.5 0.5 0.5 0.5 0.5 0.5 0.5 0.5 0.5 0.5 0.5 0.5 0.5 0.5 0.5 0.5 0.5 0.5 0.5 0.5 0.5 0.5 0.5 0.5 0.5 0.5 0.5 0.5 0.5 0.5 0.5 0.5 0.5 0.5 0.5 0.5 0.5 0.5 0.5 0.5 0.5 0.5 0.5 0.5 0.5 0.5 0.5 0.5 0.5 0.5 0.5 0.5 0.5 0.5 0.5 0.5 0.5 0.5 0.5 0.5 0.5 0.5 0.5 0.5 0.5 0.5 0.5 0.5 0.5 0.5 0.5 0.5 0.5 0.5 0.5 0.5 0.5 0.5 0.5 0.5 0.5 0.5 0.5 0.5 0.5 0.5 0.5 0.5 0.5 0.5 0.5 0.5 0.5 0.5 0.5 0.5 0.5 0.5 0.5 0.5 0.5 0.5 0.5 0.5 0.5 0.5 0.5 0.5 0.5 0.5 0.5 0.5 0.5 0.5 0.5 0.5 0.5 0.5 0.5 0.5 0.5 0.5 0.5 0.5 0.5 0.5 0.5 0.5 0.5 0.5 0.5 0.5 0.5 0.5 0.586 0.586 0.5 0.5 0.586 0.586 0.5 0.5 0.586 0.586 0.5 0.764 0.764 0.764 0.5 0.5 0.5 0.5 0.5 0.5 0.5 0.5 0.5 0.586 0.586 0.5 0.5 0.586 0.586 0.5 0.5 0.586 0.586 0.5 0.764 0.764 0.764 0.5 0.5 0.5 0.5 0.5 0.5 0.5 0.5 0.5 0.586 0.586 0.5 0.5 0.586 0.586 0.5 0.5 0.586 0.586 0.5 0.764 0.764 0.764 0.5 0.5 0.5 0.5 0.5 0.5 0.5 0.5 0.5 0.586 0.586 0.5 0.5 0.586 0.586 0.5 0.5 0.586 0.586 0.5 0.764 0.764 0.764 0.5 0.5 0.5 0.5 0.5 0.5 0.5 0.5 0.5 0.586 0.586 0.5 0.5 0.586 0.586 0.5 0.5 0.586 0.586 0.5 0.764 0.764 0.764 0.5 0.5 0.5 0.5 0.5 0.5 0.5 0.5 0.5 0.617594 0.617594 0.5 0.5 0.682725 0.682725 0.5 0.5 0.550997 0.550997 0.5 0.5 0.5 0.5 0.5 0.5 0.5 0.5 0.5 0.5 0.5 0.5 0.5 0.617594 0.617594 0.5 0.5 0.682725 0.682725 0.5 0.5 0.550997 0.550997 0.5 0.5 0.5 0.5 0.5 0.5 0.5 0.5 0.5 0.5 0.5 0.5 0.5 0.617594 0.617594 0.5 0.5 0.682725 0.682725 0.5 0.5 0.550997 0.550997 0.5 0.5 0.5 0.5 0.5 0.5 0.5 0.5 0.5 0.5 0.5 0.5 0.5 0.617594 0.617594 0.5 0.5 0.682725 0.682725 0.5 0.5 0.550997 0.550997 0.5 0.5 0.5 0.5 0.5 0.5 0.5 0.5 0.5 0.5 0.5 0.5 0.5 0.617594 0.617594 0.5 0.5 0.682725 0.682725 0.5 0.5 0.550997 0.550997 0.5 0.5 0.5 0.5 0.5 0.5 0.5 0.5 0.5 0.5 0.5 0.5 0.5 0.5 0.5 0.5 0.5 0.5 0.5 0.5 0.5 0.5 0.5 0.5 0.5 0.5 0.5 0.5 0.5 0.5 0.5 0.5 0.5 0.5 0.5 0.5 0.5 0.5 0.5 0.5 0.5 0.5 0.5 0.5 0.5 0.5 0.5 0.5 0.5 0.5 0.5 0.5 0.5 0.5 0.5 0.5 0.5 0.5 0.5 0.586 0.586 0.5 0.5 0.586 0.586 0.5 0.5 0.586 0.586 0.5 0.764 0.764 0.764 0.5 0.5 0.5 0.5 0.5 0.5 0.5 0.5 0.5 0.586 0.586 0.5 0.5 0.586 0.586 0.5 0.5 0.586 0.586 0.5 0.764 0.764 0.764 0.5 0.5 0.5 0.5 0.5 0.5 0.5 0.5 0.5 0.586 0.586 0.5 0.5 0.586 0.586 0.5 0.5 0.586 0.586 0.5 0.764 0.764 0.764 0.5 0.5 0.5 0.5 0.5 0.5 0.5 0.5 0.5 0.586 0.586 0.5 0.5 0.586 0.586 0.5 0.5 0.586 0.586 0.5 0.764 0.764 0.764 0.5 0.5 0.5 0.5 0.5 0.5 0.5 0.5 0.5 0.586 0.586 0.5 0.5 0.586 0.586 0.5 0.5 0.586 0.586 0.5 0.764 0.764 0.764 0.5 0.5 0.5 0.5 0.5 0.5 0.5 0.5 0.5 0.586 0.586 0.5 0.5 0.586 0.586 0.5 0.5 0.586 0.586 0.5 0.764 0.764 0.764 0.5 0.5 0.5 0.5 0.5 0.5 0.5 0.5 0.5 0.586 0.586 0.5 0.5 0.586 0.586 0.5 0.5 0.586 0.586 0.5 0.764 0.764 0.764 0.5 0.5 0.5 0.5 0.5 0.5 0.5 0.5 0.5 0.617594 0.617594 0.5 0.5 0.682725 0.682725 0.5 0.5 0.550997 0.550997 0.5 0.5 0.5 0.5 0.5 0.5 0.5 0.5 0.5 0.5 0.5 0.5 0.5 0.617594 0.617594 0.5 0.5 0.682725 0.682725 0.5 0.5 0.550997 0.550997 0.5 0.5 0.5 0.5 0.5 0.5 0.5 0.5 0.5 0.5 0.5 0.5 0.5 0.617594 0.617594 0.5 0.5 0.682725 0.682725 0.5 0.5 0.550997 0.550997 0.5 0.5 0.5 0.5 0.5 0.5 0.5 0.5 0.5 0.5 0.5 0.5 0.5 0.5 0.5 0.5 0.5 0.5 0.5 0.5 0.5 0.5 0.5 0.5 0.5 0.5 0.5 0.5 0.5 0.5 0.5 0.5 0.5 0.5 0.5 0.5 0.5 0.5 0.5 0.5 0.5 0.5 0.5 0.5 0.5 0.5 0.5 0.5 0.5 0.5 0.5 0.5 0.5 0.5 0.5 0.5 0.5 0.5 0.5 0.5 0.5 0.5 0.5 0.5 0.5 0.5 0.5 0.5 0.5 0.5 0.5 0.5 0.5 0.5 0.5 0.5 0.5 0.5 0.5 0.5 0.5 0.5 0.586 0.586 0.5 0.5 0.586 0.586 0.5 0.5 0.586 0.586 0.5 0.764 0.764 0.764 0.5 0.5 0.5 0.5 0.5 0.5 0.5 0.5 0.5 0.586 0.586 0.5 0.5 0.586 0.586 0.5 0.5 0.586 0.586 0.5 0.764 0.764 0.764 0.5 0.5 0.5 0.5 0.5
104
0.5 0.5 0.5 0.5 0.586 0.586 0.5 0.5 0.586 0.586 0.5 0.5 0.586 0.586 0.5 0.764 0.764 0.764 0.5 0.5 0.5 0.5 0.5 0.5 0.5 0.5 0.5 0.586 0.586 0.5 0.5 0.586 0.586 0.5 0.5 0.586 0.586 0.5 0.764 0.764 0.764 0.5 0.5 0.5 0.5 0.5 0.5 0.5 0.5 0.5 0.586 0.586 0.5 0.5 0.586 0.586 0.5 0.5 0.586 0.586 0.5 0.764 0.764 0.764 0.5 0.5 0.5 0.5 0.5 0.5 0.5 0.5 0.5 0.586 0.586 0.5 0.5 0.586 0.586 0.5 0.5 0.586 0.586 0.5 0.764 0.764 0.764 0.5 0.5 0.5 0.5 0.5 0.5 0.5 0.5 0.5 0.586 0.586 0.5 0.5 0.586 0.586 0.5 0.5 0.586 0.586 0.5 0.764 0.764 0.764 0.5 0.5 0.5 0.5 0.5 0.5 0.5 0.5 0.5 0.586 0.586 0.5 0.5 0.586 0.586 0.5 0.5 0.586 0.586 0.5 0.764 0.764 0.764 0.5 0.5 0.5 0.5 0.5 0.5 0.5 0.5 0.5 0.586 0.586 0.5 0.5 0.586 0.586 0.5 0.5 0.586 0.586 0.5 0.764 0.764 0.764 0.5 0.5 0.5 0.5 0.5 0.5 0.5 0.5 0.5 0.586 0.586 0.5 0.5 0.586 0.586 0.5 0.5 0.586 0.586 0.5 0.764 0.764 0.764 0.5 0.5 0.5 0.5 0.5 0.5 0.5 0.5 0.5 0.617594 0.617594 0.5 0.5 0.682725 0.682725 0.5 0.5 0.550997 0.550997 0.5 0.5 0.5 0.5 0.5 0.5 0.5 0.5 0.5 0.5 0.5 0.5 0.5 0.617594 0.617594 0.5 0.5 0.682725 0.682725 0.5 0.5 0.550997 0.550997 0.5 0.5 0.5 0.5 0.5 0.5 0.5 0.5 0.5 0.5 0.5 0.5 0.5 0.617594 0.617594 0.5 0.5 0.682725 0.682725 0.5 0.5 0.550997 0.550997 0.5 0.5 0.5 0.5 0.5 0.5 0.5 0.5 0.5 0.5 0.5 0.5 0.5 0.617594 0.617594 0.5 0.5 0.682725 0.682725 0.5 0.5 0.550997 0.550997 0.5 0.5 0.5 0.5 0.5 0.5 0.5 0.5 0.5 0.5 0.5 0.5 0.5 0.617594 0.617594 0.5 0.5 0.682725 0.682725 0.5 0.5 0.550997 0.550997 0.5 0.5 0.5 0.5 0.5 0.5 0.5 0.5 0.5 0.5 0.5 0.5 0.5 0.617594 0.617594 0.5 0.5 0.682725 0.682725 0.5 0.5 0.550997 0.550997 0.5 0.5 0.5 0.5 0.5 0.5 0.5 0.5 0.5 0.5 0.5 0.5 0.5 0.617594 0.617594 0.5 0.5 0.682725 0.682725 0.5 0.5 0.550997 0.550997 0.5 0.5 0.5 0.5 0.5 0.5 0.5 0.5 0.5 0.5 0.5 0.5 0.5 0.617594 0.617594 0.5 0.5 0.682725 0.682725 0.5 0.5 0.550997 0.550997 0.5 0.5 0.5 0.5 0.5 0.5 0.5 0.5 0.5 0.5 0.5 0.5 0.5 0.617594 0.617594 0.5 0.5 0.682725 0.682725 0.5 0.5 0.550997 0.550997 0.5 0.5 0.5 0.5 0.5 0.5 0.5 0.5 0.5 0.5 0.5 0.5 0.5 0.617594 0.617594 0.5 0.5 0.682725 0.682725 0.5 0.5 0.550997 0.550997 0.5 0.5 0.5 0.5 0.5 0.5 0.5 0.5 0.5 0.5 0.5 0.5 0.5 0.617594 0.617594 0.5 0.5 0.682725 0.682725 0.5 0.5 0.550997 0.550997 0.5 0.5 0.5 0.5 0.5 0.5 0.5 0.5 0.5 0.5 0.5 0.5 0.5 0.617594 0.617594 0.5 0.5 0.682725 0.682725 0.5 0.5 0.550997 0.550997 0.5 0.5 0.5 0.5 0.5 0.5 0.5 0.5 0.5 0.5 0.5 0.5 0.5 0.617594 0.617594 0.5 0.5 0.682725 0.682725 0.5 0.5 0.550997 0.550997 0.5 0.5 0.5 0.5 0.5 0.5 0.5 0.5 0.5 0.5 0.5 0.5 0.5 0.617594 0.617594 0.5 0.5 0.682725 0.682725 0.5 0.5 0.550997 0.550997 0.5 0.5 0.5 0.5 0.5 0.5 0.5 0.5 0.5 0.5 0.5 0.5 0.5 0.617594 0.617594 0.5 0.5 0.682725 0.682725 0.5 0.5 0.550997 0.550997 0.5 0.5 0.5 0.5 0.5 0.5 0.5 0.5 0.5 0.5 0.5 0.5 0.5 0.5 0.5 0.5 0.5 0.5 0.5 0.5 0.5 0.5 0.5 0.5 0.5 0.5 0.5 0.5 0.5 0.5 0.5 0.5 0.5 0.5 0.5 0.5 0.5 0.5 0.5 0.5 0.5 0.5 0.5 0.5 0.5 0.5 0.5 0.5 0.5 0.5 0.5 0.5 0.5 0.5 0.5 0.5 0.5 0.5 0.5 0.5 0.5 0.5 0.5 0.5 0.5 0.5 0.5 0.5 0.5 0.5 0.5 0.5 0.5 0.5 0.5 0.5 0.5 0.5 0.5 0.5 0.5 0.5 0.5 0.5 0.5 0.5 0.5 0.5 0.5 0.5 0.5 0.5 0.5 0.5 0.5 0.5 0.5 0.5 0.5 0.5 0.5 0.5 0.5 0.5 0.5 0.5 0.5 0.5 0.5 0.5 0.5 0.5 0.5 0.5 0.5 0.5 0.5 0.5 0.5 0.5 0.5 0.5 0.5 0.5 0.5 0.5 0.5 0.5 0.5 0.5 0.5 0.5 0.5 0.5 0.5 0.5 0.5 0.5 0.5 0.5 0.5 0.5 0.5 0.5 0.5 0.5 0.5 0.5 0.5 0.5 0.5 0.5 0.5 0.5 0.5 0.5 0.5 0.5 0.5 0.5 0.5 0.5 0.5 0.5 0.5 0.5 0.5 0.5 0.5 0.5 0.5 0.5 0.5 0.5 0.5 0.5 0.5 0.5 0.5 0.5 0.5 0.5 0.5 0.5 0.5 0.5 0.5 0.5 0.5 0.5 0.5 0.5 0.5 0.5 0.5 0.5 0.5 0.5 0.5 0.5 0.5 0.5 0.5 0.5 0.5 0.5 0.5 0.5 0.5 0.5 0.5 0.5 0.5 0.5 0.5 0.5 0.5 0.5 0.5 0.5 0.5 0.5 0.5 0.5 0.5 0.5 0.5 0.5 0.5 0.5 0.5 0.5 0.5 0.5 0.5 0.5 0.5 0.5 0.5 0.5 0.5 0.5 0.5 0.5 0.5 0.5 0.5 0.5 0.5 0.5 0.5 0.5 0.5 0.5 0.5 0.5 0.5 0.5 0.5 0.5 0.5 0.5
105
0.5 0.5 0.5 0.5 0.5 0.5 0.5 0.5 0.5 0.5 0.5 0.5 0.5 0.5 0.5 0.5 0.5 0.5 0.5 0.5 0.5 0.5 0.5 0.5 0.5 0.5 0.5 0.5 0.5 0.5 0.5 0.5 0.5 0.5 0.5 0.5 0.5 0.5 0.5 0.5 0.5 0.5 0.5 0.5 0.5 0.5 0.5 0.5 0.5 0.5 0.5 0.5 0.5 0.5 0.5 0.5 0.5 0.5 0.5 0.5 0.5 0.5 0.5 0.5 0.5 0.5 0.5 0.5 0.5 0.5 0.5 0.5 0.5 0.5 0.5 0.5 0.5 0.5 0.5 0.5 0.5 0.5 0.5 0.5 0.5 0.5 0.5 0.5 0.5 0.5 0.5 0.5 0.5 0.5 0.5 0.5 0.5 0.5 0.5 0.5 0.5 0.5 0.5 0.5 0.5 0.5 0.5 0.5 0.5 0.5 0.5 0.5 0.5 0.5 0.5 0.5 0.5 0.5 0.5 0.5 0.5 0.5 0.5 0.5 0.5 0.5 0.5 0.5 0.5 0.5 0.5 0.5 0.5 0.5 0.5 0.5 0.5 0.5 0.5 0.5 0.5 0.5 0.5 0.5 0.5 0.5 0.5 0.5 0.5 0.5 0.5 0.5 0.5 0.5 0.5 0.5 0.5 0.5 0.5 0.5 0.5 0.5 0.5 0.5 0.5 0.5 0.5 0.5 0.5 0.5 0.5 0.5 0.5 0.5 0.5 0.5 0.5 0.5 0.5 0.5 0.5 0.5 0.5 0.5 0.5 0.5 0.5 0.5 0.5 0.5 0.5 0.5 0.5 0.5 0.5 0.5 0.5 0.5 0.5 0.5 0.5 0.5 0.5 0.5 0.5 0.5 0.5 0.5 0.5 0.5 0.5 0.5 0.5 0.5 0.5 0.5 0.5 0.5 0.5 0.5 0.5 0.5 0.5 0.5 0.5 0.5 0.5 0.5 0.5 0.5 0.5 0.5 0.5 0.5 0.5 0.5 0.5 0.5 0.5 0.5 0.5 0.5 0.5 0.5 0.5 0.5 0.5 0.5 0.5 0.5 0.5 0.5 0.5 0.5 0.5 0.5 0.5 0.5 0.5 0.5 0.5 0.5 0.5 0.5 0.5 0.5 0.5 0.5 0.5 0.5 0.5 0.5 0.5 0.5 0.5 0.5 0.5 0.5 0.5 0.5 0.5 0.5 0.5 0.5 0.5 0.5 0.5 0.5 0.5 0.5 0.5 0.5 0.5 0.5 0.5 0.5 0.5 0.5 0.5 0.5 0.5 0.5 0.5 0.5 0.5 0.5 0.5 0.5 0.5 0.5 0.5 0.5 0.5 0.5 0.5 0.5 0.5 0.5 0.5 0.5 0.5 0.5 0.5 0.5 0.5 0.5 0.5 0.5 0.5 0.5 0.5 0.5 0.5 0.5 0.5 0.5 0.5 0.5 0.5 0.5 0.5 0.5 0.5 0.5 0.5 0.5 0.5 0.5 0.5 0.5 0.5 0.5 0.5 0.5 0.5 0.5 0.5 0.5 0.5 0.5 0.5 0.5 0.5 0.5 0.5 0.5 0.5 0.5 0.5 0.5 0.5 0.5 0.5 0.5 0.5 0.5 0.5 0.5 0.5 0.5 0.5 0.5 0.5 0.5 0.5 0.5 0.5 0.5 0.5 0.5 0.5 0.5 0.5 0.5 0.5 0.5 0.5 0.5 0.5 0.5 0.5 0.5 0.5 0.5 0.5 0.5 0.5 0.5 0.5 0.5 0.5 0.5 0.5 0.5 0.5 0.5 0.5 0.5 0.5 0.5 0.5 0.5 0.5 0.5 0.5 0.5 0.5 0.5 0.5 0.5 0.5 0.5 0.5 0.5 0.5 0.5 0.5 0.5 0.5 0.5 0.5 0.5 0.5 0.5 0.5 0.5 0.5 0.5 0.5 0.5 0.5 0.5 0.5 0.5 0.5 0.5 0.5 0.5 0.5 0.5 0.5 0.5 0.5 0.5 0.5 0.5 0.5 0.5 0.5 0.5 0.5 0.5 0.5 0.5 0.5 0.5 0.5 0.5 0.5 0.5 0.5 0.5 0.5 0.5 0.5 0.5 0.5 0.5 0.5 0.5 0.5 0.5 0.5 0.5 0.5 0.5 0.5 0.5 0.5 0.5 0.5 0.5 0.5 0.5 0.5 0.5 0.5 0.5 0.5 0.5 0.5 0.5 0.5 0.5 0.5 0.5 0.5 0.5 0.5 0.5 0.5 0.5 0.5 0.5 0.5 0.5 0.5 0.5 0.5 0.5 0.5 0.5 0.5 0.5 0.5 0.5 0.5 0.5 0.5 0.5 0.5 0.5 0.5 0.5 0.5 0.5 0.5 0.5 0.5 0.5 0.5 0.5 0.5 0.5 0.5 0.5 0.5 0.5 0.5 0.5 0.5 0.5 0.5 0.5 0.5 0.5 0.5 0.5 0.5 0.5 0.5 0.5 0.5 0.5 0.5 0.5 0.5 0.5 0.5 0.5 0.5 0.5 0.5 0.5 0.5 0.5 0.5 0.5 0.5 0.5 0.5 0.5 0.5 0.5 0.5 0.5 0.5 0.5 0.5 0.5 0.5 0.5 0.5 0.5 0.5 0.5 0.5 0.5 0.5 0.5 0.5 0.5 0.5 0.5 0.5 0.5 0.5 0.5 0.5 0.5 0.5 0.5 0.5 0.5 0.5 0.5 0.5 0.5 0.5 0.5 0.5 0.5 0.5 0.5 0.5 0.5 0.5 0.5 0.5 0.5 0.5 0.5 0.5 0.5 0.5 0.5 0.5 0.5 0.5 0.5 0.5 0.5 0.5 0.5 0.5 0.5 0.5 0.5 0.5 0.5 0.5 0.5 0.5 0.5 0.5 0.5 0.5 0.5 0.5 0.5 0.5 0.5 0.5 0.5 0.5 0.5 0.5 0.5 0.5 0.5 0.5 0.5 0.5 0.5 0.5 0.5 0.5 0.5 0.5 0.5 0.5 0.5 0.5 0.5 0.5 0.5 0.5 0.5 0.5 0.5 0.5 0.5 0.5 0.5 0.5 0.5 0.5 0.5 0.5 0.5 0.5 0.5 0.5 0.5 0.5 0.5 0.5 0.5 0.5 0.5 0.5 0.5 0.5 0.5 0.5 0.5 0.5 0.5 0.5 0.5 0.5 0.5 0.5 0.5 0.5 0.5 0.5 0.5 0.5 0.5 0.5 0.5 0.5 0.5 0.5 0.5 0.5 0.5 0.5 0.5 0.5 0.5 0.5 0.5 0.5 0.5 0.5 0.5 0.5 0.5 0.5 0.5 0.5 0.5 0.5 0.5 0.5 0.5 0.5 0.5 0.5 0.5 0.5 0.5 0.5 0.5 0.5 0.5 0.5 0.5 0.5 0.5

106
0.5 0.5 0.5 0.5 0.5 0.5 0.5 0.5 0.5 0.5 0.5 0.5 0.5 0.5 0.5 0.5 0.5 0.5 0.5 0.5 0.5 0.5 0.5 0.5 0.5 0.5 0.5 0.5 0.5 0.5 0.5 0.5 0.5 0.5 0.5 0.5 0.5 0.5 0.5 0.5 0.5 0.5 0.5 0.5 0.5 0.5 0.5 0.5 0.5 0.5 0.5 0.5 0.5 0.5 0.5 0.5 0.5 0.5 0.5 0.5 0.5 0.5 0.5 0.5 0.5 0.5 0.5 0.5 0.5 0.5 0.5 0.5 0.5 0.5 0.5 0.5 0.5 0.5 0.5 0.5 0.5 0.5 0.5 0.5 0.5 0.5 0.5 0.5 0.5 0.5 0.5 0.5 0.5 0.5 0.5 0.5 0.5 0.5 0.5 0.5 0.5 0.5 0.5 0.5 0.5 0.5 0.5 0.5 0.5 0.5 0.5 0.5 0.5 0.5 0.5 0.5 0.5 0.5 0.5 0.5 0.5 0.5 0.5 0.5 0.5 0.5 0.5 0.5 0.5 0.5 0.5 0.5 0.5 0.5 0.5 0.5 0.5 0.5 0.5 0.5 0.5 0.5 0.5 0.5 0.5 0.5 0.5 0.5 0.5 0.5 0.5 0.5 0.5 0.5 0.5 0.5 0.5 0.5 0.5 0.5 0.5 0.5 0.5 0.5 0.5 0.5 0.5 0.5 0.5 0.5 0.5 0.5 0.5 0.5 0.5 0.5 0.5 0.5 0.5 0.5 0.5 0.5 0.5 0.5 0.5 0.5 0.5 0.5 0.5 0.5 0.5 0.5 0.5 0.5 0.5 0.5 0.5 0.5 0.5 0.5 0.5 0.5 0.5 0.5 0.5 0.5 0.5 0.5 0.5 0.5 0.5 0.5 0.5 0.5 0.5 0.5 0.5 0.5 0.5 0.5 0.5 0.5 0.5 0.5 0.5 0.5 0.5 0.5 0.5 0.5 0.5 0.5 0.5 0.5 0.5 0.5 0.5 0.5 0.5 0.5 0.5 0.5 0.5 0.5 0.5 0.5 0.5 0.5 0.5 0.5 0.5 0.5 0.5 0.5 0.5 0.5 0.5 0.5 0.5 0.5 0.5 0.5 0.5 0.5 0.5 0.5 0.5 0.5 0.5 0.5 0.5 0.5 0.5 0.5 0.5 0.5 0.5 0.5 0.5 0.5 0.5 0.5 0.5 0.5 0.5 0.5 0.5 0.5 0.5 0.5 0.5 0.5 0.5 0.5 0.5 0.5 0.5 0.5 0.5 0.5 0.5 0.5 0.5 0.5 0.5 0.5 0.5 0.5 0.5 0.5 0.5 0.5 0.5 0.5 0.5 0.5 0.5 0.5 0.5 0.5 0.5 0.5 0.5 0.5 0.5 0.5 0.5 0.5 0.5 0.5 0.5 0.5 0.5 0.5 0.5 0.5 0.5 0.5 0.5 0.5 0.5 0.5 0.5 0.5 0.5 0.5 0.5 0.5 0.5 0.5 0.5 0.5 0.5 0.5 0.5 0.5 0.5 0.5 0.5 0.5 0.5 0.5 0.5 0.5 0.5 0.5 0.5 0.5 0.5 0.5 0.5 0.5 0.5 0.5 0.5 0.5 0.5 0.5 0.5 0.5 0.5 0.5 0.5 0.5 0.5 0.5 0.5 0.5 0.5 0.5 0.5 0.5 0.5 0.5 0.5 0.5 0.5 0.5 0.5 0.5 0.5 0.5 0.5 0.5 0.5 0.5 0.5 0.5 0.5 0.5 0.5 0.5 0.5 0.5 0.5 0.5 0.5 0.5 0.5 0.5 0.5 0.5 0.5 0.5 0.5 0.5 0.5 0.5 0.5 0.5 0.5 0.5 0.5 0.5 0.5 0.5 0.5 0.5 0.5 0.5 0.5 0.5 0.5 0.5 0.5 0.5 0.5 0.5 0.5 0.5 0.5 0.5 0.5 0.5 0.5 0.5 0.5 0.5 0.5 0.5 0.5 0.5 0.5 0.5 0.5 0.5 0.5 0.5 0.5 0.5 0.5 0.5 0.5 0.5 0.5 0.5 0.5 0.5 0.5 0.5 0.5 0.5 0.5 0.5 0.5 0.5 0.5 0.5 0.5 0.5 0.5 0.5 0.5 0.5 0.5 0.5 0.5 0.5 0.5 0.5 0.5 0.5 0.5 0.5 0.5 0.5 0.5 0.5 0.5 0.5 0.5 0.5 0.5 0.5 0.5 0.5 0.5 0.5 0.5 0.5 0.5 0.5 0.5 0.5 0.5 0.5 0.5 0.5 0.5 0.5 0.5 0.5 0.5 0.5 0.5 0.5 0.5 0.5 0.5 0.5 0.5 0.5 0.5 0.5 0.5 0.5 0.5 0.5 0.5 0.5 0.5 0.5 0.5 0.5 0.5 0.5 0.5 0.5 0.5 0.5 0.5 0.5 0.5 0.5 0.5 0.5 0.5 0.5 0.5 0.5 0.5 0.5 0.5 0.5 0.5 0.5 0.5 0.5 0.5 0.5 0.5 0.5 0.5 0.5 0.5 0.5 0.5 0.5 0.5 0.5 0.5 0.5 0.5 0.5 0.5 0.5 0.5 0.5 0.5 0.5 0.5 0.5 0.5 0.5 0.5 0.5 0.5 0.5 0.5 0.5 0.5 0.5 0.5 0.5 0.5 0.5 0.5 0.5 0.5 0.5 0.5 0.5 0.5 0.5 0.5 0.5 0.5 0.5 0.5 0.5 0.5 0.5 0.5 0.5 0.5 0.5 0.5 0.5 0.5 0.5 0.5 0.5 0.5 0.5 0.5 0.5 0.5 0.5 0.5 0.5 0.5 0.5 0.5 0.5 0.5 0.5 0.5 0.5 0.5 0.5 0.5 0.5 0.5 0.5 0.5 0.5 0.5 0.5 0.5 0.5 0.5 0.5 0.5 0.5 0.5 0.5 0.5 0.5 0.5 0.5 0.5 0.5 0.5 0.5 0.5 0.5 0.5 0.5 0.5 0.5 0.5 0.5 0.5 0.5 0.5 0.5 0.5 0.5 0.5 0.5 0.5 0.5 0.5 0.5 0.5 0.5 0.5 0.5 0.5 0.5 0.5 0.5 0.5 0.5 0.5 0.5 0.5 0.5 0.5 0.5 0.5 0.5 0.5 0.5 0.5 0.5 0.5 0.5 0.5 0.5 0.5 0.5 0.5 0.5 0.5 0.5 0.5 0.5 0.5 0.5 0.5 0.5 0.5 0.5 0.5 0.5 0.5 0.5 0.5 0.5 0.5 0.5 0.5 0.5 0.5 0.5 0.5 0.5 0.5 0.5 0.5 0.5 0.5 0.5 0.5 0.5 0.5 0.5 0.5 0.5 0.5 0.5 0.5 0.5 0.5 0.5 0.5 0.5 0.5 0.5 0.5 0.5

107
0.5 0.5 0.5 0.5 0.5 0.5 0.5 0.5 0.5 0.5 0.5 0.5 0.5 0.5 0.5 0.5 0.5 0.5 0.5 0.5 0.5 0.5 0.5 0.5 0.5 0.5 0.5 0.5 0.5 0.5 0.5 0.5 0.5 0.5 0.5 0.5 0.5 0.5 0.5 0.5 0.5 0.5 0.5 0.5 0.5 0.5 0.5 0.5 0.5 0.5 0.5 0.5 0.5 0.5 0.5 0.5 0.5 0.5 0.5 0.5 0.5 0.5 0.5 0.5 0.5 0.5 0.5 0.5 0.5 0.5 0.5 0.5 0.5 0.5 0.5 0.5 0.5 0.5 0.5 0.5 0.5 0.5 0.5 0.5 0.5 0.5 0.5 0.5 0.5 0.5 0.5 0.5 0.5 0.5 0.5 0.5 0.5 0.5 0.5 0.5 0.5 0.5 0.5 0.5 0.5 0.5 0.5 0.5 0.5 0.5 0.5 0.5 0.5 0.5 0.5 0.5 0.5 0.5 0.5 0.5 0.5 0.5 0.5 0.5 0.5 0.5 0.5 0.5 0.5 0.5 0.5 0.5 0.5 0.5 0.5 0.5 0.5 0.5 0.5 0.5 0.5 0.5 0.5 0.5 0.5 0.5 0.5 0.5 0.5 0.5 0.5 0.5 0.5 0.5 0.5 0.5 0.5 0.5 0.5 0.5 0.5 0.5 0.5 0.5 0.5 0.5 0.5 0.5 0.5 0.5 0.5 0.5 0.5 0.5 0.5 0.5 0.5 0.5 0.5 0.5 0.5 0.5 0.5 0.5 0.5 0.5 0.5 0.5 0.5 0.5 0.5 0.5 0.5 0.5 0.5 0.5 0.5 0.5 0.5 0.5 0.5 0.5 0.5 0.5 0.5 0.5 0.5 0.5 0.5 0.5 0.5 0.5 0.5 0.5 0.5 0.5 0.5 0.5 0.5 0.5 0.5 0.5 0.5 0.5 0.5 0.5 0.5 0.5 0.5 0.5 0.5 0.5 0.5 0.5 0.5 0.5 0.5 0.5 0.5 0.5 0.5 0.5 0.5 0.5 0.5 0.5 0.5 0.5 0.5 0.5 0.5 0.5 0.5 0.5 0.5 0.5 0.5 0.5 0.5 0.5 0.5 0.5 0.5 0.5 0.5 0.5 0.5 0.5 0.5 0.5 0.5 0.5 0.5 0.5 0.5 0.5 0.5 0.5 0.5 0.5 0.5 0.5 0.5 0.5 0.5 0.5 0.5 0.5 0.5 0.5 0.5 0.5 0.5 0.5 0.5 0.5 0.5 0.5 0.5 0.5 0.5 0.5 0.5 0.5 0.5 0.5 0.5 0.5 0.5 0.5 0.5 0.5 0.5 0.5 0.5 0.5 0.5 0.5 0.5 0.5 0.5 0.5 0.5 0.5 0.5 0.5 0.5 0.5 0.5 0.5 0.5 0.5 0.5 0.5 0.5 0.5 0.5 0.5 0.5 0.5 0.5 0.5 0.5 0.5 0.5 0.5 0.5 0.5 0.5 0.5 0.5 0.5 0.5 0.5 0.5 0.5 0.5 0.5 0.5 0.5 0.5 0.5 0.5 0.5 0.5 0.5 0.5 0.5 0.5 0.5 0.5 0.5 0.5 0.5 0.5 0.5 0.5 0.5 0.5 0.5 0.5 0.5 0.5 0.5 0.5 0.5 0.5 0.5 0.5 0.5 0.5 0.5 0.5 0.5 0.5 0.5 0.5 0.5 0.5 0.5 0.5 0.5 0.5 0.5 0.5 0.5 0.5 0.5 0.5 0.5 0.5 0.5 0.5 0.5 0.5 0.5 0.5 0.5 0.5 0.5 0.5 0.5 0.5 0.5 0.5 0.5 0.5 0.5 0.5 0.5 0.5 0.5 0.5 0.5 0.5 0.5 0.5 0.5 0.5 0.5 0.5 0.5 0.5 0.5 0.5 0.5 0.5 0.5 0.5 0.5 0.5 0.5 0.5 0.5 0.5 0.5 0.5 0.5 0.5 0.5 0.5 0.5 0.5 0.5 0.5 0.5 0.5 0.5 0.5 0.5 0.5 0.5 0.5 0.5 0.5 0.5 0.5 0.5 0.5 0.5 0.5 0.5 0.5 0.5 0.5 0.5 0.5 0.5 0.5 0.5 0.5 0.5 0.5 0.5 0.5 0.5 0.5 0.5 0.5 0.5 0.5 0.5 0.5 0.5 0.5 0.5 0.5 0.5 0.5 0.5 0.5 0.5 0.5 0.5 0.5 0.5 0.5 0.5 0.5 0.5 0.5 0.5 0.5 0.5 0.5 0.5 0.5 0.5 0.5 0.5 0.5 0.5 0.5 0.5 0.5 0.5 0.5 0.5 0.5 0.5 0.5 0.5 0.5 0.5 0.5 0.5 0.5 0.5 0.5 0.5 0.5 0.5 0.5 0.5 0.5 0.5 0.5 0.5 0.5 0.5 0.5 0.5 0.5 0.5 0.5 0.5 0.5 0.5 0.5 0.5 0.5 0.5 0.5 0.5 0.5 0.5 0.5 0.5 0.5 0.5 0.5 0.5 0.5 0.5 0.5 0.5 0.5 0.5 0.5 0.5 0.5 0.5 0.5 0.5 0.5 0.5 0.5 0.5 0.5 0.5 0.5 0.5 0.5 0.5 0.5 0.5 0.5 0.5 0.5 0.5 0.5 0.5 0.5 0.5 0.5 0.5 0.5 0.5 0.5 0.5 0.5 0.5 0.5 0.5 0.5 0.5 0.5 0.5 0.5 0.5 0.5 0.5 0.5 0.5 0.5 0.5 0.5 0.5 0.5 0.5 0.5 0.5 0.5 0.5 0.5 0.5 0.5 0.5 0.5 0.5 0.5 0.5 0.5 0.5 0.5 0.5 0.5 0.5 0.5 0.5 0.5 0.5 0.5 0.5 0.5 0.5 0.5 0.5 0.5 0.5 0.5 0.5 0.5 0.5 0.5 0.5 0.5 0.5 0.5 0.5 0.5 0.5 0.5 0.5 0.5 0.5 0.5 0.5 0.5 0.5 0.5 0.5 0.5 0.5 0.5 0.5 0.5 0.5 0.5 0.5 0.5 0.5 0.5 0.5 0.5 0.5 0.5 0.5 0.5 0.5 0.5 0.5 0.5 0.5 0.5 0.5 0.5 0.5 0.5 0.5 0.5 0.5 0.5 0.5 0.5 0.5 0.5 0.5 0.5 0.5 0.5 0.5 0.5 0.5 0.5 0.5 0.5 0.5 0.5 0.5 0.5 0.5 0.5 0.5 0.5 0.5 0.5 0.5 0.5 0.5 0.5 0.5 0.5 0.5 0.5 0.5 0.5 0.5 0.5 0.5 0.5 0.5 0.5 0.5 0.5 0.5 0.5 0.5 0.5 0.5 0.5 0.5 0.5 0.5 0.5 0.5 0.5 0.5 0.5 0.5 0.5 0.5

108
0.5 0.5 0.5 0.5 0.5 0.5 0.5 0.5 0.5 0.5 0.5 0.5 0.5 0.5 0.5 0.5 0.5 0.5 0.5 0.5 0.5 0.5 0.5 0.5 0.5 0.5 0.5 0.5 0.5 0.5 0.5 0.5 0.5 0.5 0.5 0.5 0.5 0.5 0.5 0.5 0.5 0.5 0.5 0.5 0.5 0.5 0.5 0.5 0.5 0.5 0.5 0.5 0.5 0.5 0.5 0.5 0.5 0.5 0.5 0.5 0.5 0.5 0.5 0.5 0.5 0.5 0.5 0.5 0.5 0.5 0.5 0.5 0.5 0.5 0.5 0.5 0.5 0.5 0.5 0.5 0.5 0.5 0.5 0.5 0.5 0.5 0.5 0.5 0.5 0.5 0.5 0.5 0.5 0.5 0.5 0.5 0.5 0.5 0.5 0.5 0.5 0.5 0.5 0.5 0.5 0.5 0.5 0.5 0.5 0.5 0.5 0.5 0.5 0.5 0.5 0.5 0.5 0.5 0.5 0.5 0.5 0.5 0.5 0.5 0.5 0.5 0.5 0.5 0.5 0.5 0.5 0.5 0.5 0.5 0.5 0.5 0.5 0.5 0.5 0.5 0.5 0.5 0.5 0.5 0.5 0.5 0.5 0.5 0.5 0.5 0.5 0.5 0.5 0.5 0.5 0.5 0.5 0.5 0.5 0.5 0.5 0.5 0.5 0.5 0.5 0.5 0.5 0.5 0.5 0.5 0.5 0.5 0.5 0.5 0.5 0.5 0.5 0.5 0.5 0.5 0.5 0.5 0.5 0.5 0.5 0.5 0.5 0.5 0.5 0.5 0.5 0.5 0.5 0.5 0.5 0.5 0.5 0.5 0.5 0.5 0.5 0.5 0.5 0.5 0.5 0.5 0.5 0.5 0.5 0.5 0.5 0.5 0.5 0.5 0.5 0.5 0.5 0.5 0.5 0.5 0.5 0.5 0.5 0.5 0.5 0.5 0.5 0.5 0.5 0.5 0.5 0.5 0.5 0.5 0.5 0.5 0.5 0.5 0.5 0.5 0.5 0.5 0.5 0.5 0.5 0.5 0.5 0.5 0.5 0.5 0.5 0.5 0.5 0.5 0.5 0.5 0.5 0.5 0.5 0.5 0.5 0.5 0.5 0.5 0.5 0.5 0.5 0.5 0.5 0.5 0.5 0.5 0.5 0.5 0.5 0.5 0.5 0.5 0.5 0.5 0.5 0.5 0.5 0.5 0.5 0.5 0.5 0.5 0.5 0.5 0.5 0.5 0.5 0.5 0.5 0.5 0.5 0.5 0.5 0.5 0.5 0.5 0.5 0.5 0.5 0.5 0.5 0.5 0.5 0.5 0.5 0.5 0.5 0.5 0.5 0.5 0.5 0.5 0.5 0.5 0.5 0.5 0.5 0.5 0.5 0.5 0.5 0.5 0.5 0.5 0.5 0.5 0.5 0.5 0.5 0.5 0.5 0.5 0.5 0.5 0.5 0.5 0.5 0.5 0.5 0.5 0.5 0.5 0.5 0.5 0.5 0.5 0.5 0.5 0.5 0.5 0.5 0.5 0.5 0.5 0.5 0.5 0.5 0.5 0.5 0.5 0.5 0.5 0.5 0.5 0.5 0.5 0.5 0.5 0.5 0.5 0.5 0.5 0.5 0.5 0.5 0.5 0.5 0.5 0.5 0.5 0.5 0.5 0.5 0.5 0.5 0.5 0.5 0.5 0.5 0.5 0.5 0.5 0.5 0.5 0.5 0.5 0.5 0.5 0.5 0.5 0.5 0.5 0.5 0.5 0.5 0.5 0.5 0.5 0.5 0.5 0.5 0.5 0.5 0.5 0.5 0.5 0.5 0.5 0.5 0.5 0.5 0.5 0.5 0.5 0.5 0.5 0.5 0.5 0.5 0.5 0.5 0.5 0.5 0.5 0.5 0.5 0.5 0.5 0.5 0.5 0.5 0.5 0.5 0.5 0.5 0.5 0.5 0.5 0.5 0.5 0.5 0.5 0.5 0.5 0.5 0.5 0.5 0.5 0.5 0.5 0.5 0.5 0.5 0.5 0.5 0.5 0.5 0.5 0.5 0.5 0.5 0.5 0.5 0.5 0.5 0.5 0.5 0.5 0.5 0.5 0.5 0.5 0.5 0.5 0.5 0.5 0.5 0.5 0.5 0.5 0.5 0.5 0.5 0.5 0.5 0.5 0.5 0.5 0.5 0.5 0.5 0.5 0.5 0.5 0.5 0.5 0.5 0.5 0.5 0.5 0.5 0.5 0.5 0.5 0.5 0.5 0.5 0.5 0.5 0.5 0.5 0.5 0.5 0.5 0.5 0.5 0.5 0.5 0.5 0.5 0.5 0.5 0.5 0.5 0.5 0.5 0.5 0.5 0.5 0.5 0.5 0.5 0.5 0.5 0.5 0.5 0.5 0.5 0.5 0.5 0.5 0.5 0.5 0.5 0.5 0.5 0.5 0.5 0.5 0.5 0.5 0.5 0.5 0.5 0.5 0.5 0.5 0.5 0.5 0.5 0.5 0.5 0.5 0.5 0.5 0.5 0.5 0.5 0.5 0.5 0.5 0.5 0.5 0.5 0.5 0.5 0.5 0.5 0.5 0.5 0.5 0.5 0.5 0.5 0.5 0.5 0.5 0.5 0.5 0.5 0.5 0.5 0.5 0.5 0.5 0.5 0.5 0.5 0.5 0.5 0.5 0.5 0.5 0.5 0.5 0.5 0.5 0.5 0.5 0.5 0.5 0.5 0.5 0.5 0.5 0.5 0.5 0.5 0.5 0.5 0.5 0.5 0.5 0.5 0.5 0.5 0.5 0.5 0.5 0.5 0.5 0.5 0.5 0.5 0.5 0.5 0.5 0.5 0.5 0.5 0.5 0.5 0.5 0.5 0.5 0.5 0.5 0.5 0.5 0.5 0.5 0.5 0.5 0.5 0.5 0.5 0.5 0.5 0.5 0.5 0.5 0.5 0.5 0.5 0.5 0.5 0.5 0.5 0.5 0.5 0.5 0.5 0.5 0.5 0.5 0.5 0.5 0.5 0.5 0.5 0.5 0.5 0.5 0.5 0.5 0.5 0.5 0.5 0.5 0.5 0.5 0.5 0.5 0.5 0.5 0.5 0.5 0.5 0.5 0.5 0.5 0.5 0.5 0.5 0.5 0.5 0.5 0.5 0.5 0.5 0.5 0.5 0.5 0.5 0.5 0.5 0.5 0.5 0.5 0.5 0.5 0.5 0.5 0.5 0.5 0.5 0.5 0.5 0.5 0.5 0.5 0.5 0.5 0.5 0.5 0.5 0.5 0.5 0.5 0.5 0.5 0.5 0.5 0.5 0.5 0.5 0.5 0.5 0.5 0.5 0.5 0.5 0.5 0.5 0.5 0.5 0.5 0.5 0.5 0.5 0.5 0.5 0.5 0.5 0.5 0.5
109
0.5 0.5 0.5 0.5 0.5 0.5 0.5 0.5 0.5 0.5 0.5 0.5 0.5 0.5 0.5 0.5 0.5 0.5 0.5 0.5 0.5 0.5 0.5 0.5 0.5 0.5 0.5 0.5 0.5 0.5 0.5 0.5 0.5 0.5 0.5 0.5 0.5 0.5 0.5 0.5 0.5 0.5 0.5 0.5 0.5 0.5 0.5 0.5 0.5 0.5 0.5 0.5 0.5 0.5 0.5 0.5 0.5 0.5 0.5 0.5 0.5 0.5 0.5 0.5 0.5 0.5 0.5 0.5 0.5 0.5 0.5 0.5 0.5 0.5 0.5 0.5 0.5 0.5 0.5 0.5 0.5 0.5 0.5 0.5 0.5 0.5 0.5 0.5 0.5 0.5 0.5 0.5 0.5 0.5 0.5 0.5 0.5 0.5 0.5 0.5 0.5 0.5 0.5 0.5 0.5 0.5 0.5 0.5 0.5 0.5 0.5 0.5 0.5 0.5 0.5 0.5 0.5 0.5 0.5 0.5 0.5 0.5 0.5 0.5 0.5 0.5 0.5 0.5 0.5 0.5 0.5 0.5 0.5 0.5 0.5 0.5 0.5 0.5 0.5 0.5 0.5 0.5 0.5 0.5 0.5 0.5 0.5 0.5 0.5 0.5 0.5 0.5 0.5 0.5 0.5 0.5 0.5 0.5 0.5 0.5 0.5 0.5 0.5 0.5 0.5 0.5 0.5 0.5 0.5 0.5 0.5 0.5 0.5 0.5 0.5 0.5 0.5 0.5 0.5 0.5 0.5 0.5 0.5 0.5 0.5 0.5 0.5 0.5 0.5 0.5 0.5 0.5 0.5 0.5 0.5 0.5 0.5 0.5 0.5 0.5 0.5 0.5 0.5 0.5 0.5 0.5 0.5 0.5 0.5 0.5 0.5 0.5 0.5 0.5 0.5 0.5 0.5 0.5 0.5 0.5 0.5 0.5 0.5 0.5 0.5 0.5 0.5 0.5 0.5 0.5 0.5 0.5 0.5 0.5 0.5 0.5 0.5 0.5 0.5 0.5 0.5 0.5 0.5 0.5 0.5 0.5 0.5 0.5 0.5 0.5 0.5 0.5 0.5 0.5 0.5 0.5 0.5 0.5 0.5 0.5 0.5 0.5 0.5 0.5 0.5 0.5 0.5 0.5 0.5 0.5 0.5 0.5 0.5 0.5 0.5 0.5 0.5 0.5 0.5 0.5 0.5 0.5 0.5 0.5 0.5 0.5 0.5 0.5 0.5 0.5 0.5 0.5 0.5 0.5 0.5 0.5 0.5 0.5 0.5 0.5 0.5 0.5 0.5 0.5 0.5 0.5 0.5 0.5 0.5 0.5 0.5 0.5 0.5 0.5 0.5 0.5 0.5 0.5 0.5 0.5 0.5 0.5 0.5 0.5 0.5 0.5 0.5 0.5 0.5 0.5 0.5 0.5 0.5 0.5 0.5 0.5 0.5 0.5 0.5 0.5 0.5 0.5 0.5 0.5 0.5 0.5 0.5 0.5 0.5 0.5 0.5 0.5 0.5 0.5 0.5 0.5 0.5 0.5 0.5 0.5 0.5 0.5 0.5 0.5 0.5 0.5 0.5 0.5 0.5 0.5 0.5 0.5 0.5 0.5 0.5 0.5 0.5 0.5 0.5 0.5 0.5 0.5 0.5 0.5 0.5 0.5 0.5 0.5 0.5 0.5 0.5 0.5 0.5 0.5 0.5 0.5 0.5 0.5 0.5 0.5 0.5 0.5 0.5 0.5 0.5 0.5 0.5 0.5 0.5 0.5 0.5 0.5 0.5 0.5 # tag fish rep group flags 1 1 1 1 2 2 1 1 3 3 1 1 4 4 1 5 6 7 1 8 8 9 1 1 1 1 1 2 2 1 1 3 3 1 1 4 4 1 5 6 7 1 8 8 9 1 1 1 1 1 2 2 1 1 3 3 1 1 4 4 1 5 6 7 1 8 8 9 1 1 1 1 1 2 2 1 1 3 3 1 1 4 4 1 5 6 7 1 8 8 9 1 1 1 1 1 2 2 1 1 3 3 1 1 4 4 1 5 6 7 1 8 8 9 1 1 1 1 1 2 2 1 1 3 3 1 1 4 4 1 5 6 7 1 8 8 9 1 1 1 1 1 2 2 1 1 3 3 1 1 4 4 1 5 6 7 1 8 8 9 1 1 1 1 1 2 2 1 1 3 3 1 1 4 4 1 5 6 7 1 8 8 9 1 10 10 10 10 11 11 10 10 12 12 10 10 13 13 10 14 15 16 10 17 17 18 10 10 10 10 10 11 11 10 10 12 12 10 10 13 13 10 14 15 16 10 17 17 18 10 10 10 10 10 11 11 10 10 12 12 10 10 13 13 10 14 15 16 10 17 17 18 10 10 10 10 10 11 11 10 10 12 12 10 10 13 13 10 14 15 16 10 17 17 18 10 10 10 10 10 11 11 10 10 12 12 10 10 13 13 10 14 15 16 10 17 17 18 10 10 10 10 10 11 11 10 10 12 12 10 10 13 13 10 14 15 16 10 17 17 18 10 10 10 10 10 11 11 10 10 12 12 10 10 13 13 10 14 15 16 10 17 17 18 10 10 10 10 10 11 11 10 10 12 12 10 10 13 13 10 14 15 16 10 17 17 18 10 10 10 10 10 11 11 10 10 12 12 10 10 13 13 10 14 15 16 10 17 17 18 10 19 19 19 19 20 20 19 19 21 21 19 19 22 22 19 23 24 25 19 26 26 27 19 19 19 19 19 20 20 19 19 21 21 19 19 22 22 19 23 24 25 19 26 26 27 19 19 19 19 19 20 20 19 19 21 21 19 19 22 22 19 23 24 25 19 26 26 27 19 19 19 19 19 20 20 19 19 21 21 19 19 22 22 19 23 24 25 19 26 26 27 19 19 19 19 19 20 20 19 19 21 21 19 19 22 22 19 23 24 25 19 26 26 27 19 19 19 19 19 20 20 19 19 21 21 19 19 22 22 19 23 24 25 19 26 26 27 19 19 19 19 19 20 20 19 19 21 21 19 19 22 22 19 23 24 25 19 26 26 27 19 19 19 19 19 20 20 19 19 21 21 19 19 22 22 19 23 24 25 19 26 26 27 19 19 19 19 19 20 20 19 19 21 21 19 19 22 22 19 23 24 25 19 26 26 27 19 19 19 19 19 20 20 19 19 21 21 19 19 22 22 19 23 24 25 19 26 26 27 19 19 19 19 19 20 20 19 19 21 21 19 19 22 22 19 23 24 25 19 26 26 27 19 1 1 1 1 2 2 1 1 3 3 1 1 4 4 1 5 6 7 1 8 8 9 1 1 1 1 1 2 2 1 1 3 3 1 1 4 4 1 5 6 7 1 8 8 9 1 1 1 1 1 2 2 1 1 3 3 1 1 4 4 1 5 6 7 1 8 8 9 1
110
1 1 1 1 2 2 1 1 3 3 1 1 4 4 1 5 6 7 1 8 8 9 1 1 1 1 1 2 2 1 1 3 3 1 1 4 4 1 5 6 7 1 8 8 9 1 1 1 1 1 2 2 1 1 3 3 1 1 4 4 1 5 6 7 1 8 8 9 1 1 1 1 1 2 2 1 1 3 3 1 1 4 4 1 5 6 7 1 8 8 9 1 1 1 1 1 2 2 1 1 3 3 1 1 4 4 1 5 6 7 1 8 8 9 1 1 1 1 1 2 2 1 1 3 3 1 1 4 4 1 5 6 7 1 8 8 9 1 10 10 10 10 11 11 10 10 12 12 10 10 13 13 10 14 15 16 10 17 17 18 10 10 10 10 10 11 11 10 10 12 12 10 10 13 13 10 14 15 16 10 17 17 18 10 10 10 10 10 11 11 10 10 12 12 10 10 13 13 10 14 15 16 10 17 17 18 10 10 10 10 10 11 11 10 10 12 12 10 10 13 13 10 14 15 16 10 17 17 18 10 10 10 10 10 11 11 10 10 12 12 10 10 13 13 10 14 15 16 10 17 17 18 10 19 19 19 19 20 20 19 19 21 21 19 19 22 22 19 23 24 25 19 26 26 27 19 19 19 19 19 20 20 19 19 21 21 19 19 22 22 19 23 24 25 19 26 26 27 19 19 19 19 19 20 20 19 19 21 21 19 19 22 22 19 23 24 25 19 26 26 27 19 19 19 19 19 20 20 19 19 21 21 19 19 22 22 19 23 24 25 19 26 26 27 19 19 19 19 19 20 20 19 19 21 21 19 19 22 22 19 23 24 25 19 26 26 27 19 1 1 1 1 2 2 1 1 3 3 1 1 4 4 1 5 6 7 1 8 8 9 1 1 1 1 1 2 2 1 1 3 3 1 1 4 4 1 5 6 7 1 8 8 9 1 10 10 10 10 11 11 10 10 12 12 10 10 13 13 10 14 15 16 10 17 17 18 10 10 10 10 10 11 11 10 10 12 12 10 10 13 13 10 14 15 16 10 17 17 18 10 10 10 10 10 11 11 10 10 12 12 10 10 13 13 10 14 15 16 10 17 17 18 10 10 10 10 10 11 11 10 10 12 12 10 10 13 13 10 14 15 16 10 17 17 18 10 10 10 10 10 11 11 10 10 12 12 10 10 13 13 10 14 15 16 10 17 17 18 10 10 10 10 10 11 11 10 10 12 12 10 10 13 13 10 14 15 16 10 17 17 18 10 10 10 10 10 11 11 10 10 12 12 10 10 13 13 10 14 15 16 10 17 17 18 10 19 19 19 19 20 20 19 19 21 21 19 19 22 22 19 23 24 25 19 26 26 27 19 19 19 19 19 20 20 19 19 21 21 19 19 22 22 19 23 24 25 19 26 26 27 19 19 19 19 19 20 20 19 19 21 21 19 19 22 22 19 23 24 25 19 26 26 27 19 1 1 1 1 2 2 1 1 3 3 1 1 4 4 1 5 6 7 1 8 8 9 1 1 1 1 1 2 2 1 1 3 3 1 1 4 4 1 5 6 7 1 8 8 9 1 1 1 1 1 2 2 1 1 3 3 1 1 4 4 1 5 6 7 1 8 8 9 1 10 10 10 10 11 11 10 10 12 12 10 10 13 13 10 14 15 16 10 17 17 18 10 10 10 10 10 11 11 10 10 12 12 10 10 13 13 10 14 15 16 10 17 17 18 10 10 10 10 10 11 11 10 10 12 12 10 10 13 13 10 14 15 16 10 17 17 18 10 10 10 10 10 11 11 10 10 12 12 10 10 13 13 10 14 15 16 10 17 17 18 10 10 10 10 10 11 11 10 10 12 12 10 10 13 13 10 14 15 16 10 17 17 18 10 10 10 10 10 11 11 10 10 12 12 10 10 13 13 10 14 15 16 10 17 17 18 10 10 10 10 10 11 11 10 10 12 12 10 10 13 13 10 14 15 16 10 17 17 18 10 10 10 10 10 11 11 10 10 12 12 10 10 13 13 10 14 15 16 10 17 17 18 10 10 10 10 10 11 11 10 10 12 12 10 10 13 13 10 14 15 16 10 17 17 18 10 10 10 10 10 11 11 10 10 12 12 10 10 13 13 10 14 15 16 10 17 17 18 10 19 19 19 19 20 20 19 19 21 21 19 19 22 22 19 23 24 25 19 26 26 27 19 19 19 19 19 20 20 19 19 21 21 19 19 22 22 19 23 24 25 19 26 26 27 19 19 19 19 19 20 20 19 19 21 21 19 19 22 22 19 23 24 25 19 26 26 27 19 19 19 19 19 20 20 19 19 21 21 19 19 22 22 19 23 24 25 19 26 26 27 19 19 19 19 19 20 20 19 19 21 21 19 19 22 22 19 23 24 25 19 26 26 27 19 19 19 19 19 20 20 19 19 21 21 19 19 22 22 19 23 24 25 19 26 26 27 19 19 19 19 19 20 20 19 19 21 21 19 19 22 22 19 23 24 25 19 26 26 27 19 19 19 19 19 20 20 19 19 21 21 19 19 22 22 19 23 24 25 19 26 26 27 19 19 19 19 19 20 20 19 19 21 21 19 19 22 22 19 23 24 25 19 26 26 27 19 19 19 19 19 20 20 19 19 21 21 19 19 22 22 19 23 24 25 19 26 26 27 19 19 19 19 19 20 20 19 19 21 21 19 19 22 22 19 23 24 25 19 26 26 27 19 19 19 19 19 20 20 19 19 21 21 19 19 22 22 19 23 24 25 19 26 26 27 19 19 19 19 19 20 20 19 19 21 21 19 19 22 22 19 23 24 25 19 26 26 27 19 19 19 19 19 20 20 19 19 21 21 19 19 22 22 19 23 24 25 19 26 26 27 19 19 19 19 19 20 20 19 19 21 21 19 19 22 22 19 23 24 25 19 26 26 27 19 28 28 28 28 29 29 28 28 30 30 28 28 31 31 28 32 33 34 28 35 35 36 28 28 28 28 28 29 29 28 28 30 30 28 28 31 31 28 32 33 34 28 35 35 36 28 28 28 28 28 29 29 28 28 30 30 28 28 31 31 28 32 33 34 28 35 35 36 28 28 28 28 28 29 29 28 28 30 30 28 28 31 31 28 32 33 34 28 35 35 36 28 28 28 28 28 29 29 28 28 30 30 28 28 31 31 28 32 33 34 28 35 35 36 28 28 28 28 28 29 29 28 28 30 30 28 28 31 31 28 32 33 34 28 35 35 36 28 28 28 28 28 29 29 28 28 30 30 28 28 31 31 28 32 33 34 28 35 35 36 28 28 28 28 28 29 29 28 28 30 30 28 28 31 31 28 32 33 34 28 35 35 36 28 28 28 28 28 29 29 28 28 30 30 28 28 31 31 28 32 33 34 28 35 35 36 28 28 28 28 28 29 29 28 28 30 30 28 28 31 31 28 32 33 34 28 35 35 36 28 28 28 28 28 29 29 28 28 30 30 28 28 31 31 28 32 33 34 28 35 35 36 28 28 28 28 28 29 29 28 28 30 30 28 28 31 31 28 32 33 34 28 35 35 36 28

111
28 28 28 28 29 29 28 28 30 30 28 28 31 31 28 32 33 34 28 35 35 36 28 28 28 28 28 29 29 28 28 30 30 28 28 31 31 28 32 33 34 28 35 35 36 28 28 28 28 28 29 29 28 28 30 30 28 28 31 31 28 32 33 34 28 35 35 36 28 28 28 28 28 29 29 28 28 30 30 28 28 31 31 28 32 33 34 28 35 35 36 28 28 28 28 28 29 29 28 28 30 30 28 28 31 31 28 32 33 34 28 35 35 36 28 28 28 28 28 29 29 28 28 30 30 28 28 31 31 28 32 33 34 28 35 35 36 28 28 28 28 28 29 29 28 28 30 30 28 28 31 31 28 32 33 34 28 35 35 36 28 28 28 28 28 29 29 28 28 30 30 28 28 31 31 28 32 33 34 28 35 35 36 28 28 28 28 28 29 29 28 28 30 30 28 28 31 31 28 32 33 34 28 35 35 36 28 28 28 28 28 29 29 28 28 30 30 28 28 31 31 28 32 33 34 28 35 35 36 28 28 28 28 28 29 29 28 28 30 30 28 28 31 31 28 32 33 34 28 35 35 36 28 28 28 28 28 29 29 28 28 30 30 28 28 31 31 28 32 33 34 28 35 35 36 28 28 28 28 28 29 29 28 28 30 30 28 28 31 31 28 32 33 34 28 35 35 36 28 28 28 28 28 29 29 28 28 30 30 28 28 31 31 28 32 33 34 28 35 35 36 28 28 28 28 28 29 29 28 28 30 30 28 28 31 31 28 32 33 34 28 35 35 36 28 28 28 28 28 29 29 28 28 30 30 28 28 31 31 28 32 33 34 28 35 35 36 28 28 28 28 28 29 29 28 28 30 30 28 28 31 31 28 32 33 34 28 35 35 36 28 28 28 28 28 29 29 28 28 30 30 28 28 31 31 28 32 33 34 28 35 35 36 28 28 28 28 28 29 29 28 28 30 30 28 28 31 31 28 32 33 34 28 35 35 36 28 28 28 28 28 29 29 28 28 30 30 28 28 31 31 28 32 33 34 28 35 35 36 28 28 28 28 28 29 29 28 28 30 30 28 28 31 31 28 32 33 34 28 35 35 36 28 28 28 28 28 29 29 28 28 30 30 28 28 31 31 28 32 33 34 28 35 35 36 28 28 28 28 28 29 29 28 28 30 30 28 28 31 31 28 32 33 34 28 35 35 36 28 28 28 28 28 29 29 28 28 30 30 28 28 31 31 28 32 33 34 28 35 35 36 28 28 28 28 28 29 29 28 28 30 30 28 28 31 31 28 32 33 34 28 35 35 36 28 28 28 28 28 29 29 28 28 30 30 28 28 31 31 28 32 33 34 28 35 35 36 28 28 28 28 28 29 29 28 28 30 30 28 28 31 31 28 32 33 34 28 35 35 36 28 28 28 28 28 29 29 28 28 30 30 28 28 31 31 28 32 33 34 28 35 35 36 28 28 28 28 28 29 29 28 28 30 30 28 28 31 31 28 32 33 34 28 35 35 36 28 28 28 28 28 29 29 28 28 30 30 28 28 31 31 28 32 33 34 28 35 35 36 28 28 28 28 28 29 29 28 28 30 30 28 28 31 31 28 32 33 34 28 35 35 36 28 28 28 28 28 29 29 28 28 30 30 28 28 31 31 28 32 33 34 28 35 35 36 28 28 28 28 28 29 29 28 28 30 30 28 28 31 31 28 32 33 34 28 35 35 36 28 28 28 28 28 29 29 28 28 30 30 28 28 31 31 28 32 33 34 28 35 35 36 28 28 28 28 28 29 29 28 28 30 30 28 28 31 31 28 32 33 34 28 35 35 36 28 28 28 28 28 29 29 28 28 30 30 28 28 31 31 28 32 33 34 28 35 35 36 28 28 28 28 28 29 29 28 28 30 30 28 28 31 31 28 32 33 34 28 35 35 36 28 28 28 28 28 29 29 28 28 30 30 28 28 31 31 28 32 33 34 28 35 35 36 28 28 28 28 28 29 29 28 28 30 30 28 28 31 31 28 32 33 34 28 35 35 36 28 28 28 28 28 29 29 28 28 30 30 28 28 31 31 28 32 33 34 28 35 35 36 28 28 28 28 28 29 29 28 28 30 30 28 28 31 31 28 32 33 34 28 35 35 36 28 28 28 28 28 29 29 28 28 30 30 28 28 31 31 28 32 33 34 28 35 35 36 28 28 28 28 28 29 29 28 28 30 30 28 28 31 31 28 32 33 34 28 35 35 36 28 28 28 28 28 29 29 28 28 30 30 28 28 31 31 28 32 33 34 28 35 35 36 28 28 28 28 28 29 29 28 28 30 30 28 28 31 31 28 32 33 34 28 35 35 36 28 28 28 28 28 29 29 28 28 30 30 28 28 31 31 28 32 33 34 28 35 35 36 28 28 28 28 28 29 29 28 28 30 30 28 28 31 31 28 32 33 34 28 35 35 36 28 28 28 28 28 29 29 28 28 30 30 28 28 31 31 28 32 33 34 28 35 35 36 28 28 28 28 28 29 29 28 28 30 30 28 28 31 31 28 32 33 34 28 35 35 36 28 28 28 28 28 29 29 28 28 30 30 28 28 31 31 28 32 33 34 28 35 35 36 28 28 28 28 28 29 29 28 28 30 30 28 28 31 31 28 32 33 34 28 35 35 36 28 28 28 28 28 29 29 28 28 30 30 28 28 31 31 28 32 33 34 28 35 35 36 28 28 28 28 28 29 29 28 28 30 30 28 28 31 31 28 32 33 34 28 35 35 36 28 28 28 28 28 29 29 28 28 30 30 28 28 31 31 28 32 33 34 28 35 35 36 28 28 28 28 28 29 29 28 28 30 30 28 28 31 31 28 32 33 34 28 35 35 36 28 28 28 28 28 29 29 28 28 30 30 28 28 31 31 28 32 33 34 28 35 35 36 28 28 28 28 28 29 29 28 28 30 30 28 28 31 31 28 32 33 34 28 35 35 36 28 28 28 28 28 29 29 28 28 30 30 28 28 31 31 28 32 33 34 28 35 35 36 28 28 28 28 28 29 29 28 28 30 30 28 28 31 31 28 32 33 34 28 35 35 36 28 28 28 28 28 29 29 28 28 30 30 28 28 31 31 28 32 33 34 28 35 35 36 28 28 28 28 28 29 29 28 28 30 30 28 28 31 31 28 32 33 34 28 35 35 36 28 28 28 28 28 29 29 28 28 30 30 28 28 31 31 28 32 33 34 28 35 35 36 28 28 28 28 28 29 29 28 28 30 30 28 28 31 31 28 32 33 34 28 35 35 36 28 28 28 28 28 29 29 28 28 30 30 28 28 31 31 28 32 33 34 28 35 35 36 28 28 28 28 28 29 29 28 28 30 30 28 28 31 31 28 32 33 34 28 35 35 36 28 28 28 28 28 29 29 28 28 30 30 28 28 31 31 28 32 33 34 28 35 35 36 28 28 28 28 28 29 29 28 28 30 30 28 28 31 31 28 32 33 34 28 35 35 36 28 28 28 28 28 29 29 28 28 30 30 28 28 31 31 28 32 33 34 28 35 35 36 28
112
28 28 28 28 29 29 28 28 30 30 28 28 31 31 28 32 33 34 28 35 35 36 28 28 28 28 28 29 29 28 28 30 30 28 28 31 31 28 32 33 34 28 35 35 36 28 28 28 28 28 29 29 28 28 30 30 28 28 31 31 28 32 33 34 28 35 35 36 28 28 28 28 28 29 29 28 28 30 30 28 28 31 31 28 32 33 34 28 35 35 36 28 28 28 28 28 29 29 28 28 30 30 28 28 31 31 28 32 33 34 28 35 35 36 28 28 28 28 28 29 29 28 28 30 30 28 28 31 31 28 32 33 34 28 35 35 36 28 28 28 28 28 29 29 28 28 30 30 28 28 31 31 28 32 33 34 28 35 35 36 28 28 28 28 28 29 29 28 28 30 30 28 28 31 31 28 32 33 34 28 35 35 36 28 28 28 28 28 29 29 28 28 30 30 28 28 31 31 28 32 33 34 28 35 35 36 28 28 28 28 28 29 29 28 28 30 30 28 28 31 31 28 32 33 34 28 35 35 36 28 28 28 28 28 29 29 28 28 30 30 28 28 31 31 28 32 33 34 28 35 35 36 28 28 28 28 28 29 29 28 28 30 30 28 28 31 31 28 32 33 34 28 35 35 36 28 28 28 28 28 29 29 28 28 30 30 28 28 31 31 28 32 33 34 28 35 35 36 28 28 28 28 28 29 29 28 28 30 30 28 28 31 31 28 32 33 34 28 35 35 36 28 28 28 28 28 29 29 28 28 30 30 28 28 31 31 28 32 33 34 28 35 35 36 28 28 28 28 28 29 29 28 28 30 30 28 28 31 31 28 32 33 34 28 35 35 36 28 28 28 28 28 29 29 28 28 30 30 28 28 31 31 28 32 33 34 28 35 35 36 28 28 28 28 28 29 29 28 28 30 30 28 28 31 31 28 32 33 34 28 35 35 36 28 28 28 28 28 29 29 28 28 30 30 28 28 31 31 28 32 33 34 28 35 35 36 28 28 28 28 28 29 29 28 28 30 30 28 28 31 31 28 32 33 34 28 35 35 36 28 28 28 28 28 29 29 28 28 30 30 28 28 31 31 28 32 33 34 28 35 35 36 28 28 28 28 28 29 29 28 28 30 30 28 28 31 31 28 32 33 34 28 35 35 36 28 28 28 28 28 29 29 28 28 30 30 28 28 31 31 28 32 33 34 28 35 35 36 28 28 28 28 28 29 29 28 28 30 30 28 28 31 31 28 32 33 34 28 35 35 36 28 28 28 28 28 29 29 28 28 30 30 28 28 31 31 28 32 33 34 28 35 35 36 28 28 28 28 28 29 29 28 28 30 30 28 28 31 31 28 32 33 34 28 35 35 36 28 28 28 28 28 29 29 28 28 30 30 28 28 31 31 28 32 33 34 28 35 35 36 28 28 28 28 28 29 29 28 28 30 30 28 28 31 31 28 32 33 34 28 35 35 36 28 28 28 28 28 29 29 28 28 30 30 28 28 31 31 28 32 33 34 28 35 35 36 28 28 28 28 28 29 29 28 28 30 30 28 28 31 31 28 32 33 34 28 35 35 36 28 28 28 28 28 29 29 28 28 30 30 28 28 31 31 28 32 33 34 28 35 35 36 28 28 28 28 28 29 29 28 28 30 30 28 28 31 31 28 32 33 34 28 35 35 36 28 28 28 28 28 29 29 28 28 30 30 28 28 31 31 28 32 33 34 28 35 35 36 28 28 28 28 28 29 29 28 28 30 30 28 28 31 31 28 32 33 34 28 35 35 36 28 28 28 28 28 29 29 28 28 30 30 28 28 31 31 28 32 33 34 28 35 35 36 28 28 28 28 28 29 29 28 28 30 30 28 28 31 31 28 32 33 34 28 35 35 36 28 28 28 28 28 29 29 28 28 30 30 28 28 31 31 28 32 33 34 28 35 35 36 28 28 28 28 28 29 29 28 28 30 30 28 28 31 31 28 32 33 34 28 35 35 36 28 28 28 28 28 29 29 28 28 30 30 28 28 31 31 28 32 33 34 28 35 35 36 28 28 28 28 28 29 29 28 28 30 30 28 28 31 31 28 32 33 34 28 35 35 36 28 28 28 28 28 29 29 28 28 30 30 28 28 31 31 28 32 33 34 28 35 35 36 28 28 28 28 28 29 29 28 28 30 30 28 28 31 31 28 32 33 34 28 35 35 36 28 28 28 28 28 29 29 28 28 30 30 28 28 31 31 28 32 33 34 28 35 35 36 28 28 28 28 28 29 29 28 28 30 30 28 28 31 31 28 32 33 34 28 35 35 36 28 28 28 28 28 29 29 28 28 30 30 28 28 31 31 28 32 33 34 28 35 35 36 28 28 28 28 28 29 29 28 28 30 30 28 28 31 31 28 32 33 34 28 35 35 36 28 28 28 28 28 29 29 28 28 30 30 28 28 31 31 28 32 33 34 28 35 35 36 28 28 28 28 28 29 29 28 28 30 30 28 28 31 31 28 32 33 34 28 35 35 36 28 28 28 28 28 29 29 28 28 30 30 28 28 31 31 28 32 33 34 28 35 35 36 28 28 28 28 28 29 29 28 28 30 30 28 28 31 31 28 32 33 34 28 35 35 36 28 28 28 28 28 29 29 28 28 30 30 28 28 31 31 28 32 33 34 28 35 35 36 28 28 28 28 28 29 29 28 28 30 30 28 28 31 31 28 32 33 34 28 35 35 36 28 28 28 28 28 29 29 28 28 30 30 28 28 31 31 28 32 33 34 28 35 35 36 28 28 28 28 28 29 29 28 28 30 30 28 28 31 31 28 32 33 34 28 35 35 36 28 28 28 28 28 29 29 28 28 30 30 28 28 31 31 28 32 33 34 28 35 35 36 28 28 28 28 28 29 29 28 28 30 30 28 28 31 31 28 32 33 34 28 35 35 36 28 28 28 28 28 29 29 28 28 30 30 28 28 31 31 28 32 33 34 28 35 35 36 28 28 28 28 28 29 29 28 28 30 30 28 28 31 31 28 32 33 34 28 35 35 36 28 28 28 28 28 29 29 28 28 30 30 28 28 31 31 28 32 33 34 28 35 35 36 28 28 28 28 28 29 29 28 28 30 30 28 28 31 31 28 32 33 34 28 35 35 36 28 28 28 28 28 29 29 28 28 30 30 28 28 31 31 28 32 33 34 28 35 35 36 28 28 28 28 28 29 29 28 28 30 30 28 28 31 31 28 32 33 34 28 35 35 36 28 28 28 28 28 29 29 28 28 30 30 28 28 31 31 28 32 33 34 28 35 35 36 28 28 28 28 28 29 29 28 28 30 30 28 28 31 31 28 32 33 34 28 35 35 36 28 28 28 28 28 29 29 28 28 30 30 28 28 31 31 28 32 33 34 28 35 35 36 28 28 28 28 28 29 29 28 28 30 30 28 28 31 31 28 32 33 34 28 35 35 36 28 28 28 28 28 29 29 28 28 30 30 28 28 31 31 28 32 33 34 28 35 35 36 28 28 28 28 28 29 29 28 28 30 30 28 28 31 31 28 32 33 34 28 35 35 36 28
113
28 28 28 28 29 29 28 28 30 30 28 28 31 31 28 32 33 34 28 35 35 36 28 28 28 28 28 29 29 28 28 30 30 28 28 31 31 28 32 33 34 28 35 35 36 28 28 28 28 28 29 29 28 28 30 30 28 28 31 31 28 32 33 34 28 35 35 36 28 28 28 28 28 29 29 28 28 30 30 28 28 31 31 28 32 33 34 28 35 35 36 28 28 28 28 28 29 29 28 28 30 30 28 28 31 31 28 32 33 34 28 35 35 36 28 28 28 28 28 29 29 28 28 30 30 28 28 31 31 28 32 33 34 28 35 35 36 28 28 28 28 28 29 29 28 28 30 30 28 28 31 31 28 32 33 34 28 35 35 36 28 28 28 28 28 29 29 28 28 30 30 28 28 31 31 28 32 33 34 28 35 35 36 28 28 28 28 28 29 29 28 28 30 30 28 28 31 31 28 32 33 34 28 35 35 36 28 28 28 28 28 29 29 28 28 30 30 28 28 31 31 28 32 33 34 28 35 35 36 28 28 28 28 28 29 29 28 28 30 30 28 28 31 31 28 32 33 34 28 35 35 36 28 28 28 28 28 29 29 28 28 30 30 28 28 31 31 28 32 33 34 28 35 35 36 28 28 28 28 28 29 29 28 28 30 30 28 28 31 31 28 32 33 34 28 35 35 36 28 28 28 28 28 29 29 28 28 30 30 28 28 31 31 28 32 33 34 28 35 35 36 28 28 28 28 28 29 29 28 28 30 30 28 28 31 31 28 32 33 34 28 35 35 36 28 28 28 28 28 29 29 28 28 30 30 28 28 31 31 28 32 33 34 28 35 35 36 28 1 1 1 1 2 2 1 1 3 3 1 1 4 4 1 5 6 7 1 8 8 9 1 # tag_fish_rep active flags 1 1 1 1 1 1 1 1 1 1 1 1 1 1 1 1 1 1 1 1 1 1 1 1 1 1 1 1 1 1 1 1 1 1 1 1 1 1 1 1 1 1 1 1 1 1 1 1 1 1 1 1 1 1 1 1 1 1 1 1 1 1 1 1 1 1 1 1 1 1 1 1 1 1 1 1 1 1 1 1 1 1 1 1 1 1 1 1 1 1 1 1 1 1 1 1 1 1 1 1 1 1 1 1 1 1 1 1 1 1 1 1 1 1 1 1 1 1 1 1 1 1 1 1 1 1 1 1 1 1 1 1 1 1 1 1 1 1 1 1 1 1 1 1 1 1 1 1 1 1 1 1 1 1 1 1 1 1 1 1 1 1 1 1 1 1 1 1 1 1 1 1 1 1 1 1 1 1 1 1 1 1 1 1 1 1 1 1 1 1 1 1 1 1 1 1 1 1 1 1 1 1 1 1 1 1 1 1 1 1 1 1 1 1 1 1 1 1 1 1 1 1 1 1 1 1 1 1 1 1 1 1 1 1 1 1 1 1 1 1 1 1 1 1 1 1 1 1 1 1 1 1 1 1 1 1 1 1 1 1 1 1 1 1 1 1 1 1 1 1 1 1 1 1 1 1 1 1 1 1 1 1 1 1 1 1 1 1 1 1 1 1 1 1 1 1 1 1 1 1 1 1 1 1 1 1 1 1 1 1 1 1 1 1 1 1 1 1 1 1 1 1 1 1 1 1 1 1 1 1 1 1 1 1 1 1 1 1 1 1 1 1 1 1 1 1 1 1 1 1 1 1 1 1 1 1 1 1 1 1 1 1 1 1 1 1 1 1 1 1 1 1 1 1 1 1 1 1 1 1 1 1 1 1 1 1 1 1 1 1 1 1 1 1 1 1 1 1 1 1 1 1 1 1 1 1 1 1 1 1 1 1 1 1 1 1 1 1 1 1 1 1 1 1 1 1 1 1 1 1 1 1 1 1 1 1 1 1 1 1 1 1 1 1 1 1 1 1 1 1 1 1 1 1 1 1 1 1 1 1 1 1 1 1 1 1 1 1 1 1 1 1 1 1 1 1 1 1 1 1 1 1 1 1 1 1 1 1 1 1 1 1 1 1 1 1 1 1 1 1 1 1 1 1 1 1 1 1 1 1 1 1 1 1 1 1 1 1 1 1 1 1 1 1 1 1 1 1 1 1 1 1 1 1 1 1 1 1 1 1 1 1 1 1 1 1 1 1 1 1 1 1 1 1 1 1 1 1 1 1 1 1 1 1 1 1 1 1 1 1 1 1 1 1 1 1 1 1 1 1 1 1 1 1 1 1 1 1 1 1 1 1 1 1 1 1 1 1 1 1 1 1 1 1 1 1 1 1 1 1 1 1 1 1 1 1 1 1 1 1 1 1 1 1 1 1 1 1 1 1 1 1 1 1 1 1 1 1 1 1 1 1 1 1 1 1 1 1 1 1 1 1 1 1 1 1 1 1 1 1 1 1 1 1 1 1 1 1 1 1 1 1 1 1 1 1 1 1 1 1 1 1 1 1 1 1 1 1 1 1 1 1 1 1 1 1 1 1 1 1 1 1 1 1 1 1 1 1 1 1 1 1 1 1 1 1 1 1 1 1 1 1 1 1 1 1 1 1 1 1 1 1 1 1 1 1 1 1 1 1 1 1 1 1 1 1 1 1 1 1 1 1 1 1 1 1 1 1 1 1 1 1 1 1 1 1 1 1 1 1 1 1 1 1 1 1 1 1 1 1 1 1 1 1 1 1 1 1 1 1 1 1 1 1 1 1 1 1 1 1 1 1 1 1 1 1 1 1 1 1 1 1 1 1 1 1 1 1 1 1 1 1 1 1 1 1 1 1 1 1 1 1 1 1 1 1 1 1 1 1 1 1 1 1 1 1 1 1 1 1 1 1 1 1 1 1 1 1 1 1 1 1 1 1 1 1 1 1 1 1 1 1 1 1 1 1 1 1 1 1 1 1 1 1 1 1 1 1 1 1 1 1 1 1 1 1 1 1 1 1 1 1 1 1 1 1 1 1 1 1 1 1 1 1 1 1 1 1 1 1 1 1 1 1 1 1 1 1 1 1 1 1 1 1 1 1 1 1 1 1 1 1 1 1 1 1 1 1 1 1 1 1 1 1 1 1 1 1 1 1 1 1 1 1 1 1 1 1 1 1 1 1 1 1 1 1 1 1 1 1 1 1 1 1 1 1 1 1 1 1 1 1 1 1 1 1 1 1 1 1 1 1 1 1 1 1 1 1 1 1 1 1 1 1 1 1 1 1 1 1 1 1 1 1 1 1 1 1 1 1 1 1 1 1 1 1 1 1 1 1 1 1 1 1 1 1 1 1 1 1 1 1 1 1 1 1 1 1 1 1 1 1 1 1 1 1 1 1 1 1 1 1 1 1 1 1 1 1 1 1 1 1 1 1 1 1 1 1 1 1 1 1 1 1 1 1 1 1 1 1 1 1 1 1 1 1 1 1 1 1 1 1 1 1 1 1 1 1 1 1 1 1 1 1 1 1 1 1 1 1 1 1 1 1 1 1 1 1 1 1 1 1 1 1 1 1 1 1 1 1

114
1 1 1 1 1 1 1 1 1 1 1 1 1 1 1 1 1 1 1 1 1 1 1 1 1 1 1 1 1 1 1 1 1 1 1 1 1 1 1 1 1 1 1 1 1 1 1 1 1 1 1 1 1 1 1 1 1 1 1 1 1 1 1 1 1 1 1 1 1 1 1 1 1 1 1 1 1 1 1 1 1 1 1 1 1 1 1 1 1 1 1 1 1 1 1 1 1 1 1 1 1 1 1 1 1 1 1 1 1 1 1 1 1 1 1 1 1 1 1 1 1 1 1 1 1 1 1 1 1 1 1 1 1 1 1 1 1 1 1 1 1 1 1 1 1 1 1 1 1 1 1 1 1 1 1 1 1 1 1 1 1 1 1 1 1 1 1 1 1 1 1 1 1 1 1 1 1 1 1 1 1 1 1 1 1 1 1 1 1 1 1 1 1 1 1 1 1 1 1 1 1 1 1 1 1 1 1 1 1 1 1 1 1 1 1 1 1 1 1 1 1 1 1 1 1 1 1 1 1 1 1 1 1 1 1 1 1 1 1 1 1 1 1 1 1 1 1 1 1 1 1 1 1 1 1 1 1 1 1 1 1 1 1 1 1 1 1 1 1 1 1 1 1 1 1 1 1 1 1 1 1 1 1 1 1 1 1 1 1 1 1 1 1 1 1 1 1 1 1 1 1 1 1 1 1 1 1 1 1 1 1 1 1 1 1 1 1 1 1 1 1 1 1 1 1 1 1 1 1 1 1 1 1 1 1 1 1 1 1 1 1 1 1 1 1 1 1 1 1 1 1 1 1 1 1 1 1 1 1 1 1 1 1 1 1 1 1 1 1 1 1 1 1 1 1 1 1 1 1 1 1 1 1 1 1 1 1 1 1 1 1 1 1 1 1 1 1 1 1 1 1 1 1 1 1 1 1 1 1 1 1 1 1 1 1 1 1 1 1 1 1 1 1 1 1 1 1 1 1 1 1 1 1 1 1 1 1 1 1 1 1 1 1 1 1 1 1 1 1 1 1 1 1 1 1 1 1 1 1 1 1 1 1 1 1 1 1 1 1 1 1 1 1 1 1 1 1 1 1 1 1 1 1 1 1 1 1 1 1 1 1 1 1 1 1 1 1 1 1 1 1 1 1 1 1 1 1 1 1 1 1 1 1 1 1 1 1 1 1 1 1 1 1 1 1 1 1 1 1 1 1 1 1 1 1 1 1 1 1 1 1 1 1 1 1 1 1 1 1 1 1 1 1 1 1 1 1 1 1 1 1 1 1 1 1 1 1 1 1 1 1 1 1 1 1 1 1 1 1 1 1 1 1 1 1 1 1 1 1 1 1 1 1 1 1 1 1 1 1 1 1 1 1 1 1 1 1 1 1 1 1 1 1 1 1 1 1 1 1 1 1 1 1 1 1 1 1 1 1 1 1 1 1 1 1 1 1 1 1 1 1 1 1 1 1 1 1 1 1 1 1 1 1 1 1 1 1 1 1 1 1 1 1 1 1 1 1 1 1 1 1 1 1 1 1 1 1 1 1 1 1 1 1 1 1 1 1 1 1 1 1 1 1 1 1 1 1 1 1 1 1 1 1 1 1 1 1 1 1 1 1 1 1 1 1 1 1 1 1 1 1 1 1 1 1 1 1 1 1 1 1 1 1 1 1 1 1 1 1 1 1 1 1 1 1 1 1 1 1 1 1 1 1 1 1 1 1 1 1 1 1 1 1 1 1 1 1 1 1 1 1 1 1 1 1 1 1 1 1 1 1 1 1 1 1 1 1 1 1 1 1 1 1 1 1 1 1 1 1 1 1 1 1 1 1 1 1 1 1 1 1 1 1 1 1 1 1 1 1 1 1 1 1 1 1 1 1 1 1 1 1 1 1 1 1 1 1 1 1 1 1 1 1 1 1 1 1 1 1 1 1 1 1 1 1 1 1 1 1 1 1 1 1 1 1 1 1 1 1 1 1 1 1 1 1 1 1 1 1 1 1 1 1 1 1 1 1 1 1 1 1 1 1 1 1 1 1 1 1 1 1 1 1 1 1 1 1 1 1 1 1 1 1 1 1 1 1 1 1 1 1 1 1 1 1 1 1 1 1 1 1 1 1 1 1 1 1 1 1 1 1 1 1 1 1 1 1 1 1 1 1 1 1 1 1 1 1 1 1 1 1 1 1 1 1 1 1 1 1 1 1 1 1 1 1 1 1 1 1 1 1 1 1 1 1 1 1 1 1 1 1 1 1 1 1 1 1 1 1 1 1 1 1 1 1 1 1 1 1 1 1 1 1 1 1 1 1 1 1 1 1 1 1 1 1 1 1 1 1 1 1 1 1 1 1 1 1 1 1 1 1 1 1 1 1 1 1 1 1 1 1 1 1 1 1 1 1 1 1 1 1 1 1 1 1 1 1 1 1 1 1 1 1 1 1 1 1 1 1 1 1 1 1 1 1 1 1 1 1 1 1 1 1 1 1 1 1 1 1 1 1 1 1 1 1 1 1 1 1 1 1 1 1 1 1 1 1 1 1 1 1 1 1 1 1 1 1 1 1 1 1 1 1 1 1 1 1 1 1 1 1 1 1 1 1 1 1 1 1 1 1 1 1 1 1 1 1 1 1 1 1 1 1 1 1 1 1 1 1 1 1 1 1 1 1 1 1 1 1 1 1 1 1 1 1 1 1 1 1 1 1 1 1 1 1 1 1 1 1 1 1 1 1 1 1 1 1 1 1 1 1 1 1 1 1 1 1 1 1 1 1 1 1 1 1 1 1 1 1 1 1 1 1 1 1 1 1 1 1 1 1 1 1 1 1 1 1 1 1 1 1 1 1 1 1 1 1 1 1 1 1 1 1 1 1 1 1 1 1 1 1 1 1 1 1 1 1 1 1 1 1 1 1 1 1 1 1 1 1 1 1 1 1 1 1 1 1 1 1 1 1 1 1 1 1 1 1 1 1 1 1 1 1 1 1 1 1 1 1 1 1 1 1 1 1 1 1 1 1 1 1 1 1 1 1 1 1 1 1 1 1 1 1 1 1 1 1 1 1 1 1 1 1 1 1 1 1 1 1 1 1 1 1 1 1 1 1 1 1 1 1 1 1 1 1 1 1 1 1 1 1 1 1 1 1 1 1 1 1 1 1 1 1 1 1 1 1 1 1 1 1 1 1 1 1 1 1 1 1 1 1 1 1 1 1 1 1 1 1 1 1 1 1 1 1 1 1 1 1 1 1 1 1 1 1 1 1 1 1 1 1 1 1 1 1 1 1 1 1 1 1 1 1 1 1 1 1 1 1 1 1 1 1 1 1 1 1 1 1 1 1 1 1 1 1 1 1 1 1 1 1 1 1 1 1 1 1 1 1 1 1 1 1 1 1 1 1 1 1 1 1 1 1 1 1 1 1 1 1 1 1 1 1 1 1 1 1 1 1 1 1 1 1 1 1 1 1 1 1 1 1 1 1 1 1 1 1 1 1 1 1 1 1 1 1 1 1 1 1 1 1 1 1 1 1 1 1 1 1 1 1 1 1 1

115
1 1 1 1 1 1 1 1 1 1 1 1 1 1 1 1 1 1 1 1 1 1 1 1 1 1 1 1 1 1 1 1 1 1 1 1 1 1 1 1 1 1 1 1 1 1 1 1 1 1 1 1 1 1 1 1 1 1 1 1 1 1 1 1 1 1 1 1 1 1 1 1 1 1 1 1 1 1 1 1 1 1 1 1 1 1 1 1 1 1 1 1 1 1 1 1 1 1 1 1 1 1 1 1 1 1 1 1 1 1 1 1 1 1 1 1 1 1 1 1 1 1 1 1 1 1 1 1 1 1 1 1 1 1 1 1 1 1 1 1 1 1 1 1 1 1 1 1 1 1 1 1 1 1 1 1 1 1 1 1 1 1 1 1 1 1 1 1 1 1 1 1 1 1 1 1 1 1 1 1 1 1 1 1 1 1 1 1 1 1 1 1 1 1 1 1 1 1 1 1 1 1 1 1 1 1 1 1 1 1 1 1 1 1 1 1 1 1 1 1 1 1 1 1 1 1 1 1 1 1 1 1 1 1 1 1 1 1 1 1 1 1 1 1 1 1 1 1 1 1 1 1 1 1 1 1 1 1 1 1 1 1 1 1 1 1 1 1 1 1 1 1 1 1 1 1 1 1 1 1 1 1 1 1 1 1 1 1 1 1 1 1 1 1 1 1 1 1 1 1 1 1 1 1 1 1 1 1 1 1 1 1 1 1 1 1 1 1 1 1 1 1 1 1 1 1 1 1 1 1 1 1 1 1 1 1 1 1 1 1 1 1 1 1 1 1 1 1 1 1 1 1 1 1 1 1 1 1 1 1 1 1 1 1 1 1 1 1 1 1 1 1 1 1 1 1 1 1 1 1 1 1 1 1 1 1 1 1 1 1 1 1 1 1 1 1 1 1 1 1 1 1 1 1 1 1 1 1 1 1 1 1 1 1 1 1 1 1 1 1 1 1 1 1 1 1 1 1 1 1 1 1 1 1 1 1 1 1 1 1 1 1 1 1 1 1 1 1 1 1 1 1 1 1 1 1 1 1 1 1 1 1 1 1 1 1 1 1 1 1 1 1 1 1 1 1 1 1 1 1 1 1 1 1 1 1 1 1 1 1 1 1 1 1 1 1 1 1 1 1 1 1 1 1 1 1 1 1 1 1 1 1 1 1 1 1 1 1 1 1 1 1 1 1 1 1 1 1 1 1 1 1 1 1 1 1 1 1 1 1 1 1 1 1 1 1 1 1 1 1 1 1 1 1 1 1 1 1 1 1 1 1 1 1 1 1 1 1 1 1 1 1 1 1 1 1 1 1 1 1 1 1 1 1 1 1 1 1 1 1 1 1 1 1 1 1 1 1 1 1 1 1 1 1 1 1 1 1 1 1 1 1 1 1 1 1 1 1 1 1 1 1 1 1 1 1 1 1 1 1 1 1 1 1 1 1 1 1 1 1 1 1 1 1 1 1 1 1 1 1 1 1 1 1 1 1 1 1 1 1 1 1 1 1 1 1 1 1 1 1 1 1 1 1 1 1 1 1 1 1 1 1 1 1 1 1 1 1 1 1 1 1 1 1 1 1 1 1 1 1 1 1 1 1 1 1 1 1 1 1 1 1 1 1 1 1 1 1 1 1 1 1 1 1 1 1 1 1 1 1 1 1 1 1 1 1 1 1 1 1 1 1 1 1 1 1 1 1 1 1 1 1 1 1 1 1 1 1 1 1 1 1 1 1 1 1 1 1 1 1 1 1 1 1 1 1 1 1 1 1 1 1 1 1 1 1 1 1 1 1 1 1 1 1 1 1 1 1 1 1 1 1 1 1 1 1 1 1 1 1 1 1 1 1 1 1 1 1 1 1 1 1 1 1 1 1 1 1 1 1 1 1 1 1 1 1 1 1 1 1 1 1 1 1 1 1 1 1 1 1 1 1 1 1 1 1 1 1 1 1 1 1 1 1 1 1 1 1 1 1 1 1 1 1 1 1 1 1 1 1 1 1 1 1 1 1 1 1 1 1 1 1 1 1 1 1 1 1 1 1 1 1 1 1 1 1 1 1 1 1 1 1 1 1 1 1 1 1 1 1 1 1 1 1 1 1 1 1 1 1 1 1 1 1 1 1 1 1 1 1 1 1 1 1 1 1 1 1 1 1 1 1 1 1 1 1 1 1 1 1 1 1 1 1 1 1 1 1 1 1 1 1 1 1 1 1 1 1 1 1 1 1 1 1 1 1 1 1 1 1 1 1 1 1 1 1 1 1 1 1 1 1 1 1 1 1 1 1 1 1 1 1 1 1 1 1 1 1 1 1 1 1 1 1 1 1 1 1 1 1 1 1 1 1 1 1 1 1 1 1 1 1 1 1 1 1 1 1 1 1 1 1 1 1 1 1 1 1 1 1 1 1 1 1 1 1 1 1 1 1 1 1 1 1 1 1 1 1 1 1 1 1 1 1 1 1 1 1 1 1 1 1 1 1 1 1 1 1 1 1 1 1 1 1 1 1 1 1 1 1 1 1 1 1 1 1 1 1 1 1 1 1 1 1 1 1 1 1 1 1 1 1 1 1 1 1 1 1 1 1 1 1 1 1 1 1 1 1 1 1 1 1 1 1 1 1 1 1 1 1 1 1 1 1 1 1 1 1 1 1 1 1 1 1 1 1 1 1 1 1 1 1 1 1 1 1 1 1 1 1 1 1 1 1 1 1 1 1 1 1 1 1 1 1 1 1 1 1 1 1 1 1 1 1 1 1 1 1 1 1 1 1 1 1 1 1 1 1 1 1 1 1 1 1 1 1 1 1 1 1 1 1 1 1 1 1 1 1 1 1 1 1 1 1 1 1 1 1 1 1 1 1 1 1 1 1 1 1 1 1 1 1 1 1 1 1 1 1 1 1 1 1 1 1 1 1 1 1 1 1 1 1 1 1 1 1 1 1 1 1 1 1 1 1 1 1 1 1 1 1 1 1 1 1 1 1 1 1 1 1 1 1 1 1 1 1 1 1 1 1 1 1 1 1 1 1 1 1 1 1 1 1 1 1 1 1 1 1 1 1 1 1 1 1 1 1 1 1 1 1 1 1 1 1 1 1 1 1 1 1 1 1 1 1 1 1 1 1 1 1 1 1 1 1 1 1 1 1 1 1 1 1 1 1 1 1 1 1 1 1 1 1 1 1 1 1 1 1 1 1 1 1 1 1 1 1 1 1 1 1 1 1 1 1 1 1 1 1 1 1 1 1 1 1 1 1 1 1 1 1 1 1 1 1 1 1 1 1 1 1 1 1 1 1 1 1 1 1 1 1 1 1 1 1 1 1 1 1 1 1 1 1 1 1 1 1 1 1 1 1 1 1 1 1 1 1 1 1 1 1 1 1 1 1 1 1 1 1 1 1 1 1 1 1 1 1 1 1 1 1 1 1 1 1 1 1 1 1 1 1 1 1 1 1 1 1 1 1 1 1 1 1 1 1 1 1 1 1 1 1 1 1 1 1 1 1 1 1 1 1 1 1 1 1 1 1 1 1 1 1 1 1 1 1

116
1 1 1 1 1 1 1 1 1 1 1 1 1 1 1 1 1 1 1 1 1 1 1 1 1 1 1 1 1 1 1 1 1 1 1 1 1 1 1 1 1 1 1 1 1 1 1 1 1 1 1 1 1 1 1 1 1 1 1 1 1 1 1 1 1 1 1 1 1 1 1 1 1 1 1 1 1 1 1 1 1 1 1 1 1 1 1 1 1 1 1 1 1 1 1 1 1 1 1 1 1 1 1 1 1 1 1 1 1 1 1 1 1 1 1 1 1 1 1 1 1 1 1 1 1 1 1 1 1 1 1 1 1 1 1 1 1 1 1 1 1 1 1 1 1 1 1 1 1 1 1 1 1 1 1 1 1 1 1 1 1 1 1 1 1 1 1 1 1 1 1 1 1 1 1 1 1 1 1 1 1 1 1 1 1 1 1 1 1 1 1 1 1 1 1 1 1 1 1 1 1 1 1 1 1 1 1 1 1 1 1 1 1 1 1 1 1 1 1 1 1 1 1 1 1 1 1 1 1 1 1 1 1 1 1 1 1 1 1 1 1 1 1 1 1 1 1 1 1 1 1 1 1 1 1 1 1 1 1 1 1 1 1 1 1 1 1 1 1 1 1 1 1 1 1 1 1 1 1 1 1 1 1 1 1 1 1 1 1 1 1 1 1 1 1 1 1 1 1 1 1 1 1 1 1 1 1 1 1 1 1 1 1 1 1 1 1 1 1 1 1 1 1 1 1 1 1 1 1 1 1 1 1 1 1 1 1 1 1 1 1 1 1 1 1 1 1 1 1 1 1 1 1 1 1 1 1 1 1 1 1 1 1 1 1 1 1 1 1 1 1 1 1 1 1 1 1 1 1 1 1 1 1 1 1 1 1 1 1 1 1 1 1 1 1 1 1 1 1 1 1 1 1 1 1 1 1 1 1 1 1 1 1 1 1 1 1 1 1 1 1 1 1 1 1 1 1 1 1 1 1 1 1 1 1 1 1 1 1 1 1 1 1 1 1 1 1 1 1 1 1 1 1 1 1 1 1 1 1 1 1 1 1 1 1 1 1 1 1 1 1 1 1 1 1 1 1 1 1 1 1 1 1 1 1 1 1 1 1 1 1 1 1 1 1 1 1 1 1 1 1 1 1 1 1 1 1 1 1 1 1 1 1 1 1 1 1 1 1 1 1 1 1 1 1 1 1 1 1 1 1 1 1 1 1 1 1 1 1 1 1 1 1 1 1 1 1 1 1 1 1 1 1 1 1 1 1 1 1 1 1 1 1 1 1 1 1 1 1 1 1 1 1 1 1 1 1 1 1 1 1 1 1 1 1 1 1 1 1 1 1 1 1 1 1 1 1 1 1 1 1 1 1 1 1 1 1 1 1 1 1 1 1 1 1 1 1 1 1 1 1 1 1 1 1 1 1 1 1 1 1 1 1 1 1 1 1 1 1 1 1 1 1 1 1 1 1 1 1 1 1 1 1 1 1 1 1 1 1 1 1 1 1 1 1 1 1 1 1 1 1 1 1 1 1 1 1 1 1 1 1 1 1 1 1 1 1 1 1 1 1 1 1 1 1 1 1 1 1 1 1 1 1 1 1 1 1 1 1 1 1 1 1 1 1 1 1 1 1 1 1 1 1 1 1 1 1 1 1 1 1 1 1 1 1 1 1 1 1 1 1 1 1 1 1 1 1 1 1 1 1 1 1 1 1 1 1 1 1 1 1 1 1 1 1 1 1 1 1 1 1 1 1 1 1 1 1 1 1 1 1 1 1 1 1 1 1 1 1 1 1 1 1 1 1 1 1 1 1 1 1 1 1 1 1 1 1 1 1 1 1 1 1 1 1 1 1 1 1 1 1 1 1 1 1 1 1 1 1 1 1 1 1 1 1 1 1 1 1 1 1 1 1 1 1 1 1 1 1 1 1 1 1 1 1 1 1 1 1 1 1 1 1 1 1 1 1 1 1 1 1 1 1 1 1 1 1 1 1 1 1 1 1 1 1 1 1 1 1 1 1 1 1 1 1 1 1 1 1 1 1 1 1 1 1 1 1 1 1 1 1 1 1 1 1 1 1 1 1 1 1 1 1 1 1 1 1 1 1 1 1 1 1 1 1 1 1 1 1 1 1 1 1 1 1 1 1 1 1 1 1 1 1 1 1 1 1 1 1 1 1 1 1 1 1 1 1 1 1 1 1 1 1 1 1 1 1 1 1 1 1 1 1 1 1 1 1 1 1 1 1 1 1 1 1 1 1 1 1 1 1 1 1 1 1 1 1 1 1 1 1 1 1 1 1 1 1 1 1 1 1 1 1 1 1 1 1 1 1 1 1 1 1 1 1 1 1 1 1 1 1 1 1 1 1 1 1 1 1 1 1 1 1 1 1 1 1 1 1 1 1 1 1 1 1 1 1 1 1 1 1 1 1 1 1 1 1 1 1 1 1 1 1 1 1 1 1 1 1 1 1 1 1 1 1 1 1 1 1 1 1 1 1 1 1 1 1 1 1 1 1 1 1 1 1 1 1 1 1 1 1 1 1 1 1 1 1 1 1 1 1 1 1 1 1 1 1 1 1 1 1 1 1 1 1 1 1 1 1 1 1 1 1 1 1 1 1 1 1 1 1 1 1 1 1 1 1 1 1 1 1 1 1 1 1 1 1 1 1 1 1 1 1 1 1 1 1 1 1 1 1 1 1 1 1 1 1 1 1 1 1 1 1 1 1 1 1 1 1 1 1 1 1 1 1 1 1 1 1 1 1 1 1 1 1 1 1 1 1 1 1 1 1 1 1 1 1 1 1 1 1 1 1 1 1 1 1 1 1 1 1 1 1 1 1 1 1 1 1 1 1 1 1 1 1 1 1 1 1 1 1 1 1 1 1 1 1 1 1 1 1 1 1 1 1 1 1 1 1 1 1 1 1 1 1 1 1 1 1 1 1 1 1 1 1 1 1 1 1 1 1 1 1 1 1 1 1 1 1 1 1 1 1 1 1 1 1 1 1 1 1 1 1 1 1 1 1 1 1 1 1 1 1 1 1 1 1 1 1 1 1 1 1 1 1 1 1 1 1 1 1 1 1 1 1 1 1 1 1 1 1 1 1 1 1 1 1 1 1 1 1 1 1 1 1 1 1 1 1 1 1 1 1 1 1 1 1 1 1 1 1 1 1 1 1 1 1 1 1 1 1 1 1 1 1 1 1 1 1 1 1 1 1 1 1 1 1 1 1 1 1 1 1 1 1 1 1 1 1 1 1 1 1 1 1 1 1 1 1 1 1 1 1 1 1 1 1 1 1 1 1 1 1 1 1 1 1 1 1 1 1 1 1 1 1 1 1 1 1 1 1 1 1 1 1 1 1 1 1 1 1 1 1 1 1 1 1 1 1 1 1 1 1 1 1 1 1 1 1 1 1 1 1 1 1 1 1 1 # tag_fish_rep target 50 50 50 50 50 50 50 50 50 50 50 50 50 50 50 50 50 50 50 50 50 50 50
117
50 50 50 50 50 50 50 50 50 50 50 50 50 50 50 50 50 50 50 50 50 50 50 50 50 50 50 50 50 50 50 50 50 50 50 50 50 50 50 50 50 50 50 50 50 50 50 50 50 50 50 50 50 50 50 50 50 50 50 50 50 50 50 50 50 50 50 50 50 50 50 50 50 50 50 50 50 50 50 50 50 50 50 50 50 50 50 50 50 50 50 50 50 50 50 50 50 50 50 50 50 50 50 50 50 50 50 50 50 50 50 50 50 50 50 50 50 50 50 50 50 50 50 50 50 50 50 50 50 50 50 50 50 50 50 50 50 50 50 50 50 50 50 50 50 50 50 50 50 50 50 50 50 50 50 50 50 50 50 50 50 50 50 50 50 58.6 58.6 50 50 58.6 58.6 50 50 58.6 58.6 50 76.4 76.4 76.4 50 50 50 50 50 50 50 50 50 58.6 58.6 50 50 58.6 58.6 50 50 58.6 58.6 50 76.4 76.4 76.4 50 50 50 50 50 50 50 50 50 58.6 58.6 50 50 58.6 58.6 50 50 58.6 58.6 50 76.4 76.4 76.4 50 50 50 50 50 50 50 50 50 58.6 58.6 50 50 58.6 58.6 50 50 58.6 58.6 50 76.4 76.4 76.4 50 50 50 50 50 50 50 50 50 58.6 58.6 50 50 58.6 58.6 50 50 58.6 58.6 50 76.4 76.4 76.4 50 50 50 50 50 50 50 50 50 58.6 58.6 50 50 58.6 58.6 50 50 58.6 58.6 50 76.4 76.4 76.4 50 50 50 50 50 50 50 50 50 58.6 58.6 50 50 58.6 58.6 50 50 58.6 58.6 50 76.4 76.4 76.4 50 50 50 50 50 50 50 50 50 58.6 58.6 50 50 58.6 58.6 50 50 58.6 58.6 50 76.4 76.4 76.4 50 50 50 50 50 50 50 50 50 58.6 58.6 50 50 58.6 58.6 50 50 58.6 58.6 50 76.4 76.4 76.4 50 50 50 50 50 50 50 50 50 61.7594 61.7594 50 50 68.2725 68.2725 50 50 55.0997 55.0997 50 50 50 50 50 50 50 50 50 50 50 50 50 61.7594 61.7594 50 50 68.2725 68.2725 50 50 55.0997 55.0997 50 50 50 50 50 50 50 50 50 50 50 50 50 61.7594 61.7594 50 50 68.2725 68.2725 50 50 55.0997 55.0997 50 50 50 50 50 50 50 50 50 50 50 50 50 61.7594 61.7594 50 50 68.2725 68.2725 50 50 55.0997 55.0997 50 50 50 50 50 50 50 50 50 50 50 50 50 61.7594 61.7594 50 50 68.2725 68.2725 50 50 55.0997 55.0997 50 50 50 50 50 50 50 50 50 50 50 50 50 61.7594 61.7594 50 50 68.2725 68.2725 50 50 55.0997 55.0997 50 50 50 50 50 50 50 50 50 50 50 50 50 61.7594 61.7594 50 50 68.2725 68.2725 50 50 55.0997 55.0997 50 50 50 50 50 50 50 50 50 50 50 50 50 61.7594 61.7594 50 50 68.2725 68.2725 50 50 55.0997 55.0997 50 50 50 50 50 50 50 50 50 50 50 50 50 61.7594 61.7594 50 50 68.2725 68.2725 50 50 55.0997 55.0997 50 50 50 50 50 50 50 50 50 50 50 50 50 61.7594 61.7594 50 50 68.2725 68.2725 50 50 55.0997 55.0997 50 50 50 50 50 50 50 50 50 50 50 50 50 61.7594 61.7594 50 50 68.2725 68.2725 50 50 55.0997 55.0997 50 50 50 50 50 50 50 50 50 50 50 50 50 50 50 50 50 50 50 50 50 50 50 50 50 50 50 50 50 50 50 50 50 50 50 50 50 50 50 50 50 50 50 50 50 50 50 50 50 50 50 50 50 50 50 50 50 50 50 50 50 50 50 50 50 50 50 50 50 50 50 50 50 50 50 50 50 50 50 50 50 50 50 50 50 50 50 50 50 50 50 50 50 50 50 50 50 50 50 50 50 50 50 50 50 50 50 50 50 50 50 50 50 50 50 50 50 50 50 50 50 50 50 50 50 50 50 50 50 50 50 50 50 50 50 50 50 50 50 50 50 50 50 50 50 50 50 50 50 50 50 50 50 50 50 50 50 50 50 50 50 50 50 50 50 50 50 50 50 50 50 50 50 50 50 50 50 50 50 50 50 50 50 50 50 50 50 50 50 50 50 50 50 50 50 50 50 50 50 50 50 50 50 50 50 50 50 50 50 50 50 50 50 50 50 50 50 50 50 50 58.6 58.6 50 50 58.6 58.6 50 50 58.6 58.6 50 76.4 76.4 76.4 50 50 50 50 50 50 50 50 50 58.6 58.6 50 50 58.6 58.6 50 50 58.6 58.6 50 76.4 76.4 76.4 50 50 50 50 50 50 50 50 50 58.6 58.6 50 50 58.6 58.6 50 50 58.6 58.6 50 76.4 76.4 76.4 50 50 50 50 50 50 50 50 50 58.6 58.6 50 50 58.6 58.6 50 50 58.6 58.6 50 76.4 76.4 76.4 50 50 50 50 50 50 50 50 50 58.6 58.6 50 50 58.6 58.6 50 50 58.6 58.6 50 76.4 76.4 76.4 50 50 50 50 50 50 50 50 50 61.7594 61.7594 50 50 68.2725 68.2725 50 50 55.0997 55.0997 50 50 50 50 50 50 50 50 50
118
50 50 50 50 61.7594 61.7594 50 50 68.2725 68.2725 50 50 55.0997 55.0997 50 50 50 50 50 50 50 50 50 50 50 50 50 61.7594 61.7594 50 50 68.2725 68.2725 50 50 55.0997 55.0997 50 50 50 50 50 50 50 50 50 50 50 50 50 61.7594 61.7594 50 50 68.2725 68.2725 50 50 55.0997 55.0997 50 50 50 50 50 50 50 50 50 50 50 50 50 61.7594 61.7594 50 50 68.2725 68.2725 50 50 55.0997 55.0997 50 50 50 50 50 50 50 50 50 50 50 50 50 50 50 50 50 50 50 50 50 50 50 50 50 50 50 50 50 50 50 50 50 50 50 50 50 50 50 50 50 50 50 50 50 50 50 50 50 50 50 50 50 50 50 50 50 50 50 58.6 58.6 50 50 58.6 58.6 50 50 58.6 58.6 50 76.4 76.4 76.4 50 50 50 50 50 50 50 50 50 58.6 58.6 50 50 58.6 58.6 50 50 58.6 58.6 50 76.4 76.4 76.4 50 50 50 50 50 50 50 50 50 58.6 58.6 50 50 58.6 58.6 50 50 58.6 58.6 50 76.4 76.4 76.4 50 50 50 50 50 50 50 50 50 58.6 58.6 50 50 58.6 58.6 50 50 58.6 58.6 50 76.4 76.4 76.4 50 50 50 50 50 50 50 50 50 58.6 58.6 50 50 58.6 58.6 50 50 58.6 58.6 50 76.4 76.4 76.4 50 50 50 50 50 50 50 50 50 58.6 58.6 50 50 58.6 58.6 50 50 58.6 58.6 50 76.4 76.4 76.4 50 50 50 50 50 50 50 50 50 58.6 58.6 50 50 58.6 58.6 50 50 58.6 58.6 50 76.4 76.4 76.4 50 50 50 50 50 50 50 50 50 61.7594 61.7594 50 50 68.2725 68.2725 50 50 55.0997 55.0997 50 50 50 50 50 50 50 50 50 50 50 50 50 61.7594 61.7594 50 50 68.2725 68.2725 50 50 55.0997 55.0997 50 50 50 50 50 50 50 50 50 50 50 50 50 61.7594 61.7594 50 50 68.2725 68.2725 50 50 55.0997 55.0997 50 50 50 50 50 50 50 50 50 50 50 50 50 50 50 50 50 50 50 50 50 50 50 50 50 50 50 50 50 50 50 50 50 50 50 50 50 50 50 50 50 50 50 50 50 50 50 50 50 50 50 50 50 50 50 50 50 50 50 50 50 50 50 50 50 50 50 50 50 50 50 50 50 50 50 50 50 50 50 50 50 50 58.6 58.6 50 50 58.6 58.6 50 50 58.6 58.6 50 76.4 76.4 76.4 50 50 50 50 50 50 50 50 50 58.6 58.6 50 50 58.6 58.6 50 50 58.6 58.6 50 76.4 76.4 76.4 50 50 50 50 50 50 50 50 50 58.6 58.6 50 50 58.6 58.6 50 50 58.6 58.6 50 76.4 76.4 76.4 50 50 50 50 50 50 50 50 50 58.6 58.6 50 50 58.6 58.6 50 50 58.6 58.6 50 76.4 76.4 76.4 50 50 50 50 50 50 50 50 50 58.6 58.6 50 50 58.6 58.6 50 50 58.6 58.6 50 76.4 76.4 76.4 50 50 50 50 50 50 50 50 50 58.6 58.6 50 50 58.6 58.6 50 50 58.6 58.6 50 76.4 76.4 76.4 50 50 50 50 50 50 50 50 50 58.6 58.6 50 50 58.6 58.6 50 50 58.6 58.6 50 76.4 76.4 76.4 50 50 50 50 50 50 50 50 50 58.6 58.6 50 50 58.6 58.6 50 50 58.6 58.6 50 76.4 76.4 76.4 50 50 50 50 50 50 50 50 50 58.6 58.6 50 50 58.6 58.6 50 50 58.6 58.6 50 76.4 76.4 76.4 50 50 50 50 50 50 50 50 50 58.6 58.6 50 50 58.6 58.6 50 50 58.6 58.6 50 76.4 76.4 76.4 50 50 50 50 50 50 50 50 50 61.7594 61.7594 50 50 68.2725 68.2725 50 50 55.0997 55.0997 50 50 50 50 50 50 50 50 50 50 50 50 50 61.7594 61.7594 50 50 68.2725 68.2725 50 50 55.0997 55.0997 50 50 50 50 50 50 50 50 50 50 50 50 50 61.7594 61.7594 50 50 68.2725 68.2725 50 50 55.0997 55.0997 50 50 50 50 50 50 50 50 50 50 50 50 50 61.7594 61.7594 50 50 68.2725 68.2725 50 50 55.0997 55.0997 50 50 50 50 50 50 50 50 50 50 50 50 50 61.7594 61.7594 50 50 68.2725 68.2725 50 50 55.0997 55.0997 50 50 50 50 50 50 50 50 50 50 50 50 50 61.7594 61.7594 50 50 68.2725 68.2725 50 50 55.0997 55.0997 50 50 50 50 50 50 50 50 50 50 50 50 50 61.7594 61.7594 50 50 68.2725 68.2725 50 50 55.0997 55.0997 50 50 50 50 50 50 50 50 50
119
50 50 50 50 61.7594 61.7594 50 50 68.2725 68.2725 50 50 55.0997 55.0997 50 50 50 50 50 50 50 50 50 50 50 50 50 61.7594 61.7594 50 50 68.2725 68.2725 50 50 55.0997 55.0997 50 50 50 50 50 50 50 50 50 50 50 50 50 61.7594 61.7594 50 50 68.2725 68.2725 50 50 55.0997 55.0997 50 50 50 50 50 50 50 50 50 50 50 50 50 61.7594 61.7594 50 50 68.2725 68.2725 50 50 55.0997 55.0997 50 50 50 50 50 50 50 50 50 50 50 50 50 61.7594 61.7594 50 50 68.2725 68.2725 50 50 55.0997 55.0997 50 50 50 50 50 50 50 50 50 50 50 50 50 61.7594 61.7594 50 50 68.2725 68.2725 50 50 55.0997 55.0997 50 50 50 50 50 50 50 50 50 50 50 50 50 61.7594 61.7594 50 50 68.2725 68.2725 50 50 55.0997 55.0997 50 50 50 50 50 50 50 50 50 50 50 50 50 61.7594 61.7594 50 50 68.2725 68.2725 50 50 55.0997 55.0997 50 50 50 50 50 50 50 50 50 50 50 50 50 50 50 50 50 50 50 50 50 50 50 50 50 50 50 50 50 50 50 50 50 50 50 50 50 50 50 50 50 50 50 50 50 50 50 50 50 50 50 50 50 50 50 50 50 50 50 50 50 50 50 50 50 50 50 50 50 50 50 50 50 50 50 50 50 50 50 50 50 50 50 50 50 50 50 50 50 50 50 50 50 50 50 50 50 50 50 50 50 50 50 50 50 50 50 50 50 50 50 50 50 50 50 50 50 50 50 50 50 50 50 50 50 50 50 50 50 50 50 50 50 50 50 50 50 50 50 50 50 50 50 50 50 50 50 50 50 50 50 50 50 50 50 50 50 50 50 50 50 50 50 50 50 50 50 50 50 50 50 50 50 50 50 50 50 50 50 50 50 50 50 50 50 50 50 50 50 50 50 50 50 50 50 50 50 50 50 50 50 50 50 50 50 50 50 50 50 50 50 50 50 50 50 50 50 50 50 50 50 50 50 50 50 50 50 50 50 50 50 50 50 50 50 50 50 50 50 50 50 50 50 50 50 50 50 50 50 50 50 50 50 50 50 50 50 50 50 50 50 50 50 50 50 50 50 50 50 50 50 50 50 50 50 50 50 50 50 50 50 50 50 50 50 50 50 50 50 50 50 50 50 50 50 50 50 50 50 50 50 50 50 50 50 50 50 50 50 50 50 50 50 50 50 50 50 50 50 50 50 50 50 50 50 50 50 50 50 50 50 50 50 50 50 50 50 50 50 50 50 50 50 50 50 50 50 50 50 50 50 50 50 50 50 50 50 50 50 50 50 50 50 50 50 50 50 50 50 50 50 50 50 50 50 50 50 50 50 50 50 50 50 50 50 50 50 50 50 50 50 50 50 50 50 50 50 50 50 50 50 50 50 50 50 50 50 50 50 50 50 50 50 50 50 50 50 50 50 50 50 50 50 50 50 50 50 50 50 50 50 50 50 50 50 50 50 50 50 50 50 50 50 50 50 50 50 50 50 50 50 50 50 50 50 50 50 50 50 50 50 50 50 50 50 50 50 50 50 50 50 50 50 50 50 50 50 50 50 50 50 50 50 50 50 50 50 50 50 50 50 50 50 50 50 50 50 50 50 50 50 50 50 50 50 50 50 50 50 50 50 50 50 50 50 50 50 50 50 50 50 50 50 50 50 50 50 50 50 50 50 50 50 50 50 50 50 50 50 50 50 50 50 50 50 50 50 50 50 50 50 50 50 50 50 50 50 50 50 50 50 50 50 50 50 50 50 50 50 50 50 50 50 50 50 50 50 50 50 50 50 50 50 50 50 50 50 50 50 50 50 50 50 50 50 50 50 50 50 50 50 50 50 50 50 50 50 50 50 50 50 50 50 50 50 50 50 50 50 50 50 50 50 50 50 50 50 50 50 50 50 50 50 50 50 50 50 50 50 50 50 50 50 50 50 50 50 50 50 50 50 50 50 50 50 50 50 50 50 50 50 50 50 50 50 50 50 50 50 50 50 50 50 50 50 50 50 50 50 50 50 50 50 50 50 50 50 50 50 50 50 50 50 50 50 50 50 50 50 50 50 50 50 50 50 50 50 50 50 50 50 50 50 50 50 50 50 50 50 50 50 50 50 50 50 50 50 50 50 50 50 50 50 50 50 50 50 50 50 50 50 50 50 50 50 50 50 50 50 50 50 50 50 50 50 50 50 50 50 50 50 50 50 50 50 50 50 50 50 50 50 50 50 50 50 50 50 50 50 50 50 50 50 50 50 50 50 50 50 50 50 50 50 50 50 50 50 50 50 50 50 50 50 50 50 50 50 50 50 50 50 50 50 50 50 50 50 50 50 50 50 50 50 50 50 50 50 50 50 50 50 50 50 50 50 50 50 50 50 50 50 50 50 50 50 50 50 50 50 50 50 50 50 50 50 50 50 50 50 50 50 50 50 50 50 50 50 50 50 50 50 50 50 50 50 50 50 50 50 50 50 50 50 50 50 50 50 50 50 50 50 50 50 50 50 50 50 50 50 50 50 50 50 50 50 50 50 50 50 50 50 50 50 50 50 50 50 50 50 50 50 50 50 50 50 50 50 50 50 50 50 50 50 50 50 50 50 50 50 50 50 50 50 50 50 50 50 50 50 50 50 50 50 50 50 50 50 50 50 50 50 50 50 50 50 50 50 50 50 50 50 50 50 50 50 50 50 50 50 50 50 50 50 50 50 50 50 50 50 50 50 50 50 50 50 50 50 50 50 50 50 50 50 50 50 50 50 50 50 50 50 50 50 50 50 50 50 50 50 50 50 50 50 50 50 50 50 50 50 50 50 50 50 50 50 50 50 50 50 50 50 50 50 50 50 50 50 50 50 50 50 50 50 50 50 50 50 50 50 50 50 50 50 50 50 50 50 50 50 50 50 50 50 50 50 50 50 50 50 50 50 50 50 50 50 50 50 50 50 50 50 50 50 50 50 50 50 50 50 50 50 50 50 50 50 50 50 50 50 50 50 50 50 50 50 50 50 50 50 50 50 50 50 50 50 50 50 50 50 50 50 50 50 50 50 50 50 50 50 50 50 50 50 50 50 50 50 50 50 50 50 50 50 50 50 50 50 50 50 50 50 50 50 50 50 50 50 50 50 50 50 50 50 50 50 50 50 50 50 50 50 50 50 50 50 50 50 50 50 50 50 50 50 50 50 50 50 50 50 50 50 50 50 50 50
120
50 50 50 50 50 50 50 50 50 50 50 50 50 50 50 50 50 50 50 50 50 50 50 50 50 50 50 50 50 50 50 50 50 50 50 50 50 50 50 50 50 50 50 50 50 50 50 50 50 50 50 50 50 50 50 50 50 50 50 50 50 50 50 50 50 50 50 50 50 50 50 50 50 50 50 50 50 50 50 50 50 50 50 50 50 50 50 50 50 50 50 50 50 50 50 50 50 50 50 50 50 50 50 50 50 50 50 50 50 50 50 50 50 50 50 50 50 50 50 50 50 50 50 50 50 50 50 50 50 50 50 50 50 50 50 50 50 50 50 50 50 50 50 50 50 50 50 50 50 50 50 50 50 50 50 50 50 50 50 50 50 50 50 50 50 50 50 50 50 50 50 50 50 50 50 50 50 50 50 50 50 50 50 50 50 50 50 50 50 50 50 50 50 50 50 50 50 50 50 50 50 50 50 50 50 50 50 50 50 50 50 50 50 50 50 50 50 50 50 50 50 50 50 50 50 50 50 50 50 50 50 50 50 50 50 50 50 50 50 50 50 50 50 50 50 50 50 50 50 50 50 50 50 50 50 50 50 50 50 50 50 50 50 50 50 50 50 50 50 50 50 50 50 50 50 50 50 50 50 50 50 50 50 50 50 50 50 50 50 50 50 50 50 50 50 50 50 50 50 50 50 50 50 50 50 50 50 50 50 50 50 50 50 50 50 50 50 50 50 50 50 50 50 50 50 50 50 50 50 50 50 50 50 50 50 50 50 50 50 50 50 50 50 50 50 50 50 50 50 50 50 50 50 50 50 50 50 50 50 50 50 50 50 50 50 50 50 50 50 50 50 50 50 50 50 50 50 50 50 50 50 50 50 50 50 50 50 50 50 50 50 50 50 50 50 50 50 50 50 50 50 50 50 50 50 50 50 50 50 50 50 50 50 50 50 50 50 50 50 50 50 50 50 50 50 50 50 50 50 50 50 50 50 50 50 50 50 50 50 50 50 50 50 50 50 50 50 50 50 50 50 50 50 50 50 50 50 50 50 50 50 50 50 50 50 50 50 50 50 50 50 50 50 50 50 50 50 50 50 50 50 50 50 50 50 50 50 50 50 50 50 50 50 50 50 50 50 50 50 50 50 50 50 50 50 50 50 50 50 50 50 50 50 50 50 50 50 50 50 50 50 50 50 50 50 50 50 50 50 50 50 50 50 50 50 50 50 50 50 50 50 50 50 50 50 50 50 50 50 50 50 50 50 50 50 50 50 50 50 50 50 50 50 50 50 50 50 50 50 50 50 50 50 50 50 50 50 50 50 50 50 50 50 50 50 50 50 50 50 50 50 50 50 50 50 50 50 50 50 50 50 50 50 50 50 50 50 50 50 50 50 50 50 50 50 50 50 50 50 50 50 50 50 50 50 50 50 50 50 50 50 50 50 50 50 50 50 50 50 50 50 50 50 50 50 50 50 50 50 50 50 50 50 50 50 50 50 50 50 50 50 50 50 50 50 50 50 50 50 50 50 50 50 50 50 50 50 50 50 50 50 50 50 50 50 50 50 50 50 50 50 50 50 50 50 50 50 50 50 50 50 50 50 50 50 50 50 50 50 50 50 50 50 50 50 50 50 50 50 50 50 50 50 50 50 50 50 50 50 50 50 50 50 50 50 50 50 50 50 50 50 50 50 50 50 50 50 50 50 50 50 50 50 50 50 50 50 50 50 50 50 50 50 50 50 50 50 50 50 50 50 50 50 50 50 50 50 50 50 50 50 50 50 50 50 50 50 50 50 50 50 50 50 50 50 50 50 50 50 50 50 50 50 50 50 50 50 50 50 50 50 50 50 50 50 50 50 50 50 50 50 50 50 50 50 50 50 50 50 50 50 50 50 50 50 50 50 50 50 50 50 50 50 50 50 50 50 50 50 50 50 50 50 50 50 50 50 50 50 50 50 50 50 50 50 50 50 50 50 50 50 50 50 50 50 50 50 50 50 50 50 50 50 50 50 50 50 50 50 50 50 50 50 50 50 50 50 50 50 50 50 50 50 50 50 50 50 50 50 50 50 50 50 50 50 50 50 50 50 50 50 50 50 50 50 50 50 50 50 50 50 50 50 50 50 50 50 50 50 50 50 50 50 50 50 50 50 50 50 50 50 50 50 50 50 50 50 50 50 50 50 50 50 50 50 50 50 50 50 50 50 50 50 50 50 50 50 50 50 50 50 50 50 50 50 50 50 50 50 50 50 50 50 50 50 50 50 50 50 50 50 50 50 50 50 50 50 50 50 50 50 50 50 50 50 50 50 50 50 50 50 50 50 50 50 50 50 50 50 50 50 50 50 50 50 50 50 50 50 50 50 50 50 50 50 50 50 50 50 50 50 50 50 50 50 50 50 50 50 50 50 50 50 50 50 50 50 50 50 50 50 50 50 50 50 50 50 50 50 50 50 50 50 50 50 50 50 50 50 50 50 50 50 50 50 50 50 50 50 50 50 50 50 50 50 50 50 50 50 50 50 50 50 50 50 50 50 50 50 50 50 50 50 50 50 50 50 50 50 50 50 50 50 50 50 50 50 50 50 50 50 50 50 50 50 50 50 50 50 50 50 50 50 50 50 50 50 50 50 50 50 50 50 50 50 50 50 50 50 50 50 50 50 50 50 50 50 50 50 50 50 50 50 50 50 50 50 50 50 50 50 50 50 50 50 50 50 50 50 50 50 50 50 50 50 50 50 50 50 50 50 50 50 50 50 50 50 50 50 50 50 50 50 50 50 50 50 50 50 50 50 50 50 50 50 50 50 50 50 50 50 50 50 50 50 50 50 50 50 50 50 50 50 50 50 50 50 50 50 50 50 50 50 50 50 50 50 50 50 50 50 50 50 50 50 50 50 50 50 50 50 50 50 50 50 50 50 50 50 50 50 50 50 50 50 50 50 50 50 50 50 50 50 50 50 50 50 50 50 50 50 50 50 50 50 50 50 50 50 50 50 50 50 50 50 50 50 50 50 50 50 50 50 50 50 50 50 50 50 50 50 50 50 50 50 50 50 50 50 50 50 50 50 50 50 50 50 50 50 50 50 50 50 50 50 50 50 50 50 50 50 50 50 50 50 50 50 50 50 50 50 50 50 50 50 50 50 50 50 50 50 50 50 50 50 50 50 50 50 50 50 50 50 50 50 50 50 50 50 50 50 50 50 50 50 50 50 50 50 50 50 50 50 50 50 50 50 50 50 50 50 50 50 50 50 50 50 50 50 50 50 50 50 50 50 50 50 50 50 50 50 50 50 50 50 50 50 50 50 50 50 50 50 50 50 50 50 50 50 50 50 50 50 50 50 50 50 50 50 50 50 50 50 50 50 50 50 50 50 50 50 50 50 50 50 50 50 50 50 50 50 50 50 50 50 50 50 50 50 50 50 50 50 50 50 50 50 50 50 50 50 50 50 50 50 50 50 50 50 50 50 50 50 50 50 50 50 50 50 50 50 50 50 50 50 50 50 50 50 50 50 50 50 50 50 50 50 50 50 50 50 50 50 50
121
50 50 50 50 50 50 50 50 50 50 50 50 50 50 50 50 50 50 50 50 50 50 50 50 50 50 50 50 50 50 50 50 50 50 50 50 50 50 50 50 50 50 50 50 50 50 50 50 50 50 50 50 50 50 50 50 50 50 50 50 50 50 50 50 50 50 50 50 50 50 50 50 50 50 50 50 50 50 50 50 50 50 50 50 50 50 50 50 50 50 50 50 50 50 50 50 50 50 50 50 50 50 50 50 50 50 50 50 50 50 50 50 50 50 50 50 50 50 50 50 50 50 50 50 50 50 50 50 50 50 50 50 50 50 50 50 50 50 50 50 50 50 50 50 50 50 50 50 50 50 50 50 50 50 50 50 50 50 50 50 50 50 50 50 50 50 50 50 50 50 50 50 50 50 50 50 50 50 50 50 50 50 50 50 50 50 50 50 50 50 50 50 50 50 50 50 50 50 50 50 50 50 50 50 50 50 50 50 50 50 50 50 50 50 50 50 50 50 50 50 50 50 50 50 50 50 50 50 50 50 50 50 50 50 50 50 50 50 50 50 50 50 50 50 50 50 50 50 50 50 50 50 50 50 50 50 50 50 50 50 50 50 50 50 50 50 50 50 50 50 50 50 50 50 50 50 50 50 50 50 50 50 50 50 50 50 50 50 50 50 50 50 50 50 50 50 50 50 50 50 50 50 50 50 50 50 50 50 50 50 50 50 50 50 50 50 50 50 50 50 50 50 50 50 50 50 50 50 50 50 50 50 50 50 50 50 50 50 50 50 50 50 50 50 50 50 50 50 50 50 50 50 50 50 50 50 50 50 50 50 50 50 50 50 50 50 50 50 50 50 50 50 50 50 50 50 50 50 50 50 50 50 50 50 50 50 50 50 50 50 50 50 50 50 50 50 50 50 50 50 50 50 50 50 50 50 50 50 50 50 50 50 50 50 50 50 50 50 50 50 50 50 50 50 50 50 50 50 50 50 50 50 50 50 50 50 50 50 50 50 50 50 50 50 50 50 50 50 50 50 50 50 50 50 50 50 50 50 50 50 50 50 50 50 50 50 50 50 50 50 50 50 50 50 50 50 50 50 50 50 50 50 50 50 50 50 50 50 50 50 50 50 50 50 50 50 50 50 50 50 50 50 50 50 50 50 50 50 50 50 50 50 50 50 50 50 50 50 50 50 50 50 50 50 50 50 50 50 50 50 50 50 50 50 50 50 50 50 50 50 50 50 50 50 50 50 50 50 50 50 50 50 50 50 50 50 50 50 50 50 50 50 50 50 50 50 50 50 50 50 50 50 50 50 50 50 50 50 50 50 50 50 50 50 50 50 50 50 50 50 50 50 50 50 50 50 50 50 50 50 50 50 50 50 50 50 50 50 50 50 50 50 50 50 50 50 50 50 50 50 50 50 50 50 50 50 50 50 50 50 50 50 50 50 50 50 50 50 50 50 50 50 50 50 50 50 50 50 50 50 50 50 50 50 50 50 50 50 50 50 50 50 50 50 50 50 50 50 50 50 50 50 50 50 50 50 50 50 50 50 50 50 50 50 50 50 50 50 50 50 50 50 50 50 50 50 50 50 50 50 50 50 50 50 50 50 50 50 50 50 50 50 50 50 50 50 50 50 50 50 50 50 50 50 50 50 50 50 50 50 50 50 50 50 50 50 50 50 50 50 50 50 50 50 50 50 50 50 50 50 50 50 50 50 50 50 50 50 50 50 50 50 50 50 50 50 50 50 50 50 50 50 50 50 50 50 50 50 50 50 50 50 50 50 50 50 50 50 50 50 50 50 50 50 50 50 50 50 50 50 50 50 50 50 50 50 50 50 50 50 50 50 50 50 50 50 50 50 50 50 50 50 50 50 50 50 50 50 50 50 50 50 50 50 50 50 50 50 50 50 50 50 50 50 50 50 50 50 50 50 50 50 50 50 50 50 50 50 50 50 50 50 50 50 50 50 50 50 50 50 50 50 50 50 50 50 50 50 50 50 50 50 50 50 50 50 50 50 50 50 50 50 50 50 50 50 50 50 50 50 50 50 50 50 50 50 50 50 50 50 50 50 50 50 50 50 50 50 50 50 50 50 50 50 50 50 50 50 50 50 50 50 50 50 50 50 50 50 50 50 50 50 50 50 50 50 50 50 50 50 50 50 50 50 50 50 50 50 50 50 50 50 50 50 50 50 50 50 50 50 50 50 50 50 50 50 50 50 50 50 50 50 50 50 50 50 50 50 50 50 50 50 50 50 50 50 50 50 50 50 50 50 50 50 50 50 50 50 50 50 50 50 50 50 50 50 50 50 50 50 50 50 50 50 50 50 50 50 50 50 50 50 50 50 50 # tag_fish_rep penalty 1 1 1 1 1 1 1 1 1 1 1 1 1 1 1 1 1 1 1 1 1 1 1 1 1 1 1 1 1 1 1 1 1 1 1 1 1 1 1 1 1 1 1 1 1 1 1 1 1 1 1 1 1 1 1 1 1 1 1 1 1 1 1 1 1 1 1 1 1 1 1 1 1 1 1 1 1 1 1 1 1 1 1 1 1 1 1 1 1 1 1 1 1 1 1 1 1 1 1 1 1 1 1 1 1 1 1 1 1 1 1 1 1 1 1 1 1 1 1 1 1 1 1 1 1 1 1 1 1 1 1 1 1 1 1 1 1 1 1 1 1 1 1 1 1 1 1 1 1 1 1 1 1 1 1 1 1 1 1 1 1 1 1 1 1 1 1 1 1 1 1 1 1 1 1 1 1 1 1 1 1 1 1 1 1 1 1 1 84 84 1 1 84 84 1 1 84 84 1 20 20 20 1 1 1 1 1 1 1 1 1 84 84 1 1 84 84 1 1 84 84 1 20 20 20 1 1 1 1 1 1 1 1 1 84 84 1 1 84 84 1 1 84 84 1 20 20 20 1 1 1 1 1 1 1 1 1 84 84 1 1 84 84 1 1 84 84 1 20 20 20 1 1 1 1 1 1 1 1 1 84 84 1 1 84 84 1 1 84 84 1 20 20 20 1 1 1 1 1 1 1 1 1 84 84 1 1 84 84 1 1 84 84 1 20 20 20 1 1 1 1 1 1 1 1 1 84 84 1 1 84 84 1 1 84 84 1 20 20 20 1 1 1 1 1 1 1 1 1 84 84 1 1 84 84 1 1 84 84 1 20 20 20 1 1 1 1 1 1 1 1 1 84 84 1 1 84 84 1 1 84 84 1 20 20 20 1 1 1 1 1 1 1 1 1 43 43 1 1 82 82 1 1 151 151 1 1 1 1 1 1 1 1 1 1 1 1 1 43 43 1 1 82 82 1 1 151 151 1 1 1 1 1 1 1 1 1 1 1 1 1 43 43 1 1 82 82 1 1 151 151 1 1 1 1 1 1 1 1 1 1 1 1 1 43 43 1 1 82 82 1 1 151 151 1 1 1 1 1 1 1 1 1 1 1 1 1 43 43 1 1 82 82 1 1 151 151 1 1 1 1 1 1 1 1 1
122
1 1 1 1 43 43 1 1 82 82 1 1 151 151 1 1 1 1 1 1 1 1 1 1 1 1 1 43 43 1 1 82 82 1 1 151 151 1 1 1 1 1 1 1 1 1 1 1 1 1 43 43 1 1 82 82 1 1 151 151 1 1 1 1 1 1 1 1 1 1 1 1 1 43 43 1 1 82 82 1 1 151 151 1 1 1 1 1 1 1 1 1 1 1 1 1 43 43 1 1 82 82 1 1 151 151 1 1 1 1 1 1 1 1 1 1 1 1 1 43 43 1 1 82 82 1 1 151 151 1 1 1 1 1 1 1 1 1 1 1 1 1 1 1 1 1 1 1 1 1 1 1 1 1 1 1 1 1 1 1 1 1 1 1 1 1 1 1 1 1 1 1 1 1 1 1 1 1 1 1 1 1 1 1 1 1 1 1 1 1 1 1 1 1 1 1 1 1 1 1 1 1 1 1 1 1 1 1 1 1 1 1 1 1 1 1 1 1 1 1 1 1 1 1 1 1 1 1 1 1 1 1 1 1 1 1 1 1 1 1 1 1 1 1 1 1 1 1 1 1 1 1 1 1 1 1 1 1 1 1 1 1 1 1 1 1 1 1 1 1 1 1 1 1 1 1 1 1 1 1 1 1 1 1 1 1 1 1 1 1 1 1 1 1 1 1 1 1 1 1 1 1 1 1 1 1 1 1 1 1 1 1 1 1 1 1 1 1 1 1 1 1 1 1 1 1 1 1 1 1 1 1 1 1 1 1 1 1 1 1 1 1 1 1 1 1 1 1 1 84 84 1 1 84 84 1 1 84 84 1 20 20 20 1 1 1 1 1 1 1 1 1 84 84 1 1 84 84 1 1 84 84 1 20 20 20 1 1 1 1 1 1 1 1 1 84 84 1 1 84 84 1 1 84 84 1 20 20 20 1 1 1 1 1 1 1 1 1 84 84 1 1 84 84 1 1 84 84 1 20 20 20 1 1 1 1 1 1 1 1 1 84 84 1 1 84 84 1 1 84 84 1 20 20 20 1 1 1 1 1 1 1 1 1 43 43 1 1 82 82 1 1 151 151 1 1 1 1 1 1 1 1 1 1 1 1 1 43 43 1 1 82 82 1 1 151 151 1 1 1 1 1 1 1 1 1 1 1 1 1 43 43 1 1 82 82 1 1 151 151 1 1 1 1 1 1 1 1 1 1 1 1 1 43 43 1 1 82 82 1 1 151 151 1 1 1 1 1 1 1 1 1 1 1 1 1 43 43 1 1 82 82 1 1 151 151 1 1 1 1 1 1 1 1 1 1 1 1 1 1 1 1 1 1 1 1 1 1 1 1 1 1 1 1 1 1 1 1 1 1 1 1 1 1 1 1 1 1 1 1 1 1 1 1 1 1 1 1 1 1 1 1 1 1 1 84 84 1 1 84 84 1 1 84 84 1 20 20 20 1 1 1 1 1 1 1 1 1 84 84 1 1 84 84 1 1 84 84 1 20 20 20 1 1 1 1 1 1 1 1 1 84 84 1 1 84 84 1 1 84 84 1 20 20 20 1 1 1 1 1 1 1 1 1 84 84 1 1 84 84 1 1 84 84 1 20 20 20 1 1 1 1 1 1 1 1 1 84 84 1 1 84 84 1 1 84 84 1 20 20 20 1 1 1 1 1 1 1 1 1 84 84 1 1 84 84 1 1 84 84 1 20 20 20 1 1 1 1 1 1 1 1 1 84 84 1 1 84 84 1 1 84 84 1 20 20 20 1 1 1 1 1 1 1 1 1 43 43 1 1 82 82 1 1 151 151 1 1 1 1 1 1 1 1 1 1 1 1 1 43 43 1 1 82 82 1 1 151 151 1 1 1 1 1 1 1 1 1 1 1 1 1 43 43 1 1 82 82 1 1 151 151 1 1 1 1 1 1 1 1 1 1 1 1 1 1 1 1 1 1 1 1 1 1 1 1 1 1 1 1 1 1 1 1 1 1 1 1 1 1 1 1 1 1 1 1 1 1 1 1 1 1 1 1 1 1 1 1 1 1 1 1 1 1 1 1 1 1 1 1 1 1 1 1 1 1 1 1 1 1 1 1 1 1 84 84 1 1 84 84 1 1 84 84 1 20 20 20 1 1 1 1 1 1 1 1 1 84 84 1 1 84 84 1 1 84 84 1 20 20 20 1 1 1 1 1 1 1 1 1 84 84 1 1 84 84 1 1 84 84 1 20 20 20 1 1 1 1 1 1 1 1 1 84 84 1 1 84 84 1 1 84 84 1 20 20 20 1 1 1 1 1 1 1 1 1 84 84 1 1 84 84 1 1 84 84 1 20 20 20 1 1 1 1 1 1 1 1 1 84 84 1 1 84 84 1 1 84 84 1 20 20 20 1 1 1 1 1 1 1 1 1 84 84 1 1 84 84 1 1 84 84 1 20 20 20 1 1 1 1 1 1 1 1 1 84 84 1 1 84 84 1 1 84 84 1 20 20 20 1 1 1 1 1 1 1 1 1 84 84 1 1 84 84 1 1 84 84 1 20 20 20 1 1 1 1 1 1 1 1 1 84 84 1 1 84 84 1 1 84 84 1 20 20 20 1 1 1 1 1 1 1 1 1 43 43 1 1 82 82 1 1 151 151 1 1 1 1 1 1 1 1 1 1 1 1 1 43 43 1 1 82 82 1 1 151 151 1 1 1 1 1 1 1 1 1 1 1 1 1 43 43 1 1 82 82 1 1 151 151 1 1 1 1 1 1 1 1 1 1 1 1 1 43 43 1 1 82 82 1 1 151 151 1 1 1 1 1 1 1 1 1 1 1 1 1 43 43 1 1 82 82 1 1 151 151 1 1 1 1 1 1 1 1 1 1 1 1 1 43 43 1 1 82 82 1 1 151 151 1 1 1 1 1 1 1 1 1 1 1 1 1 43 43 1 1 82 82 1 1 151 151 1 1 1 1 1 1 1 1 1 1 1 1 1 43 43 1 1 82 82 1 1 151 151 1 1 1 1 1 1 1 1 1 1 1 1 1 43 43 1 1 82 82 1 1 151 151 1 1 1 1 1 1 1 1 1 1 1 1 1 43 43 1 1 82 82 1 1 151 151 1 1 1 1 1 1 1 1 1 1 1 1 1 43 43 1 1 82 82 1 1 151 151 1 1 1 1 1 1 1 1 1 1 1 1 1 43 43 1 1 82 82 1 1 151 151 1 1 1 1 1 1 1 1 1 1 1 1 1 43 43 1 1 82 82 1 1 151 151 1 1 1 1 1 1 1 1 1 1 1 1 1 43 43 1 1 82 82 1 1 151 151 1 1 1 1 1 1 1 1 1 1 1 1 1 43 43 1 1 82 82 1 1 151 151 1 1 1 1 1 1 1 1 1 1 1 1 1 1 1 1 1 1 1 1 1 1 1 1 1 1 1 1 1 1 1 1 1 1 1 1 1 1 1 1 1 1 1 1 1 1 1 1 1 1 1 1 1 1 1 1 1 1 1 1 1 1 1 1 1 1 1 1 1 1 1 1 1 1 1 1 1 1

123
1 1 1 1 1 1 1 1 1 1 1 1 1 1 1 1 1 1 1 1 1 1 1 1 1 1 1 1 1 1 1 1 1 1 1 1 1 1 1 1 1 1 1 1 1 1 1 1 1 1 1 1 1 1 1 1 1 1 1 1 1 1 1 1 1 1 1 1 1 1 1 1 1 1 1 1 1 1 1 1 1 1 1 1 1 1 1 1 1 1 1 1 1 1 1 1 1 1 1 1 1 1 1 1 1 1 1 1 1 1 1 1 1 1 1 1 1 1 1 1 1 1 1 1 1 1 1 1 1 1 1 1 1 1 1 1 1 1 1 1 1 1 1 1 1 1 1 1 1 1 1 1 1 1 1 1 1 1 1 1 1 1 1 1 1 1 1 1 1 1 1 1 1 1 1 1 1 1 1 1 1 1 1 1 1 1 1 1 1 1 1 1 1 1 1 1 1 1 1 1 1 1 1 1 1 1 1 1 1 1 1 1 1 1 1 1 1 1 1 1 1 1 1 1 1 1 1 1 1 1 1 1 1 1 1 1 1 1 1 1 1 1 1 1 1 1 1 1 1 1 1 1 1 1 1 1 1 1 1 1 1 1 1 1 1 1 1 1 1 1 1 1 1 1 1 1 1 1 1 1 1 1 1 1 1 1 1 1 1 1 1 1 1 1 1 1 1 1 1 1 1 1 1 1 1 1 1 1 1 1 1 1 1 1 1 1 1 1 1 1 1 1 1 1 1 1 1 1 1 1 1 1 1 1 1 1 1 1 1 1 1 1 1 1 1 1 1 1 1 1 1 1 1 1 1 1 1 1 1 1 1 1 1 1 1 1 1 1 1 1 1 1 1 1 1 1 1 1 1 1 1 1 1 1 1 1 1 1 1 1 1 1 1 1 1 1 1 1 1 1 1 1 1 1 1 1 1 1 1 1 1 1 1 1 1 1 1 1 1 1 1 1 1 1 1 1 1 1 1 1 1 1 1 1 1 1 1 1 1 1 1 1 1 1 1 1 1 1 1 1 1 1 1 1 1 1 1 1 1 1 1 1 1 1 1 1 1 1 1 1 1 1 1 1 1 1 1 1 1 1 1 1 1 1 1 1 1 1 1 1 1 1 1 1 1 1 1 1 1 1 1 1 1 1 1 1 1 1 1 1 1 1 1 1 1 1 1 1 1 1 1 1 1 1 1 1 1 1 1 1 1 1 1 1 1 1 1 1 1 1 1 1 1 1 1 1 1 1 1 1 1 1 1 1 1 1 1 1 1 1 1 1 1 1 1 1 1 1 1 1 1 1 1 1 1 1 1 1 1 1 1 1 1 1 1 1 1 1 1 1 1 1 1 1 1 1 1 1 1 1 1 1 1 1 1 1 1 1 1 1 1 1 1 1 1 1 1 1 1 1 1 1 1 1 1 1 1 1 1 1 1 1 1 1 1 1 1 1 1 1 1 1 1 1 1 1 1 1 1 1 1 1 1 1 1 1 1 1 1 1 1 1 1 1 1 1 1 1 1 1 1 1 1 1 1 1 1 1 1 1 1 1 1 1 1 1 1 1 1 1 1 1 1 1 1 1 1 1 1 1 1 1 1 1 1 1 1 1 1 1 1 1 1 1 1 1 1 1 1 1 1 1 1 1 1 1 1 1 1 1 1 1 1 1 1 1 1 1 1 1 1 1 1 1 1 1 1 1 1 1 1 1 1 1 1 1 1 1 1 1 1 1 1 1 1 1 1 1 1 1 1 1 1 1 1 1 1 1 1 1 1 1 1 1 1 1 1 1 1 1 1 1 1 1 1 1 1 1 1 1 1 1 1 1 1 1 1 1 1 1 1 1 1 1 1 1 1 1 1 1 1 1 1 1 1 1 1 1 1 1 1 1 1 1 1 1 1 1 1 1 1 1 1 1 1 1 1 1 1 1 1 1 1 1 1 1 1 1 1 1 1 1 1 1 1 1 1 1 1 1 1 1 1 1 1 1 1 1 1 1 1 1 1 1 1 1 1 1 1 1 1 1 1 1 1 1 1 1 1 1 1 1 1 1 1 1 1 1 1 1 1 1 1 1 1 1 1 1 1 1 1 1 1 1 1 1 1 1 1 1 1 1 1 1 1 1 1 1 1 1 1 1 1 1 1 1 1 1 1 1 1 1 1 1 1 1 1 1 1 1 1 1 1 1 1 1 1 1 1 1 1 1 1 1 1 1 1 1 1 1 1 1 1 1 1 1 1 1 1 1 1 1 1 1 1 1 1 1 1 1 1 1 1 1 1 1 1 1 1 1 1 1 1 1 1 1 1 1 1 1 1 1 1 1 1 1 1 1 1 1 1 1 1 1 1 1 1 1 1 1 1 1 1 1 1 1 1 1 1 1 1 1 1 1 1 1 1 1 1 1 1 1 1 1 1 1 1 1 1 1 1 1 1 1 1 1 1 1 1 1 1 1 1 1 1 1 1 1 1 1 1 1 1 1 1 1 1 1 1 1 1 1 1 1 1 1 1 1 1 1 1 1 1 1 1 1 1 1 1 1 1 1 1 1 1 1 1 1 1 1 1 1 1 1 1 1 1 1 1 1 1 1 1 1 1 1 1 1 1 1 1 1 1 1 1 1 1 1 1 1 1 1 1 1 1 1 1 1 1 1 1 1 1 1 1 1 1 1 1 1 1 1 1 1 1 1 1 1 1 1 1 1 1 1 1 1 1 1 1 1 1 1 1 1 1 1 1 1 1 1 1 1 1 1 1 1 1 1 1 1 1 1 1 1 1 1 1 1 1 1 1 1 1 1 1 1 1 1 1 1 1 1 1 1 1 1 1 1 1 1 1 1 1 1 1 1 1 1 1 1 1 1 1 1 1 1 1 1 1 1 1 1 1 1 1 1 1 1 1 1 1 1 1 1 1 1 1 1 1 1 1 1 1 1 1 1 1 1 1 1 1 1 1 1 1 1 1 1 1 1 1 1 1 1 1 1 1 1 1 1 1 1 1 1 1 1 1 1 1 1 1 1 1 1 1 1 1 1 1 1 1 1 1 1 1 1 1 1 1 1 1 1 1 1 1 1 1 1 1 1 1 1 1 1 1 1 1 1 1 1 1 1 1 1 1 1 1 1 1 1 1 1 1 1 1 1 1 1 1 1 1 1 1 1 1 1 1 1 1 1 1 1 1 1 1 1 1 1 1 1 1 1 1 1 1 1 1 1 1 1 1 1 1 1 1 1 1 1 1 1 1 1 1 1 1 1 1 1 1 1 1 1 1 1 1 1 1 1 1 1 1 1 1 1 1 1 1 1 1 1 1 1 1 1 1 1 1 1 1 1 1 1 1 1 1 1 1 1 1 1 1 1 1 1 1 1 1 1 1 1 1 1 1 1 1 1 1 1 1 1 1 1 1 1 1 1 1 1 1 1 1 1 1 1 1 1 1 1 1 1 1 1 1 1 1 1 1 1 1 1 1 1 1 1 1 1 1 1 1 1 1 1 1 1 1 1 1 1 1 1 1 1 1 1 1 1 1 1 1 1 1 1 1 1
124
1 1 1 1 1 1 1 1 1 1 1 1 1 1 1 1 1 1 1 1 1 1 1 1 1 1 1 1 1 1 1 1 1 1 1 1 1 1 1 1 1 1 1 1 1 1 1 1 1 1 1 1 1 1 1 1 1 1 1 1 1 1 1 1 1 1 1 1 1 1 1 1 1 1 1 1 1 1 1 1 1 1 1 1 1 1 1 1 1 1 1 1 1 1 1 1 1 1 1 1 1 1 1 1 1 1 1 1 1 1 1 1 1 1 1 1 1 1 1 1 1 1 1 1 1 1 1 1 1 1 1 1 1 1 1 1 1 1 1 1 1 1 1 1 1 1 1 1 1 1 1 1 1 1 1 1 1 1 1 1 1 1 1 1 1 1 1 1 1 1 1 1 1 1 1 1 1 1 1 1 1 1 1 1 1 1 1 1 1 1 1 1 1 1 1 1 1 1 1 1 1 1 1 1 1 1 1 1 1 1 1 1 1 1 1 1 1 1 1 1 1 1 1 1 1 1 1 1 1 1 1 1 1 1 1 1 1 1 1 1 1 1 1 1 1 1 1 1 1 1 1 1 1 1 1 1 1 1 1 1 1 1 1 1 1 1 1 1 1 1 1 1 1 1 1 1 1 1 1 1 1 1 1 1 1 1 1 1 1 1 1 1 1 1 1 1 1 1 1 1 1 1 1 1 1 1 1 1 1 1 1 1 1 1 1 1 1 1 1 1 1 1 1 1 1 1 1 1 1 1 1 1 1 1 1 1 1 1 1 1 1 1 1 1 1 1 1 1 1 1 1 1 1 1 1 1 1 1 1 1 1 1 1 1 1 1 1 1 1 1 1 1 1 1 1 1 1 1 1 1 1 1 1 1 1 1 1 1 1 1 1 1 1 1 1 1 1 1 1 1 1 1 1 1 1 1 1 1 1 1 1 1 1 1 1 1 1 1 1 1 1 1 1 1 1 1 1 1 1 1 1 1 1 1 1 1 1 1 1 1 1 1 1 1 1 1 1 1 1 1 1 1 1 1 1 1 1 1 1 1 1 1 1 1 1 1 1 1 1 1 1 1 1 1 1 1 1 1 1 1 1 1 1 1 1 1 1 1 1 1 1 1 1 1 1 1 1 1 1 1 1 1 1 1 1 1 1 1 1 1 1 1 1 1 1 1 1 1 1 1 1 1 1 1 1 1 1 1 1 1 1 1 1 1 1 1 1 1 1 1 1 1 1 1 1 1 1 1 1 1 1 1 1 1 1 1 1 1 1 1 1 1 1 1 1 1 1 1 1 1 1 1 1 1 1 1 1 1 1 1 1 1 1 1 1 1 1 1 1 1 1 1 1 1 1 1 1 1 1 1 1 1 1 1 1 1 1 1 1 1 1 1 1 1 1 1 1 1 1 1 1 1 1 1 1 1 1 1 1 1 1 1 1 1 1 1 1 1 1 1 1 1 1 1 1 1 1 1 1 1 1 1 1 1 1 1 1 1 1 1 1 1 1 1 1 1 1 1 1 1 1 1 1 1 1 1 1 1 1 1 1 1 1 1 1 1 1 1 1 1 1 1 1 1 1 1 1 1 1 1 1 1 1 1 1 1 1 1 1 1 1 1 1 1 1 1 1 1 1 1 1 1 1 1 1 1 1 1 1 1 1 1 1 1 1 1 1 1 1 1 1 1 1 1 1 1 1 1 1 1 1 1 1 1 1 1 1 1 1 1 1 1 1 1 1 1 1 1 1 1 1 1 1 1 1 1 1 1 1 1 1 1 1 1 1 1 1 1 1 1 1 1 1 1 1 1 1 1 1 1 1 1 1 1 1 1 1 1 1 1 1 1 1 1 1 1 1 1 1 1 1 1 1 1 1 1 1 1 1 1 1 1 1 1 1 1 1 1 1 1 1 1 1 1 1 1 1 1 1 1 1 1 1 1 1 1 1 1 1 1 1 1 1 1 1 1 1 1 1 1 1 1 1 1 1 1 1 1 1 1 1 1 1 1 1 1 1 1 1 1 1 1 1 1 1 1 1 1 1 1 1 1 1 1 1 1 1 1 1 1 1 1 1 1 1 1 1 1 1 1 1 1 1 1 1 1 1 1 1 1 1 1 1 1 1 1 1 1 1 1 1 1 1 1 1 1 1 1 1 1 1 1 1 1 1 1 1 1 1 1 1 1 1 1 1 1 1 1 1 1 1 1 1 1 1 1 1 1 1 1 1 1 1 1 1 1 1 1 1 1 1 1 1 1 1 1 1 1 1 1 1 1 1 1 1 1 1 1 1 1 1 1 1 1 1 1 1 1 1 1 1 1 1 1 1 1 1 1 1 1 1 1 1 1 1 1 1 1 1 1 1 1 1 1 1 1 1 1 1 1 1 1 1 1 1 1 1 1 1 1 1 1 1 1 1 1 1 1 1 1 1 1 1 1 1 1 1 1 1 1 1 1 1 1 1 1 1 1 1 1 1 1 1 1 1 1 1 1 1 1 1 1 1 1 1 1 1 1 1 1 1 1 1 1 1 1 1 1 1 1 1 1 1 1 1 1 1 1 1 1 1 1 1 1 1 1 1 1 1 1 1 1 1 1 1 1 1 1 1 1 1 1 1 1 1 1 1 1 1 1 1 1 1 1 1 1 1 1 1 1 1 1 1 1 1 1 1 1 1 1 1 1 1 1 1 1 1 1 1 1 1 1 1 1 1 1 1 1 1 1 1 1 1 1 1 1 1 1 1 1 1 1 1 1 1 1 1 1 1 1 1 1 1 1 1 1 1 1 1 1 1 1 1 1 1 1 1 1 1 1 1 1 1 1 1 1 1 1 1 1 1 1 1 1 1 1 1 1 1 1 1 1 1 1 1 1 1 1 1 1 1 1 1 1 1 1 1 1 1 1 1 1 1 1 1 1 1 1 1 1 1 1 1 1 1 1 1 1 1 1 1 1 1 1 1 1 1 1 1 1 1 1 1 1 1 1 1 1 1 1 1 1 1 1 1 1 1 1 1 1 1 1 1 1 1 1 1 1 1 1 1 1 1 1 1 1 1 1 1 1 1 1 1 1 1 1 1 1 1 1 1 1 1 1 1 1 1 1 1 1 1 1 1 1 1 1 1 1 1 1 1 1 1 1 1 1 1 1 1 1 1 1 1 1 1 1 1 1 1 1 1 1 1 1 1 1 1 1 1 1 1 1 1 1 1 1 1 1 1 1 1 1 1 1 1 1 1 1 1 1 1 1 1 1 1 1 1 1 1 1 1 1 1 1 1 1 1 1 1 1 1 1 1 1 1 1 1 1 1 1 1 1 1 1 1 1 1 1 1 1 1 1 1 1 1 1 1 1 1 1 1 1 1 1 1 1 1 1 1 1 1 1 1 1 1 1 1 1 1 1 1 1 1 1 1 1 1 1 1 1 1 1 1 1 1 1 1 1 1 1 1 1 1 1 1 1 1 1 1 1 1 1 1 1 1 1 1 1 1 1 1 1 1 1 1 1 1 1 1 1 1 1 1 1 1 1 1 1 1 1 1 1 1 1
125
1 1 1 1 1 1 1 1 1 1 1 1 1 1 1 1 1 1 1 1 1 1 1 1 1 1 1 1 1 1 1 1 1 1 1 1 1 1 1 1 1 1 1 1 1 1 1 1 1 1 1 1 1 1 1 1 1 1 1 1 1 1 1 1 1 1 1 1 1 1 1 1 1 1 1 1 1 1 1 1 1 1 1 1 1 1 1 1 1 1 1 1 1 1 1 1 1 1 1 1 1 1 1 1 1 1 1 1 1 1 1 1 1 1 1 1 1 1 1 1 1 1 1 1 1 1 1 1 1 1 1 1 1 1 1 1 1 1 1 1 1 1 1 1 1 1 1 1 1 1 1 1 1 1 1 1 1 1 1 1 1 1 1 1 1 1 1 1 1 1 1 1 1 1 1 1 1 1 1 1 1 1 1 1 1 1 1 1 1 1 1 1 1 1 1 1 1 1 1 1 1 1 1 1 1 1 1 1 1 1 1 1 1 1 1 1 1 1 1 1 1 1 1 1 1 1 1 1 1 1 1 1 1 1 1 1 1 1 1 1 1 1 1 1 1 1 1 1 1 1 1 1 1 1 1 1 1 1 1 1 1 1 1 1 1 1 1 1 1 1 1 1 1 1 1 1 1 1 1 1 1 1 1 1 1 1 1 1 1 1 1 1 1 1 1 1 1 1 1 1 1 1 1 1 1 1 1 1 1 1 1 1 1 1 1 1 1 1 1 1 1 1 1 1 1 1 1 1 1 1 1 1 1 1 1 1 1 1 1 1 1 1 1 1 1 1 1 1 1 1 1 1 1 1 1 1 1 1 1 1 1 1 1 1 1 1 1 1 1 1 1 1 1 1 1 1 1 1 1 1 1 1 1 1 1 1 1 1 1 1 1 1 1 1 1 1 1 1 1 1 1 1 1 1 1 1 1 1 1 1 1 1 1 1 1 1 1 1 1 1 1 1 1 1 1 1 1 1 1 1 1 1 1 1 1 1 1 1 1 1 1 1 1 1 1 1 1 1 1 1 1 1 1 1 1 1 1 1 1 1 1 1 1 1 1 1 1 1 1 1 1 1 1 1 1 1 1 1 1 1 1 1 1 1 1 1 1 1 1 1 1 1 1 1 1 1 1 1 1 1 1 1 1 1 1 1 1 1 1 1 1 1 1 1 1 1 1 1 1 1 1 1 1 1 1 1 1 1 1 1 1 1 1 1 1 1 1 1 1 1 1 1 1 1 1 1 1 1 1 1 1 1 1 1 1 1 1 1 1 1 1 1 1 1 1 1 1 1 1 1 1 1 1 1 1 1 1 1 1 1 1 1 1 1 1 1 1 1 1 1 1 1 1 1 1 1 1 1 # maturity at age 0 0 1 1 1 1 1 1 1 1 1 1 1 1 1 1 # natural mortality (per year) 0.4 # movement map 1 2 3 4 # diffusion coffs (per year) 0.1 0.1 0.1 0.1 0.1 0.1 0.1 0.1 0.1 0.1 0.1 0.1 0.1 0.1 0.1 0.1 0.1 0.1 0.1 0.1 0.1 0.1 0.1 0.1 0.1 0.1 0.1 0.1 0.1 0.1 0.1 0.1 0.1 0.1 0.1 0.1 0.1 0.1 0.1 0.1 0.1 0.1 0.1 0.1 0.1 0.1 0.1 0.1 0.1 0.1 0.1 0.1 0.1 0.1 0.1 0.1 # age_pars 0 0 0 0 0 0 0 0 0 0 0 0 0 0 0 0 0 0 0 0 0 0 0 0 0 0 0 0 0 0 0 0 0 0 0 0 0 0 0 0 0 0 0 0 0 0 0 0 0 0 0 0 0 0 0 0 0 0 0 0 0 0 0 0 0 0 0 0 0 0 0 0 0 0 0 0 0 0 0 0 0 0 0 0 0 0 0 0 0 0 0 0 0 0 0 0 0 0 0 0 0 0 0 0 0 0 0 0 0 0 0 0 0 0 0 0 0 0 0 0 0 0 0 0 0 0 0 0 0 0 0 0 0 0 0 0 0 0 0 0 0 0 0 0 0 0 0 0 0 0 0 0 0 0 0 0 0 0 0 0 # recruitment distribution by region 0.142 0.242 0.381 0.134 0.101 # The von Bertalanffy parameters # Initial lower bound upper bound # ML1 10 10 30 # ML2 88.317 60 100 # K (per year) 0.1965 0.05 0.4 # Length-weight parameters 8.6386e-06 3.2174 # sv(29) 0.75 # Generic SD of length at age 5.0747 1 9 # Length-dependent SD 0.56558 0 3 # The number of mean constraints 0