scientific inquiry the scientific method scientists study the natural world by: observation...
TRANSCRIPT

Scientific Inquiry
The Scientific Method

Scientists study the natural world by:
• Observation
• Experimentation
• Modeling
They Follow a set of procedures known as the Scientific Method.

Steps of the Scientific method
I f H yp o th e s is is no t su p po rted
M o d ify h yp o the s is a n d re do e xpe rim e n t.
If H ypo th es is is su p po rted R e pe a t se vera l tim es
U n til yo u ca n fo rm a th e o ry
D ra w C on c lu s io ns
A n a lyze th e D a ta(U s in g G ra p h s)
T e s t th e H yp o th e s is(E xp e rim e n t)
F o rm a hyp o th e s is
G a th e r In fo rm a tion
S ta te Th e P rob lem

Key Words
• Experiment - A procedure used to test a hypothesis.
• Example:
• Performing a procedure to test how quickly Kool Aid dissolves in water

Key Words
• Hypothesis - Prediction in terms of variables. A hypothesis has to be testable.
• Example: “ Kool Aid will dissolve faster in cold water than hot water”
• Note: The hypothesis is not right or wrong until the experiment has proved it right or wrong!

Key Words
• Variable - A factor in an experiment that can or cannot be changed.
• Example:
• Amount of Kool Aid
• Amount of Water
• Temperature of Water
• Speed Kool Aid dissolves ( Time)
• Speed of Mixing

Key Words ( Types of Variables) • Independent variable - The variable that is
changed by the experimenter. It is the Manipulated change that the scientist makes in the experiment.
• Dependent variable - The variable that is changed depending on the values of the Independent variable. It is the Responding change that occurs as a result of the experiment.
• Constant - The variable that does not change throughout the experiment.

1) Scientists test a hypothesis by
• (A) formulating questions
• (B) designing models
• (C) doing experiments
• (D) drawing conclusions

2) In an experiment to determine the effects of radiation on the germination
of seeds, the independent variable would be
• (A) the amount of radiation
• (B) the temperature of the soil
• (C) the germination rate of seeds
• (D) the amount of water added to the seeds

3) During a laboratory activity, a student combined two solutions. In the laboratory report, the student wrote, “A yellow color
appeared.” The statement represents the student’s recorded
• ((A) conclusion
• (B) observation
• (C) hypothesis
• (D) inference

4) The dependent variable in an
experiment is
• (A) the part of the experiment that
the scientist changes.• (B) what changes as a result of
the experiment.• (C) an educated guess about
what might happen.• (D) one of the steps in the
scientific method.

5) John wanted to find out which laundry soap was
best for removing grass stains. Each soap was mixed with warm water. It was then used to scrub a piece of grass-stained cloth for 1 minute. Then the amount of
stain left on the cloth was measured. What was the dependent variable
• (A) water temperature
• (B) Laundry soap
• (C) amount of stain left on the cloth
• (D) scrubbing time for each cloth

But….
How do we determine the variables??!!!

It depends on the EXPERIMENT!
Example-

Experiment: To determine how temperature affects how fast Kool Aid dissolves in Water
•Independent variable - •Temperature of water
•Dependent variable -•Speed Kool Aid dissolves ( Time)
•Constants - •Amount of Kool Aid•Amount of Water•Speed of Mixing

Experiment: To determine how the amount of water affects how
fast Kool Aid dissolves.•Independent variable - •Amount of Water
•Dependent variable -•Speed Kool Aid dissolves ( Time)
•Constants - •Amount of Kool Aid•Speed of Mixing•Temperature of water

Experiment: To determine how the amount of Kool Aid you add
affects how fast it dissolves.•Independent variable - •Amount of Kool Aid
•Dependent variable -•Speed Kool Aid dissolves ( Time)
•Constants - •Amount of Water•Speed of Mixing•Temperature of water

6) Mark is studying how heat affects how fast oil flows. He guesses that as the oil gets hotter, it flows faster.
How could he test this?
• A) Heat oil to different temperatures. Then weigh it after it flows out of the can.
• (B) Observe how fast oil at different temperatures flows down a smooth surface.
• (C) Let oil flow down smooth surfaces at different angles. Observe its speed.]
• (D) Measure the time it takes for oil of different thickness to pour out of the can

Key Words
• Control
• A Standard Value used to compare results
Key Words
• Theory
• An explanation that has been tested repeatedly under controlled experimental conditions conditions and found to be right each time.
Key Words
• Scientific Law
• States a proven theory about nature
• Example
• Law of Gravity.

Key Words
• Technology
• Man-made uses of scientific knowledge
• Example
• TVs IPODs.

7) The ability to reproduce results is an important part of any
(A) hypothesis (C) law(B) theory (D) experiment
•(A)Hypothesis•(B)Theory•(C)Law
• (D)Experiment

8) Which of the following would be an example of technology?
(A) hypothesis (C) law(B) theory (D) experiment
•(A) Observing a rainbow after a storm
•(B) Explaining why a crystal sparkles
•(C) Learning about the nature of fire
•(D) Producing a medicine from a plant

Key Words
• Data• Quantitative and Qualitative
observations made during an experiment.
• Example• Time - Quantitative
• Color - Qualitative

Organizing Scientific Data
•Scientists use graphs to organize data.
•There are 3 main types-

Line Graphs
• Line Graphs are used when trying to show the relationship between two sets of Quantitative Data

Bar Graphs
• Bar Graphs are used when trying to compare the relationship between Quantitative Data and Qualitative Data
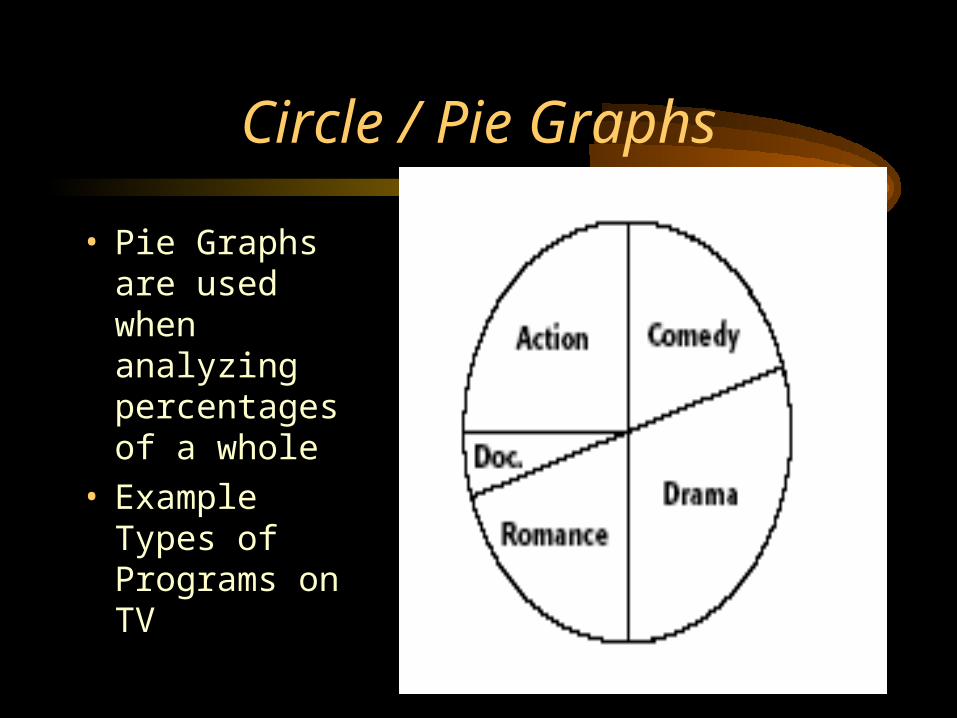
Circle / Pie Graphs
• Pie Graphs are used when analyzing percentages of a whole
• Example Types of Programs on TV

Experiment to determine how the amount of time two chemicals are allowed to react, affects how much gas is produced from the
reaction
• Independent variable -
• Time
• Dependent variable -
• Gas Volume

When graphing REMEMBER!!!!DRY- MIX
•Dependent variable
•Responding variable
•Y-axis
•Manipulated variable
•Independent variable
•X-axis

9)Which of the following is the BEST description of the relationship shown
on the graph?
•(A) The larger the engine, the more miles per gallon the car gets.
•(B) The fewer miles per gallon the car gets, the smaller the engine.•(C) The smaller the engine, the more miles per gallon a car gets.•(D) The more miles per gallon for a car, the larger the engine.

10) John let his flashlight burn for 14 straight hours. He measured the amount of light given off (in
lumens) at various times.
Time, hoursLight given off, lumens09.528.538.556.084.2
140.6
• Which graph would best shows his results?
• (A) Bar Graph• (B) Line Graph• ( C) Circle Graph• ( D) Pie Graph