scientific methods in psychology
DESCRIPTION
Scientific Methods in Psychology. Scientific Method. The Scientific Method: Terminology. Operational definition: A definition that specifies the operations or procedures used to produce or measure something, a way to give it a numerical value - PowerPoint PPT PresentationTRANSCRIPT

Scientific Methods in PsychologyScientific Methods in Psychology
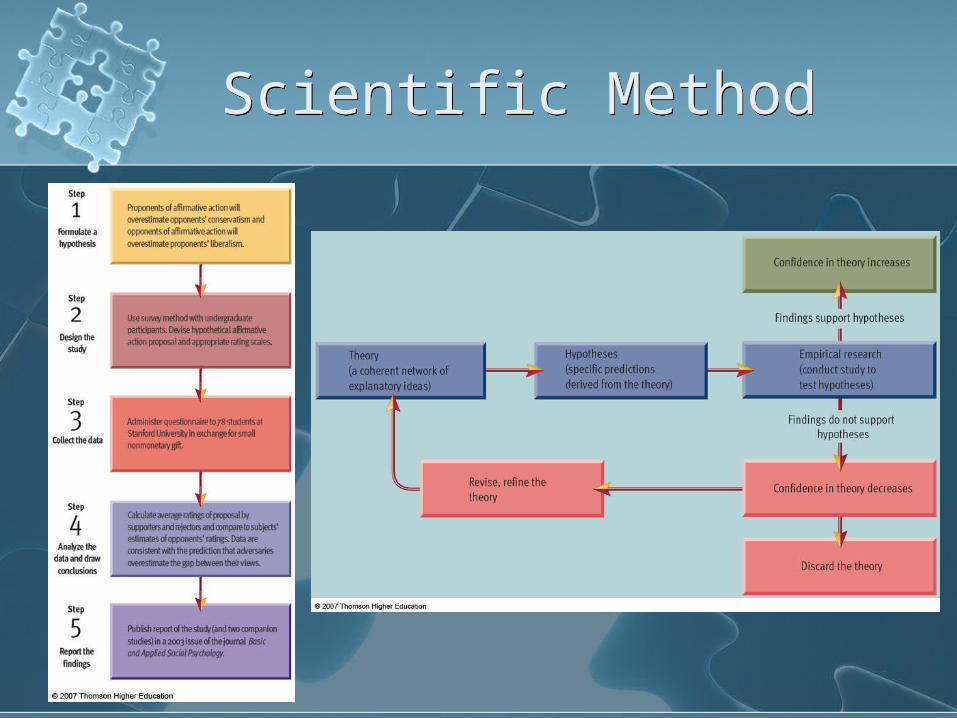
Scientific MethodScientific Method
The Scientific Method: Terminology
The Scientific Method: Terminology
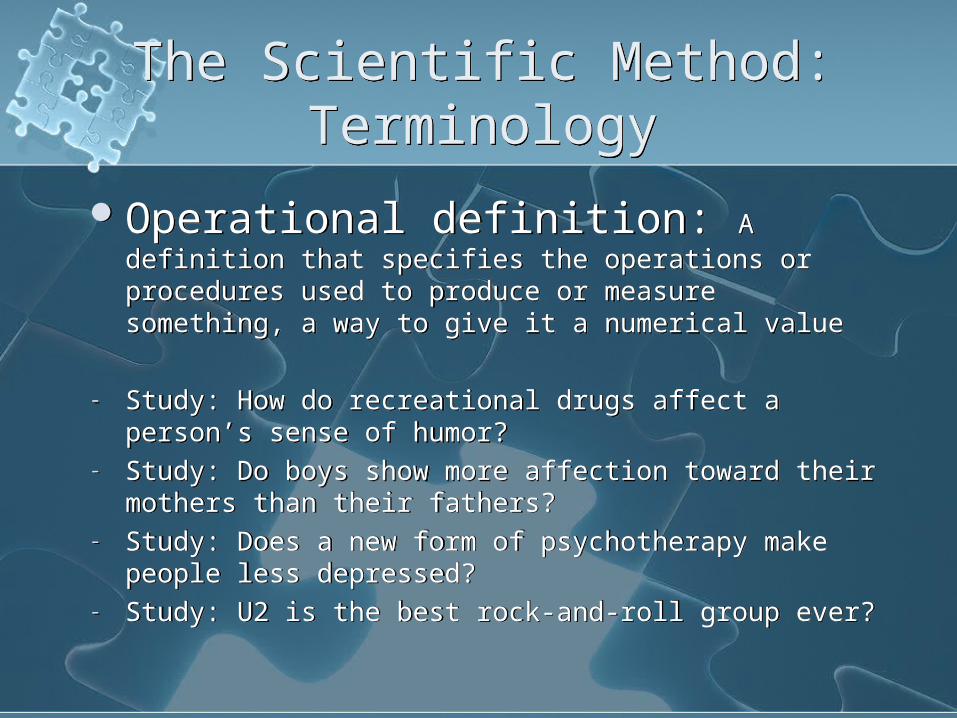
Operational definition: A definition that specifies the operations or procedures used to produce or measure something, a way to give it a numerical value
- Study: How do recreational drugs affect a person’s sense of humor?
- Study: Do boys show more affection toward their mothers than their fathers?
- Study: Does a new form of psychotherapy make people less depressed?
- Study: U2 is the best rock-and-roll group ever?
The Scientific Method: Terminology
The Scientific Method: Terminology
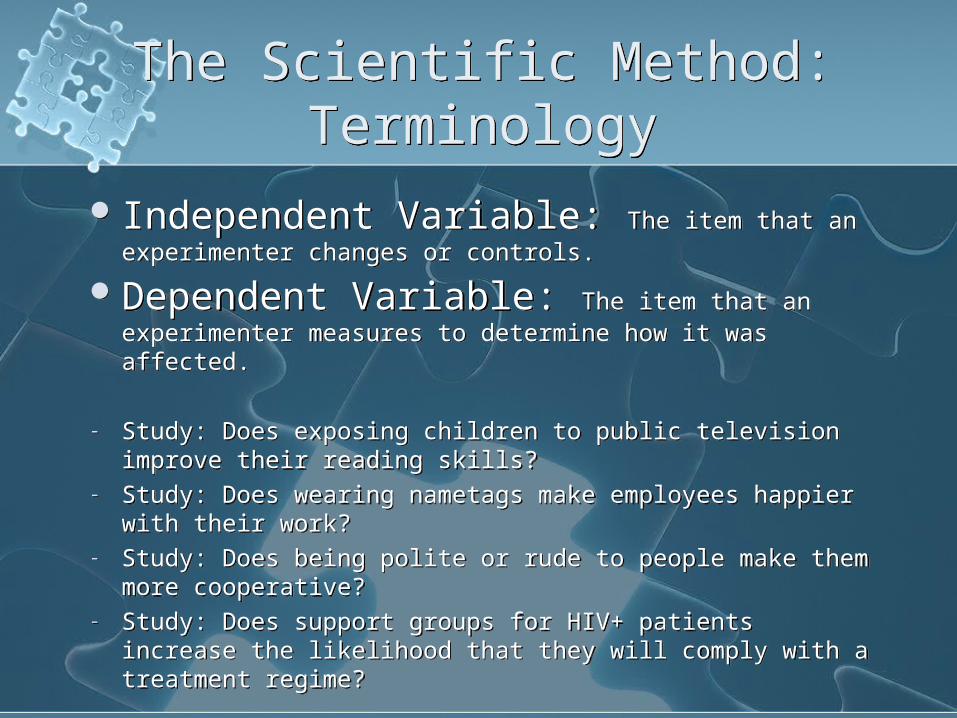
Independent Variable: The item that an experimenter changes or controls.
Dependent Variable: The item that an experimenter measures to determine how it was affected.
- Study: Does exposing children to public television improve their reading skills?
- Study: Does wearing nametags make employees happier with their work?
- Study: Does being polite or rude to people make them more cooperative?
- Study: Does support groups for HIV+ patients increase the likelihood that they will comply with a treatment regime?
Pulling it all together:“Personal Space”
Pulling it all together:“Personal Space”
We are a Lab Group
What is our Hypothesis? How do we Operationalize “Personal Space” What is our Independent Variable? What is our Dependent Variable?
What are our Results? What are the Implications?
http://www.npr.org/blogs/bryantpark/2007/05/dont_stand_so_close_to_me.html
We are a Lab Group
What is our Hypothesis? How do we Operationalize “Personal Space” What is our Independent Variable? What is our Dependent Variable?
What are our Results? What are the Implications?
http://www.npr.org/blogs/bryantpark/2007/05/dont_stand_so_close_to_me.html
Populations & SamplesPopulations & Samples
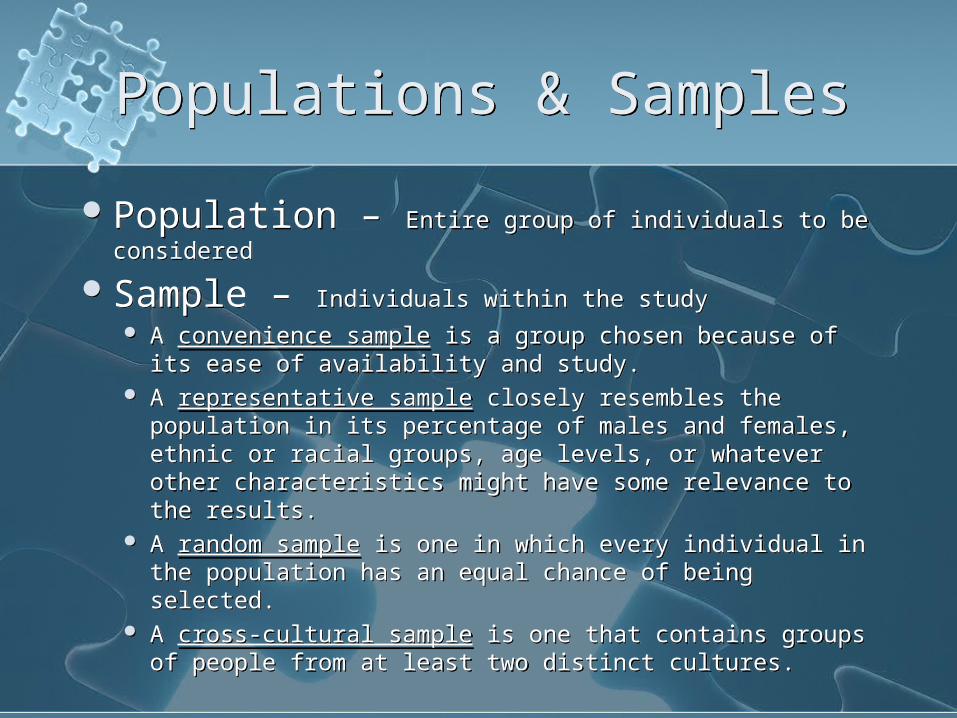
Population – Entire group of individuals to be considered
Sample – Individuals within the study A convenience sample is a group chosen because of its
ease of availability and study. A representative sample closely resembles the
population in its percentage of males and females, ethnic or racial groups, age levels, or whatever other characteristics might have some relevance to the results.
A random sample is one in which every individual in the population has an equal chance of being selected.
A cross-cultural sample is one that contains groups of people from at least two distinct cultures.
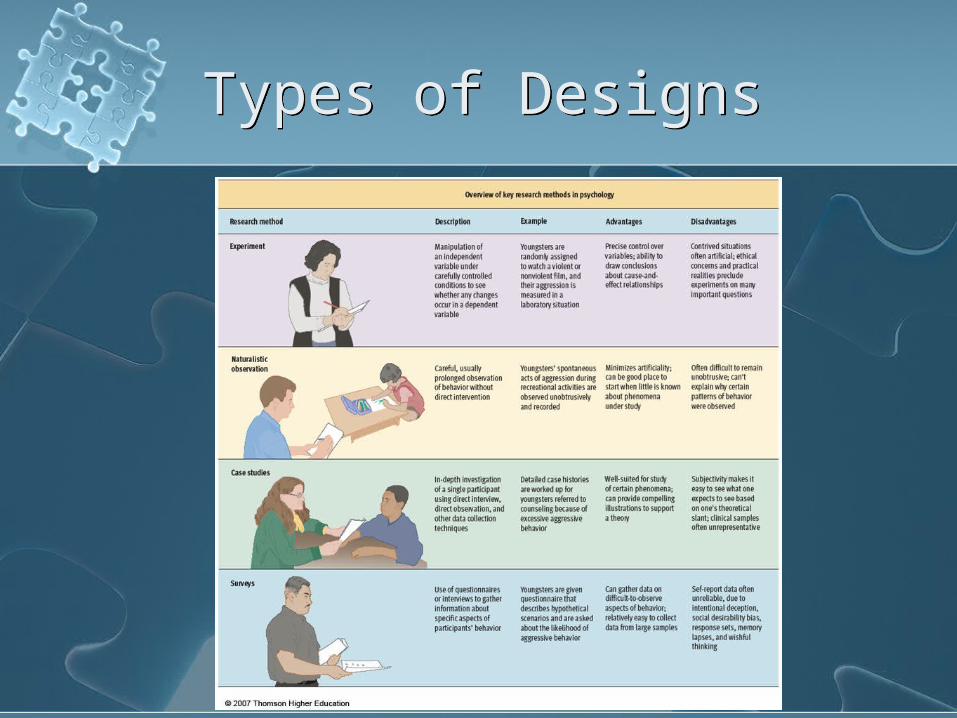
Types of DesignsTypes of Designs
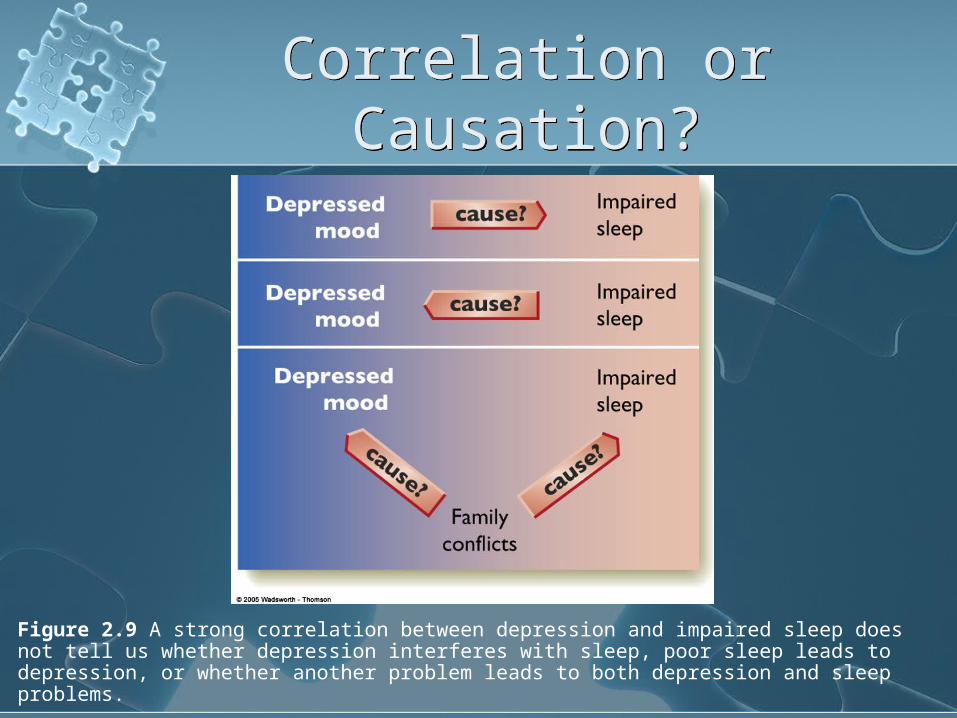
Figure 2.9 A strong correlation between depression and impaired sleep does not tell us whether depression interferes with sleep, poor sleep leads to depression, or whether another problem leads to both depression and sleep problems.
Correlation or Causation?
Correlation or Causation?
Correlation or Causation?
Correlation or Causation?
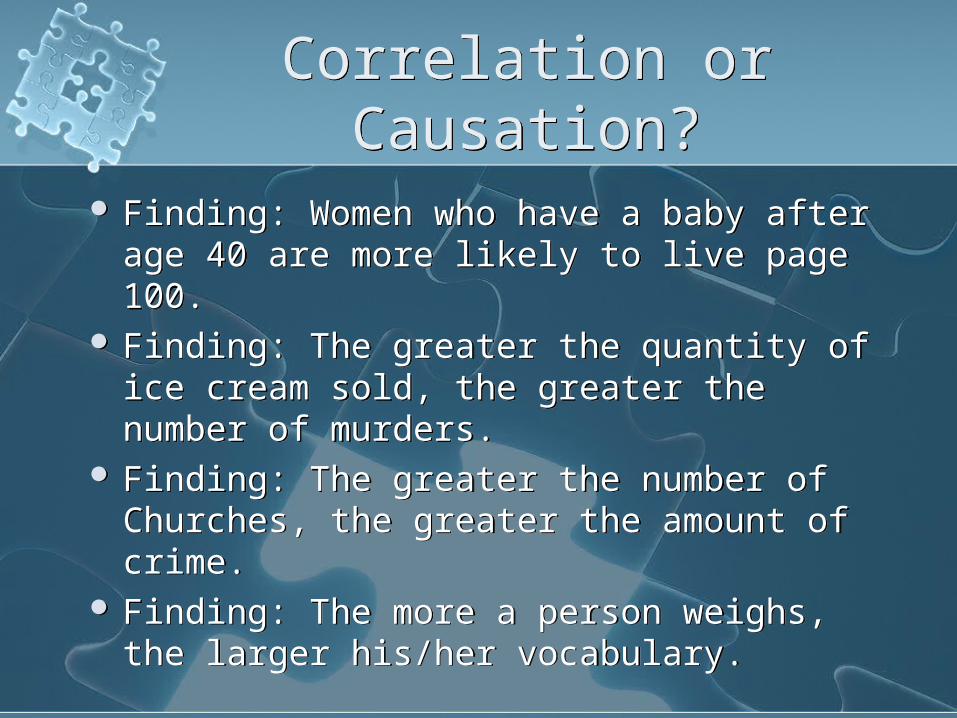
Finding: Women who have a baby after age 40 are more likely to live page 100.
Finding: The greater the quantity of ice cream sold, the greater the number of murders.
Finding: The greater the number of Churches, the greater the amount of crime.
Finding: The more a person weighs, the larger his/her vocabulary.

Critical ThinkingCritical Thinking
Critical Thinking - how we utilize scientific methods in evaluating claims and theories in psychology.
A theory that makes precise predictions is falsifiable because it is easy to think of evidence that would confirm or contradict the theory.
Reliance on the fewest and simplest possible assumptions is called parsimony, and is considered an essential strength of good scientific theory.
Replicable results are those that anyone can obtain, at least approximately, by following the same procedures.
The willingness to consider proper evidence is called open-mindedness
Horoscope StudyHoroscope Study

Horoscope StudyHoroscope Study
http://www.youtube.com/watch?v=3Dp2Zqk8vHw
http://www.youtube.com/watch?v=3Dp2Zqk8vHw
Statistics and Research:Drawing Conclusions
Statistics and Research:Drawing Conclusions
Statistics – using mathematics to organize, summarize, and interpret numerical dataDescriptive statistics: organizing
and summarizing dataInferential statistics: interpreting
data and drawing conclusions
Statistics – using mathematics to organize, summarize, and interpret numerical dataDescriptive statistics: organizing
and summarizing dataInferential statistics: interpreting
data and drawing conclusions
Mean, Median, ModeMean, Median, Mode
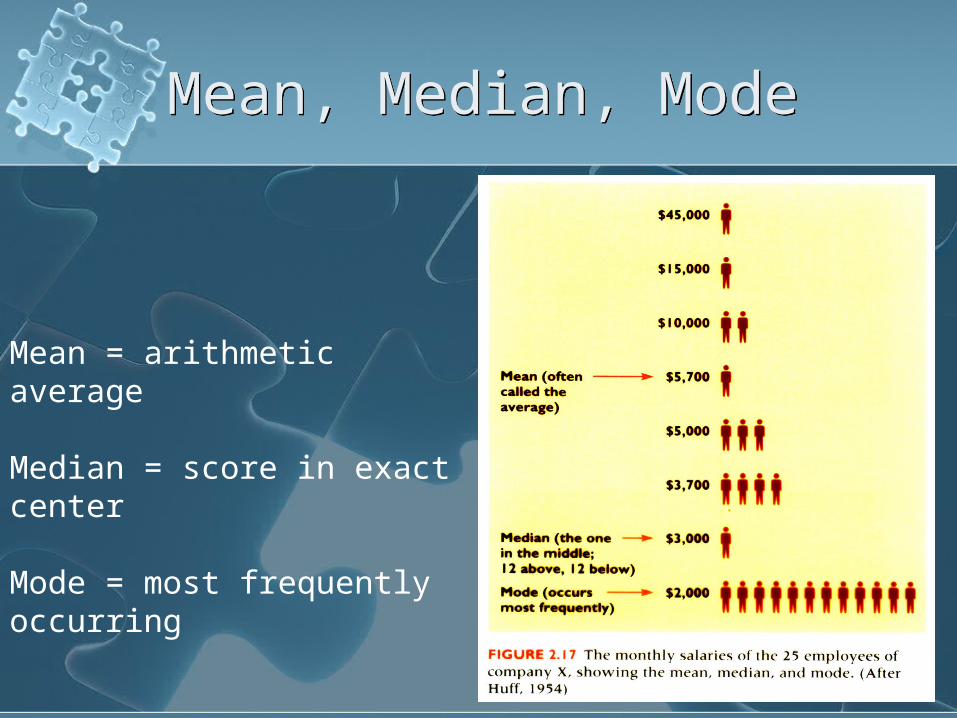
Mean = arithmetic average
Median = score in exact center
Mode = most frequently occurring

Calculate the mean, median and mode for this distribution of scores:
2, 3, 4, 4, 7, 10
Calculate the mean, median and mode for this distribution of scores:
2, 3, 4, 4, 7, 10
Calculate the mean, median and mode for this distribution of scores:
2, 3, 4, 4, 7, 10
Calculate the mean, median and mode for this distribution of scores:
2, 3, 4, 4, 7, 10
Mean, Median, ModeMean, Median, Mode
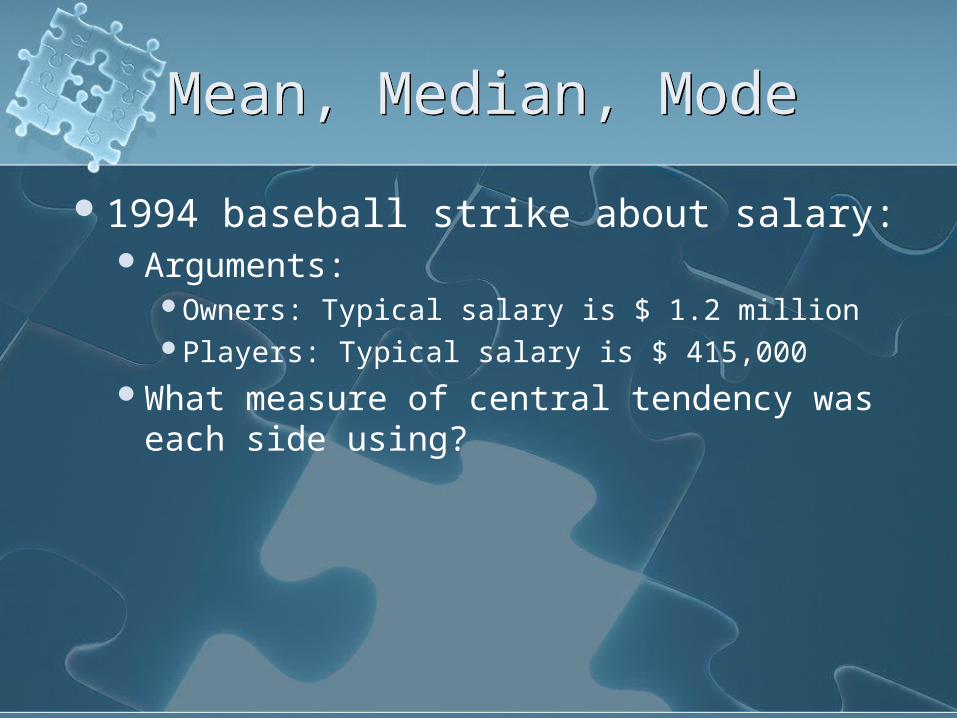
1994 baseball strike about salary:Arguments:
Owners: Typical salary is $ 1.2 millionPlayers: Typical salary is $ 415,000
What measure of central tendency was each side using?
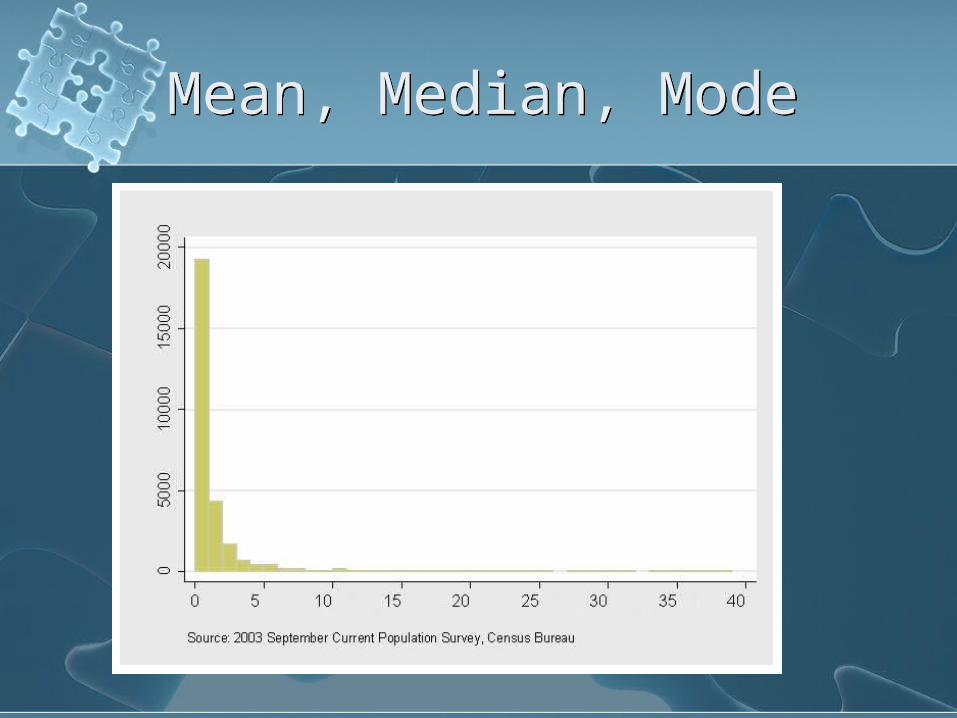
Mean, Median, ModeMean, Median, Mode
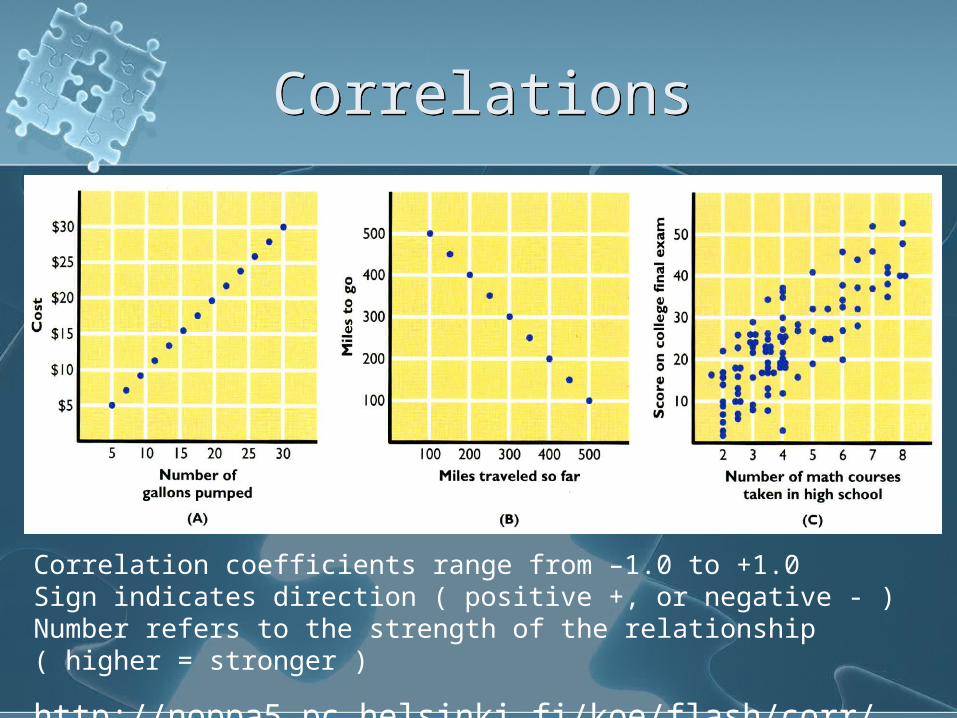
CorrelationsCorrelations
Correlation coefficients range from –1.0 to +1.0 Sign indicates direction ( positive +, or negative - )Number refers to the strength of the relationship ( higher = stronger )
http://noppa5.pc.helsinki.fi/koe/flash/corr/ch16.html
Misleading StatisticsMisleading Statistics
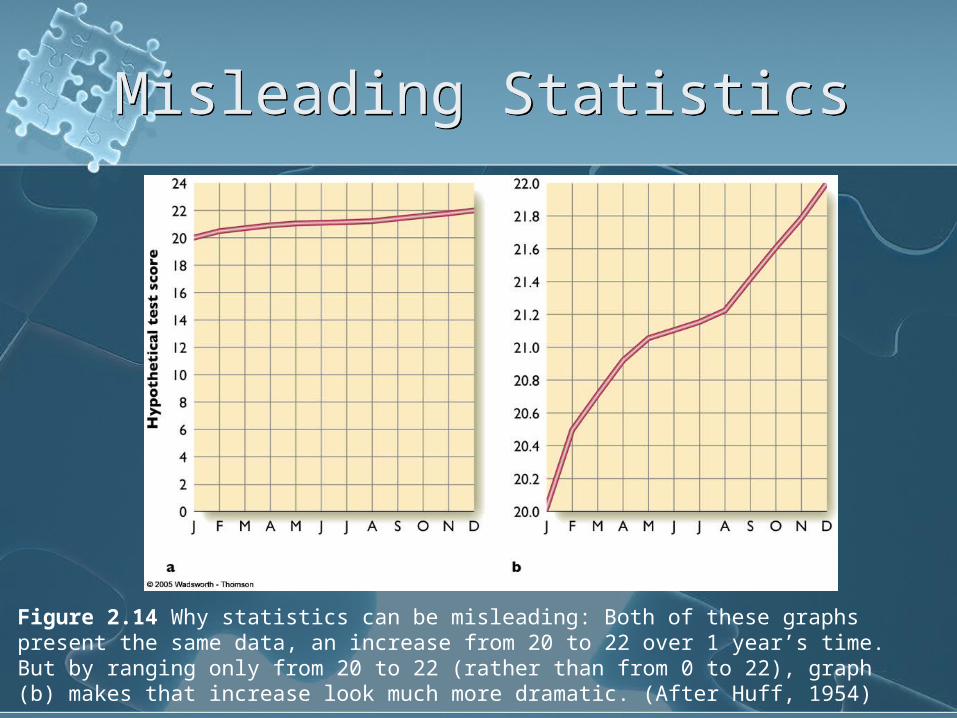
Figure 2.14 Why statistics can be misleading: Both of these graphs present the same data, an increase from 20 to 22 over 1 year’s time. But by ranging only from 20 to 22 (rather than from 0 to 22), graph (b) makes that increase look much more dramatic. (After Huff, 1954)