scientific programming in c ix. debugging · worst case scenario: spend many weeks nding a trivial...
TRANSCRIPT
Scientific Programming in CIX. Debugging
Susi Lehtola
13 November 2012
Debugging
Quite often you spend an hour to write a code, and then two hoursdebugging why it doesn’t work properly.
Worst case scenario: spend many weeks finding a trivial bug, e.g.,in the unit conversions.
Break your problem into simple pieces and test themseparately.
Scientific Programming in C, fall 2012 Susi Lehtola Debugging 2/24
Debugging
Quite often you spend an hour to write a code, and then two hoursdebugging why it doesn’t work properly.
Worst case scenario: spend many weeks finding a trivial bug, e.g.,in the unit conversions.
Break your problem into simple pieces and test themseparately.
Scientific Programming in C, fall 2012 Susi Lehtola Debugging 3/24
Debugging
Quite often you spend an hour to write a code, and then two hoursdebugging why it doesn’t work properly.
Worst case scenario: spend many weeks finding a trivial bug, e.g.,in the unit conversions.
Break your problem into simple pieces and test themseparately.
Scientific Programming in C, fall 2012 Susi Lehtola Debugging 4/24
Debugging, cont’d
You can always use manual debugging to figure out what goes outin the program, i.e. insert lots of printf statements.
Another option is to use debugging tools such as gdb andvalgrind.
To use the debugging tools you need to use the -g flag whencompiling.
Scientific Programming in C, fall 2012 Susi Lehtola Debugging 5/24
Debugging, cont’d
Perhaps the most common problem a beginning C programmerencounters is
$ . / a . outSegmentat ion f a u l t ( c o r e dumped )
In these cases you often just want to know where the segfaulthappens.
Scientific Programming in C, fall 2012 Susi Lehtola Debugging 6/24
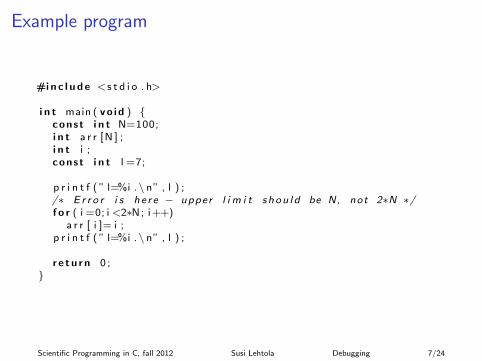
Example program
#i n c l u d e <s t d i o . h>
i n t main ( v o i d ) {const i n t N=100;i n t a r r [N ] ;i n t i ;const i n t l =7;
p r i n t f ( ” l=%i .\ n” , l ) ;/∗ E r r o r i s he r e − upper l i m i t shou l d be N, not 2∗N ∗/f o r ( i =0; i <2∗N; i ++)
a r r [ i ]= i ;p r i n t f ( ” l=%i .\ n” , l ) ;
r e t u r n 0 ;}
Scientific Programming in C, fall 2012 Susi Lehtola Debugging 7/24
Using GDB
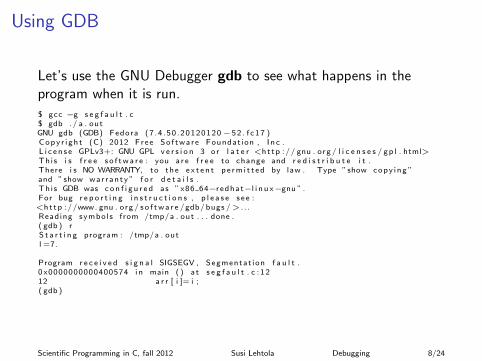
Let’s use the GNU Debugger gdb to see what happens in theprogram when it is run.
$ gcc −g s e g f a u l t . c$ gdb . / a . outGNU gdb (GDB) Fedora (7 .4 .50 .20120120 −52 . f c 1 7 )C o p y r i g h t (C) 2012 F r e e S o f t w a r e Foundat ion , I n c .L i c e n s e GPLv3+: GNU GPL v e r s i o n 3 o r l a t e r <h t t p : / / gnu . org / l i c e n s e s / g p l . html>This i s f r e e s o f t w a r e : you a r e f r e e to change and r e d i s t r i b u t e i t .There i s NO WARRANTY, to t h e e x t e n t p e r m i t t e d by law . Type ”show c o p y i n g ”and ”show w a r r a n t y ” f o r d e t a i l s .Th i s GDB was c o n f i g u r e d as ” x86 64−redhat−l i n u x−gnu ” .For bug r e p o r t i n g i n s t r u c t i o n s , p l e a s e s e e :<h t t p : / /www. gnu . org / s o f t w a r e /gdb/ bugs / > . . .Reading symbol s from /tmp/a . out . . . done .( gdb ) rS t a r t i n g program : /tmp/a . outl =7.
Program r e c e i v e d s i g n a l SIGSEGV , Segmentat ion f a u l t .0 x0000000000400574 i n main ( ) a t s e g f a u l t . c : 1 212 a r r [ i ]= i ;( gdb )
Scientific Programming in C, fall 2012 Susi Lehtola Debugging 8/24
Using GDB, cont’d
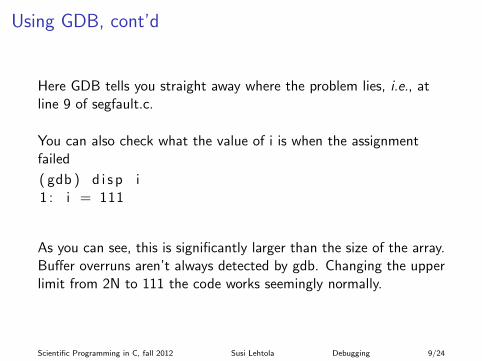
Here GDB tells you straight away where the problem lies, i.e., atline 9 of segfault.c.
You can also check what the value of i is when the assignmentfailed
( gdb ) d i s p i1 : i = 111
As you can see, this is significantly larger than the size of the array.Buffer overruns aren’t always detected by gdb. Changing the upperlimit from 2N to 111 the code works seemingly normally.
Scientific Programming in C, fall 2012 Susi Lehtola Debugging 9/24
Using GDB, cont’d
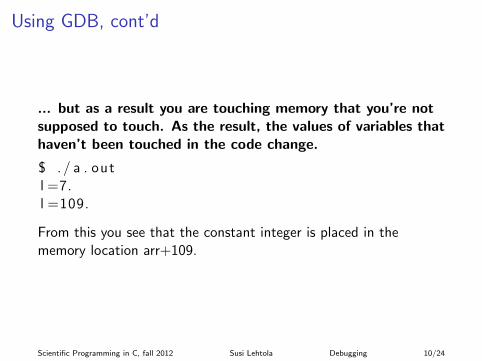
... but as a result you are touching memory that you’re notsupposed to touch. As the result, the values of variables thathaven’t been touched in the code change.
$ . / a . outl =7.l =109.
From this you see that the constant integer is placed in thememory location arr+109.
Scientific Programming in C, fall 2012 Susi Lehtola Debugging 10/24
Using GDB, cont’d
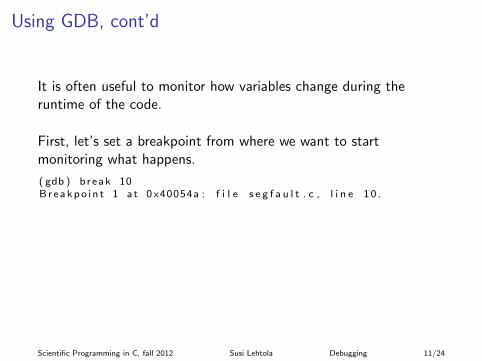
It is often useful to monitor how variables change during theruntime of the code.
First, let’s set a breakpoint from where we want to startmonitoring what happens.
( gdb ) b r e a k 10B r e a k p o i n t 1 a t 0 x40054a : f i l e s e g f a u l t . c , l i n e 1 0 .
If you have multiple translation units linked into the same program,you can define the unit with, e.g.
( gdb ) b r e a k s e g f a u l t . c : 1 0B r e a k p o i n t 1 a t 0 x40054a : f i l e s e g f a u l t . c , l i n e 1 0 .
Scientific Programming in C, fall 2012 Susi Lehtola Debugging 11/24
Using GDB, cont’d
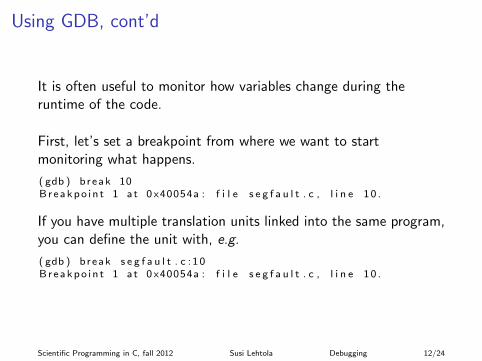
It is often useful to monitor how variables change during theruntime of the code.
First, let’s set a breakpoint from where we want to startmonitoring what happens.
( gdb ) b r e a k 10B r e a k p o i n t 1 a t 0 x40054a : f i l e s e g f a u l t . c , l i n e 1 0 .
If you have multiple translation units linked into the same program,you can define the unit with, e.g.
( gdb ) b r e a k s e g f a u l t . c : 1 0B r e a k p o i n t 1 a t 0 x40054a : f i l e s e g f a u l t . c , l i n e 1 0 .
Scientific Programming in C, fall 2012 Susi Lehtola Debugging 12/24
Using GDB, cont’d
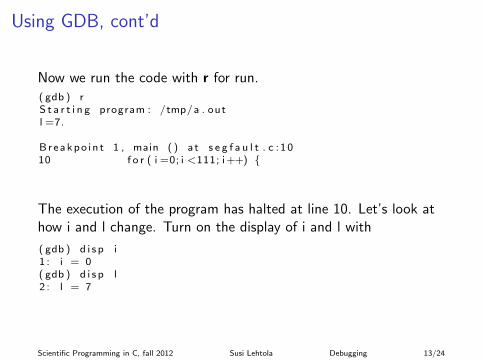
Now we run the code with r for run.( gdb ) rS t a r t i n g program : /tmp/a . outl =7.
B r e a k p o i n t 1 , main ( ) a t s e g f a u l t . c : 1 010 f o r ( i =0; i <111; i ++) {
The execution of the program has halted at line 10. Let’s look athow i and l change. Turn on the display of i and l with
( gdb ) d i s p i1 : i = 0( gdb ) d i s p l2 : l = 7
Scientific Programming in C, fall 2012 Susi Lehtola Debugging 13/24
Using GDB, cont’d
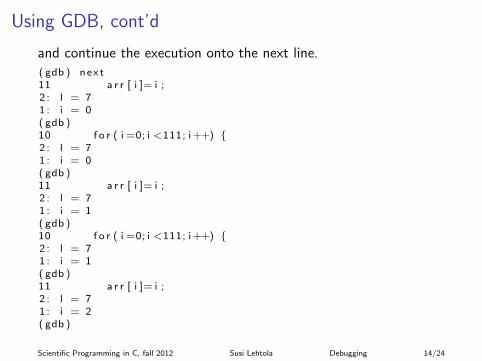
and continue the execution onto the next line.( gdb ) n e x t11 a r r [ i ]= i ;2 : l = 71 : i = 0( gdb )10 f o r ( i =0; i <111; i ++) {2 : l = 71 : i = 0( gdb )11 a r r [ i ]= i ;2 : l = 71 : i = 1( gdb )10 f o r ( i =0; i <111; i ++) {2 : l = 71 : i = 1( gdb )11 a r r [ i ]= i ;2 : l = 71 : i = 2( gdb )
Scientific Programming in C, fall 2012 Susi Lehtola Debugging 14/24
Using GDB, cont’d
Hitting ENTER will just repeat the same command as seen above.From the output you see how the program runs.
I When the program enters the loop i=0 and l=7 and it hasbeen checked that i<111.
I Next, arr[0] is set to 0.
I The for loop has been completed, i is incremented and it isonce again checked that i<111.
I arr[1] is set to 1.
I i is incremented and checked that i<111.
I arr[2] is set to 2.
Scientific Programming in C, fall 2012 Susi Lehtola Debugging 15/24
Using GDB, cont’d
Hitting ENTER will just repeat the same command as seen above.From the output you see how the program runs.
I When the program enters the loop i=0 and l=7 and it hasbeen checked that i<111.
I Next, arr[0] is set to 0.
I The for loop has been completed, i is incremented and it isonce again checked that i<111.
I arr[1] is set to 1.
I i is incremented and checked that i<111.
I arr[2] is set to 2.
Scientific Programming in C, fall 2012 Susi Lehtola Debugging 16/24
Using GDB, cont’d
Hitting ENTER will just repeat the same command as seen above.From the output you see how the program runs.
I When the program enters the loop i=0 and l=7 and it hasbeen checked that i<111.
I Next, arr[0] is set to 0.
I The for loop has been completed, i is incremented and it isonce again checked that i<111.
I arr[1] is set to 1.
I i is incremented and checked that i<111.
I arr[2] is set to 2.
Scientific Programming in C, fall 2012 Susi Lehtola Debugging 17/24
Using GDB, cont’d
Hitting ENTER will just repeat the same command as seen above.From the output you see how the program runs.
I When the program enters the loop i=0 and l=7 and it hasbeen checked that i<111.
I Next, arr[0] is set to 0.
I The for loop has been completed, i is incremented and it isonce again checked that i<111.
I arr[1] is set to 1.
I i is incremented and checked that i<111.
I arr[2] is set to 2.
Scientific Programming in C, fall 2012 Susi Lehtola Debugging 18/24
Using GDB, cont’d
Hitting ENTER will just repeat the same command as seen above.From the output you see how the program runs.
I When the program enters the loop i=0 and l=7 and it hasbeen checked that i<111.
I Next, arr[0] is set to 0.
I The for loop has been completed, i is incremented and it isonce again checked that i<111.
I arr[1] is set to 1.
I i is incremented and checked that i<111.
I arr[2] is set to 2.
Scientific Programming in C, fall 2012 Susi Lehtola Debugging 19/24
Using GDB, cont’d
Hitting ENTER will just repeat the same command as seen above.From the output you see how the program runs.
I When the program enters the loop i=0 and l=7 and it hasbeen checked that i<111.
I Next, arr[0] is set to 0.
I The for loop has been completed, i is incremented and it isonce again checked that i<111.
I arr[1] is set to 1.
I i is incremented and checked that i<111.
I arr[2] is set to 2.
Scientific Programming in C, fall 2012 Susi Lehtola Debugging 20/24
Using GDB, cont’d
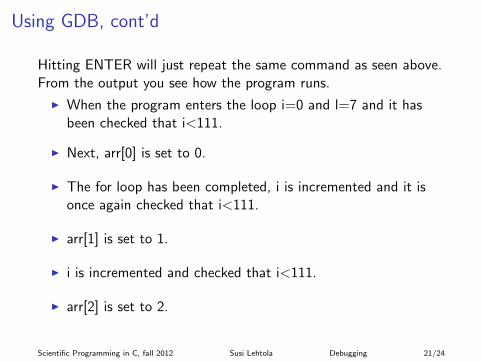
Hitting ENTER will just repeat the same command as seen above.From the output you see how the program runs.
I When the program enters the loop i=0 and l=7 and it hasbeen checked that i<111.
I Next, arr[0] is set to 0.
I The for loop has been completed, i is incremented and it isonce again checked that i<111.
I arr[1] is set to 1.
I i is incremented and checked that i<111.
I arr[2] is set to 2.
Scientific Programming in C, fall 2012 Susi Lehtola Debugging 21/24
Using GDB, cont’d
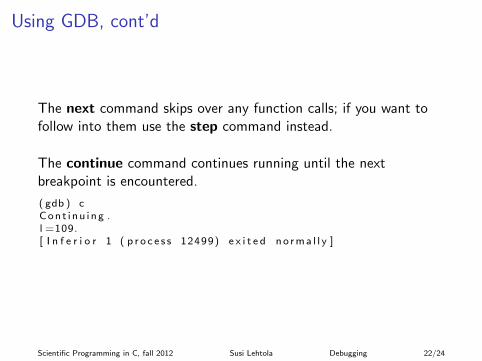
The next command skips over any function calls; if you want tofollow into them use the step command instead.
The continue command continues running until the nextbreakpoint is encountered.
( gdb ) cC o n t i n u i n g .l =109.[ I n f e r i o r 1 ( p r o c e s s 12499) e x i t e d n o r m a l l y ]
Scientific Programming in C, fall 2012 Susi Lehtola Debugging 22/24
Valgrind
The use of the debugger doesn’t tell you if you have errors in thememory management. These you can find with memory debuggerssuch as Valgrind.
It is especially useful with dynamic memory allocation, as it alsochecks for leaked memory (memory that is malloc’d but notfree’d).
Scientific Programming in C, fall 2012 Susi Lehtola Debugging 23/24
Valgrind, cont’d
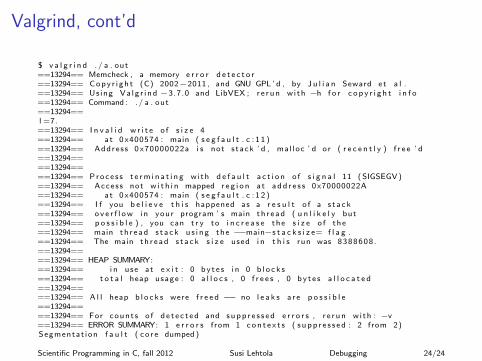
$ v a l g r i n d . / a . out==13294== Memcheck , a memory e r r o r d e t e c t o r==13294== C o p y r i g h t (C) 2002−2011 , and GNU GPL ’ d , by J u l i a n Seward e t a l .==13294== Using V a l g r i n d −3.7.0 and LibVEX ; r e r u n w i t h −h f o r c o p y r i g h t i n f o==13294== Command : . / a . out==13294==l =7.==13294== I n v a l i d w r i t e o f s i z e 4==13294== a t 0 x400574 : main ( s e g f a u l t . c : 1 1 )==13294== Address 0 x70000022a i s not s t a c k ’ d , mal loc ’ d o r ( r e c e n t l y ) f r e e ’ d==13294====13294====13294== P r o c e s s t e r m i n a t i n g w i t h d e f a u l t a c t i o n o f s i g n a l 11 ( SIGSEGV )==13294== Ac ce ss not w i t h i n mapped r e g i o n a t a d d r e s s 0 x70000022A==13294== a t 0 x400574 : main ( s e g f a u l t . c : 1 2 )==13294== I f you b e l i e v e t h i s happened as a r e s u l t o f a s t a c k==13294== o v e r f l o w i n your program ’ s main t h r e a d ( u n l i k e l y but==13294== p o s s i b l e ) , you can t r y to i n c r e a s e t h e s i z e o f t h e==13294== main t h r e a d s t a c k u s i n g t h e −−main−s t a c k s i z e= f l a g .==13294== The main t h r e a d s t a c k s i z e used i n t h i s run was 8388608.==13294====13294== HEAP SUMMARY:==13294== i n use a t e x i t : 0 b y t e s i n 0 b l o c k s==13294== t o t a l heap usage : 0 a l l o c s , 0 f r e e s , 0 b y t e s a l l o c a t e d==13294====13294== A l l heap b l o c k s were f r e e d −− no l e a k s a r e p o s s i b l e==13294====13294== For c o u n t s o f d e t e c t e d and s u p p r e s s e d e r r o r s , r e r u n w i t h : −v==13294== ERROR SUMMARY: 1 e r r o r s from 1 c o n t e x t s ( s u p p r e s s e d : 2 from 2)Segmentat ion f a u l t ( c o r e dumped )
Scientific Programming in C, fall 2012 Susi Lehtola Debugging 24/24