scientific, technical and economic committee for …plen... · 4 56th plenary meeting report of the...
TRANSCRIPT
1
SCIENTIFIC, TECHNICAL AND
ECONOMIC COMMITTEE FOR
FISHERIES –
57TH PLENARY MEETING REPORT
(PLEN-18-01)
EUR 29225 EN
Edited by Clara Ulrich & Hendrik Doerner

This publication is a Science for Policy report by the Joint Research Centre (JRC), the European
Commission’s science and knowledge service. It aims to provide evidence-based scientific support
to the European policy-making process. The scientific output expressed does not imply a policy
position of the European Commission. Neither the European Commission nor any person acting on
behalf of the Commission is responsible for the use which might be made of this publication.
Contact information
Name: STECF secretariat
Address: Unit D.02 Water and Marine Resources, Via Enrico Fermi 2749, 21027 Ispra VA, Italy
E-mail: [email protected]
Tel.: +39 0332 789343
JRC Science Hub
https://ec.europa.eu/jrc
JRC111800
EUR 29225 EN
PDF ISBN 978-92-79-85804-8 ISSN 1831-9424 doi:10.2760/088784
STECF ISSN 2467-0715
Luxembourg: Publications Office of the European Union, 2018
© European Union, 2018
Reuse is authorised provided the source is acknowledged. The reuse policy of European
Commission documents is regulated by Decision 2011/833/EU (OJ L 330, 14.12.2011, p. 39).
For any use or reproduction of photos or other material that is not under the EU copyright, permission
must be sought directly from the copyright holders.
How to cite: Scientific, Technical and Economic Committee for Fisheries (STECF) – 57th Plenary
Meeting Report (PLEN-18-01), Publications Office of the European Union, Luxembourg, 2018, ISBN
978-92-79-85804-8, doi:10.2760/088784, JRC111800
All images © European Union 2018
Abstract
Commission Decision of 25 February 2016 setting up a Scientific, Technical and Economic
Committee for Fisheries, C(2016) 1084, OJ C 74, 26.2.2016, p. 4–10. The Commission may consult
the group on any matter relating to marine and fisheries biology, fishing gear technology, fisheries
economics, fisheries governance, ecosystem effects of fisheries, aquaculture or similar disciplines.
The Scientific, Technical and Economic Committee for Fisheries hold its 57th plenary on 9-13 April
2018 in Brussels.

3
TABLE OF CONTENTS
1. INTRODUCTION ....................................................................................... 4
2. LIST OF PARTICIPANTS ............................................................................. 4
3. INFORMATION TO THE COMMITTEE ............................................................. 5
4. ASSESSMENT OF STECF EWG REPORTS ........................................................ 6
4.1 EWG 17-15 Stock assessments in the Mediterranean Sea - part II ......................... 6
4.2 EWG 17-16 (Transition) Economic report fish processing 2017 ............................ 13
4.3 EWG 18-01 Data gaps and Biomass Escapement Strategy for Adriatic anchovy and sardine ........................................................................................................... 15
4.4 EWG 18-02 Technical Measures – Improving selectivity to reduce the risk of choke species ........................................................................................................... 18
5. ADDITIONAL REQUESTS SUBMITTED TO THE STECF PLENARY BY THE COMMISSION 25
5.1 CFP monitoring ............................................................................................. 25
5.2 Monitoring the Landing Obligation ................................................................... 33
5.3 Review of the North Western Waters Combined de minimis request ..................... 47
5.4 Impact of exploitation pattern on MSY yields .................................................... 56
5.5 Review of the UK avoidance programme for picked dogfish ................................. 64
5.6 Skipjack HCR ............................................................................................... 73
5.7 Preparation for the EWG on mandatory surveys ................................................ 81
5.8 Evaluation of Italian national management plans for demersal stocks in GSA 9, 10, 11, 16,
17-18 and 19 ......................................................................................... 86
5.9 Evaluation of the quality of DCF data for data limited information ....................... 102
5.10 Evaluation of the national management plan for boat dredges in Catalonia, Spain110
6. ITEMS /DISCUSSION POINTS FOR PREPARATION OF EWGS AND OTHER STECF WORK .......................................................................................................... 122
6.1 Preparation for the EWG 18-19 aquaculture economic report .............................. 122
6.2 EWG 18-09 on an effort regime for demersal fisheries in the western Mediterranean124
6.5 Reflection on identification of future research and innovation priorities in fisheries science .......................................................................................................... 127
7. BACKGROUND DOCUMENTS .................................................................... 140
8. CONTACT DETAILS OF STECF MEMBERS AND OTHER PARTICIPANTS ............ 141
4
56th PLENARY MEETING REPORT OF THE SCIENTIFIC, TECHNICAL
AND ECONOMIC COMMITTEE FOR FISHERIES (PLEN-17-02)
PLENARY MEETING
10-14 July 2017, Brussels
1. INTRODUCTION
The STECF plenary took place at the Centre Borschette, Brussels, from 9 to 13 April 2018. The
chair of the STECF, Clara Ulrich, opened the plenary session at 11:00h. The terms of reference for the meeting were reviewed and discussed and consequently the meeting agenda agreed.
The session was managed through alternation of plenary and working group meetings. Rapporteurs for each item on the agenda were appointed and are identified in the list of
participants. The meeting closed at 16:00h on 13 April 2018.
2. LIST OF PARTICIPANTS
The meeting was attended by 30 members of the STECF, two invited experts and three JRC
personnel. 10 DG MARE attended parts of the meeting. Section eight of this report provides a detailed participant list with contact details.
The following STCF members were unable to attend the meeting:
1. Massimiliano Cardinale
2. Jenny Nord

5
3. INFORMATION TO THE COMMITTEE
STECF work program 2018
The STECF was informed on the current state of planning for meetings and requests for advice by written procedures in 2018.
Meetings 2018 updates:
EWG 18-08 Elasmobranch, 11-15 June, Brussels – EWG has been cancelled
Working Group for the preparation of EWG 18-11: New FDI – date tbd, JRC
EWG 18-11: New FDI, 10-14 September, Ispra / Varese / JRC – co-chaired by Arina
Motova & Willy Vanhee
Working group for the preparation for STECF EWG 18-14: Balance / Capacity – 2 days
in week 23 July
EWG 18-15: CFP monitoring: expansion of indicators – date set to 1-5 October, venue
Brussels
EWG 18-13: Stock assessments in the Black Sea 2018 - date moved to 24-28
September, venue Ispra, Chair: M. Cardinale, review procedure: OWP by end Ocotber
https://stecf.jrc.ec.europa.eu/meetings
Forthcoming written procedures:
No written procedures are currently foreseen prior to the July 2018 plenary meeting.
Election of new vice chair
Following the resignation of Massimiliano Cardinale from the vice chair position, the election for a new vice-chair for the remaining Committee term until April 2019 was held. Two nominations
for the vice-chair position were received by the secretariat. Before the election, the candidates presented themselves to the plenary on 11 April. STECF members present elected Antonello
Sala vice chair. The election took place on the morning of 11 April and was chaired by the secretariat.

6
4. ASSESSMENT OF STECF EWG REPORTS
4.1 EWG 17-15 Stock assessments in the Mediterranean Sea - part II
Request to the STECF
STECF is requested to review the report of the STECF Expert Working Group meetings, evaluate the findings and make any appropriate comments and recommendations.
STECF observations
The working group was held in Rome, Italy, from 27rd November to 3rd December 2017. The meeting was attended by 22 experts in total, including 2 STECF members and 2 JRC experts
with two observers.
The objective of the EWG 17-15 was to carry out demersal stock assessments defined in the ToRs. STECF acknowledges that like the previous Mediterranean assessment meeting (STECF-
17-09) EWG17-15 had two additional days to answer the ToRs. STECF notes that this additional time was of considerable help, allowing a completion of the assessments and a full
review of the work and agreement on conclusions during the meeting.
STECF comments
STECF considers that the EWG addressed thoroughly all ToRs. STECF notes that the EWG
carefully reviewed the quality of the assessments produced. Some analyses were considered to
be suitable for short term forecasts, others were only considered sufficiently reliable to estimate F-status, and no forecast was produced.
For several assessments in GSAs 20, 22 and 23 it was not possible to conclude stock status or provide advice. This is considered to be partly because of the absence of Greek demersal
survey indices for several years. This situation is only likely to improve if the surveys are carried out every year in the future.
A total of 19 area/species combinations were evaluated (Tables 4.1.1 and 4.1.2). The EWG has carried out short term forecasts out of seven age-based or surplus production analytical
assessments. Catch advice for two stocks was based on biomass index methods. For ten stocks
no catch advice has been provided, however, of these five have an indication of stock status in terms of fishing mortality relative to MSY. The main results are summarised in bullets below.
Statements on catch changes are in relation to reaching Fmsy in 2019:
Hake in GSA 17-18 is declining and is being overfished. Catches should be reduced by a
half as a minimum to reach FMSY in 2019..
Red mullet in GSA 17-18 has increased rapidly over the last few years. Fishing mortality
is uncertain but probably below MSY in the last two years. Catches should be increased
by no more than 25% in 2019.
Norway lobster in GSA 17-18 is at a low level with biomass close to Blim, F is at 2.3 time
MSY. Catches should be reduced by around 60%
Common Pandora in GSA 17-18 has been increasing over the last five years, fishing
mortality is uncertain. Catches should be decreased by 4%
Deep-water rose shrimp in GSA 17-18-19 is increasing and is being exploited at 2 times
MSY. Catches should be reduced by around 10%
7
Thornback ray in GSA 17 is depleted, fishing mortality is uncertain but high catches
should be reduced.
Common cuttlefish in GSA 17-18 is likely to be exploited above MSY, but catches are
uncertain and no catch advice can be provided.
Sole in GSA 17 is increasing but is overfished. Catches should be reduced by at a half
as a minimum to reach FMSY in 2019
Spottail mantis shrimp in GSA 17-18 has been increasing over recent years, F is at 2
times MSY. Catches should be reduced by around 10%.
Hake in GSA 19 is declining and fishing mortality is estimated several times above
Fmsy. Catches should be reduced by around 80%
Hake in GSA 20 data is sparse due to missing DCF data and uncertain, assessments
give conflicting results, no catch advice is provided.
Red mullet in GSA 19 has been increasing over recent years, F has been decreasing and
is at 1.6 times MSY. There is considerable uncertainty in reported catches from different
sources, but survey data indicate a required reduction of these of around 10%.
Red mullet in GSA 20 data is sparse, due to missing DCF data, and uncertain,
assessments give conflicting results, no catch advice is provided.
Hake in GSA 22 data is sparse, due to missing DCF data and uncertain; the stock is
considered to be increasing and exploited close to MSY. No catch advice is provided.
Red mullet in GSA 22 data is sparse, due to missing DCF data, and uncertain; the stock
is considered to be increasing and under exploited. No catch advice is provided.
Deep-water rose shrimp in GSA 22 data is sparse, due to missing DCF data, and
uncertain; the stock status is unknown. No catch advice is provided.
Hake in GSA 23 data is sparse, due to missing DCF data, and uncertain, the stock is
considered to be declining and over exploited. No catch advice can be given.
Red mullet GSA 23 data is sparse, due to missing DCF data, and uncertain;
assessments give conflicting results. No catch advice is provided.
Deep-water rose shrimp in GSA 22 data is sparse due to missing DCF data and
uncertain, assessments give conflicting results, no advice is provided.
STECF noted the difficulties encountered by the EWG in selecting a single assessment for both hake in GSA 17&18 and sole in GSA17 due marked differences particularly in biomass resulting
from different modelling approaches (SS3 vs a4a) and from shape of the selection curve (dome-shaped vs. logistic). STECF agrees with the conclusion that both stocks were being
overfished, however, accepts that it is not possible select a single assessment based on the information provided in the EWG report (Section 5.1 and Section 5.8). STECF considers that
more work is required to identify and confirm a single agreed assessment for each of these
stocks. Tables 4.1.2 and 4.1.3 contain the conclusions, in terms of F in 2016 and changes in catch for 2018, that STECF draws from the analyses completed for both these stocks.
Regarding hake in GSA 17&18, STECF is concerned that the growth rates and selection that fit best in the SS3 model gives SSB constituted almost exclusively of old animals, with around
90% of SSB at ages greater than those that contribute to the fishery. Further exploration of both growth and selection is required to establish what is driving these aspects which are not
seen to the same extent in the combined fleet model (a4a). However, based on results of both models STECF is able to conclude that F is high, greater than FMSY and that catches need to be
reduced by a half as a minimum to achieve FMSY in 2019. STECF is not able to advise on the
current state of biomass for this stock.
8
For sole in GSA 17 similar issues exist, though differences are less extreme in terms of SSB, and there is less uncertainty on growth parameters. An extensive further evaluation was
carried out after the EWG, concluding that results depend strongly on the choice of selection
for the fishery, and even more on the choice of selection curve for the beam trawl survey. When strong dome shaped selectivity is used substantial biomass, coming from ages and areas
outside the survey and fishery is estimated by the model, similar to the case of hake. Further exploration is required to determine why strongly domed selection is better fitted by the SS3
model, whereas evaluation of mortality signals in the survey does not support selection in this form. At present STECF is able to conclude that for sole in GSA 17, F is greater than FMSY, and
catches need to be reduced by a half as a minimum to achieve FMSY in 2019.. STECF also advises that SSB has been increasing over the last three years, although the historical levels of
biomass remain uncertain. STECF has discussed the various hypotheses and evidences underpinning the various models, and notes that this might be further analysed by STECF 18-
16. Although no unanimous conclusion could be reached by the committee, it is suggested that
unless new conclusions are reached by EWG 18-16, the intermediate SS3 model (SS3 Run7 section 6.8.3) with intermediate levels of cryptic biomass (around 15% of adult biomass not
accessible to the fishery) is used as the main basis for MAP analyses in STECF 18-17. This run is more conservative than the run with dome-shaped selection.
STECF notes that the EWG has estimated and provided values of FMSY and MSY ranges for five stocks (Table 4.1.3). The values of Flow and FMSY are regarded as reasonable estimates that can
be expected to be precautionary and thus may be used directly. The values for Fupper are indicative only; they have not been evaluated as precautionary and should not be used as such
without further evaluation.
STECF notes that data quality deficiencies and recommendations for further research studies and data collection have been comprehensively addressed by the EWG for each stock in
section 7 of the report, as well as summarized in stock summaries.
In response to ToR 10, STECF notes that the EWG has provided maps of persistence of several
species and life stages, based on MEDITS trawl survey data: Hake (juveniles and adults); Red Mullet (adults and spawners); Deep-water rose shrimp (juveniles and adults). Juveniles as
here defined by maturation state not fish size. The distribution of adults relates to the distribution at the time of the year when the MEDITS survey is carried out. For red mullet this
may also be suitable as a spawning area as it is possible to identify spawners at the time of
the survey. Data is unsuitable to draw distribution of persistence of juvenile red mullet.
The maps can be used to inform selection of suitable areas to protect juveniles or adults. The
information produced by the EWG provides the underlying information to allow the selection of areas with high persistence of adults or juveniles. If it is intended to define areas for use as a
part of spatial management, such as closed areas, a further step involving the definition of explicit boundaries is required. This step would apply GIS (Geographical Information System)
methodologies on the information supplied here to define adequate areas. As a final step managers will be required to make decisions on the proportion of the area of persistence to be
closed for fishing.
STECF conclusions
STECF concludes that the EWG addressed all ToRs appropriately. STECF notes that the EWG applied assessment methodologies that allowed estimation of uncertainty and conditioning of
operating models to be used in future fishery management evaluations (MSEs).
STECF endorses the assessments and evaluation of stock status produced by the EWG.
STECF endorses the short term forecasts produced by the EWG. In the cases of hake in GSA 17&18 and sole in GSA 17, where conflicting results were produced by different assessment

9
methods, STECF concludes that as precautionary measure catches should be reduced by a half as a minimum to achieve FMSY in 2019.
STECF notes that the EWG was not able to assess stock status or provide advice for several
assessments in GSAs 20, 22 and 23, partly because of the absence of usable time-series of demersal survey indices. Over the last decade, surveys were performed only in 2008, 2014
and 2016. Improving the quality of the stock assessments require the surveys to be carried out every year in the future.
10
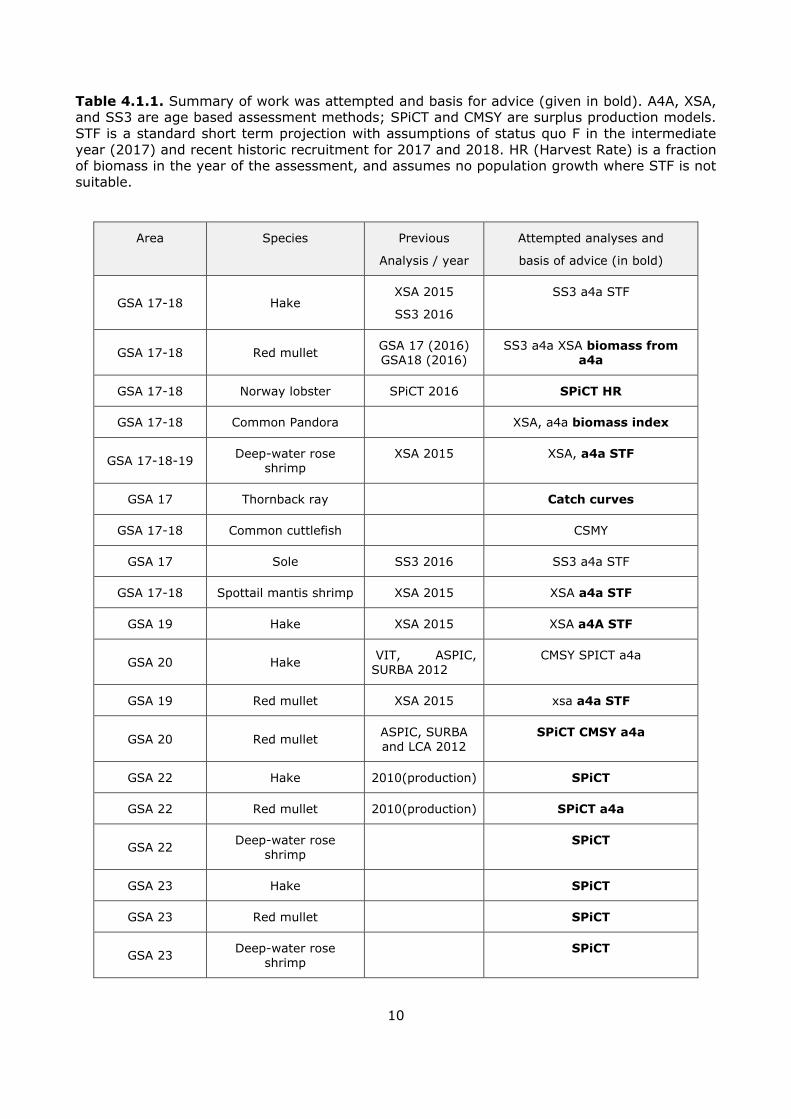
Table 4.1.1. Summary of work was attempted and basis for advice (given in bold). A4A, XSA, and SS3 are age based assessment methods; SPiCT and CMSY are surplus production models.
STF is a standard short term projection with assumptions of status quo F in the intermediate
year (2017) and recent historic recruitment for 2017 and 2018. HR (Harvest Rate) is a fraction of biomass in the year of the assessment, and assumes no population growth where STF is not
suitable.
Area Species Previous
Analysis / year
Attempted analyses and
basis of advice (in bold)
GSA 17-18 Hake XSA 2015
SS3 2016
SS3 a4a STF
GSA 17-18 Red mullet GSA 17 (2016) GSA18 (2016)
SS3 a4a XSA biomass from a4a
GSA 17-18 Norway lobster SPiCT 2016 SPiCT HR
GSA 17-18 Common Pandora XSA, a4a biomass index
GSA 17-18-19 Deep-water rose
shrimp XSA 2015 XSA, a4a STF
GSA 17 Thornback ray Catch curves
GSA 17-18 Common cuttlefish CSMY
GSA 17 Sole SS3 2016 SS3 a4a STF
GSA 17-18 Spottail mantis shrimp XSA 2015 XSA a4a STF
GSA 19 Hake XSA 2015 XSA a4A STF
GSA 20 Hake VIT, ASPIC,
SURBA 2012
CMSY SPICT a4a
GSA 19 Red mullet XSA 2015 xsa a4a STF
GSA 20 Red mullet ASPIC, SURBA and LCA 2012
SPiCT CMSY a4a
GSA 22 Hake 2010(production) SPiCT
GSA 22 Red mullet 2010(production) SPiCT a4a
GSA 22 Deep-water rose
shrimp SPiCT
GSA 23 Hake SPiCT
GSA 23 Red mullet SPiCT
GSA 23 Deep-water rose
shrimp SPiCT

11
Table 4.1.2. Summary of advice from EWG 17-15 by area and species. F 2016 is terminal F in
the assessment. Change in F is the difference as % change between targeted F in 2018 (Fmsy)
and the estimated F in 2016. Change in catch is % change from catch estimated 2016 to projected catch 2018. Biomass status is given relative to BMSY where available, (only in
Nephrops GSA 17-18) and as an indication of trend over the last 3 years for stocks with time series analytical assessments or biomass indices. (L indicated landing only, not catch).
Area Species Method/ basis
F 2016 F 2018
Change in F
Catch 2016
Catch 2018
Change in catch
Biomass
(status)
GSA 17-18
Hake SS3/a4a >FMSY 0.19
<-50% 5200 <2600
<50% Declining
GSA 17-
18
Red mullet A4a biomass
index 6188 7706 25% Increasing
GSA
17-18
Norway
lobster
SPiCT
STF 0.49 0.21 -57% 1022 441 -57% 0.33 BMSY
GSA 17-18
Common pandora
biomass index 232 222 -4% Increasing
GSA 17-18-
19
Deep-water rose
shrimp
a4a STF
1.44 0.70 -51% 3559 3225 -9%
Increasing
GSA 17
Thornback ray
Level
advice Reduce
catch
Depleted
GSA 17-18
Common cuttlefish
CMSY
above FMSY No
advice
GSA 17
Sole SS3/a4a
F>FMSY 0.25 <-37% 2100 <1050 <-50% Increasing
GSA 17-
18
Spottail mantis
shrimp
a4a STF
0.65 0.38 -42% 4360 4028 -8% Increasing
GSA 19
Hake a4a STF
1.42 0.16 -89% 802 178 -78% Declining
GSA
20 Hake
SPiCT CMSY
a4a
Conflicting
results
No
advice

12
GSA 19
Red mullet a4a STF
0.56 0.36 -36% 257 253 -2% Increasing
GSA 20
Red mullet
SPiCT CMSY
a4a
Conflicting
results
no
advice
GSA
22 Hake
SPiCT Close to
MSY
no
advice
Increasing
GSA 22
Red mullet SPiCT
a4a
Under
exploited
no
advice
Increasing
GSA 22
Deep-water rose
shrimp
SPiCT No
conclusion
no
advice
GSA
23 Hake
SPiCT Over
exploited
no
advice
Declining
GSA 23
Red mullet SPiCT No
conclusion
no
advice
GSA 23
Deep-water rose
shrimp
Not
possible
No
conclusion
no
advice
Table 4.1.3. FMSY ranges (Flow and Fupp) for demersal stocks from the Mediterranean. The values for Fupp are indicative only they have not been evaluated as precautionary and should
not be used as such without further evaluation.
GSA Species Fcurr F MSY Flow Fupp
Fcurr/
FMSY
GSA 17-18 Norway lobster 0.49 0.21 0.14 0.29 2.33
GSA 17-18-19 Deep-water rose shrimp 1.44 0.7 0.47 0.95 2.06
GSA 17-18 Spottail mantis shrimp 0.65 0.38 0.25 0.52 1.71
GSA 19 Hake 1.42 0.16 0.11 0.22 8.88
GSA 19 Red mullet 0.56 0.36 0.24 0.49 1.56
13
4.2 EWG 17-16 (Transition) Economic report fish processing 2017
Request to the STECF
STECF is requested to review the report of the STECF Expert Working Group meetings, evaluate the findings and make any appropriate comments and recommendations.
STECF observations
The Expert Working Group, STECF EWG 17-16, on the Economic report of the EU fish
processing sector 2017, was convened in Ispra, Italy 15-19 January 2018.
STECF reviewed the report and notes that the EWG adequately addressed all the ToRs. In addition the EWG provided a very well developed section on trends and drivers of changes in
economic indicators and an outlook of the future of the fish processing industry. STECF observes that EWG 17-16 was able also to answer a specific request arrived from DG-MARE
during the meeting about the effects of the structural funds on the fish processing sector.
Considering the time limit and the lack of preparation for this request, experts were only able to carry out a limited analysis of data provided.
The report is the sixth report of its kind and provides a comprehensive overview of the latest
information available on the structure, social, economic and competitive performance of the fish processing industry at the national and EU levels.
The results of the 2017 EU fish processing sector analysis shows that in 2015 the sector
consisted of around 3,600 enterprises (with fish processing as main activity), of which 57% were micro-enterprises with less than 10 employees. The sector employs around 124 thousand
persons of which 45% are female. Most of the EU employment is to be found in enterprises with less than 10 employees (55%) and only 14% of it in companies with more than 50
employees. In 2015 the sector produced a total income of €30.3 billion. In general 2015 data
show a deterioration of the economic performance if compared to 2014 (e.g. GVA and net
profit were respectively 14% and 21% lower than in 2014) even if the sector still remain profitable.
STECF observes that landings of European vessels cover only approximately 40% of the total
raw material requirements of the EU fish processing industry (according to external data or expertise for some MS available in the EWG), The EU fish processing industry is therefore still
influenced by the developments in the global fish markets. Whether the dependency will be reduced as more stocks in European waters are fished at MSY level remains to be seen. Latest
information on the EU aquaculture production seems to indicate that there will be a growing supply from this sector (e.g. see Danish national chapter).
STECF observes that several Member States especially around the Eastern Baltic Sea were and
are still negatively affected by the Russian embargo, being affected by a substantial reduction in exports to Russia.
STECF observes that the data coverage and quality continues to improve compared to the
previous reports, as all MS who were legally obliged to deliver data have now done so and the EWG was able to produce a national chapter for all those countries. There were though missing
14
data for some years for some countries, e.g. Greece, delivering only data from 2011 to 2015, Romania, not delivering 2008 data and Netherlands, not delivering data for 2015 because for
this year data were not collated, as stated in their National Programme (2017-2019).
STECF observes that the coverage section highlights some missing data in relation to the collection and delivering of data disaggregated by size categories (employment classes). The
data collection of disaggregated data is not mandatory but, according to the last data call, in
case a MS included a data collection for disaggregated data in the national plan there is an obligation to deliver them. The TORs for the EWG did not include an assessment of the
coverage of the data by MS and, therefore, the EWG has not checked the coverage issues arising from the coverage report drafted by JRC and included in the report.
The EWG was requested to produce a “Special Chapter for the Comparison of the data and
indicators of the DCF and Eurostat’s Structural Business Statistics (SBS)”. The aim was to understand whether a future STECF fish processing report could be based on Eurostat data as
a main source (complemented by DCF data), considering that under EUMAP data collection for the fish processing sector is no longer mandatory and MS may probably skip the data
collection on the fish processing industry under their Work Plans (WP).
The EWG checked the planned data collection at MS level under the new data collection
Programme (2017-2019). All the MS WP were downloaded from https://datacollection.jrc.ec.europa.eu/wp-np-ar and a template prepared by experts was used
to facilitate this check. STECF observes that the future data collection appears not to change
so much: on 27 MS presenting a WP, 21 have included a data collection for the fish processing sector; of these 21 MS only 6 are going to use exclusively Eurostat SBS data. It is also worth
noting that there will be a full comparability of future data (collected in 2017-2019) to past data (provided with the last data call) for most MS (16 countries of the 21).
STECF observes that the results of the SECFISH (MARE/2016/22 "Strengthening regional
cooperation in the area of fisheries data collection") project as well as the national pilot studies on the possibilities to collect data on raw material will be likely available in advance of the next
fish processing report.
STECF conclusions
STECF concludes that the Report on the Economic performance of the fish processing industry
can be continued in the present form in the future. The performed analysis highlights that for
most MS DCF data will not have Eurostat SBS data as main source and very negligible changes are foreseen under the WP.
STECF notes that one additional analysis was requested during the working group, which could
thus not be completely addressed. STECF underlines the importance of the early planning of the ToRs ahead of the meeting, in order to give the chair and experts the time to adequately
prepare the analysis.
The EWG was not requested to carry out an extensive check on coverage of data and concludes that this should be again part of the TOR for the next fish processing report. This
would assist DG Mare in assessing the non-delivery of data, which may have legal implications (e.g. in case a MS proposed to collect data in the WP and not delivered).
STECF suggests that the main findings of the SECFISH project as well as of the national pilot
project on the collection of raw material are considered in the next reporting period.
15
4.3 EWG 18-01 Data gaps and Biomass Escapement Strategy for
Adriatic anchovy and sardine
Request to the STECF
STECF is requested to review the report of the STECF Expert Working Group meeting, evaluate
the findings and make any appropriate comments and recommendations.
STECF comments
EWG 18-01 was asked to develop and assess a biomass escapement harvest control rule
(HCR) for anchovy and sardine in the Adriatic Sea (GSA 17-18) that would ensure a low probability of SSB to fall below Blim. STECF reviewed the report of EWG 18-01 and notes that
the EWG adequately addressed the ToRs. STECF acknowledges the extensive work undertaken
by the working group.
STECF notes that information for the Adriatic eco-surveys on sampling design, sampling errors
and abundance estimates uncertainty, was not available to the EWG. Consequently, only limited quantitative analysis could be carried out during the working group to assess the
potential use of the current acoustic survey as a basis for a biomass escapement strategy HCR and to propose alternative settings. STECF notes that the conclusions on that term of reference
(ToR 1.2) are thus mainly based on expert knowledge. STECF agrees with those conclusions but notes however that it would have been useful to quantify the impact of alternative survey
settings (number of surveys, seasons) on the catch advice based on a biomass escapement
strategy, and that such analysis could be further developed once the information needed is made available.
To address ToR 1.3, EWG 18-01 opted for a stepwise approach by first selecting from a grid of potential HCR parameters (biomass escapement, Besc; fishing mortality cap, Fcap), those
which were delivering the objectives of low risk of falling below Blim ( P[SSB< Blim] < 0.05 across all operational models and secondly running management scenarios and robustness test
using those selected parameters. STECF agrees with this stepwise approach which allows focusing the analysis on the “area of interest” and limit as much as possible the number of
simulations to be conducted and interpreted.
STECF notes that the stock dynamics modelled in the simulations are somewhat optimistic due to the use of stock-recruitment models based on average recruitment, segmented regressions
and geometric means. These models don’t capture the linear relationship between SSB and recruitment observed in the data, which shows a decreasing trend in recruitment in the recent
years. To mitigate this effect the EWG chose the most conservative combinations of Besc and Fcap parameters as candidates to parametrize the HCR.
With relation to the analysis of long term effects, carried out without considering stock assessment uncertainty, STECF notes that large biomass escapement levels lead to more
frequent closures of the fishery or provide very small catches. Conversely, small biomass
escapement levels need to be complemented with low fishing mortality caps to avoid large inter-annual fluctuations in catches and exploitation levels.
STECF notes however that assessment uncertainty leads to a strong degradation of the performance of the harvest control rules for both stocks, with an increasing risk of SSB falling
below Blim. In the case of anchovy this risk becomes about 20% to 30%, while for sardine 5% to 10%.
16
To evaluate short term effects, the EWG tested the requested set of catch options during the intermediate period of 2017-2020. Using real reported catches for 2017, assuming status quo
catches in 2018 and catch reductions of 5-10-20% per year in 2019 and 2020. STECF notes
that the proposed levels of catch reductions led to the collapse of the stock of anchovy. STECF notes that these results are associated with the very poor status of the anchovy stock in the
Adriatic (STECF EWG 17-09), and considers that additional measures are needed in the short-term to reduce catches and increase biomass above Blim.
For ToR 2 (economic analyses), STECF notes that, because of the limited time available, EWG 18-01 used an approach based on short-term projections. This approach was used for the AER
short-term projections (STECF 2017b) through BEMEF (extension of the EIAA models). EWG 18-01 explored alternative functions to compute variable costs to the inverse of the Cobb-
Douglas function (in order to link the estimated catches and biomass resulting from the HCR with corresponding fishing activity) as well as an alternative approach based on the existence
of a correlation between fuel consumption per kilo of landings and the ratio between total
catches and fishing mortality. The low number of observations for Croatian purse-seiners (only 4 years) did not allow the EWG to conclude with the parameters’ estimation for that fleet.
STECF suggests that further work should be done on the socio-economic sustainability of the fishery, exploring e.g. the use of the minimum break-even revenue to set the minimum
catches required from the HCRs and/or the maximum level of risk required to make these fisheries profitable. STECF also suggests that such analysis would also need to take into
account the effects of a change in the level of catches on the canning industry and tuna farms, since a significant part of the catches are allocated to these industries.
Finally, STECF recalls the comments made by PLEN 17-01 (in ToR 4.2) that, "a common
database with stock assessment results and DCF data will be a relevant development on bio-economic modelling, given the time require to collate all the data coming from different
sources. Development of calibration methods based on an integrated database gathering main data needed for bio-economic parametrisation would improve the ability to perform impact
assessments in a short interval". The development of such calibration methods would improve the ability of experts to perform impact assessments more quickly, such that they could be
done effectively within a short EWG.
STECF conclusions
STECF endorses the general conclusions and recommendations from the EWG:
STECF considers that the current acoustic survey settings could potentially be used to
set fishing opportunities based on a biomass escapement strategy. Furthermore, providing the survey index to the assessment EWG, in the same year the survey is
carried out, would allow a more precise application of the escapement strategy by removing the need to project the intermediate year. Having several surveys would also
provide better estimates of recruitment for each stock (in the beginning of the year for anchovy and second half of the year for sardine), and better indications of spawning
stock biomass, (in the summer for anchovy and winter for sardine).
Under the condition of perfect knowledge of the stock dynamics (no error in the stock
assessment results), the selected combinations of values of biomass escapement and fishing mortality caps generally fulfil the condition of a low probability of SSB to fall
below Blim. However, the inclusion of stock assessment uncertainty leads to a very strong increase in the risk. STECF thus consider that the framework developed during
the EWG and the results of the simulations can serve as a basis for further discussion. However, the implementation of an HCR would need to be more conservative than the
results presented here in order to account for assessment uncertainty.

17
In the long term, large biomass escapements lead to more closure of the fishery or provide very small catches, while small biomass escapements need to be
complemented with low fishing mortality caps to avoid large fluctuations in catches and
exploitation levels.
The short-term simulations led to stock collapse for anchovy for any level of catch reductions. This result is the consequence of the current very poor status of the
anchovy and STECF considers that for that stock, additional measures are needed in the short-term to reduce catches and increase biomass above Blim.
The analysis carried out by EWG 18-01 showed that there is a high percentage of
monospecies catches in the fishing operations analysed for the fisheries for anchovy and sardine in the Adriatic Sea (GSA 17-18), suggesting that potential choke species
effects should be limited.
Economic analysis of the different scenarios and HCRs was attempted but the short
time series of available economic data for some fleets did not allow a full analysis of management options. STECF suggests exploring alternative options of e.g. aggregating
national fleets segments into broader regional groups, which may allow performing further bio-economic impacts assessments of the management measures in the short-
and medium-term.
18
4.4 EWG 18-02 Technical Measures – Improving selectivity to reduce
the risk of choke species
Background provided by the Commission
The North Western Waters Advisory Council (NWWAC) has developed a Choke Mitigation tool
(CMT) which provides a means for the identification of choke situations for key stocks. It is designed to help assess what tools – improvements in selectivity; avoidance; quota
flexibilities; and exemptions included in Article 15 of the CFP - are appropriate for individual stocks/fisheries to mitigate choke situations. It also provides a qualitative assessment of how
and to what extent the available tools can reduce the deficit between catch and fishing opportunities.
Two expert workshops have been convened by the NWWAC and the NWW Regional group to
work through the different stocks in the Celtic Sea, West of Scotland, the Irish Sea and Channel using the CMT. The threat of choking fisheries has been assessed for each of these
stocks/fisheries and sea basins. The aim was to use this analysis to identify residual choke issues that can only be addressed at Union level with alternative measures over and above the
existing tools available.
Each of the stocks assessed was classified depending on the extent of the problem as follows:
“High risk” – catches are well in excess of current fishing opportunities and even with all the available mitigation tools applied there is a high risk of choke for multiple
Member States.
“Moderate risk” – catches are in excess of fishing opportunities for one or more Member States and the risk of choke is significant for these Member States but
mitigation tools potentially can solve the problem. “Low or no apparent risk” – catches are in line with fishing opportunities and the
risk of choke is low or there is no apparent risk with the mitigation tools available.
The choke mitigation tool has proven to be an extremely useful tool for carrying out this
evaluation, but the analysis carried out was meant as illustrative and to identify stocks where chokes may be an issue and to identify what tools maybe applicable to mitigate choke
situations. The analysis has identified 12 stocks where there is a high risk of residual choke
issues. For 6 of these stocks – whiting VIIb-k; sole and plaice VIIf,g; whiting VI, cod VIIa; plaice VIId,e - the available measures and tools will significantly reduce the choke risk
provide they are used appropriately. For the other 6 stocks – haddock VIIb-k, skates and rays VI and VII, cod VIa, saithe VI, whiting VIIa and skates and rays VIId,e -
additional measures or a different management approach is likely to be required to prevent multiple fisheries from being choked. The analysis has identified a further 13 stocks where
there is a moderate risk of residual choke issues for one or more Member States. The available tools and measures can significantly reduce this risk for these species.
In the case of the 12 high risk stocks, improving selectivity has been identified in 9 of these
stocks as one of the main mitigation actions to reduce the risk of fisheries being choked. In addition improving selectivity was seen as an important mitigation action for a further 5 stocks
of the 13 identified as having a moderate risk. However, as the CMT is largely qualitative rather than quantitative analysis the extent to which selectivity and in which fisheries was not
fully identified.

19
Request for EWG-18-02
In order to address this and in particular confirm that the high risk stocks identified have
residual choke issues that will require additional measures to solve, a further analysis is
required. This analysis should identify the fisheries in which the high risk stocks are caught and in which of these fisheries improving selectivity is appropriate on the basis that discard rates
are high. The analysis should also identify the selectivity tools available to improve selectivity and assess the knock-on effects of utilising these tools in the fisheries identified. Therefore for
the stocks listed. STECF is requested to:
1. Describe the main fisheries in which the high risk stocks identified are caught and identify whether catches are from a targeted fishery or as a bycatch. For these fisheries identify
the catches of the relevant stock and the main gear types used.
2. Assess in which of these fisheries improving selectivity may be possible.
3. Identify in these fisheries what selectivity devices and gear modifications are available that
could improve selectivity.
4. Assess the likely reductions in unwanted catches of the relevant stock that might
reasonably be achieved based on the results of past trials carried out with these selectivity devices and gear modifications,
5. Assess the likely economic impacts resulting from such changes in selectivity on the basis of losses of marketable catches of the stock or reductions in the marketable catches of
other species contrasted with the economic impacts of a choke situation.
The High risk stocks are:
Haddock VIIb-k Whiting VIIb-k
Sole VIIf,g Plaice VIIf,g
Cod VIa Whiting VIa
Cod VIIa Whiting VIIa
Plaice VIId,e
The moderate risk stocks are:
Hake VI and VII Cod VIIb-k
Haddock VIa Haddock VIb
Haddock VIIa
Request to the STECF
STECF is requested to review the report of the STECF Expert Working Group meeting, evaluate the findings and make any appropriate comments and recommendations.
STECF Observations
STECF acknowledges the work undertaken by the EWG chair and experts to produce the report of EWG 18-02, Technical Measures. EWG-18-02 identified fisheries (gear, target species and
20
area combination) in which there is a high risk of choke problems that will persist unless additional tools or measures, over and above what is contained in the CFP and supporting
legislation, are applied. As detailed below, STECF notes that there are a large number of cases
of high risk stocks,, and a fully detailed assessment of each ToR for each stock and fishery could not be performed within one week. The EWG provides therefore a very good overview
about the issues, sources of information, data and models available and represents a very useful preliminary assessment of the likely impacts of the alternative scenarios on fishing
businesses. STECF notes however that a more detailed case-by-case assessment may be further required in order to inform decisions about policy or regulatory steps that could be
taken to avoid choke situations.
STECF observes that high risk stocks (high risk of causing a choke situation) identified are
caught either as target species or as a bycatch. For fisheries involving high risk stocks, the catches of the relevant stock and the main gear types used are provided. TOR 1, Description
of the main fisheries, is fully addressed in section 3 of the EWG 18-02 report.
STECF observes that TOR 2, Assessing Fisheries for which Selectivity may be Improved, is addressed in section 4 of the EWG 18-02 report, where these fisheries (stock
groups) are listed in a table at page 42. The fisheries were identified as having high discards quantity and also high discard rates thus vessels involved would benefit most from selectivity
improvements. The majority of these fisheries involve vessels using TR2 or BT2 gear, with codend mesh sizes of less than 100 mm. There are also several TR1 fisheries with high level of
discards and high discard rates.
The EWG identified available selectivity devices and gear modifications (TOR 3, section 5) that
could be used when fishing for or trying to select out these high risk stock groups. STECF
observes that, given the wide range of selective gear options that have been tested for different fisheries, and the time available to the EWG, it was not possible for EWG 18-02 to
fully assess the effect of all the potential gear modifications on unwanted catches of the relevant stocks. STECF notes that, as ICES and STECF do not routinely report catches-at-
length for the relevant stocks, the evaluation of the relative impact of different selectivity changes on catches-at-length is limited. Therefore, in TOR 4, Likely reductions in
unwanted catches (section 6), EWG 18-02 explored the potential effect on catch profile using different selectivity improvements only for a limited range of roundfish species and sea
areas where these are considered as high risk of causing choke situations.
STECF observes that EWG 18-02 was not able to assess all the economic impacts (TOR 5, Likely Economic Impacts, section 7), namely loss of marketable catch, for all the fisheries,
due to the complexity of the issue and time constraints. The report provides two case studies applying a Landing Obligation Impact Assessment Model, a fairly simple and limited Excel
model developed during the EWG meeting and applied to several sea areas, and the SEAFISH model (Mardle et al., 2017), a more comprehensive, bio-economic model developed for the UK
fleet. Both models were developed to provide information on possible choke stocks and effects on fleets.
STECF observes that the simple Excel model created during the meeting was applied to
fisheries in areas VIIbk, VIIfg, VIIde, VIIa and VI and includes a limited number of stocks. Analysis shows that MS fleets would be affected differently. In some cases, vessels would
reach a choke situation even if they had implemented mitigation measures and subsequently would forego a substantial amount of catch of other stocks. In other cases, after adopting
mitigation measures, and given the assumptions made, vessels would be able to avoid choke situations and land a higher quantity of fish after applying the mitigation measures. The
impacts are analysed for stocks listed in the EWG ToRs and for which data were made specifically available for the meeting, and a large number of species are missing.
STECF notes that the SEAFISH model was used to provide information on choke effects and
possible impacts of new technical measures for three UK fleets. The EWG report provides results for UK Northern Irish Nephrops fleet fishing in area 7 and Scottish Nephrops trawl and

21
Demersal trawl fleets fishing in West of Scotland (ICES Area 6a). The SEAFISH model estimates at which point stocks might choke the fleet under different modelled scenarios with
and without additional selectivity measures. It was also possible to show how changes in quota
allocations to the fleets may reduce the choke effects. The UK analysis shows that changes of selectivity in combination with the quota management can help UK fleets to delay the choke
point or reduce the level of foregone catch before choke occurs. However the selectivity improvements tested do not fully eliminate the problem of choke and its economic
implications. The extent to which gear selectivity can help to mitigate against the risk of choke varies according to the fleet and the stocks.
Fleet Model outputs
Northern Irish Nephrops trawl
fleet in area 7
Fleet chokes on whiting 7a in 2019. Selectivity adjustment can
improve situation for all scenarios (compared to initial scenario), effect is limited, choke risk remains without extra quota for the fleet.
Scottish Nephrops trawl fleet in area 6
Zero TAC stocks (cod and whiting) are choke stocks area 6. Use of 80mm + 160mm square mesh panel, in combination with quota
movement, allows fleet to increase effort until choke point from 9% of 2016 days at sea in B4 to 50% of 2016 days at sea in both quota trade scenarios.
Scottish demersal trawl fleet in area 6
Effort of the fleet was mostly in North Sea, but 23% annual effort was in area 6, using TR1 and TR2. Selectivity improvements and quota
management delays choke point until 54% of 2016 actual days at sea.
STECF conclusions
STECF concludes that the EWG 18-02 report identifies some key stocks with high risk of
causing choke situations and some gear selectivity improvements that could reduce the risk of
choke situations occurring at all, or could potentially delay choke situations to a point later in year, in the Celtic Sea, West of Scotland, the Irish Sea and Channel. Delaying a choke
situation until later in the year could allow enough revenues and operating profit to enable a vessel business to continue to operate as solutions are found to avoid choke situations
altogether.
STECF concludes that the limited review of gear trials did identify some modifications that
might improve selectivity, with a view to avoiding choke situations. STECF concludes that there are also likely to be other trials, not included in the review, which have identified gear
modifications that could improve selectivity. STECF concludes that some of the gear
modifications listed in one sea area might also be relevant to other sea areas.
STECF concludes that further investigation is needed to assess the potential for gear
modifications to prevent or delay choke situations in the identified stocks/fisheries. In recent years there have been several trials to test the effects of modifying gear. While many of these
trials are limited in time and space, many have demonstrated the potential to change selectivity. Nevertheless, the trials have also highlighted how difficult it is to improve
selectivity without reducing marketable catch to the extent that fishing operations are not profitable. This difficulty exists particularly for trials testing larger codend mesh sizes, owing

22
to the discrepancy in the marketable size of different species caught simultaneously. STECF concludes nevertheless that large-mesh and/or square-mesh panels in the trawl body may
offer effective alternative or complementary solutions to avoid or delay choke situations under
the landing obligation (see Table 4.4.1 below).
STECF recognises that most trials consist of a relatively low number of hauls, and modified
trawl designs are tested only to a limited extent. STECF concludes that, until economic incentives motivate vessel operators to improve selectivity, the full potential to improve
selectivity cannot be determined. The intended consequence of the landing obligation is to motivate vessel operators to avoid unwanted catches, but the incentive will not arise unless
the regulation is adequately enforced. The ability to avoid choke by illegally discarding unwanted catches, could remove the need and the potential for gear-based selectivity
improvement. With effective enforcement of the landing obligation, vessel operators would begin to base decisions on their choice of gear on trade-offs between risk of choke, risk of
infringement and risk of less profitable or unprofitable fishing due to loss marketable catches.
There are examples of proactive vessel operators who are making positive progress to reducing unwanted catches through gear selectivity (and through other changes to fishing
practices) but the overall discard rates for fleets indicate that these individuals are in the minority.
STECF notes that the dissemination of gear trial results to fishermen is important and recent initiatives, including the gear trial factsheets of the H2020 Project DISCARDLESS
(www.discardless.eu/selectivity_manual) and the Gearing Up initiative (https://gearingup.eu), are increasing access to trial information for fishermen.
STECF concludes that the results from the simple excel model are of some interest but the
usefulness of some results is limited because the model does not use data on all fish stocks, is based on unrealistic assumptions and presents only partial economic impact assessment.
Some of the scenarios presented simply rely on the assumption that somehow the first choke stock has been resolved, and then go to show which stock would be the next to cause choke.
E.g. for demersal fish species in Area 6a, a scenario is presented that assumes that somehow, the choke on cod 6a has been resolved for all fleets. For most fleets tested, the mitigation of
choke situations resulting from selectivity improvements was relatively small.
STECF concludes that the SEAFISH model is a useful tool for assessing the likely choke stocks
and choke points based on assumptions of either status quo catch rates or improved selectivity
catch rates, combined with quota management measures. For the UK fleets shown, STECF concludes that gear selectivity improvements tested may delay but are unlikely to enable fleets
to avoid choke situations.
STECF concludes that, to assess economic effects of selective gear on choke mitigation, it is
not sufficient to just explore possible losses of marketable catch as a change in fishing practice would most likely mean change in costs and/or changes in other economic variables, e.g. fish
price. The application of more advanced analyses and bio-economic models, such as the SEAFISH model, but also including the long term effects of increased selectivity, would be
useful but would demand a lot more time and preparatory work.
STECF concludes that although improvements to gear selectivity can help delay choke points, gear adaptation is only one of several changes that fishing businesses may need to make in
order to fish legally and profitably under the landing obligation.
References
Mardle, S., Russell, J., Motova, A., 2017. Seafish Bio-economic Modelling: Methodology Report,
34 pp.
23
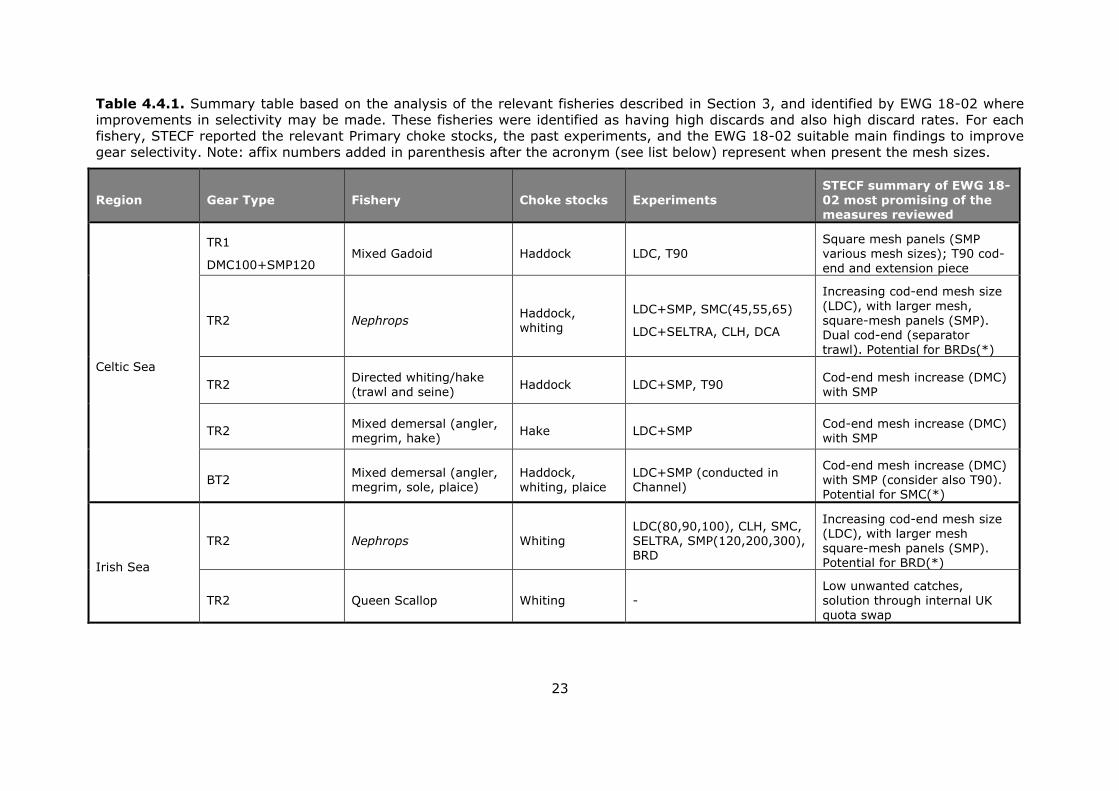
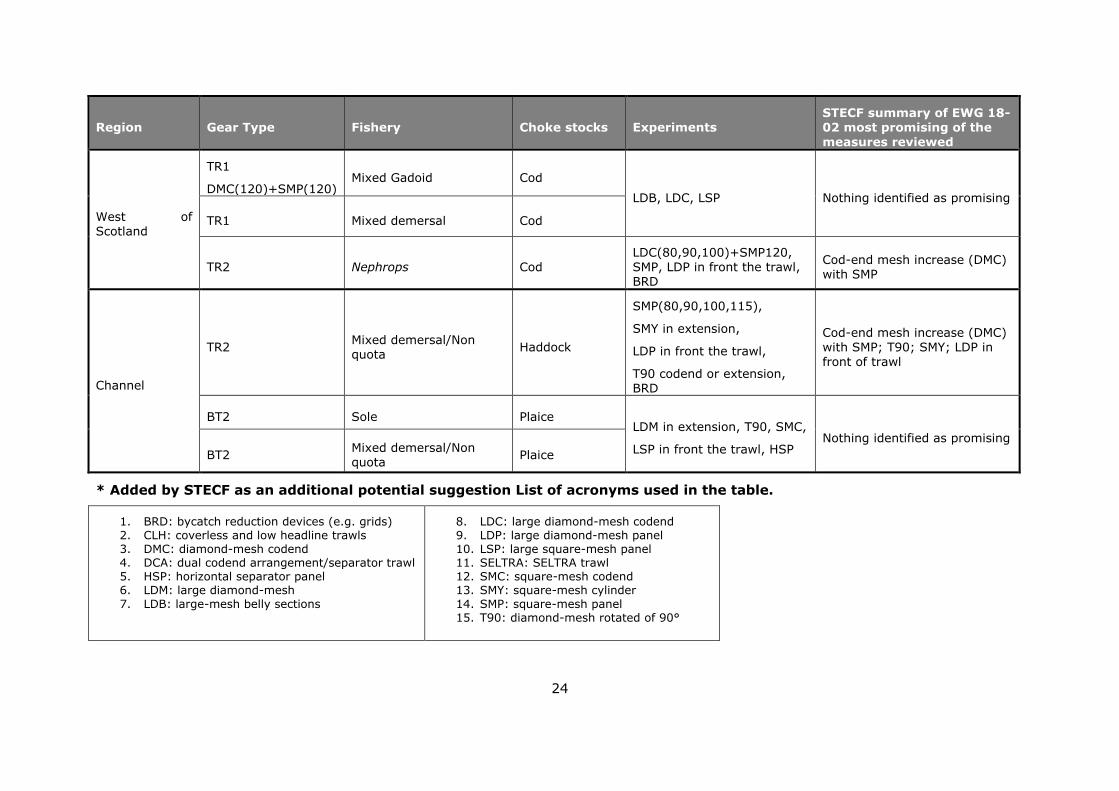
Table 4.4.1. Summary table based on the analysis of the relevant fisheries described in Section 3, and identified by EWG 18-02 where
improvements in selectivity may be made. These fisheries were identified as having high discards and also high discard rates. For each fishery, STECF reported the relevant Primary choke stocks, the past experiments, and the EWG 18-02 suitable main findings to improve
gear selectivity. Note: affix numbers added in parenthesis after the acronym (see list below) represent when present the mesh sizes.
Region Gear Type Fishery Choke stocks Experiments
STECF summary of EWG 18-
02 most promising of the measures reviewed
Celtic Sea
TR1
DMC100+SMP120 Mixed Gadoid Haddock LDC, T90
Square mesh panels (SMP various mesh sizes); T90 cod-
end and extension piece
TR2 Nephrops Haddock, whiting
LDC+SMP, SMC(45,55,65)
LDC+SELTRA, CLH, DCA
Increasing cod-end mesh size
(LDC), with larger mesh,
square-mesh panels (SMP). Dual cod-end (separator
trawl). Potential for BRDs(*)
TR2 Directed whiting/hake
(trawl and seine) Haddock LDC+SMP, T90
Cod-end mesh increase (DMC)
with SMP
TR2 Mixed demersal (angler, megrim, hake)
Hake LDC+SMP Cod-end mesh increase (DMC) with SMP
BT2 Mixed demersal (angler, megrim, sole, plaice)
Haddock, whiting, plaice
LDC+SMP (conducted in Channel)
Cod-end mesh increase (DMC) with SMP (consider also T90). Potential for SMC(*)
Irish Sea
TR2 Nephrops Whiting
LDC(80,90,100), CLH, SMC,
SELTRA, SMP(120,200,300), BRD
Increasing cod-end mesh size
(LDC), with larger mesh square-mesh panels (SMP).
Potential for BRD(*)
TR2 Queen Scallop Whiting -
Low unwanted catches,
solution through internal UK quota swap
24
Region Gear Type Fishery Choke stocks Experiments STECF summary of EWG 18-02 most promising of the
measures reviewed
West of Scotland
TR1
DMC(120)+SMP(120) Mixed Gadoid Cod
LDB, LDC, LSP Nothing identified as promising
TR1 Mixed demersal Cod
TR2 Nephrops Cod LDC(80,90,100)+SMP120, SMP, LDP in front the trawl, BRD
Cod-end mesh increase (DMC) with SMP
Channel
TR2 Mixed demersal/Non quota
Haddock
SMP(80,90,100,115),
SMY in extension,
LDP in front the trawl,
T90 codend or extension, BRD
Cod-end mesh increase (DMC) with SMP; T90; SMY; LDP in
front of trawl
BT2 Sole Plaice LDM in extension, T90, SMC,
LSP in front the trawl, HSP Nothing identified as promising
BT2 Mixed demersal/Non quota
Plaice
* Added by STECF as an additional potential suggestion List of acronyms used in the table.
1. BRD: bycatch reduction devices (e.g. grids) 2. CLH: coverless and low headline trawls 3. DMC: diamond-mesh codend 4. DCA: dual codend arrangement/separator trawl 5. HSP: horizontal separator panel 6. LDM: large diamond-mesh
7. LDB: large-mesh belly sections
8. LDC: large diamond-mesh codend 9. LDP: large diamond-mesh panel 10. LSP: large square-mesh panel 11. SELTRA: SELTRA trawl 12. SMC: square-mesh codend 13. SMY: square-mesh cylinder
14. SMP: square-mesh panel 15. T90: diamond-mesh rotated of 90°

25
5. ADDITIONAL REQUESTS SUBMITTED TO THE STECF PLENARY BY THE
COMMISSION
5.1 CFP monitoring
Background provided by the Commission
Article 50 of the Common Fisheries Policy (CFP; Regulation (EU) No 1380/2013 of the
European Parliament and of the Council of 11 December 2013) stipulates: “The Commission shall report annually to the European Parliament and to the Council on the
progress on achieving maximum sustainable yield and on the situation of fish stocks, as
early as possible following the adoption of the yearly Council Regulation fixing the fishing opportunities available in Union waters and, in certain non-Union waters, to Union
vessels.”
Request to the STECF
The STECF is requested to report on progress in achieving MSY objectives in line with the
Common Fisheries Policy.
STECF observations
STECF notes that to address the above Terms of Reference a JRC Expert Group (EG) was convened to compile available assessment outputs and conduct the extensive analysis.
The EG output was presented in a comprehensive report accompanied by several detailed annexes providing: 1) CFP monitoring protocols as agreed by STECF (STECF,
2017); 2a) R code for computing NE Atlantic indicators; 2b) R code for computing Mediterranean indicators and 3) ICES data quality issues corrected prior to the analysis.
The report and Annexes are available at https://stecf.jrc.ec.europa.eu/plen18_01
STECF notes that the report is clear and well laid out, transparently describing the
analysis undertaken, cataloguing changes made in approach since the previous report
(2017) and including URL links to the various reports and stock advice sheets underpinning the analysis. STECF commends the effort employed in updating
nomenclature following various changes to the ICES database and the careful attention paid to ensuring the correct figures were used.
The most significant changes in the 2018 approach were:
i) A revision of the Mediterranean sampling frame used for the analysis
ii) Where data were unavailable for the most recent year, the data from the previous year was rolled forward
iii) MSYBtrigger was used as a proxy for lower bound of BMSY
Details of these changes and other points to note can be found in section 2 of the EG
report.
The EG report then sets out results of the analysis for the ICES area of the NE Atlantic and Mediterranean & Black Sea separately in Sections 3 and 4 (respectively). Based on
these results STECF provides an overview of what is currently known regarding the

26
achievement of the MSY objectives, drawing together the results from the different sea
areas to provide a comparative picture. The overview focuses on a limited number of ‘core’ indicators earlier agreed by STECF (2017). The EG report contains results for a
number of ‘experimental’ indicators which STECF notes are still at the development stage. It is expected that these will be further developed as part of another STECF EWG
(EWG 18-15) to be held later in 2018 (see conclusions). In this report, “ICES Area” refers to all stocks in the FAO Area 27 in the Northeast Atlantic assessed by ICES, while
the denomination “NE Atlantic stocks” refers more specifically to the stocks distributed widely, including outside EU Waters
Trends towards the MSY objectives in the ICES area and Mediterranean& Black Seas
The overview below describes the trends observed in the ICES area and the Mediterranean for the periods 2003 to 2016 and 2003 to 2015 respectively and applies
to the stocks included in the reference list of stocks for these areas. The stocks are primarily those with a full analytical assessment (ICES Category 1).
Stock status in the ICES area
The indicators provided by the JRC EG show that stocks status has significantly improved
(Figure 5.1.1) but also that many stocks are still overexploited in the ICES area, and that the rate of progress has slowed in the last few years. In the ICES area, among the
65 to 71 stocks which are fully assessed, the proportion of overexploited stocks (i.e. F>FMSY, blue line) decreased from more than 70% to close to 40%, over the last ten
years and seems to have stabilised in the last three years. The proportion of stocks outside the safe biological limits (F>Fpa or B<Bpa, orange line), computed for the 46
stocks for which both reference points are available, follows the same decreasing trend, from 65% in 2003 to around 30% in 2016.
Figure 5.1.1. Trends in stocks status, 2003-2016. Three indicators are presented: Blue line: the proportion of overexploited stocks (F>FMSY) within the sampling frame (65 to 71
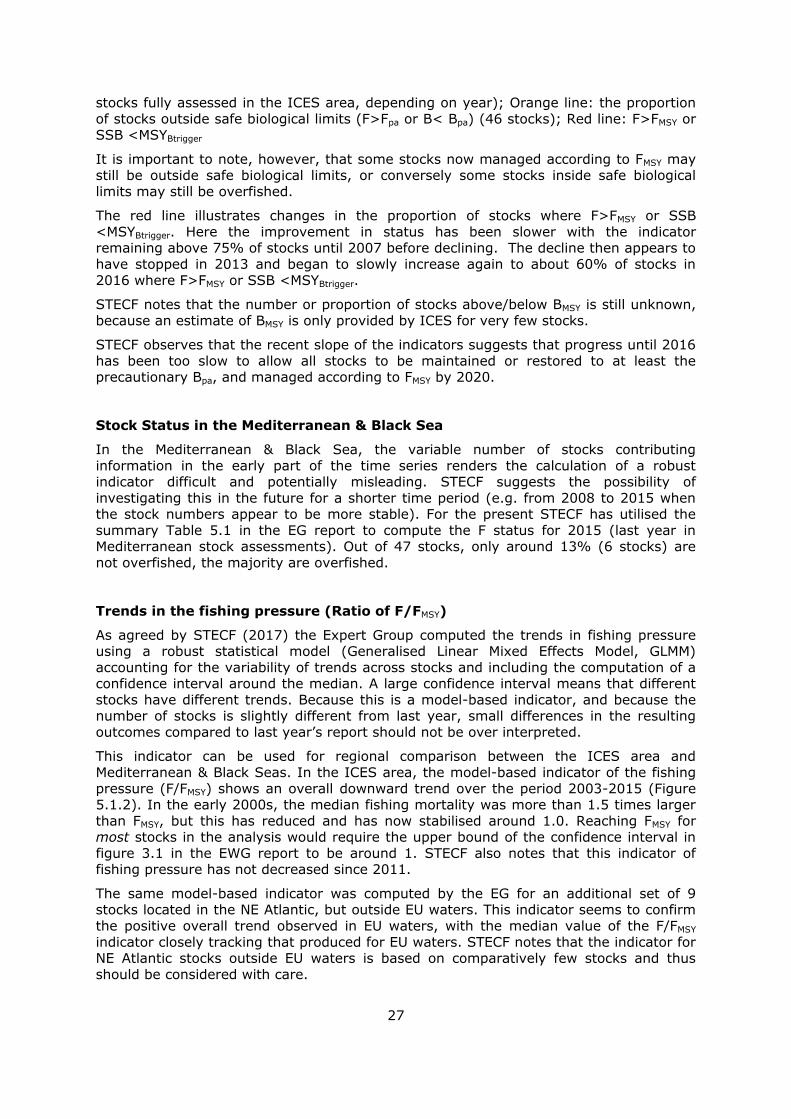
27
stocks fully assessed in the ICES area, depending on year); Orange line: the proportion
of stocks outside safe biological limits (F>Fpa or B< Bpa) (46 stocks); Red line: F>FMSY or SSB <MSYBtrigger
It is important to note, however, that some stocks now managed according to FMSY may still be outside safe biological limits, or conversely some stocks inside safe biological
limits may still be overfished.
The red line illustrates changes in the proportion of stocks where F>FMSY or SSB
<MSYBtrigger. Here the improvement in status has been slower with the indicator remaining above 75% of stocks until 2007 before declining. The decline then appears to
have stopped in 2013 and began to slowly increase again to about 60% of stocks in
2016 where F>FMSY or SSB <MSYBtrigger.
STECF notes that the number or proportion of stocks above/below BMSY is still unknown,
because an estimate of BMSY is only provided by ICES for very few stocks.
STECF observes that the recent slope of the indicators suggests that progress until 2016
has been too slow to allow all stocks to be maintained or restored to at least the precautionary Bpa, and managed according to FMSY by 2020.
Stock Status in the Mediterranean & Black Sea
In the Mediterranean & Black Sea, the variable number of stocks contributing
information in the early part of the time series renders the calculation of a robust indicator difficult and potentially misleading. STECF suggests the possibility of
investigating this in the future for a shorter time period (e.g. from 2008 to 2015 when the stock numbers appear to be more stable). For the present STECF has utilised the
summary Table 5.1 in the EG report to compute the F status for 2015 (last year in Mediterranean stock assessments). Out of 47 stocks, only around 13% (6 stocks) are
not overfished, the majority are overfished.
Trends in the fishing pressure (Ratio of F/FMSY)
As agreed by STECF (2017) the Expert Group computed the trends in fishing pressure using a robust statistical model (Generalised Linear Mixed Effects Model, GLMM)
accounting for the variability of trends across stocks and including the computation of a confidence interval around the median. A large confidence interval means that different
stocks have different trends. Because this is a model-based indicator, and because the number of stocks is slightly different from last year, small differences in the resulting
outcomes compared to last year’s report should not be over interpreted.
This indicator can be used for regional comparison between the ICES area and
Mediterranean & Black Seas. In the ICES area, the model-based indicator of the fishing
pressure (F/FMSY) shows an overall downward trend over the period 2003-2015 (Figure 5.1.2). In the early 2000s, the median fishing mortality was more than 1.5 times larger
than FMSY, but this has reduced and has now stabilised around 1.0. Reaching FMSY for most stocks in the analysis would require the upper bound of the confidence interval in
figure 3.1 in the EWG report to be around 1. STECF also notes that this indicator of fishing pressure has not decreased since 2011.
The same model-based indicator was computed by the EG for an additional set of 9 stocks located in the NE Atlantic, but outside EU waters. This indicator seems to confirm
the positive overall trend observed in EU waters, with the median value of the F/FMSY
indicator closely tracking that produced for EU waters. STECF notes that the indicator for NE Atlantic stocks outside EU waters is based on comparatively few stocks and thus
should be considered with care.

28
Figure 5.1.2. Trends in the fishing pressure. Three model based indicators F/FMSY are presented (all referring to the median value of the model): one for 48 EU stocks with
appropriate information in the ICES area (red line); one for an additional set of 9 stocks
also located in the NE Atlantic but outside EU waters (green line), and one for the 47 assessed stocks from the Mediterranean and Black Sea region (black line).
In contrast, the indicator computed for stocks from the Mediterranean Sea and Black Sea
has remained at a very high level during the whole 2003-2015 period, with no decreasing trend. The value of F/FMSY varies around 2.3 indicating that the stocks are
being exploited on average at rates well above the FMSY CFP objective.
Trends in Biomass
The model-based indicator of the trend in biomass shows improvement in the ICES area, but not in the Mediterranean and Black Sea (Figure 5.1.3). In the ICES area the biomass
has been generally increasing since 2006, and was in 2016 on average around 39% higher than in 2003. This represents a slight change from the reporting in 2016
reflecting the fact that the modelled trend incorporates new information. In the Mediterranean & Black Sea the uncertainty associated with this indicator (see Figure 4.4
in the EWG report) makes it difficult to conclude anything about trend and the situation is essentially unchanged since the start of the series in 2003.
An improving trend is also observed for data poor stocks (Figure 3.23 in the EWG
report), according to the indicator computed by the EG for 61 ICES Category 3 stocks. However, in view of the fact that this indicator is still regarded as experimental, care in
interpretation is required.

29
Figure 5.1.3. Trends in the indicators of stock biomass (median values of the model-
based estimates relative to 2003). Two indicators are presented: one for the ICES area (54 stocks considered, blue line); one for the Mediterranean region (47 stocks, black
line). The EG noticed that a large uncertainty is associated to these estimates, coming
from the fact that the biomass estimates are quite variable from one year to the next.
Trends per Ecoregion
For the ICES area, the EG provides some information and figures broken down by Ecoregion. The main trends are summarised here.
The fishing pressure has decreased and the status of stocks has improved in all ICES
Ecoregions. In 2016, the proportion of overexploited stocks ranged between to 29 - 50% across the different Ecoregions, while the modelled estimate of the F/F
MSY ratio for 2016
was between 0.89 and 1.18.
Some variations between Ecoregions in modelled trends can be seen. According to the
latest indicator trends presented in the EG report, the fishing pressure decreased consistently over the whole period and the stock status improved most markedly in the
Celtic Sea. Here the fishing mortality was at a very high level at the beginning of the time series (F/F
MSY>1.9) and decreased significantly to below 1.0. In the remaining
areas, marked declines are also evident in the first part of the time series but the rate of
decline of the indicator falls around 2010 and the indicator tends to level out. In the Bay of Biscay and Iberian Ecoregion, and stocks present throughout the wider Northeast
Atlantic the indicator has fluctuated in the most recent years.
Coverage of the scientific advice
30
Coverage of biological stocks by the CFP monitoring
As stated previously (STECF PLEN 16-03), the analyses of the progress in achieving MSY objectives in the ICES area should consider all stocks with advice provided by ICES, on
the condition of being distributed in EU waters, at least partially. Based on the ICES
database accessed for the analysis, ICES provides a scientific advice for 257 biological stocks included in EU waters (at least in part). Of these, 159 stocks are data-poor,
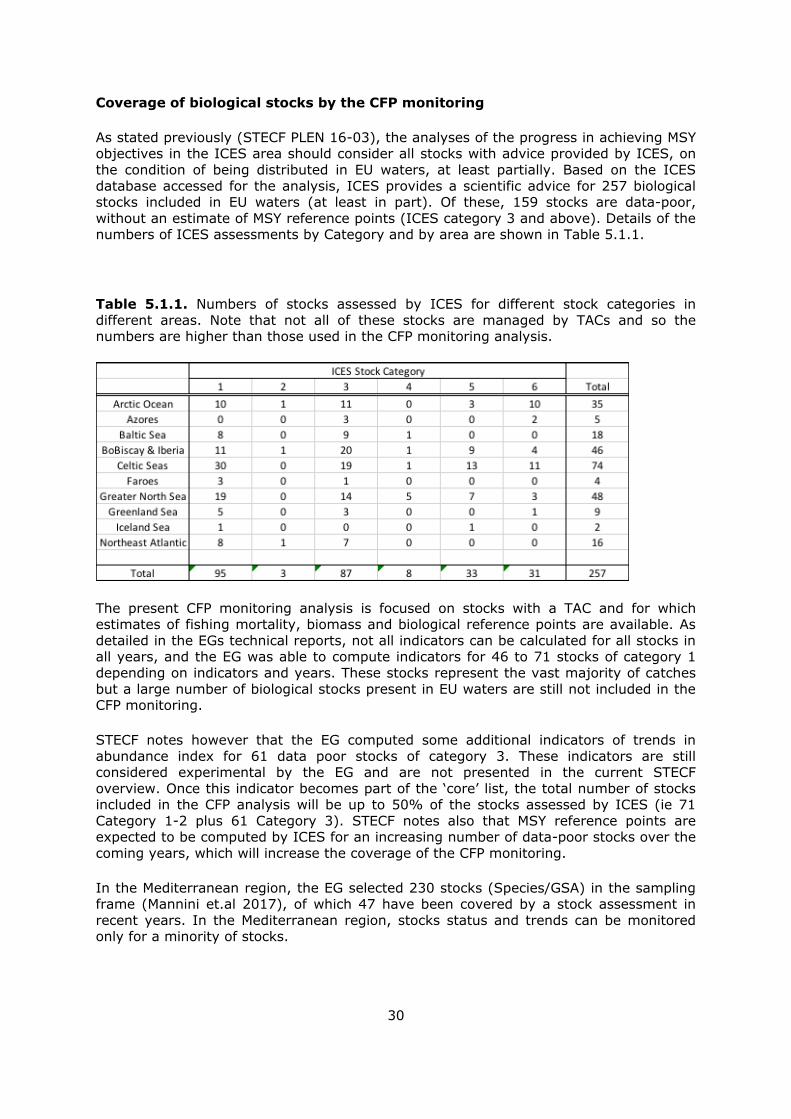
without an estimate of MSY reference points (ICES category 3 and above). Details of the numbers of ICES assessments by Category and by area are shown in Table 5.1.1.
Table 5.1.1. Numbers of stocks assessed by ICES for different stock categories in
different areas. Note that not all of these stocks are managed by TACs and so the numbers are higher than those used in the CFP monitoring analysis.
The present CFP monitoring analysis is focused on stocks with a TAC and for which estimates of fishing mortality, biomass and biological reference points are available. As
detailed in the EGs technical reports, not all indicators can be calculated for all stocks in all years, and the EG was able to compute indicators for 46 to 71 stocks of category 1
depending on indicators and years. These stocks represent the vast majority of catches
but a large number of biological stocks present in EU waters are still not included in the CFP monitoring.
STECF notes however that the EG computed some additional indicators of trends in
abundance index for 61 data poor stocks of category 3. These indicators are still considered experimental by the EG and are not presented in the current STECF
overview. Once this indicator becomes part of the ‘core’ list, the total number of stocks included in the CFP analysis will be up to 50% of the stocks assessed by ICES (ie 71
Category 1-2 plus 61 Category 3). STECF notes also that MSY reference points are expected to be computed by ICES for an increasing number of data-poor stocks over the
coming years, which will increase the coverage of the CFP monitoring.
In the Mediterranean region, the EG selected 230 stocks (Species/GSA) in the sampling frame (Mannini et.al 2017), of which 47 have been covered by a stock assessment in
recent years. In the Mediterranean region, stocks status and trends can be monitored only for a minority of stocks.
31
Coverage of TAC regulation by scientific advice
According to the EG report, STECF notes that 156 TACs (combination of species and fishing management zones) were in place in 2016 in the EU waters of the NE Atlantic.
STECF underlines that in many cases, the boundaries of the TAC management areas are
not aligned with the biological limits of stocks used in ICES assessments. The EG therefore computed an indicator of advice coverage, where a TAC is considered to be
“covered” by a stock assessment when at least one of its divisions matched the spatial
distribution of a stock for which reference points have been estimated from an ICES full assessment. Based on this indicator, 56% among the 156 TACs are covered, at least
partially, by stock assessments that provide estimates of FMSY (or a proxy) and 43% by
stock assessments that have Bpa (or a proxy).
Additionally, STECF notes that, using this index, some TACs can be considered as
“covered” even if they relate to several assessments contributing to a single TAC (e.g.
Nephrops functional units in the North Sea) or to a scientific advice covering a different (but partially common) area (e.g. whiting in the Bay of Biscay). Thus, such an approach
overestimates the spatial coverage of advice (i.e. the proportion of TACs based on a single and aligned assessment). This means that a large number of TACs are still
imperfectly covered by scientific advice based on FMSY or Bpa reference values.
General principles for future analysis
Based on the latest process of analysis and overview, STECF advises that the CFP monitoring process should continue with the following principles:
The three indicators of stock status are useful and should be regularly computed
in the coming years (expressed in stock numbers in the detailed report and in proportion in the synthesis)
As soon as a representative number of BMSY estimates become available from
ICES assessments, the proportion (and number) of stocks below or above this reference point should become part of the ‘core’ indicator set, together with an
indicator of trends in the B/BMSY ratio.
Regarding trends in fishing mortality and biomass, all indicators should be computed in a consistent way. STECF considers that the model-based indicators
should continue to be used as the standard method for every time series (including indicators per Ecoregion and indicators for NE Atlantic stocks outside
EU waters). These model-based indicators are preferable to arithmetic mean
estimates, which although easy to communicate, are generally sensitive to outliers.
To maintain ease of visual comparison, indicators of biomass trends should continue to be rescaled to the value of the starting year.
As far as possible, according to data availability, the same indicators should be computed in the ICES area and in the Mediterranean region.
Ongoing development
STECF notes that the EG Report again includes sections providing preliminary outputs
from a number of experimental indicators. STECF considers that these require further

32
development to fully understand their performance and stability before adoption as ‘core’
indicators. STECF draws attention to an STECF EWG planned for later in the year (STECF 18-15) which is dedicated to the development of CFP monitoring and suggests that
further progress on the experimental indicators relating to fish stocks could be made. During this meeting STECF encourages exploration of indicators for other aggregations
such as stock categories (eg pelagic fish versus demersal fish)
STECF conclusions
STECF acknowledges that monitoring the performance of the CFP requires significant effort in order to provide a comprehensive picture. The process presents a number of
methodological challenges due to the annual variability in the number and categories of stocks assessed (especially in the Mediterranean) and due to the large variations in
trends across stocks. As a result, the choice of indicators and their interpretation is being
discussed, expanded and adjusted over time, as duly documented in the suite of STECF plenary reports and in the JRC EG technical reports. In particular, STECF notes that the
CFP monitoring has improved this year thanks to the implementation of a revised protocol and ongoing improvements in the coverage of fish stock assessments and
estimates of reference points. STECF is aware that minor differences in the indicators can occur compared to previous years. However STECF always use the latest assessment
and best science available at the time of the report
Regarding the progress made in the achievement of FMSY in line with the CFP, STECF
notes that the latest results are generally in line with those reported in the 2017 CFP
monitoring and confirm a reduction in the overall exploitation rate for the ICES area. On average the stock biomass is increasing and stock status is improving. Nevertheless,
based on the set of assessed stocks included in the analyses, STECF notes that many stocks remain overfished and/or outside safe biological limits, and that progress
achieved until 2016 seems too slow to ensure that all stocks will be rebuilt and managed according to FMSY by 2020.
STECF also concludes that stocks from the Mediterranean Sea and Black sea remain in a very poor situation, with no change apparent in terms of fishing pressure or stock
biomass.
STECF concludes that further progress has been made on the development of additional indicators relating to fish stocks which would benefit from some additional testing before
being adopted as core indicators. STECF also recognises the need to broaden the scope of the CFP monitoring to cover additional aspects not so far dealt with. In particular,
there is a need to develop the CFP monitoring process to cover wider ecosystem and socio-economic aspects in the analysis. STECF notes that the scheduled STECF EWG on
CFP monitoring later in the year (STECF 18-15) will provide an opportunity to progress these requirements.

33
5.2 Monitoring the Landing Obligation
Background provided by the Commission
Regulation (EU) No 2015/812 (the so-called Omnibus Regulation), introduced an obligation for the Commission to report annually on the implementation of the landing
obligation, based on information transmitted by the Member States, the Advisory Councils and other relevant sources.
According to Article 9 of the Omnibus Regulation, Commission report should include the following elements:
• steps taken by Member States and producer organisations to comply with the landing obligation;
• steps taken by Member States regarding control of compliance with the landing obligation;
• information on the socioeconomic impact of the landing obligation; • information on the effect of the landing obligation on safety on board fishing
vessels; • information on the use and outlets of catches below the minimum
conservation reference size of a species subject to the landing obligation;
• information on port infrastructures and of vessels' fitting with regard to the landing obligation; for each fishery concerned; and
• information on the difficulties encountered in the implementation of the landing obligation and recommendations to address them.
In order to facilitate the reporting, and in line with the outcome of STECF EWG 16-04, in 2017 Member States were invited on a voluntary basis to complete questionnaires
seeking more detailed information on the impact of the landing obligation and national steps taken to assist with its implementation. This year, Member States were asked to
update the information provided as appropriate. This information has been reviewed and
summarized in an ad hoc contract.
Background information is provided on: https://stecf.jrc.ec.europa.eu/plen1801
Request to the STECF
Based on:
- The report of the ad hoc contract for Evaluation of Member States Annual
Reports on the Landing Obligation - Annual reports received by Member States, the Advisory Councils, EFCA
- Any other relevant sources of information
The STECF is requested to:
1) To advise the Commission on the elements appropriate to meet the reporting requirements of Article 9 of Regulation 2015/812, review and summarise the
main findings of the reports highlighting, in a structured manner, key salient points raised by each MS and to provide an overview of them at the sea basin
level. 2) To identify to what extent discard rates are being reduced in specific fleets or
fisheries.

34
3) Identify specific actions where MS have made adjustments to support the
introduction of the landing obligation. 4) Identify the most important gaps or weakness in implementation and the
lessons to be learned from best practices. Where available, identify specific fleets and stocks where the landing obligation has had a direct impact on
fishing activity; 5) Highlight the most important weaknesses in reporting and the lessons to be
learned from best practices. 6) Make any further recommendations as appropriate to improve implementation
and reporting
STECF response
STECF response is based on the Member States’ Annual Reports on the Landing Obligation (2017), and an ad-hoc contract issued to evaluate these reports.
The ad-hoc contract report is available on the plenary meeting website: https://stecf.jrc.ec.europa.eu/plen1801 under “documents”.
Overview of the responses received by the Commission
STECF notes that for 2017, as in the 2 previous years, the Commission asked MS to
complete a questionnaire based on proposals in STECF-16-03 and received reports from 15 Member States and 2 advisory Councils - this represents a decline in reporting rate
since 21 MS and 3 advisory Councils submitted reports for 2016. These reports were reviewed and synthesised by means of an ad-hoc contract, whose report was presented
to the STECF.
The Commission did not receive 2017 reports from eight MS: Croatia, France, Italy,
Latvia, Netherlands, Portugal, Romania or United Kingdom. Six of these MS did report for 2016, see Table 5.2.1. Care is required in interpreting apparent annual changes since
the composition of MS in the different areas has changed.
STECF notes that question 23 in the questionnaire circulated by the Commission relates to social and economic impacts of the Landing Obligation and the question refers to a list
of indicators, but the list of indicators was actually not provided by the Commission.
Extract of text from the questionnaire sent by MARE to MS:
Information on the socioeconomic impact of the landing obligation
Q. 23. Using the most appropriate indicators defined below, provide information on the
socioeconomics impacts on:
• The catching sector
• Upstream businesses
• Processors
• Consumption and markets
• Costs for Member States

35
However the list of indicators as found in table 6.10 below (extracted by STECF from
EWG 16-04) (https://stecf.jrc.ec.europa.eu/c/document_library/get_file?uuid=d00b38c1-035c-43d6-
80e3-0519e15eae5b&groupId=43805 )was not attached to the letter.
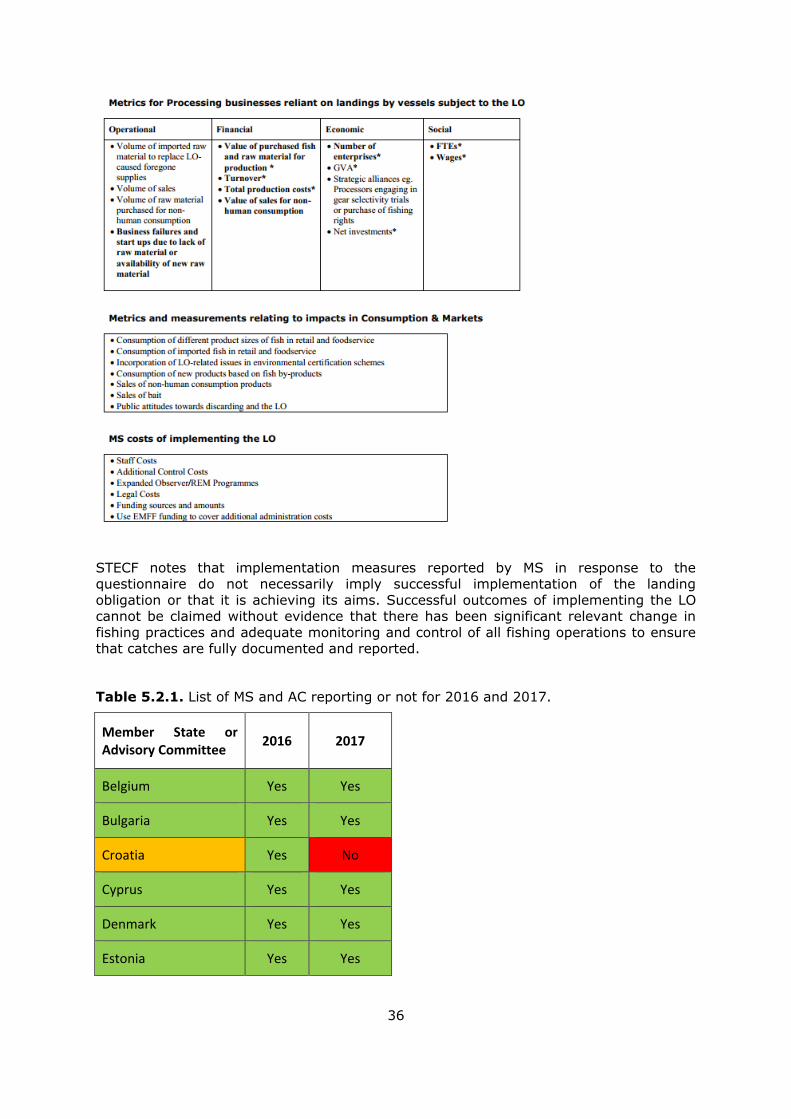
36
STECF notes that implementation measures reported by MS in response to the questionnaire do not necessarily imply successful implementation of the landing
obligation or that it is achieving its aims. Successful outcomes of implementing the LO cannot be claimed without evidence that there has been significant relevant change in
fishing practices and adequate monitoring and control of all fishing operations to ensure that catches are fully documented and reported.
Table 5.2.1. List of MS and AC reporting or not for 2016 and 2017.
Member State or Advisory Committee
2016 2017
Belgium Yes Yes
Bulgaria Yes Yes
Croatia Yes No
Cyprus Yes Yes
Denmark Yes Yes
Estonia Yes Yes
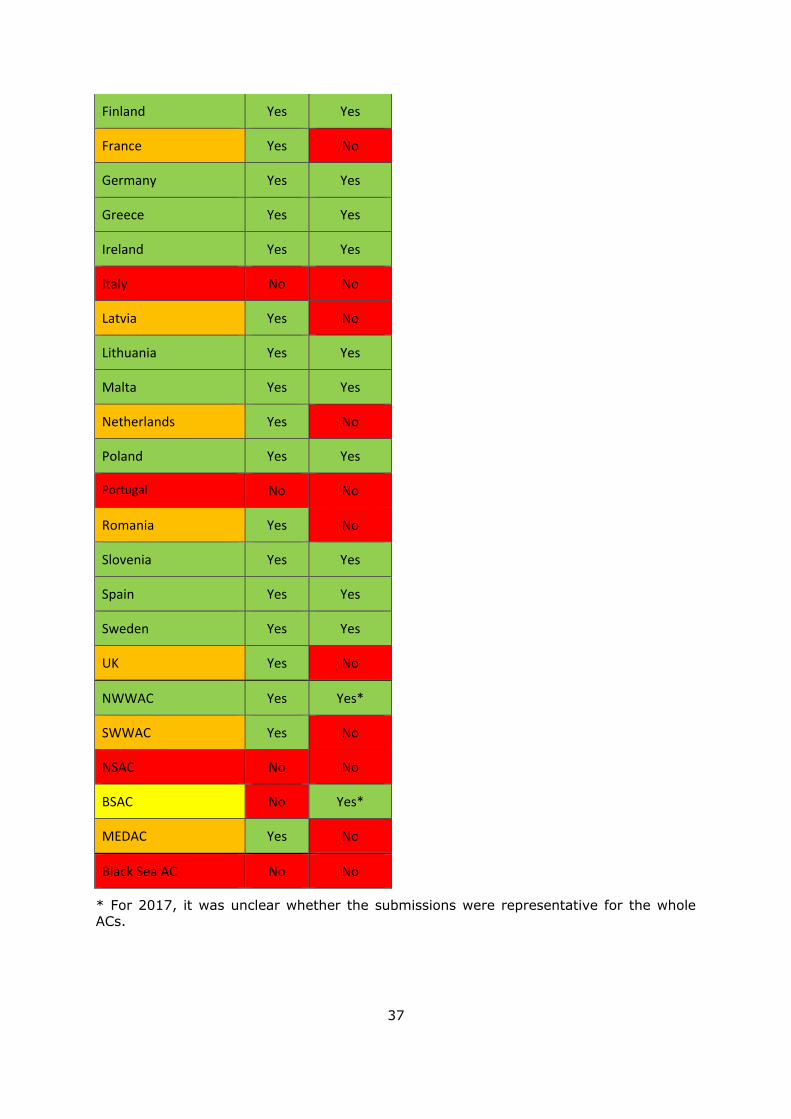
37
Finland Yes Yes
France Yes No
Germany Yes Yes
Greece Yes Yes
Ireland Yes Yes
Italy No No
Latvia Yes No
Lithuania Yes Yes
Malta Yes Yes
Netherlands Yes No
Poland Yes Yes
Portugal No No
Romania Yes No
Slovenia Yes Yes
Spain Yes Yes
Sweden Yes Yes
UK Yes No
NWWAC Yes Yes*
SWWAC Yes No
NSAC No No
BSAC No Yes*
MEDAC Yes No
Black Sea AC No No
* For 2017, it was unclear whether the submissions were representative for the whole ACs.

38
Table 5.2.2 provides a summary of the aspects of the landing obligation where most
change was evident. Here a simple colour scale from ‘No change’ to ‘Significant change’ has been used to classify the responses (by Member State) to the individual questions
posed in the Commission questionnaire (the questions are included in Annex II of the STECF 16-13 – Methods and data requirements for LO report.
https://stecf.jrc.ec.europa.eu/ewg1604).
Table 5.2.2. Summary by Member State of the aspects of the landing obligation implementation in 2017 where change from 2016 was evident. Numbering refers to the
questionnaire within the broad topic headings.
Summary of background information provided to the Commission by MS
This section provides a synthesis of the background information received from Member
States, Advisory Councils as well as of the report of the Ad-hoc contract (No.ARES(2018)1564295).
The following sections summarise the key points made in MS 2016 reports (included in
the ad-hoc contract report) and highlights new content in MS 2017 reports relating to the different sea basins.
Most of what was reported in MS 2016 reports is again present in the 2017 reports of MS which reported in both years and hence 2016 summary notes are included again here as
for those MS, the report also applies to 2017. For the six MS that reported for 2016 but did not report for 2017, we cannot say whether they continued activities reported in

39
relation to 2016. The comments below relating to 2017 highlight only new content from
the 2017 reports of MS which reported in both years.
NORTH WESTERN WATERS
Of the seven MS which had vessels active in NWW in 2017, three (Spain, Ireland and
Belgium) submitted a report to the Commission. France, Netherlands, Portugal and the UK did not submit reports for 2017. NWWAC did reply in 2017.
Relating to 2016 MS reports: Member States in NWW have been proactive in trying to implement the landing obligation and most have initiated studies and pilot projects. In
addition, Member States have also made adaptations to their catch reporting systems or
introduced specific management measures to assist with implementation. Member States have also worked extensively with the NWWAC to disseminate information to the fishing
industry, but it is evident there is a lack of industry buy-in for the landing obligation which is hindering implementation.
New for 2017: there was considerably more reporting of outcomes from the studies and innovative ideas to encourage vessel operators to take up some of the options.
Relating to 2016 MS reports: Several specific cases of choke species have been reported by Member States in the NWW and this issue remains one of the key concerns in this sea
basin. Analyses carried out in conjunction with the NWWAC highlight that the existing
exemptions and tools within the Regulation are unlikely to fully alleviate the choke problems.
New for 2017: there were several references made to the workshops on choke analysis convened by the AC and Regional Group which has helped focus attention on key choke
species.
Relating to 2016 MS reports: The difficulties in monitoring catches discarded under
exemptions and the low level of landings of fish below Minimum Conservation Reference Sizes (MCRS) in NWW which generally have been low are also issues of concern for
Member States. In this regard, at least one Member State reports difficulties in placing
observers on board fishing vessels subject to the landing obligation.
SOUTH WESTERN WATERS
Belgium, France, Portugal and Spain had vessels active in SWW in 2017 and only
Belgium and Spain submitted reports relating to 2017. SWWAC did not reply in 2017.
Relating to 2016 MS reports: Based on the reports received, the landing obligation
seems to have had little impact on fishing activities in the SWW. Apart from one Member State, very few studies or specific measures are reported to have been taken to
implement the landing obligation. Member States do point to issues in future years when
more species and fisheries are subject to the landing obligation.
New for 2017: further detail on projects was given but there were few outcomes
reported.
Relating to 2016 MS reports: Delays in the EMFF and difficulties in accessing funds have
been listed as an issue by the SWWAC and generally, other than one Member State, very little funding for port infrastructures, to modify vessels to handle unwanted catches or
for selective gears has been forthcoming.
New for 2017: one Member State presented a long list of potential difficulties without
many suggestions for how these could be overcome.

40
NORTH SEA
Seven MS had fishing vessels active in the North Sea in 2017: Belgium, Denmark, Germany and Sweden submitted reports; France, Netherlands and UK did not submit
reports for 2017. The NSAC did not reply in 2017.
Relating to 2016 MS reports: MS reports indicated a perceived general reluctance from
the fishing industry to fully comply with the transition rules of the landing obligation. In particular reporting catches discarded under exemptions remains highly variable and
landing fish below MCRS are well below levels that would be expected based on data of previous catches. There is little change observed in fishing practices to avoid unwanted
catch of under MCRS fish.
In 2016 and 2017 changes to fishing practices in order to avoid unwanted catches has been widespread by vessel operators of many Member States in the North Sea, mostly
focussed on improving selectivity of the fishing operation. However, uptake of selective gears by industry has been low.
In 2017 trials with control and monitoring tools such as Closed Circuit TV (CCTV) and Remote Electronic Monitoring (REM) have continued in the North Sea to assess their
application in implementing the landing obligation, but the use of such tools has not progressed past the experimental phase.
One of the issues in the 2017 responses, reiterated from previous responses, is that of
ensuring a level playing field between MS. There appears to be some concern that Member States which commit to this more stringent and continuous monitoring system
will be disadvantaged compared to those which do not.
Identifying potential choke species and the impacts of these species on North Sea
fisheries remains a priority in 2017 for Member States in the North Sea. Extensive analysis of the problem has been carried out by the Scheveningen group as well as the
NSAC.
In 2016 and 2017 most Member States in the North Sea have been pro-active in
allocating funding to enable implementation of the landing obligation.
BALTIC
Eight MS had fishing vessels active in the Baltic in 2017: Denmark, Estonia, Finland, Germany, Lithuania, Poland and Sweden submitted reports for 2017; Latvia did not
submit a report for 2017. The BSAC did reply in 2017.
Relating to 2016 MS reports: Changes to fishing practices in order to avoid unwanted
catches were a priority for many Member States with vessels fishing in the Baltic, mostly focussed on improving selectivity of the fishing operation. However, uptake of new
selective gears by industry has so far been low.
Member States fishing in the Baltic, through the Baltfish group, report having been proactive in disseminating information to the fishing industry and inspectors from the
Member States have worked extensively with the European Fisheries Control Agency (EFCA) on developing control and monitoring measures.
Some Member States fishing in the Baltic have made changes to their quota management systems. Some have created bycatch quotas reserved for vessel operators
targeting other species, who may need a small amount of quota to avoid a choke situation. This adjustment has helped to avoid choke situations in the Baltic.
Damage to fish by seals was reported as being widespread and the exemption included
in the landing obligation to allow discarding of such catches has been used by most Baltic Member States. However, the accuracy of how such discards are reported is not
41
uniform with some Member States supplying very detail information while others
claiming it impossible to accurately record such discards.
MS reports for 2017 do not suggest any fundamental changes in the approaches
reported by Member States for 2016 and the comments above remain valid.
MEDITERRANEAN
Eight MS had vessels fishing in the Mediterranean in 2017: Cyprus, Greece, Malta,
Slovenia and Spain submitted reports for 2017; Croatia, France and Italy did not submit 2017 reports. The MEDAC did not reply in 2017
Relating to 2016 MS reports: The landing obligation appears to have had little impact on
fishing activities in the Mediterranean, and many Member States report few difficulties in implementation. Most MS point to the importance of maintaining de minimis exemptions
included in current discard plans to minimise impacts in the future. Some MS recognised that difficulties will arise when demersal fisheries become subject to the landing
obligation, have instigated studies to consider the use of spatio-temporal closures and selective gears to protect juveniles.
For 2017 a new closed area was introduced to protect hake in the eastern Mediterranean.
Relating to the 2016 MS reports: Several Member States highlight specific problems with
the existence of illegal sales of fish below MCRS and the need to widen the allowable uses for such catches to charitable purposes as a disincentive to the sale of fish below
MCRS. This is not a new problem in the Mediterranean, but the Member States and the MEDAC see that the landing obligation may exacerbate the problem.
BLACK SEA
Only Bulgaria and Romania had vessels fishing in the Black Sea in 2017. Bulgaria submitted a report for both 2016 and 2017 but Romania submitted a report only for
2016. The Black Sea AC did not reply in 2017.
Relating to the 2016 MS reports: The landing obligation has had little or no impact on fisheries in the Black Sea. No specific actions or measures are reported by the Member
States in this sea basin.
For 2017 Bulgaria reported some studies on the Rapana beam trawl fleet and its
influence on juvenile turbot discards. There are concerns that impacts will increase in future years without any clear evidence to support this assertion.
Specific actions taken by Member States
Based on 2016 reports: Most Member States that reported appear to be moving towards
a risk-based approach to control and monitoring, largely as a result of the efforts made by EFCA to assist Member States. The European Fisheries Control Agency (EFCA) has
also shown the utility of the last observed haul analysis as a means to facilitate evaluation of overall, fleet-wide, compliance with the landing obligation provisions and
provide information on catch composition across different fleets or metiers.
Most Member States have engaged with the relevant Advisory Councils since 2016 and in
the case of the Mediterranean, have largely followed the advice provided by the MEDAC. Member States have also made significant efforts to disseminating information to vessel
operators in a variety of ways – meetings, information notes or one-to-one meetings.

42
Reports by MS suggest that most Member States have provided specific training for
inspectors, facilitated extensively by EFCA.
During 2017, reports suggest that engagement with fishing businesses continued and
there seems to have been a focus on jointly developing tools to analyse and identify potential choke situations.
Key areas of concern and difficulties
Based on 2016 reports: Most Member States’ reports indicated that problems have been minimal but are expected to increase as more species and fleets become subject to the
landing obligation. Member States report that their main difficulty arises from the lack of
engagement by the fishing industry and a reluctance to fully comply with the legislation. In many Member States, there is little or no evidence of change in fishing practices.
Choke stocks remain a concern for most Member States in 2017 although the actual extent of the problem is unclear and there are almost no examples of reported choke
situations actually occurring since the introduction of the landing obligation. Belgium indicated that their quota for a main target species ran out (species not mentioned)
although it is not clear that this was as a result of a choke situation. Estonia indicated that salmon (in the Baltic) had essentially become a choke but that the problem was
mitigated by quota exchange with another member State. Denmark suggested that ling
was a choke species for them in the Skagerrak/Kattegat but no details were provided on the circumstances surrounding this.
In 2016 only five Member States report having used EMFF funding to support vessel operators, except for funding selectivity experiments and assistance to modify fishing
gear. Very little funding has been provided to improve the infrastructure of ports and harbours, reflecting low levels of landing unwanted catches below MCRS. Despite this,
many Member States point out that this will be a serious issue in the future when the landing obligation is fully implemented. Similarly, many Member States highlight
potential problems and safety issues that will be faced by fishermen in handling
unwanted catches on board vessels. However, no evidence is presented that such problems exist, even in the pelagic fleets and the Baltic, where the landing obligation has
been in place for more than two years.
In 2017 there was an increase in the reporting of detail on the use of the EMFF.
Specific gaps or weaknesses in implementation
A number of specific gaps and weaknesses in implementation were reported. These issues are grouped below into those that may require intervention by DGMARE and those
that might require action by Member States, Regional Groups or vessel operators.
Gaps or weaknesses in implementation requiring DGMARE response or action:
•STECF notes that fewer MS reported to the Commission on implementation of the landing obligations for 2017. This reduction in reports has devalued the combined
information. Much of the information included in reports is qualitative.
•Some Member States report ongoing improvements to data entry systems in 2017 but
others continue to report problems with reporting de minimis discards and catches of fish below MCRS in the Electronic registration system (ERS), in paper logbooks and also in
reporting these to the Commission. STECF observes that it is important to have
standardised reporting across Member States which will assist vessel operators to meet their catch reporting obligations.
43
•Several of the reports for 2017 suggest again that despite the efforts of EFCA, there is
evidence of different interpretations between Member States within regions and also across sea basins in the implementation of the landing obligation, for example,
interpretations of reporting requirements and interpretation of the use of de minimis. These differences have created confusion and a level of mistrust among vessel
operators, which has hindered compliance. Successful implementation of the landing obligation will rely on achieving assurance that all catches are accounted for.
Gaps or weaknesses in implementation requiring MEMBER STATES or REGIONAL
GROUPS actions or response
•Feedback on progress of implementation at sea basin level is required to enable
understanding of how effective the implementation of the landing obligation has been and what adjustments may be necessary to achieve its objectives. It is evident from the
2017 MS reports that there has been almost no cooperation between Member States in completing the questionnaire to prepare their reports. A co-ordinated approach to
reporting might help to ensure that all Member States are involved in the response process to the Commission.
•Reports for 2017 again show that most Member States reporting have put a lot of effort
into control and monitoring the landing obligation, particularly with the move towards a risk-based approach and the using last observed haul analysis developed by EFCA.
However, it is apparent that forensic sampling of catches on board vessels and in ports is only applied in a few Member States and the level of STECF’s confidence in catch
reporting remains low. Observer coverage has not increased in several Member States and there have been anecdotal indications that it may have actually reduced in some
cases, however, only one Member State (Estonia) reported ‘refusal to carry observers’ in their response and this was an isolated case. There is little uptake in the use of
monitoring tools such as Remote Electronic Monitoring and there may be too much
reliance on existing control and monitoring techniques to enforce the landing obligation.
•Catches of fish below MCRS reported for 2017 by most Member States are extremely
low and, based on observer data and last observed haul analysis, STECF doubts that they reflect the true quantities actually being caught. Accurate reporting of unwanted
catches is vital to effective implementation of the landing obligation and to understand the impact of the landing obligation.
•The Omnibus Regulation allows for technical measures regulations to be modified in discard plans. However, despite many Member States carrying out experiments with
selective gears or avoidance measures, as yet few of these measures have been adopted
into discard plans.
•Member States have not used all exemptions and flexibility tools available to them to
implement the landing obligation. In particular, no Member State has used the inter-species quota flexibility mechanism, although Member States appear to recognise that
this carries risks of elevated mortality rates and should be viewed as a last resort approach.
Gaps or weaknesses in implementation requiring FISHING INDUSTRY actions or
responses
•Most Member States’ 2017 reports again suggest that there is opposition and a sense of denial towards the landing obligation from the fishing industry with no evidence of any
44
change in fishing practices. Full and effective compliance with the landing obligation
requires a change in fishing operations.
•Many of the 2017 MS reports indicate a lack of reporting by vessel operators of fish
discarded under exemptions (i.e. de minimis and high survivability), discards of fish currently not subject to the landing obligation and catches of fish below MCRS. This lack
of reporting is in part because the ERS system has not allowed for the recording of such catches. Based on the Member States reports, the quantities of discards and unwanted
catches being recorded in logbooks are extremely low and do not match information from observer trips or from last observed haul analyses carried out by inspectors.
Inaccurate or incomplete catch data will compromise the provision of scientific advice
STECF conclusions
ToR 1 - To advise the Commission on the elements appropriate to meet the reporting requirements of Article 9 of Regulation 2015/812, review and summarise the main
findings of the reports highlighting, in a structured manner, key salient points raised by each MS and to provide an overview of them at the sea basin level.
STECF concludes that Member State reports relating to 2017 include more information and in a more structured manner than in the previous year. However, STECF notes that
fewer reports were sent by Member States for 2017 than for 2016. This reduction
hampers interpretation of year on year changes.
Since MS reports contain mostly qualitative statements, generally not supported with
data, they cannot form a basis for an independent assessment of the implementation of or impacts of the landing obligation. Therefore, STECF concludes that the MS reports do
not supply sufficient data to enable STECF to give the Commission the information required to fulfil the Commission’s reporting obligations under Article 9 of the Omnibus
Regulation.
STECF concludes that based on the submitted MS reports, overall implementation of the
transitional phase of the landing obligation has been challenging for MS and vessel
operators. However, there is no evidence of significant changes in fishing practices.
STECF concludes that there was no data included in MS reports that could amount to an
assessment of the socio-economic impacts of the landing obligation.
Overall STECF concludes that provision of a more detailed, defined template for reporting
as required by the regulation could result in more standardised and useful reports from MS.
ToR 2 – To identify to what extent discard rates are being reduced in specific fleets or
fisheries.
STECF concludes that, based on MS reports submitted, it is not possible to identify to what extent discard rates have been reduced in specific fleets or for specific fish stocks.
STECF suggests that a comparison between vessel reports and onboard control reports (last haul) would be useful to investigate suspected widespread under-declaration by
vessel operators of fish under MCRS and discarded fish. Uncertainty about reported catch and discard data results in low confidence that regulations are being followed, and may
lead to biased scientific advice and underestimates of fishing mortality.
STECF reiterates that accurate reporting of all catches is vital to understanding the
impact of the landing obligation.

45
STECF concludes that, for those MS which reported, observer coverage of fishing activity
did not increase in 2017, and in a few Member States there are indications that observer coverage had actually reduced due to increased refusal to take observers on board.
ToR 3 - Identify specific actions where MS have made adjustments to support the
introduction of the landing obligation.
STECF concludes that Member State Reports and the sea basin summaries contain
numerous examples of specific actions undertaken to support the introduction of the landing obligation. These include numerous gear trials attempting to adjust size and/or
species selectivity. In one MS, an incentive scheme to encourage uptake of selective
gears has been implemented. The use of spatial measures has so far been more limited. A few MS have made adjustments to their quota management systems, while
substantially more have been involved in ongoing changes to compliance and monitoring utilising risk-based approaches and last haul analysis. There is a mixed picture regarding
providing financial support to assist with vessel changes or port modifications to facilitate the landing obligation. Some Member States indicate use of EMFF funding (quoting
numbers of projects and expenditure), others appear not to have used these provisions at all.
While it is possible to identify specific actions, there is very little information provided on
the outcomes arising from these actions. For example, information on proportions of vessels utilising new gears is very sparse and few statistics are provided on levels of
monitoring of vessels at sea. STECF concludes that it is not possible to make any judgement on the impact of the specific actions in assisting the introduction of the
Landing Obligation and its effectiveness.
ToR 4 - Identify the most important gaps or weakness in implementation and the lessons to be learned from best practices. Where available, identify specific fleets and
stocks where the landing obligation has had a direct impact on fishing activity
STECF concludes that many of the concerns with the implementation of the landing obligation highlighted in the reports of several Member States are anticipated for the
future and not yet necessarily observed. The reports of limited impact in some regions such as Mediterranean and Black Sea may also be related to non-implementation of the
landing obligation, rather than because the landing obligation does not pose any issue. These statements must thus be interpreted with caution.
STECF concludes that many Member States report few problems with the implementation of the landing obligation. Several MS reported lack of engagement by
the industry to adapt to the landing obligation and Member States are unable to point to
significant changes in fishing practices. Based on the MS reports available, STECF is unable to identify specific fleets and stocks where the landing obligation has had direct
impact on fishing activity.
ToR 5 - Highlight the most important weaknesses in reporting and the lessons to be learned from best practices
STECF concludes that the major weaknesses is reporting all catches so that the effects of changes in fishing practices in response to the implementation of the landing obligation
can be identified. This weakness creates a lack of overall knowledge of fishing practices.
Another one of the most serious and important gaps in reporting is lack of reporting on the socio-economic impacts of the landing obligation. No MS has adequately reported on
this topic.
46
STECF concludes that the questionnaire provided to Member States by the Commission
has helped to structure the responses supplied by Member States. However, much of the information supplied remains largely qualitative and any increase in the level of
quantitative information would provide a better means of assessing the implementation of the landing obligation. In particular, the reports would benefit from reliable
quantitative information on fish discarded under exemptions (i.e. de minimis and high survivability), discards of fish currently not subject to the landing obligation and catches
of fish below MCRS.
ToR 6 - Make any further recommendations as appropriate to improve implementation
and reporting
Although Member States continue to develop enforcement and monitoring activities,
particularly the risk-based approach and the use of the last observed haul analysis, it is apparent that there is only limited use of comparative data and forensic sampling. STECF
concludes that more reliable data could be achieved if more effort was made to compare data from sampling on board with vessel-reported data on caches, discards and landings.
As in previous years STECF concludes that monitoring at sea would need to be increased significantly and this can be achieved by promoting alternative techniques to monitor
vessels at sea. Member States still rely heavily on traditional compliance and monitoring
tools to observe the landing obligation and enforce it. There are no indications that innovative monitoring at sea, such as Remote Electronic Monitoring (REM, CCTV +
sensor system), are being used as a more effective means to monitor the landing obligation (STECF EWG 13-17).
STECF concludes that, to encourage more and better data submission, the Commission could provide a template tables to help MS to supply information on de minimis
quantities and fish below MCRS.
STECF concludes that on the 2 additional questions asked in the accompanying letter
from the Commission in 2018, very little information was provided by the Member
States. There are no detected infringements of the landing obligation reported by any Member State. However, it was mentioned that it is difficult to detect infringements in
relation to the LO and that prosecutions are even more difficult.
STECF concludes that a comparison between the 2017 data provided by Member States
and forthcoming 2017 data from other sources (e.g. ICES and STECF NEW-FDI database) would be useful.
STECF concludes that it would be helpful to MS in completing their reports on social and economic impacts of the landing obligation if the Commission were to include the list of
indicators, which is provided in STECF-16-13, table 6.10 on pages 67-68.
47
5.3 Review of the North Western Waters Combined de minimis
request
Background provided by the Commission
As part of preparations for the full implementation of the landing obligation in 2019, the
Member States Regional Groups are exploring several mechanisms and methodologies to
include in joint recommendations and discard plans. The STECF has previously reviewed
the suggestion of a combined de minimis in 2017. Several concerns were raised by
STECF on how such a methodology would be applied to annual quota setting in the North
Western Waters. The Commission has received an updated proposal that contains
several changes to the proposed methodology for a combined de minimis, specifically for
gadoids in the Celtic Sea and Channel. As such the STECF is asked to verify the
information in the attached paper and evaluate the potential implications for annual
quota setting, data recording and catch advice.
Background information is provided on: https://stecf.jrc.ec.europa.eu/plen1801
Request to the STECF
STECF is requested to review the paper received from the North Western Waters Member States Technical Group on a potential combined de minimis for gadoids (cod, haddock,
whiting) for vessels using bottom trawls (OTB, OTT) >80mm in the Celtic Sea and the Channel (ICES 7b-c, e-k).
In particular is the STECF is requested to:
Advise if the proposed combined de minimis has sufficient modifications and
safeguards to address the previous concerns raised by STECF in 2017.
Based on the species and methods provided and using the most recent catch and
discard information, verify and confirm the data and calculations therein and
evaluate if the proposed combined de minimis would allow sustainable fishing in
line with the Common Fisheries Policy.
Advise on potential modifications to a combined de minimis to mitigate any
concerns
Advise how the proposed method or modified methods could be applied in annual
TAC and quota setting process, where currently quotas are set on a single stock
basis.
Evaluate potential implications for accurate recording and data collection of
catches, landings, discards and the catch advice process
Summary of the information provided to STECF
According to the supporting document the de minimis exemption would come into effect
in 2019 and would be at a maximum of 7% of the total annual catches of cod, haddock and whiting for bottom trawl fisheries with a mesh size ≥ 80 mm in the Celtic Sea and
the Channel (OTB, OTT in ICES divisions 7 b-c, e-k). The suggested de minimis
48
exemption would continue to be set at a maximum of 7% in 2020, up to a maximum of
6% in 2021 and 2022, and up to a maximum of 5% from 2023 of the total annual catches of those species. The proposal is made on the basis that selectivity is very
difficult to improve without losing large parts of commercial landings and the disproportionate costs of handling and sorting previously discarded catches. The previous
submission proposed a de minimis level of 5%.
The basis for the exemption
The supporting document includes a definition of the two fisheries, TR1 (vessels fishing
with bottom trawls and seines of a mesh size greater than 100mm) and TR2 (vessels
fishing with bottom trawls and seines of a mesh size less than 100mm). It provides information on the estimated weights of catch, landings and discards for the selected
fisheries operating in the Celtic Sea and Western Channel from 2013-2016 (derived from STECF FDI database). The updated proposal does not include information on the two
criteria for a de minimis exemption, namely evidence on difficulties to improve selectivity (although one selectivity project is mentioned REJEMCELEC) and on the disproportionate
costs of handling and sorting catches. However, in the previous submission, EWG 17-08 noted the following selectivity projects were listed : CELCELCT, SELSELEC, REJEMCELEC,
SELECCAB, COBRENORD, EODE and the discard study OPN.
The proposal includes an updated estimate of the level of discards that would be allowed under the de minimis exemption, which has been increased from 5% to 7% in the
updated submission. The estimate is calculated based on 2013-2016 average total catches of haddock, whiting and cod combined. For all EU TR1 mixed demersal vessels in
Celtic Sea and Western Channel the total catches of 20,057 tonnes of whiting, cod and haddock (average 2013-2016) which would represent a maximum volume of discards of
1,404 tonnes at a de minimis of 7%. According to the profile of discard established on those STECF data, discards of each species would represent:
- Whiting: 33% of the total gadoids discards volume (cod, whiting, haddock)
- Haddock: 61.5% of the total gadoids discards volume (cod, whiting, haddock)
- Cod: 5.1% of the total gadoids discards volume (cod, whiting, haddock)
For all EU TR2 vessels in Celtic sea and Western Channel, total catches of whiting, cod
and haddock were estimated at 12,383 tonnes (average 2013-2016). A de minimis of 7% would represent a weight of 867 tonnes of discards, with contributions by each
species to overall discards based on:
- Whiting: 53% of the total gadoids discard volume (cod, whiting, haddock)
- Haddock: 43.31% of the total gadoids discard volume (cod, whiting, haddock)
- Cod: 3.64% of the total gadoids discard volume (cod, whiting, haddock)
As with the previous submission, a safeguard provision to limit the de minimis species
flexibility is included. This is set at the level of a maximum 25% for all species included in the overall de minimis percentage. Therefore, the proportionate contribution to the
discards for any one of the species cannot increase by more than 25%. For example, the % of whiting discards in TR2 cannot exceed 53+25%=66.25% of the total gadoid
discard volume. To avoid exceeding the total de minimis quantity amount (across the three species), if the proportionate contribution to the discards increases for one species,
then the de minimis provision available to the other species reduces by the same weight.
According to the supporting document, this flexibility is to limit the risk of discarding of

49
only one species and these safeguards should be revised if necessary and according to
discard profile that can evolve over the years.
Details of how this approach would be applied are given for each fleet, including the
maximum amount discards allowed for each stock and the remainder that would be available for the other two stocks to avoid exceeding the combined 7% de minimis level.
The suggested approach recognises the requirement to identify the part of the fleet taking advantage of the de minimis exemption and the discards it accounts for.
Furthermore, the proposal states that, when it comes to TAC setting, for a combined de minimis exemption, the percentage de minimis level needs to account for the maximum
possible discard volumes per stock, for each of the fisheries (TR1 or TR2), including the
+25% safeguard. This is because it is not possible to determine in advance from which of the combined stocks the de minimis provision will be utilized.
STECF observations
The STECF EWG notes that the latest submission provides clarification on some observations made by STECF in the previous review.
The STECF EWG on Fisheries Dependent Information has previously drawn attention to the uncertainty in estimated discard quantities (STECF EWG 15-08) and STECF has
advised on the need for care in the use these data in the context of making TAC
adjustments related to the Landing Obligation (STECF Plen 15-03 and associated standalone report STECF 15-17). Furthermore, based on a series of 6 EWG reports
focused on the topic, STECF has regularly provided advice on many aspects of the Landing Obligation (see for example STECF Plen 13-03). STECF notes that this advice
includes warnings about the difficulty of establishing and operating de minimis provisions and difficulties associated with monitoring and controlling these provisions. STECF
reiterates this earlier advice and notes that while it has attempted to provide the quantities involved in the request, this should not be taken to imply that STECF
considers the proposal to be a suitable approach.
Further to this, STECF notes that the uncertainty associated with the discards estimates and the aggregation of the data sources (FDI levels), is likely to generate error levels in
catch estimates larger than the precision required to evaluate this exemption. As such estimates of future de minimis levels must be considered with care and only as indicative
of potential outcomes of the fishing activity. However, the evaluation presented here does demonstrate the relative differences between different de minimis approaches.
STECF corroborated the catches, landings and discards data by checking samples of data from the proposal against the STECF FDI database. STECF has recalculated de minimis
volumes and percentages identified and small differences in the results for calculations
on TR1 fleets, the updated figures are presented in Table 5.3.1. To determine if the proposed combined de minimis contains sufficient modifications and safeguards to
address the EWG 17-08 concerns. The main observations from EWG 17-08 are tabulated against the relevant information supplied in the updated submission:
EWG 17-08 observation NWW regional group response
Only detailed information for the French and
Irish fleets is provided. If the intention is to
apply this de minimis to other fleets, then information on these fleets is needed.
The updated submission again presents de
minimis calculations based on all EU fleets, but
only detailed information for the French and Irish fleets is provided. It remains unclear if the de minimis is intended to cover all EU
fleets.
50
Only limited qualitative information on the
economic impact of increasing selectivity and of sorting and handling catch is provided.
No further information is provided.
The assertion that it is difficult to improve selectivity is supported, but only for the French fleets.
No further information on selectivity trials from other Member States is provided.
To avoid increasing catches by more than intended levels, de minimis exemptions are based on a percentage of the total catch of the
given species in the given fishery where the exemption is sought (i.e. a single species approach).
The new submission clarifies that in the proposed approach, the total de minimis quantity across the selected stocks would not
be exceeded (1,404 t for TR1 and 867 t for TR2).
If all species reach the 25% maximum, then the 5% overall de minimis is surpassed. With
the 25% safeguard, the de minimis percentage exemption requested is 6.25% for TR1 and 6.01% for TR2.
It is clarified that the total de minimis quantity across the selected species would not exceed
the quantity based on a 7% de minimis. STECF note that the 25% safeguard remains in the proposal, and the de minimis level has been increased to 7% (and then 6%). If all species
did reach their maximum level of discards, the requested de minimis would effectively be 8.8% for TR1 and 8.7% for TR2.
The 5% de minimis level provides only partial solution to sorting and handling challenges
when discard rates are 27.8% for TR1 and 35.5% for TR2, indicating significant selectivity
improvements are still required.
The proposed approach increases the level of de minimis (7% then 6%), this means that an
estimated 18-20% (Table 6.3_1) of the discards for each of the stocks would be
covered by the de minimis (at 7% de minimis with safeguard at 0%). It is not stated
whether this is sufficient to alleviate sorting and handling problems.
There are risks of significant discarding and increases in catches with a combined de minimis approach even with a safeguard
mechanism in place. De minimis discard quantities should be deducted from the catch opportunities arising from FMSY based catch advice. Under a combined de minimis, the
separate de minimis volume for each individual species within the combined species can only be accounted for in respective stocks TACs by
discounting the maximum possible amount of de minimis for each species that could potentially be discarded.
In agreement with EWG 17-03 the updated proposal states that for a combined de minimis exemptions, the percentage de minimis level
needs to account for the maximum possible discard volumes per stock, for each of the fisheries (TR1 or TR2), including the +25% safeguard (Table 6.3_1). In the proposal, the
total deduction from the TAC would be 2,838 tonnes for the combined de minimis, compared with 2,280 t for single species de minimis
provisions for the same three species.
STECF observes that the effect of the combined de minimis approach is to modify the
proportions of each species that can be discarded. Table 6.3_1 shows comparative data
of a 5% and 7% combined de minimis and a 5% and 7% single stock de minimis based on this proposal. The differences in catch and discard rate between species means that
with a combined de minimis, there is less whiting and cod available under a de minimis exemption and more haddock, compared with the single species approach. For example,
for TR2, 117 tonnes more haddock can be discarded under a combined de minimis, compared with 117 tonnes more whiting and cod that could be discarded under a single
51
species de minimis. Therefore, the combined de minimis approach offers an alternate
composition of discards rather than an increasing flexibility. The principle of the de minimis exemptions is to deal with difficulties in selectivity and sorting and handling, and
that all catches discarded under de minimis should be counted against quota. STECF infer from the proposal that the difficulties in selectivity and handling are more
pronounced for haddock compared to whiting and cod. However, there is no information provided to confirm this.
STECF observe that the proportion of the estimated unwanted catch (historical discards) that can be discarded under a de minimis is modified under a combined de minimis. In
this case, the amount of unwanted catches that could be discarded under a 7%
combined de minimis are 18-19% of the total for all three species in both TR1 and TR2. Therefore, around 80% of the previously unwanted catches would still have to be
landed. With the application of the maximum 25% safeguard, this increases to 22-25%, i.e. in the absence of selectivity improvements, there would still be a requirement to
land no less than 75% of previously discarded catches. In comparison, under the single species approach for the two fleets, it is estimated that 21-22% of whiting, 42-56% of
cod and 13-15% of haddock that was previously discarded, would be discarded under a de minims provision, and the remainder would have to be landed. It is not clear whether
these levels of de minimis are sufficient to mitigate the sorting and handling problems
for these fleets, or whether the small differences when applying a safeguard maximum are meaningful.

52
Table 5.3_1. Calculations to demonstrate the relative implications on discard amounts of combined de minimis set at 5% and 7% and 7%
with a 25% safeguard, and single species de minimis set at 5% and 7% for TR1 (above) and TR2 (below) Celtic Sea and Western Channel EU vessels
TR1
Species subject to the
DM
Stock Total catch (Av. 13-
16)
Av Discard rate
(13-16) (%)
Estimated unwanted catch
(historical discards)
Estimated discard share
composition
%
Weight of discard
with a 5% DM (t)
Weight of discard
with a 7% DM (t)
% of estimated discards
covered by 7% DM
Maximum discard share
based on 25% safeguard
%
Estimate of Maximum
volume under a 7% de
minimis
Max. % of estimated discards
covered by 7% DM
Max. de minimis levels
with 7% (+25%)
whiting 7e-k 7505.1 33 2484.8 33.8 339.0 474.6 19.1 42.3 593 24% 7.9%
cod 7e-k 2559.3 13 320.3 4.4 43.7 61.2 19.1 5.4 76 24% 3.0%
haddock 7b-k 9993.2 45 4546.1 61.8 620.2 868.3 19.1 77.3 1085 24% 10.9%
Total 20057.6 7351.2 100 1002.9 1404.0 19.1 1755.04
Single species approach
whiting 7e-k 7505.1 33 2484.8 33.8 375.3 525.4 21.1
cod 7e-k 2559.3 13 320.3 4.4 128.0 179.1 55.9
haddock 7b-k 9993.2 45 4546.1 61.8 499.7 699.5 15.4
Total 20057.6 7351.2 100 1002.9 1404.0 19.1

53
Table 6.3_1 cont’d
TR2
Species subject
to the DM
Stock Total catch
(Av. 13-16)
Av Discard
rate (13-16) (%)
Estimated unwanted
catch (historical discards)
Estimated discard
share composition
%
Weight of
discard with a 5% DM
(t)
Weight of
discard with a 7% DM
(t)
% of estimated
discards covered by 7% DM
Maximum discard
share based on 25%
safeguard
%
Estimate of
Maximum volume under a
7% de minimis
Max. % of estimated
discards covered by 7% DM
Max. de minimis
levels with 7% (+25%)
whiting 7e-k 7719.0 33.1 2555.6 53.0 328.2 459.4 18.0 66.31 574.8 22% 7.4%
cod 7e-k 967.1 16.6 161.0 3.6 22.5 31.6 19.6 4.55 39.4 25% 4.1%
haddock 7b-k 3697.1 52.1 1924.9 43.3 268.2 375.4 19.5 54.14 469.3 24% 12.7%
Total 12383.2 4641.5 100 619.2 866.8 18.7 1083.5
Single species approach
whiting 7e-k 7719.0 33.1 2555.6 53.0 385.9 540.3 21.1
cod 7e-k 967.1 16.6 161.0 3.6 48.4 67.7 42.1
haddock 7b-k 3697.1 52.1 1924.9 43.3 184.9 258.8 13.4
Total 12383.2 4641.5 100.0 619.2 866.8 18.7

54
STECF observes that in the proposed approach, while the total combined de minimis should not exceed 7% across the selected species, for each of those species the
maximum percentage of the total catch that could be discarded can differ substantially
from 7%. For example, up to 4.1% of the cod catch made by the TR2 fleets can be discarded while up to 12.7% of haddock can be discarded (Table 6.3_1). Therefore, while
there is a combined de minimis of 7% there is a nominal single species de minimis level of up to 12.7% with the combined species approach.
STECF observe that to enable the approach to allow sustainable fishing in line with the CFP objectives the following two conditions should be met:
1. For quota setting, the maximum possible amount of de minimis discard quantity should be deducted from the catch opportunities arising from FMSY based catch advice
for each stock. This is stated in the updated proposal and is required because the proportion contribution from each stock to the total de minimis amount would not be
known until it is fully taken. This would result in a reduction to fishing opportunities
because not all the deducted de minimis quantities can be taken to remain within the 7% de minimis limit. In the example presented, there would be a 2,838 tonne
deduction from the TACs for these species, compared with a total of 2,280 t under single species de minimis for the selected species. The additional reduction in fishing
opportunities for cod, haddock and/or whiting would be split as 351 tonnes (1755-1404) for TR1 and 217 (1083-867) tonnes for TR2 (Table 63_1). This reduction in
permitted catch, based on this example, would imply lower revenues compared with the single species approach and therefore there are economic consequences
associated with a combined de minimis. STECF notes that with the adoption of this
combined de minimis with safeguard, 25% more catch would need to be deducted from the relevant TACs compared with a single species de minimis.
2. Accurate real-time recording of discard quantities is required so that the uptake of the de minimis quantity can be constantly monitored. There would be two thresholds at
which discarding would stop, and catches would have to be retained onboard; i) when the maximum quantity for a stock (including +25% safeguard) has been discarded, ii)
when the total de minimis quantity across all selected stocks has been discarded. To identify when these thresholds are met, real-time monitoring across Member States
would be required. The inclusion of the safeguard increases the monitoring
requirement, because uptake must be monitored across Member States. At the current time, there is no mechanism in place that would enable real-time reporting of
de minimis uptake across Member States. Single species de minimis have a fixed limit and therefore, can be managed independently by each Member State.
STECF notes that in the previous submission, a 5% de minimis was requested, while this number was increased to 7% and 6% in the most recent request. STECF observe that,
based on the data provided, a 7% de minimis would enable 1,404 t of discards in TR1 for the three species combined, compared with 1,003 t from a 5% de minimis. For TR2, a
7% de minimis represents 1,005 t compared with 867 t from a 5% de minimis. There is
no explanation provided on why the proposed de minimis percentage was increased to 7% and 6% in the updated submission.
STECF conclusions
STECF concludes that to be in line with CFP objectives, the maximum possible amount of de minimis (i.e. the maximum safeguard amount) for each species that could potentially
be discarded, must be deducted from the TAC. Consequently, the deduction from the TAC

55
to account for de minimis discards is higher than for single species de minimis. There is thus a direct tradeoff between flexibility of de minimis and the precautionary TAC
deduction; in this case a 25% flexibility requires a 25% higher deduction from each stock
TAC.
STECF concludes that under a combined de minimis of 7% with 25% safeguard, the
allowed discards can be substantially more than 7% for the individual species. For example, in the proposal, for haddock catches taken by TR2, a de minimis level of up to
12.7% would be possible.
STECF concludes that the total amount of discards permitted under a combined de
minimis with a safeguard should be same as the sum of single species de minimis for the same stocks. Rather than increasing flexibility, the effect of a combined species de
minimis is to modify the relative quantities that can be discarded of the selected species. STECF is not aware of differences in handling difficulties between different species which
would justify the need for securing higher de minimis levels for some species.
STECF concludes that based on the proposal, for the three single-species de minimis provisions, around 80% of the historical discards would need to be landed (assuming no
selectivity improvements). The combined de minimis, with a 25% safeguard flexibility, does not reduce the overall amount of unwanted catches to be landed (~80%), and for
each stock >75% of historical discards would still need to be landed, demonstrating the limited benefits of this approach.
STECF concludes that the use of a safeguard requires that monitoring requirements are significantly increased to include integrated international real-time catch monitoring and
reporting, and this is not currently in place but also not likely to be achieved in the near
future.
56
5.4 Impact of exploitation pattern on MSY yields
Background provided by the Commission
Technical measures have a direct impact on the exploitation pattern on commercially
exploited stocks. This in turn has an influence in the yield that can be taken for a given level of fishing mortality. As a first exploration of the current exploitation relative to the
optimum, a scoping analysis has been done for a limited number of stocks.
Background information is provided on: https://stecf.jrc.ec.europa.eu/plen1801
Request to the STECF
Based on the ad hoc contract for the Analysis of exploitation patterns for some sample stocks, the STECF is requested to:
(i) review the methodological approaches developed and provide comment on whether
the approach would be useful for the potential development of reference points that could be used to identify current and optimal exploitation patterns.
(ii) consider how such reference points could be reconciled in a mixed fisheries context and provide comment on what biological and economic factors should be considered.
Background information is provided on: https://stecf.jrc.ec.europa.eu/plen1801
STECF comments
Theoretical effects of selectivity on yield, stock abundance and fisheries
profitability
It is a well-known result, already presented in the seminal book of Beverton and Holt (1957), that the fishing mortality that maximises the long term catch (FMSY) depends on
fisheries selectivity. Simple yield per recruit models, where selectivity is defined by a length or an age at first catch, show that one specific value of FMSY and one value of MSY
is associated to each fishing pattern (Fig. 5.4.1). In other words, the value of FMSY (and thus the limit of overfishing) depends on minimum legal sizes, mesh sizes, technical
measures, etc.
The general rule is usually as follows: the higher the age at first catch (and more
generally the older the fish targeted), the larger the value of FMSY and the MSY tonnage
itself. Simple yield per recruit models also show that the highest possible catch is theoretically obtained for an infinitely high fishing mortality or fishing effort with the age
at first catch equal to topt (or a size Lopt) where the biomass of the cohort is maximal.
Biomass or SSB per recruit models highlight an additional important point. Changing the
fisheries selectivity has a strong impact on stock abundance. Thus, the same amount of catch can be obtained with very different impacts on the fish stock biomass. In many
cases, fishing around topt (or Lopt) would not only produce higher yields but also much higher biomass at sea for the exploited stocks. Thus, managing selectivity may
contribute to restore marine ecosystem structure and resilience and to achieve several
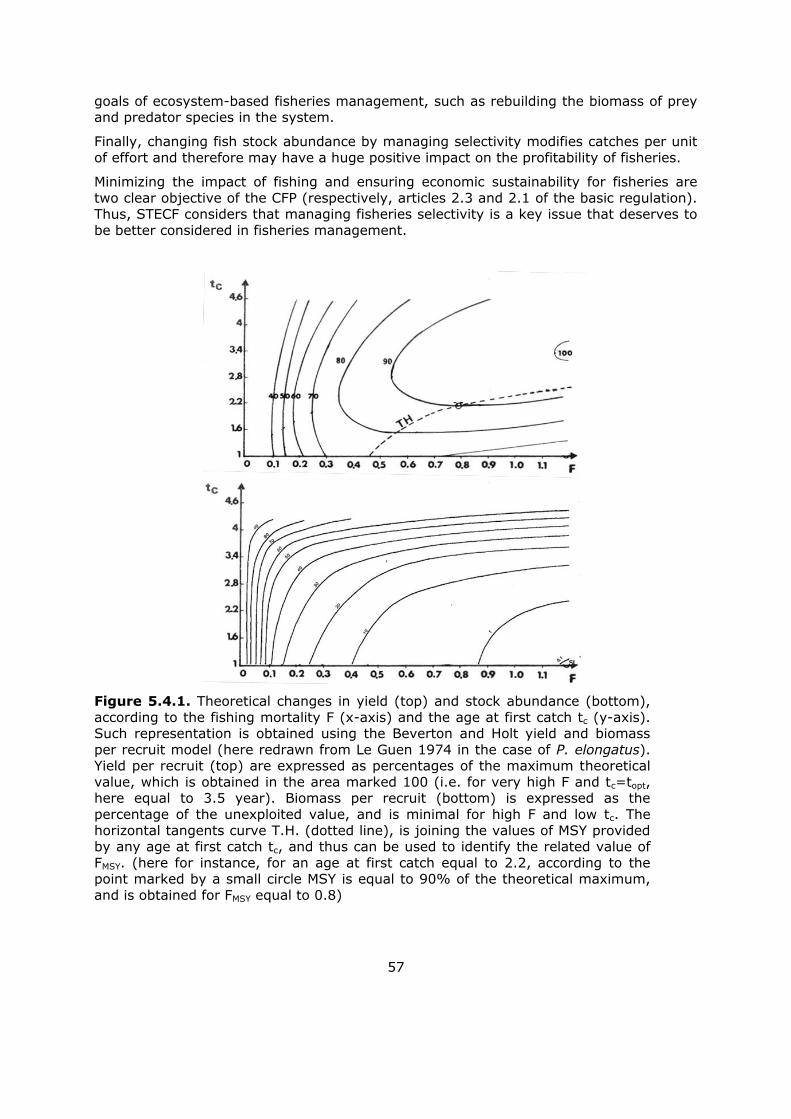
57
goals of ecosystem-based fisheries management, such as rebuilding the biomass of prey and predator species in the system.
Finally, changing fish stock abundance by managing selectivity modifies catches per unit
of effort and therefore may have a huge positive impact on the profitability of fisheries.
Minimizing the impact of fishing and ensuring economic sustainability for fisheries are
two clear objective of the CFP (respectively, articles 2.3 and 2.1 of the basic regulation). Thus, STECF considers that managing fisheries selectivity is a key issue that deserves to
be better considered in fisheries management.
Figure 5.4.1. Theoretical changes in yield (top) and stock abundance (bottom),
according to the fishing mortality F (x-axis) and the age at first catch tc (y-axis). Such representation is obtained using the Beverton and Holt yield and biomass
per recruit model (here redrawn from Le Guen 1974 in the case of P. elongatus). Yield per recruit (top) are expressed as percentages of the maximum theoretical
value, which is obtained in the area marked 100 (i.e. for very high F and tc=topt, here equal to 3.5 year). Biomass per recruit (bottom) is expressed as the
percentage of the unexploited value, and is minimal for high F and low tc. The
horizontal tangents curve T.H. (dotted line), is joining the values of MSY provided by any age at first catch tc, and thus can be used to identify the related value of
FMSY. (here for instance, for an age at first catch equal to 2.2, according to the point marked by a small circle MSY is equal to 90% of the theoretical maximum,
and is obtained for FMSY equal to 0.8)
58
Some lessons from recent case studies
Several recent publications have underlined the benefit that would result from improving
size and age selectivity in fisheries and the fact that the MSY approach calculated on the
current selectivity do not lead to an optimal catch and even less to a minimized impact on fish stocks and ecosystem. Cardinale and Hjelm (2012) showed for instance that
changing the size range of harvested cod in the Baltic, makes it possible to largely increase the yield and revenue from the fishery compared to the fishing mortality FMSY
stipulated in the management plan. Analysing a set of 36 Mediterranean fish stocks, Colloca et al. (2013) estimated that shifting the size of first capture towards the size Lopt
at which fish cohorts achieve their maximum biomass would produce on average between two and three times higher economic yields and much higher biomass at sea for
the exploited stocks.
Similar results were for instance obtained for the Atlantic cod (Diekert et al., 2010). More
generally, analysing a set of 31 North East Atlantic stocks, Vasilakopoulos et al. (2016)
showed that catching fish a year or more after they mature (combined with an intermediate exploitation rate F ≈ 0.3) promotes high sustainable yields at low levels of
stock depletion. These authors concluded that explicitly incorporating selectivity scenarios in fisheries advice would allow the identification of optimal exploitation regimes
and benefit results-based management. Based on the case study of 9 stocks from the North Sea and the Baltic, Froese et al. (2008) also argue that size matters for
ecosystem-based fisheries management and present a list of additional advantages associated with fishing at Lopt, including a minimal impact on size structure, a reduction
in the genetic selection pressure, or an increase in the stability of biomass and catch.
Based on the Beverton and Holt model and the von Bertalanffy growth equation, Froese et al (2016) established a formula to determine the length at first catch leading to a
mean length in catch equal to Lopt 1. This formula suggests that minimal legal lengths or mesh sizes should be dramatically increased for most stocks. In the case of the North
Sea cod for instance, the theoretical value of the optimal length at first catch is equal to 72 cm (see Fig. 5.4.2).
1 Based on the Beverton and Holt yield per recruit model and related equations, Froese et al. (2016) demonstrated that a length at first catch Lc_opt = L · (2+3F/M) /
[(1+F/M)(3+M/K)] results in a mean length in the catch equal to Lopt. To provide an order of magnitude, this generic equation can be simplified under the assumption of F=M and M/K=1.5. In such case, Lc_opt = 0.56·L, while Lopt = 0.67·L

59
Figure 5.4.2 Illustration of the potential effects of changing the Minimum landing
size (MLS), using the North sea cod as a case study. a) Yield per recruit relative to the theoretical maximum yield and b) Biomass per recruit relative to unexploited
biomass, for the current and for the optimal lengths at first capture. For this
stock, reducing twice the current fishing mortality while increasing MLS to Lc_opt, would lead to an increase of 30% in the catch and of 260 % in the stock
abundance (redrawn from Froese et al., 2016).
It should be underlined that in such case of an optimal selectivity pattern, there is no
realistic value of the fishing mortality that maximises the long term catch (the theoretical value of FMSY is infinity). This means that defining a management target for the
exploitation rate implies reference to other objectives or considerations rather than maximising the catch. Various candidate targets can be suggested based on empirical
ecological considerations. This includes: the F0.1 threshold (assumed to be the lower limit of full exploitation), the value F=M (take no more than nature), F50% (the fishing
mortality resulting in a stock biomass equal to half of the virgin one), while economic approaches usually refer to FMEY (the fishing mortality resulting in the maximum
economic yield) as the most appropriate target.
Main finding of the ad-hoc contract (in relation to ToR i)
The ad-hoc contract presents results from catch simulations for a selection of eight example stocks, these results are relevant in considering ToR i. A generic FLR framework
was developed, based on an age-structured per recruit analysis combined with assumptions about recruitment (i.e. using alternatively a mean recruitment or an
empirical stock-recruitment relationship). The framework was used to estimate MSY based reference points and proxies such as F0.1. A selectivity model was developed for

60
the eight species for a range of mesh sizes. Each mesh was associated with a specific length L50, used as a proxy of the length at first catch and defined as the length for which
50% of the fish are retained by the fishing gear. Then, simulations were conducted to
compare difference in stock specific MSY for the range of mesh sizes.
Simulations fully confirmed the above presented results. For all the studied
species/stocks it was found that improving the exploitation pattern through e.g. mesh size increased the expected yield, as well as value of the MSY. FMSY increases accordingly,
reaching very high (and rather unreasonable) values for the largest studied mesh sizes. Finally, the report provides estimates of the optimal length for the studied stocks,
suggesting again that from a single-species point of view, increases in the length or age at first catch (or the L50) produce very tangible benefits.
MSY FMSY
Figure 5.4.3 – Outputs of simulations for a subset of 4 stocks: values of MSY (left)
and FMSY (right) for increasing mesh sizes. Numbers on the x-axis refer to the age as

61
first catch (here defined by L50 as the age of 50% retention in the fishing gear) (From Kell, 2018)
While acknowledging that the methodological approach developed is appropriate, STECF notes that no results are provided in the report (and neither were they requested by the
ad-hoc contract ToRs) regarding the impact of the simulated mesh sizes on the stock abundance or on the fisheries profitability. Thus the report fulfils the ToRs it was given,
but does not provide the new selectivity-related biomass reference points which would have been needed by STECF to fully answer its own ToRs. This would require additional
analysis.
Practical implementation (in relation to ToR ii)
STECF was asked to consider how size-based approaches could be reconciled in a mixed
fisheries context and to provide comments on what biological and economic factors should be considered.
Two issues make it difficult to improve, in practice, the selectivity pattern of fisheries. The first one is that changing the size profile of catch toward larger fish, while often
leading to long term benefits, always implies short term losses in term of catch and profitability. As a consequence, such changes are usually feared by stakeholders, and
economically difficult to implement.
The second difficulty relates to mixed fisheries and is even more challenging. There is no
unique selection pattern which could ensure fishing each species in a mixed species
fishery according to its own optimal length Lopt. Any size-based measure such as MCRS intended to constrain the selectivity applied to each species would certainly lead to very
large unwanted (i.e. under-sized) catches.
Therefore, optimising the size profile of catches in mixed fisheries will always imply a
trade-off between species and often between fleets. Economic assessment is useful to inform the political decision process, but cannot resolve this trade off which will remain a
political decision.
This means that any attempt to change mesh sizes or MCRS should be carefully
evaluated with MSE approaches before any implementation. They should include impacts
assessment of selectivity patterns on the economic performances of fleet segments. Such an analysis could be for instance conducted at the time Multi Annual Plans are discussed.
There are various ways to improve exploitation patterns in populations using technical measures such as MCRS, minimum mesh size or selective devices, closed areas, gear
restrictions, juvenile’s protection, etc. Bearing this in mind, STECF considers that a result-based approach deserves to be promoted, developing incentives for fishermen to
improve their selectivity (and reduce unwanted catches at the same time). This would be likely to lead to a requirement to demonstrate the achievement of any exploitation
pattern targets. Such requirements would not be without cost but on the other hand
results-based approaches do provide the opportunity for fishermen to utilise their capacity for innovation in ways tailored to their specific fisheries.
In practice, targets related to selectivity should be defined on a case by case basis, taking into account trade-offs between species and fleet segments. ICES standard
procedure already provides estimates of Lopt for data poor species using the LBI (Length-Based Indicators) package. It should be recognized that for most species Lopt is far above
62
the current mean length of catch. Thus, in most fisheries, reaching an optimal selectivity is not a realistic objective on the short or even medium term. Nevertheless, using
results-based indicators (for instance the ratios between the current mean length or
mean age in catch and Lopt or topt) could be useful to assess the current selectivity performances of fisheries, to monitor or encourage selectivity improvements, or to define
intermediate targets, for instance in the frame of MAPs.
STECF notes that monitoring and managing the size profile of fishing fleets also requires
having proper mechanisms of data collection and collation in place and due recognition of the additional analysis requirements.
STECF conclusions
STECF underlines that by changing the size range of harvested fish, it is possible in most fisheries to largely increase the long term yield and profit, compared to the current
fisheries management at FMSY based on the current selectivity. Optimized fishing regimes
(including F and selectivity targets) may also ensure significant increase in fish stock abundance, thus contributing to minimize the ecosystem impacts of fishing and to
improve ecosystems resilience.
In order to progressively promote such optimized fishing regimes STECF suggests
evaluating the potential effects of changing the selectivity patterns, on catches, stocks biomass and when possible fisheries profitability.
STECF considers this question could be assessed using MSE in bio-economic multispecies models (and ecosystem models when available), for example in the framework of the
definition of MAPs or in the framework of the future CFP. Improving selectivity is a key
issue to be maintained in the dialogue with stakeholders.
There are several management measures by which selectivity could be improved.
Traditional technical measures including changes in mesh sizes, MCRS or closed areas have intended to achieve this, but have not always been successful in doing so (cf STECF
EWG 15-01). When fully enforced, the landing obligation could provide additional results-based incentives for the industry to reduce unwanted catches and thus improve
selectivity.
In order to monitor changes in selectivity, additional length-based indicators would need
to be developed. In the first instance, simple indicators could be tested on some case
study fisheries. The upcoming expert working group dedicated to the expansion of indicators used to monitor the ecosystem performances of the CFP is scheduled for the
autumn (STECF 18-15) and would provide an opportunity to address this.
References
Beverton and Holt, 1957 - On the dynamics of exploited fish populations. Fisheries
investigations series 2. Ministry of Agriculture, Fisheries and Food. London, UK.
Cardinale M., Hjelm J., 2012 - Size matters: Short term loss and long term gain in a size-
selective fishery. Marine Policy, 36: 903–906.
Colloca M., Cardinale M., Maynou F., Giannoulaki M., Scarcella G., et al., 2013 - Rebuilding Mediterranean fisheries: a new paradigm for ecological sustainability.
Fish and Fisheries, 14 : 89–109.

63
Diekert F.K., Hjermann D.O, Nævdal E., Stenseth N.C., 2010 - Spare the Young Fish: Optimal Harvesting Policies for North-East Arctic Cod. Environ Resource Eco.,
47:455–475
Froese R., Stern-Pirlot A., Winker H. and Gascuel D., 2008 - Size matters: how single-species management can contribute to ecosystem-based fisheries management.
Fisheries Research, 92 : 231–241.
Froese R., Winker H., Gascuel D., Sumaila U.S., and Pauly D., 2016 - Minimizing the
impact of fishing. Fish and Fisheries, 17: 785–802.
Kell L.T., 2018 - Impact of Exploitation pattern of MSY and the Development of Potential
Reference Points. Request for services, 1803, STECF Ad hoc Contract, 42 pp.
Le Guen 1974 - Dynamique des populations de Pseudotolithus (Fonticulus) elongatus
(Bowd, 1825), Poisson Sciaenidae. Cah. Orstom, sér. Océanogr., 9 (1): 3-84.
Vasilakopoulos P., O’Neill F.G., and Marshalll C.T., 2016 - The unfulfilled potential of
fisheries selectivity to promote sustainability. Fish and Fisheries, 17 : 399–416.

64
5.5 Review of the UK avoidance programme for picked dogfish
Background provided by the Commission
Since 2016, an amendment to the fishing opportunities for 2016 (regulation 2016/72)
and subsequent regulations have allowed for a catch avoidance programme for picked
dogfish (Squalus acanthias) by the UK. The current regulation on fishing opportunities,
2018/120, provides a derogation from the ‘Prohibited species’ listing of picked dogfish,
for UK fishing vessels participating in the catch avoidance programme to land limited
quantities of dead picked dogfish. UK has been granted an overall annual allocation of
100 tonnes, with a vessel monthly limit of 2 tonnes, to incentivise industry participation
in the programme. Based on the STECF opinions on this programme the Commission has
requested the UK to keep it informed of the results of the by-catch avoidance
programme, in order to assess its effectiveness in reaching the objectives.
Background information is provided on: https://stecf.jrc.ec.europa.eu/plen1801
Request to the STECF
STECF is requested to review the report received from UK on the catch avoidance
programme for picked dogfish (12 month progress update: interim evaluation Nov 2016-
Oct 2017) in light of the STECF opinions2, and on this basis assess whether, taking into
account the latest ICES advice on the stock3:
The programme overall contributes to the avoidance of picked dogfish in the
fisheries concerned.
The objectives of the UK bycatch avoidance programme can be or are already
being met, and what improvements can be made, especially in terms of:
o Improving the current data deficiencies.
o Increasing the knowledge on spatial aggregations of picked dogfish.
o Increasing the knowledge on discard survival.
2 https://stecf.jrc.ec.europa.eu/documents/43805/1281129/2015-11_STECF+PLEN+15-03_JRC98672.pdf, p.
50, https://stecf.jrc.ec.europa.eu/documents/43805/896390/2014-11_STECF+PLEN-14-03_JRC93037.pdf, p.
82, https://stecf.jrc.ec.europa.eu/documents/43805/662804/2013-11_STECF+PLEN+13-03_JRC86096.pdf, p.
50
3 http://www.ices.dk/sites/pub/Publication%20Reports/Advice/2016/2016/dgs-nea.pdf
65
o Facilitating the introduction of the landing obligation, including whether
such a programme offers a beneficial alternative to a Prohibited Species’
listing, to prevent ‘choke’ species under the CFP landing obligation.
In order to improve the effectiveness of the programme, and considering the seasonal
component to picked dogfish by-catch in the Celtic Sea, the UK is proposing to modify
the current 2 tonnes per month, per vessel, dead picked dogfish by-catch allowance to a
seasonal, gear specific, dead by-catch allowance (details set out in the report).
The STECF is asked to assess whether the programme, if amended in line with the
UK proposal, is considered scientifically justifiable.
Previous STECF comments on picked dogfish avoidance programs
This is the latest in a series of four related requests to STECF. For consistency and
context, previous conclusions that are relevant to the current request are summarized below:
STECF PLEN 13-03
On granting exemptions to land unintended picked dogfish by-catches, STECF PLEN 13-03 considers it will generate additional mortality and compromise the recovery of the
stock.
It may be possible to monitor long term trends in abundance of picked dogfish
using existing monitoring programmes, but due to the wide distribution, low
abundance, and low predicted rate of recovery, any change in abundance is unlikely to be detected for at least 10 years.
STECF PLEN 13-03 supports additional information collection systems, that would not increase mortality, including observer programs, remote electronic monitoring,
and skippers’ self-reporting, but exemptions to land unintended by-catches are likely to be less effective at achieving recovery of picked dogfish than maintaining
a zero TAC.
STECF PLEN 14-03 (UK programme)
The UK proposed a real-time monitoring programme using a picked dogfish bycatch quota as an incentive for skippers to participate. The proposal
incorporated reporting of by-catches by fishermen, which is validated by observer sampling, and includes agreed move-on rules to avoid areas where picked dogfish
catches were high. STECF PLEN 14-03 supported the collaborative approach and the use of an
incentive whereby good behaviour is rewarded with a landing allowance of picked
dogfish, that comes at no apparent cost to the stock. Monthly quota limits and the prohibition of quota movement was supported by
STECF to avoid the possibility of the development a targeted fishery. STECF PLEN 14-03 noted that when picked dogfish catch levels are below the
maximum monthly threshold, there may be an incentive to misreport the “lively” fish as “dead” and land those fish and increase fishing mortality by landing fish
66
that may have otherwise survived. Measures needed to avoid this include observer coverage or CCTV systems.
While the landing of dead discards would mean there should be no increase in
fishing mortality, without successful avoidance behaviour from skippers, the programme would not progress the conservation objectives for picked dogfish.
STECF PLEN 14-03 observed that it would not possible to predict the usefulness of move-on rules because it is not known whether moving from one area to a
different area will result in higher or lower incidental catches. Moreover, there were no indicators presented against which individual avoidance behaviour could
be measured. STECF PLEN 14-03 concluded that managers need to base their decision on
whether to permit the pilot to go ahead without having access to objective scientific advice.
STECF PLEN 15-03 (UK programme)
The UK undertook a pilot project on the management of picked dogfish and
proposed a full avoidance programme, based on real-time monitoring and a bycatch quota.
STECF 15-03 considered the UK proposal could potentially aid the rebuilding of the stock of picked dogfish by promoting avoidance behaviour, which may in turn lead
to reductions in fishing mortality.
STECF 15-03 considered that the main potential benefits of the proposed pilot project are in providing an incentive for participating vessels to report incidental
catches of picked dogfish and the proportions of the catch that are brought aboard dead and alive.
If operationally successful, it would require that vessels move away from areas of high incidental catch, which may result in a reduction in fishing mortality relative
to that which would occur in the absence of the programme. Picked dogfish is not included in any discard plans to implement the Landing
Obligation (Delegated Regulations), therefore vessels that do not opt into the
programme can continue discarding catches of picked dogfish, it is likely that realised catches will exceed any agreed by-catch TAC.
In order to promote a reduction in fishing mortality through discard avoidance, provisions to opt into the project should be expanded to include additional vessels
and MS.
STECF PLEN 17-02 (Ireland programme)
STECF PLEN 17-02 concluded that there was no a priori means to assess whether
implementation of the proposed programme will result in a reduction in catches of
picked dogfish (through the avoidance provisions) relative to the catches that would occur in the absence of the programme.
The programme would potentially provide detailed information on the fishing activity and catches of the participating vessels. However, any provision for the
landing of picked dogfish bycatch should include close monitoring of the stock and fisheries.
STECF PLEN 17-02 concludes that to improve the chances of meeting its objectives, further details are needed before the programme is initiated. This
includes, among others, the mechanisms to capture and exchange information on
incidental picked dogfish catches between participants and with the wider fleets

67
STECF PLEN 17-02 concludes that to investigate the trade-offs and risks to the stock and to the fishing industry for adopting different management approaches, it
is necessary to have more detailed data on catch levels.
Summary of the information provided to STECF
In the TAC 2017 regulation (European Union, 2017), picked dogfish (spurdog, Squalus
acanthias) was listed as a prohibited species (article 12). Specimens should therefore not be harmed and if caught should be released immediately, with the exception for vessels
operating in a specific area where landings up to 270 tonnes of dead picked dogfish are allowed, as long as vessels are engaged in a Members State ‘bycatch avoidance
programmes’. Furthermore, a vessel engaged in the bycatch avoidance programme may land not more than 2 tonnes per month of picked dogfish that is dead at the moment
when the fishing gear is hauled on board.
The UK is the highest TAC (270 tonnes) quota holder with 100 tonnes, followed by France
and Ireland with 83 and 53 tonnes, respectively. The UK and Ireland have ongoing spurdog bycatch avoidance programmes. No information is available from France, or
from the remaining quota holder Member States (Belgium 20 tonnes, Spain 10, Germany 4, Portugal and Netherlands 0).
STECF notes that the objective of the UK bycatch avoidance programme is, according to
the report, to “assess the feasibility of the near real-time Spurdog By-catch Avoidance
Programme as an alternative to a ‘Prohibited Species’ listing, meeting Defra’s policy need to align spurdog with the landing obligation by 2019, whilst significantly reducing dead
discards and fishing mortality, without ‘choking’ the fishery through the use of a dead spurdog by-catch allowance.”
The UK bycatch avoidance programme includes several features that advance the knowledge on spurdog biology, its fisheries and possible management measures. Such
features include, among others:
improve knowledge on spurdog finer scale abundance and spatial distribution
typology of gillnets and trawlers daily catches
use of real-time catch self-reporting and mapping system collaborative approach between stakeholder
possible applied alternatives to reduce choke effects in the Landing Obligation the applicability of incentives to foster industry participation to report incidental
catches
Although the UK bycatch avoidance programme is based on a small sample of vessels, namely three gillnets and three trawlers, some of the features listed above could be
applicable to a larger sample of vessels, to other areas or to other species. In this
context, the programme has (and could potentially) achieve (further) significant results.
STECF notes that to assess whether there has been active avoidance of picked dogfish catch or any reduction in picked dogfish mortality during the UK bycatch avoidance

68
programme, the report refers to a comparison made between past and the recorded fishing activity and picked dogfish distribution in the programme in two ways:
Comparison 1 - between the fishing activity on the two first months, where
skippers were not provided risk maps, and the remaining duration of the project (Table 5.5.1 & 2)
Comparison 2 - between past annual fishing activity maps (for gillnetters only) and the activity during the programme (Figure 5.5.1).
Table 5.5.1. Proportion of cells fished by risk status in November-December 2016.
Advisory information was not communicated to the skippers during this period.
Table 5.5.2. Risk of spurdog bycatch in grid cell days available to be fished and cell days that were fished by participating vessels in the first 10 months that RAG advisory maps
were issued in the spurdog bycatch avoidance programme (January-October 2017).

69
Figure 5.5.1. Similarities and differences in fishing activity by the three participating gill
netters between November 2016 – October 2017 compared with fishing activity by the
same vessels in November 2011 – October 2016. (purple – cell fished in “both” periods; pink – cells fished only between November 2016 – October 2017; yellow – cell fished
only in November 2011 – October 2016)
Based on the above results the report concludes that “preliminary evidence indicates avoidance of red (high risk of significant spurdog by-catch) and amber (medium risk of
significant spurdog by-catch) cells, with no more than 5% of cell days fished by any vessel in red or amber risk cells”. However, it also states that these results were also
partly a reflection of the limited red and amber cell days available.
70
STECF comments
STECF does not see much evidence of the statement from the report regarding observed
changes in fishing behavior and thus in the level of picked dogfish catch relative to that
which would occur in the absence of the programme. STECF notes no obvious changes in fishing patterns between the first two months and the rest of the project (comparison 1;
similar % levels of high and amber risk cells fished) or between the cells fished in the past and during the project (comparison 2, no obvious predominance of pink cells).
STECF also notes that of the 60 tonnes of bycatch allowance given to the 6 vessels to land dead picked dogfish for the duration of the programme, subject to a 2 tonnes
maximum monthly threshold per vessel, only 38 tonnes in total were landed. However, the 60 tonnes were sufficient to cover the dead catches of picked dogfish during the
whole programme, but because catches were almost exclusively limited to the winter months, the maximum monthly threshold has in effect, limited the overall quota uptake
by the participating vessels. However, the programme was not set up in a landing
obligation scenario, so the vessels were allowed to continue discard dead catches after the bycatch allowance was reached. As such this limitation on landing quota uptake did
not result in a strong incentive to avoid catches.
STECF also notes that, in line with previous observations (STECF PLEN 14-03), when
picked dogfish catch levels are below the maximum monthly threshold, there may be an incentive for skippers to either: a) misreport the “lively” fish as “dead” and land those
fish thereby increasing fishing mortality by landing fish that may otherwise have survived; or, as documented in the report of the UK bycatch avoidance programme, on
one occasion, b) to continue fishing in high risk areas to take up the permitted monthly 2
tonnes dead-catch limit.
Such issues are of particularly importance if the maximum monthly threshold is changed,
as proposed. The UK proposal is to retain the 60 tonnes annual bycatch limit, but to permit vessels to retain and land up to 5 tonnes per month between October and April
and 1 tonne per month between May and September for gillnetters and the opposite for trawlers. In doing so, and if such practices occur, there is a risk that fishing mortality will
increase as the variable monthly threshold will not necessarily match the monthly unavoidable dead picked dogfish catch
On the other hand, and noting the programme results that “partial overlap between the
spatial abundance of tagged picked dogfish and commercial gillnet vessels occurs throughout all seasons, but most notably in autumn”, higher unavoidable dead picked
dogfish catches do occur and are likely to continue to occur in autumn/winter. If the threshold objective is to avoid “choking” the fishery in a landing obligation scenario by
accounting for unavoidable dead picked dogfish catches, but still incentivizing avoidance of catches, then a seasonal change with a variable monthly limit is justifiable. However, if
the maximum level of that threshold is set consistent with present bycatch levels, there will be little incentive to avoid catches. As STECF PLEN 14-03 noted, while the landing of
dead discards would mean there should be no increase in fishing mortality, without
successful avoidance behaviour from skippers, the programme would not progress the conservation objectives for picked dogfish.
STECF notes that considering the status of the picked dogfish stock and their biology and life strategy, the main objectives of any picked dogfish bycatch avoidance programme
should be to reduce mortality by firstly reduce or eliminate contact with fishing gears, secondly to improve the survival of live discards, and only after to allow for the landing
and commercialization of unavoidable dead picked dogfish catches. These objectives prioritizations should be clear in any programme.

71
Finally, STECF notes that the proposal to continue the programme while introducing an
obligation for skippers to report the reasons why they chose to fish a high or medium risk
cell, together with the associated AIS/VMS and Remote Electronic Monitoring would provide information that may prove useful in attempting to understand and evaluate the
fishing decision-making and behavior. However, project improvements will necessary have to include also a limitation on allowed catches, namely that when the monthly
threshold is reached the vessels is not allowed to continue fishing and discarding.
STECF conclusions
STECF notes that the UK bycatch avoidance program has several objectives and provides
useful information on challenges linked to the management of valuable sensitive bycatch that go beyond the focus of the UK fisheries catching picked dogfish, and in particularly,
in providing practical answers to some of the challenges of the Landing Obligation.
ToR 1. The programme overall contributes to the avoidance of picked dogfish in
the fisheries concerned
STECF concludes that there is little evidence that UK bycatch avoidance programme has
resulted in a reduction in catches of picked dogfish (through the avoidance provisions) relative to the catches that would occur in the absence of the programme. This is likely
the result that when the bycatch allowance is reached the vessels are allowed to continue discarding dead picked dogfish catches.
ToR 2. The objectives of the UK bycatch avoidance programme can be or are already being met, and what improvements can be made especially in terms of:
o Improving the current data deficiencies.
o Increasing the knowledge on spatial aggregations of picked dogfish.
o Increasing the knowledge on discard survival.
o Facilitating the introduction of the landing obligation, including whether
such a programme offers a beneficial alternative to a Prohibited Species’ listing, to prevent ‘choke’ species under the CFP landing obligation.
STECF concludes that although the avoidance objectives may not have been achieved, the project has provided useful and new information on a number of aspects, such as
increasing knowledge of picked dogfish abundance and distribution, finer scale catch data, real-time reporting system.
Regarding the facilitating the introduction of the LO, STECF concludes that without running the programme in an actual LO scenario including choke mechanisms, i.e. that
when the bycatch allowance is reached the vessels would not be allowed to continue fishing and discard dead catches, the programme offers very little insight whether the
avoidance objective can be reached.

72
ToR3. Assess whether the programme, if amended in line with the UK proposal, is considered scientifically justifiable
STECF notes that the proposed amendment of changing the seasonal monthly threshold by gear corresponds to the present catch levels (landings + discards) of the 6 vessels
engaged. STECF concludes therefore that the amended UK bycatch avoidance programme may not incentivize the avoidance of catches and thus will not progress the
conservation objectives for picked dogfish. Furthermore, (monthly) landing threshold can provide disincentives for avoidance when picked dogfish catch levels are below the
threshold.
STECF notes that the project has the potential to suggest areas and seasons of high
probability of picked dogfish encounter. Fishing away from these areas and seasons may results in effective avoidance of picked dogfish catches. STECF therefore suggest that in
the next phase of the project and before a decision is made on the management of
picked dogfish from 2019 onwards, the programme continues but that when the bycatch allowance is reached the vessels would not be allowed to continue fishing and discarding
dead catches.

73
5.6 Skipjack HCR
Background provided by the Commission
Resolution 16/02 'On harvest control rules for Skipjack tuna in the IOTC Area of
Competence" provides the pre-agreed framework based on depletion reference points including a mechanism to calculate the total annual catch limit on the basis of the
following formula:
I x Etarg x SSBcurr
Where
- I is the fishing intensity, in percentage, for alternative levels of estimated stock status (SSBcurr/SSBo) where SSBo is the estimate of the unfished spawning stock biomass
- E targ is the estimate of the equilibrium exploitation rate associated with sustaining the
stock at SSBtarg
- SSBcurr is the estimate of the current spawning stock biomass
At the recent 20th Scientific Committee the application of the agreed HCR and related
formula provides a total annual catch limit of 470,020 t valid over the next 3-year period 2018-2020.
Request to the STECF
STECF is requested:
- to provide the adaptation of the abovementioned formula with a view to take into
account the estimated current exploitable biomass instead of only the current spawning stock biomass. The scientific information underpinning such adaptation shall be provided
and commented as required
- to calculate the annual catch limit if the abovementioned formula was applied to the
estimated exploitable biomass instead of only the current spawning stock biomass
- to provide an updated overview of the HCR performance indicators on status, safety,
yield, abundance and stability
- to provide an estimate of the likely difference in the economic value between the two catch limits by taking into account, inter alia, the possible price elasticity and other
changes that may affect the market
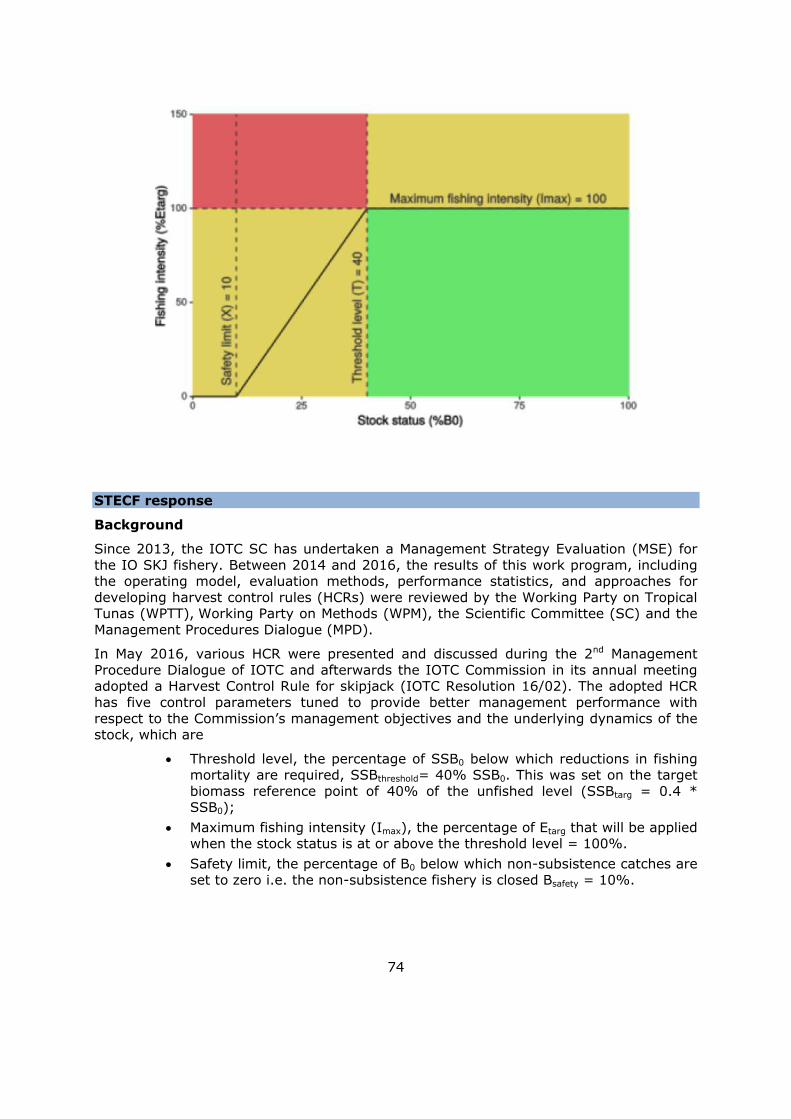
74
STECF response
Background
Since 2013, the IOTC SC has undertaken a Management Strategy Evaluation (MSE) for
the IO SKJ fishery. Between 2014 and 2016, the results of this work program, including the operating model, evaluation methods, performance statistics, and approaches for
developing harvest control rules (HCRs) were reviewed by the Working Party on Tropical Tunas (WPTT), Working Party on Methods (WPM), the Scientific Committee (SC) and the
Management Procedures Dialogue (MPD).
In May 2016, various HCR were presented and discussed during the 2nd Management
Procedure Dialogue of IOTC and afterwards the IOTC Commission in its annual meeting adopted a Harvest Control Rule for skipjack (IOTC Resolution 16/02). The adopted HCR
has five control parameters tuned to provide better management performance with
respect to the Commission’s management objectives and the underlying dynamics of the stock, which are
Threshold level, the percentage of SSB0 below which reductions in fishing mortality are required, SSBthreshold= 40% SSB0. This was set on the target
biomass reference point of 40% of the unfished level (SSBtarg = 0.4 * SSB0);
Maximum fishing intensity (Imax), the percentage of Etarg that will be applied when the stock status is at or above the threshold level = 100%.
Safety limit, the percentage of B0 below which non-subsistence catches are
set to zero i.e. the non-subsistence fishery is closed Bsafety = 10%.

75
Maximum catch limit (Cmax), the maximum recommended catch limit = 900,000t. This value is based upon the estimated upper limit of the MSY
range in the 2014 Skipjack stock assessment.
Maximum change in catch limit (Dmax), the maximum percentage change in the catch limit = 30% from year to year.
The adopted HCR seeks to maintain the skipjack tuna stock biomass at, or above, the
target reference point while avoiding the biomass limit reference point, which is the biomass of 20% of the unfished level (SSBlim = 0.2*SSB0). Note that the biomass limit
reference point (0.2*SSB0) is different to the Safety limit of the HCR (0.1*SSB0).
The adopted Harvest Control Rule (HCR) specifies that the skipjack tuna stock
assessment shall be conducted every three years, with the first application of the HCR based on the 2017 stock assessment. The skipjack tuna HCR then provides a total annual
catch limit using three different values estimated from each skipjack stock assessment.
For each value, the reported median from the reference case adopted by the Scientific Committee shall be used. These values are:
The estimate of current spawning stock biomass (SSBcurr);
The estimate of the unfished spawning stock biomass (SSB0);
The estimate of the equilibrium exploitation rate (Etarg) associated with sustaining the stock at SSBtarg.
And the total annual catch limit is calculated using the following:
If the current spawning biomass (SSBcurr) is estimated to be at or above the threshold spawning biomass i.e., SSBcurr >= 0.4*SSB0, then the catch
limit shall be set at [ Imax * Etarg * SSBcurr ]
If the current spawning biomass (SSBcurr) is estimated to be below the
threshold biomass i.e, SSBcurr < 0.4*B0, but greater than the safety limit i.e., 0.1*SSB0, then the catch limit shall be set at [ I * Etarg * SSBcurr]. See
Table of Appendix 1 of Resolution 16/02 for values of fishing intensity (I)
for specific SSBcurr.
If the spawning biomass is estimated to be below the safety limit, i.e.
SSBcurr < 0.1*SSB0 then the catch limit shall be at 0 for all fisheries other than subsistence fisheries.
The STECF notes that 2017 IOTC Scientific Committee applied the HCR to advice a total
annual catch limit for 2018-2020 using the following values estimated from the 2017 skipjack stock assessment. For each value, the reported median from the reference grid
adopted by the Scientific Committee for advising the Commission is used:
The median of SSB2016/SSB0 = 0.40; The estimate median of current spawning stock biomass (SSBcurr) is
796,660 tons; The estimate of the equilibrium exploitation rate associated with sustaining
the stock at SSBtarg is Etarg = 0,59;
76
As current spawning biomass (SSBcurr) is estimated to be at or above the threshold spawning biomass i.e., SSBcurr >= 0.4*SSB0, then the fishing
intensity parameter (I) corresponds to Imax (1);
Therefore, according to Resolution 16/02, the catch limit is calculated as [ Imax * Etarg *
Bcurr] = 1 * 0.59 * 796,660 t. which results in an annual overall catch limit of 470,029 t for the period 2018-2020.
The STECF notes the catch of skipjack in the Indian Ocean was 446,000 tonnes in 2016, which is below the overall catch limit adopted for 2018-2020 period.
STECF notes that Resolution 12/06 also includes provisions to develop a workplan to review the adopted HCR using Management Strategy Evaluation (MSE), including (i) the
refinement of operating models, (ii) alternative management procedures and (iii) performance statistics; no later than 2021 (i.e. five years from its implementation).
STECF observations
1: Adaptation of HCR to consider exploitable biomass instead of SSB
The STECF notes that the only change to the current HCR would be to replace the SSB by the exploitable biomass (Bexp) in the catch limit calculation and, therefore, the skipjack tuna HCR would recommend a total annual catch limit using four (4) values estimated from each skipjack stock assessment, as follows:
If SSBcurr => 0.4*SSB0, then the catch limit is set at [ Imax * Etarg * Bexp]
If SSBcurr < 0.4*SSB0 but > 0.1*SSB0, then the catch limit is set at [ I *
Etarg * Bexp].
If SSBcurr < 0.1*SSB0 then the catch limit shall be at 0 for all fisheries
other than subsistence fisheries.
The STECF notes that the skipjack fisheries in the Indian Ocean exploit mainly, but not only, the spawning stock population as fish selected by the fishery are already mature
due to fast growth and early maturation of skipjack. Thus, exploitable biomass is around
7 % larger than Spawning Stock Biomass. The STECF notes that the basis of using exploitable biomass in the HCR is to use as an indicator the biomass that will be affected
by the equilibrium exploitation rate associated with sustaining the stock at SSBtarget.
Calculation of the annual catch limit when using exploitable biomass HCR
The STECF notes following values were estimated in the 2017 skipjack stock assessment:
o The median of SB2016/SB0 = 0.40; o The median estimate of current exploitable biomass (Bexp) is 853,922 tons;
o The estimate of the equilibrium exploitation rate associated with sustaining
the stock at Btarg is Etarg = 0,59; o As SSBcurr >= 0.4*SSB0, then the fishing intensity parameter (I)
corresponds to Imax (1);
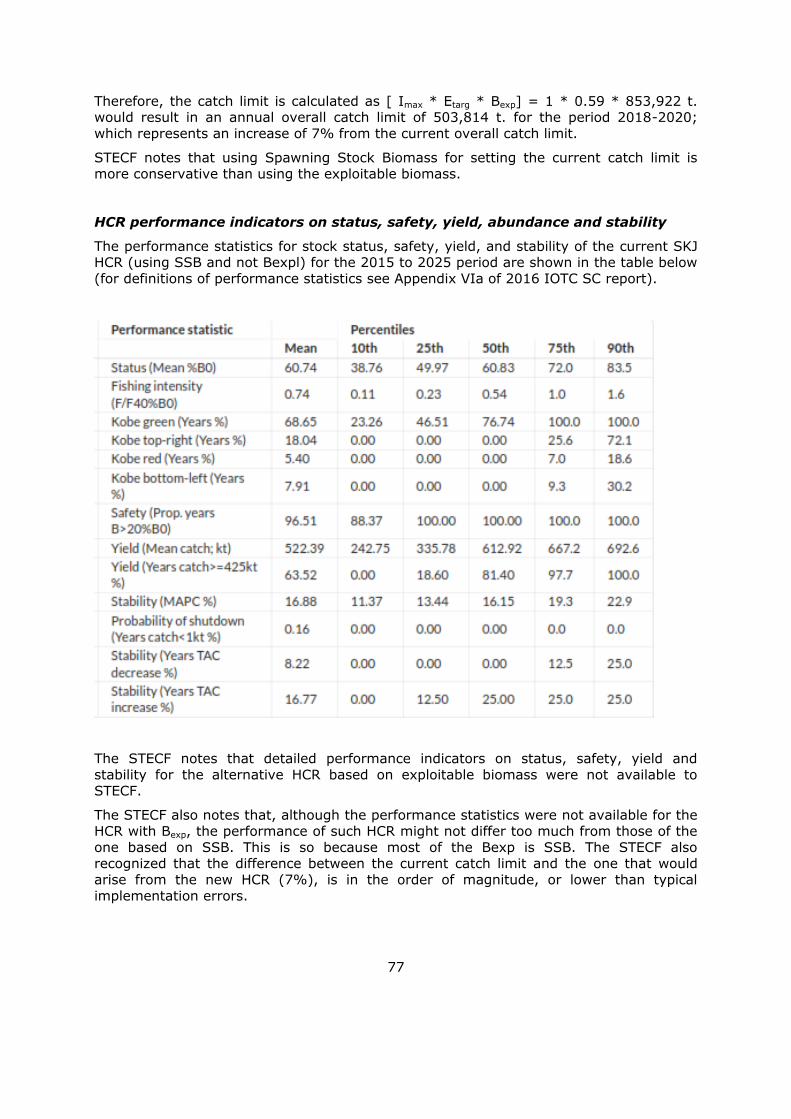
77
Therefore, the catch limit is calculated as [ Imax * Etarg * Bexp] = 1 * 0.59 * 853,922 t. would result in an annual overall catch limit of 503,814 t. for the period 2018-2020;
which represents an increase of 7% from the current overall catch limit.
STECF notes that using Spawning Stock Biomass for setting the current catch limit is more conservative than using the exploitable biomass.
HCR performance indicators on status, safety, yield, abundance and stability
The performance statistics for stock status, safety, yield, and stability of the current SKJ HCR (using SSB and not Bexpl) for the 2015 to 2025 period are shown in the table below
(for definitions of performance statistics see Appendix VIa of 2016 IOTC SC report).
The STECF notes that detailed performance indicators on status, safety, yield and
stability for the alternative HCR based on exploitable biomass were not available to STECF.
The STECF also notes that, although the performance statistics were not available for the HCR with Bexp, the performance of such HCR might not differ too much from those of the
one based on SSB. This is so because most of the Bexp is SSB. The STECF also recognized that the difference between the current catch limit and the one that would
arise from the new HCR (7%), is in the order of magnitude, or lower than typical
implementation errors.

78
However, it would be necessary to confirm this by reviewing the performance statistics of the new HCR as, for example, including younger ages in the catch calculation of the HCR
could likely to make it more variable due to larger recruitment variability in those ages.
The same level of risk as the current HCR would be obtained by setting a more conservative catch strategy in an HCR based on Bexpl . Therefore, the STECF
recommends that before any amendment to the current HCR is proposed, the performance statistics of updated HCR should be made available to assure the
sustainability of the stock.
Difference in the economic value between the two catch limits
In order to analyse the economic consequences of the change in the adopted harvest
control rule, STECF observes that the 2016 catch of SKJ in the Indian Ocean is 446,895 tons, which is lower than the 2016 overall catch limit of 470,029 tonnes. Thus, it is
expected that neither the current catch limit nor the “new” catch limit will affect
immediately the EU Purse seiner fleet activity, unless there are changes in for instance costs, sales prices or technology, giving the fleets incentive to catch more skipjack tuna.
STECF observes that if the current overall catch limit is 100% utilised, this will imply an increase in catches of 23,000 tonnes compared to 2016. Under the new catch limit of
504,000 tonnes, this will imply a potential further increase in catches of 34,000 tonnes. Thus, assuming 100% utilisation of the TAC with the HCR, catches of skipjack tuna can
be increased by up to 57,000 tonnes in total.
STECF notes that the contribution of European Purse seiners (PS) to the total catch of
skipjack was 24 % in 2016 (IOTC, 2017)4. Thus, the EU fleet could potentially increase
its catches 5,520 tons with the current overall catch limit and 13,680 tons with the “new” overall catch limit.
STECF observes that the average monthly price of skipjack tuna from April 2016 to
September 2017 was 1,504 Euro per tonnes with the lowest price in June 2016 of 1,245 Euro and the highest price in July 2017 of 1,701 Euro
(https://www.undercurrentnews.com/prices/#/skipjackBKK). Using the average price implies that the total catch value of skipjack tuna can be increased with 86 million Euro,
where 35 million Euro is due using the current TAC, and the remaining 51 million Euro due to the increased catch possibilities under the HCR. This corresponds the total value
of EU PS skipjack could be increased with 20.6 million Euros, where 8.3 million Euro is due to the current overall catch limit and the remaining 12.3 million Euro due to the
increased catch possibilities under the new HCR for the EU PS fleet.
STECF observes that such an increased activity would result also in increased costs. Using the cost structure of the Spanish, Italian and French purse seiners catching fish in
the Other Fishing Regions (OFR) supra region, the variable costs per landed Euro was
4 IOTC–SC20 2017. Report of the 20th Session of the IOTC Scientific Committee. Seychelles, 30 November – 4
December 2017. IOTC–2017–SC20–R[E]: 232 pp.
79
0.65 Euro on average for the years 2013-2015 (STECF 17-12)5. The remaining 0.35 Euro
covers non-variable costs, depreciation and any profits for the owners.
Based on the cost figures above, an increase in catch value of 20.6 million Euro for the
European PS will, if it can be caught by the current fleet, give rise to an increase of costs comprising in total 13.4 million Euro, Thus resulting in increased profits before non-
variable costs and depreciation costs of 7.2 million Euro, amounting to approximately an increase of 1.3% compared to the average of 2013-2015.
Regarding potential effects on the market for skipjack tuna, STECF observes that the
market for skipjack tuna is considered global, with much bigger volumes of skipjack being caught in the Western Central Pacific Ocean (around two million tonnes). Thus, any
potential market/price effects should be considered in relation to this global market.
STECF conclusions
STECF concludes that the considerations made here should be taken into account when
the first revision of the adopted skipjack HCR Resolution takes place no later than 2021. IOTC has indicated its commitment to extend the current resolution from an HCR to a full
Management Procedures (MP), which will require a new evaluation and tuning exercise of
alternative MP.
Adaptation of HCR to consider exploitable biomass instead of SSB
STECF notes that skipjack fisheries in the Indian Ocean exploit mainly, but not only, the
spawning stock population as most fish selected by the fisheries are already mature due to fast growth and early maturation of skipjack. Thus, exploitable biomass is around 7 %
larger than Spawning Stock Biomass. The STECF concludes that the basis of using exploitable biomass in the HCR is to use as an indicator the biomass that will be affected
by the equilibrium exploitation rate associated with sustaining the stock at SSBtarget.
The shift of the HCR parameters to use exploitable biomass will require a revision of the performance of the HCR. STECF notes that to obtain an equivalent risk levels to those of
the current HCR, the shift to exploitable biomass will require an update of other HCR parameters, which could easily deliver similar catch levels.
STECF further notes that differences between total biomass, exploitable biomass and SSB are taken into account in the simulation testing of the HCR to set the catch limit, and, as
long as the HCR was proven to deliver the policy objectives, the differences between biomass aggregations should not greatly affect the HCR performance.
5 Scientific, Technical and Economic Committee for Fisheries (STECF) – The 2017 Annual Economic Report on
the EU Fishing Fleet (STECF-17-12). Publications Office of the European Union, Luxembourg, 2017,
ISBN 978-92-79-73426-7, doi:10.2760/36154, PUBSY No. JRC107883

80
Calculation of the annual catch limit when using exploitable biomass HCR
The STECF estimates an overall catch limit of 503,814 t. for the period 2018-2020 when
the SKJ HCR is applied using exploitable biomass instead of spawning stock biomass;
which represents an increase of 7% from the current overall catch limit (470,000 t.).
HCR performance indicators on status, safety, yield, abundance and stability
Detailed performance indicators on status, safety, yield and stability for a HCR based on
exploitable biomass were not available to STECF. STECF considers however that the performance of such HCR is likely to be reasonably close to the performance of the
currently adopted HCR. Nevertheless, the STECF concludes that before any amendment to the current HCR is proposed, the performance statistics of any updated HCR should be
made available to assure the sustainability of the stock.
Difference in the economic value between the two catch limits
STECF concludes that any increase in the catches of skipjack tuna, following by utilising the current TAC 100% and also the increased potential catches following the HCR, can
increase the profits of the European PS fleet with 6.9 million Euro for and will most likely not have any impact on the global market price of skipjack tuna.
The STECF notes that this is a mixed fishery also catching juvenile yellowfin, which is currently overfished. Thus, the effect of skipjack catch increase may have in other
species would need to be considered by IOTC before any recommendation of catch increase is proposed.

81
5.7 Preparation for the EWG on mandatory surveys
Background provided by the Commission
Member States regularly conduct research surveys of marine fish resources to provide
fundamental data for assessing the condition of exploited fish stocks and for monitoring general conditions of the marine ecosystem. A number of these surveys are included in
the Data Collection Framework (DCF) and have been and are being consequently supported financially by direct management (2002-2013) and EMFF (2014-2020). The list
of mandatory research surveys at sea (Appendix IX of the Multiannual Community Programme6) was first reviewed in 2007 (SGRN 07-017). This meeting was followed by
two other EWGs (SGRN 09-048 which developed the TORs and roadmap for SGRN 10-039). However, the resulting 2010 STECF recommendations did not lead to modifications
in the legal framework of 201110, because the specific elements were incorporated in the
National Programmes of Member States. The ensuing legal revisions of the DCF (roll over 2014-201611 and current EU MAP12) have kept the original list of surveys intact, as
reviewed in 2007.
STECF recommended that surveys should be subject to frequent evaluation (at least once every 5 years). An EWG was originally called to revise the existing research surveys
listed in Table 10 of the EU MAP in 2017, but this was subsequently moved to May 2018, in order to allow for proper preparation. Since then, Regional Coordination Groups
(RCGs) and Member States have been compiling information on current and future
6 COM Decision of 6 November 2008 adopting a multiannual Community programme pursuant to Council
Regulation (EC) No 199/2008 establishing a Community framework for the collection, management and use of
data in the fisheries sector and support for scientific advice regarding the common fisheries policy
7 Scientific, Technical and Economic Committee for Fisheries (STECF). Report of the Working Group on
Research Needs: Review of list of surveys at sea (Appendix XIV OF EU Commission Regulation N°1581/2004)
with their priorities (SGRN 07-01), Brussels, 12-16 February 2007.
8 Scientific, Technical and Economic Committee for Fisheries (STECF) Framework and a Roadmap for the
Review of Surveys. Report of the Subgroup on Research Needs (SGECA/SGRN 09-04) Joint Subgroup on
Economic Affairs (SGECA) and on Research Needs (SGRN) of the Scientific, Technical and Economic Committee
for Fisheries (STECF), 07-11 December 2009, Hamburg.
9 Scientific, Technical and Economic Committee for Fisheries (STECF). Sub-Group on Research Needs: SGRN
10-03. Review of needs related to surveys. 4-8 October 2010, Brussels, Belgium.
10 COM Decision of 18 December 2009 adopting a multiannual Community programme for the collection,
management and use of data in the fisheries sector for the period 2011-2013.
11 COM Implementing Decision of 13.8.2013 extending the multiannual Union programme for the collection,
management and use of data in the fisheries sector for the period 2011-2013 to the period 2014-2016.
12 COM Implementing Decision (EU) 2016/1251 of 12 July 2016 adopting a multiannual Union programme for
the collection, management and use of data in the fisheries and aquaculture sectors for the period 2017-2019.
82
surveys, naming conventions and coordinating with main end users (ICES). This preparatory work is not yet finalised and/or consistent across all sea basins. In addition,
STECF has recommended that criteria, scoring rules and criteria weightings for evaluating
the surveys should be adopted and approved by the STECF before the surveys review meeting (as was the case in 2010). The STECF work carried out in 2009/2010 needs to
be updated, if one takes into account (i) the new regulatory DCF framework (Recast13, EU MAP) that has been adopted recently (2016-2017), in which specific requirements
should be met, (ii) new management needs and (ii) the experience gained by Member States, the priorities that have changed and the science that has advanced.
In view of the above, there is a clear need to change the scope of EWG 18-04 from
conducting a review of surveys into a scoping meeting. This will also allow for Member State and end user consultation between the proposed scoping meeting in May and the
actual review of surveys (tbd).
Request to the STECF
STECF is requested:
- to assess the proposed plan of action: change of EWG 18-04 into a scoping meeting,
in order to prepare for the review of surveys; propose timeline for next steps, leading
to an EWG that will revise the list of research surveys
- to critically discuss the draft TORs of EWG 18-04
- to discuss composition of EWG 18-04, ensuring both adequate regional coverage and
independence, as well as possible added value of keeping the same composition for
the EWG on the revision of surveys
- to discuss the need for any preparatory work before EWG 18-04
STECF observations
Assessment of proposed plan of action
13 Regulation (EU) 2017/1004 of the European Parliament and of the Council of 17 May 2017 on the
establishment of a Union framework for the collection, management and use of data in the fisheries sector and
support for scientific advice regarding the common fisheries policy and repealing Council Regulation (EC) No
199/2008 (recast).

83
STECF observes that the preparation of the review of mandatory research surveys-at-sea under the Data Collection Framework has not progressed sufficiently to allow a full review
of surveys with the necessary information basis at the EWG 18-04 meeting scheduled for
14-18 May 2018.
Considering the relatively short time left until the EWG 18-04, STECF acknowledges the
proposed change in direction of the EWG from the originally foreseen review of surveys to a scoping meeting, setting the framework and procedures for the actual survey
review.
Timeline for next steps towards survey review
STECF would like to draw the attention to the preparation process of the latest survey
review conducted by STECF in 2009-2010 and suggests applying a similar timeline as proposed by SGRN 09-04 (endorsed by STECF Plenary 10-01). STECF considers that the
steps towards the survey review should again include the collation of required detailed
background information, the review of that information on a regional level (Regional Coordination Groups), by Member States, data end-users and the Commission. STECF
suggests that all feedback from the involved parties should be compiled in a consistent manner into updated background information for the full STECF survey review. A detailed
STECF proposal for steps to be followed until the survey review is given below under "STECF conclusions".
ToRs of EWG 18-04
STECF considers that all elements needed for a scoping meeting on the DCF survey
review have been provided in the Commission proposal for ToRs for the EWG 18-04. Minor editorial suggestions for re-structuring the ToRs have been provided in a separate
document.
Composition of EWG 18-04
STECF suggests that the composition of experts (and observers) of the EWG 18-04
should account for coverage of all regions (relevant sea basins) and expertise needed, such as fish stock assessment and advice, survey design and statistical aspects,
ecosystem and environmental monitoring.
Need for preparatory work before EWG 18-04
STECF considers that the ToRs for the EWG 18-04 are published soon after this Plenary meeting and experts be invited soon. STECF is aware of continued efforts of ICES as one
of the main data end-users to check the use of DCF surveys in the advice and suggests that this work is concluded before EWG 18-04.
STECF conclusions
Assessment of proposed plan of action
STECF concludes that the EWG 18-04 should be held as a scoping meeting, setting the framework and procedures for the actual survey review.

84
Timeline for next steps towards survey review
STECF concludes that a similar timeline as in 2010 should be used:
Action Responsible Before
Finalise checking surveys against use in the
advice, prepared by ICES
ICES EWG 18-04
Gather background information on surveys in the Mediterranean, Black Sea and ICCAT region
from the RCG Med&BS and RCG on Large Pelagics
RCG Med&BS and RCG LP chairs
EWG 18-04
Agree on criteria, ToRs, roadmap and
preparation needed for the survey review
EWG 18-04 end of May 2018
Endorse EWG 18-04 report STECF PLEN 18-02 mid-July 2018
Send request for consistent information on
surveys (template to fill in) to MS
EC mid-July 2018
Fill out the template on survey information and send to RCGs
MS end of Aug 2018
Compile the survey information from MS by
region
RCGs end of Sep 2018
Compile survey information for all regions Liaison Meeting Oct 2018
Send compiled survey information to MS and end-users for final checks
EC end of Oct 2018
Provide final updated background information on surveys to survey review meeting
EC end of 2018
Review group meeting (EWG 19-XX) STECF early 2019
Report survey review to STECF Plenary EWG 19-XX chair April 2019
ToRs of EWG 18-04
STECF agrees with the Commission proposal for ToRs for the EWG 18-04. Minor editorial
suggestions for re-structuring the ToRs have been provided in a separate document,
applying 'track-changes' (Annex ?).
Composition of EWG 18-04
STECF concludes that the composition of experts (and observers) of the EWG 18-04
should account for coverage of all regions (relevant sea basins) and expertise needed, such as fish stock assessment and advice, survey design and statistical aspects,
ecosystem and environmental monitoring.
The composition of experts (and observers) for the actual survey review, however,
should be discussed by the EWG 18-04 and should contain a similar fraction of external
(non-EU) experts as SGRN 10-03.
85
Need for preparatory work before EWG 18-04
STECF concludes that the ToRs for the EWG 18-04 should be published as soon as
possible and the experts be invited soon. STECF suggests that the Commission asks ICES as one of the main data end-users to conclude the checking of the use of DCF surveys in
the advice before the EWG 18-04. For the surveys in the Mediterranean and Black Sea region, as well as the ICCAT region, STECF suggests that the RCG Med&BS and RCG LP
(chairs) provide information on the use of surveys for advice.

86
5.8 Evaluation of Italian national management plans for demersal
stocks in GSA 9, 10, 11, 16, 17-18 and 19
Background provided by the Commission
Under Article 19 of Council Regulation (EC) No 1967/2006 (hereafter referred to as
"MEDREG"14), Member States are expected to adopt management plans for fisheries
conducted by trawl nets, boats seines, shore seines, surrounding nets and dredges within
their territorial waters.
In 2013, the Common Fisheries Policy (CFP15) introduced new elements for conservation
such as the target of maximum sustainable yield (MSY) for all the stocks by 2020 at the
latest, the landing obligation and the regionalisation approach.
In line with these two regulations, the plans shall be based on scientific, technical and
economic advice, and shall contain conservation measures to restore and maintain fish
stocks above levels capable of producing maximum sustainable yield or MSY. Where
targets relating to the MSY (e.g. fishing mortality at MSY) cannot be determined, owing
to insufficient data, the plans shall provide for measures based on the precautionary
approach, ensuring at least a comparable degree of conservation of the relevant stocks.
The plans shall also contain specific conservation measures based on the ecosystem
approach to achieve the objectives set. In particular, they may incorporate any measure
included in the following list to limit fishing mortality and the environmental impact of
fishing activities: limiting catches, fixing the number and type of fishing vessels
authorized to fish, limiting fishing effort, adopting technical measures (structure of
fishing gears, fishing practices, areas/period of fishing restriction, minimum size,
reduction of impact of fishing activities on marine ecosystems and non-target species),
establishing incentives to promote more selective fisheries, conduct pilot projects on
alternative types of fishing management techniques, etc.
14 Council Regulation (EC) No 1967/2006 of 21 December 2006 concerning management measures for the
sustainable exploitation of fishery resources in the Mediterranean Sea, amending Regulation (EEC) No
2847/93 and repealing Regulation (EC) No 1626/94. OJ L 409, 30.12.2006, p. 11–85.
15 Regulation (EU) No 1380/2013 of the European Parliament and of the Council of 11 December 2013 on the
Common Fisheries Policy, amending Council Regulations (EC) No 1954/2003 and (EC) No 1224/2009
and repealing Council Regulations (EC) No 2371/2002 and (EC) No 639/2004 and Council Decision
2004/585/EC. OJ L 354, 28.12.2013, p. 22–61.
87
In 2011, Italy submitted consolidated management plans for demersal fisheries to the
European Commission (EC). Since 2018 Italy is without national management plans for
demersal fisheries and in January 2018, Italy submitted new management plan which
should be examined by the STECF. The 6 new plans cover the following areas: GSA 9,
10, 11, 16, 17-18 and 19.
Background information is provided on: https://stecf.jrc.ec.europa.eu/plen1801
Request to the STECF
1) To assess and advice whether the management plans for marine commercial fishing in the territorial waters of the Republic of Italy contains adequate elements in terms
of:
The description of the fisheries
- Recent and historical data on catches (landings and discards) of the species
concerned, fishing effort and abundance indices such as catch-per-unit-effort (or CPUE).
- Data on length-frequency distribution of the catches, with particular reference to the species subject to minimum sizes in accordance with Annex III of the
MEDREG.
- An updated state of the exploited resources.
- Information on economic indicators, including the profitability of the fisheries.
Objectives, safeguards and conservation/technical measures
- Objectives consistent with article 2 of the CFP and quantifiable targets, such as
fishing mortality rates and total biomass.
- Measures proportionate to the objectives, the targets and the expected time
frame.
- Safeguards to ensure that quantifiable targets are met, as well as remedial
actions, where needed, including situations where the deteriorating quality of data or non-availability places the sustainability of the main stocks of the fishery at
risk.
- Other conservation measures, in particular measures to fully monitor catches of the target species, to gradually eliminate discards and to minimise the negative
impact of fishing on the ecosystem.
Other aspects
- Quantifiable indicators for periodic monitoring and assessment of progress in achieving the objectives of the plan.
- Evaluate if the stock assessment basis is scientifically robust. For example some assessments underlying the management plan in GSA 17-18 are similar to those
being evaluated by PLEN 18-01 emerging from STECF EWG 17-15 Med
assessment part II.
88
2) If deemed necessary, provide any recommendations and guidance on how to obtain improved scientific/technical supporting material for the plan. This could be done in
terms of collection of data, evaluation of the status of the target stocks, evaluation of
conservation measures, impact on the marine ecosystem and monitoring programme.
Documentation: The management plan for the fleets targeting demersal stocks in GSA
9 (ITA-EN),10(ITA-EN machine translation),11(ITA-EN machine translation),16(ITA-EN machine translation),17-18 (ITA-EN) and 19 (ITA-EN ) in the territorial waters of the
Republic of Italy (ENG).
Summary of the background documents provided to STECF
Six Italian Management Plans (MPs) for the fleets targeting demersal resources were
submitted to STECF-PLEN 18-01. The plans are presented by GSA: GSA 9 Ligurian and North Tyrrhenian, GSA 10 Southern and Central Tyrrhenian, GSA 11 Sardinia, GSA 16
Southern Sicily, GSA 17-18 Northern - Southern Adriatic, and GSA 19 Western Ionian Sea.
According to the stated objectives, the MPs aim to recover stocks to within safe biological limits by 2020, in line with Reg. EU 1380/2013. STECF notes that according to Reg.
1380/2013, recovery to within safe biological limits is not necessarily in line with the objective of achieving FMSY. STECF is of the understanding that it is the FMSY objective that
is referred to in the stated aims of the MPs.
All six MPs are organized in the same way. The selection of the stocks, which will be used for the characterization of the overall status of the demersal resources, is based on the
availability of stock assessments, and fleet segments are those that fish at least 2% of the landings of the selected stocks. The stock assessments that were used were those
available at the time the MPs were prepared. This means that the term ‘current situation’ in the MPs corresponds to the situation in 2015 for most of the stock assessments
considered. The number of selected stocks varies from two in GSA 16 to five in GSA 9. The number of bottom trawl and small-scale fleet segments considered varies from 5 in
GSAs 16 to 14 in GSA 17-18.
The selected stocks were the following: HKE Merluccius merluccius, DPS Parapenaeus longirostris, MUT Mullus barbatus, MUR Mullus surmuletus and NEP Nephrops norvegicus
in GSA 9; HKE Merluccius merluccius, DPS Parapenaeus longirostris and MUT Mullus barbatus in GSA 10; HKE Merluccius merluccius, MUT Mullus barbatus and ARS
Aristaeomorpha foliacea in GSA 11; DPS Parapenaeus longirostris and HKE Merluccius merluccius in GSA16; HKE Merluccius merluccius, DPS Parapenaeus longirostris, SOL
Solea solea and MUT Mullus barbatus in GSA 17-18; and HKE Merluccius merluccius, DPS Parapenaeus longirostris and ARS Aristaeomorpha foliacea in GSA 19.
The MPs include detailed information on many aspects essential to understanding the
fishing activity in each GSA. However, no data on catches (landings and discards) or species-specific effort are provided. Abundance indices such as catch-per-unit-of-effort
(CPUE) are presented for only a very limited number of stocks. Data on length-frequency distribution of the catches, with particular reference to the species subject to minimum
landing size in accordance with Annex III of the MEDREG are not considered in the MPs.

89
The description of the fishing activity and fishing areas includes the regulations in force; the biology of the target species; the physical and oceanographic characteristics of GSAs
(currents, biocenosis, bathymetry, morphology); the description of the fishing activity
(fishing fleets, spatial distribution of the trawl fishing effort expressed in fishing hours, with no differentiation among segments,, activity by season expressed in fishing days);
cost trends by fleet segment; biomass trends (MEDITS) for a limited number of stocks; landings trends of the so called associated species; and prices and market dynamics.
Biological reference points are given for the selected stocks. Harvest control rules are proposed, and these are the same for all areas, species and stocks.
An overall reduction of fishing capacity by 5% through a decommissioning scheme was adopted in the frame of the MPs in force for the period 2011-17. Future fishing effort
reductions through reductions of fishing days, not through reduction of fishing capacity, is proposed in the submitted MPs:
2018: no change and the quantification of fishing days in that period will be used as the
baseline of the plan. 2019: 5 % reduction of fishing days compared to 2018 level;
2020: 10 % reduction of fishing days compared to in 2018 level.
Four scenarios were considered to assess the likely consequences of the application of
different levels of fishing effort (fishing days) measures in the selected stocks and the corresponding socio-economic consequences. The scenarios considered were the
following:
Scenario 0: Status quo (F constant over the period 2016 – 2023)
Scenario 1: fishing days reduction by 5% each year over the period 2017 - 2020
Scenario 2: fishing days reduction by 15% each year over the period 2017 – 2020 Scenario 3: fishing days reduction to meet FMSY by 2020
The implementation of the plans will be managed through a structure of governance
organized in each GSA, with the participation of all involved stakeholders. The functions of this structure include management, control and monitoring.
STECF comments
ToR 1: The STECF evaluation of whether the management plans for demersal fishing of
the territorial waters of the Republic of Italy contains adequate elements is given in the table below for each of the 6 MPs.

90
ToR 1) To assess and advice whether the management plans for marine commercial fishing in the territorial waters of the Republic of Italy contains adequate elements in terms of:
Description of the fisheries
Recent and historical data on catches (landings and discards) of the species concerned, fishing effort and abundance indices such as catch-per-unit-effort (or CPUE). Comments
GSA 9
Data on landings are available only for the selected and for a short list of the so called associated species.
No data on discards are presented.
Fishing effort is given by AER fleet segment but not the transversal data by métier.
Abundance indices (MEDITS) are presented only for the associated species, and not for the
selected species.
CPUE based on the commercial catches are not presented.
The five selected stocks represent less than 25% of the demersal fleets’
landings.
GSA 10
The same as in GSA 9 The three selected stocks about 8%
of the demersal fleets’ landings.
GSA 11
The same as in GSA 9 The three selected species represented
around 30% and 16 % of the total landings of the segments concerned in 2004 and 2015 respectively.
GSA 16
The same as in GSA 9 The two selected species represented in 2015-2016 around 50% of the total
production of demersal fisheries in the
Strait of Sicily. Note that DPS is not fished by small-scale fishing and more than 90% of HKE landings corresponds

91
to trawl.
GSA 17-18
The same as in GSA 9 The four selected stocks represent about 25% of the demersal fleets’ landings.
GSA 19
The same as in GSA 9 The three selected stocks represent less than 15% of the demersal fleets’
landings.
Data on length-frequency distribution of the catches, with particular reference to the species subject to
minimum sizes in accordance with Annex III of the MEDREG. Comments
All GSAs
No data on length frequency distributions of the species subject to minimum sizes is presented,
neither for Annex III nor for the selected species.
An updated state of the exploited resources. Comments
GSA 9
The stock assessment information derives from assessments performed in 2016-2017 within the GFCM and STECF EWG, with 2015 as the most recent year with available data.
GSA 10
No recent stock assessment was available and therefore the selected species were assessed with XSA, using as input catch data (landings+discards) over 2007-2015 and MEDITS data for tuning.
GSA 11
No stock assessment was available and therefore the selected species were assessed with XSA, using as input catch data (landings+discards) over 2007-2015 and MEDITS data for tuning.
GSA 16
Stocks assessments of hake and white shrimp for combined GSAs 12 to 16. Reporting period 2007-2015 (SAC-GFCM, 2016).
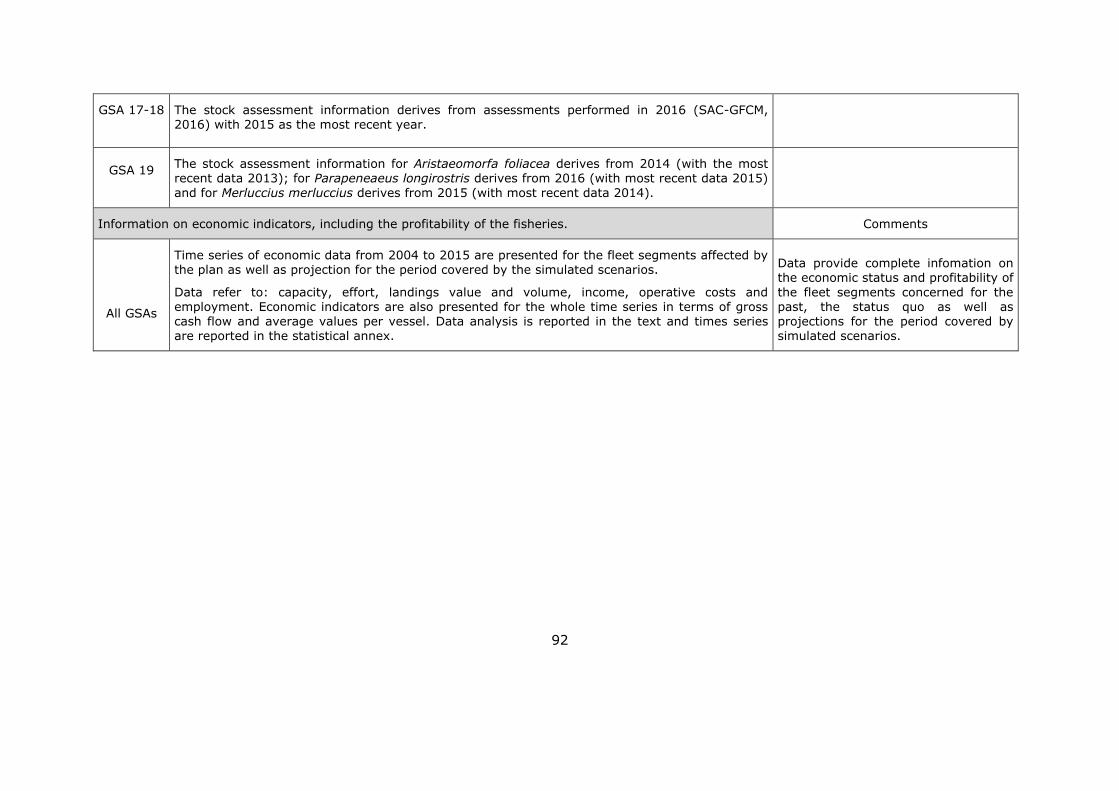
92
GSA 17-18
The stock assessment information derives from assessments performed in 2016 (SAC-GFCM, 2016) with 2015 as the most recent year.
GSA 19
The stock assessment information for Aristaeomorfa foliacea derives from 2014 (with the most recent data 2013); for Parapeneaeus longirostris derives from 2016 (with most recent data 2015)
and for Merluccius merluccius derives from 2015 (with most recent data 2014).
Information on economic indicators, including the profitability of the fisheries. Comments
All GSAs
Time series of economic data from 2004 to 2015 are presented for the fleet segments affected by the plan as well as projection for the period covered by the simulated scenarios.
Data refer to: capacity, effort, landings value and volume, income, operative costs and employment. Economic indicators are also presented for the whole time series in terms of gross
cash flow and average values per vessel. Data analysis is reported in the text and times series are reported in the statistical annex.
Data provide complete infomation on the economic status and profitability of
the fleet segments concerned for the past, the status quo as well as
projections for the period covered by simulated scenarios.

93
Objectives, safeguards and conservation/technical measures
Objectives consistent with article 2 of the CFP and quantifiable targets, such as fishing mortality
rates and total biomass. Comments
GSA 9
The plan states that it aims achieving MSY and at an improvement in SSB by reducing the exploitation rate (measured for the pool of selected species) from the current level
to a level that meets the sustainability standards set in art. 2 of the CFP but it is clear how catches will be reduced to reach this objectives. The HCR stated is a 5% reduction
of fishing effort in 2019 and 2020
No limits for F are proposed. No catch limits are proposed. No Biomass limits are proposed.
The HCR has been assessed through scenarios 0 (status quo)
to 3 (fishing at FMSY). Scenario 1 assumes reductions of 5% by year
and shows that FMSY cannot be
reached by 2020. According to scenario 3, the effort reduction
should be 74%
GSA 10
The same as in GSA 9
According to scenario 3, the effort
reduction should be by 78%
GSA 11
The same as in GSA 9 According to scenario 3, the effort
reduction should be by 75%
GSA 16
The same as in GSA 9 According to scenario 3, the effort
reduction should be by 75% for
HKE and 30% for DPS
GSA 17-
18
The same as in GSA 9 According to scenario 3, the effort
reduction should be by 57%; by 25% for SOL

94
GSA 19
The same as in GSA 9 According to scenario 3, the effort reduction should be by 80%
Measures proportionate to the objectives, the targets and the expected time frame. Comments
GSA 9
A general reduction of fishing effort (fishing days) is proposed based on the quantified
fishing days in 2018, which will be by 5% in 2019 and by 10% in 2020, for all fleet segments. Measures are not proportionate to the objectives for the selected stocks, as
shown in the projections results.
Only in the case of DPS
Parapenaeus longirostris and MUR Mullus surmuletus, the current F is
currently consistent with FMSY and hence the objective can be
considered already reached. For other assessed species, especially
for hake and red mullet, the current F is too high and is
unlikely to reach adequate rates
with the proposed measures of effort reduction and associated
technical measures
GSA 10
The same as in GSA 9
Only in the case of MUT Mullus barbatus, the current F is currently
consistent with FMSY and hence the objective can be considered
already reached. For other species, especially for hake and
rose shrimp, the current F is too high and is unlikely to reach
adequate rates with the proposed
measures of effort reduction and

95
associated technical measures
GSA 11
The same as in GSA 9
GSA 16
The same as in GSA 9
GSA 17-
18
The same as in GSA 9
Only MUT Mullus barbatus in GSA
18 meet objectives by performing the proposed measure
GSA 19
The same as in GSA 9
Safeguards to ensure that quantifiable targets are met, as well as remedial actions, where needed, including situations where the deteriorating quality of data or non-availability places the
sustainability of the main stocks of the fishery at risk. Comments
All GSA
s
HCRs are proposed, which include remedial actions in the case that fishing mortality remains largely over FMSY. HCRs have been proposed in line with GFCM (2014). These
are limit reference points for 2020 and 2023: F/FMSY ≤ 1.66 and SSB or survey index ≥ 66 percentile along the time series. In such case fishing effort will be reduced by 33%
compared to the previous year.
This HCR are the same for all GSAs and stocks. The data used come from the DCF. No
measures proposed in case of deteriorating quality of data.
No measure is described to
ensure that the FMSY objective is met for all stocks. So it is unclear
which actions will be undertaken if F/FMSY remains between 1 and
1.66 in 2020.

96
Other conservation measures, in particular measures to fully monitor catches of the target species,
to gradually eliminate discards and to minimize the negative impact of fishing on the ecosystem. Comments
GSA 9
No particular measures proposed to fully monitor catches of the target species, to gradually eliminate discards and to minimize the negative impact of fishing on the
ecosystem. Some new areas of limited size are proposed where fishing would be not allowed in the future. The need of implementation of new fishing techniques aimed at
reducing discards is mentioned, with no further details. The discard plans in place are not mentioned
Five Biological Protection zones are proposed
GSA 10
The same as in GSA 9 No new areas of protection proposed
GSA 11
The same as in GSA 9 Three Active Biological Protection
zones implemented, closed to trawl and with limitations for the
small-scale fishing (Gulfs of Cagliari, Palmas and Oristano). To
these, MPAs, sites of Community importance (SCI) and of special
protection (SPA) and areas subject
to military uses will be added (no further details as for the
implementation of the new areas)
GSA 16
The same as in GSA 9 Resolution REC.CM-GFCM/40/2016/4 of GFCM adopted
a MP for hake and deep-water rose
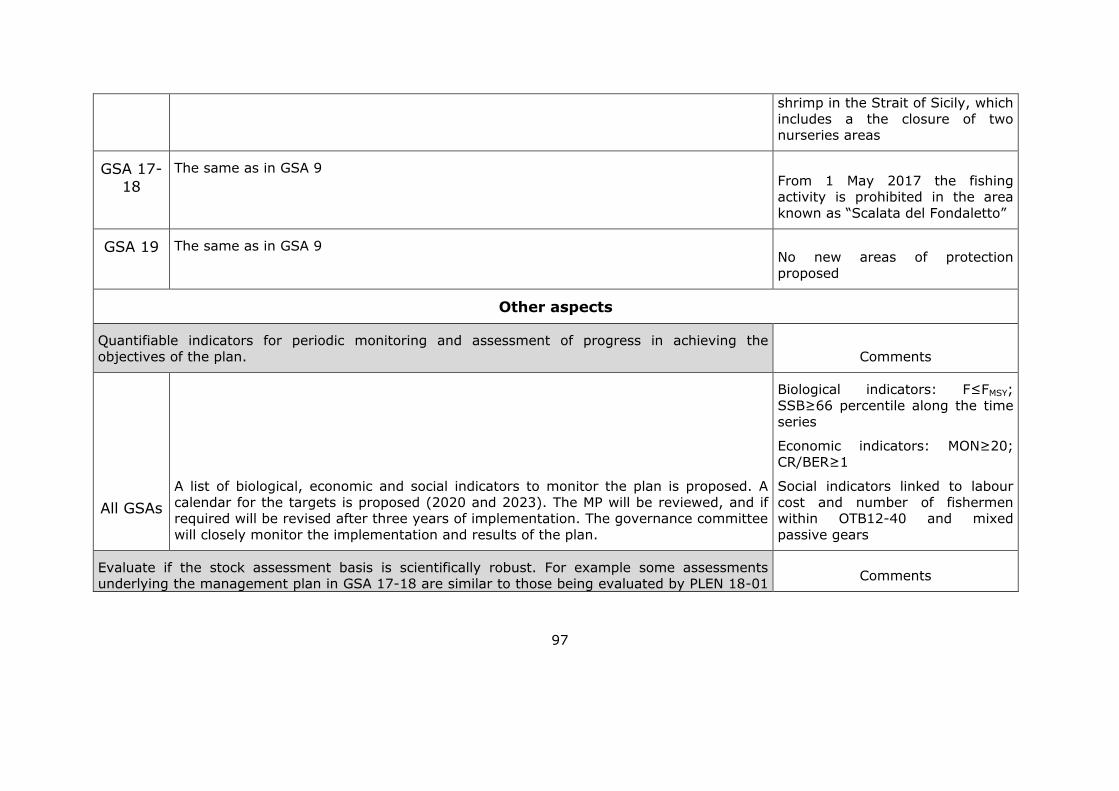
97
shrimp in the Strait of Sicily, which
includes a the closure of two nurseries areas
GSA 17-
18
The same as in GSA 9 From 1 May 2017 the fishing activity is prohibited in the area
known as “Scalata del Fondaletto”
GSA 19
The same as in GSA 9 No new areas of protection
proposed
Other aspects
Quantifiable indicators for periodic monitoring and assessment of progress in achieving the
objectives of the plan. Comments
All GSAs
A list of biological, economic and social indicators to monitor the plan is proposed. A
calendar for the targets is proposed (2020 and 2023). The MP will be reviewed, and if required will be revised after three years of implementation. The governance committee
will closely monitor the implementation and results of the plan.
Biological indicators: F≤FMSY;
SSB≥66 percentile along the time
series
Economic indicators: MON≥20;
CR/BER≥1
Social indicators linked to labour
cost and number of fishermen within OTB12-40 and mixed
passive gears
Evaluate if the stock assessment basis is scientifically robust. For example some assessments underlying the management plan in GSA 17-18 are similar to those being evaluated by PLEN 18-01
Comments

98
emerging from STECF EWG 17-15 Med assessment part II.
All GSAs
The MPs were based on the most recent stock assessments at the time (GFCM-WGSAD
or STECF-EWGs) of the preparation of the plan.
The species selected are not fully representative of the fisheries included in the MP. It
would be advisable to include more information on the status of other stocks in the MP. The most recent stock assessments from STECF EWG 17-15 should be taken into
account for adjusting reference points and the needed measures.
STECF comments that the
governance committee should make use of new stock
assessments as soon as some become available, for example the
ones from 17-15
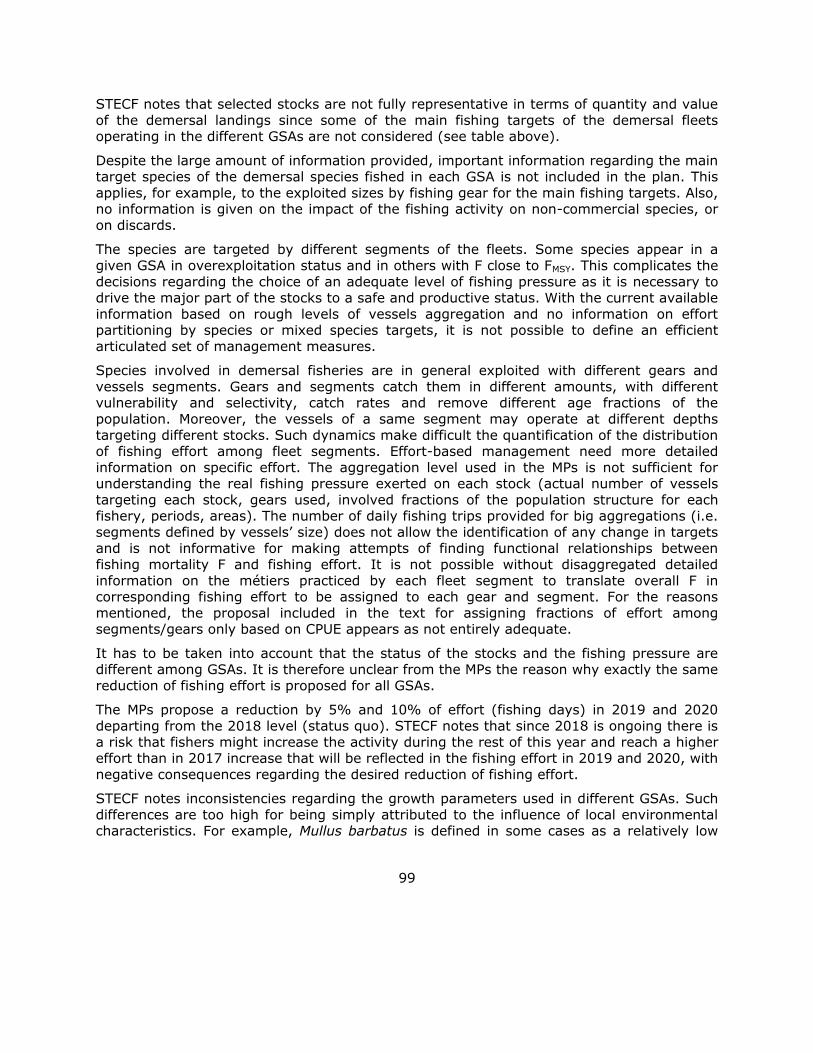
99
STECF notes that selected stocks are not fully representative in terms of quantity and value
of the demersal landings since some of the main fishing targets of the demersal fleets operating in the different GSAs are not considered (see table above).
Despite the large amount of information provided, important information regarding the main target species of the demersal species fished in each GSA is not included in the plan. This
applies, for example, to the exploited sizes by fishing gear for the main fishing targets. Also, no information is given on the impact of the fishing activity on non-commercial species, or
on discards.
The species are targeted by different segments of the fleets. Some species appear in a
given GSA in overexploitation status and in others with F close to FMSY. This complicates the
decisions regarding the choice of an adequate level of fishing pressure as it is necessary to drive the major part of the stocks to a safe and productive status. With the current available
information based on rough levels of vessels aggregation and no information on effort partitioning by species or mixed species targets, it is not possible to define an efficient
articulated set of management measures.
Species involved in demersal fisheries are in general exploited with different gears and
vessels segments. Gears and segments catch them in different amounts, with different vulnerability and selectivity, catch rates and remove different age fractions of the
population. Moreover, the vessels of a same segment may operate at different depths
targeting different stocks. Such dynamics make difficult the quantification of the distribution of fishing effort among fleet segments. Effort-based management need more detailed
information on specific effort. The aggregation level used in the MPs is not sufficient for understanding the real fishing pressure exerted on each stock (actual number of vessels
targeting each stock, gears used, involved fractions of the population structure for each fishery, periods, areas). The number of daily fishing trips provided for big aggregations (i.e.
segments defined by vessels’ size) does not allow the identification of any change in targets and is not informative for making attempts of finding functional relationships between
fishing mortality F and fishing effort. It is not possible without disaggregated detailed
information on the métiers practiced by each fleet segment to translate overall F in corresponding fishing effort to be assigned to each gear and segment. For the reasons
mentioned, the proposal included in the text for assigning fractions of effort among segments/gears only based on CPUE appears as not entirely adequate.
It has to be taken into account that the status of the stocks and the fishing pressure are different among GSAs. It is therefore unclear from the MPs the reason why exactly the same
reduction of fishing effort is proposed for all GSAs.
The MPs propose a reduction by 5% and 10% of effort (fishing days) in 2019 and 2020
departing from the 2018 level (status quo). STECF notes that since 2018 is ongoing there is
a risk that fishers might increase the activity during the rest of this year and reach a higher effort than in 2017 increase that will be reflected in the fishing effort in 2019 and 2020, with
negative consequences regarding the desired reduction of fishing effort.
STECF notes inconsistencies regarding the growth parameters used in different GSAs. Such
differences are too high for being simply attributed to the influence of local environmental characteristics. For example, Mullus barbatus is defined in some cases as a relatively low
100
growing species while in others as very fast growing (von Bertalanffy’s K value varied from
0.24 in GSA 10 to 0.6 in GSA 9, two adjacent GSAs).
ToR 2) If deemed necessary, provide any recommendations and guidance on how to obtain improved scientific/technical supporting material for the plan. This could
be done in terms of collection of data, evaluation of the status of the target stocks, evaluation of conservation measures, impact on the marine ecosystem and
monitoring programme.
STECF notes that the stock assessments used in the MPs correspond in the majority of the
cases to a single GSA, while it can be that some stocks are shared by more than one GSA and/or country. In the future, the MPs should take in consideration the stock boundaries
and corresponding GSAs, countries and fishing fleets.
The selected species used as a basis for the elaboration of a MP should represent a major
part of the stocks involved in the fisheries that are the target of the MP. The presented MPs are based on a very limited number of stocks which are considered as representative of the
mixed species complex that characterise most of the demersal fisheries in the areas. Those stocks, with the exception of GSA 16 (around 50%), accounted for a relatively low amount
of the total landings of the demersal fleets.
The description of quantitative and qualitative structure of the catch of the concerned fishing fleets (landings and discards), by year, season and fishing area, should be part of
the MP. In addition, if possible, this information should be presented by métier.
Several scenarios are assessed, and their likely biological and economic consequences are
shown for each GSA. Assessments do not show for all the GSAs equal perceptions of the current exploitation status of their stocks, and simulations indicate that different levels of
reduction of fishing pressure should be needed for reaching the same objectives. However, independently of the perception of the status of the assessed stocks within each GSA and
changes under alternative management choices, the proposal of reductions in effort is the
exactly same for all the GSAs. The proposed measures of effort reduction in terms of fishing days (5% in 2019 and 10% in 2020 in relation to the fishing days quantified in 2018) for
most of the stocks considered will not meet the objectives of CFP art. 2 in 2020.
The MP does not include information on the current impact of the different demersal gears
on the ecosystem nor on the improvements resulting from the introduction of technical measures aimed at the reduction of discards.
STECF conclusions
STECF considers that the main issue is that the Management Plans have no probability of
reaching their stated objectives or achieving FMSY. According to the simulations presented effort reductions should be decreased by 75-80% in most of the GSAs in order to achieve
FMSY in 2020.

101
STECF acknowledges that the six MPs were presented following the same structure, which facilitated their revision and the comparison among plans. Effort were made to bring
together a lot of information. In particular, the progresses made in the socio-economic analyses and the simulations showing the pros and cons of different levels of effort
reduction, as well as the proposal for a governance structure for the implementation of the MPs, with participation of all the involved sectors, administrations and stakeholders, is
acknowledged.
The MPs are based on a small number of stocks within each GSA and the selection was done
depending on the availability of a recent stock assessment. The selected stocks may not be fully representative of the catch of different demersal fleets operating in a given area nor on
the status of the other stocks under the current level of fishing pressure. In particular, the selected species are mainly target of the bottom trawl fleet. Therefore STECF suggests the
inclusion of more stocks, taking also into account the small-scale fishing so that the selected stocks are representative of the overall demersal fishing. Whenever a formal stock
assessment is not feasible for more stocks, STECF recommends the use of all the information potentially useful for a perception of their status of exploitation and for giving
advice on other stocks status (abundance indices, mean size in the catch, etc.).
Information on discards of commercial stocks, in particular those subject to minimum sizes in accordance with Annex III of the MEDREG, as well as on the catch of non-commercial
species, by fleet, are not included in the MP. This is information should be an important component of a MP. The proposal for the reduction of fishing effort in the MPs applies in the
same way to all fleet segments. Nevertheless, for the decision on the allocation of fishing effort, which may result on consequences on F quite different, information on the length-
frequencies distributions by fleet segment and on specific fishing effort should be taken into account.
Finally, STECF highlights again the need to approach management at a more regional scale
rather than for the individual GSAs. Work is ongoing to establish a multi-annual plan for the fisheries exploiting demersal stocks in the western Mediterranean Sea, and STECF
underlines any national or local MP as those evaluated here should be framed consistently with this regional approach.
102
5.9 Evaluation of the quality of DCF data for data limited information
Background provided by the Commission
DG MARE issued an ad-hoc contract to Mr Francesco Ferretti in December 2017. The
purpose of this contract was to obtain summary information to be used to identify stocks with promising or unpromising data for future work. The objective was to check for
consistency of data in terms of availability, and sampling, and the potential for significant changes in time that might provide useful signals. The contractor was requested to
concentrate on demersal data for stocks of general interest. The ToRs of the ad-hoc contract
are as given below.
ToRs of the ad hoc contract to evaluate quality of DCF data for data limited information
The purpose of this contract is to obtain summary information to be used to identify stocks with promising or unpromising data for future work. The objective would be to check for
consistency of data in terms of availability, and sampling, and the potential for significant changes in time that might provide useful signals. The proposal is to concentrate on
demersal data for stocks of general interest. Two types of DCF data should be evaluated,
survey data and catch data.
Survey evaluation: MEDITS survey by species by GSA presented on no more than one
page per species/ GSA; this should be based on annually tabulated summary data in a simple data frame (in R) and then output in plots on a single page, combined with some
overall statistics for the data set for a species in a GSA.
Annual summary stats for each species for each year calculate and tabulate and plot.
DCF calls for TA file (hauls), TB (catch by species and haul), TC (length, sex and maturity by target species). Analysis on biomass and density indexes should be possible for all the
species caught during the survey (based on the TB file in the DataCall) while the length
analysis can be carried out only for target species (TC file in the DataCall). For example in TB file GSA9 for year (2015) reported data for 270 species and for 63 in TC file and
obviously not for all these species we have enough information to do anything. The following should be stored in a data frame and plotted:
Total number of trawl stations by year;
Proportion of positive stations by year;
Mean and CV of (standardized) catch abundance (including zero values) by year;
Mean and CV of (standardized) catch weight (including zero values) by year;
Min. max and mean day in year of survey data by year (or 5, 50, 95%).
For species with length data (TC data file):
103
5, 50 and 95% on fish length caught by year;
Mean and CV of (standardized) mature catch abundance (including zero values) by
year;
Mean and CV of (standardized) mature catch weight (including zero values) by year.
Age based evaluation based on deterministic length slicing using VBGF from the Data Call biological file. In addition for a limited number of species and limited years age data has
been collected since 2012 for some target species (Hake, Red mullet, Striped red mullet) and stored in TE MEDITS file. This should be used if available:-
Matrix plot of n at age at age in year y with n at age a+1 in year y+1
Series Summary statistics across all years
Autocorrelation coefficient on mean abundance (1st order);
Autocorrelation coefficient on mean catch weight (1st order);
Autocorrelation coefficient on mean time (1st order);
Fraction of years with the mean abundance outside median of mean values +-2CV;
Fraction of years with the mean biomass outside median of mean values +-2CV.
For Multiple GSAs
In addition to single GSA the following combinations should also be presented:
1, 5, 6, 7, 8, 9, 10, 11, 15, 16 17-18, 20,22,23.
Notes:
MEDITS is a standardized survey based on random sampling stratification with hauls
number by strata allocated based on the surface of the strata (see MEDITS handbook
under: http://www.sibm.it/MEDITS%202011/principaledownload.htm).
The TA file contains hauls information including distance covered and horizontal net open so
we can estimate swept area by haul. For all the GSA, the JRC has the stratification scheme by strata and stratum so we can compute the abundance and biomass index by square
kilometre.
Having the stratification surface we can combine across GSAs.
Issues might arise dealing with some GSAs in which MEDITS time series is different (e.g. GSA17 ITALY, CROATIA and SLOVENIA), for which some extra assumptions may be needed
(maybe assuming some kind of proportion for the missing year(s), based on the years for
which we have data).
Additionally, in some areas (16 and maybe 18), the random stratified design has been
violated with the addition of a new area of sampling after 10 years of survey. As such, in this case a statistical standardization with GLMs would likely be more appropriate.

104
Identification of stocks to be moved to higher category
Identify on the basis of the available data, which of the current data limited stocks can be potentially moved to a higher category (category 1 stock sensu ICES).
Request to the STECF
STECF is requested to evaluate the results - Request for services – 1734 - Ad hoc Contract
on "The Quality Evaluation of DCF data for data limited Information" delivered by Mr Francesco Ferretti. In detail:
- Determine the adequacy of the statistical analysis in respect of the data.
- Evaluate the potential new stocks that may be suitable for stock assessment.
- Advise on the potential to upgrade category of assessment for the identified stock.
STECF observations
STECF notes that the ad-hoc report summarized an exploratory data analysis and
elaboration of the survey and commercial landings focusing on demersal species of the
Mediterranean Sea.
STECF observes that the objective of the exploration was identifying stocks (combinations
between species and GSA) with suitable data to conduct stock assessment through either production models or methods using catch at age data. These should be the stocks not yet
assessed by STECF but for which there are sufficient data to evaluate their status. For this goal the ad-hoc report focuses on two main groups of data: 1) fishery independent data
coming from the MEDITS surveys, and 2) commercial landings data coming from fisheries operating in the Mediterranean Sea. These datasets were provided by the European
Commission’s (EC) Joint Research Centre (JRC).
STECF notes that the ad-hoc report explored whether in the pool of demersal stocks occurring in the regions there are additional species that could be included in the list of
stocks suitable for stock assessment. In the ad-hoc report it was stated that the explorations indicated there might be at least 75 stocks (Table 1), on top of the 77 already
done, for which stock assessment can be done.
Regarding the survey data coming from the MEDITS surveys, the ad-hoc report took into
consideration the MEDITS’ reference list of species (Anonymous 2013). For each of those species an analysis was presented by GSA and for the whole Mediterranean basin. Such
analyses showed:
1. Total number of trawl stations by year;
2. Proportion of positive stations by year;
3. Mean and CV of (standardized) catch abundance (including zero values) by year;
4. Mean and CV of (standardized) catch weight (including zero values) by year;
105
5. Min. max and mean day in year of survey data by year (or 5,50,95%);
7. 5, 50 and 95% on fish length caught by year;
8. Mean and CV of (standardized) mature catch abundance (including zero values) by
year;
9. Mean and CV of (standardized) mature catch weight (including zero values) by
year;
10. Autocorrelation coefficient on mean abundance (1st order);
11. Autocorrelation coefficient on mean catch weight (1st order);
12. Autocorrelation coefficient on mean time (1st order);
13. Fraction of years with the mean abundance outside median of mean values +-
2CV;
14. Fraction of years with the mean biomass outside median of mean values +-2CV.
Regarding the commercial landing data coming from fisheries operating in the Mediterranean Sea, the following analyses were presented in the ad-hoc report:
1. evaluation of different fleet segments or metiers reporting landings by year;
2. calculation of the fraction of landings with samples (sum of catch with
samples/total);
3. for species with length data, estimation of the 5th, 50th and 95th percentile of fish
lengths caught by year;
4. for species with age data, compilation of matrix plots of number at age a in year y with number at age a+1 in year y+1.
Such analyses were carried out by species and GSA. Of all the species available in the commercial landing data, only those occurring in the MEDITS’ reference list were
considered.
Given the high number of output plots produced in the framework of such report, html
dashboards were assembled for an easy and straightforward consultation. To facilitate the identification of stock for which there may be sufficient data for stock assessment, a score
field that counted the materials available for each stock was also available in the
dashboards. The unassessed stocks score the maximum level (6) having all the following summary statistics available:
MEDITS survey summary; Length Boxplot Time-series of commercial landings;
Length Distributions of commercial landing by metier; Age Class Trends of commercial landings;
Cross-Correlation Plots Age Classes of commercial landings Correlation Plots Age Classes of commercial landings.
Stocks with full statistics available were considered as potential candidates for an age based
stock assessment (Table 1). STECF notes that such statistics were not evaluated in the
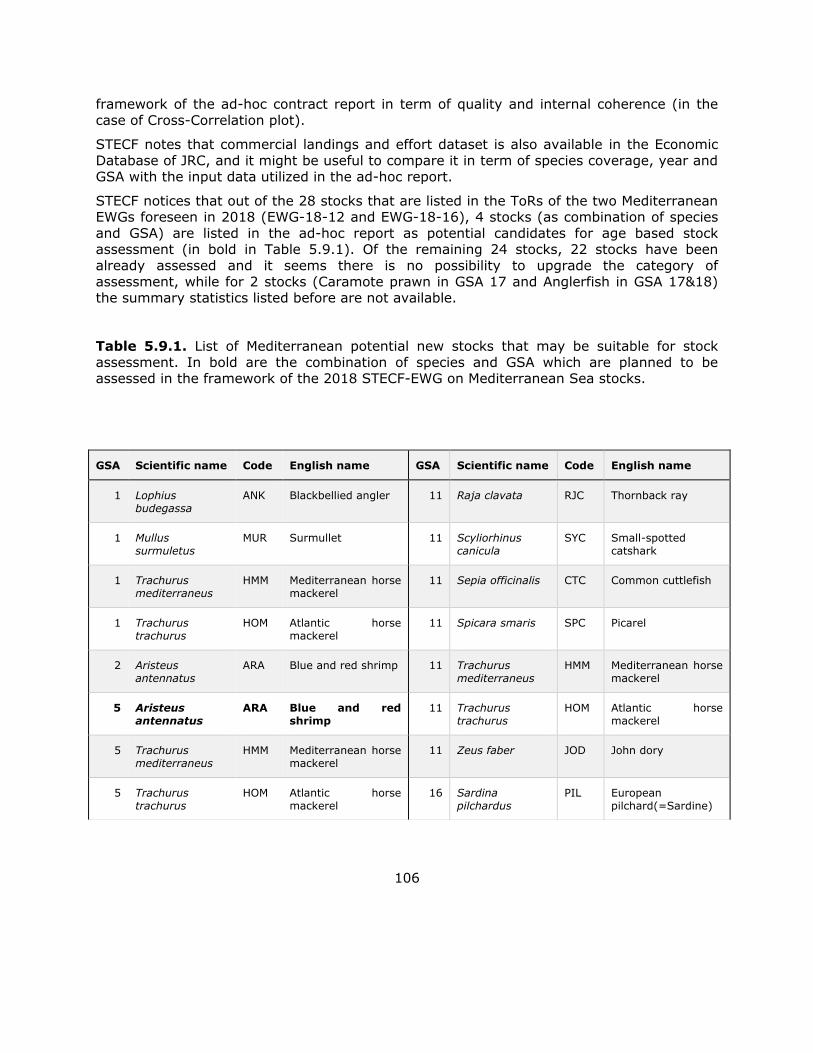
106
framework of the ad-hoc contract report in term of quality and internal coherence (in the
case of Cross-Correlation plot).
STECF notes that commercial landings and effort dataset is also available in the Economic
Database of JRC, and it might be useful to compare it in term of species coverage, year and GSA with the input data utilized in the ad-hoc report.
STECF notices that out of the 28 stocks that are listed in the ToRs of the two Mediterranean EWGs foreseen in 2018 (EWG-18-12 and EWG-18-16), 4 stocks (as combination of species
and GSA) are listed in the ad-hoc report as potential candidates for age based stock assessment (in bold in Table 5.9.1). Of the remaining 24 stocks, 22 stocks have been
already assessed and it seems there is no possibility to upgrade the category of
assessment, while for 2 stocks (Caramote prawn in GSA 17 and Anglerfish in GSA 17&18) the summary statistics listed before are not available.
Table 5.9.1. List of Mediterranean potential new stocks that may be suitable for stock
assessment. In bold are the combination of species and GSA which are planned to be assessed in the framework of the 2018 STECF-EWG on Mediterranean Sea stocks.
GSA Scientific name Code English name GSA Scientific name Code English name
1 Lophius
budegassa
ANK Blackbellied angler 11 Raja clavata RJC Thornback ray
1 Mullus
surmuletus
MUR Surmullet 11 Scyliorhinus
canicula
SYC Small-spotted
catshark
1 Trachurus
mediterraneus
HMM Mediterranean horse
mackerel
11 Sepia officinalis CTC Common cuttlefish
1 Trachurus
trachurus
HOM Atlantic horse
mackerel
11 Spicara smaris SPC Picarel
2 Aristeus
antennatus
ARA Blue and red shrimp 11 Trachurus
mediterraneus
HMM Mediterranean horse
mackerel
5 Aristeus
antennatus
ARA Blue and red
shrimp
11 Trachurus
trachurus
HOM Atlantic horse
mackerel
5 Trachurus
mediterraneus
HMM Mediterranean horse
mackerel
11 Zeus faber JOD John dory
5 Trachurus
trachurus
HOM Atlantic horse
mackerel
16 Sardina
pilchardus
PIL European
pilchard(=Sardine)

107
6 Mullus
surmuletus
MUR Surmullet 16 Sepia officinalis CTC Common cuttlefish
6 Trachurus
mediterraneus
HMM Mediterranean horse
mackerel
16 Trachurus
trachurus
HOM Atlantic horse
mackerel
6 Trachurus
trachurus
HOM Atlantic horse
mackerel
17 Eledone cirrhosa EOI Horned octopus
7 Aristeus
antennatus
ARA Blue and red shrimp 17 Eledone
moschata
EDT Musky octopus
7 Micromesistius
poutassou
WHB Blue
whiting(=Poutassou)
17 Lophius
budegassa
ANK Blackbellied angler
7 Mullus
surmuletus
MUR Surmullet 17 Mullus
surmuletus
MUR Surmullet
7 Nephrops
norvegicus
NEP Norway lobster 17 Octopus vulgaris OCC Common octopus
7 Parapenaeus
longirostris
DPS Deep-water rose
shrimp
17 Spicara smaris SPC Picarel
7 Trachurus
trachurus
HOM Atlantic horse
mackerel
17 Trachurus
trachurus
HOM Atlantic horse
mackerel
9 Boops boops BOG Bogue 18 Boops boops BOG Bogue
9 Eledone cirrhosa EOI Horned octopus 18 Eledone cirrhosa EOI Horned octopus
9 Eledone
moschata
EDT Musky octopus 18 Eutrigla
gurnardus
GUG Grey gurnard
9 Loligo vulgaris SQR European squid 18 Lophius
budegassa
ANK Blackbellied angler
9 Lophius
budegassa
ANK Blackbellied angler 18 Micromesistius
poutassou
WHB Blue
whiting(=Poutassou)
9 Octopus vulgaris OCC Common octopus 18 Mullus
surmuletus
MUR Surmullet
9 Pagellus acarne SBA Axillary seabream 18 Pagellus
erythrinus
PAC Common pandora
9 Scyliorhinus
canicula
SYC Small-spotted
catshark
18 Trachurus
mediterraneus
HMM Mediterranean horse
mackerel
9 Sepia officinalis CTC Common cuttlefish 18 Trachurus
trachurus
HOM Atlantic horse
mackerel

108
STECF conclusions
STECF concludes that the ad-hoc report addressed all ToRs properly and provides an appropriate summary of information to be used to identify stocks with suitable data for
future work, which are available in the datasets used by the STECF EWG on Mediterranean assessment.
Due to limited time STECF is not in a position to go into details and determine the adequacy of the statistical analysis in respect of the data as well as to evaluate the potential list of
new stocks that may be suitable for stock assessment (Table 1) or to advice on the
possibility to upgrade category of assessment for the identified stocks. However, taking into consideration the description of the methodology available from the ad-hoc report STECF
agrees that the outputs of the exploratory analysis are useful for the STECF Mediterranean EWGs and suggests using them as tools to be consulted during the assessment meetings.
9 Spicara smaris SPC Picarel 19 Mullus
surmuletus
MUR Surmullet
9 Trachurus
mediterraneus
HMM Mediterranean horse
mackerel
19 Nephrops
norvegicus
NEP Norway lobster
9 Trachurus
trachurus
HOM Atlantic horse
mackerel
22 Lophius
budegassa
ANK Blackbellied angler
11 Boops boops BOG Bogue 22 Mullus barbatus MUT Red mullet
11 Eledone cirrhosa EOI Horned octopus 22 Mullus
surmuletus
MUR Surmullet
11 Loligo vulgaris SQR European squid 22 Pagellus
erythrinus
PAC Common pandora
11 Lophius
piscatorius
MON Angler(=Monk) 22 Spicara smaris SPC Picarel
11 Micromesistius
poutassou
WHB Blue
whiting(=Poutassou)
22 Trachurus
mediterraneus
HMM Mediterranean horse
mackerel
11 Mullus
surmuletus
MUR Surmullet 22 Trachurus
trachurus
HOM Atlantic horse
mackerel
11 Octopus vulgaris OCC Common octopus 25 Mullus
surmuletus
MUR Surmullet
11 Pagellus
erythrinus
PAC Common pandora 25 Pagellus
erythrinus
PAC Common pandora
11 Phycis
blennoides
GFB Greater forkbeard
109
References
Anonymous (2013). International bottom trawl survey in the Mediterranean. Instruction manual, vol. Version 7. MEDITS Working Group.

110
5.10 Evaluation of the national management plan for boat dredges in
Catalonia, Spain
Background provided by the Commission
The evaluation of national management plans prepared in line with the MEDREG and the
CFP is a recurrent task for the STECF. The management plan for boat dredges in Catalonia
(Spain) was previously assessed by the STECF during its EWG 15-16 (Rome, Dec 2015) and
subsequently reviewed at the Plenary 16-01 (Brussels, Apr 2016). Early 2018, the Spanish
authorities submitted a draft management plan accompanied by a technical study.
Background information is provided on: https://stecf.jrc.ec.europa.eu/plen1801
Request to the STECF
The STECF is requested to:
1) To assess and advice whether the management plans for marine commercial fishing in
the territorial waters of Catalonia, Spain contains adequate elements in terms of:
The description of the fisheries
- Recent and historical data on catches (landings and discards) of the species concerned, fishing effort and abundance indices such as catch-per-unit-effort (or
CPUE).
- Data on length-frequency distribution of the catches, with particular reference to the species subject to minimum sizes in accordance with Annex III of the MEDREG.
- An updated state of the exploited resources.
- Information on economic indicators, including the profitability of the fisheries.
Objectives, safeguards and conservation/technical measures
- Objectives consistent with article 2 of the CFP and quantifiable targets, such as
fishing mortality rates and total biomass.
- Measures proportionate to the objectives, the targets and the expected time frame.
- Safeguards to ensure that quantifiable targets are met, as well as remedial actions,
where needed, including situations where the deteriorating quality of data or non-availability places the sustainability of the main stocks of the fishery at risk.
111
- Other conservation measures, in particular measures to fully monitor catches of the
target species, to gradually eliminate discards and to minimise the negative impact of fishing on the ecosystem.
Other aspects
- Quantifiable indicators for periodic monitoring and assessment of progress in
achieving the objectives of the plan.
2) If deemed necessary, provide any recommendations and guidance on how to obtain
improved scientific/technical supporting material for the plan. This could be done in terms of collection of data, evaluation of the status of the target stocks, evaluation of
conservation measures, impact on the marine ecosystem and monitoring programme.
3) Assess whether the plan provides a robust overview of the catch composition of boat dredges and, in particular whether the catch of species other than shellfish does not
exceed 10 % of the total live weight of the catch (in accordance with Article 13(1) of the MEDREG).
Background documents
Draft management plan - ESP/ENG
Supporting technical study (ICM-CSIC) - ESP
Summary of the background documents submitted to STECF
STECF notes that documents were provided in Spanish or in machine-translated English,
and disclaims against possible misunderstandings.
has examined two documents:
(a) Technical report (from the Catalan Administration) on boat dredges in the Catalan Coastal Mediterranean & Draft order amending the management plan for boat dredges
(PGDE)
(b) Supporting technical study ‘Evaluación y seguimiento del Plan de Gestión de Dragas
para Embarcación (ICM-CSIC)’
The “rastell de cadenes” (referred in the plan document as “dredges”) is a beam trawl
aimed to capture mollusks and crustaceans. In Catalonia, it is only used in areas surrounding the Ebro delta (Sant Carles de la Ràpita, l'Ampolla and l'Ametlla de Mar) and in
Vilanova i la Geltrú by small-scale fishermen. The Mediterranean Fisheries Regulation (EC) 1967/2006 classifies it as a "boat dredge", that is, a towed fishing gear that should only be
used at least 3 nm offshore. However, its use is authorized at less than 3 nm if the catch of species other than "shellfish" does not exceed 10% of the total catch in weight (article

112
13(1)). STECF recalls the comment made in the EWG 15-16 (Rome, Dec 2015) regarding
the interpretation of “shellfish” in the Regulation:
“According to Regulation (EC) No.1967/2006, “dredge” means gears conceived to catch bivalves, gastropods or sponges (Art.2) …. In the MP it is stated that “shellfish” refers to
“marine organisms other that finfish” based on the interpretative document forwarded by the EC in August 2014. This interpretation enlarges the range of organisms that can be
included in such category.” In the case of the Catalan “rastell de cadenes”, the gear targets molluscs and gastropods, which are mainly distributed inside the 3 nm zone. It is, therefore,
necessary to check whether the limit of 10% catch (other than shellfish) is fulfilled in order
to allow these particular dredges to fish on shallow bottoms near the coast where they usually operate.
The first version of the dredge management plan was submitted by the Generalitat de Catalunya (Catalan administration) in 2015, assessed by the STECF during its EWG 15-16
(Rome, Dec 2015) and subsequently reviewed in PLEN 16-01. Both EWG 15-16 and STECF 16-1 concluded that the information included in the plan was not sufficient for assessing the
sustainability of the activity neither under biological nor socio-economic points of view. Specifically, as noted by EWG 15-16, information regarding the fishery (e.g. fleet structure,
exerted effort, specific composition of catches and discards, fishing grounds, landings and
CPUE trends of the two shellfish target species [purple dye murex Bolinus brandaris and Venus clam Chamelea gallina], catch size distributions of both target and bycatch species)
was scarce or non-existent. Moreover, no information on the status of the involved stocks was given, neither any conservation objective or management measures necessary to grant
a sustainable use of the exploited resources with this gear. There was a complete lack of information on the impact of the use of the gear on the fishing grounds and benthic
community along the swept area and survival studies of discarded individuals were not foreseen. Finally, the socio-economic performance of the “rastrillo de cadenas” fleet was not
considered.
The EC conditioned the approval of a dredge management plan in Catalonia, Spain to the development of a scientific monitoring to determine whether the “rastell de cadenes” can be
used inside the 3 mn zone (i.e. if the catch of species other than shellfish is less than 10% of the total catch). This scientific monitoring has been carried out for a period of one year
by the Institute of Marine Sciences (ICM-CSIC), commissioned by the Department of Agriculture, Livestock, Fisheries and Food of the Generalitat de Catalunya. The study was
performed in the fishing areas where this fishery takes place, between the harbours of Vilanova and Sant Carles de la Ràpita. The sources of information used were the first sale
notes from the fish market auction, catch questionnaires distributed among the fishermen,
and various experimental samplings (scientific monitoring) on board the "rastell de cadenes" fleet in their fishing grounds, made by the Institut de Ciències del Mar (ICM-CSIC).
Moreover, a geolocation system was installed on the boats to obtain accurate maps of the actual fishing areas. The results of the monitoring are presented in document (b), with the
goal to determine the detailed catch composition obtained by the “rastell de cadenes”.
113
The document (a), in its first part (Technical report), summarizes the information contained
in document (b) and, in its second part (“Draft order”), presents an updated version of the management plan. This new draft management plan is a replacement of the plan that was
previously assessed by the STECF. The new draft management plan is based on the findings of the one-year monitoring of the fishery and includes a series of measures to control the
fishing activity in space and time.
The Order ARP/219/2016 of the Catalan administration which establishes the management
plan for the boat dredges targeting shellfish in Catalan waters, points out that, for the practice of this activity, fishers must be in possession of special permission granted by the
Catalan administration. The maximum number of permits granted throughout Catalonia is
34, with a maximum duration of one year and distributed in the following way:
Area 1: Vilanova i la Geltru: 5 permits granted for boat dredges
Area 2: l’Ametlla de Mar-Ampolla: 6 permits granted for boat dredges
Area 3: Sant Carles de la Rápita: 19 permits granted for boat dredges.
According to the results of the scientific monitoring made by the ICM-CSIC in document (b)
and summarized in document (a) by the Catalan administration, the percentage of finfish in the dredge catch (after sorting, i.e. after removing living plant material, traces of human
activity such as plastics, live animal and plant debris, and inorganic material such as stones
and mud), during the scientific monitoring in 2017, was 13% in Area 1, 20% in Area 2 and 4% in Area 3. In 2017, the total landings of shellfish and the respective landing value of
boats fishing with dredges in Area 3 was estimated to be 5-6 times higher than in the other two areas.
Based on these findings, the new draft management plan proposes that the use of boat dredges shall be permitted only in Area 3 (south of the mouth of Ebro river) and the exact
location of the fishing ground, where the boat dredging will be allowed, is specified based on an analysis of signals emitted by geolocation devices (AIS) installed on the vessels during
the one-year study. The permits to fish with dredges shall be withdrawn from vessels
operating in Area 1 which is located faraway from Area 3. The vessels permitted to operate in Area 2 (which is in close vicinity to Area 1) will continue to use dredges but only in Area
3.
Given that fishing will only be permitted in Area 3 (Sant Carles de la Ràpita), STECF has
reviewed in particular the data obtained for that area.
Control of fishing effort
The new plan contains a series of measures to further control the fishing effort and
justifications are given for taking these measures. A ‘Monitoring Committee’ will oversee the
implementation of the measures which include:
a) The reduction of the number of vessels authorized to use a dredge from 34 (previous
version of management plan) to 21.

114
b) The reduction of the number of fishing days from 5550 (previous management plan)
to 2428 per year. c) The restriction of the daily period of fishing (06:00-16:00).
The following Table summarizes the information regarding the number of vessels and total
annual number of fishing days:
Previous version
of management plan (Areas 1, 2 & 3)
Fishing
period of 2017 (Areas 1, 2 & 3)
Fishing
period of 2017 (Area 3)
New version of the
management plan (Area 3)
Number of vessels authorized
34 30 19 21
Number of fishing days
5550 2469 1669 2428
In brief, the previous version of the management plan allowed for a maximum of 34 fishing
permits and a total of 5550 fishing days. However, in the 2017 fishing period, only 30
permits were granted and the actual number of days used by these 30 vessels was 2469 in all three fishing Areas. According to the information presented in Table 4 of document (a), a
total of 19 vessels were granted a permit in 2017 and used a total of 1669 fishing days in Area 3 alone. The new version of the plan allows for 21 fishing licences, permanently
excluding vessels in Area 1, vessels that were scrapped under EMFF and vessels that did not use their allocated fishing days in 2017. STECF notes that, in the new version of the plan,
the total number of fishing days allocated to the 21 vessels in Area 3 is similar to the total days realized in 2017 in Areas 1, 2 and 3 together, by a higher number of vessels (30). This
is likely to result in an increase of fishing pressure locally in area 3. Indeed, if the 21 vessels
will use all days allowed (2428), fishing effort in Area 3 will increase by 31% in comparison to 2017.
Finally, the new version of the management plan foresees that a maturity study will be
carried out on purple dye murex (Bolinus brandaris), one of the main target species of the boat dredges, to help adjusting its minimum legal size beyond its size at first maturity.
STECF notes that Article 7.2 of the draft plan states “Catches of different species of
molluscs, crustaceans and echinoderms may not exceed 10 % of the total catches by weight
at the time of landing”. This obviously needs to be corrected as also noted by EWG 15-16,
115
as this is a different wording from “catch of species other than shellfish should not exceed
10% of the total catch in weight [article 13(1)])”.
Information on size compositions
The document (b) from the ICM-CSIC provides length data for some of the main target
species of dredges from the scientific monitoring, which are summarized below:
Purple dye murex (Bolinus brandaris)
In Sant Carles de la Ràpita, the average size of alive individuals was 27.7 mm TSS (size
without the siphonal canal) whereas the average size of dead animals was 25.4 mm. STECF
notices that the minimum legal landing size (set by the Catalan administration) is 25 mm but in width, not TSS. Therefore, STECF is not able to detect if individuals caught were
above or below the minimum landing size. Furthermore, report (b) highlights that there is still no consensus on which size of the shell to use to regulate the minimum size of capture
of Bolinus brandaris in Spain. For example, in Andalusia the administration set minimum legal size of 70 mm, but in this case it includes the length of the siphonal canal.
Caramote prawn (Penaeus kerathurus)
Despite the seasonal variations, few specimens (0.6% of total) had a cephalothorax length
lower than the minimum legal size (22.54 mm).
Mantis shrimp (Squilla mantis)
The size range of the individuals caught in Sant Carles de la Ràpita is wide, between 6-35
mm LC (carapace length). The smallest sizes, between 6-15 mm, appear in its great majority in the port of Sant Carles de la Ràpita, where this species has a great commercial
importance. No legal size exists.
Cephalopods
From all cephalopod species caught in Sant Carles, only one (Octopus vulgaris) has a minimum landing weight (1000g). Data show that only 3 individuals weighing 690-1050 g
were caught during the scientific monitoring.
Fishes
The diversity of fishes observed in the experimental fishing was high. In the port of Sant
Carles, 41 species have been recorded. Although in 10 of the 20 species captured the range of sizes displayed in the report showed that an unknown percentage of individuals were
smaller than existing minimum legal sizes, in all these cases the species were caught in low

116
numbers (<=20 individuals per species). Within the Actinopterigii the group of flatfish was
the most frequent with more than 10 species caught. The most frequent species was a small non-commercial gobiid, Lesueurigobius suerii, followed by four commercial species:
Arnoglossus laterna, Chelidonichthys lucerna, Monochirus hispidus and Citharus linguatula.
STECF comments
STECF response to ToRs 1 & 2
STECF observations regarding ToRs 1 & 2 are listed in the following table:
ToR STECF observations
ToR1 - Description of Fisheries
- Recent and historical data on catches
(landings and discards) of the species concerned, fishing effort and abundance indices such as catch-per-unit-effort (or CPUE).
- Data on length-frequency distribution of the catches, with particular reference to the species subject to minimum sizes in
accordance with Annex III of the MEDREG. - An updated state of the exploited resources. - Information on economic indicators,
including the profitability of the fisheries.
-For the purpose of describing the fishery, the data presented in the two documents are limited
to the one-year pilot study of the fishery. These data include landings compositions, catch compositions from experimental surveys and questionnaires, number of vessels and fishing
days per vessel. Landings, fishing effort and CPUE trends of the target species are not provided.
-The discarded fraction (before sorting) of the catch was estimated to be 52% in Area 3 in 2017. This discarded fraction included stones
and mud, plastics, plant and animal debris, as well as living animals that had no commercial
value. This cannot be used to estimate discards rates, as these should only include living
organisms. The percentage of finfish in the dredge catch after sorting was 13% in Area 1, 20% in Area 2 and 4% in Area 3 (experimental
surveys done in 2016-2017).
- Length frequency compositions of selected species (e.g. Bolinus brandaris, Penaeus
kerathurus) from the onboard sampling in 2017 are presented (see observations above). In terms of numbers, catches of species subject to minimum sizes in accordance with Annex III of
the MEDREG appear to be low in Area 3.
-No assessments of the state of exploited stocks have been carried out.
-No economic indicators are provided except from estimates of total annual economic gain (landings value) of the fleet derived from the

117
shellfish catch in 2017 per fishing area.
ToR1 - Objectives, safeguards and conservation/technical measures
- Objectives consistent with article 2 of the CFP and quantifiable targets, such as fishing mortality rates and total biomass.
- Measures proportionate to the objectives,
the targets and the expected time frame. - Safeguards to ensure that quantifiable
targets are met, as well as remedial actions,
where needed, including situations where the deteriorating quality of data or non-availability places the sustainability of the
main stocks of the fishery at risk. - Other conservation measures, in particular
measures to fully monitor catches of the target species, to gradually eliminate
discards and to minimise the negative impact of fishing on the ecosystem.
- In section 2 (‘Objectives’) of document (a), it is stated that the plan “follows the line marked
by the Common Fisheries Policy (CFP), adjusting
fleet capacity to fishing opportunities in order to generate a scenario enabling the environmental, economic and social sustainability of the activity
in the long term.” STECF notes that the objective of CFP is to restore and maintain populations of harvested species above levels
which can produce maximum sustainable yield (MSY). Levels of fishing opportunities should therefore be consistent with the MSY objective.
The plan does not specify quantifiable targets, such as fishing mortality and biomass reference points and measures to achieve and safeguard the MSY objective, no later by 2020 as
committed by the CFP.
-The plan contains measures to control the fishing activity in space (only in Area 3) and
time (total number of fishing days equal to 2428 allocated to 21 vessels and daily period of fishing equal to 10 hours). STECF notes that the
total number of fishing days in the new version of the plan is similar to the days realized in 2017, by a higher number of vessels (30). Given also the reduction of fishing grounds, this is
likely to result in an increase of fishing pressure locally in area 3.
- The plan postulates that specimens of bivalves
and gastropods caught below the legal minimum size or weight shall be returned to the sea immediately after sorting, in order to ensure
increased survival. No information is however provided on the actual survival rates of the fraction of the catch that is retained and successively discarded to the sea.
- No specific measures to fully monitor catches of the target species of the dredges are specified in the plan. This is particularly important, as in
the new version of the plan, the dredges will be allowed to be used together with other gears
(traps) during the same day. It is however
envisaged that the same monitoring activities described in document (a) will be
continued.
- The management plan postulates the

118
establishment of a special Committee, including
a coordinator, to follow up the implementation of the plan, as well as it opens the door to adaptive governance and co-management actions, linked
to the final approval by the Catalan
Government.
ToR1 - Other aspects
Quantifiable indicators for periodic monitoring and assessment of progress in achieving the objectives of the plan.
No such quantifiable indicators have been
specified. It is said that after 3 years of the management plan, the Committee in
charge of the follow up of the plan will evaluate the results based on the
monitoring activities.
ToR2 - Recommendations on how to obtain improved scientific/technical supporting material for the plan.
STECF recommends that additional elements be included in the plan to allow for the estimation of CPUEs of target species, discard compositions
and respective size compositions of landed and discarded portions of the catch. Based on an adequate data collection scheme, the status of
the main target species, especially the purple dye murex (Bolinus brandaris) and the striped venus (Chamelea gallina), should be assessed
and harvest control rules specified to ensure the sustainable exploitation of the stocks. Data on the economic performance of the dredge fishery should also be collected.
STECF response to ToR3 - Catch composition of boat dredges in relation to Article 13(1) of the MEDREG
In addition to document (a), STECF examined the document (b) ‘Evaluación y seguimiento
del Plan de Gestión de Dragas para Embarcación (ICM-CSIC)’, i.e. the results of the one-year experimental study, to evaluate in detail the catch composition of dredges in Area 3
(Sant Carles de la Ràpita) where the new draft management plan will authorize the use of
boat dredges.
In the Table below, a comparison of data obtained for Area 3 from different sources (landings, questionnaires and scientific survey) is done, based on figures 9, 11 and 71-79
from the ICM-CSIC report (document [b]) which refer exclusively to the port of “Sant Carles de la Ràpita” (Area 3).

119
Data source Time
frame
%
finfish in the
catch
Main shellfish
species
Main finfish species STECF
comments
Landings Sept 2016-Sept 2017
>10% -Octopus vulgaris (35%)
-Bolinus brandaris
(14%)
-Sparus aurata (9%), -Solea vulgaris (7%)
-Euthynnus
alleterattus (4%)
Data are not suitable for
inferring the
catch composition of
dredges because the
same vessels may also use
other small-scale gears
(e.g. Octopus
traps etc)
Questionnaires <10% -Penaeus
kerathurus (21%)
-Bolinus brandaris (43%)
-Solea vulgaris (6%) Dredges could
not be
combined with other gears on
the same day. Therefore,
catch data coming from
questionnaires filled out by the
fishermen
should represent
catches from only the use of
dredges
Experimental survey
October 2016-Sept
2017.
Nine
surveys, 3 fishing
operations
in each survey
<10% -Bolinus brandaris (up to 86%)
-Malacostraca (up to 56%)
The most frequent species was non-
commercial gobiid, Lesueurigobius suerii,
followed by four commercial species:
Arnoglossus laterna,
Chelidonichthys lucerna, Monochirus
STECF considers that
these data have the highest
quality and, therefore,
STECF
conclusions are mainly based
120
(total
number of fishing
operations
= 27)
hispidus and Citharus
linguatula
on data from
the experimental
survey
In summary, STECF considers that the landings data are not suitable for estimating catch
composition of dredges, whereas the data derived from questionnaires and the onboard survey are more reliable, especially the latter, and they both indicate that, in Sant Carles de
la Ràpita (Area 3), the contribution of fish to the dredge catches does not exceed 10% in total weight.
STECF notes therefore that the statement made in section 4 of document (a) that “The results of the study of ICM-CSIC show conclusively that the boat dredges in the
Mediterranean Coast Catalan are behaving as genuine dredges, with a percentage of finfish caught with less than 10 % of the total live catch weight” can only be accepted for Sant
Carles de la Ràpita (the southern part of the Ebro Delta)".
STECF conclusions
The objective of the management plan is to adjust fleet capacity to fishing opportunities,
however, the levels of fishing opportunities should be consistent with the MSY objective of the CFP.
The revised version of the management plan restricts and specifies the area where dredging will be allowed (Sant Carles de la Ràpita: south of the mouth of Ebro river). The information
presented in the documents provided suggests that fishing with dredges in Sant Carles de la
Ràpita results in finfish bycatch lower than 10% in weight, and in higher shellfish catch and total value of this catch compared to other fishing areas. Therefore, restriction of the use of
dredges in Sant Carles de la Ràpita ((area 3) appears justified.
Compared to its previous version, the new management plan imposes additional measures
to control the fishing effort (reduction of the maximum number of authorized vessels, reduction of maximum total number of fishing days, restriction of the daily period of
fishing). STECF however notes that the total number of fishing days, allocated to 21 vessels in the new version of the plan, is similar to the days realized in 2017 by a higher number of
vessels (30) and a more extended fishing ground. Given the reduction of fishing ground to
only Sant Carles de la Ràpita in the new plan, keeping similar number of fishing days is likely to result in the increase of fishing pressure in Sant Carles de la Ràpita (potentially up
to 31%), with unknown consequences for the target shellfish stocks.
Catch and CPUE trends should be provided and the status of the main target species,
especially the purple dye murex (Bolinus brandaris) and striped venus (Chamelea gallina),

121
should be assessed as well as harvest control rules specified to ensure their sustainable
exploitation.
Considering the small-scale (artisanal) character of the fishery, information on the particular
social and economic characteristics of the fishers involved would be useful. .
122
6. ITEMS /DISCUSSION POINTS FOR PREPARATION OF EWGS AND OTHER
STECF WORK
6.1 Preparation for the EWG 18-19 aquaculture economic report
Request to the STECF
STECF is requested to discuss the terms of reference and propose any special topic
relevant in the context of this report that could be addressed in this year's report.
STECF observations
STECF observes that the last economic report for the aquaculture sector in EU was prepared by EWG 16-12 and published as STECF 16-19 in October 2016.
STECF observes that the Terms of Reference for EWG 16-12 resulted in a good overview of the EU aquaculture sector, and that it was feasible to address each ToR adequately, despite
a tight time schedule.
STECF also observes that the current EU DCF Multi Annual Plan (EU Decision 1251/2016)
provides a sector segmentation that is slightly different compared to the previous EU MAP (EU Decision 93/2010). This could affect the tools used to receive data from MS (data calls
format) and for data processing, but the overall structure of the aquaculture report should
not be impacted and could be maintained.
STECF PLEN 16-03 provided a number of observations and conclusions for further
improvement of the biannual report, which should be taken into account in the EWG 18-19. .
Regarding possible topics for special analysis, STECF observes that the following special topics have been addressed previously:
1) The public support and growth of the EU/National aquaculture sectors (2016) 2) Areas for growth in the EU aquaculture sector (2014)
3) Are production volume and value statistics on EU aquaculture from FAO, Eurostat
and DCF aligned? (2013)
STECF exchanged views with the Commission regarding their possible future needs for special topics to be addressed by the EWG. Based on this, it is for the Commission to decide
their priorities in relation to the special topic to be analysed during the upcoming EWG 18-19.

123
STECF conclusions
STECF concludes that the Terms of Reference should be in line with the ToR used in EWG 16-12, and furthermore added the text about the special topic to be analysed.

124
6.2 EWG 18-09 on an effort regime for demersal fisheries in the
western Mediterranean
Request to the STECF
The objective is to discuss the preparation of the EWG 18-09, including the draft
terms of references, data availability, experts' attendance, identification of possible
work to carry out in advance of the meeting, anticipation of any issue and link with
the EWG on stock assessments.
STECF response
STECF observations
STECF observes that the Terms of References for EWG 18-09 have already been drafted and published on the STECF meetings web site. STECF appreciates that some of the TORs reflect
the conclusions of STECF Plen 17-02 that was already asked to provide advice on the establishment of a fishing effort regime for demersal fisheries in the western Mediterranean.
In particular, STECF observes that TOR 1 (Lessons learned) is aimed at presenting the general knowledge on the use of fishing effort regimes as a management tool for mixed
fisheries; however, STECF observes that issues regarding poor monitoring and
documentation of the actual effort levels should also be considered as part of this TOR, as requested by STECF 17-02.
STECF observes that the second TOR (What are the main characteristics of the trawl fishing fleet) is based on the analysis of specific sets of data. STECF considers that data should be
made available disaggregated by GSA (i.e. GFCM sub-areas 1, 2, 5, 6, 7, 8, 9, 10, 11) and not by Member State as stated in the draft TOR. The list of information could be better
defined trying to differentiate variables (like the number of vessels), that should be provided by MS based on data collected under the DCF and indicators (as for instance the
“net profit”) that need to be calculated. STECF observes that the meaning of the variable
“Economic dependency (%)” should be specified.
Regarding the proposed TOR 4 (What is the relationship between effort and fishing
mortality) STECF 17-02 already considered that the relationship between fishing effort and fishing mortality is not linear, as there are many technical and human factors that govern
the impact of one unit of fishing (e.g. one fishing day) on the exploited stocks, and fishers can also compensate effort reductions with increased fishing efficiency. STECF 17-02 noted
that is impossible to define a single adequate effort level for all stocks since large differences in catchability and stock status exist across stocks. STECF also notes that
attempts to find the relationship between fishing effort and partial fishing mortality in other
125
areas (Baltic Sea, North Sea) have shown the similar non-consistency in relationship
between fleet segments and metiers (e.g. STECF-14-20).
STECF observes that the annex of the proposed TORs for EWG 18-09 suggests an approach
to be used in case there is no meaningful relationship between effort and fishing mortality. STECF considers that it would be beneficial to implement some case studies to test any
specific assumption on this relationship.
TOR 5 for EWG 18-09 is aimed at simulating the likely impacts of different management
scenarios. STECF considers that DGMARE should clarify which stocks should be included in the model and, therefore, which fleet segments. STECF also observes that no forecast
model is suggested. In addition, STECF notes that the WestMed MAP proposal (Brussels,
8.3.2018, COM(2018) 115 final 2018/0050) includes the provisions of technical conservation measures (like closure areas) as complementary measures to the fishing effort
regime, but these are not considered in the list of management scenarios to be tested for each effort management unit.
STECF observes that simulations comparing output-based management (TAC) with input-based management (effort limits) have already been implemented by STECF-16-21
(Multiannual plan for demersal fisheries in the Western Mediterranean).
Finally, STECF observes that economic indicators to be considered in the assessment should
refer to the most recent guidelines and approach on impact assessment (such as for
example those proposed by the SOCIOEC project).
STECF conclusions
STECF concludes that the Terms of Reference for EWG 18-09 are well listed but considers
that substantial work should be carried out in advance of the meeting to allow their achievements.
In particular, STECF concludes that:
TOR 1 (Lessons learned) should be based on comments and conclusions of STECF PLEN-02.
Experts present during the meeting should integrate and further comment the issues raised
by PLEN-02. The expected output is a list of lessons learned from the use of effort management regimes in EU and non-EU fisheries. This list should not only describe, from a
scientific-technical perspective, the shortcomings of such regimes and recommendations to avoid similar issues, but it should also report the strengths and how new effort regimes
could benefit from it. The TOR should also investigate if appropriate monitoring and documentation of the actual effort levels are already in place in the Western Mediterranean
Sea.
TOR 2 (What are the main characteristics of the trawl fishing fleet) should be based on data
as specified within the DCF (in terms of variables and temporal disaggregation) but with a
lower geographical disaggregation (economic data are collected by supra-regions, but some MS have included in their National Work Plan the collection of economic data at GSA level).
STECF concludes that, before the meeting, it should be checked what data are available in the JRC database and if they are consistent. In case data by GSA are not available or they
126
are not consistent, the chair should ask MS (through National Correspondents) to provide
economic data at GSA level, if available. STECF considers that this approach is preferable to an “official” data call, which is a lengthy procedure.
Additional data, apart from those collected within the DCF, should also be made available, such as information on gears, fishing patterns, etc. STECF suggests reviewing studies and
research projects, like for instance the MYGEAR project (Sala et al., 2013). Additional data, such as individual trip data for some fisheries allowing estimation of partial fishing mortality
per day (Rijnsdorp, 2006, van Oostenbrugge et al., 2008), could also be useful.
The relationship between effort and fishing mortality should be further investigated before
the meeting taking into account comments made by STECF 17-02 and available studies and
scientific articles.
Models to be used in the simulation should be selected before the meeting as this would
also indirectly suggest experts' attendance. Management scenarios should be selected considering DGMARE meeting expectations but also time and resource availability.
References
Rijnsdorp, A. D., Daan, N., and Dekker, W. 2006. Partial fishing mortality per fishing trip: a useful indicator of effective fishing effort in mixed demersal fisheries. e ICES Journal of
Marine Science, 63: 556e566.
Sala, A., Brčić, J., Conides, A., De Carlo, F., Klaoudatos, D., Grech, D., Lucchetti, A., Mayans, A., Notti, E., Paci, N., Salom, S., Sartor, P., Sbrana, M., Soler, I., Spedicato,
M.T., Virgili, M., 2013. Technical specifications of Mediterranean trawl gears (myGears). Final project report, financed by the European Commission through the Framework
service contract for Scientific Advice and other services for the implementation of the Common Fisheries Policy in the Mediterranean (Contract MARE/2009/05-Lot 1), 519 pp.
van Oostenbrugge, H. J. A. E., Powell, J. P., Smit, J. P. G., Poos, J. J., Kraak, S. B. M., and Buisman, E. F. C. 2008. Linking catchability and fisher behaviour under effort
management. Aquatic Living Resources, 21: 265–273.

127
6.5 Reflection on identification of future research and innovation
priorities in fisheries science
Request to the STECF
DG MARE wishes to consult STECF on the future research needs in the context of
preparation of FP9. Concretely, STECF is asked to discuss and identify what knowledge will be necessary by 2030 to contribute to enabling the sustainable EU's fisheries management
and to contribute to the improved performance of EU fishing. STECF is requested to consolidate the (preliminary) conclusions of this discussion in a short document (preferably
a 1 pager) with the key elements identified in the knowledge areas. In addition, STECF is
requested to provide rationale for knowledge areas identified.
For its discussion, STECF is asked to take into consideration as a background document an
internal MARE note prepared by DG MARE CFP Units on possible FP9 priorities and consultation on post-2020 fisheries research and innovation (R&I) strategy. This note
contains first reflections on the possible agenda for future research.
STECF response
Documents reviewed
The documents reviewed to produce the conclusions and the rationale behind the knowledge
areas identified is the following:
Contribution from DG MARE CFP Units to possible FP9 priorities and consultation on
post-2020 fisheries research and innovation (R&I) strategy. 2017
EFARO’s view on research priorities for H2020 SC2 2018 and beyond. European
Fisheries and Aquaculture Research Organisation (EFARO)
http://efaro.eu/index.html.
Strategic Research and Innovation Agenda 2015-2020. JPI OCEANS: http://www.jpi-
oceans.eu/
Strategic research agenda for Fisheries, Aquaculture and Seafood Processing.
COFASP http://www.cofasp.eu/.
“Food from the Oceans” Report 2017. SAPEA https://www.sapea.info/
STECF observations
STECF recalls that the tasks of this committee are, in the field of conservation and
management of living marine resources, including biological, economic, environmental,
social and technical considerations: (i) to assist the Commission in the preparation of

128
legislative proposals, delegated acts or policy initiatives, and (ii) to monitor the evolution of
policy and bring about an exchange of experience and good practice.
Before discussing the main topics of future research, STECF notes that there are several
data and methodological gaps that have been regularly detected in the past and which
made difficult or impossible the assessment of some stocks. These deficiencies should be
considered alongside the new topics of future research. These include for example the
insufficient data for a great number of coastal species or the lack of social data (not only
quantitative, i.e. from sociology but also qualitative, i.e. from social anthropology) for some
fisheries (particularly the small –scale fishing fleets, where the social component is
particularly relevant).
Some reflections appear from the documents reviewed. STECF highlights that these themes
have multiple facets and that some of the complex aspects are sometimes omitted. Those
need a detailed discussion and analyses regarding the ways to approach them:
“Business as usual” is not sustainable from social, economic, and environmental
point of view… innovative changes in all sides (fishers, managers, scientists,
consumers) are needed. However, STECF points that there is reticence among
stakeholders to change the path, which must be taken into account.
Fast-growing global population: How can more food be obtained from the oceans in a
sustainable way? STECF highlights that is it not only about quantity, but also quality.
there are scientific voicing arguing that we particularly need to increase the quality
(micronutrients, omega 3 fatty acids, etc) and safety (parasites, biotoxins, etc)
issues of the seafood. There is also a need to consider the access to food and the
distribution of the marine resources in a global scale, considering both developed
nations as well as developing nations, from where large quantities of seafood are
imported to EU.
New stakeholders (multi-use of the space) are emerging at sea, posing economic and
social challenges. However, it is not yet clear how fishers, fisheries managers and
scientists can adapt to these changes
Based on the three challenges described in the annex of the DG MARE CFP Units document,
the documents reviewed, the reflections given above and the new ideas provided by STECF
members during the 18-01 Plenary, STECF identified the main research topics and ideas
that complement those described in the document of DG MARE CFP, in order to allow
gathering new knowledge by 2030 to contribute to sustainable EU fisheries management,
and to contribute to the improved performance of EU fishery.

129
STECF considers that the three challenges proposed by DG MARE are timely and therefore
STECF has complemented the thoughts provided by DG MARE to tackle these challenges
with further ideas. Some of these ideas are already ongoing and started to be covered in
the current calls of H2020, whereas other ideas are not and are suggested for future work in
the next decade.
The STECF ideas are presented in the following three tables (one for each challenge). STECF
discussed about the best format and extension of the research ideas and topics, taking into
account the available time frame of the advisory committee (one week), in order to make
them helpful for DG MARE. STECF did not have the time that would be necessary to provide
more details (e.g. examples or ways to approach the ideas) for each topic/idea, neither to
rank these topics / ideas according to some priority (originality or strategic necessity), but
considers that the information provided in the following tables constitute a first step that
complements the information of DG MARE.
It must also be considered that all topics / ideas need to consider overarching issues of
social, economic, environmental and climate change challenges, and that in many occasions
the link to other sciences such as medicine, nutrition or veterinary will be needed to tackle
the research issues proposed. Therefore, a full interdisciplinary view will be needed if the
topics/ideas proposed are to be promoted. The integration of fisheries scientists (whether
they come from the biological, social or economic fields) into a multi-disciplinary network of
scientists including marine biologists, parasitologists or physicians to support not only the
Blue Growth but also the Blue Health is highly needed.
Finally, STECF considers that an important issue to tackle when considering the future of
fisheries research is the lack of opportunities for young fisheries scientists. STECF realizes
that the current financial tools are too short to effectively invest in fisheries education and
research training and do not offer permanent or stable positions to young fisheries
scientists.
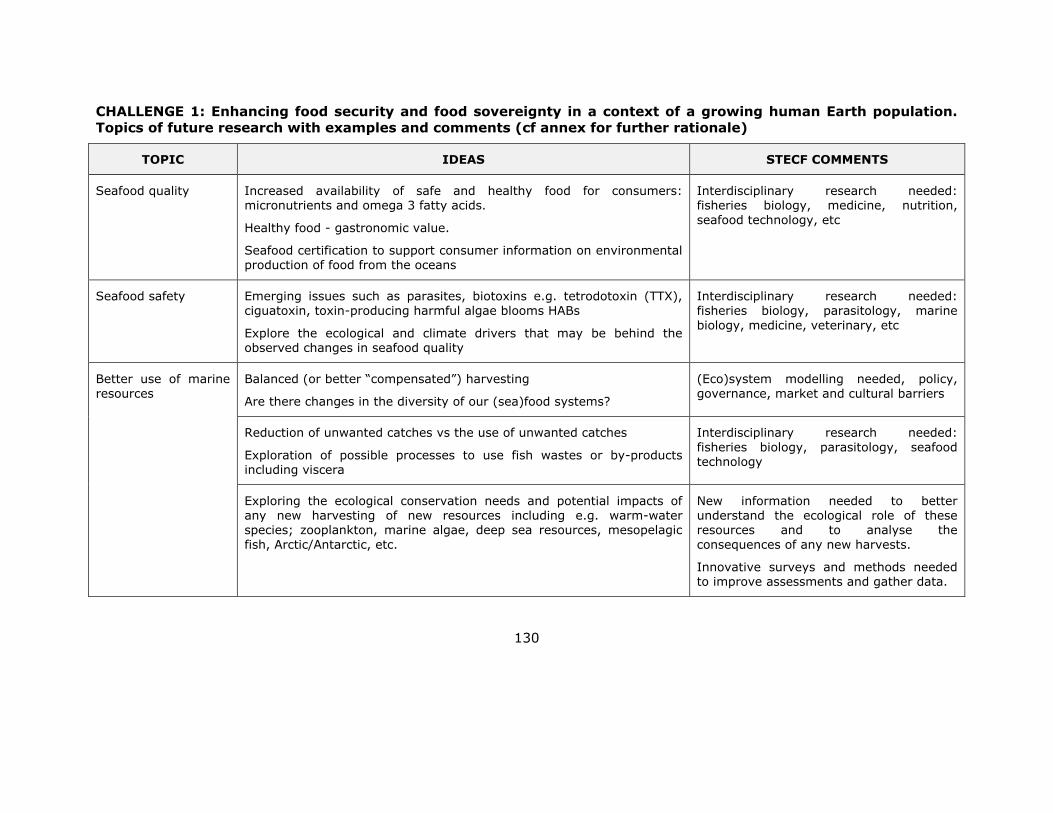
130
CHALLENGE 1: Enhancing food security and food sovereignty in a context of a growing human Earth population.
Topics of future research with examples and comments (cf annex for further rationale)
TOPIC IDEAS STECF COMMENTS
Seafood quality Increased availability of safe and healthy food for consumers: micronutrients and omega 3 fatty acids.
Healthy food - gastronomic value.
Seafood certification to support consumer information on environmental production of food from the oceans
Interdisciplinary research needed: fisheries biology, medicine, nutrition,
seafood technology, etc
Seafood safety Emerging issues such as parasites, biotoxins e.g. tetrodotoxin (TTX), ciguatoxin, toxin-producing harmful algae blooms HABs
Explore the ecological and climate drivers that may be behind the observed changes in seafood quality
Interdisciplinary research needed: fisheries biology, parasitology, marine
biology, medicine, veterinary, etc
Better use of marine
resources
Balanced (or better “compensated”) harvesting
Are there changes in the diversity of our (sea)food systems?
(Eco)system modelling needed, policy,
governance, market and cultural barriers
Reduction of unwanted catches vs the use of unwanted catches
Exploration of possible processes to use fish wastes or by-products including viscera
Interdisciplinary research needed:
fisheries biology, parasitology, seafood technology
Exploring the ecological conservation needs and potential impacts of any new harvesting of new resources including e.g. warm-water species; zooplankton, marine algae, deep sea resources, mesopelagic
fish, Arctic/Antarctic, etc.
New information needed to better understand the ecological role of these resources and to analyse the
consequences of any new harvests.
Innovative surveys and methods needed to improve assessments and gather data.

131
The potential of sustainable mariculture Interdisciplinary research needed to solve
the problems in traditional mariculture.
Maximizing the processing efficiency: exploring the integrated full
seafood value chain (fisheries, aquaculture and processing industries) in order to reach a full utilization and optimal sustainable use of oceans and seas. Development of new production technologies to maximize the efficiency.
Interdisciplinary research needed involving
all stakeholders of the seafood chain.
New technologies around traceability in the seafood supply chain
Increasing the knowledge of the value chain
Increase the consumers’ acceptability of aquaculture products
Interdisciplinary research needed
New models: non-market economic valuation, new predictive and
diagnostic tools (e.g. artificial intelligence)
Climate change and fisheries: fish adaptation and stock management
Beyond seafood: marine ecosystem
goods and services
Marine biotechnology based on fisheries products Link to medicine and biotechnology
Recreational fisheries: socioeconomic opportunities (e.g. pesca turismo/“fishing tourism”) and challenges (e.g. subsistence fisheries and competition with professional fishers) and ecological impacts
Link to the tourist boom and the economic crisis.

132
CHALLENGE 2: Consolidating the governance of the Ocean (cf annex for further rationale)
TOPIC IDEAS STECF COMMENTS
Better integration of the Human Dimension
Marine Socioecological Systems. Co-management. Societal acceptance & responsibility
Interdisciplinary research needed: fisheries biology, social anthropology, economy, marine governance
Analysis of different governance systems - fleet based approach: Small-scale traditional fisheries vs large scale fisheries. Use of Territorial Use Rights– TURFs.
Analysis of socio-economic development of local and regional communities which depend on the fisheries sector including the search for a wider set of socio-ecological indicators in monitoring CFP and
MSFD
Fishermen adaptation to climate change
Interdisciplinary research needed: fisheries biology, social anthropology, economy, marine governance
Consequences of the global seafood trade for the local communities (in
developing countries), including potential, future effects linked to potential changes in this trade depending on internal (EU) or external factors.
Research programs with developing fishing
nations needed, but also within Europe taking into account that today Europe is a net importer of seafood
Seafood consumption, human health and wellbeing in a changing environment (including climate change): challenges for the governance
Interdisciplinary research needed: fisheries biology, social anthropology, economy, marine
governance. Link to “Oceans & Human Health”
This includes a baseline survey and the development of a set of relevant indicators
that can be used for monitoring
Innovative governance strategy
Corporate Social and Environmental Responsibility of seafood corporations and fleets
Relate to labelling and certification

133
linked to innovative
management, research and dissemination
Link Marine Strategy Framework Directive (GES) with Habitats Directive
- Birds Directive.
Raise awareness of fishery issues (including climate change impacts9 to
fishers, consumers and public
International governance in the open ocean
New strategic vision in EU fisheries research:
Optimization of research infrastructures, surveys & programmes
Innovative and new technologies for research survey and data collection (advantage of using information collected by fishers/vessels)
Prioritization of research needs. Computing the value added to society
Open access to centralized fishery data
New technologies for monitoring fisheries and for stock assessments (i.e. under water drones)
Citizen (fishers) science Self-survey programmes (e.g. Norwegian Reference Fleet)
Integration of industry and society in developing relevant information for decision
making
“Multi-use” approach of the oceans. Coastal and maritime planning
Interactive advise and science Science and advise has to become more decision oriented and participatory
Human capacity building in fisheries science Need to focus on fisheries education, research training and offering permanent / stable

134
positions for young scientists.
Specific measures Removing harmful subsidies
Increase compliance and eliminate IUU fishing
Global Marine Spatial
Planning (MSP)
Develop governance, institutions, rules and tools for global MSP Need to revisit concepts of MSP: regional scale
vs global scale
CHALLENGE 3: Strengthening the resilience of marine ecosystems (cf annex for further rational)
TOPIC IDEAS STECF COMMENTS
Minimizing the
impacts on marine
ecosystems
Vulnerable species and habitats (to fisheries and climate change) Link to biological conservation initiatives
including Natura 2000
Essential fish habitats (EFHs). Link to biological conservation initiatives
including Natura 2000
Improve the ecological footprint of fishing methods: use of alternative
“low impact” gears (e.g. traps); biodegradable materials to mitigate the consequences of fishing gear loss.
Cost-efficiencies of various types of production alternatives
Interdisciplinary research needed;
fisheries biology, fisheries technology
Reducing the environmental impact of fishing activities by using innovative fishing technologies for reducing GHG, other pollutant emissions, and fossil-based fuel consumption
Focus on green and blue technologies to reduce the fuel consumption of fishing activities, increasing the energy efficiency
of fishing gears and vessels.
Ecosystem based management. Food webs. Ecosystem modelling needed.
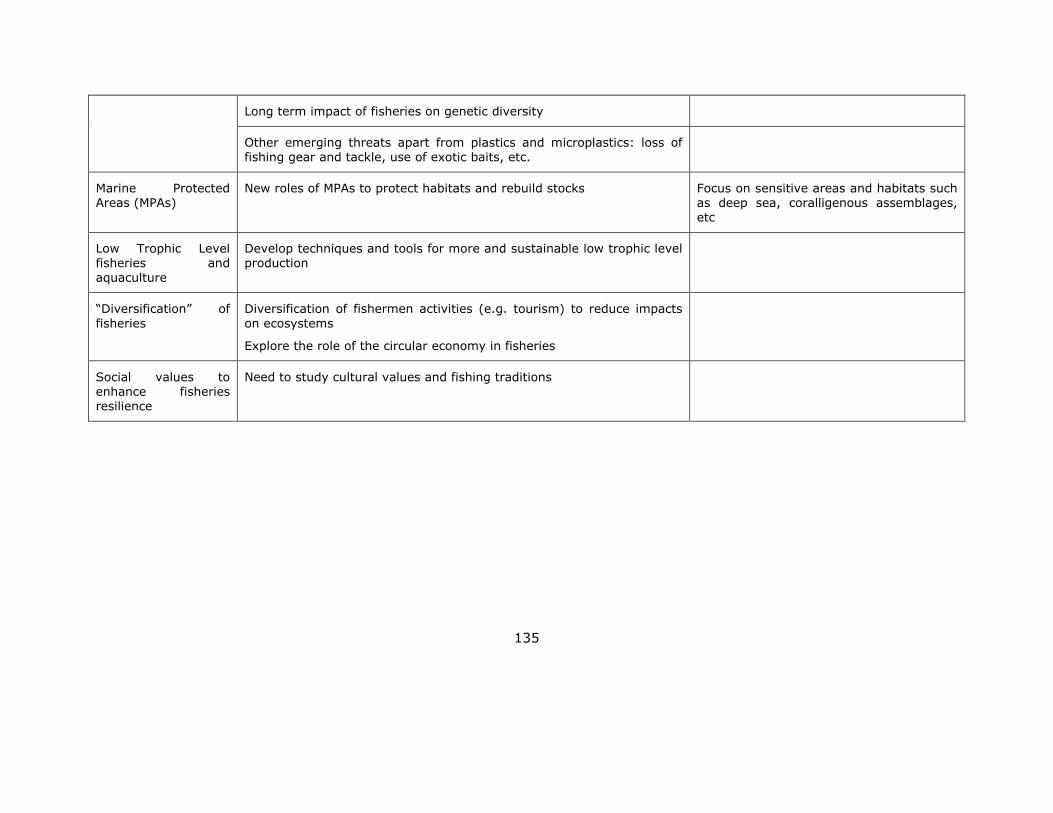
135
Long term impact of fisheries on genetic diversity
Other emerging threats apart from plastics and microplastics: loss of fishing gear and tackle, use of exotic baits, etc.
Marine Protected Areas (MPAs)
New roles of MPAs to protect habitats and rebuild stocks Focus on sensitive areas and habitats such as deep sea, coralligenous assemblages, etc
Low Trophic Level fisheries and
aquaculture
Develop techniques and tools for more and sustainable low trophic level production
“Diversification” of
fisheries
Diversification of fishermen activities (e.g. tourism) to reduce impacts
on ecosystems
Explore the role of the circular economy in fisheries
Social values to enhance fisheries resilience
Need to study cultural values and fishing traditions

136
Brief rationale for proposing the topics and ideas in the 3 tables above.
1. Enhancing food security and food sovereignty in a context of a growing
human Earth population
Although the enhancement of the food security at a global scale is important, seafood quality and safety aspects are increasingly more relevant for the human health and
wellbeing. The potential of seafood as a better source of micronutrients and omega 3 fatty acids for citizens than other foods is arguably more important than its value as a
source of protein In this sense, future research will need not only to enhance food security and sovereignty, but also to guarantee the availability of safe and healthy food
for consumers by contributing to the provision of accessible, healthy and sustainable food and diets for all. For example, the management of fisheries could take into account the
balance between the omega-3 fatty acids and the mercury provided, or the best seasons to exploit fish in accordance with the omega-3 fatty acids they provide. On the other
hand, emerging issues such as parasites, biotoxins e.g. tetrodotoxin (TTX), ciguatoxin,
toxin- producing harmful algae blooms (HABs) need to be better addressed in the future; there is a need to link these threats to climate change, because many of these emerging
issues are related to it (e.g. change in the spatial distribution of warm-water species that are toxic, such as pufferfish, or appearance of ciguatera in areas where it was not
observed before due to changes in HABs). To achieve these goals, interdisciplinary research is needed, where different disciplines should be engaged, e.g. fisheries and
marine biology, parasitology, medicine, veterinary, nutrition, toxicology, etc.
The idea of the “better use” of marine resources needs further research. For example,
on-going research supports the so-called balanced harvesting approach, though there is
not yet an adequate body of evidence on its effects – be they benefits or otherwise (cf. also ToR 5.4 for a discussion about the impact of size-base selectivity). In some places
like the Mediterranean, it seems there has been a decline in the diversity of the (sea)food systems whereas in others like the North Atlantic, the opposite may occur. Another
example is the need to investigate how a reduction of unwanted catches bycatch/discard can be achieved, and the eventual reuse of unwanted catches including viscera (e.g.
livers, which are rich in omega-3), in line with the current commitments to the so-called “circular economy”. Another example of future research to improve the way we use the
marine resources is the necessity to maximize the processing efficiency by exploring the
integrated full seafood value chain (fisheries, aquaculture and processing industries), with the goal to reach a full utilization and optimal sustainable use of oceans and seas.
There is a need to develop a better understanding of underutilized material and potential value of available resources with an analysis of the current markets and potential value
chains for new products. This needs the research collaboration of seafood processing industry, fisheries sector and aquaculture producers. Policy and governance aspects of
the full utilization and optimal sustainable use of the Oceans and Seas of Europe need to be addressed, again in line with the “circular blue bio economy”. There is an increased
necessity to fully use all of the harvested fish products, be it from aquaculture or wild
capture fisheries. This entails optimizing the use for fishmeal and oil coming from the fraction that is left after fish processing (from trimmings) and the use of all co-products
for high value products for feed, food, pharmaceuticals and cosmetics. The potential of sustainable mariculture (e.g. reducing the impact on habitats or use of alternatives to
fish oils/fish meal and agriculture products) needs to be further explored. Not only should the aquaculture industry be addressed but also consumers, because there is a need to
increase the acceptability of aquaculture products among them.
137
New methods and technologies are needed to tackle the future challenges. For example, new production technologies are needed in order to improve the efficiency of the fisheries
sector and the traceability in the seafood supply chain. New models such as e.g. non-
market economic valuation in the valuation of recreational fisheries, as well as new predictive and diagnostic tools (e.g. artificial intelligence), should be explored to
contribute to the idea of “better use” of marine resources.
The links between climate change and fisheries needs to be further explored considering
the expected changes in sea water temperature and other physical variables that may affect directly or indirectly fish stocks, such as river runoff or winds. The physiological
adaptation of fish and invertebrate species to the environmental changes produced by climate change, as well as the incorporation of physical variables into stock management
(e.g. evaluation of MSY) will need to be further investigated.
The idea of exploring and harvesting new resources needs new data to evaluate if this is
ecologically sustainable and socioeconomically feasible. Knowing the ecological role and
vulnerability of these new resources to fisheries and climate change is of paramount importance before any potential harvest may be envisaged. The marine ecosystems are
home to a large number of resources that are either not exploited or are marginally exploited currently and which could improve food security and the wellbeing of humanity.
These include species that are increasing because of climate change, including invasive species; zooplankton, marine algae and mollusks, deep sea resources and mesopelagic
fish. Some of these taxonomic groups have been proposed because they have lower trophic levels. However, many questions arise that will need further research: deep sea
biota is fragile whereas zooplankton and mesopelagic fish constitute an important food
resource for other animals; and marine algae make up an important habitat for other organisms. Therefore, before these new resources can be harvested, new data using
innovative sampling methods must be collected to fill in fundamental knowledge gaps and technical shortcomings that currently are raising doubts about the ecological
consequences of increasing food from the sea using these new resources.
Apart from being part of a healthy diet, marine resources can offer other type of goods
and services that need further research, including the use of marine biological resources through development and application of marine biotechnology (nutraceuticals,
cosmeceuticals, biomedical, biopolymers, enzymes with industrial applications) and the
social and economic challenges that recreational fisheries represent. The potential effects of recreational fisheries on fish stocks are still little explored whereas the socioeconomic
importance of different types of recreational fisheries, including the subsistence one, is still little known.
2. Consolidating the governance of the Ocean
Future research should allow a better integration of the Human Dimension. In this sense, the concept of Marine Socioecological Systems needs to be better developed in order to
improve the governance of fisheries and oceans. Co-management and participatory
approaches need to be better studied to improve the fisheries governance. Furthermore, the societal acceptance and societal responsibility of fishers and consumers needs to be
further investigated, as well as the governance of aspects of fisheries related to human health and wellbeing.
Additionally, an innovative governance strategy linked to innovative management, research and transfer of knowledge is needed. In this sense, the significance of small-
138
scale traditional fisheries as a model for better governance needs to be considered, particularly because such fleets are often said to be economically, socially and
economically more sustainable than large scale fleets (despite in some cases there are
particular impacts on particular vulnerable species and habitats that are not yet well understood). EU small-scale coastal fleet represents 47% of the total employment but is
not well-represented in the political and economic development agenda. New governance actions such as the use of Territorial Use Rights– TURFs in these fisheries needs to be
better explored whereas the competition between small- and large-scale fisheries needs to be better approached. Furthermore, the consequences of the global seafood trade for
the local communities (in developing countries), including future effects linked to potential changes in seafood trade needs to be explored because currently Europe is a
net importer of fish (ca 60% of the raw material of the processing industry is imported).
Another example of future research in the field of governance are the potential effects of
subsidies and the development of Corporate Social Responsibility (CSR) of large food
corporations. Governance could be also improved by linking the fisheries management with the management of the marine environment as a whole. There are still overlaps and
areas for closer coordination between the Marine Strategy Framework Directive (MSFD) and the Habitats and Birds Directives In this sense, the interactions between the MSFD
(Good Environmental Status - .GES), the Habitats Directive (Favourable Conservation Status -FCS) and Birds Directive is an example of research that has been little explored
so far despite the two concepts of GES and FCS can be mutually supportive (here, the collaboration between DG MARE and DG Environment is needed). Another example of
future research is the development of governance, institutions, rules and tools for global
multi spatial planning (MSP). With an increased use of our seas and oceans for the production of food (and feed), energy, tourism or drinking water and conservation, there
is a need to revisit concepts of MSP (regional scale vs global scale)
Furthermore, a new strategic vision in EU fisheries research is needed, taking into
account the optimization of research infrastructures, surveys and programmes: shared use of research vessels and infrastructures; promotion of open access to centralized
fishery data (e.g. survey data, landings, etc); the use of citizen (fishers) science (e.g. engaging fishers to collect scientific information / self-surveys); or the integration of
fisheries in the “multi-use” approach of the oceans (e.g. study the links with other
maritime sectors including offshore wind, coastal tourism, aquaculture, oil and gas exploration). In order to be able to provide sound advice that integrates social,
economic, environmental, policy and management aspects, science has to become more decision-oriented and more participatory in a world that is growing in complexity with an
increased use and hence users of the seas and oceans. To improve the governance of fisheries, new ways to raise environmental awareness among fishers, consumers and
general public is also need, and cultivation of new approaches to social responsibility must be approached. A final but important governance issue is the necessity to solve the
crisis in human capacity building in fisheries science, because the current financial tools
are too short to effectively invest in fisheries education, research training and offer permanent or stable positions to young fisheries scientists.
3. Strengthening the resilience of marine ecosystems
In order to strengthen the resilience of marine ecosystems, several actions can be promoted for future research. One is the “diversification” of fishing activities, which
should be better studied as a tool to reduce pressure on stocks. The diversification of

139
fishers towards other activities such as tourism should consider social aspects (e.g. cultural value, traditions), because these social values are important to enhance fisheries
resilience and there is yet little information. Another example is the role of marine
protected areas (MPAs) to protect habitats and rebuild stocks. Although this is not a novel topic (much research has been conducted on the impacts of MPAs on fish
abundances and biomass), it should be further explored to consider the less-known aspects such as e.g. the potential of MPAs to positively affect the life history traits of fish
inhabiting these areas, or the use of MPAs as “laboratories” where large scale issues (e.g. climate change impacts on fish, multiple use of the seas, etc) can be approached at a
local scale. Other emerging impacts on marine resources apart from plastics and microplastics should be further addressed, including the loss of leads and other fishing
tackle and the use of exotic baits by recreational fisheries, or the environmental impacts resulting from the loss of professional fishermen (e.g. “ghost fishing”).
Other future research ideas to improve the resilience of stocks may include measures to
integrate fisheries science and stakeholders in the multi-use of seas and oceans for Blue Growth and the continuation of long term research and monitoring to minimize the
impacts on marine ecosystems. A general challenge to all uses of the marine environment is to develop products and production techniques that not only reduce direct
impact on the marine resources, but are produced with the lowest possible impact on the marine ecosystem, including its associated carbon footprint. The development of low
impact fishing methods, such as eco-friendly powered vessels and the use of biodegradable materials, should be also addressed, whereas the effect of fisheries and
climate change on vulnerable species and habitats including the so-called essential fish
habitats (EFHs) must be better understood because sea warming and some fishing methods can have a large impact on fragile species and habitats such as crinoid beds and
deep water corals, but currently this impact is little known. Finally, the long term impact of fisheries on genetic diversity must be further explored. Another example of future
research idea to improve the resilience of the marine ecosystems is the improvement of ecosystem modelling and fisheries assessments, which need to consider climate change
(currently climate change is not taken into account in determining Maximum Sustainable Yields (MSY). The development of Low Trophic Level fisheries and aquaculture is another
example must be further explored. In this sense, the development of techniques and
tools to exploit or cultivate the low trophic levels in a way that does not compromise other animals of the sea should be better explored.

140
7. BACKGROUND DOCUMENTS
Background documents are published on the meeting’s web site on:
https://stecf.jrc.ec.europa.eu/plen1801

141
8. CONTACT DETAILS OF STECF MEMBERS AND OTHER PARTICIPANTS
1 - Information on STECF members and invited experts’ affiliations is displayed for information
only. In any case, Members of the STECF, invited experts, and JRC experts shall act independently. In the context of the STECF work, the committee members and other experts do
not represent the institutions/bodies they are affiliated to in their daily jobs. STECF members and experts also declare at each meeting of the STECF and of its Expert Working Groups any specific
interest which might be considered prejudicial to their independence in relation to specific items on the agenda. These declarations are displayed on the public meeting’s website if experts
explicitly authorized the JRC to do so in accordance with EU legislation on the protection of
personnel data. For more information: http://stecf.jrc.ec.europa.eu/adm-declarations
Name Address1 Tel. Email
STECF members
Abella, J. Alvaro
Independent consultant Tel. 0039-3384989821
Andersen,
Jesper Levring (rapporteur)
Department of Food and
Resource Economics (IFRO)
Section for Environment and Natural Resources
University of Copenhagen
Rolighedsvej 25
1958 Frederiksberg
Denmark
Tel.dir.: +45 35
33 68 92
Arrizabalaga,
Haritz
AZTI / Unidad de
Investigación Marina, Herrera
kaia portualdea z/g 20110 Pasaia
(Gipuzkoa), Spain
Tel.:
+34667174477
Bailey, Nicholas (rapporteur)
Independent consultant [email protected]
Bertignac, Michel (rapporteur)
Laboratoire de Biologie Halieutique
IFREMER Centre de Brest
BP 70 - 29280 Plouzane,
France
tel : +33 (0)2 98 22 45 25 - fax : +33 (0)2 98 22 46 53
Borges, Lisa (rapporteur)
FishFix, Brussels, Belgium [email protected]
142
Name Address1 Tel. Email
STECF members
*Cardinale,
Massimiliano
Föreningsgatan 45, 330
Lysekil, Sweden
Tel: +46 523
18750
massimiliano.cardinale@
slu.se
Catchpole, Thomas
(rapporteur)
CEFAS Lowestoft Laboratory,
Pakefield Road,
Lowestoft
Suffolk, UK
NR33 0HT
Curtis, Hazel Sea Fish Industry Authority
18 Logie Mill
Logie Green Road
Edinburgh
EH7 4HS, U.K.
Tel: +44 (0)131 524 8664
Fax: +44 (0)131 558 1442
Daskalov, Georgi (rapporteur)
Laboratory of Marine Ecology,
Institute of Biodiversity
and
Ecosystem Research, Bulgarian
Academy of Sciences
Tel.: +359 52 646892
Döring, Ralf (vice-chair, repporteur)
Thünen Bundesforschungsinstitut, für Ländliche Räume, Wald und Fischerei, Institut für
Seefischerei - AG Fischereiökonomie, Palmaille 9, D-22767 Hamburg, Germany
Tel.: 040 38905-185
Fax.: 040 38905-
263
Gascuel, Didier (rapporteur)
AGROCAMPUS OUEST
65 Route de Saint Brieuc,
CS 84215,
F-35042 RENNES Cedex
France
Tel:+33(0)2.23.48.55.34
Fax: +33(0)2.23.48.55.
35
Knittweis, Leyla
(rapporteur)
Department of Biology
University of Malta
Msida, MSD 2080
Malta
143
Name Address1 Tel. Email
STECF members
Lloret, Josep
(rapporteur)
Associate Professor
(Professor Agregat), University of Girona (UdG), Spain
Malvarosa, Loretta (rapporteur)
NISEA, Fishery and Aquaculture Research, Via Irno, 11, 84135 Salerno, Italy
Tel: +39 089795775
Martin, Paloma (rapporteur)
CSIC Instituto de Ciencias del Mar
Passeig Marítim, 37-49
08003 Barcelona
Spain
Tel: 4.93.2309500
Fax: 34.93.2309555
Motova, Arina
Sea Fish Industry Authority
18 Logie Mill
Logie Green Road
Edinburgh
EH7 4HS, U.K
Tel.: +44 131 524 8662
Murua, Hilario
(rapporteur)
AZTI / Unidad de
Investigación Marina, Herrera
kaia portualdea z/g 20110 Pasaia
(Gipuzkoa), Spain
Tel: 0034
667174433
Fax: 94 6572555
*Nord, Jenny The Swedish Agency of Marine and Water Management (SwAM)
Tel. 0046 76 140 140 3
Prellezo, Raúl AZTI -Unidad de Investigación Marina
Txatxarramendi Ugartea
z/g
48395 Sukarrieta (Bizkaia), Spain
Tel: +34 667174368
Raid, Tiit
Estonian Marine Institute, University of Tartu, Mäealuse 14, Tallinn, EE-126, Estonia
Tel.: +372 58339340
Fax: +372 6718900
Sabatella, Evelina Carmen
NISEA, Fishery and Aquaculture Research, Via Irno, 11, 84135 Salerno, Italy
TEL.: +39 089795775
144
Name Address1 Tel. Email
STECF members
Sala, Antonello
(vice-chair)
Italian National Research
Council (CNR)
Institute of Marine Sciences (ISMAR), Largo Fiera della Pesca, 1
60125 Ancona - Italy
Tel: +39 071
2078841
Fax: +39 071 55313
Mob.: +39 3283070446
Scarcella, Giuseppe (rapporteur)
1) Italian National Research Council (CNR), Institute of Marine Sciences (ISMAR) -
Fisheries Section, Largo Fiera della Pesca, 1, 60125 Ancona – Italy
2) AP Marine Environmental Consultancy Ltd, 2, ACROPOLEOS ST.
AGLANJIA, P.O.BOX 26728
1647 Nicosia, Cyprus
Tel: +39 071 2078846
Fax: +39 071 55313
Tel.: +357 99664694
Soldo, Alen
Department of Marine
Studies, University of Split, Livanjska 5, 21000 Split, Croatia
Tel.:
+385914433906
Somarakis, Stylianos (rapporteur)
Institute of Marine Biological Resources and Inland Waters (IMBRIW), Hellenic Centre of Marine Research (HCMR),
Thalassocosmos Gournes, P.O. Box 2214, Heraklion 71003, Crete, Greece
Tel.: +30 2810 337832
Fax +30 6936566764
somarak@hcmr. gr
Stransky, Christoph (rapporteur)
Thünen Institute [TI-SF] Federal Research Institute for Rural Areas, Forestry and Fisheries, Institute of Sea Fisheries, Palmaille 9, D-22767 Hamburg,
Germany
Tel. +49 40 38905-228
Fax: +49 40 38905-263
Ulrich, Clara (chair)
Technical University of Denmark, National
Institute of Aquatic Resources, (DTU Aqua), Charlottenlund Slot, JægersborgAllé 1, 2920 Charlottenlund, Denmark
van Hoof, Luc IMARES, Haringkade 1, Ijmuiden, The Netherlands
Tel.: +31 61061991
145
Name Address1 Tel. Email
STECF members
Vanhee, Willy
(rapporteur)
Independent consultant [email protected]
van Oostenbrugge, Hans (rapporteur)
Fisheries Economics, Wageningen Economic Research, formerly LEI Wageningen UR, The Hague, The Netherlands
Vrgoc, Nedo (rapporteur)
Institute of Oceanography and Fisheries, Split, Setaliste Ivana Mestrovica 63, 21000 Split, Croatia
Tel.: +385 21408002
STECF members marked with an asterix* did not attend the PLEN-18-01 meeting (see section 2
of this report).
External experts
Rihan, Dominic BIM, Ireland [email protected]
Simmonds,
Edmund John
Independent expert [email protected]
om
European Commission
Name Address Telephone no. Email
JRC experts
Name Address Telephone no. Email
Casey, John DG Joint Research Centre JRC
Jardim, Ernesto
DG Joint Research Centre JRC

146
Biagi, Franco DG MARE, D.1 [email protected]
Doerner,
Hendrik
DG Joint Research Centre
JRC, STECF secretariat
Stecf-
GEORGITSI, Evangelia
DG MARE, D.3 [email protected]
Graham,
Norman
DG MARE, D.3 [email protected]
pa.eu
König, Szuzsanna
DG MARE, C.3 [email protected]
Kostopoulou,
Venetia
DG MARE, C3 venetia.kostopoulou@ec.
europa.eu
Lindebo, Erik DG MARE, C.1 [email protected]
Perez-Perera,
Amanda
DG MARE D.1 Amanda.Perez-
MARAVELIAS, Christos
DG MARE D.1 [email protected]

147
OSIO, Chato DG MARE D.1 [email protected]
SHRIVES,
Jonathan
DG MARE C.1 [email protected]
uropa.eu
148
.

149
KJ-A
X-18
-02
7-EN
-N
STECF
The Scientific, Technical and
Economic Committee for Fisheries
(STECF) has been established by
the European Commission. The
STECF is being consulted at
regular intervals on matters
pertaining to the conservation and
management of living aquatic
resources, including biological,
economic, environmental, social
and technical considerations.
JRC Mission
As the science and knowledge
service of the European
Commission, the Joint Research
Centre’s mission is to support EU
policies with independent,
evidence throughout the whole
policy cycle.
doi:10.2760/088784
ISBN 978-92-79-85804-8