scientific / technical report submitted to ... - chemreg.net - toxic...the present document has been...
TRANSCRIPT
The present document has been produced and adopted by the bodies identified above as author(s). This task has been carried out exclusively by the author(s) in the context of a contract between the European Food Safety Authority and the author(s), awarded following a tender procedure. The present document is published complying with the transparency principle to which the European Food Safety Authority is subject. It may not be considered as an output adopted by EFSA. EFSA reserves its rights, view and position as regards the issues addressed and the conclusions reached in the present document, without prejudice to the rights of the authors.
SCIENTIFIC / TECHNICAL REPORT submitted to EFSA
Cumulative Exposure Assessment of Triazole Pesticides1
Prepared by J.D. van Klaveren, G. van Donkersgoed, H. van der Voet2, C. Stephenson3 and P.E. Boon, RIKILT – Institute of Food Safety,
Wageningen University and Research Centre
Abstract
In the EFSA opinion on identification of new approaches to assess cumulative and synergistic risks from pesticides a tiered approach for cumulative risk assessment has been proposed.
The aim of this study is to demonstrate the feasibility of a higher tier assessment of cumulative exposure using probabilistic modelling. The input for the probabilistic software consisted of food consumption and residue concentration databases from Czech Republic, France, Italy, the Netherlands, Sweden, United Kingdom and Finland. Food as eaten as reported in each consumption database was converted back to their corresponding raw agricultural commodities.
A probabilistic Monte Carlo model was used to estimate the short-term intake. For long-term intake assessments three statistical models ISUF, BBN and IOM were used. The probabilistic models and the data were organized in the Monte Carlo Risk Assessment (MCRA) software. Cumulative exposure assessments were performed for different countries and different age groups. Half of the scenarios aimed at calculating the actual and half for MRL setting.
Short-term and long-term cumulative dietary exposure to triazoles can be calculated with probabilistic models in the European context. A statistical model assuming that the non-analyzed triazoles in samples are zero values might result in an underestimation of exposure. For long-term exposure assessments not all models applied in all cases and a significant model uncertainty was observed especially in scenarios where the exposure was bimodal
1 Project ID: NP/EFSA/PPR/2009/01. Accepted for Publication on 15 January 2010. 2 Biometris, Wageningen UR
3 Pesticide Safety Directorate, United Kingdom
Cumulative Exposure Assessment of Triazole Pesticides
2 The present document has been produced and adopted by the bodies identified above as author(s). This task has been carried out exclusively by the author(s) in the context of a contract between the European Food Safety Authority and the author(s), awarded following a tender procedure. The present document is published complying with the transparency principle to which the European Food Safety Authority is subject. It may not be considered as an output adopted by EFSA. EFSA reserves its rights, view and position as regards the issues addressed and the conclusions reached in the present document, without prejudice to the rights of the authors.
distributed. The IOM method can be applied in all cases but it was recognized that this method overestimates the exposure in the upper tail of the exposure distribution.
It was recommended to develop new statistical models to account for unbalanced data sets and bimodal distributions. Once the residue and consumption data are organised in the MCRA platform, which is the case for the countries included in this project, the simulation can be done easily via Internet.
Key words: cumulative exposure assessment, probabilistic modelling, triazole fungicide, Monte Carlo simulation

Cumulative Exposure Assessment of Triazole Pesticides
3 The present document has been produced and adopted by the bodies identified above as author(s). This task has been carried out exclusively by the author(s) in the context of a contract between the European Food Safety Authority and the author(s), awarded following a tender procedure. The present document is published complying with the transparency principle to which the European Food Safety Authority is subject. It may not be considered as an output adopted by EFSA. EFSA reserves its rights, view and position as regards the issues addressed and the conclusions reached in the present document, without prejudice to the rights of the authors.
Project number: 872.447.01
Project title: Cumulative Exposure Assessment
Project leader: J.D. van Klaveren
Report 2009.008 September 2009
Cumulative Exposure Assessment of Triazole Pesticides
J.D. van Klaveren, G. van Donkersgoed, H. van der Voet1, C. Stephenson
2 and P.E. Boon
Business Unit: Safety & Health
Group: Databases, Risk Assessment & Supply Chain Management
RIKILT – Institute of Food Safety
Wageningen University and Research Centre
Akkermaalsbos 2, 6708 WB
P.O. Box 230, 6700 AE
Wageningen, The Netherlands
Tel: +31 317 480 256
Fax: +31 317 417 717
Internet: www.rikilt.wur.nl
1 Biometris, Wageningen UR
2 Pesticide Safety Directorate, United Kingdom

Cumulative Exposure Assessment of Triazole Pesticides
4 The present document has been produced and adopted by the bodies identified above as author(s). This task has been carried out exclusively by the author(s) in the context of a contract between the European Food Safety Authority and the author(s), awarded following a tender procedure. The present document is published complying with the transparency principle to which the European Food Safety Authority is subject. It may not be considered as an output adopted by EFSA. EFSA reserves its rights, view and position as regards the issues addressed and the conclusions reached in the present document, without prejudice to the rights of the authors.
Copyright 2009, RIKILT - Institute of Food Safety and the European Food Safety Authority
The research described in this report was funded by EFSA, European Food Safety Authority and the
Dutch Food and Consumer Product Safety Authority.
The report is approved by EFSA European Food Safety Authority
Acknowledgements
For their contributions to this project we would like to thank Fanny Héraud and Amélie Crépet
(French Food Safety Authority, AFFSA), Jiri Ruprich (National Institute of Public Health, NIPH),
Angela Santilio (National Institute of Health, ISS), Kelevi Slivinen (Finnish Customs Laboratory,
FCL), Kettil Svensson (National Food Administration, NFA), Aida Turrini (National Research
Institute for Food and Nutrition, INRAN) and Waldo de Boer (Biometris, Wageningen UR).
Distribution list:
Dutch Food and Consumer Product Safety Authority (Prof. E. Schouten, Dr H.P.J.M. Notenborn,
Dr R.M.C. Theelen)
French Food Safety Agency, Quantitative Risk Assessment Team (F. Héraud)
National Food Administration, Sweden (K. Svensson, L. Busk)
Pesticide Safety Directorate, United Kingdom (P.Y. Hamey, Dr C. Stephenson)
National Institute of Public Health, Czech Republic (Prof J. Ruprich, DVM, PhD)
Istituto Nazionale di Ricerca per gli Alimenti e la Nutrizione, Unità di Statistica ed Economia
Alimentare, Italy (A. Turrini)
Istituto Superiore di Sanità, Dipartmento di Ambiente e Connessa Prevenzione Primaria, Italy (A.
Santilio)
Finnish Customs Laboratory (K. Slivinen)
Food Standards Agency (A. Boss, J. Shavila)
This report from RIKILT - Institute of Food Safety has been produced with the utmost care.
However, RIKILT does not accept liability for any claims based on the contents of this report.
Cumulative Exposure Assessment of Triazole Pesticides
5 The present document has been produced and adopted by the bodies identified above as author(s). This task has been carried out exclusively by the author(s) in the context of a contract between the European Food Safety Authority and the author(s), awarded following a tender procedure. The present document is published complying with the transparency principle to which the European Food Safety Authority is subject. It may not be considered as an output adopted by EFSA. EFSA reserves its rights, view and position as regards the issues addressed and the conclusions reached in the present document, without prejudice to the rights of the authors.
Summary
In the EFSA opinion on identification of new approaches to assess cumulative and synergistic risks
from pesticides to human health a tiered approach for cumulative risk assessment has been proposed.
The first tier is a deterministic approach using average and large portion consumption statistics. The
higher tiers include probabilistic exposure assessment and Benchmark Dose (BMD) modeling.
The aim of this study is to demonstrate the feasibility and applicability of a higher tier assessment of
cumulative exposure using probabilistic modeling in combination with the relative potency factor (RPF)
approach. The RPFs are used to weigh the toxicity of each pesticide relative to the toxicity of a chosen
index compound (pesticide). In this report we address both the short-term and long-term cumulative
exposure to triazoles using different statistical models.
The input for the probabilistic software consisted of food consumption and residue concentration
databases from several European countries, including Czech Republic, France, Italy, the Netherlands,
Sweden, United Kingdom and Finland (only residue concentration data). The food consumption
databases included the raw consumption data. Food as eaten was converted back to their corresponding
raw agricultural commodities (RACs) in order to make food as eaten compatible with the agricultural
commodities analyzed for triazoles.
The number of triazoles analyzed varied per country and per RAC. In many samples, not all triazoles
were always analyzed. For example, in some samples three triazoles were analysed, while in some other
samples four, five, six or more were analysed. A correct statistical model to cumulate the different
triazoles that could also deal with unbalanced data sets was not available during this project. Instead an
existing statistical model was used assuming that all triazoles were analysed in all samples. This
statistical model has been used in cumulative exposure assessments up till now. An alternative model to
assess the cumulative exposure using unbalanced data sets was developed in this project and used as
well. A drawback of this alternative model was that existing correlations in residues found in RACs
were not included. Pesticide use in agriculture will rule out certain combinations of triazoles and
consequently correlation in residues found exists.
A probabilistic Monte Carlo model was used to estimate the short-term intake. For long-term intake
assessments two statistical models (ISUF and BBN) were used. Results generated with both models
were compared. Cumulative exposure assessments were performed for different countries, different age
groups and for different scenarios. Half of the scenarios were aimed at calculating the actual exposure
using only monitoring data. In the other half of the scenarios maximum residue limits (MRLs),
supervised trials median residues (STMRs) or field trial data for one particular RAC were used as input
for calculating the possible exposures as a consequence of MRL setting. In this type of calculations
monitoring data for all other food (or RAC)-pesticide combinations were used to include a kind of
background level of cumulative exposure.
Cumulative Exposure Assessment of Triazole Pesticides
6 The present document has been produced and adopted by the bodies identified above as author(s). This task has been carried out exclusively by the author(s) in the context of a contract between the European Food Safety Authority and the author(s), awarded following a tender procedure. The present document is published complying with the transparency principle to which the European Food Safety Authority is subject. It may not be considered as an output adopted by EFSA. EFSA reserves its rights, view and position as regards the issues addressed and the conclusions reached in the present document, without prejudice to the rights of the authors.
The following conclusions were drawn:
1) Short-term and long-term cumulative dietary exposure to triazoles can be calculated with
probabilistic models in combination with the RPF approach.
2) The method was applicable for calculating both the actual exposure using monitoring data as the
possible exposure in the process of MRL setting.
3) Monte Carlo simulations can be used to calculate short-term cumulative exposure.
4) For long-term exposure assessments different models can be used. Not all models apply in all cases
and a significant model uncertainty was observed in a few calculation scenarios.
5) When for a particular RAC-pesticide combination MRL, STMR or field trial data were used and
monitoring data for other RAC-pesticide combinations a bimodal exposure distribution can be
expected. In such cases the lower part of the exposure distribution (first mode) relates to the daily
consumptions consisting of only food items for which monitoring results are used, and the other
part (second mode) to daily consumptions of the particular RAC for which MRL, STMR or field
trial data are used.
6) More research is needed on how to model bimodal distributions. However, first indications of
simulation studies suggest that ISUF and BBN may overestimate the exposure level at the higher
percentiles in the case of bimodality. If so, risk assessors may consider to calculate the distribution
of individual mean exposure levels based on the observed individual mean consumption reported
during the food consumption survey and average residue levels. This is regarded as a conservative
starting point for modeling long-term exposure levels.
7) A statistical model assuming that the non-analyzed triazoles in samples are zero values (non-
detects) might result in an underestimation of exposure. The alternative statistical model, which was
pragmatically programmed, models each triazole separately and then combines the results. This
alternative approach is assumed to be a more realistic, but also conservative, approach for
unbalanced data sets.
8) Results of probabilistic modeling using RPFs derived from Benchmark Dose modeling are
sometimes higher compared to results based on calculations using RPFs derived from NOAELs.
Benchmark Dose modeling is proposed as a higher tier assessment and higher tier assessment
should result in lower exposure levels because higher tier assessment includes less conservatism.
9) Uncertainty and sensitivity analyses demonstrated that different assumptions made and different
models can result in higher or lower exposure levels.
10) We were able to perform all cumulative exposure calculations using food consumption data from
several countries.
In conclusion the probabilistic model can be applied within the European context.
The most important recommendations are:
1) Development of statistical models to account for unbalanced data sets or to harmonize data
collection resulting in datasets that contain the same pesticides in all samples.

Cumulative Exposure Assessment of Triazole Pesticides
7 The present document has been produced and adopted by the bodies identified above as author(s). This task has been carried out exclusively by the author(s) in the context of a contract between the European Food Safety Authority and the author(s), awarded following a tender procedure. The present document is published complying with the transparency principle to which the European Food Safety Authority is subject. It may not be considered as an output adopted by EFSA. EFSA reserves its rights, view and position as regards the issues addressed and the conclusions reached in the present document, without prejudice to the rights of the authors.
2) Uncertainty and sensitivity analyses are needed to show where knowledge / data are lacking and
what the effect of assumptions is on the exposure result. We therefore recommend further
integration of exposure and BMD modeling aiming at a better quantification of the uncertainties in
the calculations, including the uncertainty in the derivation of the RPF.
3) The models and data used in this project demonstrated that probabilistic modeling can be done as a
higher tier assessment, but much effort is needed to make the models and data accessible and
compatible in the European context.
4) Further elaboration on a tiered approach to assure that exposure levels resulting from lower tier
assessments are higher (more conservative) than those calculated in higher tiers.

Cumulative Exposure Assessment of Triazole Pesticides
8 The present document has been produced and adopted by the bodies identified above as author(s). This task has been carried out exclusively by the author(s) in the context of a contract between the European Food Safety Authority and the author(s), awarded following a tender procedure. The present document is published complying with the transparency principle to which the European Food Safety Authority is subject. It may not be considered as an output adopted by EFSA. EFSA reserves its rights, view and position as regards the issues addressed and the conclusions reached in the present document, without prejudice to the rights of the authors.
Contents
Summary ................................................................................................................................................. 5
1 Introduction .................................................................................................................................... 10
2 Materials and methods ................................................................................................................... 13
2.1 Food consumption databases ................................................................................................... 13
2.2 Converting food as eaten to raw agricultural commodities ..................................................... 14
2.3 Pesticide residue monitoring.................................................................................................... 15
2.4 Scenarios performed ................................................................................................................ 19
2.5 Probabilistic modeling of dietary exposure to single triazoles ................................................ 20
2.6 Statistical models for cumulative exposure assessment .......................................................... 24
2.7 Relative Potency Factors ......................................................................................................... 27
2.8 Processing and variability factors ............................................................................................ 29
2.9 Uncertainties ............................................................................................................................ 29
2.10 MRLs, STMR and field trial data used in the cumulative intake assessments ........................ 31
3 Results ............................................................................................................................................. 32
3.1 Short-term or acute intake calculations using monitoring results and BMD-derived RPFs .... 32
3.1.1 Estimated exposure distributions ............................................................................................... 32
3.1.2 Contribution of RACs and individual triazoles ......................................................................... 33
3.2 Short-term or acute intake calculations
using monitoring results and NOAEL-derived RPFs ............................................................. 36
3.2.1 Estimated exposure distributions ............................................................................................... 36
3.2.2 Contribution of RACs and individual triazoles ......................................................................... 37
3.3 Long-term or chronic intake calculations
using monitoring results and NOAEL-derived RPFs ............................................................. 40
3.3.1 Estimated exposure distributions ............................................................................................... 40
3.3.2 Contribution of RACs and individual compounds .................................................................... 40
3.4 Short- and long-term intake calculations using MRLs, STMR or Field Trail data in
combination with monitoring data for other RACs ................................................................ 43
3.4.1 RAC-pesticide combinations using MRLs in acute exposure modeling ................................... 44
3.4.2 RAC-pesticide combinations using MRLs in the estimated chronic exposure .......................... 49
4 Discussion ........................................................................................................................................ 53
4.1 RPF approach .......................................................................................................................... 53
4.2 MRL-setting and a tiered approach ......................................................................................... 54
4.3 European dimension of the cumulative estimated exposure .................................................... 57
4.4 Uncertainties / sensitivity ........................................................................................................ 59

Cumulative Exposure Assessment of Triazole Pesticides
9 The present document has been produced and adopted by the bodies identified above as author(s). This task has been carried out exclusively by the author(s) in the context of a contract between the European Food Safety Authority and the author(s), awarded following a tender procedure. The present document is published complying with the transparency principle to which the European Food Safety Authority is subject. It may not be considered as an output adopted by EFSA. EFSA reserves its rights, view and position as regards the issues addressed and the conclusions reached in the present document, without prejudice to the rights of the authors.
4.4.1 Model uncertainties ................................................................................................................... 59
4.4.1.1 Cumulative exposure: Approach 1 or 2 ..................................................................................... 59
4.4.2 Assigning residue levels to samples with residue levels below LOR ........................................ 65
4.4.3 Uncertainty in residue and / or consumption data: bootstrap method........................................ 66
4.4.4 Other uncertainty ....................................................................................................................... 69
5 Conclusions and recommendations .............................................................................................. 70
References ............................................................................................................................................. 73
Annex 1 Description of the monitoring data per country .................................................................. 76
Annex 2 Extrapolation rules of pesticide analyses .......................................................................... 106
Annex 3 Extrapolation of pesticide residue levels as used in the exposure calculations ................ 107
Annex 4 Processing factors used in the exposure calculations ....................................................... 111
Annex 5 Variability factors used in the exposure calculations using monitoring data
per raw agricultural commodity ....................................................................................... 117
Annex 6 MRLs and field trial data for selected pesticide – RAC combinations ............................. 121
Annex 7 Contribution of RACs and compounds to acute cumulative estimated exposure after
replacing monitoring data of selected RAC-pesticide combinations with MRLs
or field trial data using NOAEL-derived RPFs ................................................................. 122
Annex 8 Contribution of RACs and compounds to chronic cumulative estimated exposure after
replacing monitoring data of selected RAC-pesticide combinations with MRLs
or field trial data using NOAEL-derived RPFs ................................................................. 125

Cumulative Exposure Assessment of Triazole Pesticides
10 The present document has been produced and adopted by the bodies identified above as author(s). This task has been carried out exclusively by the author(s) in the context of a contract between the European Food Safety Authority and the author(s), awarded following a tender procedure. The present document is published complying with the transparency principle to which the European Food Safety Authority is subject. It may not be considered as an output adopted by EFSA. EFSA reserves its rights, view and position as regards the issues addressed and the conclusions reached in the present document, without prejudice to the rights of the authors.
1 Introduction
Regulation (EC) No. 396/2005 on maximum residue levels (MRLs) of pesticides in or on food and feed
of plant and animal origin emphasises the importance of the development of a methodology that
accounts for additive and possible synergistic effects of pesticide residues on human health.
In the light of this Regulation EFSA organised a scientific colloquium to evaluate existing
methodologies, and, if appropriate, identify new approaches (EFSA 2007). The outcome of this
colloquium has provided a contribution to EFSA PPR Panel discussions. The colloquium reviewed the
four major steps in risk assessment in relation to cumulative and synergistic effects of pesticides. These
steps are:
Cumulative hazard assessment;
Non dose addition;
Choice of data for combined exposure;
Methodology for combined exposure.
Based on the outcome of this colloquium and further discussions within the PPR Panel, EFSA launched
a call for tender on cumulative exposure assessment of triazole pesticides. In this report we describe the
results that were generated in the EFSA project ‗Cumulative exposure assessment of triazoles
pesticides‘, which was performed as a result of this call. The results of this project will be considered in
an EFSA opinion on the practical use of a tiered approach of cumulative modeling of actual exposure or
theoretical possible exposure levels as a consequence of setting maximum residue limits (MRL). The
opinion is planned to be an addition on the first opinion of the Scientific Panel on Plant Protection
products and their Residues (PPR panel) to evaluate the suitability of existing methodologies and, if
appropriate the identification of new approaches, to assess cumulative and synergistic risks from
pesticides to human health with a view to set MRLs for those pesticides in the frame of Regulation (EG)
396/2005 (EFSA 2008). In this opinion a tiered approach has been proposed from a simple first tier
assessment using average and large portion size diets towards higher tiers using probabilistic modeling
and a RPF (Relative Potency Factor) or similar approaches. The RPF approach enables the risk assessor
to compare the relative toxicity of the different pesticides with each other and can be used as long as
there is a common mechanism of action of the different pesticide to be addressed in the assessment.
Exposure to different pesticides belonging to a common mechanism group can be calculated by using
this approach in combinations with food consumption data as existing in a whole food consumption
database (EFSA 2008).
The aim of this study is to demonstrate the feasibility and the applicability of probabilistic modeling in
combination with the proposed RPF-method taking into account that diets in Europe can vary, and that
the method should account for both short-term and long-term exposure to acute and chronic toxic

Cumulative Exposure Assessment of Triazole Pesticides
11 The present document has been produced and adopted by the bodies identified above as author(s). This task has been carried out exclusively by the author(s) in the context of a contract between the European Food Safety Authority and the author(s), awarded following a tender procedure. The present document is published complying with the transparency principle to which the European Food Safety Authority is subject. It may not be considered as an output adopted by EFSA. EFSA reserves its rights, view and position as regards the issues addressed and the conclusions reached in the present document, without prejudice to the rights of the authors.
pesticides. The methods should also be usable both in calculating actual exposure levels using existing
monitoring results as well as in the process of MRL setting for pesticides evaluated for authorisation.
In this report the terms acute and short-term intake or exposure, and chronic and long-term intake or
exposure are used alternatively meaning the exposure / intake during one single day and over a longer
period of time, respectively.
Current international risk assessments require an international approach. Consumer diets vary from
Northern to Southern Europe, and from Western to Eastern Europe, as well as the contamination of
products with pesticide residues. Within the EU-project SAFE FOODS (www.safefoods.nl; QLRT
number Food-CT-2004-506446 ) food consumption data of Denmark (DTU), Sweden (NFA), the
Netherlands (RIKILT), Italy (ISS and INRAN), and Czech Republic (NIPH) were made compatible
with each other. The food consumption data of the five countries was converted into consumption levels
of raw agricultural commodities (RAC) in order to solve incompatibility between analytical results
usually generated in RACs and food as eaten. Residue databases of those countries were also made
compatible with each other in terms of coding. Residue and food consumption data of the different
countries are connected via the Internet to the Monte Carlo Risk Assessment (MCRA) software (De
Boer and Van der Voet 2007). In this way an Electronic Platform was created which can be used in
performing exposure assessment in a standardised way addressing the exposure to pesticides in different
European countries.
The Electronic Platform among other models and databases, was used in the EFSA Opinion of the
Scientific Panel on Plant protection products and their Residues on a request from the Commission on
acute dietary intake assessment of pesticide residues in fruit and vegetables. Different scenarios were
calculated using probabilistic exposure calculations of single compounds covering approximately 200
different scenarios in order to clarify the Level of Protection related to different values for the variability
factor (EFSA 2007).
Consumption and/or residue concentration data of Finland, United Kingdom and France have been
added to this Electronic Platform of SAFE FOODS and data from Denmark have been removed because
of a possible conflict of interest of participating in this study by the DTU . Table 1 gives an overview of
the data used in this project. Details of data and models used in this study are given in Section 2.1 to 2.6.
EFSA provided the toxicological information needed for this study including RPFs based on dose-
response modeling (benchmark doses, BMDs) and on no-observed adverse effect levels (NOAEL). Not
all of the triazoles share a common mechanism of action. The RPFs of those triazoles sharing a common
mechanism of action are described in Section 2.7. Further details regarding the quality of the
toxicological data and the method for deriving critical effect sizes based on benchmark dose modeling
are not provided in this report, because the scope of this project was exposure assessment.
In Sections 3.1, 3.2 and 3.3 the results of short-term and long-term actual exposure levels using the
monitoring data in different countries are reported. This includes different scenarios using either

Cumulative Exposure Assessment of Triazole Pesticides
12 The present document has been produced and adopted by the bodies identified above as author(s). This task has been carried out exclusively by the author(s) in the context of a contract between the European Food Safety Authority and the author(s), awarded following a tender procedure. The present document is published complying with the transparency principle to which the European Food Safety Authority is subject. It may not be considered as an output adopted by EFSA. EFSA reserves its rights, view and position as regards the issues addressed and the conclusions reached in the present document, without prejudice to the rights of the authors.
monitoring data of a particular country or a database in which the monitoring data of the seven countries
were pooled (all monitoring_data_together_database).
In Sections 3.4 and 3.5 the results are reported of exposure assessment using MRL, STMR or field trial
data for nine different combinations of a certain crop or RAC and a certain pesticide in combination
with monitoring data for all other RAC – pesticide combinations. This was done to illustrate the
possible use of cumulative exposure calculations for MRL setting, again addressing short-term and
long-term (acute or chronic) exposure levels.
Table 1. List of institutes which have provided data and models in this project.
Name of Institute Short name Role in the project
RIKILT - Institute of Food Safety,
Wageningen UR (the Netherlands) RIKILT
Dutch food consumption data
Dutch pesticide residue concentration data
MCRA software including statistical knowledge
Pesticide Safety Directorate
(United Kingdom) PSD
UK pesticide residue concentration data
Organising, reporting and reviewing field trial data
from DARs.
Food Standards Agency FSA UK food consumption data
National Food Administration
(Sweden) NFA
Swedish food consumption data
Swedish pesticide residue concentration data
National Institute of Public Health
(Czech Republic) NIPH
Czech food consumption data
Czech pesticide residue concentration data
National Institute of Health (Italy) ISS Italian pesticide residue concentration data
National Research Institute for Food
and Nutrition (Italy) INRAN Italian food consumption data
French Food Safety Authority
(France) AFSSA
French food consumption data
French pesticide residue concentration data
Statistical input
Finnish Customs Laboratory (Finland) FCL Finnish pesticide residue concentration data
In Chapter 4 the results are discussed including the feasibility of probabilistic exposure assessment in
combination with the RPF method at the international level. We also discuss the calculation method in
the perspective of a tiered approach as proposed in the EFSA-opinion. A further elaboration is given
regarding the quality of the statistical model used for calculating the cumulative exposure and
uncertainties relevant for cumulative exposure assessment .
Finally conclusions and recommendations are drawn up in Chapter 5.
Cumulative Exposure Assessment of Triazole Pesticides
13 The present document has been produced and adopted by the bodies identified above as author(s). This task has been carried out exclusively by the author(s) in the context of a contract between the European Food Safety Authority and the author(s), awarded following a tender procedure. The present document is published complying with the transparency principle to which the European Food Safety Authority is subject. It may not be considered as an output adopted by EFSA. EFSA reserves its rights, view and position as regards the issues addressed and the conclusions reached in the present document, without prejudice to the rights of the authors.
2 Materials and methods
2.1 Food consumption databases
This section gives an overview of the food consumption data used in this study. A short overview is
provided in Table 2 and a more detailed description is given in the section below.
Czech Republic (CZ)
In CZ a food consumption survey (SISP04) was conducted between November 2003 and 2004 covering
a 1-year period, including all four seasons (Ruprich et al. 2006). In this study 2,177 persons aged 10 - 90
years and 413 persons aged 4 to 9 years were asked about their eating habits via two 24-h recalls. The
repeated recall was within a period of 1-6 months after the first recall and addressed another day of the
week. The study included all days of the week. Amounts consumed were estimated using either
photographs of portions for the most frequently consumed meals, as well as measuring guides, such as
spoons and cups. Respondents were randomly selected from about 60 selected regions in the country.
Italy (IT)
For Italy food consumption data collected by the Italian National Institute of Nutrition during the period
of 1994-1996 are included in the E-platform (INRAN; (Turrini et al. 2001)). Data were obtained from a
multi-centre study (15 centres). The sampling unit of the study was at a household level and each
individual of the household was asked to record their food consumption during 7 consecutive days using
the 7-d dietary record method (foods weighed by precision scales at home, estimated food record for out
of home consumption). Trained dieticians did the fieldwork. In total 2,734 individuals aged 0-94 years
participated. These persons were representative of the total Italian population (whole country and four
main geographical areas: North-West, North-East, Centre, South & Islands). An accurate revision of
each recorded diary led to the removal of around 1/3 (27.7%) of the individuals as bad-reporters,
resulting in the inclusion of the information of 1,978 individuals in the analyses. Post-calculation was
performed to verify the compliance of the final distribution with the original sample structure.
All seasons and all days of the week were included, except for festive periods such as Christmas and
Easter due to divergent food habits during those periods.
Sweden (SE)
Food consumption data from Sweden implemented in the E-platform is that of the ‗Riksmaten‘ study
(Becker 1999; Becker and Pearson 2002). This is a dietary study performed in 1997 and 1998 among
1,211 respondents (male and female) in the age of 18 to 75 years. Participants were asked to record their
food consumption during 7 consecutive days using the 7-d dietary record method. As in Denmark,
amounts consumed were estimated using photographs of portion sizes. The study was conducted from
January 1997 up to March 1998. All seasons as well as all days of the week are represented.
Cumulative Exposure Assessment of Triazole Pesticides
14 The present document has been produced and adopted by the bodies identified above as author(s). This task has been carried out exclusively by the author(s) in the context of a contract between the European Food Safety Authority and the author(s), awarded following a tender procedure. The present document is published complying with the transparency principle to which the European Food Safety Authority is subject. It may not be considered as an output adopted by EFSA. EFSA reserves its rights, view and position as regards the issues addressed and the conclusions reached in the present document, without prejudice to the rights of the authors.
The Netherlands (NL)
The food consumption data from the Netherlands included in the E-platform is that of the Dutch
National Food Consumption Survey (DNFCS3) of 1997/1998 (Anonymous 1998; Kistemaker et al.
1998). In this survey 6,250 non-institutionalized persons aged 1 - 97 years from 2,564 households were
selected from a stratified probability sample in the Netherlands. Respondents recorded their food intake
over two consecutive days using the 2-d dietary record method. Amounts eaten were weighed
accurately. The survey was distributed equally over the 7 days of the week and over 1 year (holidays
excluded).
Within the European Project Monte Carlo data was collected of 373 babies aged 8 -12 months.
Caretakers of the babies were asked to weight the food given to the babies as accurate as possible using
weighting scales. The survey was conducted from September 2000 until August 2001 (Boon et al.
2004).
France (FR)
For France, the food consumption data are coming from the Individual National Food Consumption
Survey (INCA) conducted in 1998 and 1999 (Volatier 2000). The original sample of 1985 healthy
adults (aged 15 and over) is representative of the French population through stratification (region of
residence, agglomeration size) and use of the quota method (age, gender, household size, individual
occupation and socio-professional status). An additional sample of 1018 children from 3–14 years-old is
available. Subjects were asked to complete a seven-day food record diary (consecutive days) as well as
other questionnaires on anthropometrical and socio-economical factors, throughout all four seasons of
the year. Amounts consumed were estimated using a validated photographic booklet (Hercberg et al.
1994). Adult people identified as under-reporters by comparing their reported energy intake to their
basal metabolic rate as estimated from the Schofield equations (Black 2000) were excluded from the
study. Thus, the final sample contained 341 children aged 3-6 years and 2151 individuals aged 7 and
over. This database is used by the French government for risk assessment purposes.
United Kingdom (UK)
Food consumption data from the UK are derived from published dietary surveys (Gregory et al. 2000).
The field work for the dietary surveys was conducted over 12 months whereby a weighed diary record
was taken for food consumed over 7 days. These data are provided to the Food Standard Agency.
2.2 Converting food as eaten to raw agricultural commodities
Residue monitoring is usually performed on agricultural crops or raw agricultural commodities (RACs),
sometimes including inedible parts. Consequently there is a discrepancy between food as measured and
food as eaten. In the cumulative exposure calculations not only the foods consumed as such (e.g. apple,
endive) should be addressed but also those present in processed dishes (e.g. pizza, apple juice). To

Cumulative Exposure Assessment of Triazole Pesticides
15 The present document has been produced and adopted by the bodies identified above as author(s). This task has been carried out exclusively by the author(s) in the context of a contract between the European Food Safety Authority and the author(s), awarded following a tender procedure. The present document is published complying with the transparency principle to which the European Food Safety Authority is subject. It may not be considered as an output adopted by EFSA. EFSA reserves its rights, view and position as regards the issues addressed and the conclusions reached in the present document, without prejudice to the rights of the authors.
overcome the incompatibility between food as measured and food as eaten, food conversion tables or
databases should be available.
In both the Netherlands (Van Dooren et al. 1995) and France such a conversion model is present. Food
consumption data of the other countries included in this assessment are converted back to their raw
agricultural products based on the experience of the Dutch food conversion method. Within the SAFE
FOODS project food consumption data from Denmark, Sweden, the Czech Republic and Italy were
linked as good as possible to similar foods coded in the Dutch food consumption survey. In this study
we also converted the food coded in the British Food Consumption Survey to RACs in a similar way.
The French recipe database makes the link between the 895 food items coded in the French
consumption survey and 153 RAC for which European MRLs are established according to Annex 1 of
Regulation 365/2005/EC. This database includes 402 recipes, which have been defined according to
both industrial process and recipes, but also to home cooking habits. For a description of the Dutch food
conversion model, see (Van Dooren et al. 1995).
2.3 Pesticide residue monitoring
This section overviews the monitoring data used in this study. It describes per country the number of
samples and the analytical methods used to generate the results. In all national monitoring programmes
samples were reported to contain no residue below a certain level (the so-called non- detects). This level
is termed in this report the level of reporting (LOR) and is just the value below which results will be
reported as ‗less than‘.
Czech Republic
For the Czech Republic data of 2004-2006 were available for six different triazoles. In Annex 1 the
number of analyses per item/compound is given, as well as the range of LORs per compound.
Depending on the food item the LOR may vary. For the analyses two different multi residual methods
for food and baby food were used. Both methods were based on LC/MS/MS. Data were collected as part
of the EU monitoring programme performed by the official control laboratory of the Czech Agriculture
and Food Inspection Authority (CAFIA). Beside these data for the EU coordinated programme also data
from the national control programme, produced by the CAFIA, were used.
Finland
For Finland, data of 2003-2006 were available for 15 different triazoles. The number of RACs sampled
and relevant for the cumulative exposure assessment is listed in Annex 1. The analyses are performed
by the Finnish Customs Laboratory (FCL). In Finland different multi residual methods are used. For
each method and compound the LOR is given (see Annex 1).
Cumulative Exposure Assessment of Triazole Pesticides
16 The present document has been produced and adopted by the bodies identified above as author(s). This task has been carried out exclusively by the author(s) in the context of a contract between the European Food Safety Authority and the author(s), awarded following a tender procedure. The present document is published complying with the transparency principle to which the European Food Safety Authority is subject. It may not be considered as an output adopted by EFSA. EFSA reserves its rights, view and position as regards the issues addressed and the conclusions reached in the present document, without prejudice to the rights of the authors.
The data used consist of the results of the national pesticide residues monitoring program. The program
is planned annually in co-operation by the National Food Safety Authority and Customs Authority. It
includes samples from farm gate, retail shops and wholesalers. Domestic (Finnish) products, products
from other EU member states, and imported (third country) products are covered. Most samples are
randomly collected but some are targeted to products with higher rate of pesticide occurrence. The data
incorporates also the annual EU coordinated programs.
The samples were analyzed using the so called Luke method (AOAC 985.22) with some modifications.
The method is based on acetone-water extraction of the samples. The analysis of the sample extracts is
made using GCEC, GCNP or GCMS detection for GC amenable compounds. This method is called GC
multimethod. An aliquot of the extract (of the above mentioned method) is taken and the solvent is
changed for methanol and LCMSMS analysis is carried out. This method is called LC multimethod. In
the data set used in this report both LC multimethod 1 and 2 were used. The only difference between
these methods is that method 2 covers a wider scope of pesticides.
Italy
For Italy, residue concentration data of 2002-2004 were available for 16 different triazoles. In Annex 1
the number of analyses per item/compound is listed. Data were derived from the official monitoring
program according to EU regulation (EU coordinate program) and national law (Ministerial decree).
The analyses were performed by laboratories of the Italian regions and all data were collected by the
Ministry of Health. Although no specific information is supplied in the reports publishing the residue
concentration data, it can be declared that all analyses were performed using routine multi-residue
methods. No information on level of LOR was provided.
Sweden
For Sweden, data for the years 2003-2006 is available for 9 different triazoles. The data has been
collected within the in EU monitoring programme according to EU regulation. The analytical methods
are mainly developed by the NFA but for the validation of the methods and the results NFA cooperates
with the laboratory Lantmännen Analycen AB (ALC). Most pesticide residues are measured and
reported from the limit of determination (LOD).
The Netherlands
For the Netherlands, data of 2002-2007 were available for 23 different triazoles. Data were derived from
the official monitoring program prescribed by the European Commission and performed by the Dutch
Food and Consumer Product Safety Authority (VWA), including also data from other sources. In Annex
1 the number of samples for the relevant triazoles is listed.
The analyses were performed by different Dutch laboratories, including VWA, Laboratory Zeeuws
Vlaanderen, Agro Control, and TNO-BLGG AgriQ BV. The VWA performs the analyses as part of
directives 90/642/EEC (products of plant origin), 86/362/EEC (cereals) and recommendation
2002/663/EU (the harmonised specific programme 2003). The validity of the analytical results in all
Cumulative Exposure Assessment of Triazole Pesticides
17 The present document has been produced and adopted by the bodies identified above as author(s). This task has been carried out exclusively by the author(s) in the context of a contract between the European Food Safety Authority and the author(s), awarded following a tender procedure. The present document is published complying with the transparency principle to which the European Food Safety Authority is subject. It may not be considered as an output adopted by EFSA. EFSA reserves its rights, view and position as regards the issues addressed and the conclusions reached in the present document, without prejudice to the rights of the authors.
labs is governed by a quality assurance system complying with ISO17025. The LOR for the analyses
varies depending on the pesticide-commodity combination and the year of analysis, and is between
0.01-0.05 mg/kg.
France
For France, data for the years 2004-2006 were available for 21 different triazoles. The analyses were
performed by the Direction Générale de la Concurrence, de la Consommation et de la Repression de
Fraude (DGCCRF) of the French Department on Consumers‘ Affairs. The provided data comprised
results from both nationwide (including EU coordinated programme) and local programmes.
These various programmes may be unspecific (monitoring plans for pesticides residues in fruit and
vegetables, in cereals, etc) or targeted on specific practices (e.g. organic farming) and processes (e.g.
wine making).
Analyses were carried out by seven DGCCRF laboratories. The performed multiresidual methods were
based on Gas Chromatography GC (Mestres method or NF EN 12393 or TSD method) or Liquid
Chromatography LC (LC/MS) according to the laboratory, the year and the food-pesticide combination.
The limit of quantification (LOQ) depends on the pesticide, the laboratory, the method and the year of
analysis and is between 0.01 and 0.5 mg/kg. The number of analyses for each compound and the LOR
are listed in Annex 1.

Cumulative Exposure Assessment of Triazole Pesticides
18
The present document has been produced and adopted by the bodies identified above as author(s). This task has been carried out exclusively by the author(s) in the context of a contract between the European Food Safety Authority and the author(s), awarded following a tender procedure. The present document is published complying with the transparency principle to which the European Food Safety Authority is subject. It may not be considered as an output adopted by EFSA. EFSA reserves its rights, view and position as regards the issues addressed and the conclusions reached in the present document, without prejudice to the rights of the authors.
Table 2. Overview of food consumption data used in the cumulative exposure assessments
a Age range is in months
b Breast-fed children were not included
Country Years of
survey
Age
range (y)
Sample
size
Number
of days
Consecutive
days
Survey
method
Weighed/estimated
food weights
Comments References
Czech Republic 2003-4 10-90 2177 2 No 24h recall Estimated All days and seasons (Ruprich et al. 2006)
Czech Republic 2003-4 4-9 413 2 No 24h recall Estimated All days and seasons (Ruprich et al. 2006)
France 1998-9 3-6 340 7 Yes Dietary
record
Estimated All days and seasons (Volatier 2000)
France 1998-9 7-92 2150 7 Yes Dietary
record
Estimated All days and seasons (Volatier 2000)
Italy 1994-6 1-17 283 7 Yes Dietary
record
Estimated Excluded festive days (Turrini et al. 2001)
Italy 1994-6 18-64 1482 7 Yes Dietary
record
Estimated Excluded festive days (Turrini et al. 2001)
Sweden 1997-8 17-79 1211 7 Yes Dietary
record
Estimated All days and seasons (Becker 1999; Becker and Pearson
2002)
Sweden 2003 3-13 2540 4 Yes Dietary
record
Estimated All days, 2 seasons Not published as far as known
The Netherlands 1997-8 1-97 6250 2 Yes Dietary
record
Weighed All days and seasons (Anonymous 1998)
The Netherlands 1997-8 1-6 530 2 Yes Dietary
record
Weighed Subset of survey above (Anonymous 1998)
The Netherlands 2002-3 8-12a 373 1 - Dietary
record
Weighed All days and seasonsb (Boon et al. 2004)
UK 1997-8 4-18 1701 7 Yes Dietary
record
Weighed All days and seasons (Gregory et al. 2000)

Cumulative Exposure Assessment of Triazole Pesticides
19 The present document has been produced and adopted by the bodies identified above as author(s). This task has been carried out exclusively by the author(s) in the context of a contract between the European Food Safety Authority and the author(s), awarded following a tender procedure. The present document is published complying with the transparency principle to which the European Food Safety Authority is subject. It may not be considered as an output adopted by EFSA. EFSA reserves its rights, view and position as regards the issues addressed and the conclusions reached in the present document, without prejudice to the rights of the authors.
United Kingdom
For the United Kingdom, data of 2003-2007 were available for 12 triazoles. The number of analyses
for each compound is listed in Annex 1, as well as the number of positive finding. The data comprise
the combined results of the UK‘s Pesticide Residue Committee (PRC) surveillance programme and the
national School Fruit and Vegetable Scheme (A Department of Health initiative providing fruit and
vegetables to primary school children) and include also the UK findings for the EU co-ordinated
programme which are incorporated in the PRC data.
Analyses were performed by four contact laboratories that participate in the UK programme (Central
Science Laboratory, LGC Ltd, Scottish Agricultural Science Agency and Direct Laboratories). Each
laboratory has both an LC and a GC multi-residue method which are used to analyse for the 12
triazoles; whether a compound is analyzed by LC or GC will differ between laboratories. The LOR for
the analyses varies depending on the pesticide-commodity combination and the year of analysis, but in
general is between 0.01-0.05 mg/kg.
Extrapolation when monitoring data were not available
Not always all pesticides belonging to the common mechanism group were analyzed in all possible
RACs (Annex 1). To make the exposure calculations as complete as possible, we therefore
extrapolated residue levels analyzed in similar RACs to not analyzed RACs. For example,
tebuconazole levels in pear were extrapolated to levels in apple if tebuconazole was not analyzed in
apple. See Annex 2 for the extrapolation rules provided by EFSA. In Annex 3 the practical application
of these rules to the different national residue concentration databases is listed.
2.4 Scenarios performed
The calculations were performed using the monitoring data of each country in combination with the
consumption data of that particular country. Within the EFSA opinion on acute dietary intake it was
recognized that uncertainties in the results were partly driven by the completeness of monitoring and
the differences in monitoring practices between countries (EFSA 2007). We therefore merged
monitoring data of the separate counties into one common residue concentration database, and
combined this ‗all monitoring data together‘ database with the consumption data of the individual
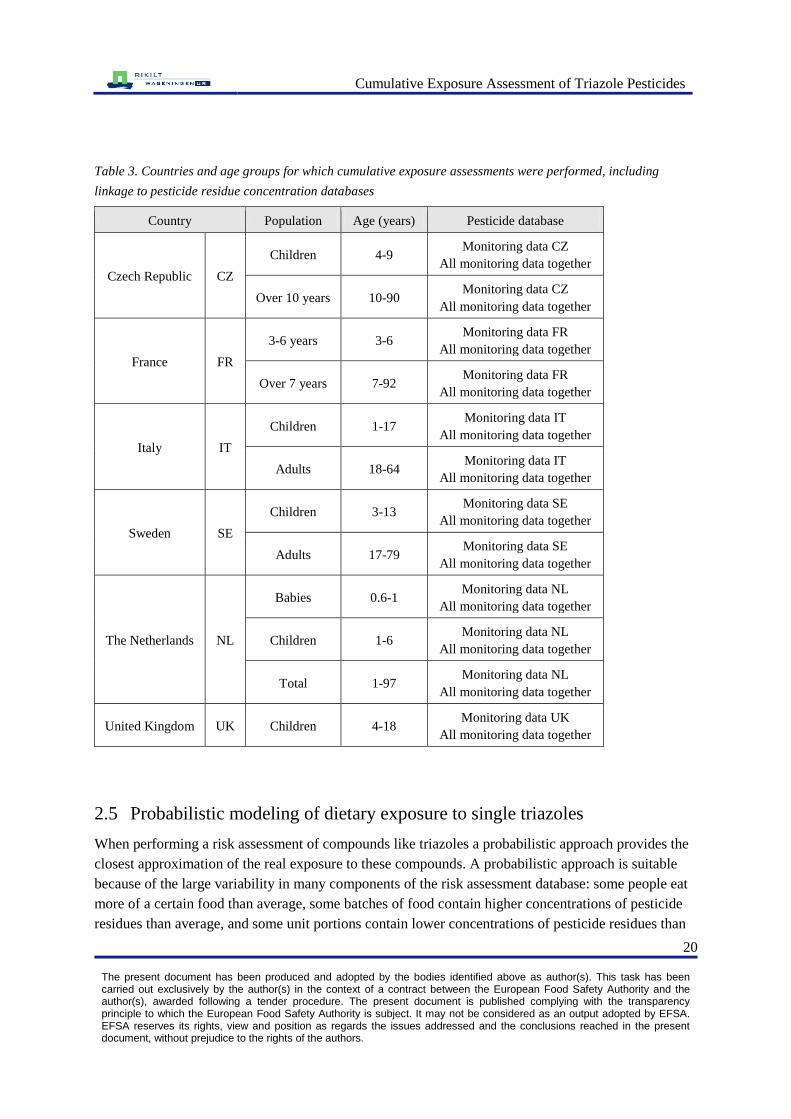
countries listed in Table 3. In total we performed 24 different scenarios (Table 3). Samples with levels
below LOR were assumed to contain no residue.
Cumulative Exposure Assessment of Triazole Pesticides
20 The present document has been produced and adopted by the bodies identified above as author(s). This task has been carried out exclusively by the author(s) in the context of a contract between the European Food Safety Authority and the author(s), awarded following a tender procedure. The present document is published complying with the transparency principle to which the European Food Safety Authority is subject. It may not be considered as an output adopted by EFSA. EFSA reserves its rights, view and position as regards the issues addressed and the conclusions reached in the present document, without prejudice to the rights of the authors.
Table 3. Countries and age groups for which cumulative exposure assessments were performed, including
linkage to pesticide residue concentration databases
Country Population Age (years) Pesticide database
Czech Republic CZ
Children 4-9 Monitoring data CZ
All monitoring data together
Over 10 years 10-90 Monitoring data CZ
All monitoring data together
France FR
3-6 years 3-6 Monitoring data FR
All monitoring data together
Over 7 years 7-92 Monitoring data FR
All monitoring data together
Italy IT
Children 1-17 Monitoring data IT
All monitoring data together
Adults 18-64 Monitoring data IT
All monitoring data together
Sweden SE
Children 3-13 Monitoring data SE
All monitoring data together
Adults 17-79 Monitoring data SE
All monitoring data together
The Netherlands NL
Babies 0.6-1 Monitoring data NL
All monitoring data together
Children 1-6 Monitoring data NL
All monitoring data together
Total 1-97 Monitoring data NL
All monitoring data together
United Kingdom UK Children 4-18 Monitoring data UK
All monitoring data together
2.5 Probabilistic modeling of dietary exposure to single triazoles
When performing a risk assessment of compounds like triazoles a probabilistic approach provides the
closest approximation of the real exposure to these compounds. A probabilistic approach is suitable
because of the large variability in many components of the risk assessment database: some people eat
more of a certain food than average, some batches of food contain higher concentrations of pesticide
residues than average, and some unit portions contain lower concentrations of pesticide residues than
Cumulative Exposure Assessment of Triazole Pesticides
21 The present document has been produced and adopted by the bodies identified above as author(s). This task has been carried out exclusively by the author(s) in the context of a contract between the European Food Safety Authority and the author(s), awarded following a tender procedure. The present document is published complying with the transparency principle to which the European Food Safety Authority is subject. It may not be considered as an output adopted by EFSA. EFSA reserves its rights, view and position as regards the issues addressed and the conclusions reached in the present document, without prejudice to the rights of the authors.
average. Moreover, in a cumulative assessment it is unlikely that all individual compounds will be at a
high value simultaneously, as would be assumed in typical deterministic approaches.
Probabilistic exposure assessments require the use of statistical programs. In acute assessments a
common approach is to combine consumption and concentration distributions by Monte Carlo
simulation. In chronic assessments a crucial step is to reconstruct the usual intake distribution from the
observed data on multiple days per person. In this study the Monte Carlo Risk Assessment (MCRA)
program was used, a program suitable for both acute and chronic exposure assessment (De Boer and
Van der Voet 2007). The program is available on the internet for registered users1, and is connected to
an electronic platform of food consumption and chemical concentration databases. In this section we
describe the existing MCRA system for single compounds, and in the next section adaptations for
cumulative exposure assessment.
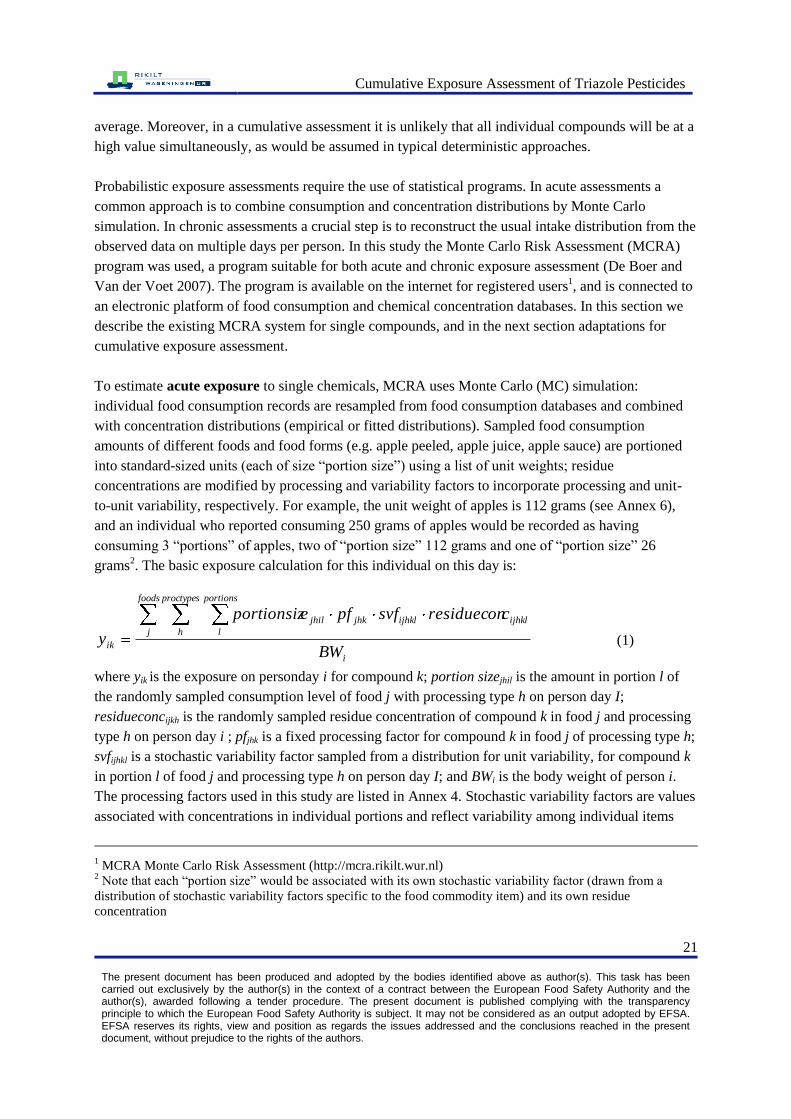
To estimate acute exposure to single chemicals, MCRA uses Monte Carlo (MC) simulation:
individual food consumption records are resampled from food consumption databases and combined
with concentration distributions (empirical or fitted distributions). Sampled food consumption
amounts of different foods and food forms (e.g. apple peeled, apple juice, apple sauce) are portioned
into standard-sized units (each of size ―portion size‖) using a list of unit weights; residue
concentrations are modified by processing and variability factors to incorporate processing and unit-
to-unit variability, respectively. For example, the unit weight of apples is 112 grams (see Annex 6),
and an individual who reported consuming 250 grams of apples would be recorded as having
consuming 3 ―portions‖ of apples, two of ―portion size‖ 112 grams and one of ―portion size‖ 26
grams2. The basic exposure calculation for this individual on this day is:
i
foods
j
proctypes
h
portions
l
ijhklijhkljhkjhil
ikBW
cresidueconsvfpfeportionsiz
y (1)
where yik is the exposure on personday i for compound k; portion sizejhil is the amount in portion l of
the randomly sampled consumption level of food j with processing type h on person day I;
residueconcijkh is the randomly sampled residue concentration of compound k in food j and processing
type h on person day i ; pfjhk is a fixed processing factor for compound k in food j of processing type h;
svfijhkl is a stochastic variability factor sampled from a distribution for unit variability, for compound k
in portion l of food j and processing type h on person day I; and BWi is the body weight of person i.
The processing factors used in this study are listed in Annex 4. Stochastic variability factors are values
associated with concentrations in individual portions and reflect variability among individual items
1 MCRA Monte Carlo Risk Assessment (http://mcra.rikilt.wur.nl)
2 Note that each ―portion size‖ would be associated with its own stochastic variability factor (drawn from a
distribution of stochastic variability factors specific to the food commodity item) and its own residue
concentration

Cumulative Exposure Assessment of Triazole Pesticides
22 The present document has been produced and adopted by the bodies identified above as author(s). This task has been carried out exclusively by the author(s) in the context of a contract between the European Food Safety Authority and the author(s), awarded following a tender procedure. The present document is published complying with the transparency principle to which the European Food Safety Authority is subject. It may not be considered as an output adopted by EFSA. EFSA reserves its rights, view and position as regards the issues addressed and the conclusions reached in the present document, without prejudice to the rights of the authors.
which comprise a given consumed amount. The variability between the portions in the consumed
amount is taken equal to the variability between units in a composite sample. While the traditional
variability factor is defined as the ratio between the concentration in the 97.5th percentile item in a
composite and the mean of that composite (see annex 5 for the values used), the stochastic variability
factors used in the MCRA model are sampled from a statistical distribution (in this work a lognormal
distribution was used), and more appropriately reflect the natural variation that may be seen in
concentrations in individual items that occur in a composite sample. The MCRA manual (De Boer and
Van der Voet 2007) describes how a variability factor is transformed to the variance parameter of a
lognormal distribution, from which a stochastic variability factor svf can be repeatedly generated and
sampled in the simulations3. The resulting simulated exposure distribution reflects the variability of
the underlying data. Inference about the population at risk can be derived from this distribution.
To estimate chronic exposure to chemicals, basically three methods are implemented in MCRA, all of
which analyse the data set of daily exposures calculated as
i
foods
j
proctypes
h
jhkjhkitjh
itkBW
cresidueconpfnconsumptio
y (2)
where yitk is the exposure on day t of person i for compound k, consumptionitjh is the consumed level of
food j with processing h on day t of person i, and residueconcjhk is the average concentration of
compound k in food j with processing h. It may be noted that for chronic risk concentration variability
3 Briefly, a traditional variability factor is defined as the ratio between the 97.5 percentile concentration of the
individual measurements making up a composite sample to the mean concentration of that composite sample.
Given an assumed lognormal distribution for residues making up that composite, the ratio of the 97.5 percentile
concentration (p97.5) to the (arithmetic) mean concentration can be estimated as follows:
)2
196.1exp(
)2
1exp(
)96.1exp(5.97 2
2mean
p
where μ and σ are the corresponding (arithmetic) mean and standard deviation of the log-transformed
concentrations. The above equation is solved for σ and the distribution of stochastic variability factors for use in
Equation (1) is defined as a lognormal distribution with an geometric mean of eμ and a geometric standard
deviation of eσ. For example, assume that a composite sample of apples is measured and found to contain a
concentration of 2 µg/kg for apples. The variability factor for apples is 3.6 (per Annex 5). Solving the above
equation for σ, we find that σ = 0.83 (the smaller of the two roots, 3.09 and 0.83). Thus the stochastic variability
factor for this composite sample is drawn from a lognormal distribution with a geometric mean 1.42 (calculated
as exp(ln(2) - 0.5*(0.83)2
as seen in the above equation ) and a GSD of exp(0.83) = 2.3. The coefficient of
variation associated with this lognormal distribution can be calculated as CV= √(exp(σ2 ) -1) or 1.05. Note the
lognormal option of MCRA does not truncate the distribution at the maximum possible value in the composite
because it simulates values for any new apple in the population (not just the apples in the composite sample
itself). On the other hand, the maximum possible value for a single apple in a composite of (for example) 15
apples with an average concentration of 2 ppb would be 30 ppb: this would occur if all residues were in one
apple from that composite. For this case another distribution can be used in MCRA (the beta model), which was
however not used in this study.

Cumulative Exposure Assessment of Triazole Pesticides
23 The present document has been produced and adopted by the bodies identified above as author(s). This task has been carried out exclusively by the author(s) in the context of a contract between the European Food Safety Authority and the author(s), awarded following a tender procedure. The present document is published complying with the transparency principle to which the European Food Safety Authority is subject. It may not be considered as an output adopted by EFSA. EFSA reserves its rights, view and position as regards the issues addressed and the conclusions reached in the present document, without prejudice to the rights of the authors.
is not relevant and that division of the consumed amounts in separate portions is unnecessary. The
exposures are calculated for multiple days per individual. The resulting exposure values are analyzed,
usually after data transformation, to derive a chronic exposure distribution by variance component
modeling to discern between-individual and within-individual (between-day) components.
The first method of analysis is a simple approach: all day exposures are averaged per individual, and
the resulting distribution of observed invidual means (OIM) is interpreted as the chronic exposure
distribution. However, the observed individual means are more variable than the true long-term
exposures unless there are many measured days per individual (which is typically not the case).
Consequently, high percentiles in the OIM distribution are expected to be conservative (too high). The
second method of analysis is a parametric approach: exposure frequencies (frequencies of exposure
>0) are modelled using a beta binomial model. Then, positive exposure amounts are transformed to
approximate normality and the usual intake distribution is derived. Both exposure frequency and the
amount distribution may be related to a covariable (e.g. age) and/or cofactor (e.g. sex) to obtain
covariable- and/or cofactor-dependent estimates. This model is referred to as the Beta Binomial
Normal (BBN) model (De Boer and van der Voet 2007) and is similar to the model proposed by Slob
(Slob 2006). The third method of analysis is referred to as the ISUF model, and is a discrete/semi-
parametric approach following the basic ideas of Nusser et al. (Nusser et al. 1996; Nusser et al. 1997)
and Dodd (Dodd 1996). In this project the BBN and ISUF models were used for chronic exposure
assessments, and the ISUF model was considered to be preferable for MRL assessments, because of
lack of normality even after a simple transformation. This model provides a larger flexibility in
modeling the distributional form of usual intakes. The long term exposure results presented in Section
3.3 and 3.4 are therefore all based on the ISUF model. However, recent research indicate that also the
ISUF model may not always be optimal for estimating percentiles of a non-normal exposure
distribution (De Boer et al, in prep.), although in many practical cases no problems are expected.
However, especially with strongly bimodal data, such as obtained in the field trial scenarios (see
Section 2.10), risk assessors may want to use the simple though conservative IOM method as a starting
point.
In addition, MCRA offers the possibility to assess the sampling uncertainty of estimates by bootstrap
sampling of consumers and/or compound concentration data.
Through model options as unit variability, replacement of values below LOR and the use of processing
factors different scenarios can be investigated and compared. Processing factors are used when
concentrations in the consumed food differ from the concentrations in the food as measured. In this
study processing values are considered as fixed factors and not as distributions.
MCRA delivers concise summaries of input data and resulting output. Percentiles of exposure and
uncertainty limits are reported, or percentages based on predefined exposure limits. The contribution
of foods to the exposure distribution is quantified, also allowing the user to zoom in on the upper tail
of the exposure distribution.

Cumulative Exposure Assessment of Triazole Pesticides
24 The present document has been produced and adopted by the bodies identified above as author(s). This task has been carried out exclusively by the author(s) in the context of a contract between the European Food Safety Authority and the author(s), awarded following a tender procedure. The present document is published complying with the transparency principle to which the European Food Safety Authority is subject. It may not be considered as an output adopted by EFSA. EFSA reserves its rights, view and position as regards the issues addressed and the conclusions reached in the present document, without prejudice to the rights of the authors.
The currently used version of the MCRA program (6.1) is written in C#. For a description of the
program and theoretical backgrounds of the statistical methods, see De Boer and Van der Voet (De
Boer and Van der Voet 2007).
2.6 Statistical models for cumulative exposure assessment
In this project there was no possibility to collect new data or develop new models. The chosen
approach was therefore restricted by current practical possibilities. Two possible approaches
(Approach 1 and 2) were addressed. The main difference between the approaches is how to deal with
samples in which not all triazoles are analyzed. Approach 1 starts with summing up the concentrations
of different triazoles in the same sample according to their corresponding RPF. This accounts for
correlations in the use pattern of pesticides. Because in practice not all samples are analyzed for all
triazoles it is difficult to assume the ‗possible‘ value of the non analyzed triazoles. Approach 1
considers these triazoles as non-detects (or zero values if we assume that a non-detect is a zero). This
might lead to an underestimation of the exposure because in reality those non analyzed triazoles might
have been positive values if they had been analyzed. Therefore we pragmatically created an alternative
approach which simulates all samples of each triazole separately and finally sums the results of the
separate simulations according to the corresponding RPF in a later stage of the cumulative exposure
calculations (Approach 2). In this approach the calculation was limited to the number of analyzed
values for each triazoles and no assumptions were made for non analyzed triazoles. Because Approach
1 could underestimate the exposure, Approach 2 was used in all calculations, with the exception of the
uncertainty analyses as described in Chapter 4. Below more statistical details are given.
Approach 1
A pragmatic approach for a short-term (acute) cumulative exposure assessment the basic Monte Carlo
calculation for a large number of simulated individual-days is to calculate:
i
foods
j
proctypes
h
portions
l
compounds
k
ijlhkkjhljhijhl
iBW
cresidueconRPFsvfpfeportionsiz
y (3)
where on a given day an individual i consumes portions l of foods j of processing type h, which may
contain residues from multiple compounds k. Individual portions portionsizeijhl are derived from
resampled consumption patterns consumptionijh and a dataset of unit weights per food type. The
individual has body weight BWi. Concentrations residueconcijlhk are resampled from the set of
concentrations residueconcks for compounds k as found in samples s. Correlations between compounds
in the chemical concentrations can be retained by resampling concentration vectors (for all compounds
simultaneously) from the set of samples. Residue concentrations are made comparable between
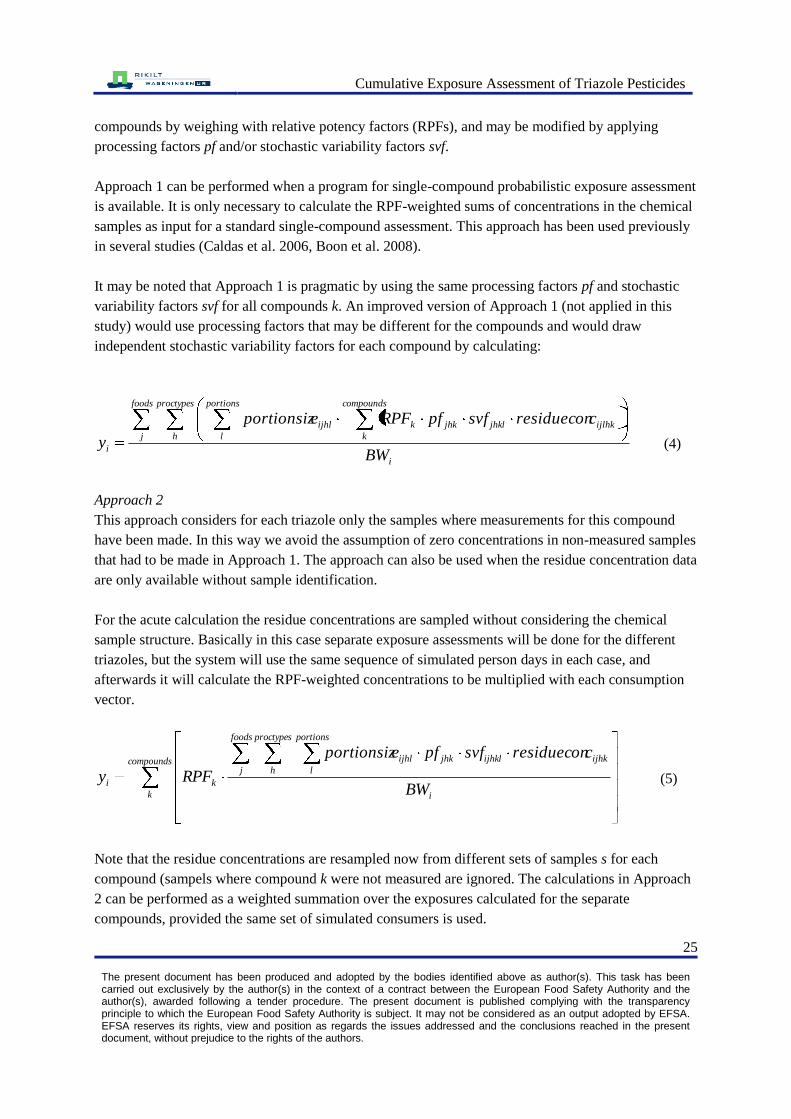
Cumulative Exposure Assessment of Triazole Pesticides
25 The present document has been produced and adopted by the bodies identified above as author(s). This task has been carried out exclusively by the author(s) in the context of a contract between the European Food Safety Authority and the author(s), awarded following a tender procedure. The present document is published complying with the transparency principle to which the European Food Safety Authority is subject. It may not be considered as an output adopted by EFSA. EFSA reserves its rights, view and position as regards the issues addressed and the conclusions reached in the present document, without prejudice to the rights of the authors.
compounds by weighing with relative potency factors (RPFs), and may be modified by applying
processing factors pf and/or stochastic variability factors svf.
Approach 1 can be performed when a program for single-compound probabilistic exposure assessment
is available. It is only necessary to calculate the RPF-weighted sums of concentrations in the chemical
samples as input for a standard single-compound assessment. This approach has been used previously
in several studies (Caldas et al. 2006, Boon et al. 2008).
It may be noted that Approach 1 is pragmatic by using the same processing factors pf and stochastic
variability factors svf for all compounds k. An improved version of Approach 1 (not applied in this
study) would use processing factors that may be different for the compounds and would draw
independent stochastic variability factors for each compound by calculating:
i
foods
j
proctypes
h
portions
l
compounds
k
ijlhkjhkljhkkijhl
iBW
cresidueconsvfpfRPFeportionsiz
y (4)
Approach 2
This approach considers for each triazole only the samples where measurements for this compound
have been made. In this way we avoid the assumption of zero concentrations in non-measured samples
that had to be made in Approach 1. The approach can also be used when the residue concentration data
are only available without sample identification.
For the acute calculation the residue concentrations are sampled without considering the chemical
sample structure. Basically in this case separate exposure assessments will be done for the different
triazoles, but the system will use the same sequence of simulated person days in each case, and
afterwards it will calculate the RPF-weighted concentrations to be multiplied with each consumption
vector.
compounds
k i
foods
j
proctypes
h
portions
l
ijhkijhkljhkijhl
kiBW
cresidueconsvfpfeportionsiz
RPFy (5)
Note that the residue concentrations are resampled now from different sets of samples s for each
compound (sampels where compound k were not measured are ignored. The calculations in Approach
2 can be performed as a weighted summation over the exposures calculated for the separate
compounds, provided the same set of simulated consumers is used.

Cumulative Exposure Assessment of Triazole Pesticides
26 The present document has been produced and adopted by the bodies identified above as author(s). This task has been carried out exclusively by the author(s) in the context of a contract between the European Food Safety Authority and the author(s), awarded following a tender procedure. The present document is published complying with the transparency principle to which the European Food Safety Authority is subject. It may not be considered as an output adopted by EFSA. EFSA reserves its rights, view and position as regards the issues addressed and the conclusions reached in the present document, without prejudice to the rights of the authors.
It should be noted that this way of calculation ignores possible correlations between the intake
distributions of the compounds.
Chosen approach for acute risk assessment
The advantage of Approach 1 over Approach 2 is its ability to incorporate correlations between
compound concentrations. In principle this leads to lower exposure estimates when such correlations
are negative (e.g. when compound A is never sprayed if compound B is being used) and to higher
exposure estimates when such correlations are positive (e.g. when compounds A and B are often used
as a mixture). A disadvantage of Approach 1 is that assumptions have to be made for non-measured
compounds. The typical assumption will be ignore all compounds in the samples for which no
measurement effort was made. This may lead to underestimation of the true exposure.
The advantage of Approach 2 over Approach 1 is that underestimation due to a wrong assumption of
zero concentration for non-measured compounds is avoided. A second advantage is practical:
concentration data may be used for each compound separately, and no identification of chemical
samples is necessary. The disadvantage of Approach 2 is of course that correlations are not modelled.
Some preliminary experiments made clear that the differences between results from the two
approaches may be large. There is uncertainty whether the assumption of zero concentrations for non-
measured triazoles is always warranted. Therefore Approach 2 has been chosen for use in this project.
A special program has been written to run MCRA assessments of the separate triazoles, and combine
the results for the cumulative assessment.
Approach for chronic risk assessment
Chronic exposure assessment is a more indirect calculation than acute exposure assessment. First, a
data set is constructed, then this data set is modelled by a statistical model (either IOM or BBN or
ISUF or any other, see 2.5), and finally usual intake distributions are sampled from these statistical
models.
For a long-term (chronic) exposure assessment the optimal basic calculation to create the data set of
daily intakes for the actual individuals (i) and days (t) in the consumption database would be:
i
foods
j
proctypes
h
compounds
k
jkjhkkitjh
itBW
cresidueconpfRPFnconsumptio
y (6)
As for acute assessment there is a choice how to use the residue concentration data. Average residue
concentrations may be calculated from the total set of samples, assuming zero for both non-detects and
non-measurements (as in Approach 1) or from separate sets per compound, assuming zero for non-
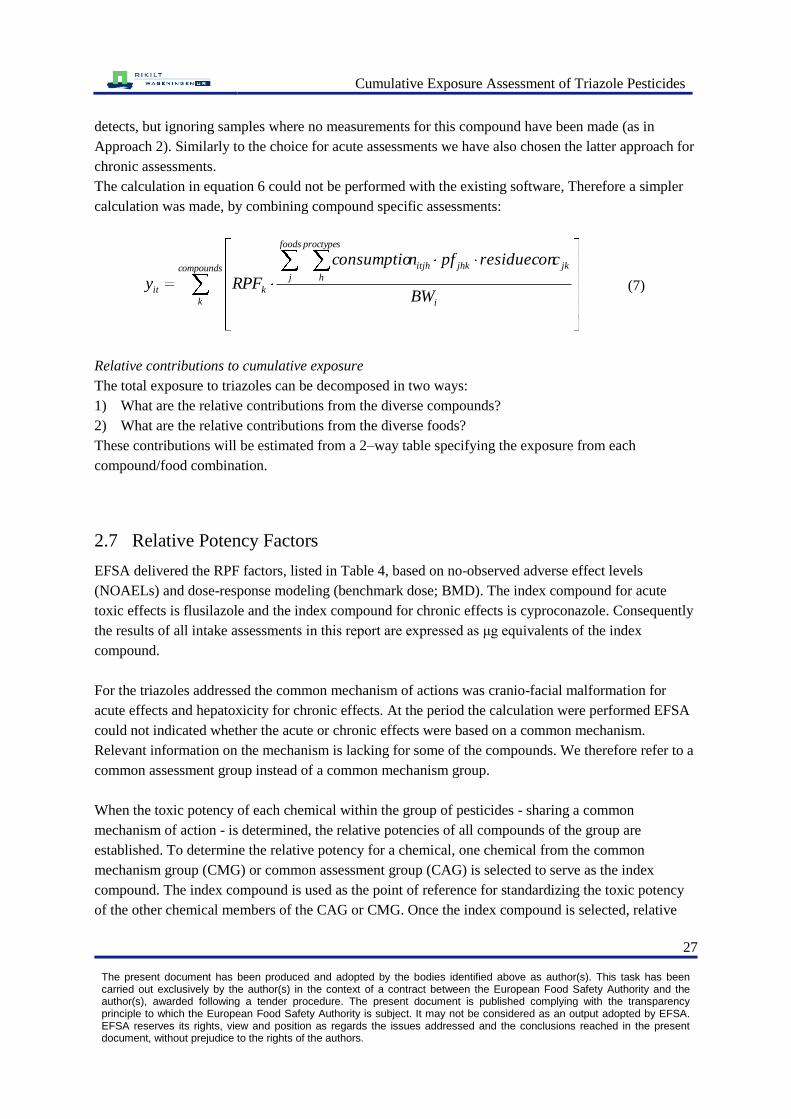
Cumulative Exposure Assessment of Triazole Pesticides
27 The present document has been produced and adopted by the bodies identified above as author(s). This task has been carried out exclusively by the author(s) in the context of a contract between the European Food Safety Authority and the author(s), awarded following a tender procedure. The present document is published complying with the transparency principle to which the European Food Safety Authority is subject. It may not be considered as an output adopted by EFSA. EFSA reserves its rights, view and position as regards the issues addressed and the conclusions reached in the present document, without prejudice to the rights of the authors.
detects, but ignoring samples where no measurements for this compound have been made (as in
Approach 2). Similarly to the choice for acute assessments we have also chosen the latter approach for
chronic assessments.
The calculation in equation 6 could not be performed with the existing software, Therefore a simpler
calculation was made, by combining compound specific assessments:
compounds
k i
foods
j
proctypes
h
jkjhkitjh
kitBW
cresidueconpfnconsumptio
RPFy (7)
Relative contributions to cumulative exposure
The total exposure to triazoles can be decomposed in two ways:
1) What are the relative contributions from the diverse compounds?
2) What are the relative contributions from the diverse foods?
These contributions will be estimated from a 2–way table specifying the exposure from each
compound/food combination.
2.7 Relative Potency Factors
EFSA delivered the RPF factors, listed in Table 4, based on no-observed adverse effect levels
(NOAELs) and dose-response modeling (benchmark dose; BMD). The index compound for acute
toxic effects is flusilazole and the index compound for chronic effects is cyproconazole. Consequently
the results of all intake assessments in this report are expressed as μg equivalents of the index
compound.
For the triazoles addressed the common mechanism of actions was cranio-facial malformation for
acute effects and hepatoxicity for chronic effects. At the period the calculation were performed EFSA
could not indicated whether the acute or chronic effects were based on a common mechanism.
Relevant information on the mechanism is lacking for some of the compounds. We therefore refer to a
common assessment group instead of a common mechanism group.
When the toxic potency of each chemical within the group of pesticides - sharing a common
mechanism of action - is determined, the relative potencies of all compounds of the group are
established. To determine the relative potency for a chemical, one chemical from the common
mechanism group (CMG) or common assessment group (CAG) is selected to serve as the index
compound. The index compound is used as the point of reference for standardizing the toxic potency
of the other chemical members of the CAG or CMG. Once the index compound is selected, relative
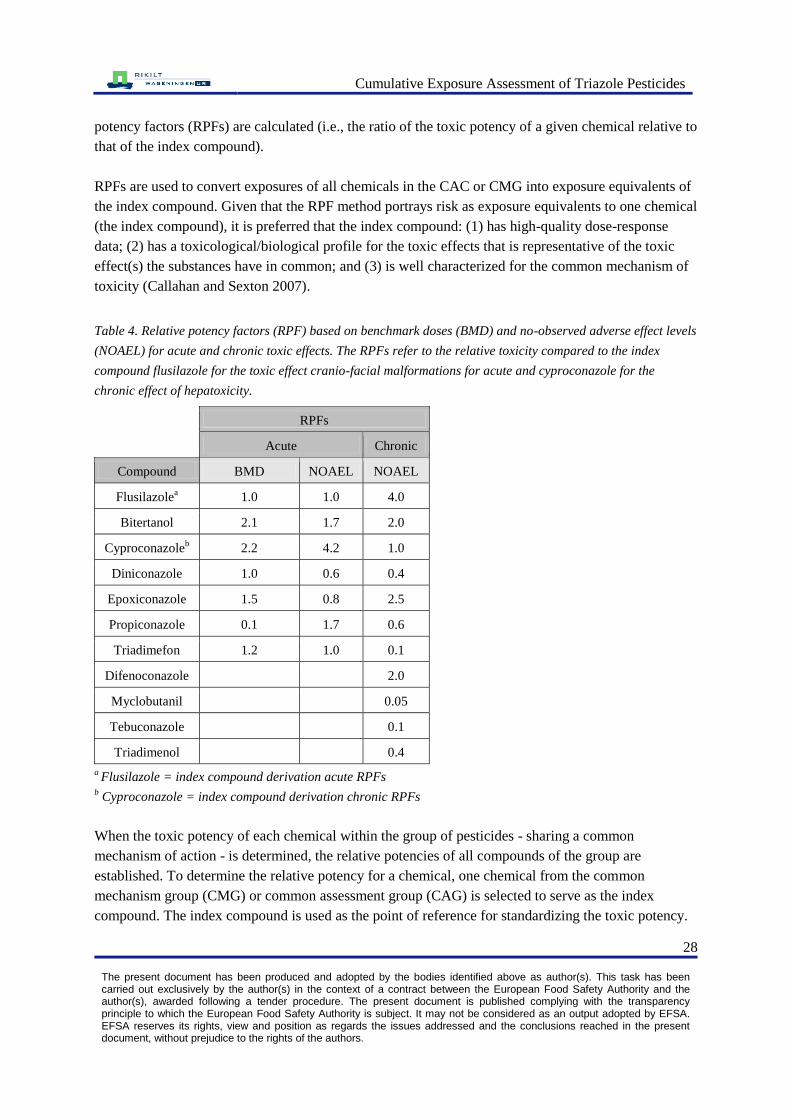
Cumulative Exposure Assessment of Triazole Pesticides
28 The present document has been produced and adopted by the bodies identified above as author(s). This task has been carried out exclusively by the author(s) in the context of a contract between the European Food Safety Authority and the author(s), awarded following a tender procedure. The present document is published complying with the transparency principle to which the European Food Safety Authority is subject. It may not be considered as an output adopted by EFSA. EFSA reserves its rights, view and position as regards the issues addressed and the conclusions reached in the present document, without prejudice to the rights of the authors.
potency factors (RPFs) are calculated (i.e., the ratio of the toxic potency of a given chemical relative to
that of the index compound).
RPFs are used to convert exposures of all chemicals in the CAC or CMG into exposure equivalents of
the index compound. Given that the RPF method portrays risk as exposure equivalents to one chemical
(the index compound), it is preferred that the index compound: (1) has high-quality dose-response
data; (2) has a toxicological/biological profile for the toxic effects that is representative of the toxic
effect(s) the substances have in common; and (3) is well characterized for the common mechanism of
toxicity (Callahan and Sexton 2007).
Table 4. Relative potency factors (RPF) based on benchmark doses (BMD) and no-observed adverse effect levels
(NOAEL) for acute and chronic toxic effects. The RPFs refer to the relative toxicity compared to the index
compound flusilazole for the toxic effect cranio-facial malformations for acute and cyproconazole for the
chronic effect of hepatoxicity.
RPFs
Acute Chronic
Compound BMD
NOAEL
NOAEL
Flusilazolea 1.0
1.0 4.0
Bitertanol 2.1 1.7 2.0
Cyproconazoleb
2.2 4.2 1.0
Diniconazole 1.0 0.6 0.4
Epoxiconazole 1.5 0.8 2.5
Propiconazole 0.1 1.7 0.6
Triadimefon 1.2 1.0 0.1
Difenoconazole 2.0
Myclobutanil 0.05
Tebuconazole 0.1
Triadimenol 0.4
a Flusilazole = index compound derivation acute RPFs
b Cyproconazole = index compound derivation chronic RPFs
When the toxic potency of each chemical within the group of pesticides - sharing a common
mechanism of action - is determined, the relative potencies of all compounds of the group are
established. To determine the relative potency for a chemical, one chemical from the common
mechanism group (CMG) or common assessment group (CAG) is selected to serve as the index
compound. The index compound is used as the point of reference for standardizing the toxic potency.

Cumulative Exposure Assessment of Triazole Pesticides
29 The present document has been produced and adopted by the bodies identified above as author(s). This task has been carried out exclusively by the author(s) in the context of a contract between the European Food Safety Authority and the author(s), awarded following a tender procedure. The present document is published complying with the transparency principle to which the European Food Safety Authority is subject. It may not be considered as an output adopted by EFSA. EFSA reserves its rights, view and position as regards the issues addressed and the conclusions reached in the present document, without prejudice to the rights of the authors.
2.8 Processing and variability factors
Where available the data were extracted from the relevant DARs and JMPR evaluations. The
processing factors were either determined through specific ‗nature and magnitude of residues‘ studies,
or calculated from the results of supervised residue trials where the distribution of residues in the RAC
had been studied, or additional processed commodities had been analyzed. No data were available for
cyproconazole as the notified use was on wheat (giving residues below 0.1 mg/kg) and no JMPR
report was available. Similarly diniconazole-M is used as seed treatment on cereals. Residues are not
sufficiently high to require processing studies. The processing factors used in the assessment are listed
in Annex 4.
A default variability factor of 3.6 was used for the calculations with the monitoring results (EFSA
2005). The UK consumer risk assessment models provided a number of specific variability factors, as
well as a list of init weights. See Annex 5 for variability factors and unit weights used per RAC.
2.9 Uncertainties
In this report we address various sources of uncertainty according to the principles mentioned in the
Opinion of the Scientific Committee related to uncertainties in dietary exposure assessment (EFSA
2006).
Model uncertainty
For two sets of food consumption and residue concentration data both approaches described in Section
2.6 will be applied to study differences in exposure. Also the differences between the two available
models within MCRA to model long-term exposure (BBN vs. ISUF) will be addressed (described in
Section 2.5), as well as two different approaches to model unit variability. Results of these simulations
are described in Section 4.4.1.
Assigning residue levels to samples with a level below LOR (non-detects)
To show the effect of assigning levels to non-detects on the overall cumulative exposure, we
performed calculations assigning either zero or ½ LOR to the non-detects of a selected RAC-pesticide
combination. In the US levels are assigned based on the percentage of the crop that has been treated
with the pesticide (EPA 2000). Due to absence of such statistics within the EU, we assumed that 10%,
50% or 100% of the selected RAC was treated with the pesticide. The calculations were performed for
acute exposure using BMD-derived RPFs and are described in Section 4.4.2.
Monitoring and consumption data
In this report we address the uncertainty related to the completeness of monitoring and the
representativeness of the data used. This was done by comparing the scenarios where consumption

Cumulative Exposure Assessment of Triazole Pesticides
30 The present document has been produced and adopted by the bodies identified above as author(s). This task has been carried out exclusively by the author(s) in the context of a contract between the European Food Safety Authority and the author(s), awarded following a tender procedure. The present document is published complying with the transparency principle to which the European Food Safety Authority is subject. It may not be considered as an output adopted by EFSA. EFSA reserves its rights, view and position as regards the issues addressed and the conclusions reached in the present document, without prejudice to the rights of the authors.
data were linked to both the ‗all monitoring together‘ database and the national monitoring databases.
Results are described in Section 4.3.
Another source of uncertainty is the limited size of the dataset for both residue concentration data and
food consumption data. To quantify these uncertainties in the exposure, we examined the uncertainty
in both data sources by using the bootstrap method (Efron 1979; Efron and Tibshirani 1993). With this
method a bootstrap database is generated of the same size as the original database for both food
consumption and residue levels by sampling with replacement from the original datasets. These
bootstrap databases are considered as databases that could have been obtained from the original
population if another sample was randomly drawn. These two bootstrap databases are then used for the
exposure calculations and derivation of the relevant percentiles. Repeating this process many times
results in a bootstrap distribution for each percentile that allows for the derivation of confidence
intervals around it.
Table 5. Scheme of bootstrapping to demonstrate the effect of small / large residue and food consumption
databases on the uncertainty in the resulting exposure percentiles.
Residue database Bootstrap Food consumption database Bootstrap
Small database Yes Large database No
Large database Yes Large database No
Large database No Small database Yes
Large database No Large database Yes
In this report we either bootstrapped residue concentration or consumption data of either a small or
large residue concentration, respectively food consumption database. In this way we could examine
the effect of a small residue concentration database on the uncertainty in the resulting exposure
percentiles compared to a large residue concentration database, keeping the consumption database
constant. The same was done for the food consumption database keeping the residue concentration
database constant. See Table 5 for the four scenarios.
In all four scenarios, we generated either 100 food consumption or 100 residue bootstrap databases
and calculated the acute cumulative (with 100,000 iterations each) exposure. Of the resulting bootstrap
distributions per percentile we calculated a 95% uncertainty interval by computing the 2.5% and
97.5% points of the empirical distribution. The uncertainty analysis using the bootstrap approach
could only be applied to the approach where the residue levels were summed up per sample for the
calculation of the cumulative exposure (Approach 1). With Approach 2 where the exposure
distributions per compound are summed up, uncertainty analyses have not yet been implemented. See
Section 4.4.3 for the results.
Cumulative Exposure Assessment of Triazole Pesticides
31 The present document has been produced and adopted by the bodies identified above as author(s). This task has been carried out exclusively by the author(s) in the context of a contract between the European Food Safety Authority and the author(s), awarded following a tender procedure. The present document is published complying with the transparency principle to which the European Food Safety Authority is subject. It may not be considered as an output adopted by EFSA. EFSA reserves its rights, view and position as regards the issues addressed and the conclusions reached in the present document, without prejudice to the rights of the authors.
2.10 MRLs, STMR and field trial data used in the cumulative intake
assessments
MRL, STMR or field trial data for different RAC-pesticide combination and monitoring data for all
other combinations were used as input for the cumulative intake calculations. For acute exposure
modeling this was the MRL, while for chronic exposure modeling the field trial data as such were used
in the calculations. If these data were not available, the STMR was used in the chronic calculations,
and if this level was not available the MRL. In practice, however, there were no situations in which the
STMR was available while there were no field trial data. Therefore in the chronic calculations we used
the field trial data, and in some cases the MRL. The field trial data were derived from JMPR reports
and DARs, while the MRLs were derived from MRL regulation 396/2005. For a list of MRLs and
field trial data used in the exposure calculations, see Annex 6. Field trial residue levels below LOR
were assigned a level equal to LOR. For all the other RAC-pesticide combinations we used monitoring
data, assigning zero to levels below LOR.
In acute exposure modeling for MRL setting especially those people consuming the RAC of interest
should be protected, the so-called consumers-only approach. We included in the acute cumulative
exposure calculations therefore only those consumption days at which consumption of the relevant
RAC was recorded. So in the case of the combination wheat – epoxiconazole only those consumption
days were included in the analysis on which at least wheat was consumed. For the chronic assessment,
however, we included all days in the analysis. This was done because on the long run it is reasonable
to expect that everybody will be a consumer of all RACs considered.
The analyses were performed for different countries and subpopulations, combining national food
consumption data with the ‗all monitoring together‘ database. Based on a request of EFSA also the
subpopulations adults (18-64 years) and women of child-bearing age (15-45 years) were addressed in
the calculations. This last group was selected because of its relevance regarding the acute toxicological
endpoint (cranio-facial effects) for the foetus on which the BMD-derived RPFs are based. For reasons
of comparison this group was also addressed when using NOAEL-derived RPFs.

Cumulative Exposure Assessment of Triazole Pesticides
32 The present document has been produced and adopted by the bodies identified above as author(s). This task has been carried out exclusively by the author(s) in the context of a contract between the European Food Safety Authority and the author(s), awarded following a tender procedure. The present document is published complying with the transparency principle to which the European Food Safety Authority is subject. It may not be considered as an output adopted by EFSA. EFSA reserves its rights, view and position as regards the issues addressed and the conclusions reached in the present document, without prejudice to the rights of the authors.
3 Results
The results of the 24 scenarios (Table 3) are listed in three different tables presenting a range of
percentiles of estimated exposure. The 95th percentile (p95) of the estimated exposure means that on 1
out of 20 days an intake equal or above the listed value is expected. Similarly, the p99.9 of exposure
means on 1 out of 1,000 days the estimated exposure is expected to be equal to or above the listed
intake. Ultimately it is the task of risk managers to decide on the most appropriate percentile(s) to
consider. For illustrative purposes only we stress the 99.9th percentile (p99.9) in this report.
The contribution of different RACs and triazoles to the (average) estimated cumulative exposure are
presented in this chapter. This was done for acute exposure calculations based on monitoring residue
concentration data, and both BMD- and NOAEL-derived RPFs. The percentiles for estimated chronic
exposure are based on monitoring data and NOAEL-derived RPFs.
3.1 Short-term or acute intake calculations using monitoring results and
BMD-derived RPFs
3.1.1 Estimated exposure distributions
Table 6 lists the most relevant percentiles of estimated exposure regarding acute exposure to triazoles
using BMD-derived RPFs for different national (sub)populations. Residue concentration data used are
either national data or all national residue concentration data pooled together.
Table 6 shows clear national differences in estimated exposure between the different countries.
Although the monitoring in each country is prescribed by the European Commission, there are many
known and unknown differences between the Member States in the number of samples taken annually,
the way of sampling (at random, targeted) and analytical methods used when analysing the samples.
The highest P99.9 level of estimated exposure was calculated for French children (8.8 μg equivalents
of flusilazole/kg bw/d), while the lowest was calculated for the adult population in Sweden (0.9 μg
equivalents of flusilazole/kg bw/d). Furthermore linking all residue concentration data to national food
consumption data instead of the national data tended to result in either higher (CZ, IT, SE), lower (FR,
UK) or comparable (NL) P99.9 levels of estimated cumulative exposure to triazoles. It is also evident
that children tended to have the highest estimated exposure levels in each country. In the Netherlands
babies aged 8 – 12 months had the highest level of estimated cumulative exposure (Table 6).
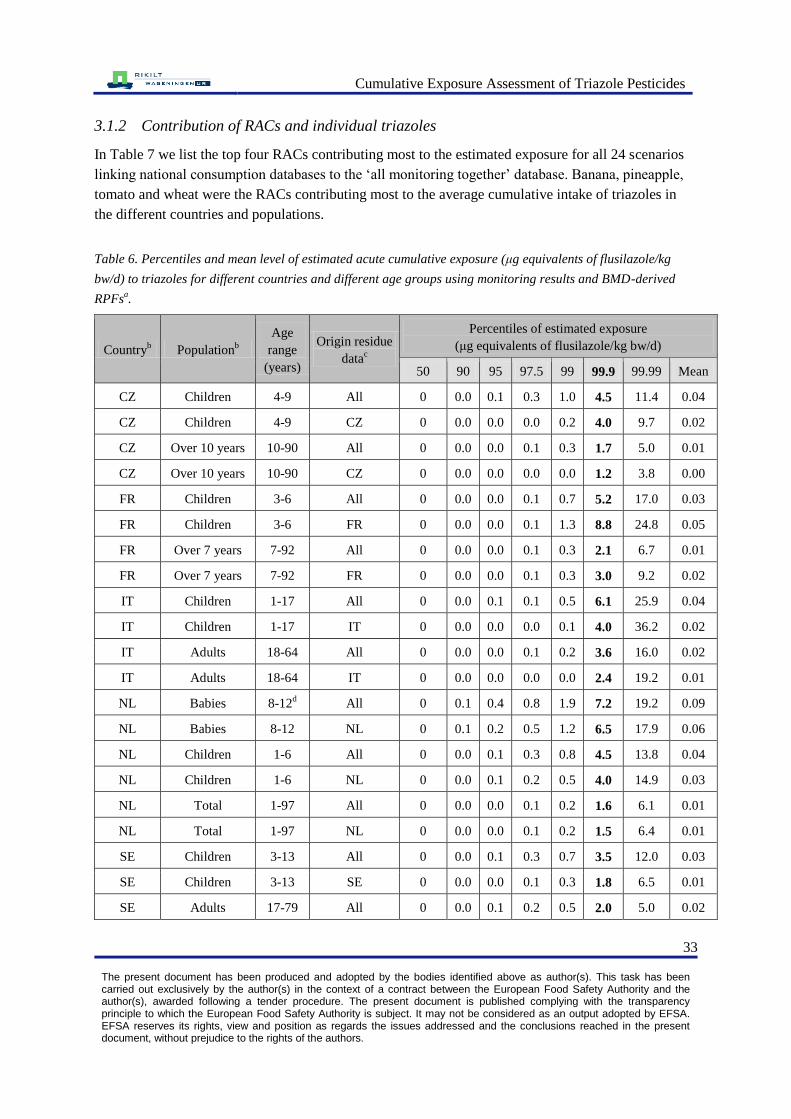
Cumulative Exposure Assessment of Triazole Pesticides
33 The present document has been produced and adopted by the bodies identified above as author(s). This task has been carried out exclusively by the author(s) in the context of a contract between the European Food Safety Authority and the author(s), awarded following a tender procedure. The present document is published complying with the transparency principle to which the European Food Safety Authority is subject. It may not be considered as an output adopted by EFSA. EFSA reserves its rights, view and position as regards the issues addressed and the conclusions reached in the present document, without prejudice to the rights of the authors.
3.1.2 Contribution of RACs and individual triazoles
In Table 7 we list the top four RACs contributing most to the estimated exposure for all 24 scenarios
linking national consumption databases to the ‗all monitoring together‘ database. Banana, pineapple,
tomato and wheat were the RACs contributing most to the average cumulative intake of triazoles in
the different countries and populations.
Table 6. Percentiles and mean level of estimated acute cumulative exposure (μg equivalents of flusilazole/kg
bw/d) to triazoles for different countries and different age groups using monitoring results and BMD-derived
RPFsa.
Countryb Population
b
Age
range
(years)
Origin residue
datac
Percentiles of estimated exposure
(μg equivalents of flusilazole/kg bw/d)
50 90 95 97.5 99 99.9 99.99 Mean
CZ
Children 4-9 All 0 0.0 0.1 0.3 1.0 4.5 11.4 0.04
CZ Children 4-9 CZ 0 0.0 0.0 0.0 0.2 4.0 9.7 0.02
CZ Over 10 years 10-90 All 0 0.0 0.0 0.1 0.3 1.7 5.0 0.01
CZ Over 10 years 10-90 CZ 0 0.0 0.0 0.0 0.0 1.2 3.8 0.00
FR Children 3-6 All 0 0.0 0.0 0.1 0.7 5.2 17.0 0.03
FR Children 3-6 FR 0 0.0 0.0 0.1 1.3 8.8 24.8 0.05
FR Over 7 years 7-92 All 0 0.0 0.0 0.1 0.3 2.1 6.7 0.01
FR Over 7 years 7-92 FR 0 0.0 0.0 0.1 0.3 3.0 9.2 0.02
IT Children 1-17 All 0 0.0 0.1 0.1 0.5 6.1 25.9 0.04
IT Children 1-17 IT 0 0.0 0.0 0.0 0.1 4.0 36.2 0.02
IT Adults 18-64 All 0 0.0 0.0 0.1 0.2 3.6 16.0 0.02
IT Adults 18-64 IT 0 0.0 0.0 0.0 0.0 2.4 19.2 0.01
NL Babies 8-12d
All 0 0.1 0.4 0.8 1.9 7.2 19.2 0.09
NL Babies 8-12 NL 0 0.1 0.2 0.5 1.2 6.5 17.9 0.06
NL Children 1-6 All 0 0.0 0.1 0.3 0.8 4.5 13.8 0.04
NL Children 1-6 NL 0 0.0 0.1 0.2 0.5 4.0 14.9 0.03
NL Total 1-97 All 0 0.0 0.0 0.1 0.2 1.6 6.1 0.01
NL Total 1-97 NL 0 0.0 0.0 0.1 0.2 1.5 6.4 0.01
SE Children 3-13 All 0 0.0 0.1 0.3 0.7 3.5 12.0 0.03
SE Children 3-13 SE 0 0.0 0.0 0.1 0.3 1.8 6.5 0.01
SE Adults 17-79 All 0 0.0 0.1 0.2 0.5 2.0 5.0 0.02
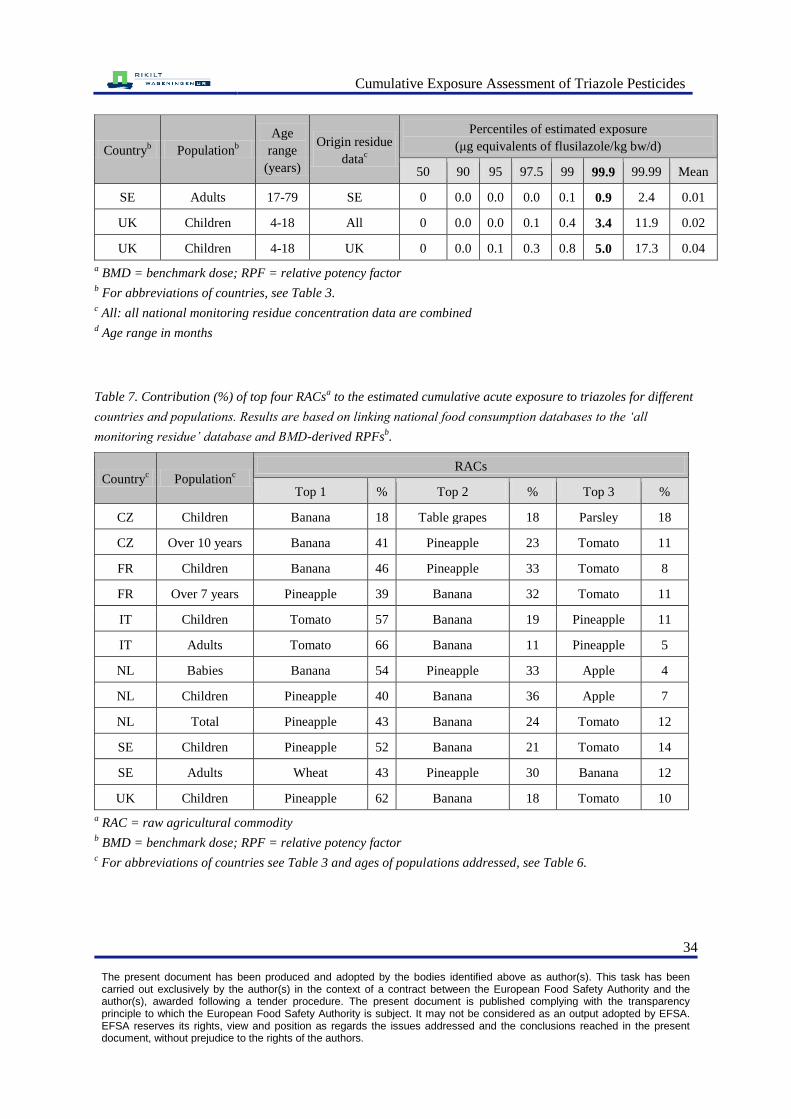
Cumulative Exposure Assessment of Triazole Pesticides
34 The present document has been produced and adopted by the bodies identified above as author(s). This task has been carried out exclusively by the author(s) in the context of a contract between the European Food Safety Authority and the author(s), awarded following a tender procedure. The present document is published complying with the transparency principle to which the European Food Safety Authority is subject. It may not be considered as an output adopted by EFSA. EFSA reserves its rights, view and position as regards the issues addressed and the conclusions reached in the present document, without prejudice to the rights of the authors.
Countryb Population
b
Age
range
(years)
Origin residue
datac
Percentiles of estimated exposure
(μg equivalents of flusilazole/kg bw/d)
50 90 95 97.5 99 99.9 99.99 Mean
SE Adults 17-79 SE 0 0.0 0.0 0.0 0.1 0.9 2.4 0.01
UK Children 4-18 All 0 0.0 0.0 0.1 0.4 3.4 11.9 0.02
UK Children 4-18 UK 0 0.0 0.1 0.3 0.8 5.0 17.3 0.04
a BMD = benchmark dose; RPF = relative potency factor
b For abbreviations of countries, see Table 3.
c All: all national monitoring residue concentration data are combined
d Age range in months
Table 7. Contribution (%) of top four RACsa to the estimated cumulative acute exposure to triazoles for different
countries and populations. Results are based on linking national food consumption databases to the ‘all
monitoring residue’ database and BMD-derived RPFsb.
Countryc Population
c
RACs
Top 1 % Top 2 % Top 3 %
CZ Children Banana 18 Table grapes 18 Parsley 18
CZ Over 10 years Banana 41 Pineapple 23 Tomato 11
FR Children Banana 46 Pineapple 33 Tomato 8
FR Over 7 years Pineapple 39 Banana 32 Tomato 11
IT Children Tomato 57 Banana 19 Pineapple 11
IT Adults Tomato 66 Banana 11 Pineapple 5
NL Babies Banana 54 Pineapple 33 Apple 4
NL Children Pineapple 40 Banana 36 Apple 7
NL Total Pineapple 43 Banana 24 Tomato 12
SE Children Pineapple 52 Banana 21 Tomato 14
SE Adults Wheat 43 Pineapple 30 Banana 12
UK Children Pineapple 62 Banana 18 Tomato 10
a RAC = raw agricultural commodity
b BMD = benchmark dose; RPF = relative potency factor
c For abbreviations of countries see Table 3 and ages of populations addressed, see Table 6.

Cumulative Exposure Assessment of Triazole Pesticides
35 The present document has been produced and adopted by the bodies identified above as author(s). This task has been carried out exclusively by the author(s) in the context of a contract between the European Food Safety Authority and the author(s), awarded following a tender procedure. The present document is published complying with the transparency principle to which the European Food Safety Authority is subject. It may not be considered as an output adopted by EFSA. EFSA reserves its rights, view and position as regards the issues addressed and the conclusions reached in the present document, without prejudice to the rights of the authors.
Table 8 lists the compounds that were responsible for the high contribution of the listed RACs (Table
7) to the overall estimated cumulative to triazoles. In the 75% of the calculations bitertanol was the
residue most commonly found.
For banana and tomato bitertanol was the compound responsible for their high contribution to the
overall estimated cumulative exposure. For pineapple the responsible compound was triadimefon and
for carrots epoxiconazole. For table grapes there are more compounds explaining the high intake:
dinicozole, flusilazole and cyproconazole. In all cases we have only listed those compounds
contributing most. In case of the table grapes diniconazole was the largest contributor. We refer to
Annex 7 for a more comprehensive overview of combinations of food items and pesticides
contributing to the total intake. It is stressed that the total intake is considered. If focus is required on
the upper end of the intake distribution, where most the higher intake occur, the contributions of food
and pesticides will change.
Table 8. Contribution (%) of top four compounds to the estimated cumulative acute exposure to triazoles for
different countries and populations. Results are based on linking national food consumption databases to the ‘all
monitoring residue’ database and BMD-derived RPFsa.
Countryb Population
b
RACs
Top 1 % Top 2 % Top 3 %
CZ Children Bitertanol 70.0 Triadimefon 21.4 Cyproconazole 3.8
CZ Over 10
years Bitertanol 64.8 Triadimefon 23.1 Propiconazole 4.6
FR Children Bitertanol 59.3 Triadimefon 33.5 Propiconazole 3.5
FR Over 7 years Bitertanol 50.9 Triadimefon 39.1 Propiconazole 4.9
IT Children Bitertanol 83.0 Triadimefon 11.5 Propiconazole 2.7
IT Adults Bitertanol 87.4 Triadimefon 5.2 Propiconazole 2.9
NL Babies Bitertanol 62.9 Triadimefon 33.7 Epoxiconazole 0.9
NL Children Bitertanol 51.7 Triadimefon 40.7 Propiconazole 2.7
NL Total Bitertanol 45.3 Triadimefon 44.2 Propiconazole 3.7
SE Children Triadimefon 52.6 Bitertanol 42.6 Propiconazole 2.5
SE Adults Propiconazole 45.5 Triadimefon 31.4 Bitertanol 19.4
UK Children Triadimefon 62.1 Bitertanol 33.2 Propiconazole 2.3
a BMD = benchmark dose; RPF = relative potency factor
b For abbreviations of countries see Table 3 and ages of populations addressed, see Table 6.
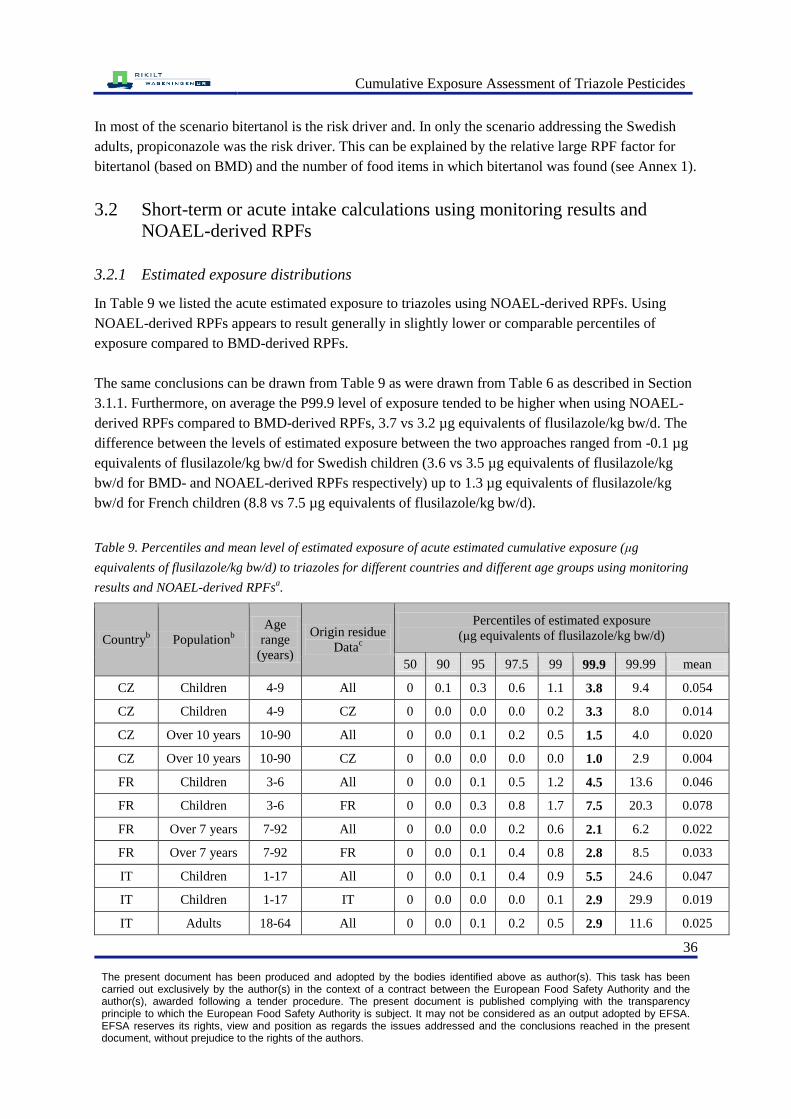
Cumulative Exposure Assessment of Triazole Pesticides
36 The present document has been produced and adopted by the bodies identified above as author(s). This task has been carried out exclusively by the author(s) in the context of a contract between the European Food Safety Authority and the author(s), awarded following a tender procedure. The present document is published complying with the transparency principle to which the European Food Safety Authority is subject. It may not be considered as an output adopted by EFSA. EFSA reserves its rights, view and position as regards the issues addressed and the conclusions reached in the present document, without prejudice to the rights of the authors.
In most of the scenario bitertanol is the risk driver and. In only the scenario addressing the Swedish
adults, propiconazole was the risk driver. This can be explained by the relative large RPF factor for
bitertanol (based on BMD) and the number of food items in which bitertanol was found (see Annex 1).
3.2 Short-term or acute intake calculations using monitoring results and
NOAEL-derived RPFs
3.2.1 Estimated exposure distributions
In Table 9 we listed the acute estimated exposure to triazoles using NOAEL-derived RPFs. Using
NOAEL-derived RPFs appears to result generally in slightly lower or comparable percentiles of
exposure compared to BMD-derived RPFs.
The same conclusions can be drawn from Table 9 as were drawn from Table 6 as described in Section
3.1.1. Furthermore, on average the P99.9 level of exposure tended to be higher when using NOAEL-
derived RPFs compared to BMD-derived RPFs, 3.7 vs 3.2 µg equivalents of flusilazole/kg bw/d. The
difference between the levels of estimated exposure between the two approaches ranged from -0.1 µg
equivalents of flusilazole/kg bw/d for Swedish children (3.6 vs 3.5 µg equivalents of flusilazole/kg
bw/d for BMD- and NOAEL-derived RPFs respectively) up to 1.3 µg equivalents of flusilazole/kg
bw/d for French children (8.8 vs 7.5 µg equivalents of flusilazole/kg bw/d).
Table 9. Percentiles and mean level of estimated exposure of acute estimated cumulative exposure (μg
equivalents of flusilazole/kg bw/d) to triazoles for different countries and different age groups using monitoring
results and NOAEL-derived RPFsa.
Countryb Population
b
Age
range
(years)
Origin residue
Datac
Percentiles of estimated exposure
(μg equivalents of flusilazole/kg bw/d)
50 90 95 97.5 99 99.9 99.99 mean
CZ
Children 4-9 All 0 0.1 0.3 0.6 1.1 3.8 9.4 0.054
CZ Children 4-9 CZ 0 0.0 0.0 0.0 0.2 3.3 8.0 0.014
CZ Over 10 years 10-90 All 0 0.0 0.1 0.2 0.5 1.5 4.0 0.020
CZ Over 10 years 10-90 CZ 0 0.0 0.0 0.0 0.0 1.0 2.9 0.004
FR Children 3-6 All 0 0.0 0.1 0.5 1.2 4.5 13.6 0.046
FR Children 3-6 FR 0 0.0 0.3 0.8 1.7 7.5 20.3 0.078
FR Over 7 years 7-92 All 0 0.0 0.0 0.2 0.6 2.1 6.2 0.022
FR Over 7 years 7-92 FR 0 0.0 0.1 0.4 0.8 2.8 8.5 0.033
IT Children 1-17 All 0 0.0 0.1 0.4 0.9 5.5 24.6 0.047
IT Children 1-17 IT 0 0.0 0.0 0.0 0.1 2.9 29.9 0.019
IT Adults 18-64 All 0 0.0 0.1 0.2 0.5 2.9 11.6 0.025
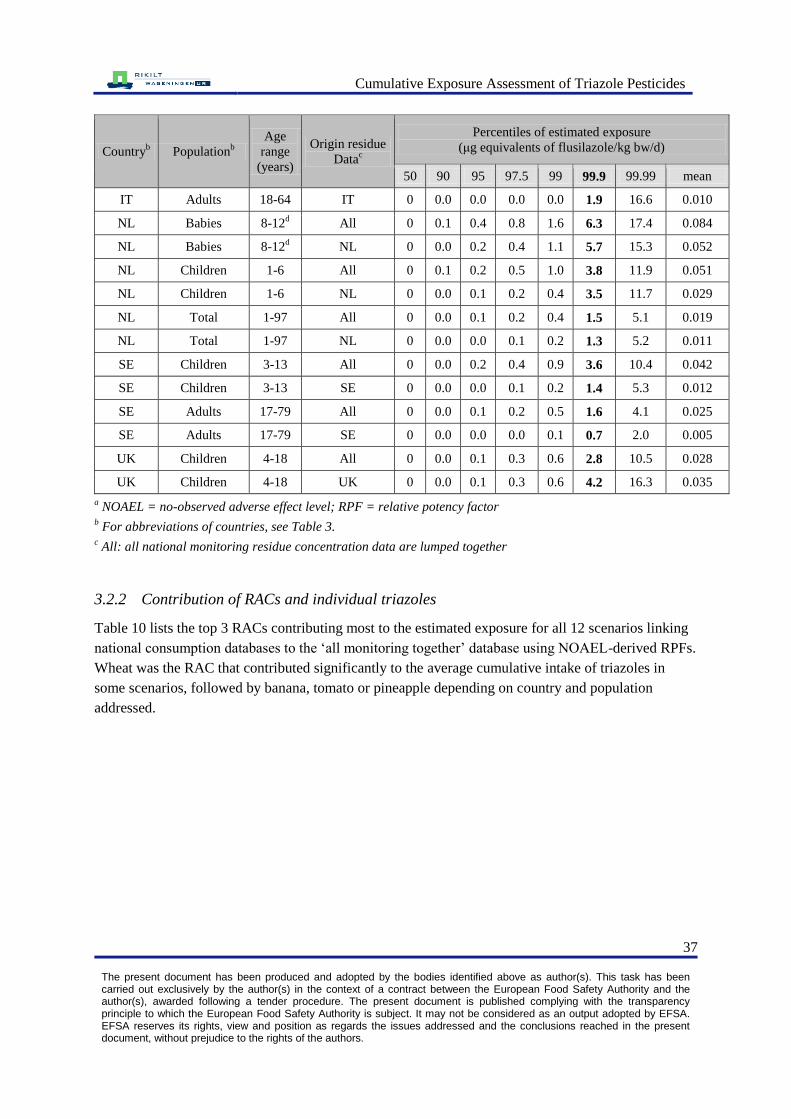
Cumulative Exposure Assessment of Triazole Pesticides
37 The present document has been produced and adopted by the bodies identified above as author(s). This task has been carried out exclusively by the author(s) in the context of a contract between the European Food Safety Authority and the author(s), awarded following a tender procedure. The present document is published complying with the transparency principle to which the European Food Safety Authority is subject. It may not be considered as an output adopted by EFSA. EFSA reserves its rights, view and position as regards the issues addressed and the conclusions reached in the present document, without prejudice to the rights of the authors.
Countryb Population
b
Age
range
(years)
Origin residue
Datac
Percentiles of estimated exposure
(μg equivalents of flusilazole/kg bw/d)
50 90 95 97.5 99 99.9 99.99 mean
IT Adults 18-64 IT 0 0.0 0.0 0.0 0.0 1.9 16.6 0.010
NL Babies 8-12d
All 0 0.1 0.4 0.8 1.6 6.3 17.4 0.084
NL Babies 8-12d
NL 0 0.0 0.2 0.4 1.1 5.7 15.3 0.052
NL Children 1-6 All 0 0.1 0.2 0.5 1.0 3.8 11.9 0.051
NL Children 1-6 NL 0 0.0 0.1 0.2 0.4 3.5 11.7 0.029
NL Total 1-97 All 0 0.0 0.1 0.2 0.4 1.5 5.1 0.019
NL Total 1-97 NL 0 0.0 0.0 0.1 0.2 1.3 5.2 0.011
SE Children 3-13 All 0 0.0 0.2 0.4 0.9 3.6 10.4 0.042
SE Children 3-13 SE 0 0.0 0.0 0.1 0.2 1.4 5.3 0.012
SE Adults 17-79 All 0 0.0 0.1 0.2 0.5 1.6 4.1 0.025
SE Adults 17-79 SE 0 0.0 0.0 0.0 0.1 0.7 2.0 0.005
UK Children 4-18 All 0 0.0 0.1 0.3 0.6 2.8 10.5 0.028
UK Children 4-18 UK 0 0.0 0.1 0.3 0.6 4.2 16.3 0.035
a NOAEL = no-observed adverse effect level; RPF = relative potency factor
b For abbreviations of countries, see Table 3.
c All: all national monitoring residue concentration data are lumped together
3.2.2 Contribution of RACs and individual triazoles
Table 10 lists the top 3 RACs contributing most to the estimated exposure for all 12 scenarios linking
national consumption databases to the ‗all monitoring together‘ database using NOAEL-derived RPFs.
Wheat was the RAC that contributed significantly to the average cumulative intake of triazoles in
some scenarios, followed by banana, tomato or pineapple depending on country and population
addressed.
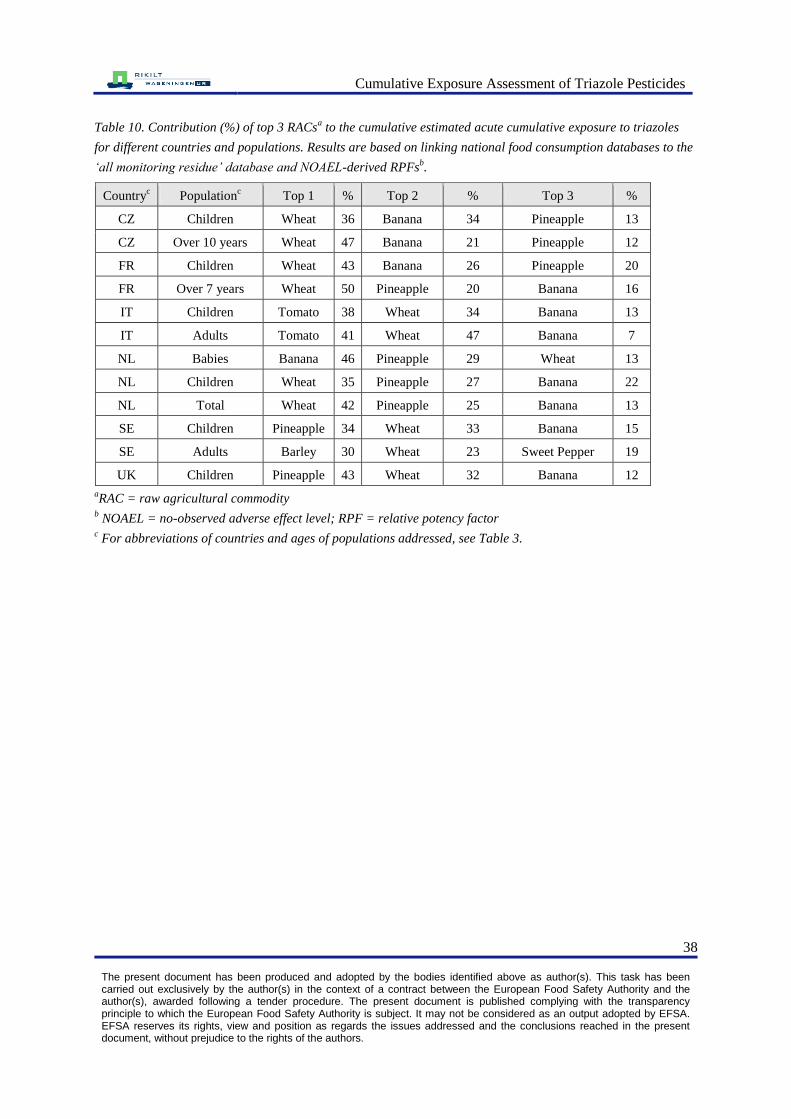
Cumulative Exposure Assessment of Triazole Pesticides
38 The present document has been produced and adopted by the bodies identified above as author(s). This task has been carried out exclusively by the author(s) in the context of a contract between the European Food Safety Authority and the author(s), awarded following a tender procedure. The present document is published complying with the transparency principle to which the European Food Safety Authority is subject. It may not be considered as an output adopted by EFSA. EFSA reserves its rights, view and position as regards the issues addressed and the conclusions reached in the present document, without prejudice to the rights of the authors.
Table 10. Contribution (%) of top 3 RACsa to the cumulative estimated acute cumulative exposure to triazoles
for different countries and populations. Results are based on linking national food consumption databases to the
‘all monitoring residue’ database and NOAEL-derived RPFsb.
Countryc Population
c Top 1 % Top 2 % Top 3 %
CZ Children Wheat 36 Banana 34 Pineapple 13
CZ Over 10 years Wheat 47 Banana 21 Pineapple 12
FR Children Wheat 43 Banana 26 Pineapple 20
FR Over 7 years Wheat 50 Pineapple 20 Banana 16
IT Children Tomato 38 Wheat 34 Banana 13
IT Adults Tomato 41 Wheat 47 Banana 7
NL Babies Banana 46 Pineapple 29 Wheat 13
NL Children Wheat 35 Pineapple 27 Banana 22
NL Total Wheat 42 Pineapple 25 Banana 13
SE Children Pineapple 34 Wheat 33 Banana 15
SE Adults Barley 30 Wheat 23 Sweet Pepper 19
UK Children Pineapple 43 Wheat 32 Banana 12
aRAC = raw agricultural commodity
b NOAEL = no-observed adverse effect level; RPF = relative potency factor
c For abbreviations of countries and ages of populations addressed, see Table 3.

Cumulative Exposure Assessment of Triazole Pesticides
39 The present document has been produced and adopted by the bodies identified above as author(s). This task has been carried out exclusively by the author(s) in the context of a contract between the European Food Safety Authority and the author(s), awarded following a tender procedure. The present document is published complying with the transparency principle to which the European Food Safety Authority is subject. It may not be considered as an output adopted by EFSA. EFSA reserves its rights, view and position as regards the issues addressed and the conclusions reached in the present document, without prejudice to the rights of the authors.
Table 11. Contribution (%) of top three pesticides to the estimated acute cumulative exposure to triazoles for
different countries and populations. Results are based on linking national food consumption databases to the ‘all
monitoring residue’ database and NOAEL -derived RPFsa.
Countryb Population
b
Pesticides
Top 1 % Top 2 % Top 3 %
CZ Children Bitertanol 43.7 Propiconazole 36.8 Triadimefon 13.0
CZ Over 10 years Propiconazole 48.1 Bitertanol 33.1 Triadimefon 12.2
FR Children Propiconazole 43.2 Bitertanol 33.9 Triadimefon 19.7
FR Over 7 years Propiconazole 50.5 Bitertanol 25.7 Triadimefon 19.9
IT Children Bitertanol 55.4 Propiconazole 34.2 Triadimefon 7.4
IT Adults Bitertanol 54.1 Propiconazole 37.4 Cyproconazole 3.8
NL Babies Bitertanol 52.8 Triadimefon 29.1 Propiconazole 15.6
NL Children Propiconazole 36.0 Bitertanol 32.1 Triadimefon 27.3
NL Total Propiconazole 43.7 Triadimefon 25.9 Bitertanol 25.0
SE Children Triadimefon 35.2 Propiconazole 34.1 Bitertanol 28.4
SE Adults Bitertanol 49.7 Propiconazole 34.2 Triadimefon 12.5
UK Children Triadimefon 43.0 Propiconazole 32.6 Bitertanol 21.9
a BMD = benchmark dose; RPF = relative potency factor
b For abbreviations of countries see Table 3 and ages of populations addressed, see Table 6.
In all countries the high contribution of wheat was due to the presence of propiconazole. Other
relevant compounds were bitertanol (in banana and tomato) and triadimefon (in pineapple).
Propiconazole was more or less an equal important risk driver compared to bitertanol as we used the
NOAEL derived RPFs. In Table 8 bitertanol was found to drive the risk. The difference is mainly
explained by the difference between the RPF factor of propioconazole derived from BMD or
NOAELs. When the RPF factors were derived from BMD-modeling propiconazole was ten times less
toxic compared to the index compound and consequently it did not contribute largely to the overall
intake. However when we compared the toxicity (RPF) based on comparison of NOAELs,
propiconazole was nearly twice as toxic as the index compound (see Table 4). In France propiconazole
was found in wheat, a food item that is consumed in large quantities by relative large part of the
population.

Cumulative Exposure Assessment of Triazole Pesticides
40 The present document has been produced and adopted by the bodies identified above as author(s). This task has been carried out exclusively by the author(s) in the context of a contract between the European Food Safety Authority and the author(s), awarded following a tender procedure. The present document is published complying with the transparency principle to which the European Food Safety Authority is subject. It may not be considered as an output adopted by EFSA. EFSA reserves its rights, view and position as regards the issues addressed and the conclusions reached in the present document, without prejudice to the rights of the authors.
3.3 Long-term or chronic intake calculations using monitoring results and
NOAEL-derived RPFs
3.3.1 Estimated exposure distributions
In Table 12 we listed the percentiles of estimated chronic exposure to triazoles using NOAEL-derived
RPFs. It is clear that the estimated exposure levels were lower compared to the estimated acute
exposure percentiles as expected (Tables 6 and 9), and that also here children tended to have higher
estimated exposure levels compared to the total population. Also, combining all residue concentration
data instead of national residue concentration data to national food consumption data tended to result
in higher, lower or comparable P99.9 levels of exposure. The main difference however was that for
UK children the estimated exposure was comparable, while in the acute assessment the intake was
higher using UK residue concentration data compared to all residue concentration data combined.
3.3.2 Contribution of RACs and individual compounds
Table 13 lists the top 3 RACs contributing most to the cumulative long-term estimated exposure to
triazoles. As for the acute assessment using NOAEL-derived RPFs, also in the chronic analysis (which
uses other NOAEL-derived RPFs, see Table 4) it was banana that contributed most to the estimated
exposure, followed by tomato, pineapple and wheat depending on country and (sub)population
addressed. For estimated long-term exposure, the presence of bitertanol resulted in the high
contribution of banana to the estimated cumulative exposure to triazoles. A list of most important
pesticides contributing to the overall chronic exposure levels is presented in Table 14.
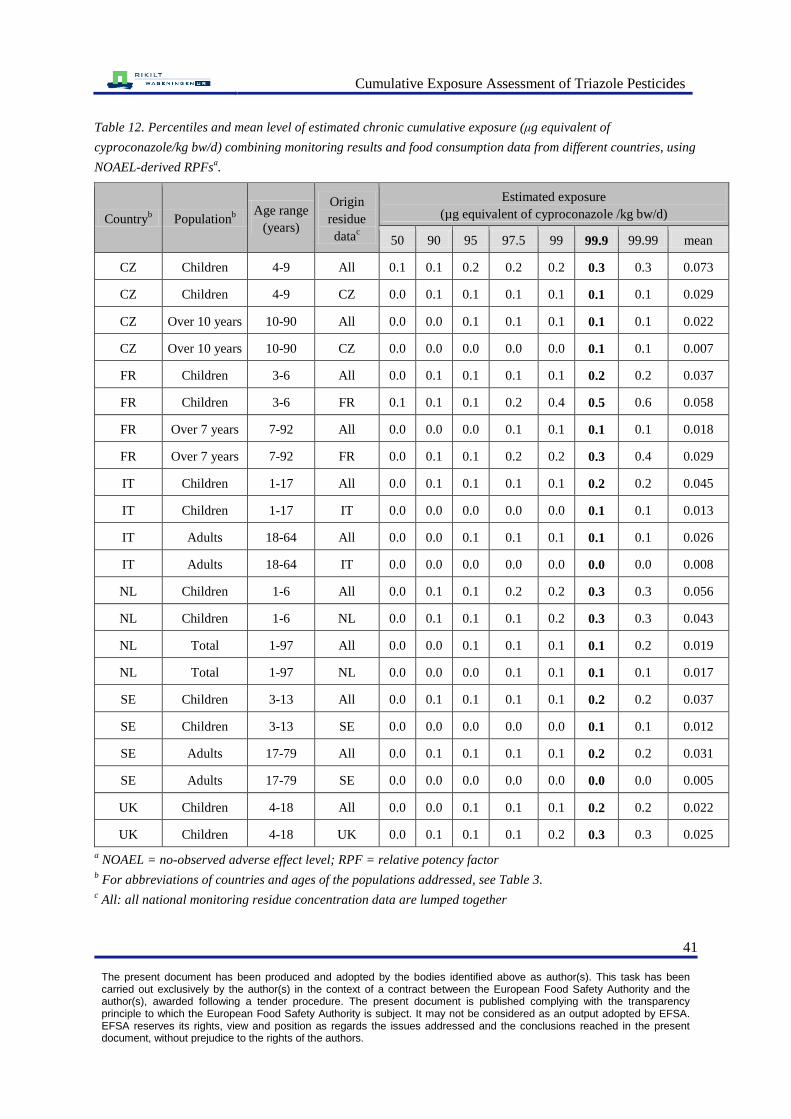
Cumulative Exposure Assessment of Triazole Pesticides
41 The present document has been produced and adopted by the bodies identified above as author(s). This task has been carried out exclusively by the author(s) in the context of a contract between the European Food Safety Authority and the author(s), awarded following a tender procedure. The present document is published complying with the transparency principle to which the European Food Safety Authority is subject. It may not be considered as an output adopted by EFSA. EFSA reserves its rights, view and position as regards the issues addressed and the conclusions reached in the present document, without prejudice to the rights of the authors.
Table 12. Percentiles and mean level of estimated chronic cumulative exposure (μg equivalent of
cyproconazole/kg bw/d) combining monitoring results and food consumption data from different countries, using
NOAEL-derived RPFsa.
Countryb Population
b
Age range
(years)
Origin
residue
datac
Estimated exposure
(µg equivalent of cyproconazole /kg bw/d)
50 90 95 97.5 99 99.9 99.99 mean
CZ Children 4-9 All 0.1 0.1 0.2 0.2 0.2 0.3 0.3 0.073
CZ Children 4-9 CZ 0.0 0.1 0.1 0.1 0.1 0.1 0.1 0.029
CZ Over 10 years 10-90 All 0.0 0.0 0.1 0.1 0.1 0.1 0.1 0.022
CZ Over 10 years 10-90 CZ 0.0 0.0 0.0 0.0 0.0 0.1 0.1 0.007
FR Children 3-6 All 0.0 0.1 0.1 0.1 0.1 0.2 0.2 0.037
FR Children 3-6 FR 0.1 0.1 0.1 0.2 0.4 0.5 0.6 0.058
FR Over 7 years 7-92 All 0.0 0.0 0.0 0.1 0.1 0.1 0.1 0.018
FR Over 7 years 7-92 FR 0.0 0.1 0.1 0.2 0.2 0.3 0.4 0.029
IT Children 1-17 All 0.0 0.1 0.1 0.1 0.1 0.2 0.2 0.045
IT Children 1-17 IT 0.0 0.0 0.0 0.0 0.0 0.1 0.1 0.013
IT Adults 18-64 All 0.0 0.0 0.1 0.1 0.1 0.1 0.1 0.026
IT Adults 18-64 IT 0.0 0.0 0.0 0.0 0.0 0.0 0.0 0.008
NL Children 1-6 All 0.0 0.1 0.1 0.2 0.2 0.3 0.3 0.056
NL Children 1-6 NL 0.0 0.1 0.1 0.1 0.2 0.3 0.3 0.043
NL Total 1-97 All 0.0 0.0 0.1 0.1 0.1 0.1 0.2 0.019
NL Total 1-97 NL 0.0 0.0 0.0 0.1 0.1 0.1 0.1 0.017
SE Children 3-13 All 0.0 0.1 0.1 0.1 0.1 0.2 0.2 0.037
SE Children 3-13 SE 0.0 0.0 0.0 0.0 0.0 0.1 0.1 0.012
SE Adults 17-79 All 0.0 0.1 0.1 0.1 0.1 0.2 0.2 0.031
SE Adults 17-79 SE 0.0 0.0 0.0 0.0 0.0 0.0 0.0 0.005
UK Children 4-18 All 0.0 0.0 0.1 0.1 0.1 0.2 0.2 0.022
UK Children 4-18 UK 0.0 0.1 0.1 0.1 0.2 0.3 0.3 0.025
a NOAEL = no-observed adverse effect level; RPF = relative potency factor
b For abbreviations of countries and ages of the populations addressed, see Table 3.
c All: all national monitoring residue concentration data are lumped together

Cumulative Exposure Assessment of Triazole Pesticides
42 The present document has been produced and adopted by the bodies identified above as author(s). This task has been carried out exclusively by the author(s) in the context of a contract between the European Food Safety Authority and the author(s), awarded following a tender procedure. The present document is published complying with the transparency principle to which the European Food Safety Authority is subject. It may not be considered as an output adopted by EFSA. EFSA reserves its rights, view and position as regards the issues addressed and the conclusions reached in the present document, without prejudice to the rights of the authors.
Table 13. Contribution (%) of top 3 RACsa to the estimated cumulative long-term exposure to triazoles for
different countries and populations. Results are based on linking national food consumption databases to the ‘all
monitoring residue’ database and NOAEL-derived RPFsb.
Countryc Population
c
RACs
Top 1 % Top 2 % Top 3 %
CZ Children Banana 51.2 Parsley 10.9 Wheat 8.6
CZ Over 10 years Banana 38.1 Wheat 13.4 Parsley 11.6
FR Children Banana 31.9 Wheat 16.1 Pineapple 12.3
FR Over 7 years Banana 20.1 Wheat 18.2 Pineapple 13.4
IT Children Tomato 33.2 Banana 27.1 Wheat 11.3
IT Adults Tomato 34.4 Banana 13.9 Wheat 11.4
NL Children Banana 40.4 Pineapple 12 Apple 10.7
NL Total Banana 25.1 Pineapple 14.5 Wheat 12.4
SE Children Banana 33.4 Pineapple 23.5 Tomato 11.1
SE Adults Banana 50.5 Tomato 12.6 Wheat 7.9
UK Children Banana 28.4 Pineapple 27.3 Wheat 11.5
a RAC = raw agricultural commodity
Table 14. Contribution (%) of top three pesticides to the estimated cumulative long-term exposure to triazoles
for different countries and populations. Results are based on linking national food consumption databases to the
‘all monitoring residue’ database and NOAEL-derived RPFs
Country Population Pesticides
Top 1 % Top 2 % Top 3 %
CZ Children Bitertanol 58.4 Difenoconazole 19.1 Propiconazole 8.8
CZ Over 10 years Bitertanol 47.8 Difenoconazole 21.4 Propiconazole 13.6
FR Children Bitertanol 43.8 Propiconazole 16.3 Difenoconazole 15.3
FR Over 7 years Bitertanol 31.8 Difenoconazole 20.1 Propiconazole 18.3
IT Children Bitertanol 55.7 Difenoconazole 13.8 Triadimenol 13.5
IT Adults Bitertanol 44.3 Difenoconazole 22.2 Triadimenol 14.1
NL Children Bitertanol 52.9 Triadimenol 15.7 Difenoconazole 12.7
NL Total Bitertanol 37.5 Triadimenol 18.4 Difenoconazole 18.1
SE Children Bitertanol 47.4 Triadimenol 25.3 Propiconazole 11.4
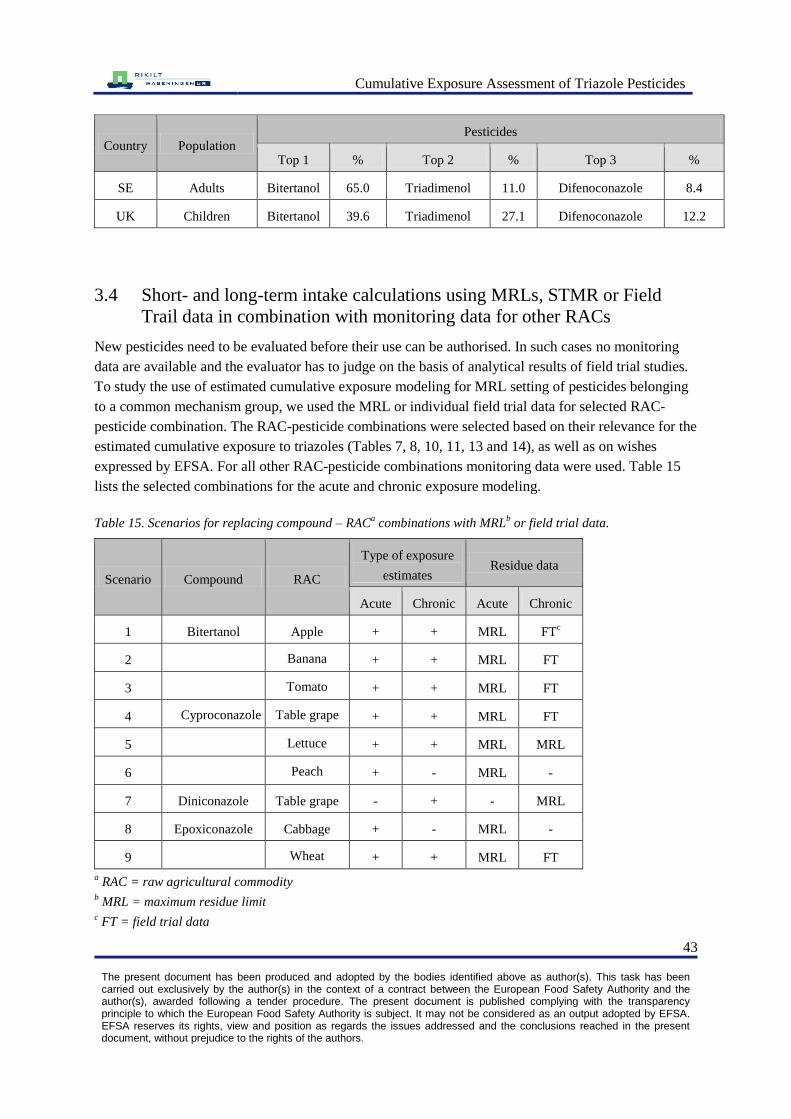
Cumulative Exposure Assessment of Triazole Pesticides
43 The present document has been produced and adopted by the bodies identified above as author(s). This task has been carried out exclusively by the author(s) in the context of a contract between the European Food Safety Authority and the author(s), awarded following a tender procedure. The present document is published complying with the transparency principle to which the European Food Safety Authority is subject. It may not be considered as an output adopted by EFSA. EFSA reserves its rights, view and position as regards the issues addressed and the conclusions reached in the present document, without prejudice to the rights of the authors.
Country Population Pesticides
Top 1 % Top 2 % Top 3 %
SE Adults Bitertanol 65.0 Triadimenol 11.0 Difenoconazole 8.4
UK Children Bitertanol 39.6 Triadimenol 27.1 Difenoconazole 12.2
3.4 Short- and long-term intake calculations using MRLs, STMR or Field
Trail data in combination with monitoring data for other RACs
New pesticides need to be evaluated before their use can be authorised. In such cases no monitoring
data are available and the evaluator has to judge on the basis of analytical results of field trial studies.
To study the use of estimated cumulative exposure modeling for MRL setting of pesticides belonging
to a common mechanism group, we used the MRL or individual field trial data for selected RAC-
pesticide combination. The RAC-pesticide combinations were selected based on their relevance for the
estimated cumulative exposure to triazoles (Tables 7, 8, 10, 11, 13 and 14), as well as on wishes
expressed by EFSA. For all other RAC-pesticide combinations monitoring data were used. Table 15
lists the selected combinations for the acute and chronic exposure modeling.
Table 15. Scenarios for replacing compound – RACa combinations with MRL
b or field trial data.
Scenario Compound RAC
Type of exposure
estimates Residue data
Acute Chronic Acute Chronic
1 Bitertanol Apple + + MRL FTc
2 Banana + + MRL FT
3 Tomato + + MRL FT
4 Cyproconazole Table grape + + MRL FT
5 Lettuce + + MRL MRL
6 Peach + - MRL -
7 Diniconazole Table grape - + - MRL
8 Epoxiconazole Cabbage + - MRL -
9 Wheat + + MRL FT
a RAC = raw agricultural commodity
b MRL = maximum residue limit
c FT = field trial data

Cumulative Exposure Assessment of Triazole Pesticides
44 The present document has been produced and adopted by the bodies identified above as author(s). This task has been carried out exclusively by the author(s) in the context of a contract between the European Food Safety Authority and the author(s), awarded following a tender procedure. The present document is published complying with the transparency principle to which the European Food Safety Authority is subject. It may not be considered as an output adopted by EFSA. EFSA reserves its rights, view and position as regards the issues addressed and the conclusions reached in the present document, without prejudice to the rights of the authors.
For the combinations listed in Table 15 the MRL, or field trial data for the mentioned RAC-pesticide
combination and monitoring data for all other combinations were used as input for the calculations.
For acute exposure modeling this was the MRL, while for chronic exposure modeling the field trial
data as such were used in the calculations. If these data were not available, the MRL was used.
3.4.1 RAC-pesticide combinations using MRLs in acute exposure modeling
In Table 16 and 17 we listed the estimated acute cumulative exposure percentiles for different
countries and populations in which the MRL of one RAC-pesticide combination was used in
combination with monitoring data for all other RAC-pesticide combinations. Calculations are based on
BMD- and NOAEL-derived RPFs, respectively.
Table 16. Percentiles and mean level of estimated acute cumulative exposure (in µg equivalents of flusilazole/kg
bw/d) to triazoles in which MRL data for a selected RAC-pesticide was used in combination with monitoring
data of other combinations. Calculations were performed using BMD-derived RPF, national food consumption
data and residue concentration data of all countries combined.
Scenario
Co
unt
ry
Population
Age
range
(years)
Estimated exposure
(µg equivalent of flusilazole/kg bw/d)
90 95 97.5 99 99.9 99.99 Mean
Bit/Apple/MRL CZ Children 4-9 47.2 64.3 83.5 112.4 204.6 333.6 21.3
Bit/Apple/MRL FR Children 3-6 37.9 58.5 81.4 114.5 218.7 364.3 13.4
Bit/Apple/MRL IT Children 1-17 33.3 49.8 70.1 102.3 210.7 348.2 12.2
Bit/Apple/MRL NL Children 1-6 31.1 47.7 66.6 95.3 196.3 345.1 10.6
Bit/Apple/MRL SE Children 3-13 45.3 64.1 84.8 115.2 206.2 315.3 16.7
Bit/Apple/MRL UK Children 4-18 22.5 33.6 46.6 67.0 137.8 240.9 8.1
Bit/Apple/MRL FR Adults 18-64 22.0 30.6 39.9 53.0 90.4 133.9 8.6
Bit/Apple/MRL IT Adults 18-64 22.4 30.2 38.7 51.5 90.6 136.6 9.4
Bit/Apple/MRL NL Adults 18-64 11.7 17.0 23.0 31.6 59.1 94.5 4.1
Bit/Apple/MRL FR Wmcba 15-45 21.1 29.0 37.5 49.6 85.9 136.1 8.0
Bit/Apple/MRL IT Wmcba 15-45 23.5 31.8 40.8 53.9 93.4 143.7 9.5
Bit/Apple/MRL NL Wmcba 15-45 11.1 16.6 22.7 31.8 60.3 98.2 3.8
Bit/Apple/MRL NL Total 1-97 14.1 21.7 31.3 47.3 112.6 211.9 5.2
Bit/Banana/MRL NL Total 1-97 9.8 15.9 24.3 39.1 93.8 176.2 3.7
Bit/Tomato/MRL NL Children 1-6 34.3 68.5 99.2 199.3 317.5 317.7 14.5
Bit/Tomato/MRL NL Wmcba 15-45 20.8 34.9 54.0 84.4 196.0 264.6 8.2
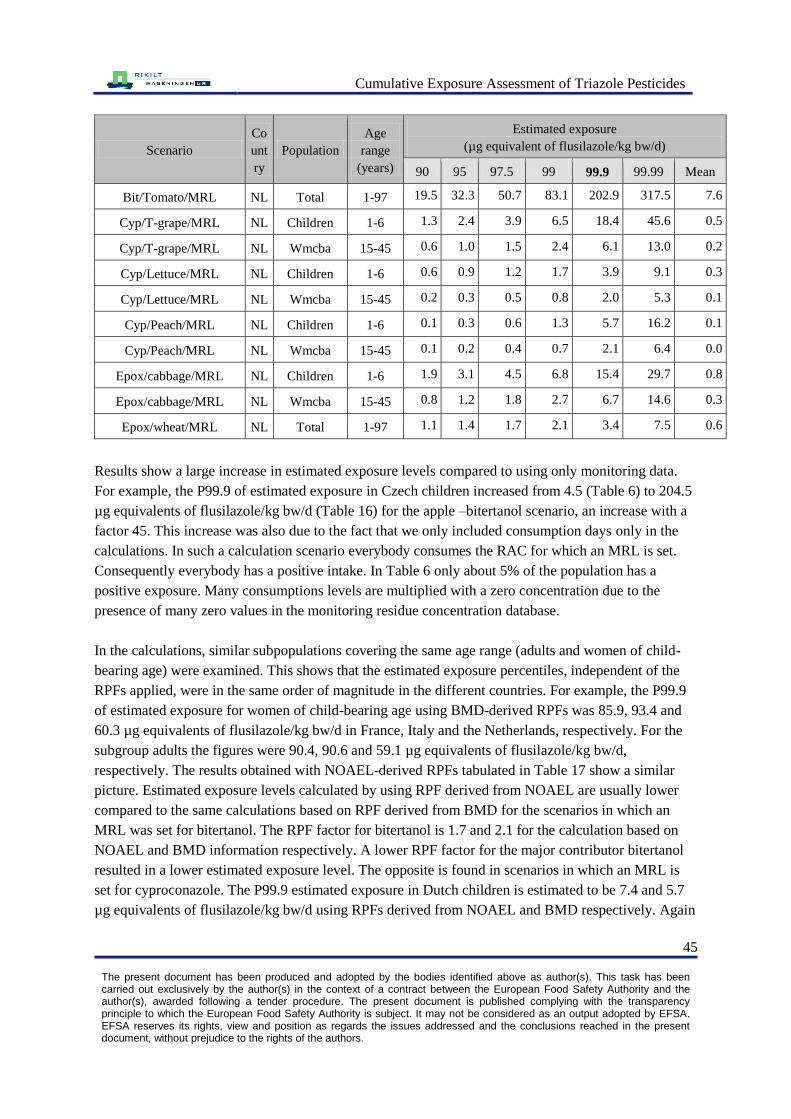
Cumulative Exposure Assessment of Triazole Pesticides
45 The present document has been produced and adopted by the bodies identified above as author(s). This task has been carried out exclusively by the author(s) in the context of a contract between the European Food Safety Authority and the author(s), awarded following a tender procedure. The present document is published complying with the transparency principle to which the European Food Safety Authority is subject. It may not be considered as an output adopted by EFSA. EFSA reserves its rights, view and position as regards the issues addressed and the conclusions reached in the present document, without prejudice to the rights of the authors.
Scenario
Co
unt
ry
Population
Age
range
(years)
Estimated exposure
(µg equivalent of flusilazole/kg bw/d)
90 95 97.5 99 99.9 99.99 Mean
Bit/Tomato/MRL NL Total 1-97 19.5 32.3 50.7 83.1 202.9 317.5 7.6
Cyp/T-grape/MRL NL Children 1-6 1.3 2.4 3.9 6.5 18.4 45.6 0.5
Cyp/T-grape/MRL NL Wmcba 15-45 0.6 1.0 1.5 2.4 6.1 13.0 0.2
Cyp/Lettuce/MRL NL Children 1-6 0.6 0.9 1.2 1.7 3.9 9.1 0.3
Cyp/Lettuce/MRL NL Wmcba 15-45 0.2 0.3 0.5 0.8 2.0 5.3 0.1
Cyp/Peach/MRL NL Children 1-6 0.1 0.3 0.6 1.3 5.7 16.2 0.1
Cyp/Peach/MRL NL Wmcba 15-45 0.1 0.2 0.4 0.7 2.1 6.4 0.0
Epox/cabbage/MRL NL Children 1-6 1.9 3.1 4.5 6.8 15.4 29.7 0.8
Epox/cabbage/MRL NL Wmcba 15-45 0.8 1.2 1.8 2.7 6.7 14.6 0.3
Epox/wheat/MRL NL Total 1-97 1.1 1.4 1.7 2.1 3.4 7.5 0.6
Results show a large increase in estimated exposure levels compared to using only monitoring data.
For example, the P99.9 of estimated exposure in Czech children increased from 4.5 (Table 6) to 204.5
µg equivalents of flusilazole/kg bw/d (Table 16) for the apple –bitertanol scenario, an increase with a
factor 45. This increase was also due to the fact that we only included consumption days only in the
calculations. In such a calculation scenario everybody consumes the RAC for which an MRL is set.
Consequently everybody has a positive intake. In Table 6 only about 5% of the population has a
positive exposure. Many consumptions levels are multiplied with a zero concentration due to the
presence of many zero values in the monitoring residue concentration database.
In the calculations, similar subpopulations covering the same age range (adults and women of child-
bearing age) were examined. This shows that the estimated exposure percentiles, independent of the
RPFs applied, were in the same order of magnitude in the different countries. For example, the P99.9
of estimated exposure for women of child-bearing age using BMD-derived RPFs was 85.9, 93.4 and
60.3 µg equivalents of flusilazole/kg bw/d in France, Italy and the Netherlands, respectively. For the
subgroup adults the figures were 90.4, 90.6 and 59.1 µg equivalents of flusilazole/kg bw/d,
respectively. The results obtained with NOAEL-derived RPFs tabulated in Table 17 show a similar
picture. Estimated exposure levels calculated by using RPF derived from NOAEL are usually lower
compared to the same calculations based on RPF derived from BMD for the scenarios in which an
MRL was set for bitertanol. The RPF factor for bitertanol is 1.7 and 2.1 for the calculation based on
NOAEL and BMD information respectively. A lower RPF factor for the major contributor bitertanol
resulted in a lower estimated exposure level. The opposite is found in scenarios in which an MRL is
set for cyproconazole. The P99.9 estimated exposure in Dutch children is estimated to be 7.4 and 5.7
µg equivalents of flusilazole/kg bw/d using RPFs derived from NOAEL and BMD respectively. Again
Cumulative Exposure Assessment of Triazole Pesticides
46 The present document has been produced and adopted by the bodies identified above as author(s). This task has been carried out exclusively by the author(s) in the context of a contract between the European Food Safety Authority and the author(s), awarded following a tender procedure. The present document is published complying with the transparency principle to which the European Food Safety Authority is subject. It may not be considered as an output adopted by EFSA. EFSA reserves its rights, view and position as regards the issues addressed and the conclusions reached in the present document, without prejudice to the rights of the authors.
this correlates with the magnitude of the RPFs which are 4.2 when derived from NOAEL and 2.2.
when derived from BMDs.
We also calculated the contribution of the RACs and pesticides to the overall cumulative estimated
exposure to triazoles for all combinations listed in Table 17 using both the NOAEL derived RPFs. In
all scenarios the RAC - pesticide combination for which the MRL value was used as input for the
exposure assessment contributed most to the total exposure. An extensive overview is given in Annex
7. In Table 18 we listed the contributions of the three major RAC-pesticide contributions for a few
typical exposure scenarios. For the scenarios in which an MRL was set for bitertanol, the exposure
levels were relatively high. For example, the P99.9 in children varied between 110.7 and 174.0 µg
equivalents of flusilazole/kg bw/d. The MRL set at 2 mg/kg is approximately a factor 1000 to 2000
higher than the monitoring results for the other triazoles.
However in many cases the ratio between the MRL and the monitoring results is much smaller. The
MRL proposed for cyproconazole in peaches is 0.1 mg/kg and a typical monitoring value is 0.03
mg/kg. In those cases the contribution of other RAC-pesticide combinations to the total estimated
average exposure levels is larger.
Table 18 lists the estimated exposure levels at the overall average exposure levels. It would be
interesting to know the contributions of different RAC-pesticide combinations at the upper tail of the
distributions for each person individually (e.g. consumers exceeding toxicological reference values),
but due to current limitation in the software this result cannot be provided yet, although information
about all RACs eaten by a particular person around a certain percentile of exposure can be obtained.
Estimated exposure levels are mainly caused by one RAC-pesticide combination. However in a few
cases small or major contributions from more than one RAC - pesticide combination can be expected.
How often this appears will depend on how often the pesticide is found and whether the RACs in
which the pesticides are found are frequently eaten.

Cumulative Exposure Assessment of Triazole Pesticides
47 The present document has been produced and adopted by the bodies identified above as author(s). This task has been carried out exclusively by the author(s) in the context of a contract between the European Food Safety Authority and the author(s), awarded following a tender procedure. The present document is published complying with the transparency principle to which the European Food Safety Authority is subject. It may not be considered as an output adopted by EFSA. EFSA reserves its rights, view and position as regards the issues addressed and the conclusions reached in the present document, without prejudice to the rights of the authors.
Table 17. Percentiles and mean level of estimated acute cumulative exposure (in µg equivalents of flusilazole/kg
bw/d) to triazoles in which MRLa data for a selected RAC
b-pesticide was used in combination with monitoring
data of other combinations. Calculations were performed using NOAEL-derived RPFsc, national food
consumption data and residue concentration data of all countries combined.
Scenario
Country
Population
Age
range
(years)
Estimated exposure
(µg equivalent of flusilazole/kg bw/d)
90 95 97.5 99 99.9 99.99 Mean
Bit/Apple/MRL CZ Children 4-9 38.2 52.1 67.8 91.5 167.4 272.1 17.2
Bit/Apple/MRL FR Children 3-6 30.8 47.5 66.0 92.6 174.0 288.6 10.8
Bit/Apple/MRL IT Children 1-17 26.9 40.3 56.5 82.6 170.0 282.4 9.9
Bit/Apple/MRL NL Children 1-6 25.2 38.5 53.9 77.3 158.3 280.9 8.6
Bit/Apple/MRL SE Children 3-13 36.7 52.0 68.6 93.5 167.7 266.6 11.8
Bit/Apple/MRL UK Children 4-18 18.2 27.3 37.8 54.1 110.7 190.2 13.6
Bit/Apple/MRL FR Adults 18-64 17.9 24.8 32.4 43.0 72.7 111.9 7.0
Bit/Apple/MRL IT Adults 18-64 18.1 24.5 31.4 41.8 74.4 114.0 7.6
Bit/Apple/MRL NL Adults 18-64 9.4 13.7 18.5 25.5 47.8 78.4 3.4
Bit/Apple/MRL FR Wmcba 15-45 17.1 23.5 30.5 40.4 69.6 109.8 6.5
Bit/Apple/MRL IT Wmcba 15-45 19.1 25.8 33.1 43.7 75.1 115.6 7.7
Bit/Apple/MRL NL Wmcba 15-45 9.0 13.5 18.4 25.8 49.0 82.9 3.1
Bit/Apple/MRL NL Total 1-97 11.4 17.6 25.2 38.1 88.0 171.1 4.2
Bit/Banana/MRL NL Total 1-97 7.9 13.0 19.8 31.8 75.8 144.4 3.0
Bit/Tomato/MRL NL Children 1-6 28.0 56.2 81.0 161.5 257.0 257.9 11.8
Bit/Tomato/MRL NL Wmcba 15-45 17.0 28.6 43.7 68.2 158.7 214.2 6.6
Bit/Tomato/MRL NL Total 1-97 15.8 26.2 41.0 67.3 164.6 257.0 6.2
Cyp/T-grape/MRL NL Children 1-6 2.4 4.5 7.2 12.1 35.7 89.2 0.9
Cyp/T-grape/MRL NL Wmcba 15-45 1.1 1.8 2.8 4.5 11.5 23.8 0.4
Cyp/Lettuce/MRL NL Children 1-6 1.1 1.6 2.1 2.9 5.7 9.9 0.5
Cyp/Lettuce/MRL NL Wmcba 15-45 0.4 0.6 0.9 1.3 2.9 5.8 0.2
Cyp/Peach/MRL NL Children 1-6 0.2 0.5 0.9 1.8 7.4 17.6 0.1
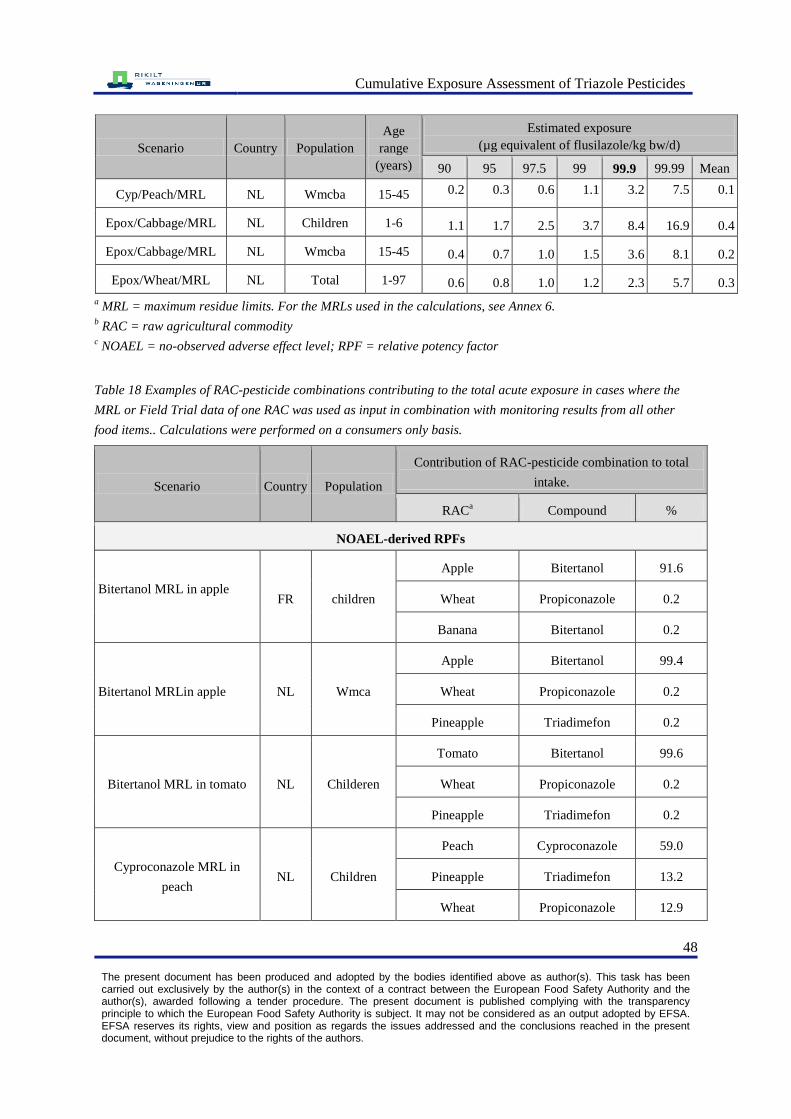
Cumulative Exposure Assessment of Triazole Pesticides
48 The present document has been produced and adopted by the bodies identified above as author(s). This task has been carried out exclusively by the author(s) in the context of a contract between the European Food Safety Authority and the author(s), awarded following a tender procedure. The present document is published complying with the transparency principle to which the European Food Safety Authority is subject. It may not be considered as an output adopted by EFSA. EFSA reserves its rights, view and position as regards the issues addressed and the conclusions reached in the present document, without prejudice to the rights of the authors.
Scenario
Country
Population
Age
range
(years)
Estimated exposure
(µg equivalent of flusilazole/kg bw/d)
90 95 97.5 99 99.9 99.99 Mean
Cyp/Peach/MRL NL Wmcba 15-45 0.2 0.3 0.6 1.1 3.2 7.5 0.1
Epox/Cabbage/MRL NL Children 1-6 1.1 1.7 2.5 3.7 8.4 16.9 0.4
Epox/Cabbage/MRL NL Wmcba 15-45 0.4 0.7 1.0 1.5 3.6 8.1 0.2
Epox/Wheat/MRL NL Total 1-97 0.6 0.8 1.0 1.2 2.3 5.7 0.3
a MRL = maximum residue limits. For the MRLs used in the calculations, see Annex 6.
b RAC = raw agricultural commodity
c NOAEL = no-observed adverse effect level; RPF = relative potency factor
Table 18 Examples of RAC-pesticide combinations contributing to the total acute exposure in cases where the
MRL or Field Trial data of one RAC was used as input in combination with monitoring results from all other
food items.. Calculations were performed on a consumers only basis.
Scenario
Country
Population
Contribution of RAC-pesticide combination to total
intake.
RACa
Compound %
NOAEL-derived RPFs
Bitertanol MRL in apple
FR children
Apple Bitertanol 91.6
Wheat Propiconazole 0.2
Banana Bitertanol 0.2
Bitertanol MRLin apple NL Wmca
Apple Bitertanol 99.4
Wheat Propiconazole 0.2
Pineapple Triadimefon 0.2
Bitertanol MRL in tomato NL Childeren
Tomato Bitertanol 99.6
Wheat Propiconazole 0.2
Pineapple Triadimefon 0.2
Cyproconazole MRL in
peach NL Children
Peach Cyproconazole 59.0
Pineapple Triadimefon 13.2
Wheat Propiconazole 12.9
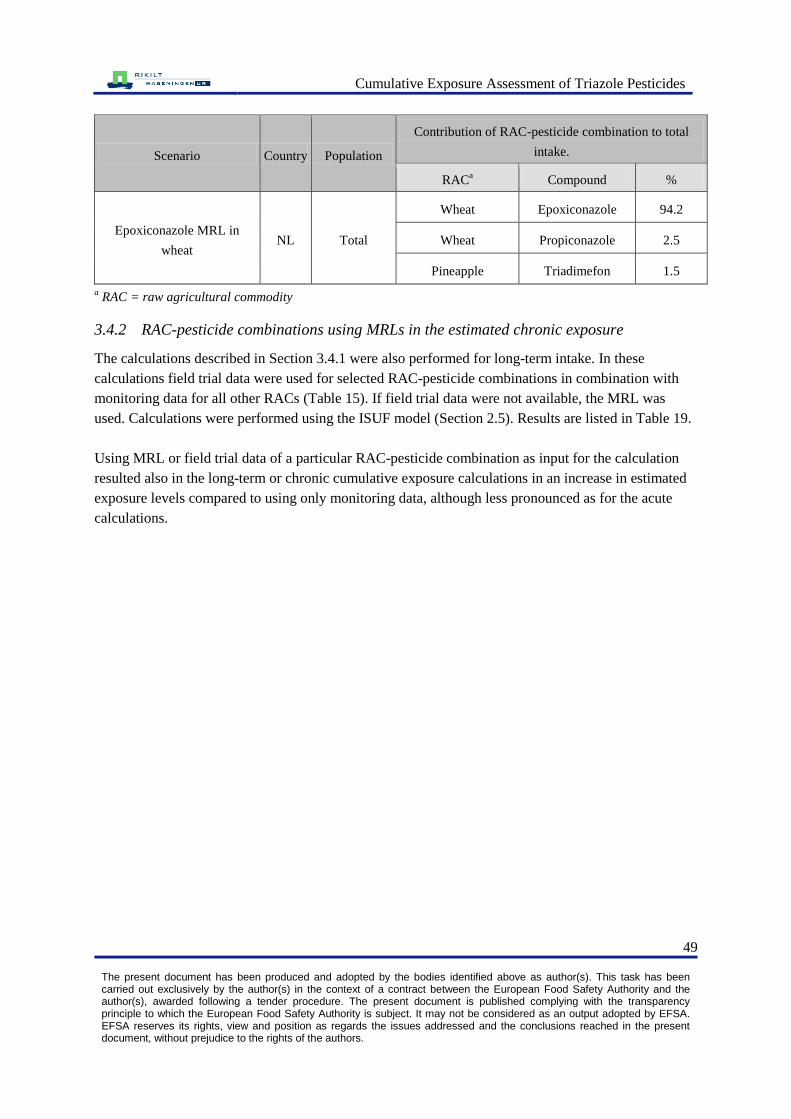
Cumulative Exposure Assessment of Triazole Pesticides
49 The present document has been produced and adopted by the bodies identified above as author(s). This task has been carried out exclusively by the author(s) in the context of a contract between the European Food Safety Authority and the author(s), awarded following a tender procedure. The present document is published complying with the transparency principle to which the European Food Safety Authority is subject. It may not be considered as an output adopted by EFSA. EFSA reserves its rights, view and position as regards the issues addressed and the conclusions reached in the present document, without prejudice to the rights of the authors.
Scenario
Country
Population
Contribution of RAC-pesticide combination to total
intake.
RACa
Compound %
Epoxiconazole MRL in
wheat NL Total
Wheat Epoxiconazole 94.2
Wheat Propiconazole 2.5
Pineapple Triadimefon 1.5
a RAC = raw agricultural commodity
3.4.2 RAC-pesticide combinations using MRLs in the estimated chronic exposure
The calculations described in Section 3.4.1 were also performed for long-term intake. In these
calculations field trial data were used for selected RAC-pesticide combinations in combination with
monitoring data for all other RACs (Table 15). If field trial data were not available, the MRL was
used. Calculations were performed using the ISUF model (Section 2.5). Results are listed in Table 19.
Using MRL or field trial data of a particular RAC-pesticide combination as input for the calculation
resulted also in the long-term or chronic cumulative exposure calculations in an increase in estimated
exposure levels compared to using only monitoring data, although less pronounced as for the acute
calculations.

Cumulative Exposure Assessment of Triazole Pesticides
50 The present document has been produced and adopted by the bodies identified above as author(s). This task has been carried out exclusively by the author(s) in the context of a contract between the European Food Safety Authority and the author(s), awarded following a tender procedure. The present document is published complying with the transparency principle to which the European Food Safety Authority is subject. It may not be considered as an output adopted by EFSA. EFSA reserves its rights, view and position as regards the issues addressed and the conclusions reached in the present document, without prejudice to the rights of the authors.
Table 19 Percentiles and mean level of estimated chronic cumulative exposure (in µg equivalent of
cyproconazole/kg bw/d) to triazoles in which Field Trial or MRLa data of selected RAC
b- pesticide combinations
was used in combination with monitoring results for other combinations.. Calculations were performed using
NOAEL-derived RPFsc, national food consumption data and residue concentration data of all countries
combined.
Scenario Countrye Population
e
Age
range
(years)
Estimated exposure
(µg equivalent of cyproconazole /kg bw/d)
90 95 99 99.9 99.99 Mean
Bit/Apple/FT CZ Children 4-9 1.4 1.6 2.0 2.5 2.5 0.8
Bit/Apple/FT FR Children 3-6 1.0 1.3 1.9 2.7 2.9 0.5
Bit/Apple/FT IT Children 1-17 0.8 1.1 1.7 2.6 2.7 0.3
Bit/Apple/FT NL Children 1-6 3.7 4.7 7.0 8.5 8.7 1.5
Bit/Apple/FT SE Children 3-13 1.9 2.4 3.5 4.8 5.1 0.8
Bit/Apple/FT UK Children 4-18 0.7 1.0 1.7 2.7 2.9 0.3
Bit/Apple/FT FR Adults 18-64 0.5 0.6 0.9 1.4 1.5 0.2
Bit/Apple/FT IT Adults 18-64 0.5 0.7 1.0 1.4 1.5 0.2
Bit/Apple/FT NL Adults 18-64 0.5 0.7 1.0 1.3 1.3 0.2
Bit/Apple/FT NL Total 1-97 0.9 1.2 2.1 3.4 3.7 0.3
Bit/Banana/FT NL Total 1-97 0.2 0.3 0.8 1.3 1.4 0.1
Bit/Tomato/FT NL Children 1-6 2.5 3.3 5.2 6.5 6.6 1.1
Bit/Tomato/FT NL Adult 15-45 1.4 1.9 2.9 3.8 3.8 0.7
Bit/Tomato/FT NL Total 1-97 1.5 1.9 3.1 4.4 4.7 0.7
Cyp/T-grape/FT NL Total 1-97 0.1 0.2 0.4 0.6 0.6 0.1
Cyp/Lettuce/MRL NL Children 1-6 0.1 0.1 0.2 0.4 0.7 0.0
Cyp/Lettuce/MRL NL Adults 18-64 0.0 0.0 0.1 0.1 0.1 0.0
Dini/T-grape/MRL NL Total 1-97 0.1 0.1 0.2 0.4 0.4 0.0
Epox/Wheat/FT CZ Children 4-9 0.8 0.9 1.1 1.3 1.3 0.6

Cumulative Exposure Assessment of Triazole Pesticides
51 The present document has been produced and adopted by the bodies identified above as author(s). This task has been carried out exclusively by the author(s) in the context of a contract between the European Food Safety Authority and the author(s), awarded following a tender procedure. The present document is published complying with the transparency principle to which the European Food Safety Authority is subject. It may not be considered as an output adopted by EFSA. EFSA reserves its rights, view and position as regards the issues addressed and the conclusions reached in the present document, without prejudice to the rights of the authors.
Scenario Countrye Population
e
Age
range
(years)
Estimated exposure
(µg equivalent of cyproconazole /kg bw/d)
90 95 99 99.9 99.99 Mean
Epox/Wheat/FT FR Children 3-6 0.8 0.9 1.2 1.5 1.5 0.5
Epox/Wheat/FT IT Children 1-17 0.7 0.8 1.0 1.2 1.2 0.5
Epox/Wheat/FT NL Children 1-6 0.7 0.8 1.1 1.2 1.3 0.5
Epox/Wheat/FT SE Children 3-13 0.6 0.7 0.8 1.1 1.1 0.4
Epox/Wheat/FT UK Children 4-18 0.4 0.5 0.6 0.8 0.8 0.2
Epox/Wheat/FT NL Total 1-97 0.4 0.4 0.6 0.8 0.8 0.2
aMRL = maximum residue limits.and Field Trial (FT) see also Annex 6 for the data used
b RAC = raw agricultural commodity
c NOAEL = no-observed adverse effect level; RPF = Relative
potency factor d For an explanation of the scenarios see Table 15.
e For abbreviations of countries and ages of the (sub)populations children and total, see Table 3. The age range
of the subpopulation adults was 18-64 years.
For example, the P99.9 in again Czech children increased from 0.4 (Table 12) to 2.5 µg equivalents of
cyproconazole/kg bw/d, an increase with a factor 6.2. Also here, when examining comparable
subpopulations like adults, the estimated exposure between countries was comparable. For example,
the P99.9 of estimated exposure in the apple – bitertanol scenario (scenario 1) for this subpopulation
was 1.4, 1.4 and 1.3 µg equivalents of µg equivalents cyproconazole/kg bw/d for France, Italy and the
Netherlands, respectively.
Table 20 Examples of RAC-pesticide combinations contributing to the total chronic exposure in cases where the
MRL or Field Trial data of one RAC was used as input in combination with monitoring data for RACs.
Calculations were based on RFP derived from NOAELs.
Scenario
Country
Population
Contribution of RAC-pesticide combination to total intake.
RAC
Compound %
Bitertanol FTin apple
FR Children
Apple Bitertanol 87.7
Banana Bitertanol 4.2
Wheat Propiconazole 2.0
Bitertanol FTin apple IT Adults
Apple Bitertanol 89.0
Tomato Bitertanol 4.4
Wheat Propiconazole 1.2
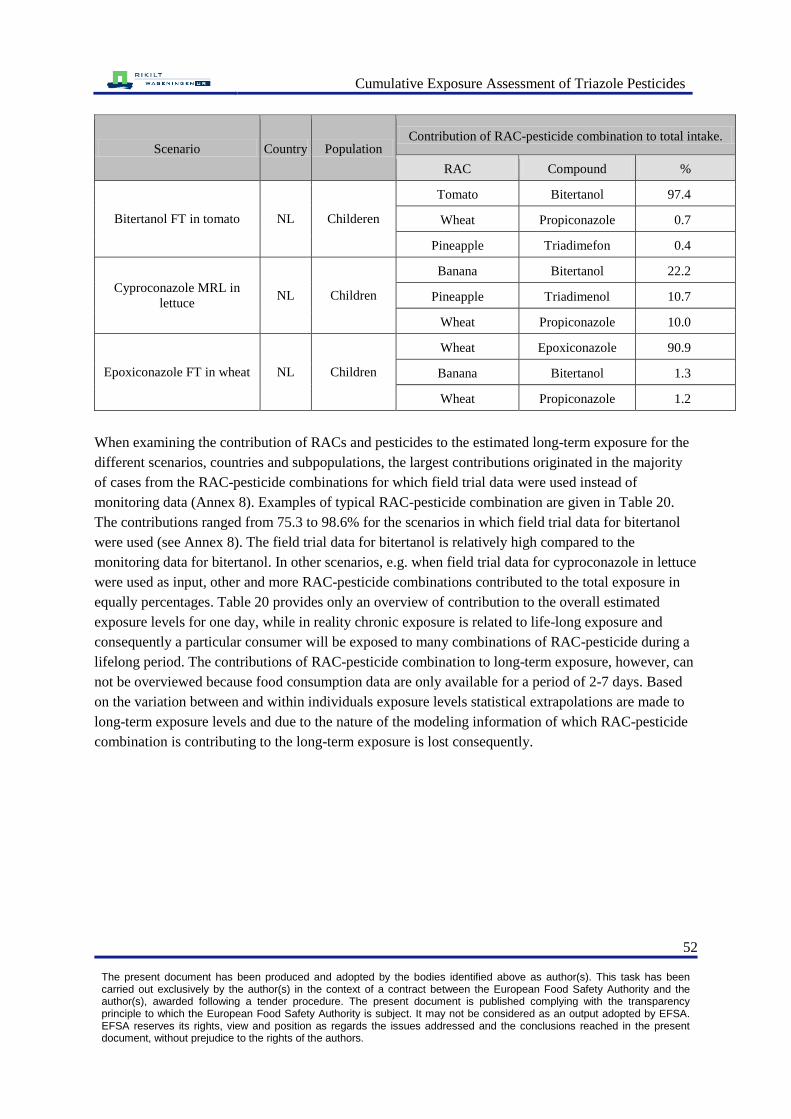
Cumulative Exposure Assessment of Triazole Pesticides
52 The present document has been produced and adopted by the bodies identified above as author(s). This task has been carried out exclusively by the author(s) in the context of a contract between the European Food Safety Authority and the author(s), awarded following a tender procedure. The present document is published complying with the transparency principle to which the European Food Safety Authority is subject. It may not be considered as an output adopted by EFSA. EFSA reserves its rights, view and position as regards the issues addressed and the conclusions reached in the present document, without prejudice to the rights of the authors.
Scenario
Country
Population
Contribution of RAC-pesticide combination to total intake.
RAC
Compound %
Bitertanol FT in tomato NL Childeren
Tomato Bitertanol 97.4
Wheat Propiconazole 0.7
Pineapple Triadimefon 0.4
Cyproconazole MRL in
lettuce NL Children
Banana Bitertanol 22.2
Pineapple Triadimenol 10.7
Wheat Propiconazole 10.0
Epoxiconazole FT in wheat NL Children
Wheat Epoxiconazole 90.9
Banana Bitertanol 1.3
Wheat Propiconazole 1.2
When examining the contribution of RACs and pesticides to the estimated long-term exposure for the
different scenarios, countries and subpopulations, the largest contributions originated in the majority
of cases from the RAC-pesticide combinations for which field trial data were used instead of
monitoring data (Annex 8). Examples of typical RAC-pesticide combination are given in Table 20.
The contributions ranged from 75.3 to 98.6% for the scenarios in which field trial data for bitertanol
were used (see Annex 8). The field trial data for bitertanol is relatively high compared to the
monitoring data for bitertanol. In other scenarios, e.g. when field trial data for cyproconazole in lettuce
were used as input, other and more RAC-pesticide combinations contributed to the total exposure in
equally percentages. Table 20 provides only an overview of contribution to the overall estimated
exposure levels for one day, while in reality chronic exposure is related to life-long exposure and
consequently a particular consumer will be exposed to many combinations of RAC-pesticide during a
lifelong period. The contributions of RAC-pesticide combination to long-term exposure, however, can
not be overviewed because food consumption data are only available for a period of 2-7 days. Based
on the variation between and within individuals exposure levels statistical extrapolations are made to
long-term exposure levels and due to the nature of the modeling information of which RAC-pesticide
combination is contributing to the long-term exposure is lost consequently.
Cumulative Exposure Assessment of Triazole Pesticides
53 The present document has been produced and adopted by the bodies identified above as author(s). This task has been carried out exclusively by the author(s) in the context of a contract between the European Food Safety Authority and the author(s), awarded following a tender procedure. The present document is published complying with the transparency principle to which the European Food Safety Authority is subject. It may not be considered as an output adopted by EFSA. EFSA reserves its rights, view and position as regards the issues addressed and the conclusions reached in the present document, without prejudice to the rights of the authors.
4 Discussion
4.1 RPF approach
To calculate the cumulative exposure to triazoles, we used the relative potency factor (RPF) approach.
There are other methods available to assess the cumulative exposure as summarised in the report of the
EFSA Colloquium (EFSA 2007), as well as in a recent opinion of the EFSA PPR Panel (EFSA 2008).
The PPR Panel concluded that the most useful methods to assess the cumulative exposure to
compounds belonging to a common mechanism group were in increasing levels of complexity and
refinement, the HI, the RfPI, the RPF approach and physiologically-based toxicokinetic (PBTK)
modeling (EFSA 2008). However, the last type of modeling is presently very resource intensive and
demanding of specialised expertise. It is therefore unlikely to be routinely used in the near future
(EFSA 2008). In this report we used the second best model, the RPF approach. In this approach the
relative potency of each compound is expressed relative to an index compound. In this report the RPFs
were supplied by EFSA. The derivation of these factors will therefore not be discussed in this report,
including whether the condition of dose-additivity was met. This will be addressed in an EFSA
opinion on the application of the suggested (tiered) cumulative exposure approach as described in
(EFSA 2008).
When RPFs are available, we showed that these factors can be used to perform both acute and chronic
cumulative exposure assessments, by combining the RPF approach with the probabilistic approach.
We demonstrated that with this approach we could calculate the cumulative exposure for different
countries and (sub)populations using either national and international (all national monitoring data
combined) monitoring data addressing the whole diet and all compounds simultaneously. We also
demonstrated the possible application of this approach in the regulatory field of pesticides by using
MRLs (acute and chronic) or field trial data (chronic) for particular RAC-pesticide combinations. In
these simulations, we used for all the other pesticide – RAC combinations monitoring data.
Furthermore, in acute modeling we mimicked the consumers-only approach as used in deterministic
estimations of exposure for MRL setting by only including those consumption days at which at least
the consumption of the RAC of interest was recorded. In this way an estimated exposure distribution
was generated containing only positive exposure levels.
It should be noted that in the present approach all RACs consumed on one day were combined, and the
time-course of the exposure was not addressed. This includes for example whether the effect of a
compound ingested during breakfast is still present when a compound of the same mechanism group is
ingested during dinner. Also whether compounds ingested yesterday are still present the next day.
Examination of this was outside the scope of this project, but can play a further role in refining
exposure scenarios if information on toxicokinetics and / or -dynamics might become available. It was
stated in the EFSA opinion that this was not expected to be a major refinement (EFSA 2008).
Cumulative Exposure Assessment of Triazole Pesticides
54 The present document has been produced and adopted by the bodies identified above as author(s). This task has been carried out exclusively by the author(s) in the context of a contract between the European Food Safety Authority and the author(s), awarded following a tender procedure. The present document is published complying with the transparency principle to which the European Food Safety Authority is subject. It may not be considered as an output adopted by EFSA. EFSA reserves its rights, view and position as regards the issues addressed and the conclusions reached in the present document, without prejudice to the rights of the authors.
4.2 MRL-setting and a tiered approach
In the opinion of the EFSA PPR panel the use of a tiered approach, for both toxicological evaluation
and exposure estimation, is advocated to perform a cumulative risk assessment (EFSA 2008). In this
way the best and most efficient use of the available sources is made.
In a tiered approach of exposure estimation the first step is normally based on a very conservative
estimate of exposure, which, if needed, can be refined in subsequent steps by using extra information
(e.g. processing factors), more realistic data (e.g. instead of a conservative estimate of consumption a
distribution of actual consumption levels) or more refined models (e.g. deterministic vs. probabilistic
models). When going through the tiers, the resulting exposure estimates will become increasingly
more realistic, ranging from one high level of estimated exposure to a probabilistic characterisation of
estimated exposures for individual members of the relevant population.
EFSA proposes to use deterministic models based on fixed (conservative) consumption and residue
levels as a first tier and using probabilistic modeling in combination with the RPF-method as a fourth
tier. We did not test the relation between the deterministic and probabilistic models, although a further
elaboration on this relationship is very important. An important issue is that in a tiered approach a first
tier should be more conservative compared to the next tiers. Testing and comparing those tiers is
recommended.
In this report we performed exposure modeling by combining national food consumption databases
with different types of residue concentration data, including MRL, field trial data and monitoring data.
These types of data can be used in different situations, e.g. to calculate the actual exposure or possible
exposure levels when establishing new MRLs. In Figure 1 we plotted the estimated cumulative long-
term exposure to triazoles for the total Dutch population using these three types of data. For reasons of
comparison we also included here the estimated exposure when using the STMR. MRL, STMR and
field trial data were included for epoxiconale in wheat. For the other RAC-pesticide combinations
monitoring data were used derived from all national data available. It is clear that the estimated
exposure decreased with an increasing level of refinement of the residue concentration data. Using the
MRL resulted in very high percentiles of exposure compared to the other three types of input data,
while monitoring data resulted in the lowest levels of estimated exposure. Wheat is a RAC that is
consumed on more than 90% of the consumption days in the Dutch database, and monitoring levels of
epoxiconazole were all below the limit of reporting (LOR). Replacing these levels with one high level
like the MRL will result in a large increase in the estimated exposure. The increase in exposure when
using STMR or field trial data instead of monitoring data was less pronounced but still large.
In the acute assessments, use of the MRL for a specific RAC–pesticide combination resulted also in a
higher level of estimated exposure compared to monitoring data (Tables 16 and 17). Apart from a
higher residue level, this was also due to the inclusion of only those consumption days in the
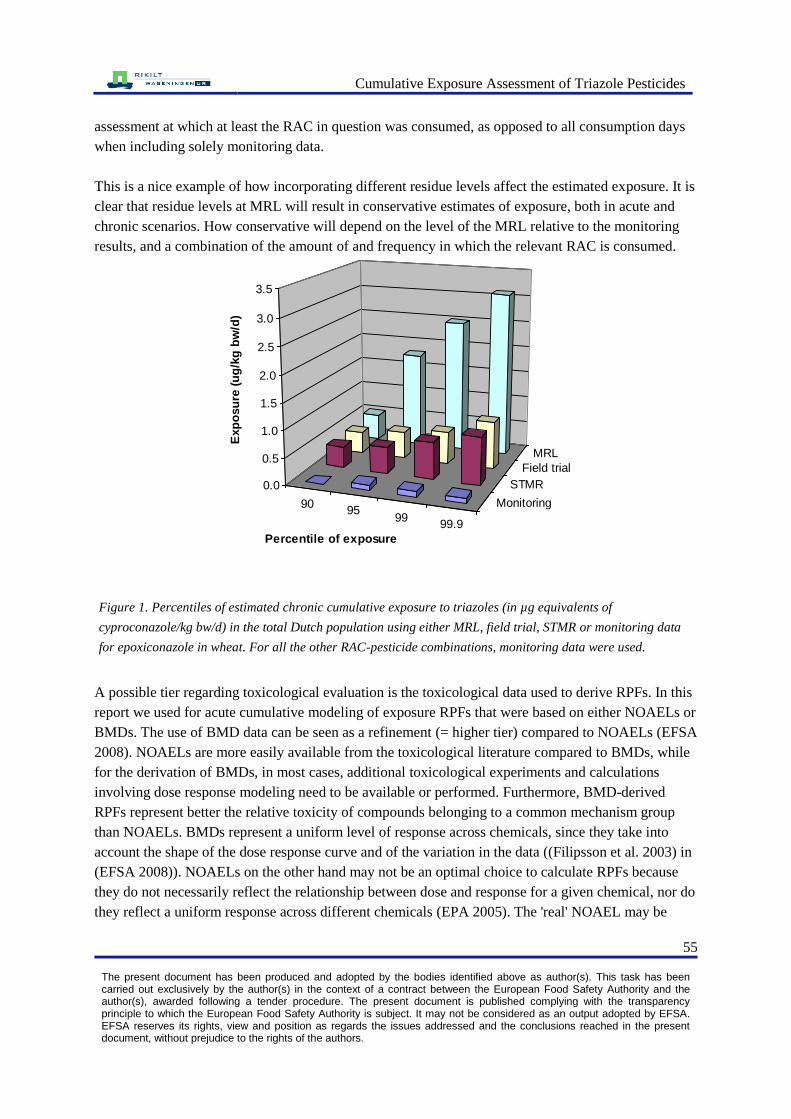
Cumulative Exposure Assessment of Triazole Pesticides
55 The present document has been produced and adopted by the bodies identified above as author(s). This task has been carried out exclusively by the author(s) in the context of a contract between the European Food Safety Authority and the author(s), awarded following a tender procedure. The present document is published complying with the transparency principle to which the European Food Safety Authority is subject. It may not be considered as an output adopted by EFSA. EFSA reserves its rights, view and position as regards the issues addressed and the conclusions reached in the present document, without prejudice to the rights of the authors.
assessment at which at least the RAC in question was consumed, as opposed to all consumption days
when including solely monitoring data.
This is a nice example of how incorporating different residue levels affect the estimated exposure. It is
clear that residue levels at MRL will result in conservative estimates of exposure, both in acute and
chronic scenarios. How conservative will depend on the level of the MRL relative to the monitoring
results, and a combination of the amount of and frequency in which the relevant RAC is consumed.
9095
9999.9
Monitoring
STMR
Field trial
MRL
0.0
0.5
1.0
1.5
2.0
2.5
3.0
3.5
Exp
osu
re (
ug
/kg
bw
/d)
Percentile of exposure
A possible tier regarding toxicological evaluation is the toxicological data used to derive RPFs. In this
report we used for acute cumulative modeling of exposure RPFs that were based on either NOAELs or
BMDs. The use of BMD data can be seen as a refinement (= higher tier) compared to NOAELs (EFSA
2008). NOAELs are more easily available from the toxicological literature compared to BMDs, while
for the derivation of BMDs, in most cases, additional toxicological experiments and calculations
involving dose response modeling need to be available or performed. Furthermore, BMD-derived
RPFs represent better the relative toxicity of compounds belonging to a common mechanism group
than NOAELs. BMDs represent a uniform level of response across chemicals, since they take into
account the shape of the dose response curve and of the variation in the data ((Filipsson et al. 2003) in
(EFSA 2008)). NOAELs on the other hand may not be an optimal choice to calculate RPFs because
they do not necessarily reflect the relationship between dose and response for a given chemical, nor do
they reflect a uniform response across different chemicals (EPA 2005). The 'real' NOAEL may be
Figure 1. Percentiles of estimated chronic cumulative exposure to triazoles (in µg equivalents of
cyproconazole/kg bw/d) in the total Dutch population using either MRL, field trial, STMR or monitoring data
for epoxiconazole in wheat. For all the other RAC-pesticide combinations, monitoring data were used.

Cumulative Exposure Assessment of Triazole Pesticides
56 The present document has been produced and adopted by the bodies identified above as author(s). This task has been carried out exclusively by the author(s) in the context of a contract between the European Food Safety Authority and the author(s), awarded following a tender procedure. The present document is published complying with the transparency principle to which the European Food Safety Authority is subject. It may not be considered as an output adopted by EFSA. EFSA reserves its rights, view and position as regards the issues addressed and the conclusions reached in the present document, without prejudice to the rights of the authors.
lower or higher than the observed level due to dosing levels used or insensitivity of the study (Slob
and Pieters 1997; Moerbeek et al. 2004). Based on this the cumulative exposure levels calculated with
BMD-derived RPFs are likely to be closer to reality.
In the context of a tiered approach estimated exposure levels calculated with NOAEL-derived RPFs
should result in higher (= more conservative) estimates of exposure than those based on BMD-derived
RPFs . This is however not always the case. In Figure 2 we plotted the estimated acute cumulative
exposure to triazoles for the total population of different countries combined with all national residue
concentration data using either NOAEL- or BMD-derived RPFs.
FR
-BM
D
FR
-NO
AE
L
IT-B
MD
IT-N
OA
EL
NL-B
MD
NL-N
OA
EL
SE
-BM
D
SE
-NO
AE
L
90
95
9999.9
0.0
0.5
1.0
1.5
2.0
2.5
3.0
3.5
4.0
Exp
osu
re (
ug
/kg
bw
/d)
Country and toxicological reference value
Percentiles of
exposure
Figure 2. Percentiles of estimated acute cumulative exposure (in µg equivalents of flusilazole/kg bw/d) for
different countries using either NOAEL- or BMD derived RPFs.
Calculations with BMD-derived RPFs resulted in either similar (France and the Netherlands) or
somewhat higher levels of estimated exposure (Italy, Sweden) as those calculated with the NOAEL-
derived RPFs. This shows that the BMD approach does not result always in less conservative levels,
and that it should be recognized that using NOAEL-derived RPFs as part of a tiered approach will not
necessarily result in a more conservative (= higher) estimate of exposure. It will result in another
estimate of exposure that is very likely less close to the ‗real‘ exposure than that derived with the
BMD approach, given the characteristics of both approaches.
Cumulative Exposure Assessment of Triazole Pesticides
57 The present document has been produced and adopted by the bodies identified above as author(s). This task has been carried out exclusively by the author(s) in the context of a contract between the European Food Safety Authority and the author(s), awarded following a tender procedure. The present document is published complying with the transparency principle to which the European Food Safety Authority is subject. It may not be considered as an output adopted by EFSA. EFSA reserves its rights, view and position as regards the issues addressed and the conclusions reached in the present document, without prejudice to the rights of the authors.
The differences in estimated exposure between the two approaches are due to differences in the
derived RPFs, which can be very large (Table 4). For example, the RPF of propiconazole is either 0.1
or 1.7 depending on whether the RPF is derived from NOAELs or from BMDs. It is not known in
advance whether RPFs derived from BMD modeling will result in higher or lower exposures
compared to RPFs derived from NOAELs. It is assumed that RPFs derived from NOAEL are more
uncertain for example because the risk assessors does not have any information on the range of doses
given to the animals and differences in dose concentration given to the test animals (dose spacing).
Apart from resulting in different levels of estimated exposure, this difference also affects the
contribution of RACs to the total estimated exposure. For example, based on NOAEL-derived RPFs
wheat contributed by far most to the overall acute estimated exposure to triazoles in all countries and
(sub)populations (>50%; Table 10). The reason for this was the presence of propiconazole in wheat
with a relatively high RPF (1.7; Table 4). When applying BMD-derived RPFs wheat was replaced by
banana and pineapple as contributing most to the exposure. Wheat was not important anymore due to
the low RPF of propiconazole (0.1).
Examination of the toxicological differences between the NOAEL and BMD-derived RPFs as reported
here is necessary, as well as a discussion on which of the approaches results in the most realistic level
of estimated exposure of the groups of compounds relative to the toxic effect on which the BMD and
NOAEL are based.
4.3 European dimension of the cumulative estimated exposure
In this report we used national food consumption and monitoring data from different European
countries, including Czech Republic, France, Italy, the Netherlands, Sweden and the UK. For the
estimated exposure calculations national food consumption data were either combined with national
monitoring data or with a database in which all national residue concentration data were combined. In
this database also monitoring residue concentration data of Finland were included. This database was
generated to eliminate uncertainties in the estimated exposure results related to the completeness of the
monitoring and differences in monitoring practices in countries, as recognized in the EFSA opinion on
acute dietary intake (EFSA 2007).
This issue of differences in national monitoring databases is illustrated in Figure 3, where we plotted
in the left panel the acute cumulative estimated exposure for the subpopulation ‗children‘ for all
countries combining national food consumption data with national monitoring residue concentration
data using BMD-derived RPFs. In the right panel the national residue concentrationdata were replaced
by all national monitoring data. In the left panel the estimated exposure levels differ largely per
country with relatively high levels of estimated exposure in France and low levels in Sweden.
Replacing the national monitoring data with all national monitoring data of all participating countries,
the estimated exposure differences were very much reduced and more comparable.

Cumulative Exposure Assessment of Triazole Pesticides
58 The present document has been produced and adopted by the bodies identified above as author(s). This task has been carried out exclusively by the author(s) in the context of a contract between the European Food Safety Authority and the author(s), awarded following a tender procedure. The present document is published complying with the transparency principle to which the European Food Safety Authority is subject. It may not be considered as an output adopted by EFSA. EFSA reserves its rights, view and position as regards the issues addressed and the conclusions reached in the present document, without prejudice to the rights of the authors.
The reasons for these differences are the number of RAC analyzed in each country and the residue
levels analysed. It is not known whether some countries might have more targeted monitoring
practices compared to other countries. Apart from differences in monitoring practices and residue
levels analyzed, there are also differences in dietary surveys that will explain (partly) the differences in
estimated exposure. The differences include for example population involved (e.g. the age range of the
French children was lower than that of the group children from Sweden (3-6 vs. 3-13 years), method
of data collection, and the duration of the study. Also harmonisation at this level is needed to compare
exposure assessments between countries.
To be able to link all the national residue concentration data to the different national food consumption
databases the food coding of the national food consumption databases were harmonised at RAC level.
This was achieved by converting foods coded in the different food consumption databases to their
RAC ingredients by linking them to Dutch foods. These foods are in turn converted to RAC level
using a food conversion model developed at RIKILT (Van Dooren et al. 1995). RACs are more or less
similar in different countries, making harmonisation at that level feasible. However, due to lack of
food conversion models in Europe we used the Dutch food conversion model, assuming therefore that
similar foods in Europe consist of the same RAC ingredients in equal weight percentages. This is of
course an approximation of the truth, but the best option available at this moment. Eventually, it is
recommended that each country develops its own food conversion model, including all relevant foods.
CZFR
ITNL
SEUK
90
95
99
99.9
0
1
2
3
4
5
6
7
8
9
10
Exp
osu
re (
ug
/kg
bw
/d)
Country
Perc
enti
le
CZFR
ITNL
SEUK
90
95
99
99.9
0
1
2
3
4
5
6
7
8
9
10
Exp
osu
re (
ug
/kg
bw
/d)
Country
Perc
enti
le
Figure 3. Percentiles of acute cumulative exposure (in µg equivalents of flusilazole/kg bw/d)
to triazoles in different countries using either national monitoring residue data (A) or all
monitoring data combined (B). The exposure was calculated using exposure BMD-derived
RPFs.
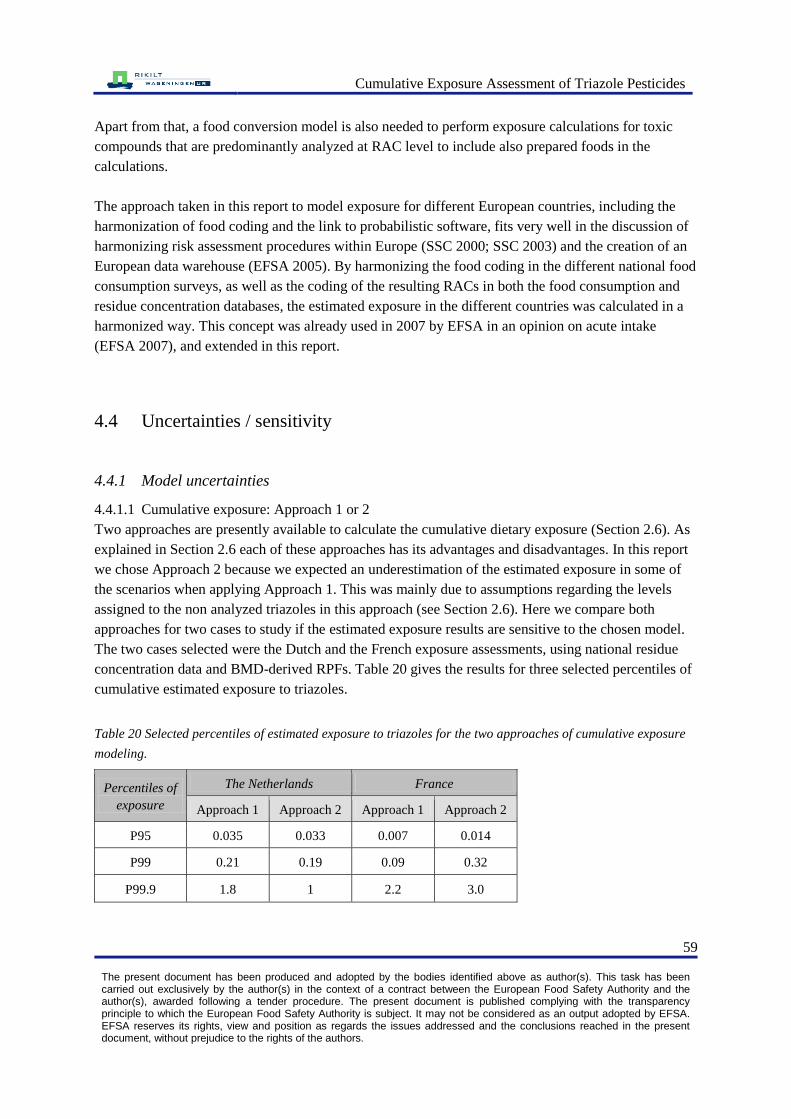
Cumulative Exposure Assessment of Triazole Pesticides
59 The present document has been produced and adopted by the bodies identified above as author(s). This task has been carried out exclusively by the author(s) in the context of a contract between the European Food Safety Authority and the author(s), awarded following a tender procedure. The present document is published complying with the transparency principle to which the European Food Safety Authority is subject. It may not be considered as an output adopted by EFSA. EFSA reserves its rights, view and position as regards the issues addressed and the conclusions reached in the present document, without prejudice to the rights of the authors.
Apart from that, a food conversion model is also needed to perform exposure calculations for toxic
compounds that are predominantly analyzed at RAC level to include also prepared foods in the
calculations.
The approach taken in this report to model exposure for different European countries, including the
harmonization of food coding and the link to probabilistic software, fits very well in the discussion of
harmonizing risk assessment procedures within Europe (SSC 2000; SSC 2003) and the creation of an
European data warehouse (EFSA 2005). By harmonizing the food coding in the different national food
consumption surveys, as well as the coding of the resulting RACs in both the food consumption and
residue concentration databases, the estimated exposure in the different countries was calculated in a
harmonized way. This concept was already used in 2007 by EFSA in an opinion on acute intake
(EFSA 2007), and extended in this report.
4.4 Uncertainties / sensitivity
4.4.1 Model uncertainties
4.4.1.1 Cumulative exposure: Approach 1 or 2
Two approaches are presently available to calculate the cumulative dietary exposure (Section 2.6). As
explained in Section 2.6 each of these approaches has its advantages and disadvantages. In this report
we chose Approach 2 because we expected an underestimation of the estimated exposure in some of
the scenarios when applying Approach 1. This was mainly due to assumptions regarding the levels
assigned to the non analyzed triazoles in this approach (see Section 2.6). Here we compare both
approaches for two cases to study if the estimated exposure results are sensitive to the chosen model.
The two cases selected were the Dutch and the French exposure assessments, using national residue
concentration data and BMD-derived RPFs. Table 20 gives the results for three selected percentiles of
cumulative estimated exposure to triazoles.
Table 20 Selected percentiles of estimated exposure to triazoles for the two approaches of cumulative exposure
modeling.
Percentiles of
exposure
The Netherlands France
Approach 1 Approach 2 Approach 1 Approach 2
P95 0.035 0.033 0.007 0.014
P99 0.21 0.19 0.09 0.32
P99.9 1.8 1 2.2 3.0
Cumulative Exposure Assessment of Triazole Pesticides
60 The present document has been produced and adopted by the bodies identified above as author(s). This task has been carried out exclusively by the author(s) in the context of a contract between the European Food Safety Authority and the author(s), awarded following a tender procedure. The present document is published complying with the transparency principle to which the European Food Safety Authority is subject. It may not be considered as an output adopted by EFSA. EFSA reserves its rights, view and position as regards the issues addressed and the conclusions reached in the present document, without prejudice to the rights of the authors.
The results show that for the Dutch assessment there is little difference between the two approaches.
For the French assessment however, the estimated exposure with Approach 1 is much lower compared
to Approach 2. This result could be expected if many RAC samples are analyzed for only part of the
triazoles. The French monitoring data listed in Annex 1 confirm that partial measurement of samples
occurred quite often in the French monitoring programme, whereas most samples were analyzed for
all triazoles in the Dutch monitoring data (Annex 1). The similarity of the results of Approach 1 and 2
in the Dutch situation seems to indicate that in this case correlation between compounds, which is not
addressed in Approach 2, was not a major issue steering the tail of the cumulative distribution.
Obviously, this conclusion cannot be generalised without further research, and it remains desirable to
develop models allowing for correlation between compounds.
The bigger uncertainty issue related to modeling of (cumulative) exposure is however not so much
related to the models used, but to the status of the data sets. It is recommended to develop procedures
where the reasons for not analyzing pesticides in a RAC sample are clearly stated, and subsequently
used to develop assumptions about the true concentrations for these non-analyzed concentrations. For
example, if compounds A and B have, but compounds C, D and E have not, been analyzed in some
samples because the latter could be assumed to be absent, then a zero concentration can be used. If the
reason was to reduce analytical costs, then concentrations of C, D and E may be assumed to be similar
to the rest of the sample population, conditional on the levels of A and B. Statistical techniques exist to
incorporate such assumptions in the model (e.g. multiple imputation, see e.g.(Rubin 1996)).
Models to estimate long-term exposure: BBN vs ISUF
In this project two different models available in MCRA to model long-term exposure were compared,
namely the Beta Binomial Normal (BBN) model based on Slob (2006), and the ISUF model ((Dodd
1996; Nusser et al. 1996; Nusser et al. 1997)}. See Section 2.5 for a description. The most important
difference between the two models is their possibilities to transform the short-term intake distribution
to normality. BBN uses for this a logaritmic or power transformation, while ISUF uses more extensive
data transformation to achieve normality.
The advantages of the BBN model are that it is a simpler model (uses less calculation time), but most
importantly that it can model the effects of a cofactor (e.g. gender) and / or covariable (e.g. age), in the
assessment. For example, when estimated exposure levels are expected to be a function of age, BBN
may be the preferred method of calculation. All exposure assessments performed in this report were
calculated using both models. However only those calculated with the ISUF approach were reported.
The reasoning for this is explained below. In Figure 4 we plotted the long-term cumulative estimated
exposure to triazoles for different countries using both models and linking national food consumption
data either to all monitoring results (Figure 4A) or to all monitoring results except for the combination
of apple – bitertanol. For this combination we replaced the monitoring results by field trial data
(Figure 4B). The figures show clearly that the choice of model had little effect on the estimated
exposure when solely monitoring data were used in the assessment (Figure 4A).

Cumulative Exposure Assessment of Triazole Pesticides
61 The present document has been produced and adopted by the bodies identified above as author(s). This task has been carried out exclusively by the author(s) in the context of a contract between the European Food Safety Authority and the author(s), awarded following a tender procedure. The present document is published complying with the transparency principle to which the European Food Safety Authority is subject. It may not be considered as an output adopted by EFSA. EFSA reserves its rights, view and position as regards the issues addressed and the conclusions reached in the present document, without prejudice to the rights of the authors.
However, replacing one crop – pesticide combination with field trial data resulted in a much larger
increase in estimated exposure using the BBN model compared to the ISUF model (Figure 4B). An
explanation for this is the difference in transformation of the short-term intake distribution to
normality between the two models. Field trial data (or MRL) are often much higher than the
monitoring results and this results in a so called bimodal distribution (see Figure 5). The BBN model
is then not applicable because it is based on the assumption of a normal distribution of exposure levels.
Whereas the ISUF model applies an additional spline transformation to create an artificial normal
distribution, it is currently not known very well if this model will always estimate the usual exposure
distribution correctly in strongly bimodal cases. More modeling research is recommended on how to
model bimodal distributions. Initial simulation studies preformed so far indicate that the calculated
exposure levels calculated with ISUF or BBN are overestimating the real risks in the case of
bimodality. If these first indications are confirmed the ISUF and BBN can still be considered as the
best option for long-term exposure assessment modeling. In absence of a firm conclusion in this
direction at the moment we also applied a more conservative approach which is based on estimating
the long-term intake by multiplying the average consumption level of food reported during the food
consumption survey with the average residue concentration for that food item for each individual
(individual observed means method). This is a conservative approach for the upper percentiles in the
distributions. The difference between modeling results obtained with the three models BBN, ISUF and
IOM are visualized in Figure 6.
A B
Figure 4. Comparison between the BBN and the ISUF model for calculating the chronic exposure. Percentiles
of estimated chronic cumulative exposure (in µg equivalents of cyproconazole/kg bw/d) to triazoles in different
countries using all monitoring data (A) or in which field trial data for a particular RAC-pesticide combination
were used in combination with monitoring data for all other RAC-pesticide combinations (B).
IT-
BBNIT-
ISUFNL-
BBNNL-
ISUFSE-
BBNSE-
ISUFUK-
BBNUK-
ISUF
90
990.00
0.20
0.40
0.60
0.80
1.00
Exp
osu
re (
ug
/kg
bw
/d)
Country and model
Percentiles
IT-
BBNIT-
ISUFNL-
BBNNL-
ISUFSE-
BBNSE-
ISUFUK-
BBNUK-
ISUF
90
990
10
20
30
Exp
osu
re (
ug
/kg
bw
/d)
Country and model
Percentiles

Cumulative Exposure Assessment of Triazole Pesticides
62 The present document has been produced and adopted by the bodies identified above as author(s). This task has been carried out exclusively by the author(s) in the context of a contract between the European Food Safety Authority and the author(s), awarded following a tender procedure. The present document is published complying with the transparency principle to which the European Food Safety Authority is subject. It may not be considered as an output adopted by EFSA. EFSA reserves its rights, view and position as regards the issues addressed and the conclusions reached in the present document, without prejudice to the rights of the authors.
BBNISUF
OIM
95
97.5
99
99.9
99.99
0.00
0.10
0.20
0.30
0.40
0.50
0.60
0.70
0.80
0.90
exp
osu
re (
ug
/kg
bw
/d)
statistical method
BBNISUF
OIM
95
97.5
99
99.9
99.99
0
0.05
0.1
0.15
0.2
0.25
0.3
0.35
0.4
Exposure (ug/kg
bw/d)
Statistical method
Figure 5. Example of a bimodal distribution. The right distribution is mainly associated with
consumers of a particular RAC for which field trial or MRL data were used as input for the
calculations in combination with monitoring data of all other RAC-pesticide combinations. The left
distribution is mainly associated with the consumers not consuming the particular RAC. These
consumers are consequently only exposed to monitoring results for all other RAC-pesticide
combinations. These monitoring results are usually much lower compared to the field trial data.
Figure 6. Comparison of chronic exposure levels at different percentiles calculated with three different models,
BBN, ISUF and OIM. IOM (individual observed means) is a model without statistical transformation for usual
intake. Data from The Netherland and France are used.
NL FR
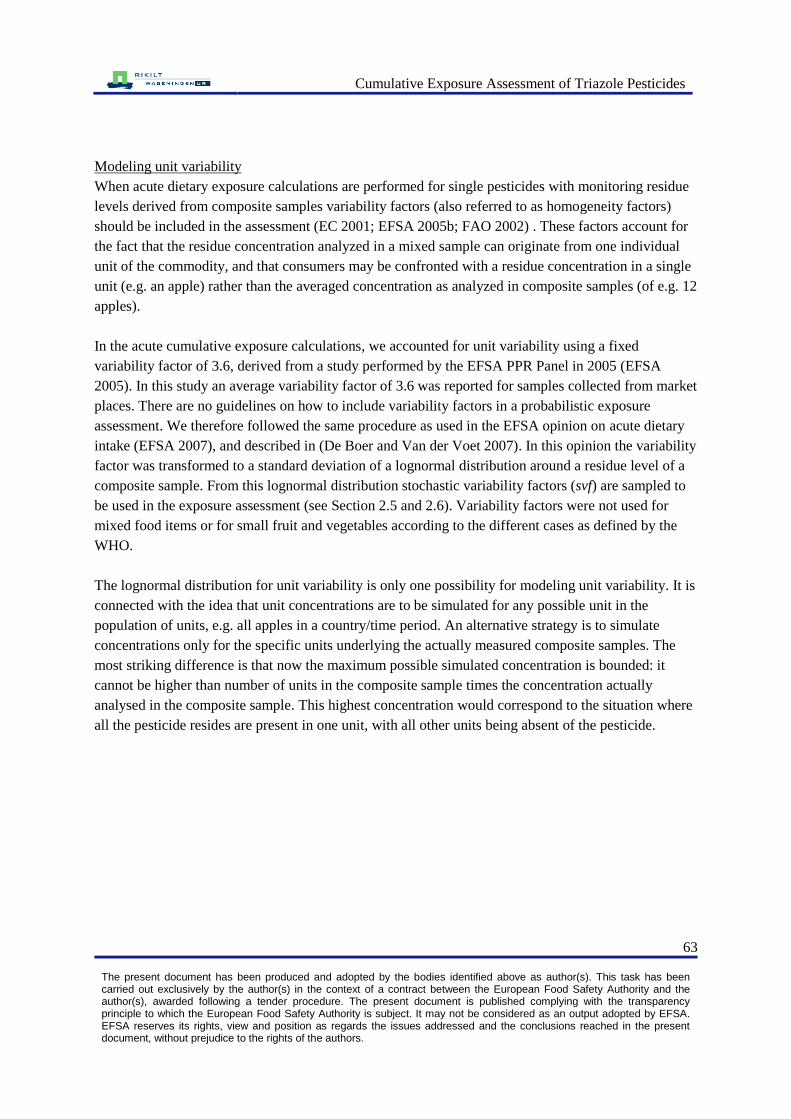
Cumulative Exposure Assessment of Triazole Pesticides
63 The present document has been produced and adopted by the bodies identified above as author(s). This task has been carried out exclusively by the author(s) in the context of a contract between the European Food Safety Authority and the author(s), awarded following a tender procedure. The present document is published complying with the transparency principle to which the European Food Safety Authority is subject. It may not be considered as an output adopted by EFSA. EFSA reserves its rights, view and position as regards the issues addressed and the conclusions reached in the present document, without prejudice to the rights of the authors.
Modeling unit variability
When acute dietary exposure calculations are performed for single pesticides with monitoring residue
levels derived from composite samples variability factors (also referred to as homogeneity factors)
should be included in the assessment (EC 2001; EFSA 2005b; FAO 2002) . These factors account for
the fact that the residue concentration analyzed in a mixed sample can originate from one individual
unit of the commodity, and that consumers may be confronted with a residue concentration in a single
unit (e.g. an apple) rather than the averaged concentration as analyzed in composite samples (of e.g. 12
apples).
In the acute cumulative exposure calculations, we accounted for unit variability using a fixed
variability factor of 3.6, derived from a study performed by the EFSA PPR Panel in 2005 (EFSA
2005). In this study an average variability factor of 3.6 was reported for samples collected from market
places. There are no guidelines on how to include variability factors in a probabilistic exposure
assessment. We therefore followed the same procedure as used in the EFSA opinion on acute dietary
intake (EFSA 2007), and described in (De Boer and Van der Voet 2007). In this opinion the variability
factor was transformed to a standard deviation of a lognormal distribution around a residue level of a
composite sample. From this lognormal distribution stochastic variability factors (svf) are sampled to
be used in the exposure assessment (see Section 2.5 and 2.6). Variability factors were not used for
mixed food items or for small fruit and vegetables according to the different cases as defined by the
WHO.
The lognormal distribution for unit variability is only one possibility for modeling unit variability. It is
connected with the idea that unit concentrations are to be simulated for any possible unit in the
population of units, e.g. all apples in a country/time period. An alternative strategy is to simulate
concentrations only for the specific units underlying the actually measured composite samples. The
most striking difference is that now the maximum possible simulated concentration is bounded: it
cannot be higher than number of units in the composite sample times the concentration actually
analysed in the composite sample. This highest concentration would correspond to the situation where
all the pesticide resides are present in one unit, with all other units being absent of the pesticide.

Cumulative Exposure Assessment of Triazole Pesticides
64 The present document has been produced and adopted by the bodies identified above as author(s). This task has been carried out exclusively by the author(s) in the context of a contract between the European Food Safety Authority and the author(s), awarded following a tender procedure. The present document is published complying with the transparency principle to which the European Food Safety Authority is subject. It may not be considered as an output adopted by EFSA. EFSA reserves its rights, view and position as regards the issues addressed and the conclusions reached in the present document, without prejudice to the rights of the authors.
No varLogn
Beta
90
95
99
99.9
0.00
25.00
50.00
75.00
100.00
125.00
150.00
175.00
Exp
osu
re (
ug
/kg
bw
/d)
Modelling unit variability
Percentiles
No varLogn
Beta
90
95
99
99.9
0.00
1.00
2.00
3.00
4.00
5.00
Exp
osu
re (
ug
/kg
bw
/d)
Modelling unit variability
Percentiles
A B
A statistical model that corresponds to this bounded situation can be based on a beta distribution. In
MCRA both models for unit variability are implemented (see De Boer and van der Voet 2007 for full
descriptions). The beta distribution model was used in cumulative exposure assessments of
organophosphorus insecticides and carbamates (Van Klaveren et al. 2006; Boon et al. 2008).
To show the effect of choosing a different approach to model variability we performed one analysis in
which we used no variability and two in which variability was modeled as a lognormal or beta
distribution. See for the results Figure 7 in which we used Dutch food consumption data of the total
population and linked that to all monitoring data (Figure 7A) or using MRL data for bitertanol in
tomato in combination with other monitoring data (Figure 7B). We used in all three analyses BMD-
derived RPFs.
In the analyses with only monitoring data the P99.9 of the estimated exposure was only very slightly
increased by including variability in the assessment compared to no variability (Figure 7A). Including
variability either as a beta or lognormal distribution did not result in significantly different levels of
estimated exposure. However, in the scenario where one RAC-pesticide combination (in this case
tomato – bitertanol) was replaced by the MRL, including variability as a lognormal distribution
resulted in a high increase (97%) in estimated exposure compared to no variability. Including
variability as a beta distribution resulted in a smaller (10%) increase in estimated exposure. This can
be partially explained as follows. There are 12 individual tomatoes in a composite sample. Therefore
one tomato corresponds to about 8% of a composite sample. If for simplicity we assume that the
extreme upper tail of the estimated exposure distribution is related to single highly contaminated units,
Figure 7. Percentiles of acute cumulative exposure (in µg equivalents of flusilazole/kg bw/d) to triazoles in the
total Dutch population using either all national monitoring results (A) or in which monitoring residue data used
in combination with the MRL for bitertanol on tomato (B). Unit variability was applied following three
scenarios: no unit variability (No var), lognormal distribution (Logn) and beta distribution (Beta).

Cumulative Exposure Assessment of Triazole Pesticides
65 The present document has been produced and adopted by the bodies identified above as author(s). This task has been carried out exclusively by the author(s) in the context of a contract between the European Food Safety Authority and the author(s), awarded following a tender procedure. The present document is published complying with the transparency principle to which the European Food Safety Authority is subject. It may not be considered as an output adopted by EFSA. EFSA reserves its rights, view and position as regards the issues addressed and the conclusions reached in the present document, without prejudice to the rights of the authors.
then any beta-distribution based estimate of percentiles higher than P92 cannot be based on the
empirical data, but corresponds to extrapolation. In contrast, the lognormal-distribution model is not
dependent on the number 12, it just assumes a smooth distribution, and for extreme percentiles like
P99.9 it will also use values sampled in the right tail extending above 12 times the composite sample
value.
Residue levels analyzed in monitoring programmes are mostly very low compared to MRL. Applying
a low variability factor of 3.6 will therefore not have a large visible impact on the estimated exposure.
Especially when you realize that variability in a stochastic model also means that lower levels than the
averaged composite sample can be simulated. However, when including an MRL in the residue
database with a relatively high level compared to the analyzed levels, a variability factor can result in
the simulation of individual residue levels that are even higher than the MRL. This will result in
extreme estimated exposure levels in the right tail of the distribution. This is especially true when
using the lognormal distribution in which the upper limit of the residue level to be modeled is not
bounded as in the beta distribution.
Which model to use depends on the wishes of the risk assessor and whether simulated residue levels in
individual units should be representative of the total population of units, or just the units underlying
the actually measured composite samples. In the simulations reported here we used the lognormal
distribution, which resulted in comparable or higher levels of estimated exposure compared to the beta
approach.
4.4.2 Assigning residue levels to samples with residue levels below LOR
When performing exposure assessments to pesticides, samples with residue levels below the limit of
reporting (LOR) are commonly assumed to contain no residue. Because only a certain part of the
commodities will be treated with the pesticide, a large part of these so-called non-detects will not
contain the pesticide. In the US the Environmental Protection Agency (EPA) has developed a
methodology to assign a level to these samples based on the percentage of the crop that has been
treated with the pesticide (EPA 2000). Information on this statistic is however not available within
Europe. Also in this study we assigned a zero level to non-detect samples analyzed in monitoring
programmes. Non-detect samples from field trial data however were assigned LOR, because in these
trials 100% of the crop is treated.
To demonstrate the effect on the estimated exposure of assigning levels to non-detect samples,
including different scenarios for percentage crop treated, we performed acute exposure calculations
using BMD-derived RPFs in which we replaced non-detect wheat samples for epoxiconazole with ½
LOR (= ½ x 0.05 mg/kg). This was done for three scenarios of percentage crop treated, namely 10%,
50% and 100% (which represents the worst case situation). In these calculations all other non-detect
RAC –pesticide combinations were assumed to contain no residue. For reasons of comparison we also
included the scenario in which all non-detects were assigned zero (including combination wheat –

Cumulative Exposure Assessment of Triazole Pesticides
66 The present document has been produced and adopted by the bodies identified above as author(s). This task has been carried out exclusively by the author(s) in the context of a contract between the European Food Safety Authority and the author(s), awarded following a tender procedure. The present document is published complying with the transparency principle to which the European Food Safety Authority is subject. It may not be considered as an output adopted by EFSA. EFSA reserves its rights, view and position as regards the issues addressed and the conclusions reached in the present document, without prejudice to the rights of the authors.
epoxiconazole). See Figure 8 for the results. Assigning ½ LOR to non-detect wheat samples analyzed
for epoxiconazole resulted in a slight increase in estimated exposure over all percentiles of estimated
exposure with increasing level of percentage crop treated. The relative increase was highest at the
lower percentiles of estimated exposure (≤ P95).
As demonstrated by Boon et al (2003), the effect of replacing non-detects with LOR on the estimated
exposure percentiles depends on the percentage of non-detects in the whole database, and the LOR
level relative to the levels present in the monitoring database. It was found that generally intermediate
percentiles (e.g. P95) were influenced most, whereas high percentiles (like P99.9) were not or less
affected (Boon et al. 2003). Also percentage of crop treated will affect the results. The results plotted
in Figure 8 comply with these results. Very likely the replacement of a part of the non-detects with
low levels of one pesticide (epoxiconazole) does not influence the upper part of the estimated
exposure distribution, because this part is dominated by samples with high cumulative levels. The
influence of levels assigned to non-detects was however not tested for other RACs and might be more
significant for RAC –pesticide combinations with a possible higher contribution to the estimated
exposure levels.
4.4.3 Uncertainty in residue and / or consumption data: bootstrap method
Sometimes the number of samples is limited. This might cause uncertainty in the data. As long as all
samples have the same or similar concentrations of the pesticide residue, it does not make any
difference if the Monte Carlo simulations are performed with large or small databases. However if
there is significant variation in residue levels, the sample size and the probability that high levels are
sampled may affect the intake distributions. For example, high residue levels can occur in 10% (case
A) of all samples or sometimes in only 1% of all samples (case B). If twenty samples are taken there is
a reasonable probability that the high residue level sample is included in case A, but a low probability
that it is also included in case B. The variation within samples and the sample size together have an
effect on the results of exposure distributions.
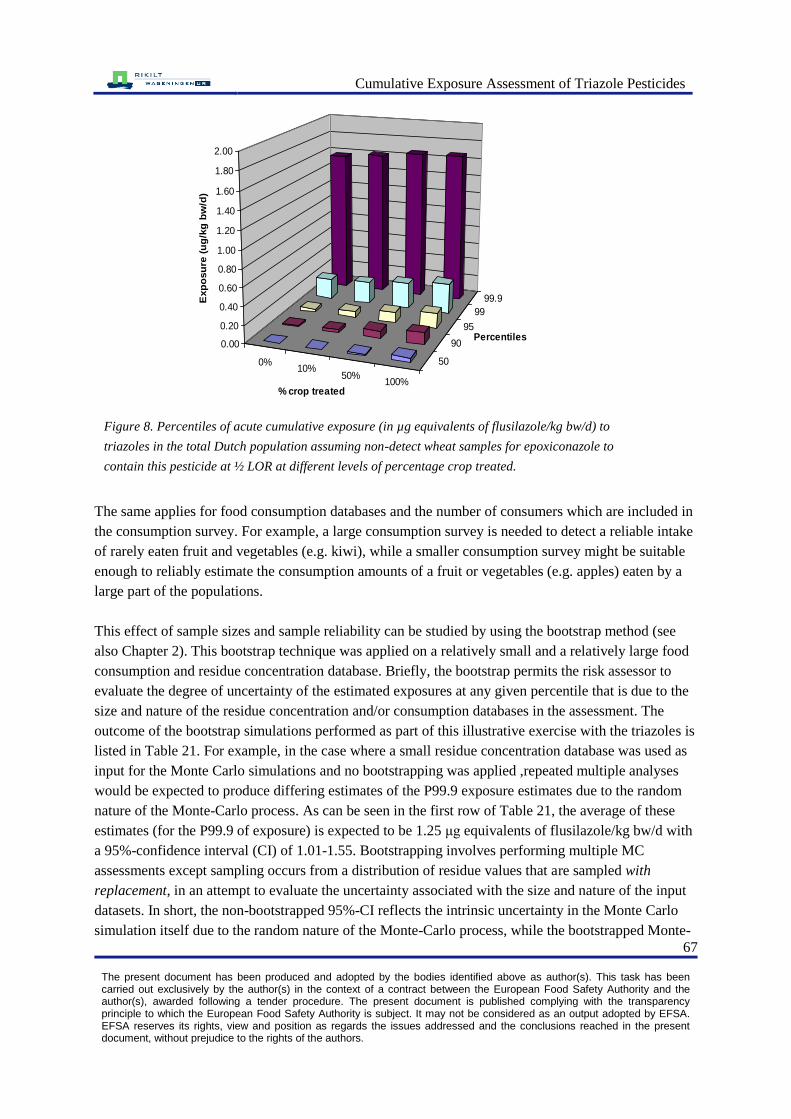
Cumulative Exposure Assessment of Triazole Pesticides
67 The present document has been produced and adopted by the bodies identified above as author(s). This task has been carried out exclusively by the author(s) in the context of a contract between the European Food Safety Authority and the author(s), awarded following a tender procedure. The present document is published complying with the transparency principle to which the European Food Safety Authority is subject. It may not be considered as an output adopted by EFSA. EFSA reserves its rights, view and position as regards the issues addressed and the conclusions reached in the present document, without prejudice to the rights of the authors.
The same applies for food consumption databases and the number of consumers which are included in
the consumption survey. For example, a large consumption survey is needed to detect a reliable intake
of rarely eaten fruit and vegetables (e.g. kiwi), while a smaller consumption survey might be suitable
enough to reliably estimate the consumption amounts of a fruit or vegetables (e.g. apples) eaten by a
large part of the populations.
This effect of sample sizes and sample reliability can be studied by using the bootstrap method (see
also Chapter 2). This bootstrap technique was applied on a relatively small and a relatively large food
consumption and residue concentration database. Briefly, the bootstrap permits the risk assessor to
evaluate the degree of uncertainty of the estimated exposures at any given percentile that is due to the
size and nature of the residue concentration and/or consumption databases in the assessment. The
outcome of the bootstrap simulations performed as part of this illustrative exercise with the triazoles is
listed in Table 21. For example, in the case where a small residue concentration database was used as
input for the Monte Carlo simulations and no bootstrapping was applied ,repeated multiple analyses
would be expected to produce differing estimates of the P99.9 exposure estimates due to the random
nature of the Monte-Carlo process. As can be seen in the first row of Table 21, the average of these
estimates (for the P99.9 of exposure) is expected to be 1.25 μg equivalents of flusilazole/kg bw/d with
a 95%-confidence interval (CI) of 1.01-1.55. Bootstrapping involves performing multiple MC
assessments except sampling occurs from a distribution of residue values that are sampled with
replacement, in an attempt to evaluate the uncertainty associated with the size and nature of the input
datasets. In short, the non-bootstrapped 95%-CI reflects the intrinsic uncertainty in the Monte Carlo
simulation itself due to the random nature of the Monte-Carlo process, while the bootstrapped Monte-
0%10%
50%100%
50
90
95
99
99.9
0.00
0.20
0.40
0.60
0.80
1.00
1.20
1.40
1.60
1.80
2.00
Exp
osu
re (
ug
/kg
bw
/d)
% crop treated
Percentiles
Figure 8. Percentiles of acute cumulative exposure (in µg equivalents of flusilazole/kg bw/d) to
triazoles in the total Dutch population assuming non-detect wheat samples for epoxiconazole to
contain this pesticide at ½ LOR at different levels of percentage crop treated.

Cumulative Exposure Assessment of Triazole Pesticides
68 The present document has been produced and adopted by the bodies identified above as author(s). This task has been carried out exclusively by the author(s) in the context of a contract between the European Food Safety Authority and the author(s), awarded following a tender procedure. The present document is published complying with the transparency principle to which the European Food Safety Authority is subject. It may not be considered as an output adopted by EFSA. EFSA reserves its rights, view and position as regards the issues addressed and the conclusions reached in the present document, without prejudice to the rights of the authors.
Carlo simulation 95%-CIs around the P99.9 reflects both the uncertainty in the Monte Carlo
simulations and the uncertainty in the residue concentration dataset. Here (as seen in the second line of
Table 21), the 95% CI from the bootstrap sample is 0.11 μg/kg bw/d (lower bound) to 3.20 μg/kg bw/d
(95% upper bound). If the estimated exposure uncertainties (i.e., the confidence intervals) between the
non-bootstrapped and bootstrapped samples are similar, this would suggest that the data anomalies,
outliers, or other peculiarities in the residue concentration data set are minimal and/or do not
significantly impact the exposure outputs. To the extent that the confidence intervals around the P99.9
estimated exposure between the non-bootstrapped and bootstrapped samples diverge, this suggests the
opposite: specifically, that outliers or other data anomalies may have a large impact on the exposure
estimates, that there may be large uncertainties in the resulting estimated exposures, and that care
should be taken in interpreting the estimated exposure results. Ideally in such a case, the input residue
concentration data should be carefully examined and the collection of additional data might be
considered if the differences were substantively meaningful (i.e, consequential) in a risk management
context. In this specific (triazole) case with the small residue concentration dataset, there is a fair
amount of divergence between the non-bootstrapped MC results (estimated exposure at the P99.9 of
1.25 μg/kg bw/d with a 95% CI between 1.01 and 1.55 μg/kg bw/d) and the bootstrapped version
(95% CI of between 0.11- to 3.20- μg/kg bw/d). If such a difference is consequential to the risk
manager (for example, the lower bound of the confidence interval and the upper bound of the
confidence interval around the P99.9 of interest reflect small and large fractions of the Reference Dose
or Allowable Daily Intake), then this might suggest -- as described above – that the results are
uncertain due to the nature and size of the residue concentration database and should be interpreted
with caution. Similar bootstraps were performed with a large residue concentration database and with
a small and large consumption databases. All simulations resulted in an increase in the 95% CI, but
these increases were not as significantly as those observed using the relative small residue
concentration database (Table 21).
In summary, the uncertainty analyses performed here suggest that high-end exposure estimates are
much less sensitive to small vs. large consumption databases than they are to large vs. small residue
data sets, and that the risk manager should determine the extent to which the differences between the
non-bootstrapped and bootstrapped results for the small residue concentration data set are substantially
important in a risk management context.
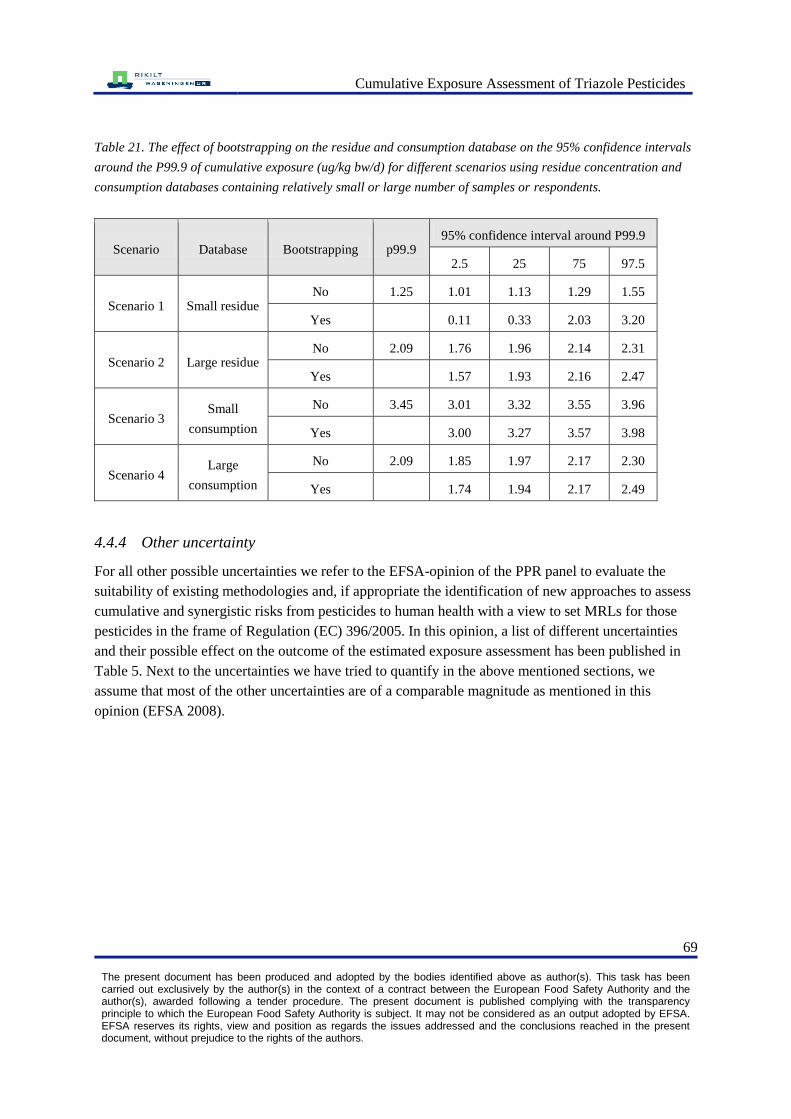
Cumulative Exposure Assessment of Triazole Pesticides
69 The present document has been produced and adopted by the bodies identified above as author(s). This task has been carried out exclusively by the author(s) in the context of a contract between the European Food Safety Authority and the author(s), awarded following a tender procedure. The present document is published complying with the transparency principle to which the European Food Safety Authority is subject. It may not be considered as an output adopted by EFSA. EFSA reserves its rights, view and position as regards the issues addressed and the conclusions reached in the present document, without prejudice to the rights of the authors.
Table 21. The effect of bootstrapping on the residue and consumption database on the 95% confidence intervals
around the P99.9 of cumulative exposure (ug/kg bw/d) for different scenarios using residue concentration and
consumption databases containing relatively small or large number of samples or respondents.
Scenario Database Bootstrapping p99.9 95% confidence interval around P99.9
2.5 25 75 97.5
Scenario 1 Small residue No 1.25 1.01 1.13 1.29 1.55
Yes 0.11 0.33 2.03 3.20
Scenario 2 Large residue No 2.09 1.76 1.96 2.14 2.31
Yes 1.57 1.93 2.16 2.47
Scenario 3 Small
consumption
No 3.45 3.01 3.32 3.55 3.96
Yes 3.00 3.27 3.57 3.98
Scenario 4 Large
consumption
No 2.09 1.85 1.97 2.17 2.30
Yes 1.74 1.94 2.17 2.49
4.4.4 Other uncertainty
For all other possible uncertainties we refer to the EFSA-opinion of the PPR panel to evaluate the
suitability of existing methodologies and, if appropriate the identification of new approaches to assess
cumulative and synergistic risks from pesticides to human health with a view to set MRLs for those
pesticides in the frame of Regulation (EC) 396/2005. In this opinion, a list of different uncertainties
and their possible effect on the outcome of the estimated exposure assessment has been published in
Table 5. Next to the uncertainties we have tried to quantify in the above mentioned sections, we
assume that most of the other uncertainties are of a comparable magnitude as mentioned in this
opinion (EFSA 2008).

Cumulative Exposure Assessment of Triazole Pesticides
70 The present document has been produced and adopted by the bodies identified above as author(s). This task has been carried out exclusively by the author(s) in the context of a contract between the European Food Safety Authority and the author(s), awarded following a tender procedure. The present document is published complying with the transparency principle to which the European Food Safety Authority is subject. It may not be considered as an output adopted by EFSA. EFSA reserves its rights, view and position as regards the issues addressed and the conclusions reached in the present document, without prejudice to the rights of the authors.
5 Conclusions and recommendations
In the EFSA opinion on identification of new approaches to assess cumulative and synergistic risks
from pesticides to human health a tiered approach for cumulative risk assessment is suggested by the
PPR-panel. The first tier is a deterministic approach. Higher tiers exist of a probabilistic assessment in
combination with relative potency factors (RPFs), to account for differences in toxicity of different
compounds with a possible same mechanism of action, like the triazoles in this report.
The aim of this study was to demonstrate the feasibility and applicability of higher tier assessment of
cumulative exposure calculations. The fourth tier using probabilistic modeling in combination with the
RPF approach was tested both for short-term and long-term estimated exposure to triazoles, using both
BMD- and NOAEL-derived RPFs. For the calculations food consumption and residue concentration
databases were used from several European countries, including Czech Republic, France, Italy, the
Netherlands, Sweden, UK and Finland (only residue concentration data).
The following conclusions were drawn:
1. Short-term and long-term cumulative dietary exposure to triazoles can be calculated with
probabilistic models in combination with the RPF approach.
2. The method was applicable for calculating both the actual exposure using monitoring data as the
possible exposure in the process of MRL setting.
3. Monte Carlo simulations can be used to calculate short-term cumulative exposure.
4. For long-term exposure assessments different models can be used. Not all models apply in all
cases and a significant model uncertainty was observed in a few calculation scenarios.
5. When for a particular RAC-pesticide combination MRL, STMR or field trial data were used and
monitoring data for other RAC-pesticide combinations a bimodal exposure distribution can be
expected. In such cases the lower part of the exposure distribution (first mode) relates to the daily
consumptions consisting of only food items for which monitoring results are used, and the other
part (second mode) to daily consumptions of the particular RAC for which MRL, STMR or field
trial data are used.
6. More research is needed on how to model bimodal distributions. However, first indications of
simulation studies suggest that ISUF and BBN may overestimate the exposure level at the higher
percentiles in the case of bimodality. If so, risk assessors may consider to calculate the distribution
of individual mean exposure levels based on the observed individual mean consumption reported
during the food consumption survey and average residue levels. This is regarded as a conservative
starting point for modeling long-term exposure levels.
7. A statistical model assuming that the non-analyzed triazoles in samples are zero values (non-
detects) might result in an underestimation of exposure. The alternative statistical model, which
was pragmatically programmed, models each triazole separately and then combines the results.
Cumulative Exposure Assessment of Triazole Pesticides
71 The present document has been produced and adopted by the bodies identified above as author(s). This task has been carried out exclusively by the author(s) in the context of a contract between the European Food Safety Authority and the author(s), awarded following a tender procedure. The present document is published complying with the transparency principle to which the European Food Safety Authority is subject. It may not be considered as an output adopted by EFSA. EFSA reserves its rights, view and position as regards the issues addressed and the conclusions reached in the present document, without prejudice to the rights of the authors.
This alternative approach is assumed to be a more realistic, but also conservative, approach for
unbalanced data sets.
8. Results of probabilistic modeling using RPFs derived from Benchmark Dose modeling are
sometimes higher compared to results based on calculations using RPFs derived from NOAELs.
Benchmark Dose modeling is proposed as a higher tier assessment and higher tier assessment
should result in lower exposure levels because higher tier assessment includes less conservatism.
9. Uncertainty and sensitivity analyses demonstrated that different assumptions made and different
models can result in higher or lower exposure levels.
10. We were able to perform all cumulative exposure calculations using food consumption data from
several countries.
In conclusion the probabilistic model can be applied within the European context.
In this report we have touched upon different issues to improve the estimation of the cumulative
dietary exposure to compounds belonging to a common mechanism group. The general conclusion is
there are models available that are applicable for cumulative dietary exposure assessment, and that
they can be used in the European context. Nevertheless it will take much effort to make those models
accessible for all stakeholders in the process of pesticide risk assessment. Also effort is needed to
make models and data compatible for cumulative exposure assessment. Bases on our experience we
come to the following project specific recommendations:
It is recommended to develop sampling procedures at an European level resulting in residue
concentration data of all triazoles relevant for the assessment in equal numbers. If this is not
possible, reasons for not analysing a pesticide in a RAC sample should be clearly stated (e.g. never
used in practice, analytical or financial limitations). Different reasons will demand different
solutions.
Statistical models should be optimized to handle unbalanced data sets, and to address possible
correlations in pesticide uses.
Statistical models should pay more attention to RAC-pesticide specific processing and variability
factors, and how to combine this information in cumulative pesticide exposure assessment.
Experiments might even be needed to elucidate variability factors for different crops and
pesticides in cumulative exposure assessment.
Examination of the toxicological differences between the NOAEL and BMD-derived RPFs as
reported here is necessary, as well as a discussion on which of the approaches results in the most
realistic level of cumulative exposure relative to the toxic effect on which the BMD and NOAEL
are based.
A further integration of exposure and effect (BMD) modeling is recommended to clarify the
uncertainty in different parameters of the risk assessment, including uncertainty analyses in RPFs
derived from either NOAEL or BMD modeling. Uncertainty models should also include
measurement uncertainty and uncertainty regarding LODs, LOQs and percentage crop treated.
To optimize the European dimension of cumulative modeling of exposure to pesticides, it is
recommended that countries develop their own food conversion models so that food coding of

Cumulative Exposure Assessment of Triazole Pesticides
72 The present document has been produced and adopted by the bodies identified above as author(s). This task has been carried out exclusively by the author(s) in the context of a contract between the European Food Safety Authority and the author(s), awarded following a tender procedure. The present document is published complying with the transparency principle to which the European Food Safety Authority is subject. It may not be considered as an output adopted by EFSA. EFSA reserves its rights, view and position as regards the issues addressed and the conclusions reached in the present document, without prejudice to the rights of the authors.
these databases can be harmonized at RAC level. Furthermore, these models are necessary to
estimate the exposure to compounds analyzed mainly at RAC level. Apart from harmonization at
RAC level, also the methodology used to assess food consumption habits should be harmonized.
A few general recommendations:
More clarity and practice are needed about how to apply a tiered approach within cumulative
exposure modeling as advocated by the EFSA PPR panel (EFSA 2008).
Guidelines should be generated to harmonize pesticide monitoring practices in different countries
within Europe so that each country analyses the same RACs in the same degree and uses similar
analytical methods with comparable LORs.
As stated in the opinion of the PPR panel, ideally risk assessments of chemicals, whether
individually or in combination, should consider all pathways (e.g., food, drinking water,
residential, occupational) and routes (ingestion, dermal, inhalation) of exposure that could
contribute to a person‘s total estimated exposure. Models and data to assess this type of exposure
should be generated for those compounds for which other pathways than food and drinking water
sources and other routes than ingestion are important for the overall estimated exposure.
The models described in this report are applicable, but do not warrant that they can be used by all
stakeholders and member states. Much effort should be spent in making the models and data
accessible to the international community.

Cumulative Exposure Assessment of Triazole Pesticides
73 The present document has been produced and adopted by the bodies identified above as author(s). This task has been carried out exclusively by the author(s) in the context of a contract between the European Food Safety Authority and the author(s), awarded following a tender procedure. The present document is published complying with the transparency principle to which the European Food Safety Authority is subject. It may not be considered as an output adopted by EFSA. EFSA reserves its rights, view and position as regards the issues addressed and the conclusions reached in the present document, without prejudice to the rights of the authors.
6 References
Anonymous (1998). Zo eet Nederland 1998. Resultaten van de voedselconsumptiepeiling 1997-1998
(Results of the Dutch National Food Consumption Survey 1997-1998). Den Haag,
Voedingscentrum.
Becker, W. (1999). "Riksmaten 1997 - 1998. Svenskarna äter nyttigare - allt fler väljer grönt
(Riksmaten 1997 - 1998. The Swedes eat more healthy)." Voar Föda 51: 24-27.
Becker, W. and M. Pearson (2002). Riksmaten 1997-98. Dietary habits and nutrient intake in Sweden
1997-98. The second national food consumption survey. Uppsala, National Food Administration.
Black, A. E. (2000). "The sensitivity and specificity of the Goldberg cut-off for EI:BMR for
identifying diet reports of poor validity." European Journal of Clinical Nutrition 54: 395-404.
Boon, P. E., E. I. M. Tjoe Nij, et al. (2004). Dietary habits and exposure to pesticides in Dutch infants.
Wageningen, RIKILT - Institute of Food Safety, Wageningen UR.
Boon, P. E., H. Van der Voet, et al. (2003). Dietary exposure to pesticides - relevant variables and
probabilistic modeling. Wageningen, RIKILT - Institute of Food Safety, Wageningen UR.
Boon, P. E., H. Van der Voet, et al. (2008). "Cumulative risk assessment of the exposure to
organophosphorus and carbamate insecticides in the Dutch diet." Food and Chemical Toxicology
doi:10.1016/j.fct.2008.06.083.
Callahan, M. A. and K. Sexton (2007). "If cumulative risk assessment is the answer, what is the
question?" Environmental Health Perspectives 115(5): 799-806.
De Boer, W. J. and H. Van der Voet (2007). MCRA, Release 6. A web-based programme for Monte
Carlo Risk Assessment, Biometris and RIKILT-Institute of Food Safety, Wageningen UR,
Wageningen and National Institute for Public Health and the Environment (RIVM), Bilthoven.
De Boer, W.J., van der Voet, H., Bokkers, B.G.H, Bakker, M.I. and Boon, P.E. (in prep.). A
comparison of two models for estimating usual intake when consumption data include many
zeroes.
Dodd, K. W. (1996). A technical guide to C-SIDE. Ames, Iowa, Department of Statistics and Center
for Agricultural and Rural Development, Iowa State University.
Efron, B. (1979). "Bootstrap methods: another look at the jackknife." Annals of Statistics 7: 1-26.
Efron, B. and R. Tibshirani (1993). An introduction to the bootstrap. New York, Chapman & Hall.
EFSA (2005). "Opinion of the Scientific Committee on a request from EFSA related to Exposure
Assessments." The EFSA Journal 249: 1-26.
EFSA (2005). "Opinion of the Scientific Panel on Plant health, Plant protection products and their
Residues on a request from Commission related to the appropriate variability factor(s) to be used
for acute dietary exposure assessment of pesticide residues in fruit and vegetables." The EFSA
Journal 177: 1-61.
EFSA (2006). "Opinion of the Scientific Committee related to uncertainties in dietary exposure
assessment." The EFSA Journal 438: 1-54.
Cumulative Exposure Assessment of Triazole Pesticides
74 The present document has been produced and adopted by the bodies identified above as author(s). This task has been carried out exclusively by the author(s) in the context of a contract between the European Food Safety Authority and the author(s), awarded following a tender procedure. The present document is published complying with the transparency principle to which the European Food Safety Authority is subject. It may not be considered as an output adopted by EFSA. EFSA reserves its rights, view and position as regards the issues addressed and the conclusions reached in the present document, without prejudice to the rights of the authors.
EFSA (2007). Cumulative risk assessment of pesticides to human health: The way forward. EFSA
Scientific colloquium summary report 7. . Parma, European Food Safety Authority.
EFSA (2007). "Opinion of the Scientific Panel on Plant protection products and their Residues on a
request from the Commission on acute dietary intake assessment of pesticide residues in fruit and
vegetables." The EFSA Journal 538: 1-88.
EFSA (2008). "Opinion of the Scientific Panel on Plant Protection products and their Residues to
evaluate the suitability of existing methodologies and, if appropriate, the identification of new
approaches to assess cumulative and synergistic risks from pesticides to human health with a view
to set MRLs for those pesticides in the frame of Regulation (EC) 396/2005." The EFSA Journal
704: 1-84.
EPA (2000). Assigning values to non-detected/non-quantified pesticide residues in human health food
exposure assessments. Washington D.C., Office of Pesticide Programs, US Environmental
Protection Agency: 25.
EPA (2005). Estimation of cumulative risk from N-methyl carbamate pesticides: preliminary
assessment. Washington, D.C., Office of Pesticide Programs, US Environmental Protection
Agency: 201.
Filipsson, A. F., S. Sand, et al. (2003). "The benchmark dose method — review of available models,
and recommendations for application in health risk assessment." Critical Reviews in Toxicology
33: 505-542.
Gregory, J. R., S. Lowe, et al. (2000). National Diet and Nutrition Survey: young people aged 4 to 18
years. Volume 1: Report of the diet and nutrition survey. London, TSO.
Hercberg, S., M. Deheeger, et al. (1994). SU-VI-MAX. Portions alimentaires. Manuel photos pour
l'estimation des quantités. Paris, Editions Poly Technica.
Kistemaker, C., M. Bouman, et al. (1998). De consumptie van afzonderlijke producten door
Nederlandse bevolkingsgroepen - Voedselconsumptiepeiling 1997-1998 (Consumption of food
products by Dutch population groups - Dutch National Food Consumption Survey 1997-1998).
Zeist, TNO-Voeding: 12.
Moerbeek, M., A. H. Piersma, et al. (2004). "A comparison of three methods for calculating
confidence intervals for the benchmark dose." Risk Analysis 24(1): 31-40.
Nusser, S. M., A. L. Carriquiry, et al. (1996). "A semiparametric transformation approach to
estimating usual daily intake distributions." Journal of the American Statistical Association
91(436): 1440-1449.
Nusser, S. M., W. A. Fuller, et al. (1997). Estimating usual dietary intake distributions: adjusting for
measurement error and nonnormality in 24-hour food intake data. Survey Measurement and
Process Quality. L. Lyberg, P. Biemer, M. Collinset al. New York, Wiley: 689-709.
Rubin, D. B. (1996). "Multiple imputation after 18+ years." Journal of the American Statistical
Association 91: 473-489.
Ruprich, J., M. Dofkova, et al. (2006). Individual food consumption - the national study SISP04.
Prague, CHFCH NIPH.
Slob, W. (2006). "Probabilistic dietary exposure assessment taking into account variability in both
amount and frequency of consumption." Food and Chemical Toxicology 44: 933-951.

Cumulative Exposure Assessment of Triazole Pesticides
75 The present document has been produced and adopted by the bodies identified above as author(s). This task has been carried out exclusively by the author(s) in the context of a contract between the European Food Safety Authority and the author(s), awarded following a tender procedure. The present document is published complying with the transparency principle to which the European Food Safety Authority is subject. It may not be considered as an output adopted by EFSA. EFSA reserves its rights, view and position as regards the issues addressed and the conclusions reached in the present document, without prejudice to the rights of the authors.
Slob, W. and M. N. Pieters (1997). Few large, or many small dose groups? An evaluation of
toxicological study designs using computer simulations. Bilthoven, National Institute of Public
Health and the Environment (RIVM).
SSC (2000). First report on the harmonisation of risk assessment procedures - The Report of the
Scientific Steering Committee's Working Group on Harmonisation of Risk Assessment Procedures
in the Scientific Committees advising the European Commission in the area of human and
environmental health. Brussels, Scientific Steering Committee, EU.
SSC (2003). The future of risk assessment in the European Union. Second report on the harmonisation
of risk assessment procedures. Brussels, Scientific Steering Committee, EU.
Turrini, A., A. Saba, et al. (2001). "Food consumption patterns in Italy: the INN-CA Study 1994-
1996." European Journal of Clinical Nutrition 55: 571-588.
Van Dooren, M. M. H., I. Boeijen, et al. (1995). Conversie van consumeerbare voedingsmiddelen naar
primaire agrarische produkten (Conversion of consumed foods into raw agricultural commodities).
Wageningen, RIKILT-DLO: 22.
Van Klaveren, J. D., M. Noordam, et al. (2006). Trends in normoverschrijdingen, overschrijdingen
van de acute referentiewaarde en gesommeerde blootstelling (Trends in exceedances of the residue
limit and the acute reference dose, and cumulative exposure). Wageningen, RIKILT-Institute of
Food Safety.
Volatier, J.-L. (2000). Enquête INCA individuelle et nationale sur les consommations alimentaires.
Tech & Doc, Paris, Agence Française de Sécurité Sanitaire des Aliments (AFSSA).
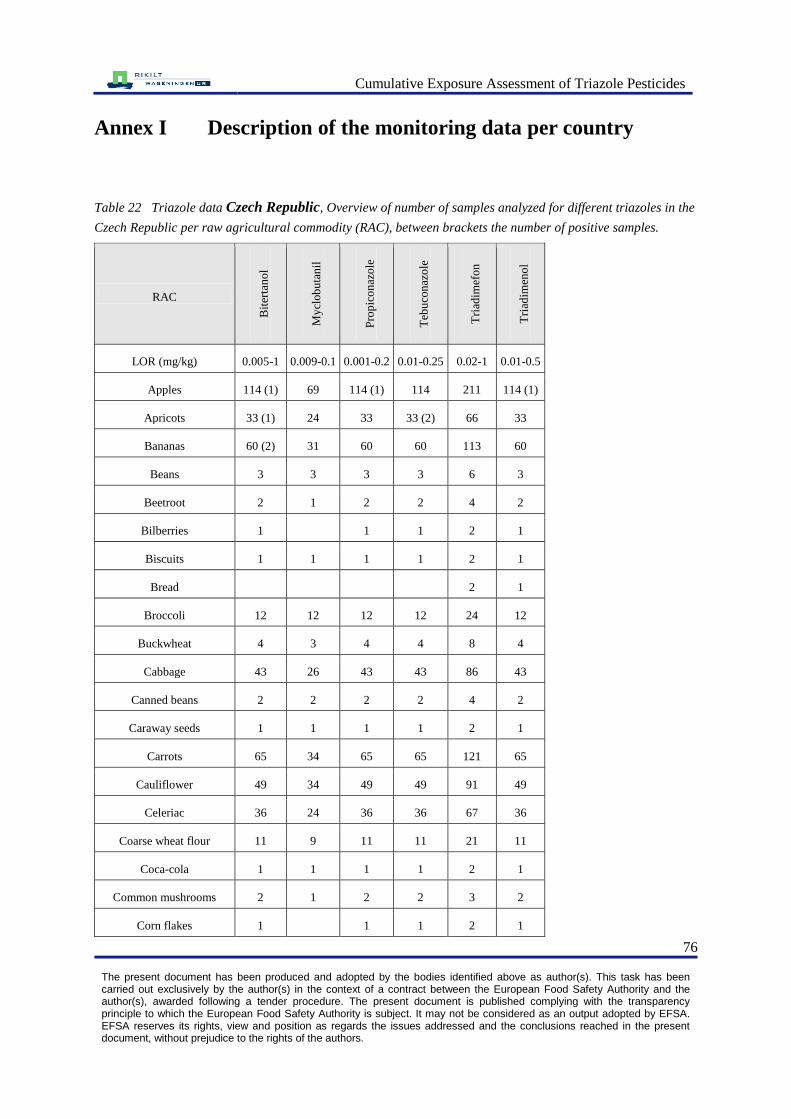
Cumulative Exposure Assessment of Triazole Pesticides
76 The present document has been produced and adopted by the bodies identified above as author(s). This task has been carried out exclusively by the author(s) in the context of a contract between the European Food Safety Authority and the author(s), awarded following a tender procedure. The present document is published complying with the transparency principle to which the European Food Safety Authority is subject. It may not be considered as an output adopted by EFSA. EFSA reserves its rights, view and position as regards the issues addressed and the conclusions reached in the present document, without prejudice to the rights of the authors.
Annex I Description of the monitoring data per country
Table 22 Triazole data Czech Republic, Overview of number of samples analyzed for different triazoles in the
Czech Republic per raw agricultural commodity (RAC), between brackets the number of positive samples.
RAC
Bit
erta
no
l
My
clob
uta
nil
Pro
pic
on
azo
le
Teb
uco
naz
ole
Tri
adim
efo
n
Tri
adim
eno
l
LOR (mg/kg) 0.005-1 0.009-0.1 0.001-0.2 0.01-0.25 0.02-1 0.01-0.5
Apples 114 (1) 69 114 (1) 114 211 114 (1)
Apricots 33 (1) 24 33 33 (2) 66 33
Bananas 60 (2) 31 60 60 113 60
Beans 3 3 3 3 6 3
Beetroot 2 1 2 2 4 2
Bilberries 1 1 1 2 1
Biscuits 1 1 1 1 2 1
Bread 2 1
Broccoli 12 12 12 12 24 12
Buckwheat 4 3 4 4 8 4
Cabbage 43 26 43 43 86 43
Canned beans 2 2 2 2 4 2
Caraway seeds 1 1 1 1 2 1
Carrots 65 34 65 65 121 65
Cauliflower 49 34 49 49 91 49
Celeriac 36 24 36 36 67 36
Coarse wheat flour 11 9 11 11 21 11
Coca-cola 1 1 1 1 2 1
Common mushrooms 2 1 2 2 3 2
Corn flakes 1 1 1 2 1
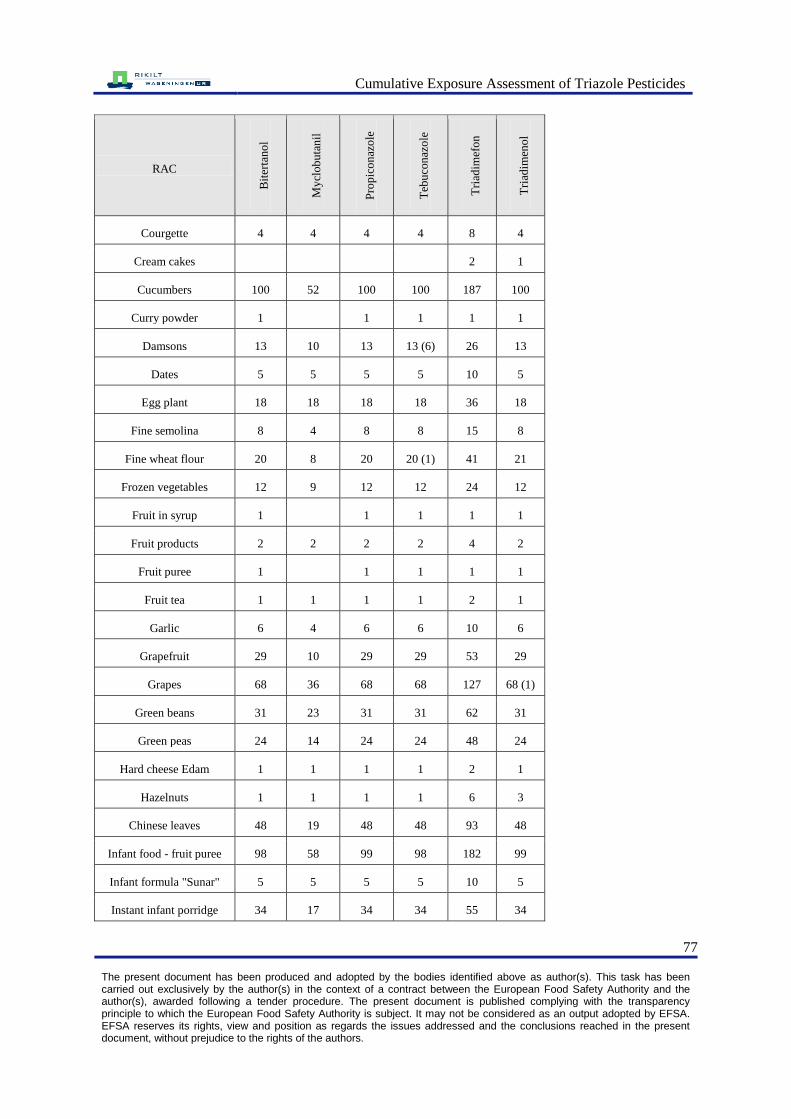
Cumulative Exposure Assessment of Triazole Pesticides
77 The present document has been produced and adopted by the bodies identified above as author(s). This task has been carried out exclusively by the author(s) in the context of a contract between the European Food Safety Authority and the author(s), awarded following a tender procedure. The present document is published complying with the transparency principle to which the European Food Safety Authority is subject. It may not be considered as an output adopted by EFSA. EFSA reserves its rights, view and position as regards the issues addressed and the conclusions reached in the present document, without prejudice to the rights of the authors.
RAC
Bit
erta
no
l
My
clob
uta
nil
Pro
pic
on
azo
le
Teb
uco
naz
ole
Tri
adim
efo
n
Tri
adim
eno
l
Courgette 4 4 4 4 8 4
Cream cakes 2 1
Cucumbers 100 52 100 100 187 100
Curry powder 1 1 1 1 1
Damsons 13 10 13 13 (6) 26 13
Dates 5 5 5 5 10 5
Egg plant 18 18 18 18 36 18
Fine semolina 8 4 8 8 15 8
Fine wheat flour 20 8 20 20 (1) 41 21
Frozen vegetables 12 9 12 12 24 12
Fruit in syrup 1 1 1 1 1
Fruit products 2 2 2 2 4 2
Fruit puree 1 1 1 1 1
Fruit tea 1 1 1 1 2 1
Garlic 6 4 6 6 10 6
Grapefruit 29 10 29 29 53 29
Grapes 68 36 68 68 127 68 (1)
Green beans 31 23 31 31 62 31
Green peas 24 14 24 24 48 24
Hard cheese Edam 1 1 1 1 2 1
Hazelnuts 1 1 1 1 6 3
Chinese leaves 48 19 48 48 93 48
Infant food - fruit puree 98 58 99 98 182 99
Infant formula "Sunar" 5 5 5 5 10 5
Instant infant porridge 34 17 34 34 55 34

Cumulative Exposure Assessment of Triazole Pesticides
78 The present document has been produced and adopted by the bodies identified above as author(s). This task has been carried out exclusively by the author(s) in the context of a contract between the European Food Safety Authority and the author(s), awarded following a tender procedure. The present document is published complying with the transparency principle to which the European Food Safety Authority is subject. It may not be considered as an output adopted by EFSA. EFSA reserves its rights, view and position as regards the issues addressed and the conclusions reached in the present document, without prejudice to the rights of the authors.
RAC
Bit
erta
no
l
My
clob
uta
nil
Pro
pic
on
azo
le
Teb
uco
naz
ole
Tri
adim
efo
n
Tri
adim
eno
l
Juice 36 19 36 36 67 36
Kiwi fruit 8 4 8 8 15 8
Kohlrabi 3 3 3 3 6 3
Leek 45 27 45 45 (1) 86 45
Lemonade 2 1 2 2 4 2
Lemons 4 4 4 4 8 4
Lettuce 63 46 63 63 116 63
Mandarin oranges 56 19 54 54 107 56
Mangoes 3 3 3 3 7 3
Medium-coarse wheat flour 10 7 10 10 20 10
Millet 1 1 1 1 2 1
Muesli 2 1 2 2 4 2
Mushrooms 1 1 1 2 1
Nectarines 25 (1) 24 25 25 50 25
Oat flakes 15 12 15 15 30 15
Onions 37 17 37 37 70 37
Oranges 54 20 53 53 97 54
Sweet pepper 1 1 1 (1) 1 1
Parsley 36 21 36 36 68 36
Peaches 54 34 54 54 (1) 108 54
Peaches in syrup 2 1 2 2 (1) 4 2
Pears 43 (1) 26 43 43 85 43
Peas 6 5 6 6 12 6
Pepper 114 61 114 114 (2) 209 114
Pineapple 5 5 5 5 10 5
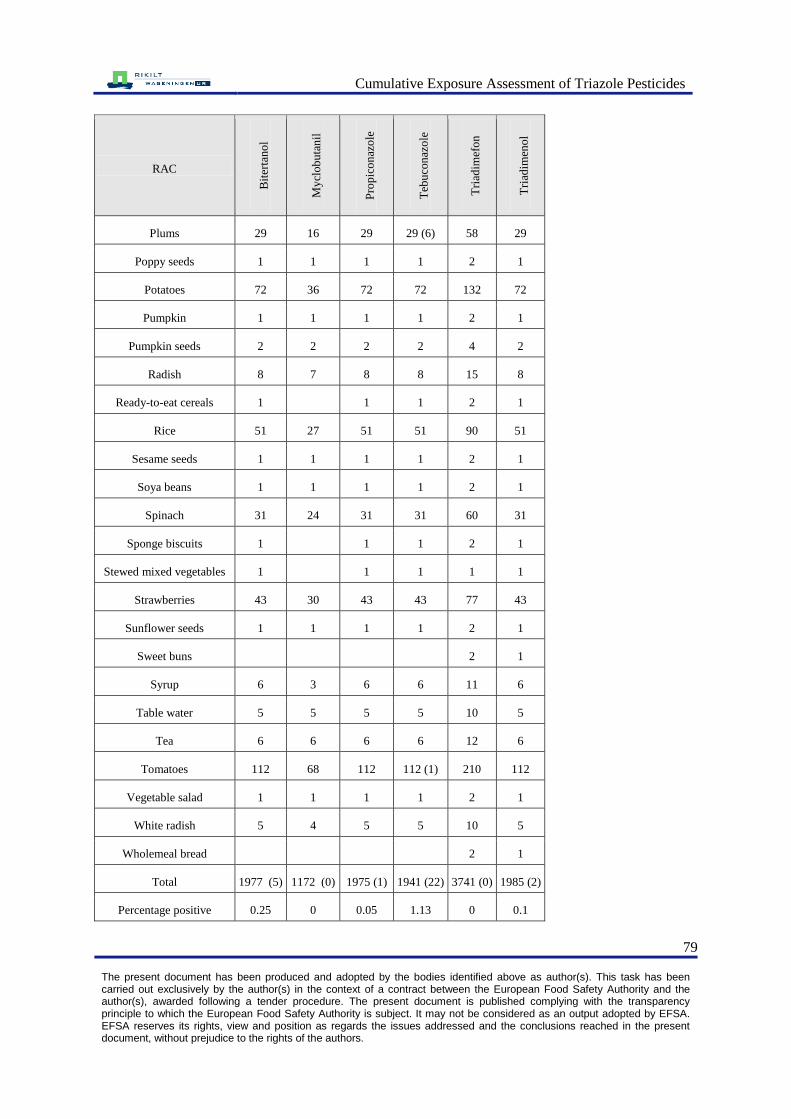
Cumulative Exposure Assessment of Triazole Pesticides
79 The present document has been produced and adopted by the bodies identified above as author(s). This task has been carried out exclusively by the author(s) in the context of a contract between the European Food Safety Authority and the author(s), awarded following a tender procedure. The present document is published complying with the transparency principle to which the European Food Safety Authority is subject. It may not be considered as an output adopted by EFSA. EFSA reserves its rights, view and position as regards the issues addressed and the conclusions reached in the present document, without prejudice to the rights of the authors.
RAC
Bit
erta
no
l
My
clob
uta
nil
Pro
pic
on
azo
le
Teb
uco
naz
ole
Tri
adim
efo
n
Tri
adim
eno
l
Plums 29 16 29 29 (6) 58 29
Poppy seeds 1 1 1 1 2 1
Potatoes 72 36 72 72 132 72
Pumpkin 1 1 1 1 2 1
Pumpkin seeds 2 2 2 2 4 2
Radish 8 7 8 8 15 8
Ready-to-eat cereals 1 1 1 2 1
Rice 51 27 51 51 90 51
Sesame seeds 1 1 1 1 2 1
Soya beans 1 1 1 1 2 1
Spinach 31 24 31 31 60 31
Sponge biscuits 1 1 1 2 1
Stewed mixed vegetables 1 1 1 1 1
Strawberries 43 30 43 43 77 43
Sunflower seeds 1 1 1 1 2 1
Sweet buns 2 1
Syrup 6 3 6 6 11 6
Table water 5 5 5 5 10 5
Tea 6 6 6 6 12 6
Tomatoes 112 68 112 112 (1) 210 112
Vegetable salad 1 1 1 1 2 1
White radish 5 4 5 5 10 5
Wholemeal bread 2 1
Total 1977 (5) 1172 (0) 1975 (1) 1941 (22) 3741 (0) 1985 (2)
Percentage positive 0.25 0 0.05 1.13 0 0.1
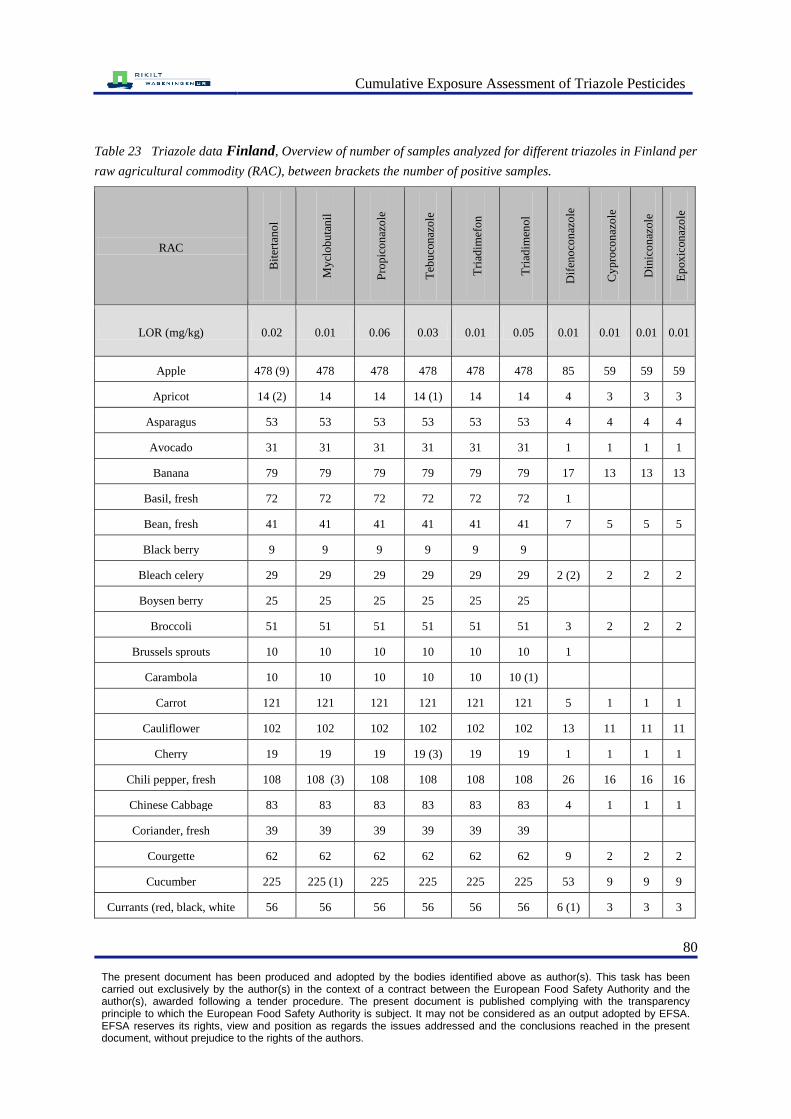
Cumulative Exposure Assessment of Triazole Pesticides
80 The present document has been produced and adopted by the bodies identified above as author(s). This task has been carried out exclusively by the author(s) in the context of a contract between the European Food Safety Authority and the author(s), awarded following a tender procedure. The present document is published complying with the transparency principle to which the European Food Safety Authority is subject. It may not be considered as an output adopted by EFSA. EFSA reserves its rights, view and position as regards the issues addressed and the conclusions reached in the present document, without prejudice to the rights of the authors.
Table 23 Triazole data Finland, Overview of number of samples analyzed for different triazoles in Finland per
raw agricultural commodity (RAC), between brackets the number of positive samples.
RAC
Bit
erta
no
l
My
clob
uta
nil
Pro
pic
on
azo
le
Teb
uco
naz
ole
Tri
adim
efo
n
Tri
adim
eno
l
Dif
eno
con
azo
le
Cy
pro
con
azo
le
Din
ico
naz
ole
Ep
ox
icon
azo
le
LOR (mg/kg) 0.02 0.01 0.06 0.03 0.01 0.05 0.01 0.01 0.01 0.01
Apple 478 (9) 478 478 478 478 478 85 59 59 59
Apricot 14 (2) 14 14 14 (1) 14 14 4 3 3 3
Asparagus 53 53 53 53 53 53 4 4 4 4
Avocado 31 31 31 31 31 31 1 1 1 1
Banana 79 79 79 79 79 79 17 13 13 13
Basil, fresh 72 72 72 72 72 72 1
Bean, fresh 41 41 41 41 41 41 7 5 5 5
Black berry 9 9 9 9 9 9
Bleach celery 29 29 29 29 29 29 2 (2) 2 2 2
Boysen berry 25 25 25 25 25 25
Broccoli 51 51 51 51 51 51 3 2 2 2
Brussels sprouts 10 10 10 10 10 10 1
Carambola 10 10 10 10 10 10 (1)
Carrot 121 121 121 121 121 121 5 1 1 1
Cauliflower 102 102 102 102 102 102 13 11 11 11
Cherry 19 19 19 19 (3) 19 19 1 1 1 1
Chili pepper, fresh 108 108 (3) 108 108 108 108 26 16 16 16
Chinese Cabbage 83 83 83 83 83 83 4 1 1 1
Coriander, fresh 39 39 39 39 39 39
Courgette 62 62 62 62 62 62 9 2 2 2
Cucumber 225 225 (1) 225 225 225 225 53 9 9 9
Currants (red, black, white 56 56 56 56 56 56 6 (1) 3 3 3
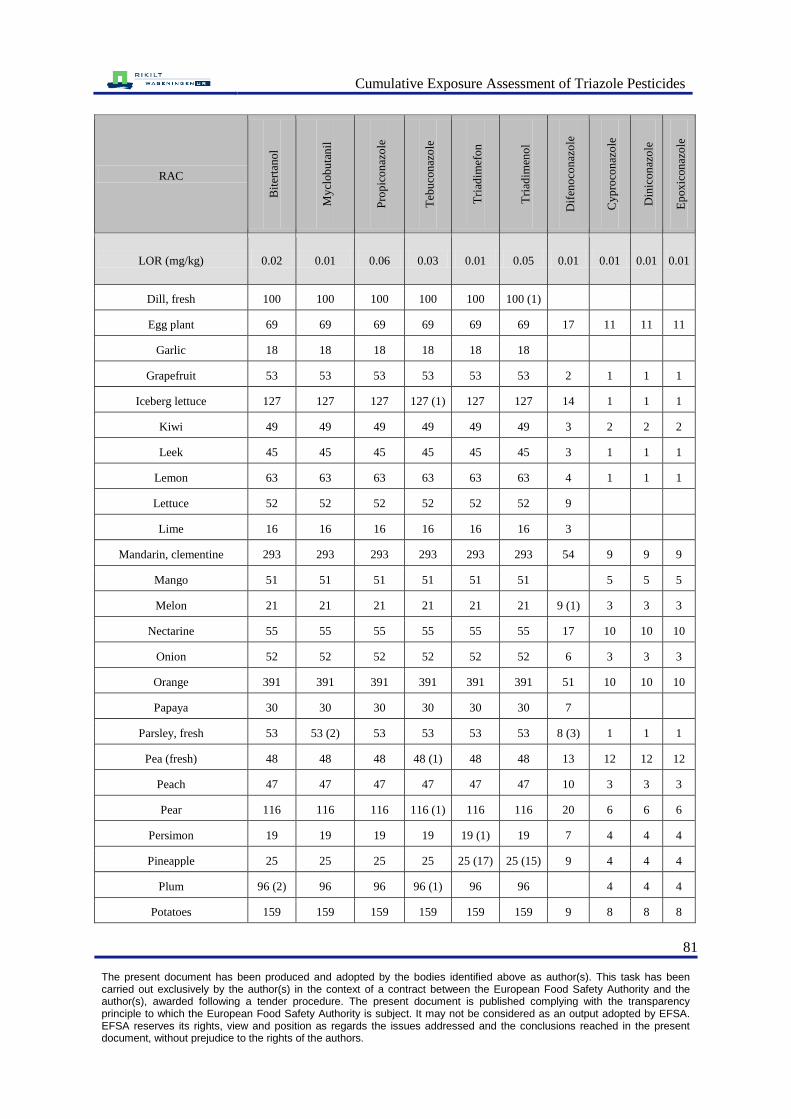
Cumulative Exposure Assessment of Triazole Pesticides
81 The present document has been produced and adopted by the bodies identified above as author(s). This task has been carried out exclusively by the author(s) in the context of a contract between the European Food Safety Authority and the author(s), awarded following a tender procedure. The present document is published complying with the transparency principle to which the European Food Safety Authority is subject. It may not be considered as an output adopted by EFSA. EFSA reserves its rights, view and position as regards the issues addressed and the conclusions reached in the present document, without prejudice to the rights of the authors.
RAC
Bit
erta
no
l
My
clob
uta
nil
Pro
pic
on
azo
le
Teb
uco
naz
ole
Tri
adim
efo
n
Tri
adim
eno
l
Dif
eno
con
azo
le
Cy
pro
con
azo
le
Din
ico
naz
ole
Ep
ox
icon
azo
le
LOR (mg/kg) 0.02 0.01 0.06 0.03 0.01 0.05 0.01 0.01 0.01 0.01
Dill, fresh 100 100 100 100 100 100 (1)
Egg plant 69 69 69 69 69 69 17 11 11 11
Garlic 18 18 18 18 18 18
Grapefruit 53 53 53 53 53 53 2 1 1 1
Iceberg lettuce 127 127 127 127 (1) 127 127 14 1 1 1
Kiwi 49 49 49 49 49 49 3 2 2 2
Leek 45 45 45 45 45 45 3 1 1 1
Lemon 63 63 63 63 63 63 4 1 1 1
Lettuce 52 52 52 52 52 52 9
Lime 16 16 16 16 16 16 3
Mandarin, clementine 293 293 293 293 293 293 54 9 9 9
Mango 51 51 51 51 51 51 5 5 5
Melon 21 21 21 21 21 21 9 (1) 3 3 3
Nectarine 55 55 55 55 55 55 17 10 10 10
Onion 52 52 52 52 52 52 6 3 3 3
Orange 391 391 391 391 391 391 51 10 10 10
Papaya 30 30 30 30 30 30 7
Parsley, fresh 53 53 (2) 53 53 53 53 8 (3) 1 1 1
Pea (fresh) 48 48 48 48 (1) 48 48 13 12 12 12
Peach 47 47 47 47 47 47 10 3 3 3
Pear 116 116 116 116 (1) 116 116 20 6 6 6
Persimon 19 19 19 19 19 (1) 19 7 4 4 4
Pineapple 25 25 25 25 25 (17) 25 (15) 9 4 4 4
Plum 96 (2) 96 96 96 (1) 96 96 4 4 4
Potatoes 159 159 159 159 159 159 9 8 8 8

Cumulative Exposure Assessment of Triazole Pesticides
82 The present document has been produced and adopted by the bodies identified above as author(s). This task has been carried out exclusively by the author(s) in the context of a contract between the European Food Safety Authority and the author(s), awarded following a tender procedure. The present document is published complying with the transparency principle to which the European Food Safety Authority is subject. It may not be considered as an output adopted by EFSA. EFSA reserves its rights, view and position as regards the issues addressed and the conclusions reached in the present document, without prejudice to the rights of the authors.
RAC
Bit
erta
no
l
My
clob
uta
nil
Pro
pic
on
azo
le
Teb
uco
naz
ole
Tri
adim
efo
n
Tri
adim
eno
l
Dif
eno
con
azo
le
Cy
pro
con
azo
le
Din
ico
naz
ole
Ep
ox
icon
azo
le
LOR (mg/kg) 0.02 0.01 0.06 0.03 0.01 0.05 0.01 0.01 0.01 0.01
Raspberry 136 136 136 136 136 136 21 7 7 7
Rucola 65 65 65 65 65 65 16 5 5 5
Savoy cabbage 77 77 77 77 77 77
Spinach 67 67 67 67 67 67 8 2 2 2
Strawberry 207 (1) 207 (5) 207 207 207 (1) 207 53 (1) 16 16 16
Sweet pepper 251 251 251 251 251 251 43 23 23 23
Sweet potato 26 26 26 26 26 26 6 3 3 3
Table grape 217 217 (13) 217 217 (5) 217 217 (2 45 (1) 26 (1) 26 26
Tomato 246 246 246 246 246 246 29 18 18 18
Watermelon 26 26 26 26 26 26 7 2 2 2
Total 5083
(14)
5083
(24)
5083
(0)
5083
(14)
5083
(19)
5083
(19)
745
(9)
334
(1)
334
(0)
334
(0)
Percentage positive 0.28 0.45 0 0.28 0.37 0.37 1.21 0.30 0 0
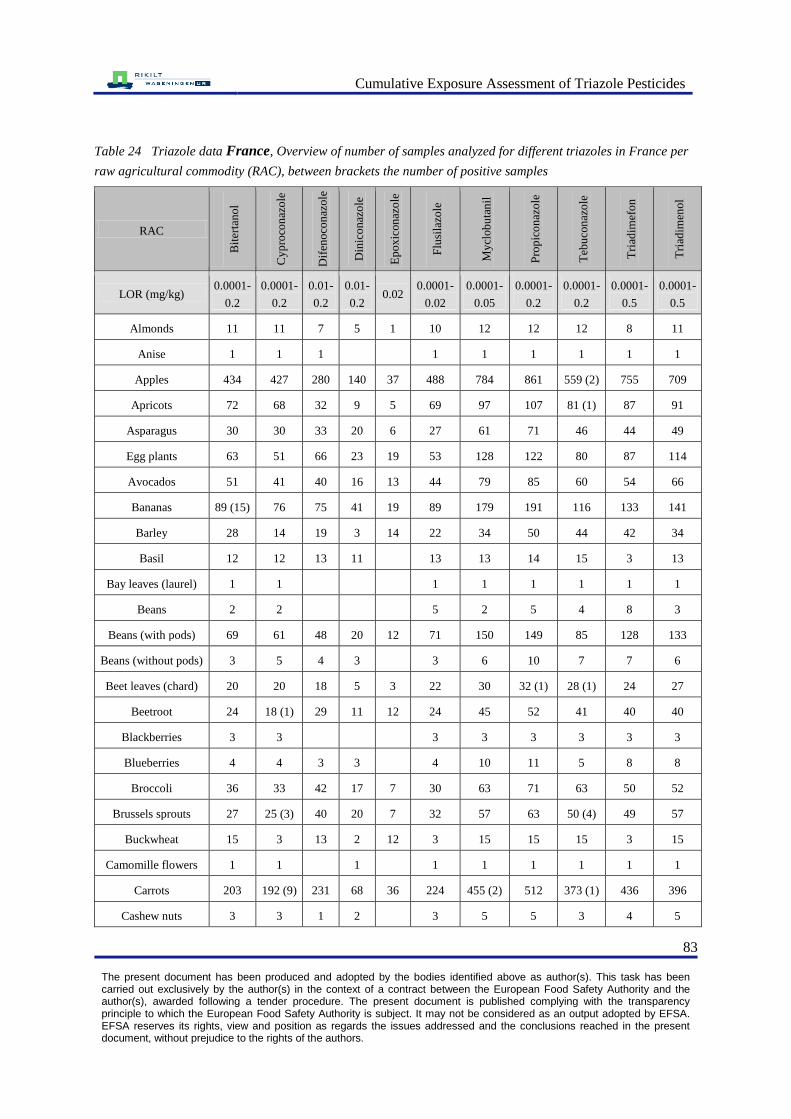
Cumulative Exposure Assessment of Triazole Pesticides
83 The present document has been produced and adopted by the bodies identified above as author(s). This task has been carried out exclusively by the author(s) in the context of a contract between the European Food Safety Authority and the author(s), awarded following a tender procedure. The present document is published complying with the transparency principle to which the European Food Safety Authority is subject. It may not be considered as an output adopted by EFSA. EFSA reserves its rights, view and position as regards the issues addressed and the conclusions reached in the present document, without prejudice to the rights of the authors.
Table 24 Triazole data France, Overview of number of samples analyzed for different triazoles in France per
raw agricultural commodity (RAC), between brackets the number of positive samples
RAC B
iter
tan
ol
Cy
pro
con
azo
le
Dif
eno
con
azo
le
Din
ico
naz
ole
Ep
ox
icon
azo
le
Flu
sila
zole
My
clob
uta
nil
Pro
pic
on
azo
le
Teb
uco
naz
ole
Tri
adim
efo
n
Tri
adim
eno
l
LOR (mg/kg) 0.0001-
0.2
0.0001-
0.2
0.01-
0.2
0.01-
0.2 0.02
0.0001-
0.02
0.0001-
0.05
0.0001-
0.2
0.0001-
0.2
0.0001-
0.5
0.0001-
0.5
Almonds 11 11 7 5 1 10 12 12 12 8 11
Anise 1 1 1 1 1 1 1 1 1
Apples 434 427 280 140 37 488 784 861 559 (2) 755 709
Apricots 72 68 32 9 5 69 97 107 81 (1) 87 91
Asparagus 30 30 33 20 6 27 61 71 46 44 49
Egg plants 63 51 66 23 19 53 128 122 80 87 114
Avocados 51 41 40 16 13 44 79 85 60 54 66
Bananas 89 (15) 76 75 41 19 89 179 191 116 133 141
Barley 28 14 19 3 14 22 34 50 44 42 34
Basil 12 12 13 11 13 13 14 15 3 13
Bay leaves (laurel) 1 1 1 1 1 1 1 1
Beans 2 2 5 2 5 4 8 3
Beans (with pods) 69 61 48 20 12 71 150 149 85 128 133
Beans (without pods) 3 5 4 3 3 6 10 7 7 6
Beet leaves (chard) 20 20 18 5 3 22 30 32 (1) 28 (1) 24 27
Beetroot 24 18 (1) 29 11 12 24 45 52 41 40 40
Blackberries 3 3 3 3 3 3 3 3
Blueberries 4 4 3 3 4 10 11 5 8 8
Broccoli 36 33 42 17 7 30 63 71 63 50 52
Brussels sprouts 27 25 (3) 40 20 7 32 57 63 50 (4) 49 57
Buckwheat 15 3 13 2 12 3 15 15 15 3 15
Camomille flowers 1 1 1 1 1 1 1 1 1
Carrots 203 192 (9) 231 68 36 224 455 (2) 512 373 (1) 436 396
Cashew nuts 3 3 1 2 3 5 5 3 4 5

Cumulative Exposure Assessment of Triazole Pesticides
84 The present document has been produced and adopted by the bodies identified above as author(s). This task has been carried out exclusively by the author(s) in the context of a contract between the European Food Safety Authority and the author(s), awarded following a tender procedure. The present document is published complying with the transparency principle to which the European Food Safety Authority is subject. It may not be considered as an output adopted by EFSA. EFSA reserves its rights, view and position as regards the issues addressed and the conclusions reached in the present document, without prejudice to the rights of the authors.
RAC
Bit
erta
no
l
Cy
pro
con
azo
le
Dif
eno
con
azo
le
Din
ico
naz
ole
Ep
ox
icon
azo
le
Flu
sila
zole
My
clob
uta
nil
Pro
pic
on
azo
le
Teb
uco
naz
ole
Tri
adim
efo
n
Tri
adim
eno
l
LOR (mg/kg) 0.0001-
0.2
0.0001-
0.2
0.01-
0.2
0.01-
0.2 0.02
0.0001-
0.02
0.0001-
0.05
0.0001-
0.2
0.0001-
0.2
0.0001-
0.5
0.0001-
0.5
Cassava 2 2 2 7 7 2 5 7
Cauliflower 54 57 79 36 10 70 126 136 105 100 93
Celeriac 17 14 25 10 6 14 29 29 25 13 26
Celery 31 29 (1) 27 14 3 40 54 64 43 (1) 63 57
Celery leaves 44 43 (2) 12 7 3 48 64 79 59 (2) 74 66
Cherries 114 110 34 20 4 111 150 (1) 162 119 (6) 136 141
Chervil 5 5 3 1 1 4 6 6 6 4 5
Chestnuts 8 8 4 1 9 9 9 8 9 9
Chinese cabbage 10 1 11 1
Chives 7 5 (1) 8 2 2 9 11 13 12 10 11
Cinnamon 1 1 1 1
Cocoa (fermented
beans) 4 3 1 1 3 5 5 4 4 5
Coconuts 1 1 1 1
Coffee beans 3 2 1 1 5 22 23 3 24 22
Courgettes 114 105 60 26 13 108 185 191 141 174 165
Cranberries 1 1 1 1
Cress 23 13 22 9 12 17 49 53 31 32 41
Cucumbers 145 99 105 41 50 101 245 (2) 257 167 182 225
Cultivated fungi 14 14 16 8 2 16 27 31 20 25 27
Currants
(red,black,white) 13 8 12 6 5 12 22 26 16 19 21
Dates 6 7 2 2 6 8 8 7 6 6
Dill seed 2 2 2 1 2 2 3 3 2 2
Elderberries 2 2 2 2 2 2 2 2 2
Fennel 38 35 28 11 6 38 57 65 48 54 52
Fenugreek 2 2 2

Cumulative Exposure Assessment of Triazole Pesticides
85 The present document has been produced and adopted by the bodies identified above as author(s). This task has been carried out exclusively by the author(s) in the context of a contract between the European Food Safety Authority and the author(s), awarded following a tender procedure. The present document is published complying with the transparency principle to which the European Food Safety Authority is subject. It may not be considered as an output adopted by EFSA. EFSA reserves its rights, view and position as regards the issues addressed and the conclusions reached in the present document, without prejudice to the rights of the authors.
RAC
Bit
erta
no
l
Cy
pro
con
azo
le
Dif
eno
con
azo
le
Din
ico
naz
ole
Ep
ox
icon
azo
le
Flu
sila
zole
My
clob
uta
nil
Pro
pic
on
azo
le
Teb
uco
naz
ole
Tri
adim
efo
n
Tri
adim
eno
l
LOR (mg/kg) 0.0001-
0.2
0.0001-
0.2
0.01-
0.2
0.01-
0.2 0.02
0.0001-
0.02
0.0001-
0.05
0.0001-
0.2
0.0001-
0.2
0.0001-
0.5
0.0001-
0.5
Figs 7 7 6 2 1 7 12 13 9 8 10
Garlic 34 36 18 5 35 40 44 38 41 41
Gherkins 4 3 1 2 1 5 4 6 6 7 4
Ginger 7 1 7 1 6 1 25 25 7 10 17
Ginseng root 7 7 5 7 7 7 7 7 7 7
Globe artichokes 25 24 49 6 4 42 61 71 66 64 58
Grapefruit 32 21 36 7 13 22 48 53 41 32 45
Hazelnuts 13 12 9 6 2 12 16 16 15 11 15
Head cabbage 46 50 39 27 1 63 97 107 72 91 67
Herbal infusions 71 71 10 69 72 73 73 71 66 72
Honey 5 5 1 1 5 9 18 5 13 14
Horseradish 1 1 1 1 1 1 1 1 1
Hybiscus flowers 1 1 1 1 1 1 1
Kale 2 2 2 2 2 2 2 2 2
Kiwi 49 46 18 6 3 48 83 102 50 97 100
Kohlrabi 1 1 1 1 1 1 1 1 1
Kumquatss 1 1 1 1 1 1 1 1
Lamb's lettuce 15 6 51 4 9 31 63 73 61 62 64
Leek 96 98 67 43 5 99 171 190 137 (7) 150 122
Lemons 175 158 126 53 28 179 286 (4) 302 219 239 250
Lentils 52 45 41 27 9 48 72 78 63 52 67
Lettuce 579 591 252 179 27 671 901 1023 747 970 833
Lime (linden) 2 2 2 2 3 3 2 3 3
Linseed 1 1 1 1 2 1 2 2 2 1
Lychee (Lychee) 11 9 4 2 11 17 19 12 18 17
Maize 64 61 9 3 61 68 84 80 80 67
Mandarins 137 134 73 32 9 141 202 195 159 184 183
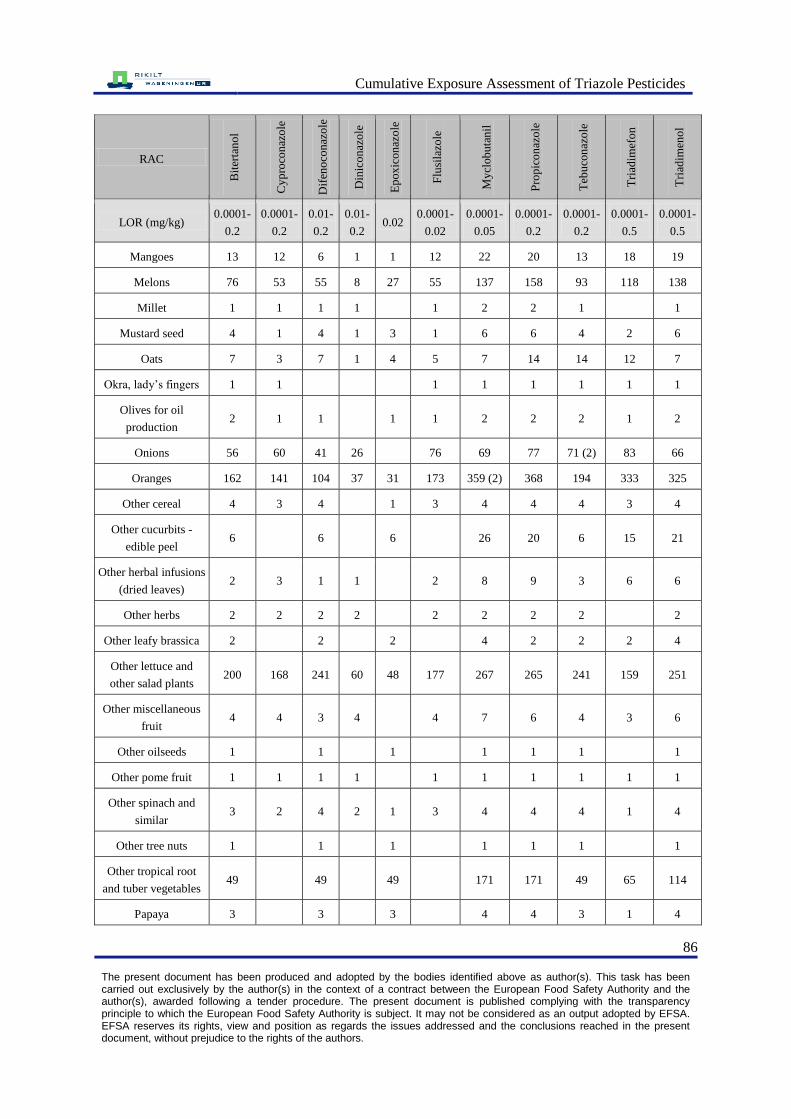
Cumulative Exposure Assessment of Triazole Pesticides
86 The present document has been produced and adopted by the bodies identified above as author(s). This task has been carried out exclusively by the author(s) in the context of a contract between the European Food Safety Authority and the author(s), awarded following a tender procedure. The present document is published complying with the transparency principle to which the European Food Safety Authority is subject. It may not be considered as an output adopted by EFSA. EFSA reserves its rights, view and position as regards the issues addressed and the conclusions reached in the present document, without prejudice to the rights of the authors.
RAC
Bit
erta
no
l
Cy
pro
con
azo
le
Dif
eno
con
azo
le
Din
ico
naz
ole
Ep
ox
icon
azo
le
Flu
sila
zole
My
clob
uta
nil
Pro
pic
on
azo
le
Teb
uco
naz
ole
Tri
adim
efo
n
Tri
adim
eno
l
LOR (mg/kg) 0.0001-
0.2
0.0001-
0.2
0.01-
0.2
0.01-
0.2 0.02
0.0001-
0.02
0.0001-
0.05
0.0001-
0.2
0.0001-
0.2
0.0001-
0.5
0.0001-
0.5
Mangoes 13 12 6 1 1 12 22 20 13 18 19
Melons 76 53 55 8 27 55 137 158 93 118 138
Millet 1 1 1 1 1 2 2 1 1
Mustard seed 4 1 4 1 3 1 6 6 4 2 6
Oats 7 3 7 1 4 5 7 14 14 12 7
Okra, lady‘s fingers 1 1 1 1 1 1 1 1
Olives for oil
production 2 1 1 1 1 2 2 2 1 2
Onions 56 60 41 26 76 69 77 71 (2) 83 66
Oranges 162 141 104 37 31 173 359 (2) 368 194 333 325
Other cereal 4 3 4 1 3 4 4 4 3 4
Other cucurbits -
edible peel 6 6 6 26 20 6 15 21
Other herbal infusions
(dried leaves) 2 3 1 1 2 8 9 3 6 6
Other herbs 2 2 2 2 2 2 2 2 2
Other leafy brassica 2 2 2 4 2 2 2 4
Other lettuce and
other salad plants 200 168 241 60 48 177 267 265 241 159 251
Other miscellaneous
fruit 4 4 3 4 4 7 6 4 3 6
Other oilseeds 1 1 1 1 1 1 1
Other pome fruit 1 1 1 1 1 1 1 1 1 1
Other spinach and
similar 3 2 4 2 1 3 4 4 4 1 4
Other tree nuts 1 1 1 1 1 1 1
Other tropical root
and tuber vegetables 49 49 49 171 171 49 65 114
Papaya 3 3 3 4 4 3 1 4

Cumulative Exposure Assessment of Triazole Pesticides
87 The present document has been produced and adopted by the bodies identified above as author(s). This task has been carried out exclusively by the author(s) in the context of a contract between the European Food Safety Authority and the author(s), awarded following a tender procedure. The present document is published complying with the transparency principle to which the European Food Safety Authority is subject. It may not be considered as an output adopted by EFSA. EFSA reserves its rights, view and position as regards the issues addressed and the conclusions reached in the present document, without prejudice to the rights of the authors.
RAC
Bit
erta
no
l
Cy
pro
con
azo
le
Dif
eno
con
azo
le
Din
ico
naz
ole
Ep
ox
icon
azo
le
Flu
sila
zole
My
clob
uta
nil
Pro
pic
on
azo
le
Teb
uco
naz
ole
Tri
adim
efo
n
Tri
adim
eno
l
LOR (mg/kg) 0.0001-
0.2
0.0001-
0.2
0.01-
0.2
0.01-
0.2 0.02
0.0001-
0.02
0.0001-
0.05
0.0001-
0.2
0.0001-
0.2
0.0001-
0.5
0.0001-
0.5
Parsley 41 38 (1) 25
(1) 5 4 49 60 (1) 69 55 70 61
Passion fruit 1 1 1 1 1 1 1 1 1 1
Peaches 166 161 73 43 10 166 (1) 230 238 183 (6) 201 209
Peanuts 13 13 8 7 2 14 20 20 16 16 18
Pears 169 162 126 61 21 171 271 291 213 237 247
Peas 2 2 4 2 6 5 8 3 (1)
Peas (with pods) 12 11 13 4 1 12 15 16 14 11 15
Peas (without pods) 35 27 36 21 12 30 62 74 53 43 57 (1)
Peppers 189 181 107 42 15 186 (1) 242 259 221 (1) 228 241 (1)
Persimmon 2 1 2 1 1 2 3 2 2 3
Pine nuts 2 2 1 2 2 3 3 3 2
Pineapples 30 14 26 2 16 16 65 65 35 42 (6) 56 (5)
Pistachios 6 6 2 3 7 9 10 7 10 9
Plums 79 (6) 76 46 62 3 78 112 (1) 126 83 (9) 102 119
Pomegranate 1 1 1 1 1 1 1 1 1
Pomelo 43 43 8 11 48 62 66 44 63 53
Poppy seed 1 1 1 1 1 1
Potatoes 198 241 225 129 29 333 382 401 348 403 258
Pumpkin seeds 2 2 2 2 2 2 2 2 2
Pumpkins 8 1 8 7 1 18 18 8 10 17
Quinces 1 1 1 1
Radishes 36 33 35 15 8 39 56 67 56 56 48
Rape seed 1 1 1 1 1 4 4 4
Raspberries 24 19 20 7 6 21 42 46 32 32 35
Rhubarb 3 3 1 3 4 7 7 3 7 6
Rice 132 129 44 1 3 133 145 140 133 148 146
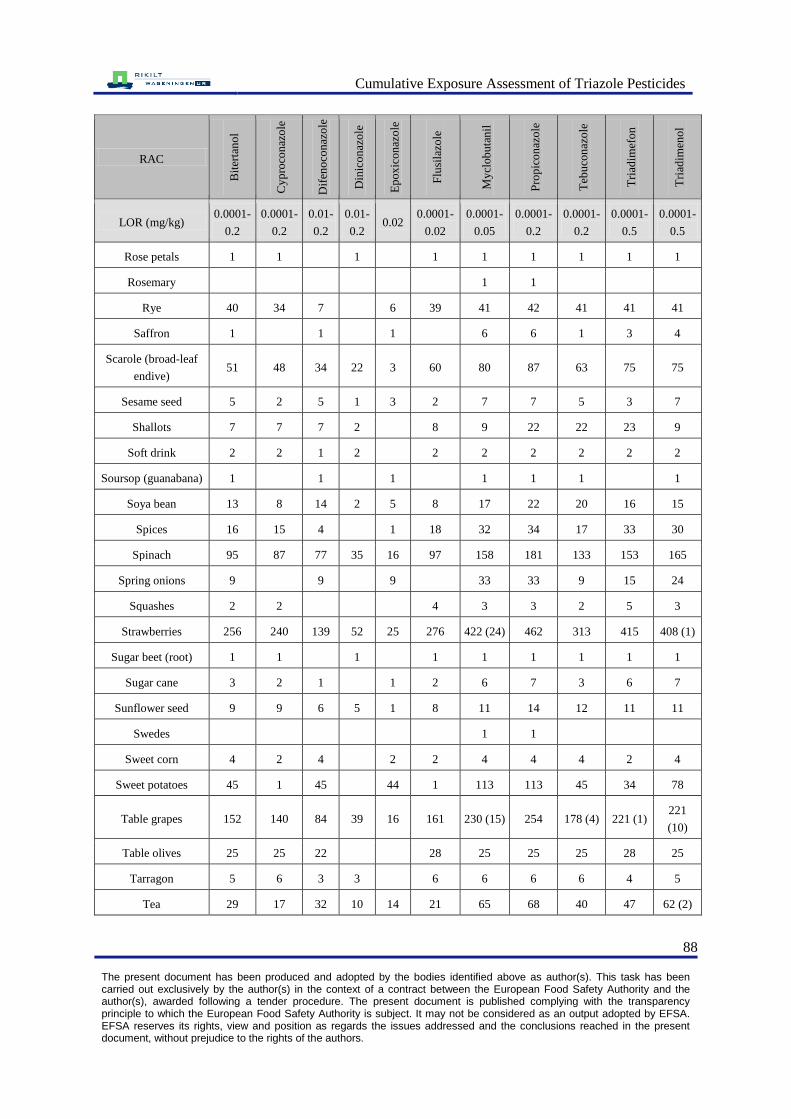
Cumulative Exposure Assessment of Triazole Pesticides
88 The present document has been produced and adopted by the bodies identified above as author(s). This task has been carried out exclusively by the author(s) in the context of a contract between the European Food Safety Authority and the author(s), awarded following a tender procedure. The present document is published complying with the transparency principle to which the European Food Safety Authority is subject. It may not be considered as an output adopted by EFSA. EFSA reserves its rights, view and position as regards the issues addressed and the conclusions reached in the present document, without prejudice to the rights of the authors.
RAC
Bit
erta
no
l
Cy
pro
con
azo
le
Dif
eno
con
azo
le
Din
ico
naz
ole
Ep
ox
icon
azo
le
Flu
sila
zole
My
clob
uta
nil
Pro
pic
on
azo
le
Teb
uco
naz
ole
Tri
adim
efo
n
Tri
adim
eno
l
LOR (mg/kg) 0.0001-
0.2
0.0001-
0.2
0.01-
0.2
0.01-
0.2 0.02
0.0001-
0.02
0.0001-
0.05
0.0001-
0.2
0.0001-
0.2
0.0001-
0.5
0.0001-
0.5
Rose petals 1 1 1 1 1 1 1 1 1
Rosemary 1 1
Rye 40 34 7 6 39 41 42 41 41 41
Saffron 1 1 1 6 6 1 3 4
Scarole (broad-leaf
endive) 51 48 34 22 3 60 80 87 63 75 75
Sesame seed 5 2 5 1 3 2 7 7 5 3 7
Shallots 7 7 7 2 8 9 22 22 23 9
Soft drink 2 2 1 2 2 2 2 2 2 2
Soursop (guanabana) 1 1 1 1 1 1 1
Soya bean 13 8 14 2 5 8 17 22 20 16 15
Spices 16 15 4 1 18 32 34 17 33 30
Spinach 95 87 77 35 16 97 158 181 133 153 165
Spring onions 9 9 9 33 33 9 15 24
Squashes 2 2 4 3 3 2 5 3
Strawberries 256 240 139 52 25 276 422 (24) 462 313 415 408 (1)
Sugar beet (root) 1 1 1 1 1 1 1 1 1
Sugar cane 3 2 1 1 2 6 7 3 6 7
Sunflower seed 9 9 6 5 1 8 11 14 12 11 11
Swedes 1 1
Sweet corn 4 2 4 2 2 4 4 4 2 4
Sweet potatoes 45 1 45 44 1 113 113 45 34 78
Table grapes 152 140 84 39 16 161 230 (15) 254 178 (4) 221 (1) 221
(10)
Table olives 25 25 22 28 25 25 25 28 25
Tarragon 5 6 3 3 6 6 6 6 4 5
Tea 29 17 32 10 14 21 65 68 40 47 62 (2)
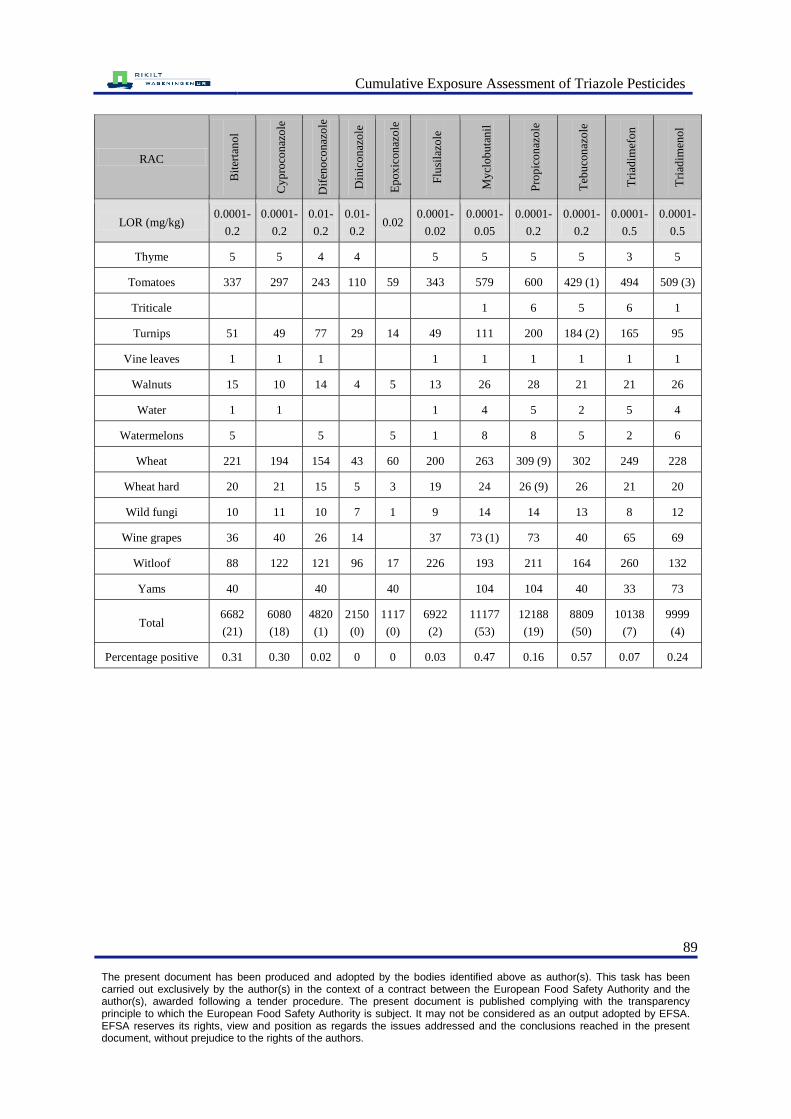
Cumulative Exposure Assessment of Triazole Pesticides
89 The present document has been produced and adopted by the bodies identified above as author(s). This task has been carried out exclusively by the author(s) in the context of a contract between the European Food Safety Authority and the author(s), awarded following a tender procedure. The present document is published complying with the transparency principle to which the European Food Safety Authority is subject. It may not be considered as an output adopted by EFSA. EFSA reserves its rights, view and position as regards the issues addressed and the conclusions reached in the present document, without prejudice to the rights of the authors.
RAC
Bit
erta
no
l
Cy
pro
con
azo
le
Dif
eno
con
azo
le
Din
ico
naz
ole
Ep
ox
icon
azo
le
Flu
sila
zole
My
clob
uta
nil
Pro
pic
on
azo
le
Teb
uco
naz
ole
Tri
adim
efo
n
Tri
adim
eno
l
LOR (mg/kg) 0.0001-
0.2
0.0001-
0.2
0.01-
0.2
0.01-
0.2 0.02
0.0001-
0.02
0.0001-
0.05
0.0001-
0.2
0.0001-
0.2
0.0001-
0.5
0.0001-
0.5
Thyme 5 5 4 4 5 5 5 5 3 5
Tomatoes 337 297 243 110 59 343 579 600 429 (1) 494 509 (3)
Triticale 1 6 5 6 1
Turnips 51 49 77 29 14 49 111 200 184 (2) 165 95
Vine leaves 1 1 1 1 1 1 1 1 1
Walnuts 15 10 14 4 5 13 26 28 21 21 26
Water 1 1 1 4 5 2 5 4
Watermelons 5 5 5 1 8 8 5 2 6
Wheat 221 194 154 43 60 200 263 309 (9) 302 249 228
Wheat hard 20 21 15 5 3 19 24 26 (9) 26 21 20
Wild fungi 10 11 10 7 1 9 14 14 13 8 12
Wine grapes 36 40 26 14 37 73 (1) 73 40 65 69
Witloof 88 122 121 96 17 226 193 211 164 260 132
Yams 40 40 40 104 104 40 33 73
Total 6682
(21)
6080
(18)
4820
(1)
2150
(0)
1117
(0)
6922
(2)
11177
(53)
12188
(19)
8809
(50)
10138
(7)
9999
(4)
Percentage positive 0.31 0.30 0.02 0 0 0.03 0.47 0.16 0.57 0.07 0.24

Cumulative Exposure Assessment of Triazole Pesticides
90 The present document has been produced and adopted by the bodies identified above as author(s). This task has been carried out exclusively by the author(s) in the context of a contract between the European Food Safety Authority and the author(s), awarded following a tender procedure. The present document is published complying with the transparency principle to which the European Food Safety Authority is subject. It may not be considered as an output adopted by EFSA. EFSA reserves its rights, view and position as regards the issues addressed and the conclusions reached in the present document, without prejudice to the rights of the authors.
Table 25 Triazole data Italy, Overview of number of samples analyzed for different triazoles in Italy per raw
agricultural commodity (RAC), between brackets the number of positive samples.
RAC
Bit
erta
no
l
Cy
pro
con
azo
le
Dif
eno
con
azo
le
Flu
sila
zole
My
clob
uta
nil
Pro
pic
on
azo
le
Teb
uco
naz
ole
Tri
adim
efo
n
Tri
adim
eno
l
Ananas 15 18 5 9 24 34 14 28 (8) 21 (8)
Apple 1009 (2) 941 157 783 (1) 1274 (4) 1492 1002 (7) 1320 974 (1)
Apricot 219 (1) 189 32 170 (1) 233 (1) 270 218 (8) 244 188
Artichok 70 68 27 28 62 151 (1) 96 102 74
Asparagus 32 27 2 23 44 53 31 40 25
Egg plant 110 111 49 50 84 194 (1) 118 97 114
Avocado 1 1 1 1 2 1 1 1
Banana 130 (2) 134 32 101 163 (1) 207 (1) 145 179 150
Barley 10 6 16 16 3 18 5
Basil 18 29 6 13 21 30 18 14 15
Beans with
pod 73 63 30 36 138 224 78 89 72 (1)
Beat chard 77 73 27 53 59 97 81 90 82
Beat leaves 28 21 5 11 23 46 21 30 19
Brassica
vegetables 44 42 9 27 57 114 61 59 45
Broad beans 13 9 3 5 23 42 16 19 10
Buck wheat 30 23 1 39 36 11 36 3
Cardoons 8 8 8 8 13 8 10 9
Carrots 533 524 264 236 353 702 567 555 (1) 637
Cauliflower 64 56 21 29 68 130 87 94 62
Celeriac 18 18 1 16 17 19 17 20 17
Celery 138 130 32 91 130 198 161 179 123
Cherries 116 (2) 112 13 99 125 160 125 (5) 142 108
Chestnut 8 8 8 14 14 9 9 9
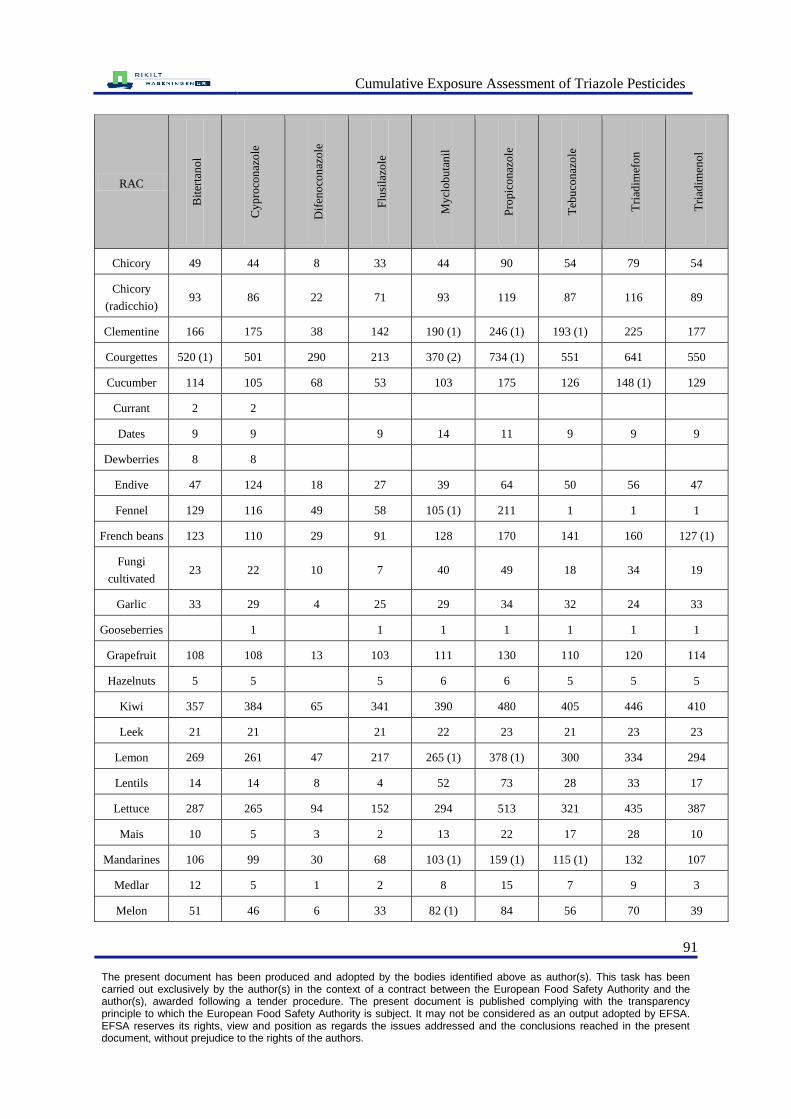
Cumulative Exposure Assessment of Triazole Pesticides
91 The present document has been produced and adopted by the bodies identified above as author(s). This task has been carried out exclusively by the author(s) in the context of a contract between the European Food Safety Authority and the author(s), awarded following a tender procedure. The present document is published complying with the transparency principle to which the European Food Safety Authority is subject. It may not be considered as an output adopted by EFSA. EFSA reserves its rights, view and position as regards the issues addressed and the conclusions reached in the present document, without prejudice to the rights of the authors.
RAC B
iter
tan
ol
Cy
pro
con
azo
le
Dif
eno
con
azo
le
Flu
sila
zole
My
clob
uta
nil
Pro
pic
on
azo
le
Teb
uco
naz
ole
Tri
adim
efo
n
Tri
adim
eno
l
Chicory 49 44 8 33 44 90 54 79 54
Chicory
(radicchio) 93 86 22 71 93 119 87 116 89
Clementine 166 175 38 142 190 (1) 246 (1) 193 (1) 225 177
Courgettes 520 (1) 501 290 213 370 (2) 734 (1) 551 641 550
Cucumber 114 105 68 53 103 175 126 148 (1) 129
Currant 2 2
Dates 9 9 9 14 11 9 9 9
Dewberries 8 8
Endive 47 124 18 27 39 64 50 56 47
Fennel 129 116 49 58 105 (1) 211 1 1 1
French beans 123 110 29 91 128 170 141 160 127 (1)
Fungi
cultivated 23 22 10 7 40 49 18 34 19
Garlic 33 29 4 25 29 34 32 24 33
Gooseberries 1 1 1 1 1 1 1
Grapefruit 108 108 13 103 111 130 110 120 114
Hazelnuts 5 5 5 6 6 5 5 5
Kiwi 357 384 65 341 390 480 405 446 410
Leek 21 21 21 22 23 21 23 23
Lemon 269 261 47 217 265 (1) 378 (1) 300 334 294
Lentils 14 14 8 4 52 73 28 33 17
Lettuce 287 265 94 152 294 513 321 435 387
Mais 10 5 3 2 13 22 17 28 10
Mandarines 106 99 30 68 103 (1) 159 (1) 115 (1) 132 107
Medlar 12 5 1 2 8 15 7 9 3
Melon 51 46 6 33 82 (1) 84 56 70 39
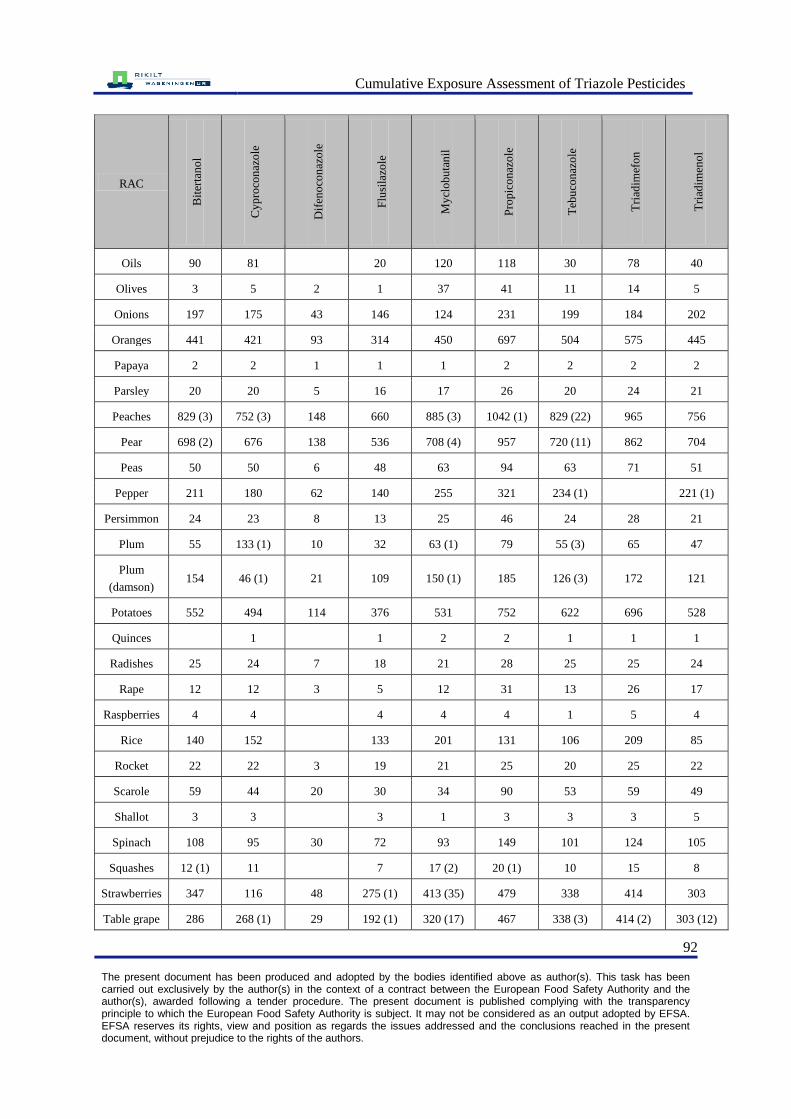
Cumulative Exposure Assessment of Triazole Pesticides
92 The present document has been produced and adopted by the bodies identified above as author(s). This task has been carried out exclusively by the author(s) in the context of a contract between the European Food Safety Authority and the author(s), awarded following a tender procedure. The present document is published complying with the transparency principle to which the European Food Safety Authority is subject. It may not be considered as an output adopted by EFSA. EFSA reserves its rights, view and position as regards the issues addressed and the conclusions reached in the present document, without prejudice to the rights of the authors.
RAC B
iter
tan
ol
Cy
pro
con
azo
le
Dif
eno
con
azo
le
Flu
sila
zole
My
clob
uta
nil
Pro
pic
on
azo
le
Teb
uco
naz
ole
Tri
adim
efo
n
Tri
adim
eno
l
Oils 90 81 20 120 118 30 78 40
Olives 3 5 2 1 37 41 11 14 5
Onions 197 175 43 146 124 231 199 184 202
Oranges 441 421 93 314 450 697 504 575 445
Papaya 2 2 1 1 1 2 2 2 2
Parsley 20 20 5 16 17 26 20 24 21
Peaches 829 (3) 752 (3) 148 660 885 (3) 1042 (1) 829 (22) 965 756
Pear 698 (2) 676 138 536 708 (4) 957 720 (11) 862 704
Peas 50 50 6 48 63 94 63 71 51
Pepper 211 180 62 140 255 321 234 (1) 221 (1)
Persimmon 24 23 8 13 25 46 24 28 21
Plum 55 133 (1) 10 32 63 (1) 79 55 (3) 65 47
Plum
(damson) 154 46 (1) 21 109 150 (1) 185 126 (3) 172 121
Potatoes 552 494 114 376 531 752 622 696 528
Quinces 1 1 2 2 1 1 1
Radishes 25 24 7 18 21 28 25 25 24
Rape 12 12 3 5 12 31 13 26 17
Raspberries 4 4 4 4 4 1 5 4
Rice 140 152 133 201 131 106 209 85
Rocket 22 22 3 19 21 25 20 25 22
Scarole 59 44 20 30 34 90 53 59 49
Shallot 3 3 3 1 3 3 3 5
Spinach 108 95 30 72 93 149 101 124 105
Squashes 12 (1) 11 7 17 (2) 20 (1) 10 15 8
Strawberries 347 116 48 275 (1) 413 (35) 479 338 414 303
Table grape 286 268 (1) 29 192 (1) 320 (17) 467 338 (3) 414 (2) 303 (12)
Cumulative Exposure Assessment of Triazole Pesticides
93 The present document has been produced and adopted by the bodies identified above as author(s). This task has been carried out exclusively by the author(s) in the context of a contract between the European Food Safety Authority and the author(s), awarded following a tender procedure. The present document is published complying with the transparency principle to which the European Food Safety Authority is subject. It may not be considered as an output adopted by EFSA. EFSA reserves its rights, view and position as regards the issues addressed and the conclusions reached in the present document, without prejudice to the rights of the authors.
RAC B
iter
tan
ol
Cy
pro
con
azo
le
Dif
eno
con
azo
le
Flu
sila
zole
My
clob
uta
nil
Pro
pic
on
azo
le
Teb
uco
naz
ole
Tri
adim
efo
n
Tri
adim
eno
l
Tomatoes 619 (1) 651 (1) 211 395 774 1137 730 (1) 967 655 (2)
Walnuts 2 2 1 1 1 7 3 3 2
Watermelon 13 13 2 11 13 25 10 25 22
Wheat 45 6 94 142 60 106 55
Wine 343 (1) 325 12 191 460 (16) 536 (1) 259 572 196
Wine grape 117 87 3 69 101 129 82 115 69 (1)
Total 10803
(17) 10050 (7) 2538 (0) 7314 (4) 11489 (92) 16027 (11) 11128 (66) 13348 (12) 10497 (27)
Percentage
positive 0.16 0.07 0 0.05 0.80 0.07 0.59 0.09 0.26
Table 26 Triazole data the Netherlands, Overview of the number of samples analyzed for different triazoles in
the Netherlands per raw agricultural commodity (RAC), between brackets the number of positive samples.
RAC
Bit
erta
no
l
Cy
pro
con
azo
le
Dif
eno
con
azo
le
Din
ico
azo
le
Ep
ox
icon
azo
le
Flu
sila
zole
My
clo
rbu
tan
il
Pro
pic
on
azo
le
Teb
uco
naz
ole
Tri
adim
efo
n
Tri
adim
eno
l LOR (mg/kg 0.02 0.01 0.02 0.01 0.01 0.01 0.01 0.01 0.01 0.02 0.05
Almond 1 1 1 1 1 1 1 1 1 1 1
Apple 830 794 858
(13) 843 843 843 843 843 843 (1) 830 (1)
830
(16)
Apricot 77 (2) 77 77 (1) 77 77 77 (1) 77 77 77 (9) 77 77 (1)
Artichokes 13 13 13 13 13 13 13 13 13 13 13 (1)
Asperagus 130 127 155 (2) 155 155 155 155 155 155 130 130 (1)
Avocado 128 131 131 131 131 131 131 131 131 128 128
Banana 228 (2) 228 228 228 228 228 228 (3) 228 228 228 228 (2)
Barley 26 26 26 26 26 26 (1) 26 26 26 26 26
Basil 87 87 87 (5) 87 87 87 87 87 (4) 87 87 87

Cumulative Exposure Assessment of Triazole Pesticides
94 The present document has been produced and adopted by the bodies identified above as author(s). This task has been carried out exclusively by the author(s) in the context of a contract between the European Food Safety Authority and the author(s), awarded following a tender procedure. The present document is published complying with the transparency principle to which the European Food Safety Authority is subject. It may not be considered as an output adopted by EFSA. EFSA reserves its rights, view and position as regards the issues addressed and the conclusions reached in the present document, without prejudice to the rights of the authors.
RAC
Bit
erta
no
l
Cy
pro
con
azo
le
Dif
eno
con
azo
le
Din
ico
azo
le
Ep
ox
icon
azo
le
Flu
sila
zole
My
clo
rbu
tan
il
Pro
pic
on
azo
le
Teb
uco
naz
ole
Tri
adim
efo
n
Tri
adim
eno
l
LOR (mg/kg 0.02 0.01 0.02 0.01 0.01 0.01 0.01 0.01 0.01 0.02 0.05
Beans dry 51 51 51 51 51 51 51 51 51 51 51
Beans with pods 18 19 19 (1) 19 (6) 19 19 19 (3) 19 (1) 19 (6) 18 (1) 18 (9)
Beans without
pods (fresh) 35 38 38 (2) 38 38 38 38 38 38 35 35 (1)
Beet leaves 7 7 7 7 7 7 7 7 7 7 7
Beetroot 111 111 111 111 111 111 111 111 111 (1) 111 111
Black pepper 11 11 11 11 11 11 11 11 11 11 11
Blackberries 73 77 77 77 77 77 77 (1) 77 77 73 73 (1)
Bleach celery 141 146 147
(55) 146 146 147 147 147 146 (7) 141 141 (1)
Blue Berry 89 101 102 101 101 101 101 101 101 89 89
Broccoli 266 255 276 (2) 272 272 272 272 272 (2) 272 (1) 266 266
Brussels sprouts 120 123 123 (3) 123 123 (2) 123 123 123 123
(37) 120 120
Buckwheat 1 1 1 1 1 1 1 1 1 1 1
Carambola 20 20 20 20 20 20 20 20 20 20 20 (6)
Carrot 419 435 436
(37) 435 435 (6) 435 435 435
435
(39) 419 419 (1)
Cassava 6 6 6 6 6 6 6 6 6 6 6
Cauliflower 345 338 357 356 356 356 356 356 356 345 345
Celeriac 65 53 72 (10) 72 72 (1) 72 72 72 (2) 72 (2) 65 65
Celery Leaves 104 104 104
(28) 104 104 104 104 104 (1) 104 104 104
Cherry 109 (4) 110 110 110 110 110 110 (2) 110 110
(21) 109 109
Chestnuts 1 1 1 1 1 1 1 1 1 1 1
Chinese cabbage 108 116 116 116 116 116 116 116 116 108 108
Chives 34 34 (1) 34 (1) 34 34 34 34 34 34 (2) 34 (1) 34 (1)
Cinnamon 1 1 1 1 1 1 1 1 1 1 1
Cumulative Exposure Assessment of Triazole Pesticides
95 The present document has been produced and adopted by the bodies identified above as author(s). This task has been carried out exclusively by the author(s) in the context of a contract between the European Food Safety Authority and the author(s), awarded following a tender procedure. The present document is published complying with the transparency principle to which the European Food Safety Authority is subject. It may not be considered as an output adopted by EFSA. EFSA reserves its rights, view and position as regards the issues addressed and the conclusions reached in the present document, without prejudice to the rights of the authors.
RAC
Bit
erta
no
l
Cy
pro
con
azo
le
Dif
eno
con
azo
le
Din
ico
azo
le
Ep
ox
icon
azo
le
Flu
sila
zole
My
clo
rbu
tan
il
Pro
pic
on
azo
le
Teb
uco
naz
ole
Tri
adim
efo
n
Tri
adim
eno
l
LOR (mg/kg 0.02 0.01 0.02 0.01 0.01 0.01 0.01 0.01 0.01 0.02 0.05
Coconut 6 6 6 6 6 6 6 6 6 6 6
Common bean 231 197 242 238 238 238 238 238 238 231 231
Courgette 200 (1) 201 213 211 211 211 211 211 211 200 200 (9)
Cranberry 10 10 10 10 10 10 10 10 10 10 10
Cucumber 649 (3) 559 677 (1) 662 661 662 662 (2) 662 (1) 662 (3) 649 649
(17)
Curly kale 56 59 59 (2) 59 59 59 59 59 59 (3) 56 56
Currants (red,
white, black) 100 (1) 102 111 (2) 102 102 102 102 (1) 102 102 (5) 100
100
(17)
Date 24 24 24 24 24 24 24 (1) 24 24 24 (4) 24 (3)
Dill 27 28 28 28 28 28 (2) 28 28 28 27 27 (1)
Egg plant 166 163 169 167 167 167 167 167 167 (1) 166 166 (1)
Endive 686 703 736 (1) 736 736 736 736 736 736 (1) 686 686
Fennel 43 48 51 (1) 48 48 48 48 48 48 43 43
Fennel fresh 13 14 14 14 14 14 14 14 14 13 13
Fig 54 54 54 54 54 54 54 (1) 54 54 (4) 54 54
Garlic 43 44 44 44 44 44 44 44 44 43 43
Gherkin 11 12 12 12 12 12 12 12 12 11 11
Ginger 35 35 35 35 35 (2) 35 35 35 35 35 35
Gooseberries 3 3 3 3 3 3 3 3 3 3 3 (2)
Grapefruit 140 140 140 140 140 140 140 140 140 140 (4) 140 (4)
Green bean 539 534 546 545 545 545 545 545 545 539 539
Guava 1 1 1 1 1 1 1 1 1 1 1
Hazelnuts 3 3 3 3 3 3 3 3 3 3 3
Head lettuce 1380 1404 1510
(2) 1510 1510 1510 1510 1510
1510
(11) 1380 1380
Hops 1 1 1 1 1 1 1 1 1 1 1
Kiwi 175 178 178 178 178 178 178 178 178 175 175
Cumulative Exposure Assessment of Triazole Pesticides
96 The present document has been produced and adopted by the bodies identified above as author(s). This task has been carried out exclusively by the author(s) in the context of a contract between the European Food Safety Authority and the author(s), awarded following a tender procedure. The present document is published complying with the transparency principle to which the European Food Safety Authority is subject. It may not be considered as an output adopted by EFSA. EFSA reserves its rights, view and position as regards the issues addressed and the conclusions reached in the present document, without prejudice to the rights of the authors.
RAC
Bit
erta
no
l
Cy
pro
con
azo
le
Dif
eno
con
azo
le
Din
ico
azo
le
Ep
ox
icon
azo
le
Flu
sila
zole
My
clo
rbu
tan
il
Pro
pic
on
azo
le
Teb
uco
naz
ole
Tri
adim
efo
n
Tri
adim
eno
l
LOR (mg/kg 0.02 0.01 0.02 0.01 0.01 0.01 0.01 0.01 0.01 0.02 0.05
Kohlrabi 18 20 20 20 20 20 20 20 20 18 18
Kumquats 7 7 7 7 7 7 7 7 7 7 7
Leek 415 412 445 (1) 438 438 (8) 445 444 445 (1) 438
(87) 415 415
Lemon 101 101 101 101 101 101 101 (4) 101 (1) 101 101 101
Lentils 10 10 10 10 10 10 10 10 10 10 10
Lime 69 69 69 69 69 69 69 69 69 (1) 69 69
Lychee 21 21 21 21 21 21 21 21 21 21 21
Maize 41 41 41 41 41 41 41 41 41 41 41
Mandarins 362 362 362 (2) 362 362 362 362 (2) 362 (2) 362 (8) 362 362
Mango 269 268 268 268 268 268 268 268 268 (1) 269 269
Medlar 1 1 1 (1) 1 1 1 1 1 1 1 1
Melon 314 314 (1) 314 (1) 314 314 314 314 (4) 314 314 (1) 314 314
(16)
Mineola 24 24 24 24 24 24 24 24 24 24 24
Mint 31 32 32 32 32 32 (2) 32 32 32 31 31
Mushroom 177 133 183 182 182 182 182 182 182 177 177
Nectarine 227 (8) 228 228 228 (2) 228 228 (3) 228 (3) 228 228
(21) 227 227
Nutmeg 1 1 1 1 1 1 1 1 1 1 1
Oats 2 2 2 2 2 2 2 2 2 2 2
Okra 118 118 118 118 118 118 118 118 118 118 118
Onion 356 364 364 (1) 364 364 (2) 364 364 364 364 (4) 356 356 (2)
Orange 680 680 680 680 680 680 680 (7) 680 680 680 680
Oregano 5 5 5 5 5 5 5 5 5 5 5
Oriental pear 1 1 1 1 1 1 1 1 1 1 1
Other herbs fresh 33 33 33 33 33 33 33 33 33 (1) 33 33
Pac choi 96 97 97 97 97 97 97 97 97 96 (1) 96 (1)

Cumulative Exposure Assessment of Triazole Pesticides
97 The present document has been produced and adopted by the bodies identified above as author(s). This task has been carried out exclusively by the author(s) in the context of a contract between the European Food Safety Authority and the author(s), awarded following a tender procedure. The present document is published complying with the transparency principle to which the European Food Safety Authority is subject. It may not be considered as an output adopted by EFSA. EFSA reserves its rights, view and position as regards the issues addressed and the conclusions reached in the present document, without prejudice to the rights of the authors.
RAC
Bit
erta
no
l
Cy
pro
con
azo
le
Dif
eno
con
azo
le
Din
ico
azo
le
Ep
ox
icon
azo
le
Flu
sila
zole
My
clo
rbu
tan
il
Pro
pic
on
azo
le
Teb
uco
naz
ole
Tri
adim
efo
n
Tri
adim
eno
l
LOR (mg/kg 0.02 0.01 0.02 0.01 0.01 0.01 0.01 0.01 0.01 0.02 0.05
Papaya 68 68 68 (2) 68 68 68 68 68 68 (2) 68 68 (1)
Parsley 151 (1) 148 (5) 148
(19) 148 148 (1) 148 148 148 (1) 148 (1) 151 151 (1)
Parsnips 5 5 5 5 5 5 5 5 5 5 5
Passion fruit 94 (1) 94 (3) 94 (4) 94 94 94 (2) 94 94 94 94 94
Peach 185 (7) 185 185 (2) 185 185 185 (1) 185 (3) 185 185
(23) 185 185
Pear 617 550 628
(15) 621 621 621 621 621 (1) 621 (5) 616 617
Peas (fresh) 98 98 98 98 98 98 98 98 98 98 98 (1)
Peas with pods 288 289 (3) 289 (8) 289 (1) 289 (1) 289 289 289 289
(60) 288
288
(11)
Peppers 485 484 (4) 486 (4) 484 (1) 484 484 (5) 484 (8) 484
(21) 484 (4) 485
485
(11)
Persimmon 35 35 35 35 35 35 35 35 35 35 35
Pineapple 129 129 129 129 129 129 129 129 129 129
(89)
129
(89)
Plantain 5 5 5 5 5 5 5 5 5 5 5
Plum 191 (2) 190 191 191 191 191 191 191 191 (7) 191 191 (1)
Pointed head
cabbage 117 121 121 121 121 121 121 121 121 (1) 117 117
Pomegranate 41 41 41 (1) 41 41 41 41 41 (1) 41 41 41
Pomelo 6 6 6 6 6 6 6 6 6 6 6
Potato 289 294 294 294 294 294 294 294 294 289 289
Pumpkin 23 23 23 23 23 23 23 23 23 23 23
Purslane 17 17 17 17 17 17 17 17 17 17 17
Quinces 5 5 5 5 5 5 5 5 5 5 5
Radicchio Rosso 223 225 225 225 225 225 225 225 225 223 223
Radish 103 98 115 114 114 114 114 114 114 103 103
Cumulative Exposure Assessment of Triazole Pesticides
98 The present document has been produced and adopted by the bodies identified above as author(s). This task has been carried out exclusively by the author(s) in the context of a contract between the European Food Safety Authority and the author(s), awarded following a tender procedure. The present document is published complying with the transparency principle to which the European Food Safety Authority is subject. It may not be considered as an output adopted by EFSA. EFSA reserves its rights, view and position as regards the issues addressed and the conclusions reached in the present document, without prejudice to the rights of the authors.
RAC
Bit
erta
no
l
Cy
pro
con
azo
le
Dif
eno
con
azo
le
Din
ico
azo
le
Ep
ox
icon
azo
le
Flu
sila
zole
My
clo
rbu
tan
il
Pro
pic
on
azo
le
Teb
uco
naz
ole
Tri
adim
efo
n
Tri
adim
eno
l
LOR (mg/kg 0.02 0.01 0.02 0.01 0.01 0.01 0.01 0.01 0.01 0.02 0.05
Raisins 61 61 61 61 61 61 61 (2) 61 61 61 61 (2)
Rambutan 7 7 7 7 7 7 7 7 7 7 7
Raspberry 101 103 103 103 103 103 103 (2) 103 103 101 101 (2)
Red cabbage 133 136 136 136 136 (1) 136 136 136 136 (4) 133 133
Rettich 15 15 16 16 16 16 16 16 16 15 15
Rhubarb 46 52 52 52 52 52 52 52 52 46 46
Rice 69 69 69 69 69 69 69 69 69 69 69
Roodlof 3 2 2 2 2 2 2 2 2 3 3
Rosemary 27 (2) 27 27 27 27 27 27 (1) 27 (2) 27 (1) 27 27
Rucola 99 100 100 100 100 100 100 100 100 99 99 (4)
Rye 11 11 11 11 11 11 11 11 11 11 11
Sage 4 4 4 4 4 4 4 (1) 4 4 4 4
Salsify 5 8 8 8 8 8 8 8 8 5 5
Savoy cabbage 53 55 55 (6) 55 55 55 55 55 55 (1) 53 53
Sesame seed 30 30 30 30 30 30 30 30 30 30 30
Shallot 26 26 26 26 26 26 26 26 26 26 26
Spinach 446 438 458 458 458 458 458 458 (1) 458 446 446
Spring onion 8 8 8 8 8 8 8 8 8 8 8
Strawberry 1119
(1)
1062
(11)
1213
(1) 1146 1146
1145
(2)
1145
(69) 1146 1146 1118
1119
(68)
String bean 163 (7) 163 163 (6) 163 163 163 163 (1) 163 (1) 163 (1) 163 163 (5)
Swedes 18 18 18 18 18 18 18 18 18 18 18
Sweet corn 29 31 31 31 31 31 31 31 31 29 29
Sweet pepper 1065 1021
(20)
1115
(2)
1094
(5) 1094
1094
(4)
1094
(32) 1094
1094
(75) 1065
1065
(105)
Sweet potato 5 5 5 5 5 5 5 5 5 5 5
Table grape 1171 1172
(19)
1172
(10)
1172
(16) 1172
1172
(37)
1172
(200) 1172
1172
(101)
1172
(9)
1172
(236)

Cumulative Exposure Assessment of Triazole Pesticides
99 The present document has been produced and adopted by the bodies identified above as author(s). This task has been carried out exclusively by the author(s) in the context of a contract between the European Food Safety Authority and the author(s), awarded following a tender procedure. The present document is published complying with the transparency principle to which the European Food Safety Authority is subject. It may not be considered as an output adopted by EFSA. EFSA reserves its rights, view and position as regards the issues addressed and the conclusions reached in the present document, without prejudice to the rights of the authors.
RAC
Bit
erta
no
l
Cy
pro
con
azo
le
Dif
eno
con
azo
le
Din
ico
azo
le
Ep
ox
icon
azo
le
Flu
sila
zole
My
clo
rbu
tan
il
Pro
pic
on
azo
le
Teb
uco
naz
ole
Tri
adim
efo
n
Tri
adim
eno
l
LOR (mg/kg 0.02 0.01 0.02 0.01 0.01 0.01 0.01 0.01 0.01 0.02 0.05
Tamarind 3 3 3 3 3 3 3 3 3 3 3
Tea 86 86 86 (1) 86 86 86 (1) 86 86 86 (1) 86 86 (4)
Thyme 28 28 28 28 28 28 28 28 28 28 28
Tomato 1026
(20) 945 (2)
1086
(1) 1063 1063 1063
1063
(2) 1063
1063
(43) 1026
1026
(68)
Walnuts 2 2 2 2 2 2 2 2 2 2 2
Water cress 13 14 14 14 14 14 14 14 14 13 13
Watermelon 25 25 25 25 25 25 25 25 25 25 25
Wheat 118 118 118 118 118 118 118 118 118 118 118
White cabbage 107 109 109 109 109 109 109 109 109 (1) 107 107
Wine, alcohol >
9% 247 247 247 247 247 247 247 (1) 247 247 (6) 247 247 (8)
Winter cress 1 1 1 1 1 1 1 1 1 1 1
Witloof, Chicory 181 166 197 186 186 186 186 186 (1) 186 181 181
Total 21356
(61)
20987
(69)
22104
(257)
21905
(36)
21904
(24)
21912
(61)
21907
(354)
21913
(44)
21796
(605)
21355
(109)
21357
(625)
Percentage
positive 0.29 0.33 1.16 0.16 0.11 0.28 1.62 0.2 2.78 0.51 2.9
Table 27 Triazole data Sweden, Overview of the number of samples analyzed for different triazoles in Sweden
per raw agricultural commodity (RAC), between brackets the number of positive samples.
RAC
Bit
erta
no
l
Cy
pro
con
azo
le
Ep
ox
yco
nao
le
Flu
sila
zole
My
clob
uta
nil
Pro
pic
on
azo
le
Teb
uco
naz
ole
Tri
adim
efo
n
Tri
adim
eno
l
LOR (mg/kg) 0.01 0.01 0.01 0.01-0.02 0.01-0.02 0.01-0.05 0.01 0.01-0.1 0.01-0.2
Apples 841 (15) 135 135 841 841 (2) 841 445 706 841 (1)
Apricots 7 7 7 7 2 (1) 7 7
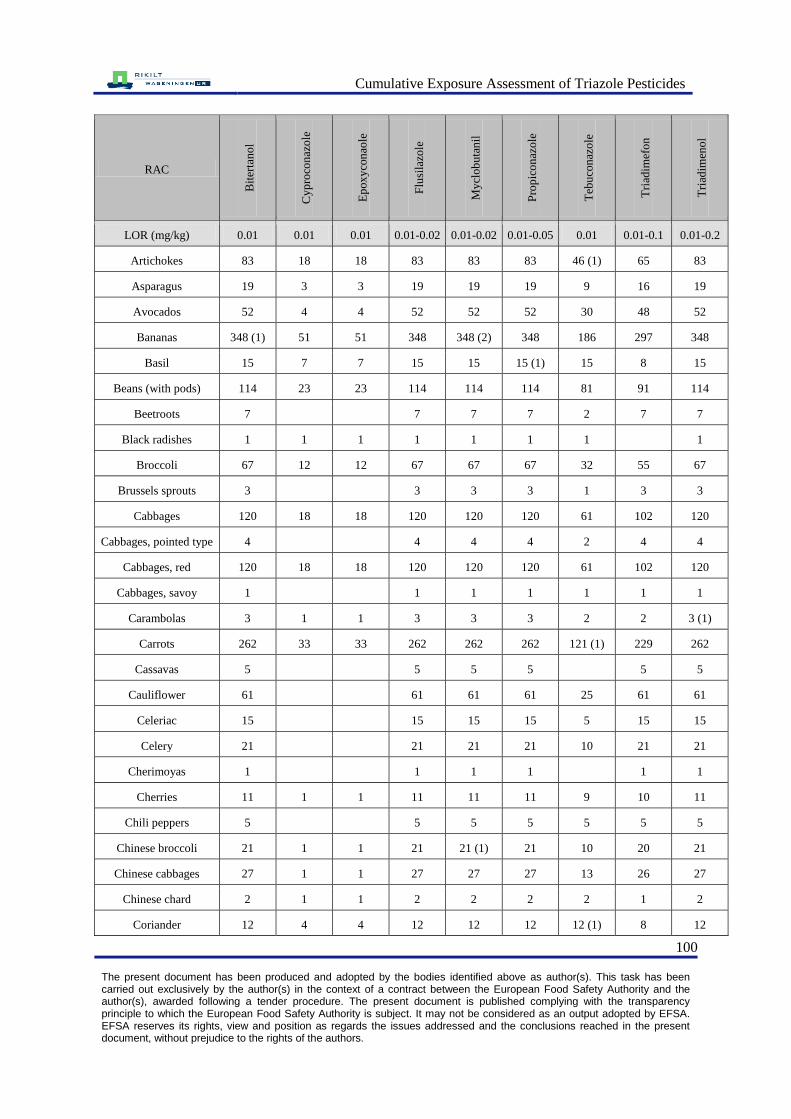
Cumulative Exposure Assessment of Triazole Pesticides
100 The present document has been produced and adopted by the bodies identified above as author(s). This task has been carried out exclusively by the author(s) in the context of a contract between the European Food Safety Authority and the author(s), awarded following a tender procedure. The present document is published complying with the transparency principle to which the European Food Safety Authority is subject. It may not be considered as an output adopted by EFSA. EFSA reserves its rights, view and position as regards the issues addressed and the conclusions reached in the present document, without prejudice to the rights of the authors.
RAC
Bit
erta
no
l
Cy
pro
con
azo
le
Ep
ox
yco
nao
le
Flu
sila
zole
My
clob
uta
nil
Pro
pic
on
azo
le
Teb
uco
naz
ole
Tri
adim
efo
n
Tri
adim
eno
l
LOR (mg/kg) 0.01 0.01 0.01 0.01-0.02 0.01-0.02 0.01-0.05 0.01 0.01-0.1 0.01-0.2
Artichokes 83 18 18 83 83 83 46 (1) 65 83
Asparagus 19 3 3 19 19 19 9 16 19
Avocados 52 4 4 52 52 52 30 48 52
Bananas 348 (1) 51 51 348 348 (2) 348 186 297 348
Basil 15 7 7 15 15 15 (1) 15 8 15
Beans (with pods) 114 23 23 114 114 114 81 91 114
Beetroots 7 7 7 7 2 7 7
Black radishes 1 1 1 1 1 1 1 1
Broccoli 67 12 12 67 67 67 32 55 67
Brussels sprouts 3 3 3 3 1 3 3
Cabbages 120 18 18 120 120 120 61 102 120
Cabbages, pointed type 4 4 4 4 2 4 4
Cabbages, red 120 18 18 120 120 120 61 102 120
Cabbages, savoy 1 1 1 1 1 1 1
Carambolas 3 1 1 3 3 3 2 2 3 (1)
Carrots 262 33 33 262 262 262 121 (1) 229 262
Cassavas 5 5 5 5 5 5
Cauliflower 61 61 61 61 25 61 61
Celeriac 15 15 15 15 5 15 15
Celery 21 21 21 21 10 21 21
Cherimoyas 1 1 1 1 1 1
Cherries 11 1 1 11 11 11 9 10 11
Chili peppers 5 5 5 5 5 5 5
Chinese broccoli 21 1 1 21 21 (1) 21 10 20 21
Chinese cabbages 27 1 1 27 27 27 13 26 27
Chinese chard 2 1 1 2 2 2 2 1 2
Coriander 12 4 4 12 12 12 12 (1) 8 12

Cumulative Exposure Assessment of Triazole Pesticides
101 The present document has been produced and adopted by the bodies identified above as author(s). This task has been carried out exclusively by the author(s) in the context of a contract between the European Food Safety Authority and the author(s), awarded following a tender procedure. The present document is published complying with the transparency principle to which the European Food Safety Authority is subject. It may not be considered as an output adopted by EFSA. EFSA reserves its rights, view and position as regards the issues addressed and the conclusions reached in the present document, without prejudice to the rights of the authors.
RAC
Bit
erta
no
l
Cy
pro
con
azo
le
Ep
ox
yco
nao
le
Flu
sila
zole
My
clob
uta
nil
Pro
pic
on
azo
le
Teb
uco
naz
ole
Tri
adim
efo
n
Tri
adim
eno
l
LOR (mg/kg) 0.01 0.01 0.01 0.01-0.02 0.01-0.02 0.01-0.05 0.01 0.01-0.1 0.01-0.2
Corn salad 1 1 1 1 1 1 1
Courgettes 62 11 11 62 62 62 26 51 62 (2)
Cucumbers 296 30 30 296 296 (1) 296 140 266 296 (3)
Cucumbers, other 296 30 30 296 296 296 140 266 296
Dates 1 1 1 1 1 1
Dill 12 2 2 12 12 12 2 10 12
Egg plants 83 18 18 83 83 83 46 (1) 65 83
Fennel 6 1 1 6 6 6 5 5 6
Figs 35 35 35 35 20 35 35
Garlic 14 14 14 14 6 14 14
Grapefruits 43 12 12 43 43 43 32 31 43
Ground cherries 11 1 1 11 11 11 4 10 11
Jerusalem artichokes 3 1 1 3 3 3 2 2 3
Kiwi fruits 99 21 21 99 99 99 61 78 99
Kohlrabies 4 1 1 4 4 4 3 3 4
Kumquatss 16 16 16 16 5 16 16
Leeks 121 20 20 (1) 121 121 121 56 101 121
Lemons 50 1 1 50 50 50 28 (9) 49 50
Lettuce, head 260 28 28 260 260 260 110 232 260
Lettuce, iceberg 260 28 28 260 260 260 110 (1) 232 260
Lettuce, others 260 28 28 260 260 260 110 232 260
Limes 24 2 2 24 24 24 12 22 24
Lychees 32 1 1 32 32 32 21 31 32
Longan 1 1 (1) 1 1 1 1 1 1
Mandarins 315 59 59 315 315 315 181 (1) 256 315
Mangoes 77 17 17 77 77 77 47 60 77
Mangostan 1 1 1 1 1 1 1
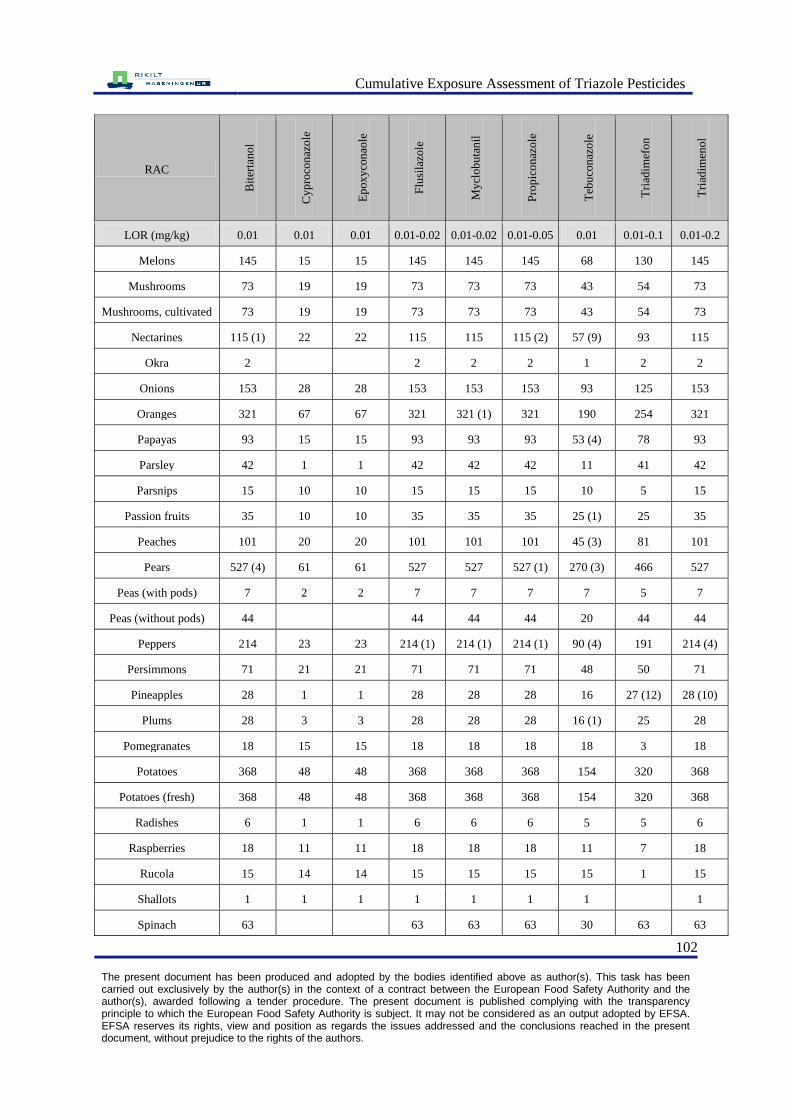
Cumulative Exposure Assessment of Triazole Pesticides
102 The present document has been produced and adopted by the bodies identified above as author(s). This task has been carried out exclusively by the author(s) in the context of a contract between the European Food Safety Authority and the author(s), awarded following a tender procedure. The present document is published complying with the transparency principle to which the European Food Safety Authority is subject. It may not be considered as an output adopted by EFSA. EFSA reserves its rights, view and position as regards the issues addressed and the conclusions reached in the present document, without prejudice to the rights of the authors.
RAC
Bit
erta
no
l
Cy
pro
con
azo
le
Ep
ox
yco
nao
le
Flu
sila
zole
My
clob
uta
nil
Pro
pic
on
azo
le
Teb
uco
naz
ole
Tri
adim
efo
n
Tri
adim
eno
l
LOR (mg/kg) 0.01 0.01 0.01 0.01-0.02 0.01-0.02 0.01-0.05 0.01 0.01-0.1 0.01-0.2
Melons 145 15 15 145 145 145 68 130 145
Mushrooms 73 19 19 73 73 73 43 54 73
Mushrooms, cultivated 73 19 19 73 73 73 43 54 73
Nectarines 115 (1) 22 22 115 115 115 (2) 57 (9) 93 115
Okra 2 2 2 2 1 2 2
Onions 153 28 28 153 153 153 93 125 153
Oranges 321 67 67 321 321 (1) 321 190 254 321
Papayas 93 15 15 93 93 93 53 (4) 78 93
Parsley 42 1 1 42 42 42 11 41 42
Parsnips 15 10 10 15 15 15 10 5 15
Passion fruits 35 10 10 35 35 35 25 (1) 25 35
Peaches 101 20 20 101 101 101 45 (3) 81 101
Pears 527 (4) 61 61 527 527 527 (1) 270 (3) 466 527
Peas (with pods) 7 2 2 7 7 7 7 5 7
Peas (without pods) 44 44 44 44 20 44 44
Peppers 214 23 23 214 (1) 214 (1) 214 (1) 90 (4) 191 214 (4)
Persimmons 71 21 21 71 71 71 48 50 71
Pineapples 28 1 1 28 28 28 16 27 (12) 28 (10)
Plums 28 3 3 28 28 28 16 (1) 25 28
Pomegranates 18 15 15 18 18 18 18 3 18
Potatoes 368 48 48 368 368 368 154 320 368
Potatoes (fresh) 368 48 48 368 368 368 154 320 368
Radishes 6 1 1 6 6 6 5 5 6
Raspberries 18 11 11 18 18 18 11 7 18
Rucola 15 14 14 15 15 15 15 1 15
Shallots 1 1 1 1 1 1 1 1
Spinach 63 63 63 63 30 63 63

Cumulative Exposure Assessment of Triazole Pesticides
103 The present document has been produced and adopted by the bodies identified above as author(s). This task has been carried out exclusively by the author(s) in the context of a contract between the European Food Safety Authority and the author(s), awarded following a tender procedure. The present document is published complying with the transparency principle to which the European Food Safety Authority is subject. It may not be considered as an output adopted by EFSA. EFSA reserves its rights, view and position as regards the issues addressed and the conclusions reached in the present document, without prejudice to the rights of the authors.
RAC
Bit
erta
no
l
Cy
pro
con
azo
le
Ep
ox
yco
nao
le
Flu
sila
zole
My
clob
uta
nil
Pro
pic
on
azo
le
Teb
uco
naz
ole
Tri
adim
efo
n
Tri
adim
eno
l
LOR (mg/kg) 0.01 0.01 0.01 0.01-0.02 0.01-0.02 0.01-0.05 0.01 0.01-0.1 0.01-0.2
Spring onions 17 9 9 17 17 17 13 8 17
Strawberries 228 30 30 228 228 228 (6) 110 198 228
Swedish turnips 12 12 12 12 5 12 12
Sweet corn (cobs) 2 1 1 2 2 2 2 1 2
Sweet potatoes 26 10 10 26 26 26 20 16 26
Swiss chard 2 1 1 2 2 2 2 1 2
Table grapes 497 79 79 497 (5) 497 497 (33) 279 (18) 418 497 (23)
Tomatoes 322 (3) 49 49 322 (2) 322 322 162 (1) 273 322 (3)
Water spinach 8 2 2 8 8 8 5 6 8
Watermelons 21 21 21 21 21 21
Wine grapes 1 1 1 1 1 1 1 1
Total 8711 (24) 1302 (1) 1302 (1) 8711 (8) 8711 (8) 8711 (44) 4452 (60) 7409 (12) 8711 (47)
Percentage positive 0.28 0.08 0.08 0.09 0.09 0.51 1.35 0.16 0.54
Table 28 Triazole data United Kingdom, Overview of the number of samples analyzed for different triazoles
in the United Kingdom per raw agricultural commodity (RAC), between brackets the number of positive samples.
RAC
Bit
erta
no
l
Cy
pro
con
azo
le
Dif
eno
con
azo
le
Flu
sila
zole
My
clob
uta
nil
Pro
pic
on
azo
le
Teb
uco
naz
ole
Tri
adim
efo
n
Tri
adim
eno
l
LOR (mg/kg) 0.02-0.05 0.02 0.01-0.05 0.01-0.05 0.01-0.05 0.01-0.05 0.01-0.05 0.02-0.05 0.02-0.05
Apple 185 82 838 838 941 (6) 838 838 838 82
Asparagus 95 95 95 95
Banana 259 (48) 19 19 19 188 28 95 28 28
Bleach celery 47 47 47 ( 12) 47 47 47 47 47 47
Blue berry 49 49 49 49 49
Broccoli 96 96 96 96 96

Cumulative Exposure Assessment of Triazole Pesticides
104 The present document has been produced and adopted by the bodies identified above as author(s). This task has been carried out exclusively by the author(s) in the context of a contract between the European Food Safety Authority and the author(s), awarded following a tender procedure. The present document is published complying with the transparency principle to which the European Food Safety Authority is subject. It may not be considered as an output adopted by EFSA. EFSA reserves its rights, view and position as regards the issues addressed and the conclusions reached in the present document, without prejudice to the rights of the authors.
RAC
Bit
erta
no
l
Cy
pro
con
azo
le
Dif
eno
con
azo
le
Flu
sila
zole
My
clob
uta
nil
Pro
pic
on
azo
le
Teb
uco
naz
ole
Tri
adim
efo
n
Tri
adim
eno
l
LOR (mg/kg) 0.02-0.05 0.02 0.01-0.05 0.01-0.05 0.01-0.05 0.01-0.05 0.01-0.05 0.02-0.05 0.02-0.05
Carrot 37 18 18 18 317 429 18 (2) 189 189
Cauliflower 96 96 96 96
Cherry 70 142 72 142 (12) 143 (1) 142 (16) 70 70
Courgette 95 95 95 95 95 47 48
Cucumber 3 3 3 110 110 110 110 110 110
Egg plant 35 35 35 35 131 35 131 131 131
French bean 94 94 94 94 94 94 94 94 (1)
Garlic 48 48 48 48
Grapefruit 72 72
Kiwi 48 48 144 48 144 144 48 48 48
Leek 37 37 37 37 109 109 109 37 37
Lemon 72 72 (1)
Lettuce 71 71 501 (6) 178 501 501 501 (9) 394 394 (1)
Lychee 26 10 26 10 26 26 10 26 26
Mandarine, clementine 296 62 62 62 296 62 62 (1) 62 62
Mango 96 96 96 96 96
Mushroom 48 48 48 48
Nectarine 47 (1) 47 47 47 47 47 (1) 47 (2) 47 47
Onion 48 48 48 48
Orange 72 72 72 72
Papaya 32 32 32 32 32 32
Passion fruit 87 27 87 (5) 27 87 87 27 (1) 75 87
Pea (fresh) 120 120 (3) 120 120 (3)
Peach 30 (4) 30 30 30 30 30 (1) 30 (3) 30 30
Pear 123 46 46 46 679 46 854 (1) 458 458
Pepper 73 73 (1) 73 73 145 145 145 (1) 145 145 (2)
Pineapple 60 60 60 60 (32)
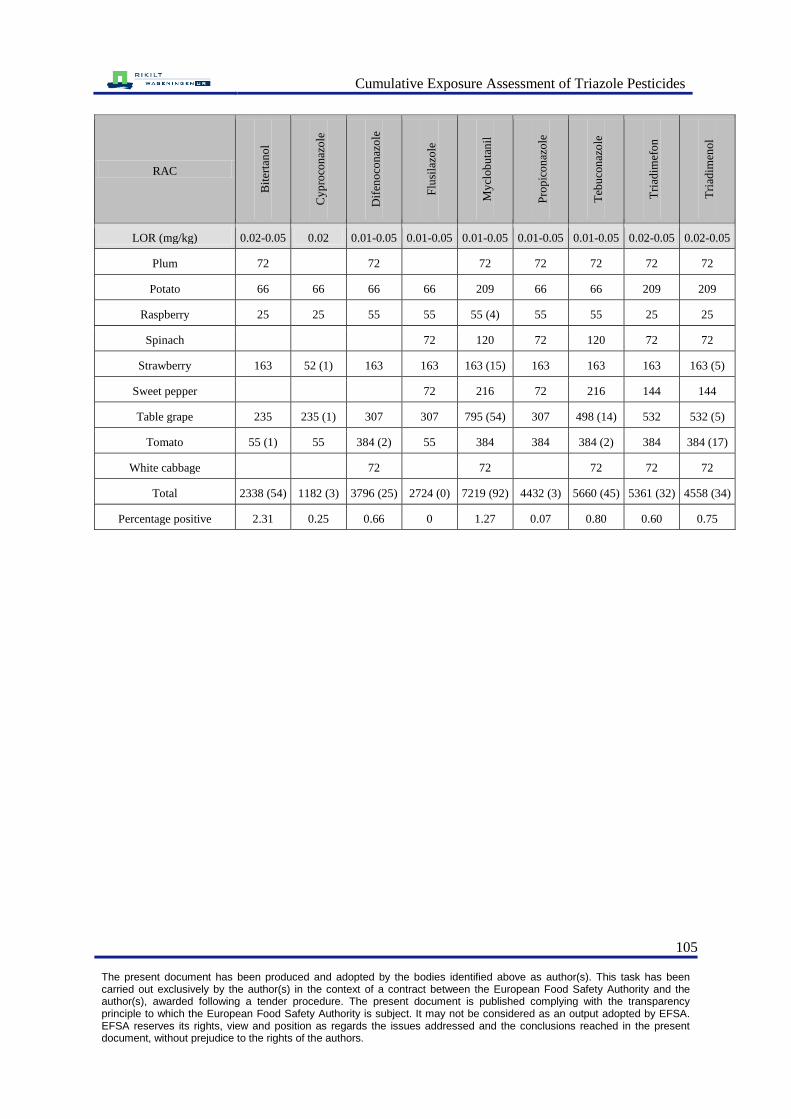
Cumulative Exposure Assessment of Triazole Pesticides
105 The present document has been produced and adopted by the bodies identified above as author(s). This task has been carried out exclusively by the author(s) in the context of a contract between the European Food Safety Authority and the author(s), awarded following a tender procedure. The present document is published complying with the transparency principle to which the European Food Safety Authority is subject. It may not be considered as an output adopted by EFSA. EFSA reserves its rights, view and position as regards the issues addressed and the conclusions reached in the present document, without prejudice to the rights of the authors.
RAC
Bit
erta
no
l
Cy
pro
con
azo
le
Dif
eno
con
azo
le
Flu
sila
zole
My
clob
uta
nil
Pro
pic
on
azo
le
Teb
uco
naz
ole
Tri
adim
efo
n
Tri
adim
eno
l
LOR (mg/kg) 0.02-0.05 0.02 0.01-0.05 0.01-0.05 0.01-0.05 0.01-0.05 0.01-0.05 0.02-0.05 0.02-0.05
Plum 72 72 72 72 72 72 72
Potato 66 66 66 66 209 66 66 209 209
Raspberry 25 25 55 55 55 (4) 55 55 25 25
Spinach 72 120 72 120 72 72
Strawberry 163 52 (1) 163 163 163 (15) 163 163 163 163 (5)
Sweet pepper 72 216 72 216 144 144
Table grape 235 235 (1) 307 307 795 (54) 307 498 (14) 532 532 (5)
Tomato 55 (1) 55 384 (2) 55 384 384 384 (2) 384 384 (17)
White cabbage 72 72 72 72 72
Total 2338 (54) 1182 (3) 3796 (25) 2724 (0) 7219 (92) 4432 (3) 5660 (45) 5361 (32) 4558 (34)
Percentage positive 2.31 0.25 0.66 0 1.27 0.07 0.80 0.60 0.75
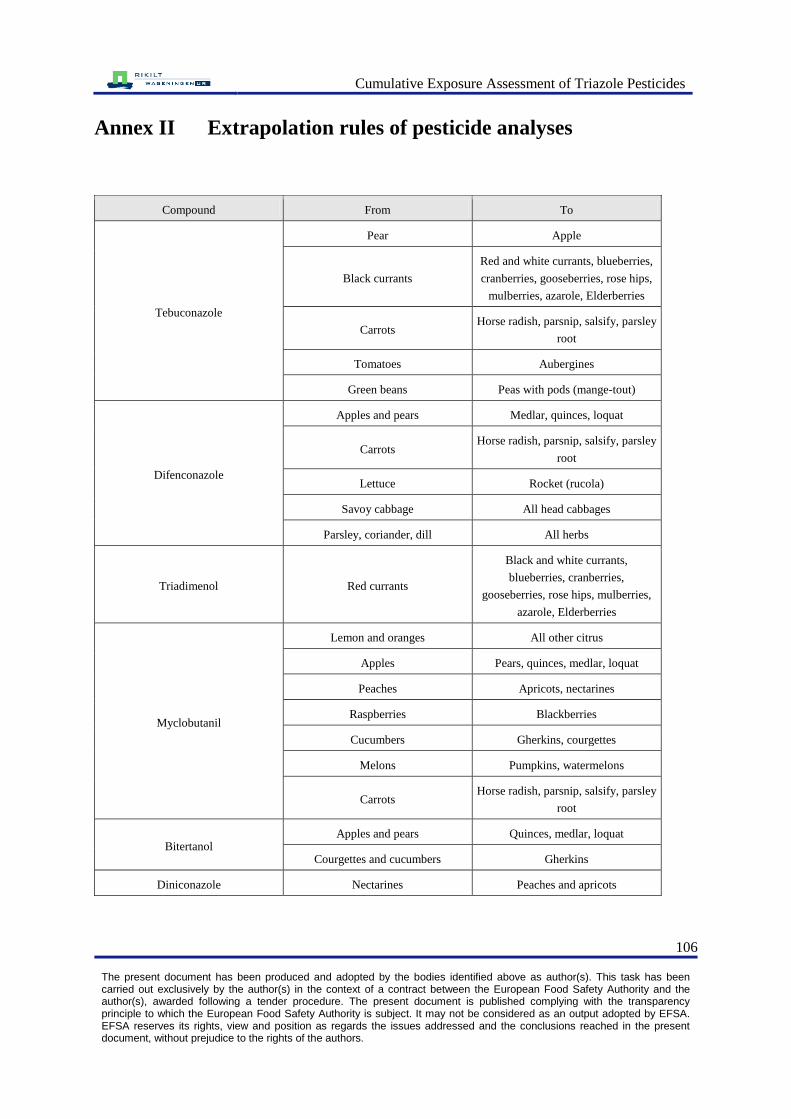
Cumulative Exposure Assessment of Triazole Pesticides
106 The present document has been produced and adopted by the bodies identified above as author(s). This task has been carried out exclusively by the author(s) in the context of a contract between the European Food Safety Authority and the author(s), awarded following a tender procedure. The present document is published complying with the transparency principle to which the European Food Safety Authority is subject. It may not be considered as an output adopted by EFSA. EFSA reserves its rights, view and position as regards the issues addressed and the conclusions reached in the present document, without prejudice to the rights of the authors.
Annex II Extrapolation rules of pesticide analyses
Compound From To
Tebuconazole
Pear Apple
Black currants
Red and white currants, blueberries,
cranberries, gooseberries, rose hips,
mulberries, azarole, Elderberries
Carrots Horse radish, parsnip, salsify, parsley
root
Tomatoes Aubergines
Green beans Peas with pods (mange-tout)
Difenconazole
Apples and pears Medlar, quinces, loquat
Carrots Horse radish, parsnip, salsify, parsley
root
Lettuce Rocket (rucola)
Savoy cabbage All head cabbages
Parsley, coriander, dill All herbs
Triadimenol Red currants
Black and white currants,
blueberries, cranberries,
gooseberries, rose hips, mulberries,
azarole, Elderberries
Myclobutanil
Lemon and oranges All other citrus
Apples Pears, quinces, medlar, loquat
Peaches Apricots, nectarines
Raspberries Blackberries
Cucumbers Gherkins, courgettes
Melons Pumpkins, watermelons
Carrots Horse radish, parsnip, salsify, parsley
root
Bitertanol Apples and pears Quinces, medlar, loquat
Courgettes and cucumbers Gherkins
Diniconazole Nectarines Peaches and apricots
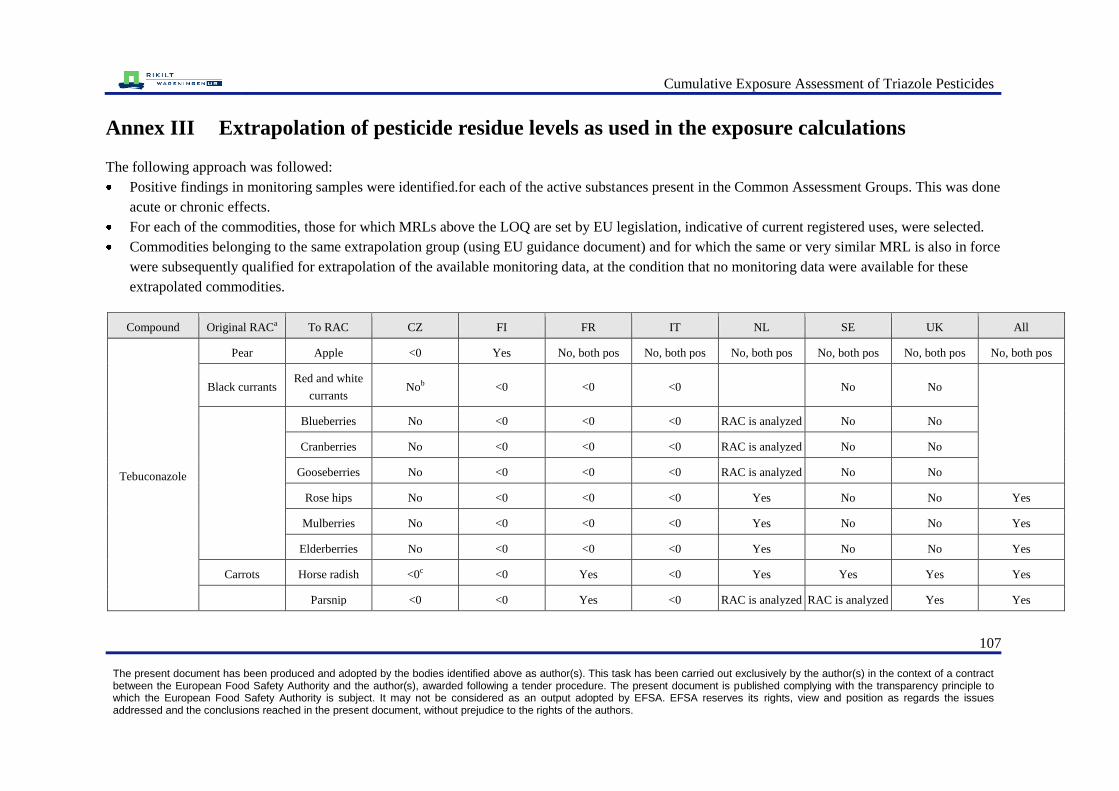
Cumulative Exposure Assessment of Triazole Pesticides
107
The present document has been produced and adopted by the bodies identified above as author(s). This task has been carried out exclusively by the author(s) in the context of a contract between the European Food Safety Authority and the author(s), awarded following a tender procedure. The present document is published complying with the transparency principle to which the European Food Safety Authority is subject. It may not be considered as an output adopted by EFSA. EFSA reserves its rights, view and position as regards the issues addressed and the conclusions reached in the present document, without prejudice to the rights of the authors.
Annex III Extrapolation of pesticide residue levels as used in the exposure calculations
The following approach was followed:
Positive findings in monitoring samples were identified.for each of the active substances present in the Common Assessment Groups. This was done
acute or chronic effects.
For each of the commodities, those for which MRLs above the LOQ are set by EU legislation, indicative of current registered uses, were selected.
Commodities belonging to the same extrapolation group (using EU guidance document) and for which the same or very similar MRL is also in force
were subsequently qualified for extrapolation of the available monitoring data, at the condition that no monitoring data were available for these
extrapolated commodities.
Compound Original RACa To RAC CZ FI FR IT NL SE UK All
Tebuconazole
Pear Apple <0 Yes No, both pos No, both pos No, both pos No, both pos No, both pos No, both pos
Black currants Red and white
currants Nob <0 <0 <0 No No
Blueberries No <0 <0 <0 RAC is analyzed No No
Cranberries No <0 <0 <0 RAC is analyzed No No
Gooseberries No <0 <0 <0 RAC is analyzed No No
Rose hips No <0 <0 <0 Yes No No Yes
Mulberries No <0 <0 <0 Yes No No Yes
Elderberries No <0 <0 <0 Yes No No Yes
Carrots Horse radish <0c <0 Yes <0 Yes Yes Yes Yes
Parsnip <0 <0 Yes <0 RAC is analyzed RAC is analyzed Yes Yes
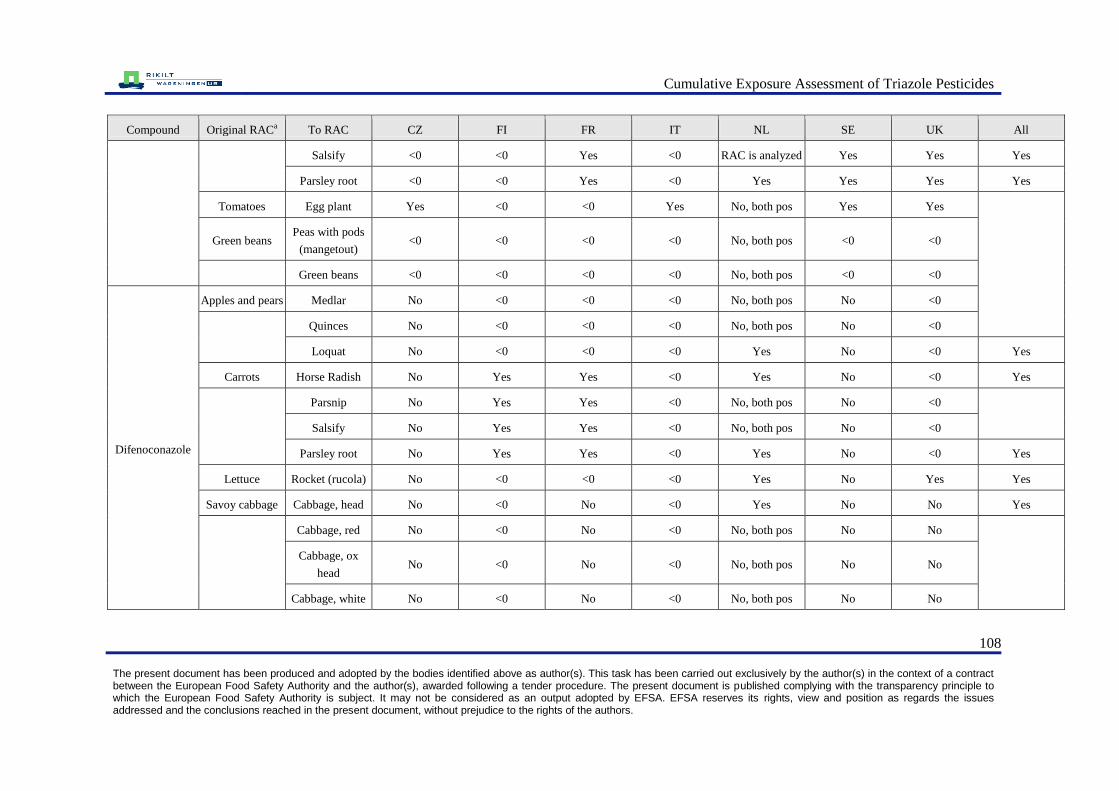
Cumulative Exposure Assessment of Triazole Pesticides
108
The present document has been produced and adopted by the bodies identified above as author(s). This task has been carried out exclusively by the author(s) in the context of a contract between the European Food Safety Authority and the author(s), awarded following a tender procedure. The present document is published complying with the transparency principle to which the European Food Safety Authority is subject. It may not be considered as an output adopted by EFSA. EFSA reserves its rights, view and position as regards the issues addressed and the conclusions reached in the present document, without prejudice to the rights of the authors.
Compound Original RACa To RAC CZ FI FR IT NL SE UK All
Salsify <0 <0 Yes <0 RAC is analyzed Yes Yes Yes
Parsley root <0 <0 Yes <0 Yes Yes Yes Yes
Tomatoes Egg plant Yes <0 <0 Yes No, both pos Yes Yes
Green beans Peas with pods
(mangetout) <0 <0 <0 <0 No, both pos <0 <0
Green beans <0 <0 <0 <0 No, both pos <0 <0
Difenoconazole
Apples and pears Medlar No <0 <0 <0 No, both pos No <0
Quinces No <0 <0 <0 No, both pos No <0
Loquat No <0 <0 <0 Yes No <0 Yes
Carrots Horse Radish No Yes Yes <0 Yes No <0 Yes
Parsnip No Yes Yes <0 No, both pos No <0
Salsify No Yes Yes <0 No, both pos No <0
Parsley root No Yes Yes <0 Yes No <0 Yes
Lettuce Rocket (rucola) No <0 <0 <0 Yes No Yes Yes
Savoy cabbage Cabbage, head No <0 No <0 Yes No No Yes
Cabbage, red No <0 No <0 No, both pos No No
Cabbage, ox
head No <0 No <0 No, both pos No No
Cabbage, white No <0 No <0 No, both pos No No

Cumulative Exposure Assessment of Triazole Pesticides
109
The present document has been produced and adopted by the bodies identified above as author(s). This task has been carried out exclusively by the author(s) in the context of a contract between the European Food Safety Authority and the author(s), awarded following a tender procedure. The present document is published complying with the transparency principle to which the European Food Safety Authority is subject. It may not be considered as an output adopted by EFSA. EFSA reserves its rights, view and position as regards the issues addressed and the conclusions reached in the present document, without prejudice to the rights of the authors.
Compound Original RACa To RAC CZ FI FR IT NL SE UK All
Parsley,
coriander, dill All herbs No Yes Yesd <0 Yesd No No No
Triadimenol
Red currants Black and white
currants No <0 <0 <0 No, both pos No No
Blueberries No <0 <0 <0 No, both pos No No
Cranberries No <0 <0 <0 No, both pos No No
Gooseberries No <0 <0 <0 No, both pos No No
Rose hips No <0 <0 <0 Yes No No Yes
Mulberries No <0 <0 <0 Yes No No Yes
Elderberries No <0 <0 <0 Yes No No Yes
Myclobutanil
Lemon and
oranges All other citrus <0 <0 Yese Yese Yese No No No
Apples Pears <0 <0 <0 No, both pos No, both pos No, both pos No, both pos
Medlar <0 <0 <0 Yes <0 Yes Yes Yes
Quinces <0 <0 <0 Yes <0 Yes Yes Yes
Loquat <0 <0 <0 Yes <0 Yes Yes Yes
Peaches Apricots <0 <0 <0 No, both pos No, both pos No, both pos <0
Nectarines <0 <0 <0 Yes No, both pos No, both pos <0
Raspberries Blackberries No <0 <0 <0 No, both pos <0 Yes
Cucumbers Gherkins <0 Yes Yes <0 No, both pos Yes <0

Cumulative Exposure Assessment of Triazole Pesticides
110
The present document has been produced and adopted by the bodies identified above as author(s). This task has been carried out exclusively by the author(s) in the context of a contract between the European Food Safety Authority and the author(s), awarded following a tender procedure. The present document is published complying with the transparency principle to which the European Food Safety Authority is subject. It may not be considered as an output adopted by EFSA. EFSA reserves its rights, view and position as regards the issues addressed and the conclusions reached in the present document, without prejudice to the rights of the authors.
Compound Original RACa To RAC CZ FI FR IT NL SE UK All
Courgette <0 Yes No <0 No, both pos No, both pos <0
Melons Pumpkins <0 <0 <0 Yes No, both pos <0 No
Watermelons <0 <0 <0 Yes No, both pos No, both pos No
Carrots Horse Radish <0 <0 Yes <0 <0 <0 <0 Yes
Parsnip <0 <0 Yes <0 <0 <0 <0 Yes
Salsify <0 <0 Yes <0 <0 <0 <0 Yes
Parsley root <0 <0 Yes <0 <0 <0 <0 Yes
Bitertanol
Apples and pears Medlar Yes Yes <0 Yes <0 Yes <0
Quinces Yes Yes <0 Yes <0 Yes <0 Yes
Loquat Yes Yes <0 Yes <0 Yes <0 Yes
Courgettes and
cucumber Gherkins <0 <0 <0 Yes No, both pos <0 No, both pos
Diniconazole Nectarines Peaches No <0 No No No, both pos No No, both pos
Apricots No <0 No No No, both pos No No
a RAC = raw agricultural commodity
b No = the original RAC is not analyzed
c < 0 = All analytical results of original RAC are below limit of detection
d Some herbs had pos.
e Some citrus fruits were positive
both positive should be explained as well
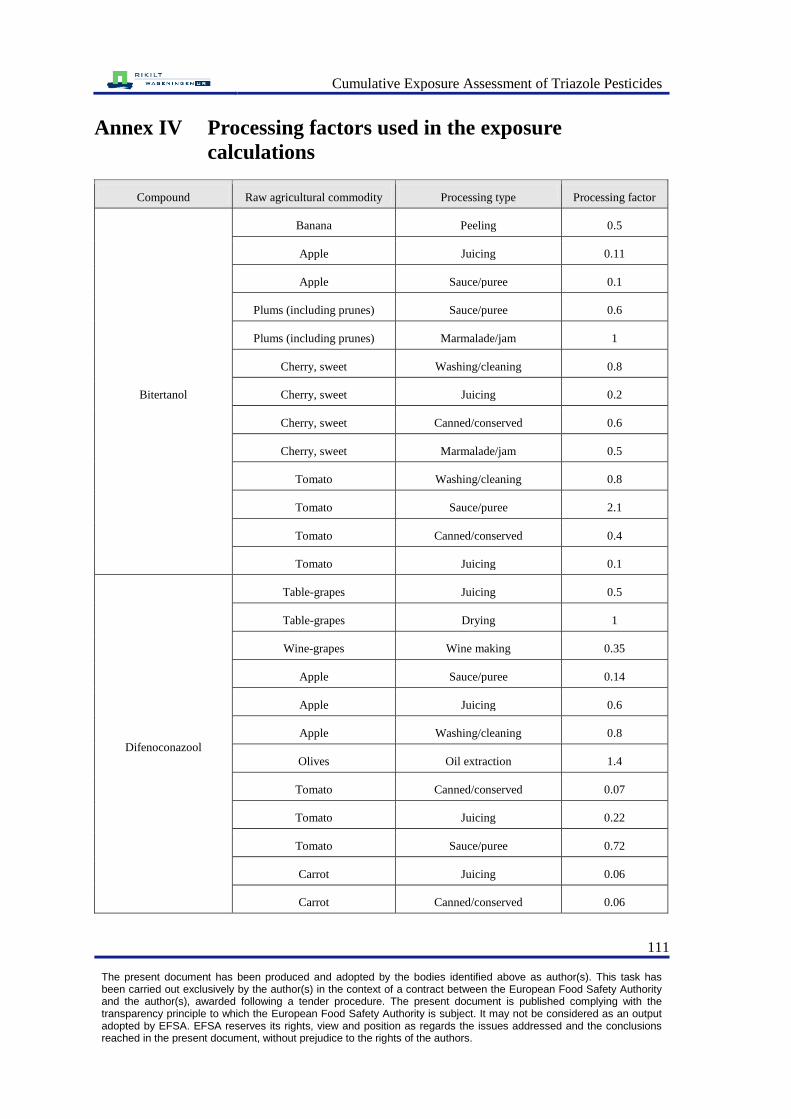
Cumulative Exposure Assessment of Triazole Pesticides
111 The present document has been produced and adopted by the bodies identified above as author(s). This task has been carried out exclusively by the author(s) in the context of a contract between the European Food Safety Authority and the author(s), awarded following a tender procedure. The present document is published complying with the transparency principle to which the European Food Safety Authority is subject. It may not be considered as an output adopted by EFSA. EFSA reserves its rights, view and position as regards the issues addressed and the conclusions reached in the present document, without prejudice to the rights of the authors.
Annex IV Processing factors used in the exposure
calculations
Compound Raw agricultural commodity Processing type Processing factor
Bitertanol
Banana Peeling 0.5
Apple Juicing 0.11
Apple Sauce/puree 0.1
Plums (including prunes) Sauce/puree 0.6
Plums (including prunes) Marmalade/jam 1
Cherry, sweet Washing/cleaning 0.8
Cherry, sweet Juicing 0.2
Cherry, sweet Canned/conserved 0.6
Cherry, sweet Marmalade/jam 0.5
Tomato Washing/cleaning 0.8
Tomato Sauce/puree 2.1
Tomato Canned/conserved 0.4
Tomato Juicing 0.1
Difenoconazool
Table-grapes Juicing 0.5
Table-grapes Drying 1
Wine-grapes Wine making 0.35
Apple Sauce/puree 0.14
Apple Juicing 0.6
Apple Washing/cleaning 0.8
Olives Oil extraction 1.4
Tomato Canned/conserved 0.07
Tomato Juicing 0.22
Tomato Sauce/puree 0.72
Carrot Juicing 0.06
Carrot Canned/conserved 0.06

Cumulative Exposure Assessment of Triazole Pesticides
112 The present document has been produced and adopted by the bodies identified above as author(s). This task has been carried out exclusively by the author(s) in the context of a contract between the European Food Safety Authority and the author(s), awarded following a tender procedure. The present document is published complying with the transparency principle to which the European Food Safety Authority is subject. It may not be considered as an output adopted by EFSA. EFSA reserves its rights, view and position as regards the issues addressed and the conclusions reached in the present document, without prejudice to the rights of the authors.
Compound Raw agricultural commodity Processing type Processing factor
Epoxiconazool
Barley Brewing 0.1
Wheat Milling 1
Wheat Baking of bread 1
Flusilazol
Table-grapes Drying 1
Table-grapes Juicing 0.3
Wine-grapes Wine making 0.1
Apple Juicing 0.2
Barley Milling 0.4
Wheat Milling 0.96
Wheat Baking of bread 1
Myclobutanil
Currants, black, red, white Juicing 0.3
Currants, black, red, white Canned/conserved 1
Strawberry Canned/conserved 0.85
Strawberry Marmalade/jam 0.5
Table-grapes Juicing 0.2
Wine-grapes Wine making 0.15
Mandarins Juicing 0.4
Mandarins Peeling 0
Banana Peeling 0.24
Apple Washing/cleaning 1
Apple Juicing 0.13
Apple Sauce/puree 0.25
Tomato Canned/conserved 0.75
Tomato Juicing 0.58
Tomato Washing/cleaning 1
Tomato Sauce/puree 1.6
Propiconazole
Tea, green, black Cooking in water 0.02
Table-grapes Juicing 0.5
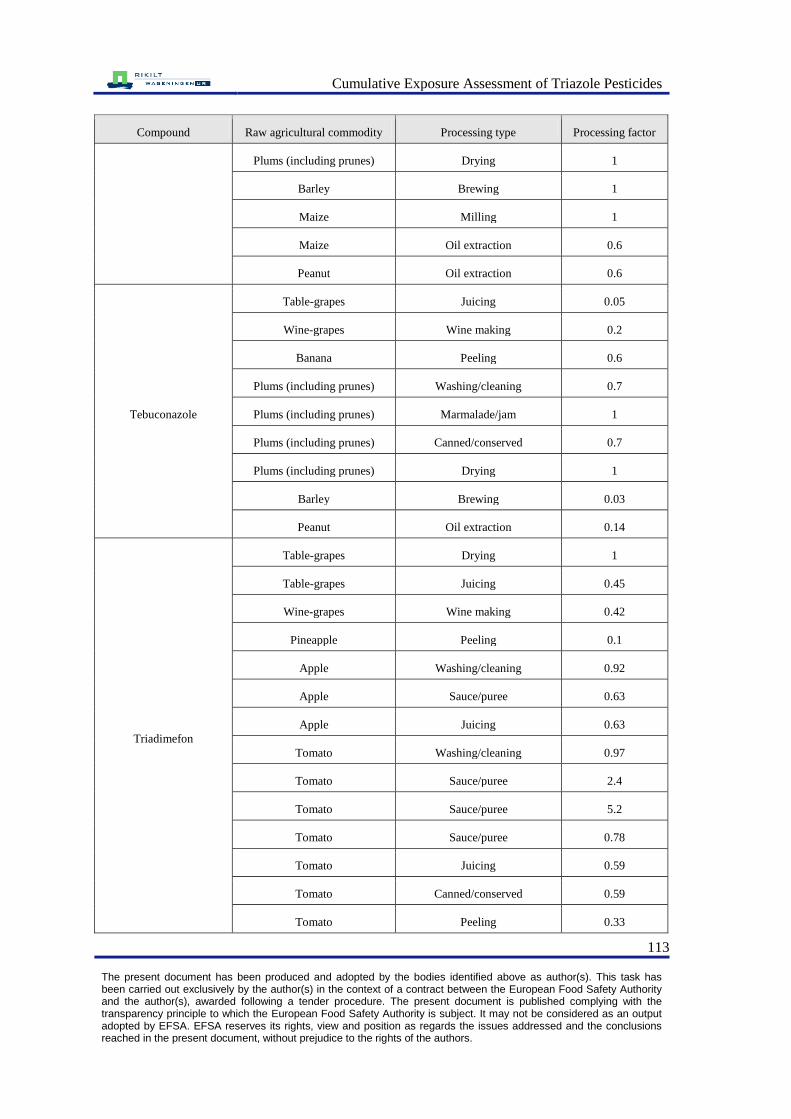
Cumulative Exposure Assessment of Triazole Pesticides
113 The present document has been produced and adopted by the bodies identified above as author(s). This task has been carried out exclusively by the author(s) in the context of a contract between the European Food Safety Authority and the author(s), awarded following a tender procedure. The present document is published complying with the transparency principle to which the European Food Safety Authority is subject. It may not be considered as an output adopted by EFSA. EFSA reserves its rights, view and position as regards the issues addressed and the conclusions reached in the present document, without prejudice to the rights of the authors.
Compound Raw agricultural commodity Processing type Processing factor
Plums (including prunes) Drying 1
Barley Brewing 1
Maize Milling 1
Maize Oil extraction 0.6
Peanut Oil extraction 0.6
Tebuconazole
Table-grapes Juicing 0.05
Wine-grapes Wine making 0.2
Banana Peeling 0.6
Plums (including prunes) Washing/cleaning 0.7
Plums (including prunes) Marmalade/jam 1
Plums (including prunes) Canned/conserved 0.7
Plums (including prunes) Drying 1
Barley Brewing 0.03
Peanut Oil extraction 0.14
Triadimefon
Table-grapes Drying 1
Table-grapes Juicing 0.45
Wine-grapes Wine making 0.42
Pineapple Peeling 0.1
Apple Washing/cleaning 0.92
Apple Sauce/puree 0.63
Apple Juicing 0.63
Tomato Washing/cleaning 0.97
Tomato Sauce/puree 2.4
Tomato Sauce/puree 5.2
Tomato Sauce/puree 0.78
Tomato Juicing 0.59
Tomato Canned/conserved 0.59
Tomato Peeling 0.33
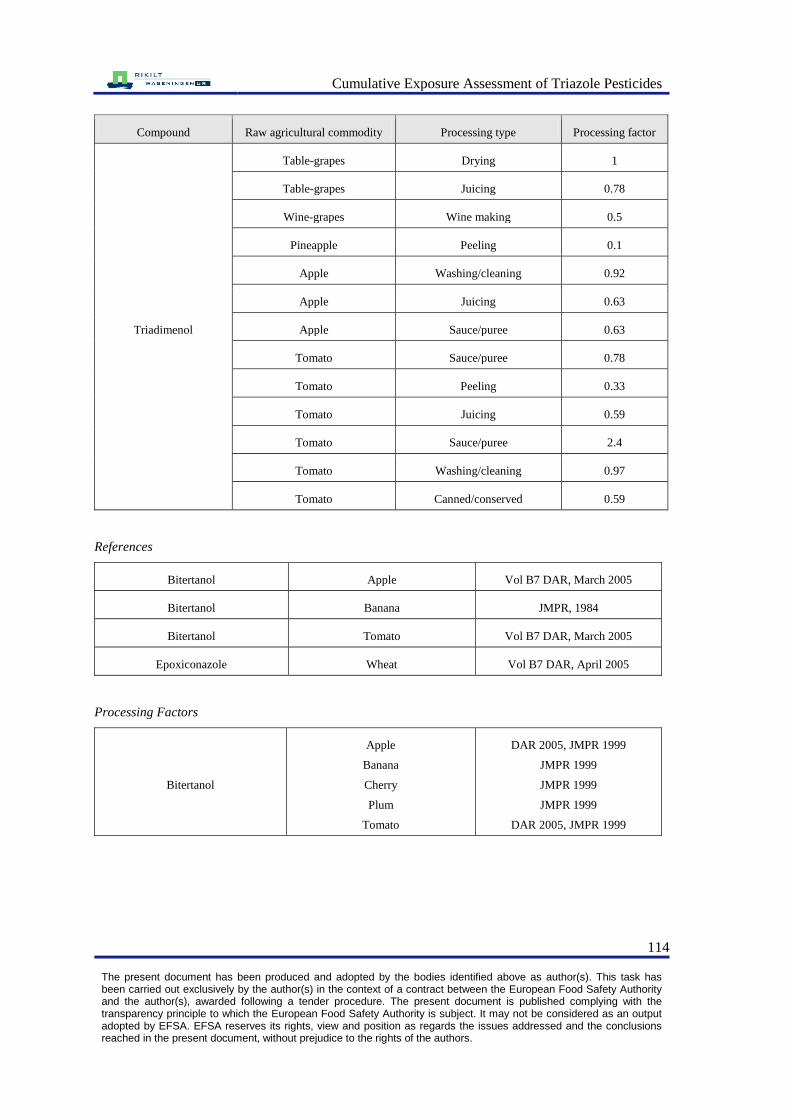
Cumulative Exposure Assessment of Triazole Pesticides
114 The present document has been produced and adopted by the bodies identified above as author(s). This task has been carried out exclusively by the author(s) in the context of a contract between the European Food Safety Authority and the author(s), awarded following a tender procedure. The present document is published complying with the transparency principle to which the European Food Safety Authority is subject. It may not be considered as an output adopted by EFSA. EFSA reserves its rights, view and position as regards the issues addressed and the conclusions reached in the present document, without prejudice to the rights of the authors.
Compound Raw agricultural commodity Processing type Processing factor
Triadimenol
Table-grapes Drying 1
Table-grapes Juicing 0.78
Wine-grapes Wine making 0.5
Pineapple Peeling 0.1
Apple Washing/cleaning 0.92
Apple Juicing 0.63
Apple Sauce/puree 0.63
Tomato Sauce/puree 0.78
Tomato Peeling 0.33
Tomato Juicing 0.59
Tomato Sauce/puree 2.4
Tomato Washing/cleaning 0.97
Tomato Canned/conserved 0.59
References
Bitertanol Apple Vol B7 DAR, March 2005
Bitertanol Banana JMPR, 1984
Bitertanol Tomato Vol B7 DAR, March 2005
Epoxiconazole Wheat Vol B7 DAR, April 2005
Processing Factors
Bitertanol
Apple
Banana
Cherry
Plum
Tomato
DAR 2005, JMPR 1999
JMPR 1999
JMPR 1999
JMPR 1999
DAR 2005, JMPR 1999
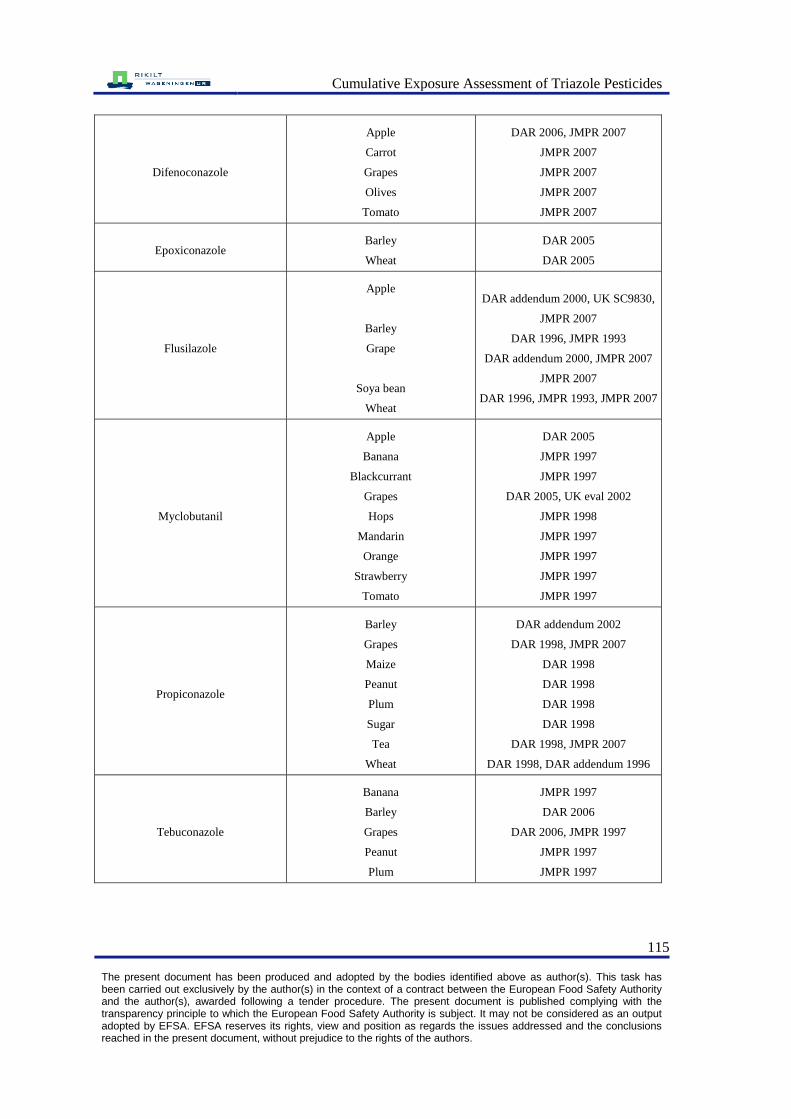
Cumulative Exposure Assessment of Triazole Pesticides
115 The present document has been produced and adopted by the bodies identified above as author(s). This task has been carried out exclusively by the author(s) in the context of a contract between the European Food Safety Authority and the author(s), awarded following a tender procedure. The present document is published complying with the transparency principle to which the European Food Safety Authority is subject. It may not be considered as an output adopted by EFSA. EFSA reserves its rights, view and position as regards the issues addressed and the conclusions reached in the present document, without prejudice to the rights of the authors.
Difenoconazole
Apple
Carrot
Grapes
Olives
Tomato
DAR 2006, JMPR 2007
JMPR 2007
JMPR 2007
JMPR 2007
JMPR 2007
Epoxiconazole Barley
Wheat
DAR 2005
DAR 2005
Flusilazole
Apple
Barley
Grape
Soya bean
Wheat
DAR addendum 2000, UK SC9830,
JMPR 2007
DAR 1996, JMPR 1993
DAR addendum 2000, JMPR 2007
JMPR 2007
DAR 1996, JMPR 1993, JMPR 2007
Myclobutanil
Apple
Banana
Blackcurrant
Grapes
Hops
Mandarin
Orange
Strawberry
Tomato
DAR 2005
JMPR 1997
JMPR 1997
DAR 2005, UK eval 2002
JMPR 1998
JMPR 1997
JMPR 1997
JMPR 1997
JMPR 1997
Propiconazole
Barley
Grapes
Maize
Peanut
Plum
Sugar
Tea
Wheat
DAR addendum 2002
DAR 1998, JMPR 2007
DAR 1998
DAR 1998
DAR 1998
DAR 1998
DAR 1998, JMPR 2007
DAR 1998, DAR addendum 1996
Tebuconazole
Banana
Barley
Grapes
Peanut
Plum
JMPR 1997
DAR 2006
DAR 2006, JMPR 1997
JMPR 1997
JMPR 1997
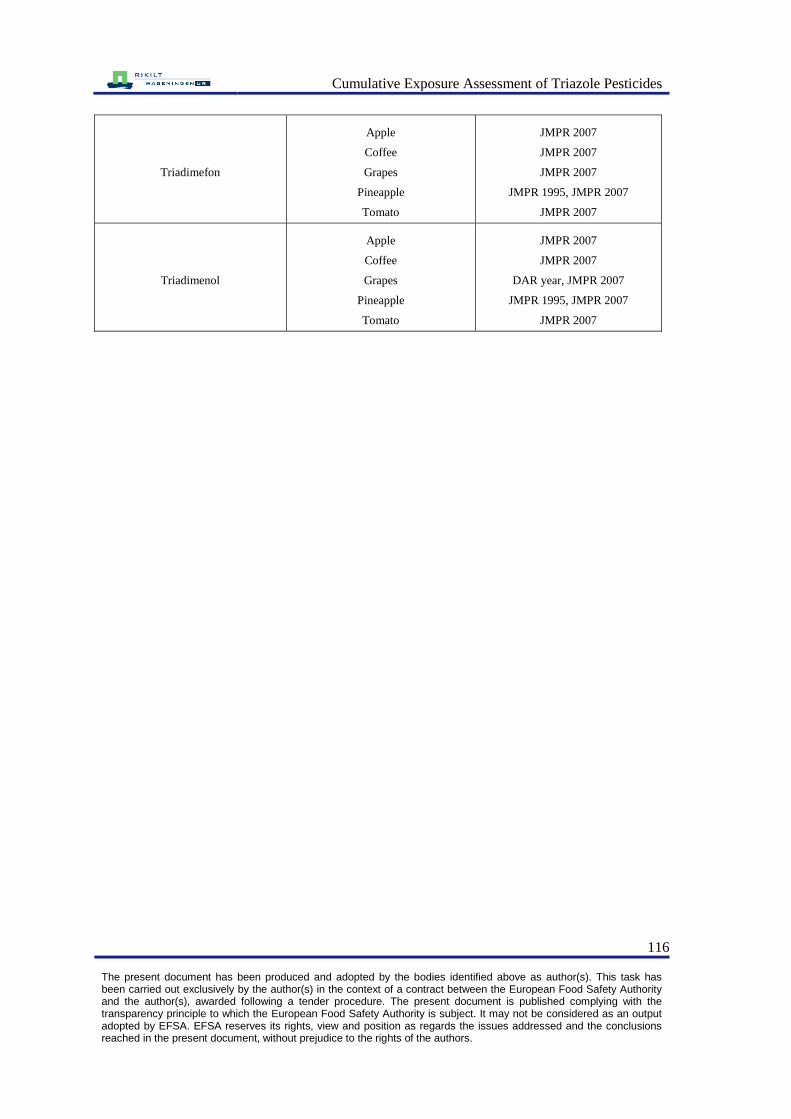
Cumulative Exposure Assessment of Triazole Pesticides
116 The present document has been produced and adopted by the bodies identified above as author(s). This task has been carried out exclusively by the author(s) in the context of a contract between the European Food Safety Authority and the author(s), awarded following a tender procedure. The present document is published complying with the transparency principle to which the European Food Safety Authority is subject. It may not be considered as an output adopted by EFSA. EFSA reserves its rights, view and position as regards the issues addressed and the conclusions reached in the present document, without prejudice to the rights of the authors.
Triadimefon
Apple
Coffee
Grapes
Pineapple
Tomato
JMPR 2007
JMPR 2007
JMPR 2007
JMPR 1995, JMPR 2007
JMPR 2007
Triadimenol
Apple
Coffee
Grapes
Pineapple
Tomato
JMPR 2007
JMPR 2007
DAR year, JMPR 2007
JMPR 1995, JMPR 2007
JMPR 2007

Cumulative Exposure Assessment of Triazole Pesticides
117 The present document has been produced and adopted by the bodies identified above as author(s). This task has been carried out exclusively by the author(s) in the context of a contract between the European Food Safety Authority and the author(s), awarded following a tender procedure. The present document is published complying with the transparency principle to which the European Food Safety Authority is subject. It may not be considered as an output adopted by EFSA. EFSA reserves its rights, view and position as regards the issues addressed and the conclusions reached in the present document, without prejudice to the rights of the authors.
Annex V Variability factors used in the exposure calculations
using monitoring data per raw agricultural
commodity
The variability factor is defined as the ratio of the 97.5th percentile to the mean of the distribution
of concentrations in individual units. In probabilistic modeling these (fixed) values are used to
define distributions (lognormal or beta, see 4.4.1) from which stochastic variability factors are
sampled for use in the simulations (see 2.5 and 2.6).
Raw agricultural commodity Variability factor Unit weighta
Almonds 1 Na
Apple 3.6 112
Apricot 3.6 65
Artichoke, globe 3.6 116
Asparagus 3.6 16
Avocado 3.6 na
Banana 3.6 100
Barley 1 Na
Beetroot 3.6 82
Blackberries 1 Na
Broccoli 3.6 608
Brussels sprouts 1 Na
Cabbage, red 3.6 908
Cabbage, savoy 3.6 908
Cabbage, white 3.6 908
Carrot 3.6 80
Cauliflower 3.6 1733
Celeriac 3.6 550
Celery 3.6 462
Chard 3.6 Na
Cherry, sweet 1 Na

Cumulative Exposure Assessment of Triazole Pesticides
118 The present document has been produced and adopted by the bodies identified above as author(s). This task has been carried out exclusively by the author(s) in the context of a contract between the European Food Safety Authority and the author(s), awarded following a tender procedure. The present document is published complying with the transparency principle to which the European Food Safety Authority is subject. It may not be considered as an output adopted by EFSA. EFSA reserves its rights, view and position as regards the issues addressed and the conclusions reached in the present document, without prejudice to the rights of the authors.
Raw agricultural commodity Variability factor Unit weighta
Chestnuts 1 Na
Chicory (sprouts) 3.6 122
Coconut 1 Na
Common bean (pods and/or immature seeds) 1 Na
Corn salad 1 10
Cowberry, see bilberry, red 1 Na
Cress, garden 1 Na
Cucumber 3.6 490
Date 1 Na
Egg plant 3.6 271
Endive 3.6 122
Fennel, bulb 3.6 234
Fig 3.6 55
Garden pea (young pods) 1 Na
Garden pea, shelled (succulent seeds) 1 Na
Gherkin 1 15
Grapefruit 3.6 160
Hazelnuts 1 Na
Kale (including among others: collards, curly kale) 1 Na
Kiwifruit 3.6 76
Kohlrabi 3.6 135
Leek 3.6 140
Lemon 3.6 84
Lettuce, head 3.6 558
Lettuce, leaf 3.6 558
Lime 3.6 67
Linseed 1 Na
Lychee 1 Na

Cumulative Exposure Assessment of Triazole Pesticides
119 The present document has been produced and adopted by the bodies identified above as author(s). This task has been carried out exclusively by the author(s) in the context of a contract between the European Food Safety Authority and the author(s), awarded following a tender procedure. The present document is published complying with the transparency principle to which the European Food Safety Authority is subject. It may not be considered as an output adopted by EFSA. EFSA reserves its rights, view and position as regards the issues addressed and the conclusions reached in the present document, without prejudice to the rights of the authors.
Raw agricultural commodity Variability factor Unit weighta
Maize 1 Na
Mandarin 3.6 100
Mango 3.6 207
Melons, except watermelon 3.6 552
Millet 1 Na
Mushrooms 1 Na
Nectarine 3.6 110
Oats 1 Na
Olives 1 Na
Onion, bulb 3.6 150
Orange, sweet 3.6 160
Papaya 3.6 268
Parsley 1 Na
Passion fruit 3.6 45
Peach 3.6 110
Peanut 1 Na
Pear 3.6 150
Peppers, sweet (including pimento or pimiento) 3.6 160
Persimmon, Japanese 3.6 150
Pineapple 3.6 1600
Plums (including prunes) 3.6 55
Pomegranate 3.6 154
Potato 3.6 216
Pumpkins 3.6 116
Quince 3.6 Na
Radish 1 Na
Raspberries, red, black 1 Na
Rhubarb 3.6 38

Cumulative Exposure Assessment of Triazole Pesticides
120 The present document has been produced and adopted by the bodies identified above as author(s). This task has been carried out exclusively by the author(s) in the context of a contract between the European Food Safety Authority and the author(s), awarded following a tender procedure. The present document is published complying with the transparency principle to which the European Food Safety Authority is subject. It may not be considered as an output adopted by EFSA. EFSA reserves its rights, view and position as regards the issues addressed and the conclusions reached in the present document, without prejudice to the rights of the authors.
Raw agricultural commodity Variability factor Unit weighta
Rice 1 Na
Rye 1 Na
Sesame seed 1 Na
Soya bean (dry) 1 Na
Spinach 3.6 Na
Squash, summer 3.6 114
Strawberry 1 Na
Sunflower seed 1 Na
Swede 3.6 500
Sweet corn (corn-on-the-cob) 3.6 215
Sweet potato 3.6 130
Table-grapes 3.6 500
Tomato 3.6 85
Walnuts 1 Na
Watermelon 3.6 4518
Wheat 1 Na
a na = not applicable. When the unit weight was not available, it was assumed in the calculations that each
consumed amount consists of just one portion
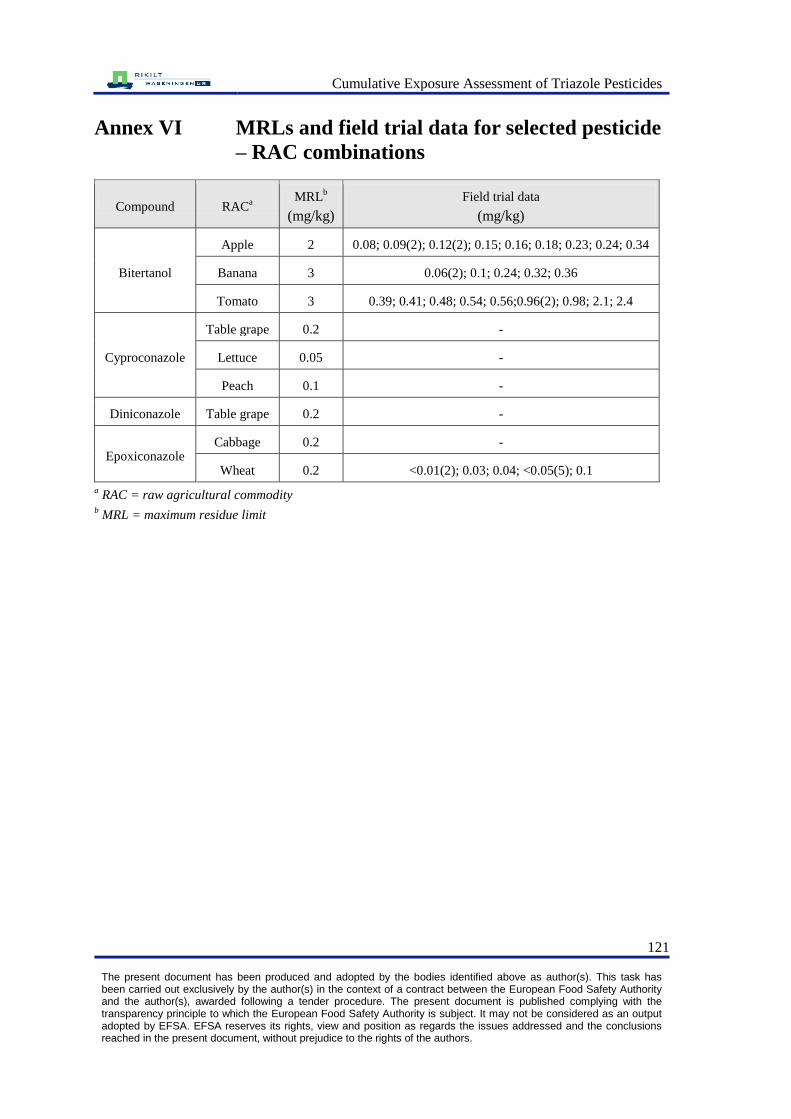
Cumulative Exposure Assessment of Triazole Pesticides
121 The present document has been produced and adopted by the bodies identified above as author(s). This task has been carried out exclusively by the author(s) in the context of a contract between the European Food Safety Authority and the author(s), awarded following a tender procedure. The present document is published complying with the transparency principle to which the European Food Safety Authority is subject. It may not be considered as an output adopted by EFSA. EFSA reserves its rights, view and position as regards the issues addressed and the conclusions reached in the present document, without prejudice to the rights of the authors.
Annex VI MRLs and field trial data for selected pesticide
– RAC combinations
Compound RACa MRL
b
(mg/kg)
Field trial data
(mg/kg)
Bitertanol
Apple 2 0.08; 0.09(2); 0.12(2); 0.15; 0.16; 0.18; 0.23; 0.24; 0.34
Banana 3 0.06(2); 0.1; 0.24; 0.32; 0.36
Tomato 3 0.39; 0.41; 0.48; 0.54; 0.56;0.96(2); 0.98; 2.1; 2.4
Cyproconazole
Table grape 0.2 -
Lettuce 0.05 -
Peach 0.1 -
Diniconazole Table grape 0.2 -
Epoxiconazole Cabbage 0.2 -
Wheat 0.2 <0.01(2); 0.03; 0.04; <0.05(5); 0.1
a RAC = raw agricultural commodity
b MRL = maximum residue limit

Cumulative Exposure Assessment of Triazole Pesticides
122
The present document has been produced and adopted by the bodies identified above as author(s). This task has been carried out exclusively by the author(s) in the context of a contract between the European Food Safety Authority and the author(s), awarded following a tender procedure. The present document is published complying with the transparency principle to which the European Food Safety Authority is subject. It may not be considered as an output adopted by EFSA. EFSA reserves its rights, view and position as regards the issues addressed and the conclusions reached in the present document, without prejudice to the rights of the authors.
Annex VII Contribution of RACs and compounds to acute cumulative estimated exposure after
replacing monitoring data of selected RAC-pesticide combinations with MRLs or field
trial data using NOAEL-derived RPFs
Scenarioa
Countryb
Populationb
RACs and pesticides
Top 1 Top 2 Top 3
RACc
Pesticide % RAC Pesticide % RAC Pesticide %
MRL bitertanol in apple CZ Children Apple Bitertanol 99.7 Wheat Propiconazole 0.1 Pineapple Triadimefon 0.05
MRL bitertanol-apple FR Children Apple Bitertanol 99.5 Wheat Propiconazole 0.2 Pineapple Triadimefon 0.2
MRL bitertanol-apple IT Children Apple Bitertanol 99.4 Tomato Bitertanol 0.2 Wheat Propiconazole 0.2
MRL bitertanol-apple NL Children Apple Bitertanol 99.5 Wheat Propiconazole 0.2 Pineapple Triadimefon 0.2
MRL bitertanol-apple SE Children Apple Bitertanol 99.7 Pineapple Triadimefon 0.2 Wheat Propiconazole 0.1
MRL bitertanol-apple UK Children Apple Bitertanol 99.5 Pineapple Triadimefon 0.2 Wheat Propiconazole 0.1
MRL bitertanol-apple FR Adults Apple Bitertanol 99.8 Wheat Propiconazole 0.1 Pineapple Triadimefon 0.1
MRL bitertanol-apple IT Adults Apple Bitertanol 99.7 Wheat Propiconazole 0.1 Tomato Bitertanol 0.1
MRL bitertanol-apple NL Adults Apple Bitertanol 99.5 Wheat Propiconazole 0.2 Pineapple Triadimefon 0.2
MRL bitertanol-apple NL Total Apple Bitertanol 99.5 Wheat Propiconazole 0.2 Pineapple Triadimefon 0.2
MRL bitertanol-apple FR Wmcba Apple Bitertanol 99.7 Wheat Propiconazole 0.1 Pineapple Triadimefon 0.1
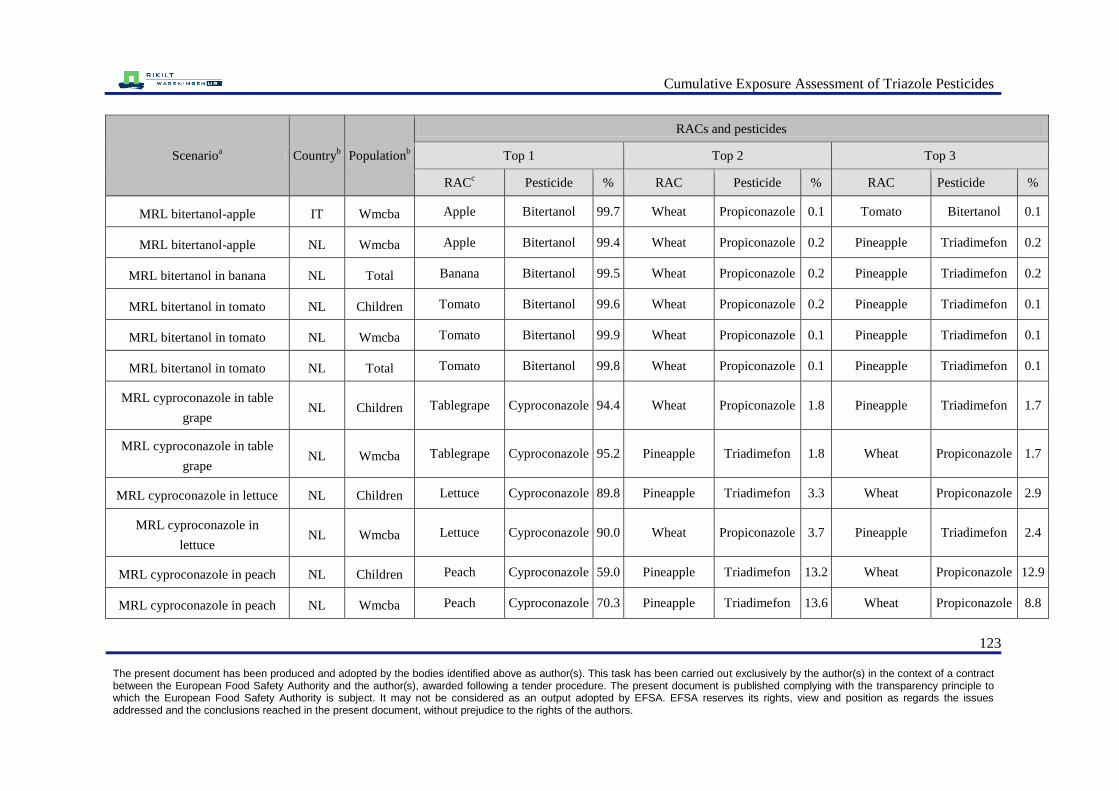
Cumulative Exposure Assessment of Triazole Pesticides
123
The present document has been produced and adopted by the bodies identified above as author(s). This task has been carried out exclusively by the author(s) in the context of a contract between the European Food Safety Authority and the author(s), awarded following a tender procedure. The present document is published complying with the transparency principle to which the European Food Safety Authority is subject. It may not be considered as an output adopted by EFSA. EFSA reserves its rights, view and position as regards the issues addressed and the conclusions reached in the present document, without prejudice to the rights of the authors.
Scenarioa
Countryb
Populationb
RACs and pesticides
Top 1 Top 2 Top 3
RACc
Pesticide % RAC Pesticide % RAC Pesticide %
MRL bitertanol-apple IT Wmcba Apple Bitertanol 99.7 Wheat Propiconazole 0.1 Tomato Bitertanol 0.1
MRL bitertanol-apple NL Wmcba Apple Bitertanol 99.4 Wheat Propiconazole 0.2 Pineapple Triadimefon 0.2
MRL bitertanol in banana NL Total Banana Bitertanol 99.5 Wheat Propiconazole 0.2 Pineapple Triadimefon 0.2
MRL bitertanol in tomato NL Children Tomato Bitertanol 99.6 Wheat Propiconazole 0.2 Pineapple Triadimefon 0.1
MRL bitertanol in tomato NL Wmcba Tomato Bitertanol 99.9 Wheat Propiconazole 0.1 Pineapple Triadimefon 0.1
MRL bitertanol in tomato NL Total Tomato Bitertanol 99.8 Wheat Propiconazole 0.1 Pineapple Triadimefon 0.1
MRL cyproconazole in table
grape NL Children Tablegrape Cyproconazole 94.4 Wheat Propiconazole 1.8 Pineapple Triadimefon 1.7
MRL cyproconazole in table
grape NL Wmcba Tablegrape Cyproconazole 95.2 Pineapple Triadimefon 1.8 Wheat Propiconazole 1.7
MRL cyproconazole in lettuce NL Children Lettuce Cyproconazole 89.8 Pineapple Triadimefon 3.3 Wheat Propiconazole 2.9
MRL cyproconazole in
lettuce NL Wmcba Lettuce Cyproconazole 90.0 Wheat Propiconazole 3.7 Pineapple Triadimefon 2.4
MRL cyproconazole in peach NL Children Peach Cyproconazole 59.0 Pineapple Triadimefon 13.2 Wheat Propiconazole 12.9
MRL cyproconazole in peach NL Wmcba Peach Cyproconazole 70.3 Pineapple Triadimefon 13.6 Wheat Propiconazole 8.8

Cumulative Exposure Assessment of Triazole Pesticides
124
The present document has been produced and adopted by the bodies identified above as author(s). This task has been carried out exclusively by the author(s) in the context of a contract between the European Food Safety Authority and the author(s), awarded following a tender procedure. The present document is published complying with the transparency principle to which the European Food Safety Authority is subject. It may not be considered as an output adopted by EFSA. EFSA reserves its rights, view and position as regards the issues addressed and the conclusions reached in the present document, without prejudice to the rights of the authors.
Scenarioa
Countryb
Populationb
RACs and pesticides
Top 1 Top 2 Top 3
RACc
Pesticide % RAC Pesticide % RAC Pesticide %
MRL epoxiconazole in cabbage NL Children Cabbage, red Epoxiconazole 49.3 Cabbage, white Epoxiconazole 31.2 Cabbage, oxhead Epoxiconazole 8.2
MRL epoxiconazole in cabbage NL Wmcba Cabbage, white Epoxiconazole 53.6 Cabbage, red Epoxiconazole 26.6 Cabbage, oxhead Epoxiconazole 10.2
MRL epoxiconazole in wheat NL Total Wheat Epoxiconazole 94.2 Wheat Propiconazole 2.5 Pineapple Triadimefon 1.5
a For an explanation of the scenarios see Table 15.
b For abbreviations of countries and ages of the (sub)populations addressed, see Table 3. The age ranges of the subpopulations adults and women of child-bearing age
(Wmbca) were 18-64 years and 15-45 years, respectively. c RAC = raw agricultural commodity

Cumulative Exposure Assessment of Triazole Pesticides
125
The present document has been produced and adopted by the bodies identified above as author(s). This task has been carried out exclusively by the author(s) in the context of a contract between the European Food Safety Authority and the author(s), awarded following a tender procedure. The present document is published complying with the transparency principle to which the European Food Safety Authority is subject. It may not be considered as an output adopted by EFSA. EFSA reserves its rights, view and position as regards the issues addressed and the conclusions reached in the present document, without prejudice to the rights of the authors.
Annex VIII Contribution of RACs and compounds to chronic cumulative estimated exposure
after replacing monitoring data of selected RAC-pesticide combinations with MRLs
or field trial data using NOAEL-derived RPFs
Scenarioa
Countryb
Populationb
RACs and pesticides
Top 1 Top 2 Top 3
RACc
Pesticide % RAC Pesticide % RAC Pesticide %
FT bitertanol-apple CZ Children Apple Bitertanol 93.4 Banana Bitertanol 2.4 Parsley Difenoconazole 0.9
FT bitertanol-apple FR Children Apple Bitertanol 87.7 Banana Bitertanol 4.2 Wheat Propiconazole 2.0
FT bitertanol-apple IT Children Apple Bitertanol 88.3 Tomato Bitertanol 4.7 Banana Bitertanol 1.6
FT bitertanol-apple NL Children Apple Bitertanol 93.6 Banana Bitertanol 1.7 Pineapple Triadimenol 0.9
FT bitertanol-apple SE Children Apple Bitertanol 94.8 Banana Bitertanol 1.1 Tomato Bitertanol 0.7
FT bitertanol-apple UK Children Apple Bitertanol 90.8 Pineapple Triadimenol 2.3 Banana Bitertanol 1.6
FT bitertanol-apple FR Adults Apple Bitertanol 91.7 Banana Bitertanol 1.4 Pineapple Triadimenol 0.8
FT bitertanol-apple IT Adults Apple Bitertanol 89.0 Tomato Bitertanol 4.4 Wheat Propiconazole 1.2
FT bitertanol-apple NL Adults Apple Bitertanol 91.6 Banana Bitertanol 1.0 Tomato Bitertanol 0.8
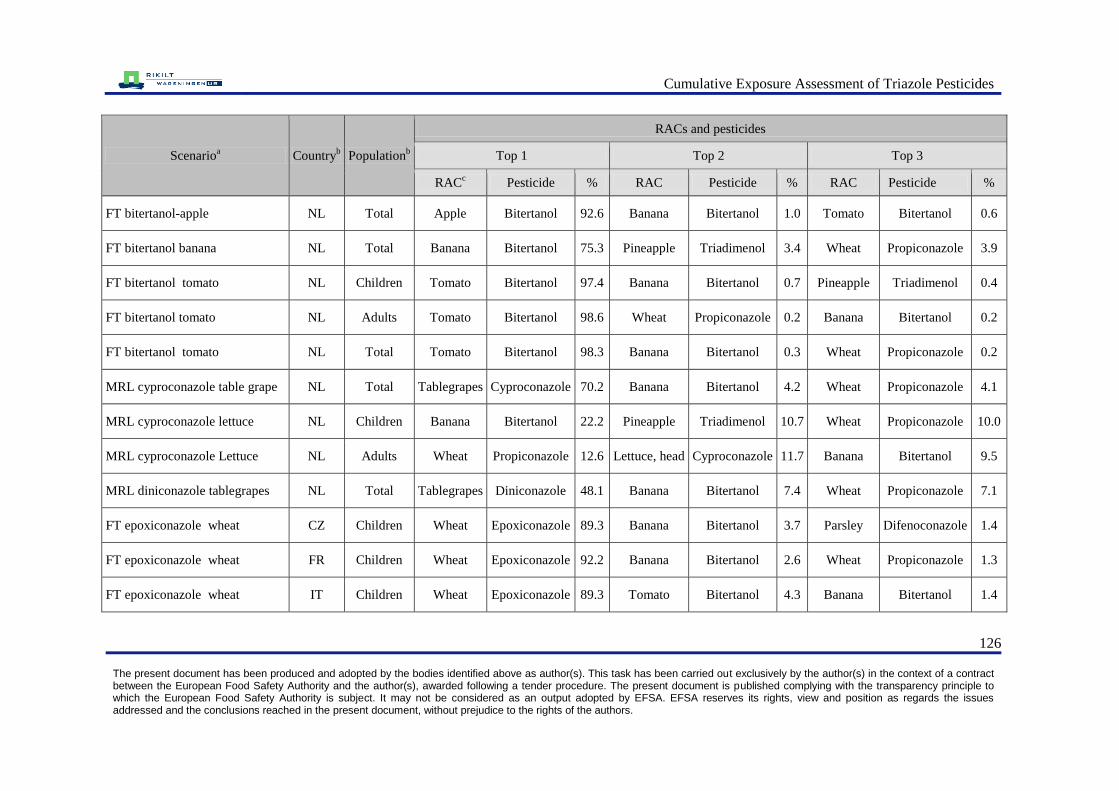
Cumulative Exposure Assessment of Triazole Pesticides
126
The present document has been produced and adopted by the bodies identified above as author(s). This task has been carried out exclusively by the author(s) in the context of a contract between the European Food Safety Authority and the author(s), awarded following a tender procedure. The present document is published complying with the transparency principle to which the European Food Safety Authority is subject. It may not be considered as an output adopted by EFSA. EFSA reserves its rights, view and position as regards the issues addressed and the conclusions reached in the present document, without prejudice to the rights of the authors.
Scenarioa
Countryb
Populationb
RACs and pesticides
Top 1 Top 2 Top 3
RACc
Pesticide % RAC Pesticide % RAC Pesticide %
FT bitertanol-apple NL Total Apple Bitertanol 92.6 Banana Bitertanol 1.0 Tomato Bitertanol 0.6
FT bitertanol banana NL Total Banana Bitertanol 75.3 Pineapple Triadimenol 3.4 Wheat Propiconazole 3.9
FT bitertanol tomato NL Children Tomato Bitertanol 97.4 Banana Bitertanol 0.7 Pineapple Triadimenol 0.4
FT bitertanol tomato NL Adults Tomato Bitertanol 98.6 Wheat Propiconazole 0.2 Banana Bitertanol 0.2
FT bitertanol tomato NL Total Tomato Bitertanol 98.3 Banana Bitertanol 0.3 Wheat Propiconazole 0.2
MRL cyproconazole table grape NL Total Tablegrapes Cyproconazole 70.2 Banana Bitertanol 4.2 Wheat Propiconazole 4.1
MRL cyproconazole lettuce NL Children Banana Bitertanol 22.2 Pineapple Triadimenol 10.7 Wheat Propiconazole 10.0
MRL cyproconazole Lettuce NL Adults Wheat Propiconazole 12.6 Lettuce, head Cyproconazole 11.7 Banana Bitertanol 9.5
MRL diniconazole tablegrapes NL Total Tablegrapes Diniconazole 48.1 Banana Bitertanol 7.4 Wheat Propiconazole 7.1
FT epoxiconazole wheat CZ Children Wheat Epoxiconazole 89.3 Banana Bitertanol 3.7 Parsley Difenoconazole 1.4
FT epoxiconazole wheat FR Children Wheat Epoxiconazole 92.2 Banana Bitertanol 2.6 Wheat Propiconazole 1.3
FT epoxiconazole wheat IT Children Wheat Epoxiconazole 89.3 Tomato Bitertanol 4.3 Banana Bitertanol 1.4

Cumulative Exposure Assessment of Triazole Pesticides
127
The present document has been produced and adopted by the bodies identified above as author(s). This task has been carried out exclusively by the author(s) in the context of a contract between the European Food Safety Authority and the author(s), awarded following a tender procedure. The present document is published complying with the transparency principle to which the European Food Safety Authority is subject. It may not be considered as an output adopted by EFSA. EFSA reserves its rights, view and position as regards the issues addressed and the conclusions reached in the present document, without prejudice to the rights of the authors.
Scenarioa
Countryb
Populationb
RACs and pesticides
Top 1 Top 2 Top 3
RACc
Pesticide % RAC Pesticide % RAC Pesticide %
FT epoxiconazole wheat NL Children Wheat Epoxiconazole 89.4 Banana Bitertanol 2.7 Pineapple Triadimenol 1.3
FT epoxiconazole wheat SE Children Wheat Epoxiconazole 91.2 Pineapple Triadimenol 1.8 Banana Bitertanol 1.7
FT epoxiconazole wheat UK Children Wheat Epoxiconazole 90.5 Pineapple Triadimefon 2.3 Banana Bitertanol 1.5
FT epoxiconazole wheat NL Total Wheat Epoxiconazole 90.9 Banana Bitertanol 1.3 Wheat Propiconazole 1.2
a For an explanation of the scenarios see Table 15.
b For abbreviations of countries and ages of the (sub)populations addressed, see Table 3. The age ranges of the subpopulations adults and women of child-bearing age
(Wmbca) were 18-64 years and 15-45 years, respectively. c RAC = raw agricultural commodity