scoop indiana university – september 21, 2004 steve thomson
TRANSCRIPT

SCOOP
Indiana University – September 21, 2004
Steve Thomson

2
OCEAN SHIPPING
Trade name for the containerized shipping operations of A.P. Moller – Maersk Group.
The world’s largest container shipping operator

3
The History of Shipping
4
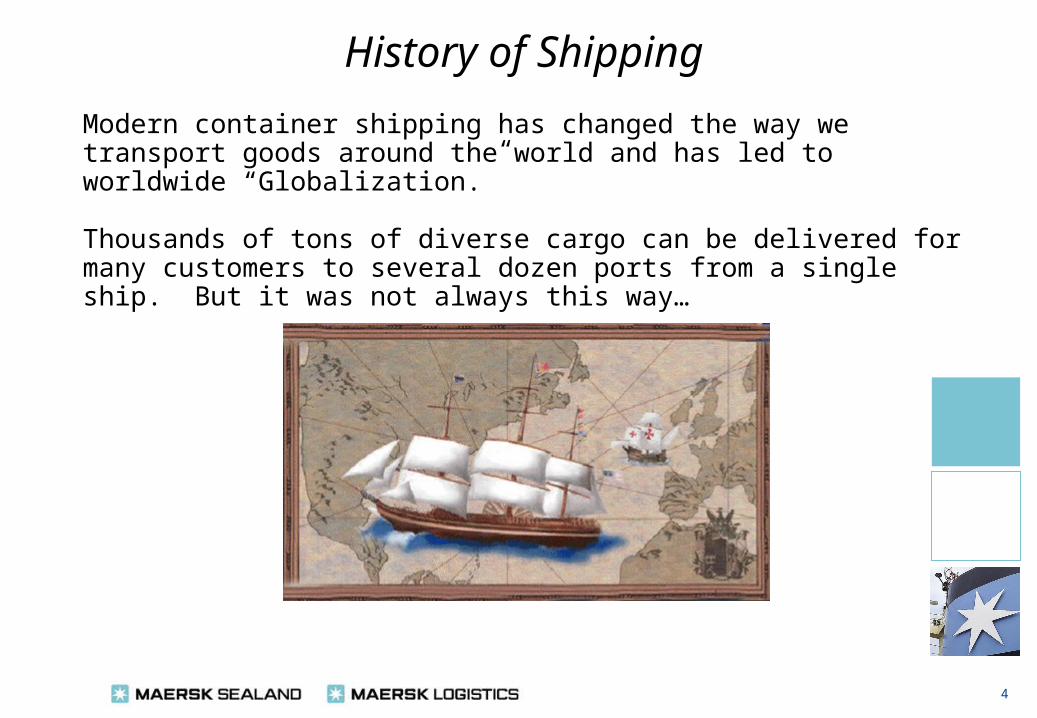
History of Shipping
Modern container shipping has changed the way we transport goods around the world and has led to worldwide “Globalization.”
Thousands of tons of diverse cargo can be delivered for many customers to several dozen ports from a single ship. But it was not always this way…

5
History of Shipping
Before containerships, cargo was painstakingly moved in cargo nets. The name for this type of cargo movement, “breakbulk,” seems appropriate.
Disadvantages• Labor intensive• Greater handling• Slow to load & unload• Subject to damage from weather• Theft

6
History of Shipping
The pallet was the next evolutionary stage in containerization. Although an improvement over breakbulk, there were still problems.
Advantages • Quicker • More load per lift • Less damage to cargo • No special shore equipment needed
Disadvantages • Expensive • Not all cargo can be palletized• Broken stowage • High investment

7
History of Shipping
The concept of shipping cargo in containers was not new. In fact the German company “Schenker AG,” began sea freight container shipments in 1931.

8
History of Shipping
During the early days of cargo shipping, containers were lashed to the deck of ships. Later, containers were placed below deck. Eventually, full container or cellular-built vessels were designed that are now the mainstay of the cargo revolution.

9
History of Shipping
Malcom McLean invented containerized shipping in the 1930s and later founded Sea-Land Service, Inc. in New Jersey.
At this time, trucks were used to transport cargo to the docks in order to be loaded on to vessels. It was McLean who realized that rather than loading and unloading trucks onto vessels, the truck body itself—with some minor modifications—could be the container that was transported.

10
History of Shipping
Containerization is a system of freight transport using standard containers that can be loaded on container ships, trains and trucks.
» Advantages
• Rapid transit times – “from factory floor to customer door”
• Quick and efficient operation at port and inland
• Reduced cargo damage, pilferage, handling costs, claims
• Greater economies of scale – fewer, large ships
• Disadvantages
• Capital intensive (vessels, ports, roads, railways)
• Administration
• Specialized equipment / port facilities

11
History of Shipping
One 40 foot reefer container can contain 90,000 lamb chops, equivalent to the average consumption of a four-person familyfor 450 years.
A 40 foot high cube container has the same dimensions as a city bus (12m x 2.5m x 2.9m).
One 45 foot high cube container can contain 28,000 Barbie Dolls, which put in a line, is equivalent to 9.3 km.

12
History of Shipping
Containerization has revolutionized cargo shipping. Today, approximately 90% of cargo moves on containerized vessels. Over 200 million containers per year now move between ports worldwide.

13
History of ShippingVessels
As the container business has grown, so too have the vessels. In the early 1960’s capacity was approximately 1,700 TEU. Today, capacity surpasses 8,000 TEU.

14
The Shipping Industry Today

15
The Shipping Industry Today
Globalisation / Economic Development
Demand > Supply
Shifting Trade Patterns
Continued Containerization
Increasing Vessel Size (subject to infrastructures)
Fierce Competition Low Carrier Profitability
Industry Consolidation (M&A) / Alliances
Service Customization
Focus on Security

16
1988-2007 (Million TEU)Growth in World Trade
The Shipping Industry Today
Source: Clarkson Research Studies and WestLB Panmure
0
10
20
30
40
50
60
70
80
901
98
8
19
90
19
92
19
94
19
96
19
98
20
00
20
02
20
04
20
06
8.5% Average Annual
Growth Rate(compounded annually)

17
Source: Containership Databank © MDS Transmodal
Global Vessel Capacity2003
The Shipping Industry Today
0
100
200
300
400
500
600
700
800
900T
EU
'000
Mae
rsk
Seala
ndM
SC
Everg
reen
P&O Ned
lloyd
CMA-C
GMHan
jin APLNYK
Cosco
K-Lin
e

18
Source: Top 25 (2003) Container Liner Operators © Dynamar B.V.
Global Cargo Volumes2003
The Shipping Industry Today
0
1000
2000
3000
4000
5000
6000
7000
8000
9000T
EU
'00
0
Mae
rsk
Seala
nd
Everg
reen
MSC
P&O Ned
lloyd
Hanjin
Cosco
APL
CMA C
GM
China
Shippin
g
OOCL

19
Maersk Sealand “S-Class Vessels” (23 Total)
Fun Facts
An “S” class vessel can load about 6,600 twenty foot containers. Fully loaded this is equivalent to 4,989,600 cases of beer, or about 150,000,000 bottles.
The five auxiliary engines of an S-type vessel produce 15.6 MW per day - equivalent to the consumption of 5,000 European single-family houses per day.
An “S” class vessel is 1,138 feet long, which is 154 feet longer than the Eiffel Tower.
1,138 ft.
984 ft.
The main engine on an S-type weighs roughly 1,900 metric tons – equivalent to the weight of more than 1,275 small cars!
The Shipping Industry Today

20
Fun Facts
If all Maersk Sealand’s operated containers were put in a line they would stretch more than 4,350 miles, approximately the same distance between Miami and Paris.
In 2003, Maersk Seland sailed approximately 30,000,000 miles, making over 32,000 port calls and circling the world over 1,300 times!
The Shipping Industry Today

21
• Over 70,000 employees
• Operating in over 100 countries
• Comparable to high 200’s of the Global Fortune 500
A.P. Moller – Maersk Group
Esplanaden
Copenhagen, Denmark
A Global Enterprise

22
Mærsk Mc-Kinney MøllerSr. Partner
Tommy ThomsenPartner
Knud StubkjaerPartner
Jess SøderbergPartner & CEO
Michael Pram RasmussenChairman of the Board
Senior Management
A.P. Moller – Maersk Group

23
• While accompanying her husband on a voyage, Anna Møller suffered a serious illness which left a lasting impression on the deeply religious captain, who felt himself to be responsible.
• Several years later in a letter to his wife (October 1886), the captain explained the background for the company's new emblem:
•"The little star on the funnel is a reminder of the evening I prayed for you so dejectedly and anxiously, asking for the sign that I might see in the grey, overcast sky, a reminder that the Lord hears our prayers".
A.P. Moller – Maersk GroupOur Logo
24
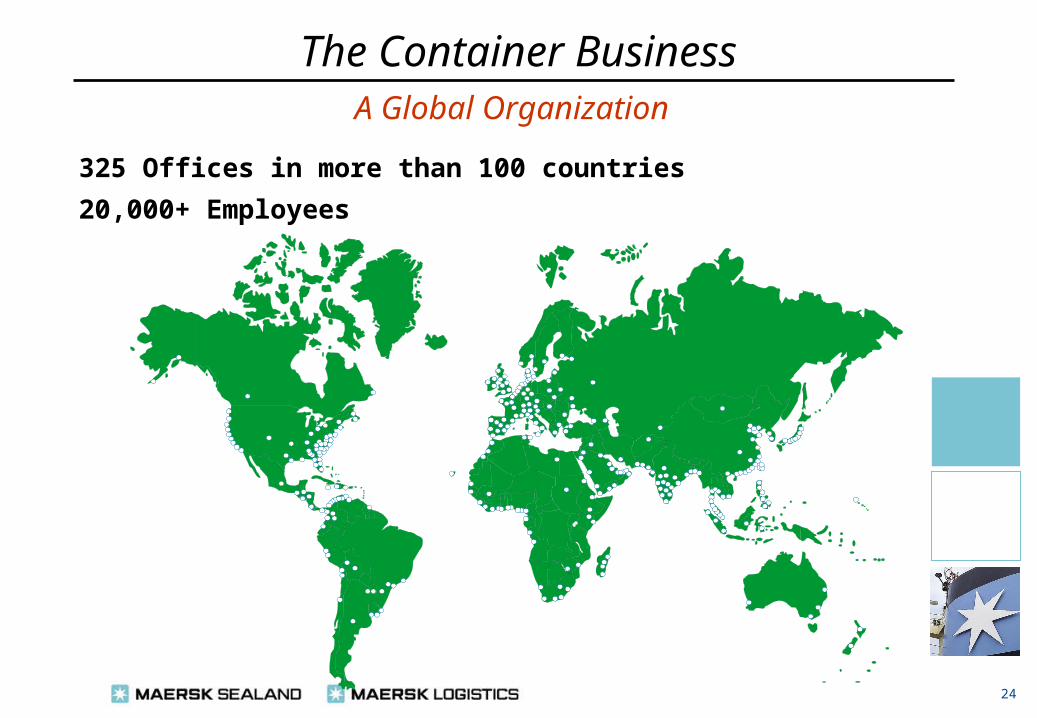
325 Offices in more than 100 countries
20,000+ Employees
A Global Organization
The Container Business

25
1,700 TEU
2,305 TEU
3,220 TEU
4,848 TEU
7,598 TEU
TEU CAPACITY
Vessels & Containers
Vessels 300+
TEU Capacity 750,000+
Containers 950,000+
Reefers 110,000+
Chassis 80,000+
The Container Business

26
Customers
Maersk Sealand Customers

27
Source: JOC Statistics
2003 Market Shares
Others41.5% Evergreen
6.7%
Hanjin6.7%
APL6.6%
Hyundai4.0%
MSL12.9%
MSC4.8%P&O4.6%OOCL
4.3%COSCO4.1%
NYK3.9%
2003 Total Market Volumes
TEU (000) 2003 2002 Change
PACIFIC 13,196.112,084.
3 9.2%
TRANSATLANTIC 2,648.9 2,654.3 -0.2%
MECL 2,276.8 2,091.9 8.8%
CAM / CAR 1,562.7 1,516.2 3.1%
ECSA 652.5 572.8 13.9%
WCSA 494.6 440.9 12.2%
OCEANIA 371.5 351.3 5.7%
AFRICA 198.1 161 23.0%
TOTAL 21,401.1 19,872.8 7.7%
Total U.S. Market Imports & Exports
The Maersk Inc. Group of Companies

28
Top U.S. Trading Partners
Source: Journal of Commerce (JOC)
Rank Country 2002 TEU 2003 TEU Growth Rank Country 2002 TEU 2003 TEU Growth
1 PRC 901,588 1,220,649 26.1% 1 PRC 4,119,354 4,688,525 12.1%2 Japan 890,425 888,804 -0.2% 2 Hong Kong 1,272,020 1,364,797 6.8%3 Puerto Rico 501,413 529,149 5.2% 3 Japan 738,736 781,224 5.4%4 Korea 430,109 436,212 1.4% 4 China 633,807 689,830 8.1%5 Hong Kong 329,932 332,671 0.8% 5 Korea 523,603 510,045 -2.7%
All Other 4,390,347 4,606,650 4.7% All Other 6,269,887 6,647,668 5.7%
Top 5 % Total 41.0% 42.5% 1.5 pts. Top 5 % Total 53.8% 54.7% 1 pt.Total U.S. Exports 7,443,813 8,014,136 7.1% Total U.S. Exports 13,557,408 14,682,089 7.7%
U.S. Exports U.S. Imports
Ranked by Total Market 2003 TEU
The Maersk Inc. Group of Companies

29
Top U.S. Traded CommoditiesRanked by Total Market 2003 TEU
Rank Commodity Rank Commodity
1 Waste Paper 1 Misc. / General Cargo2 Chemicals 2 Furniture3 Misc. / General Cargo 3 Garments4 Refrigerated Cargo 4 Electrical Goods5 Groceries 5 Refrigerated Cargo
U.S. Exports U.S. Imports
The Maersk Inc. Group of Companies

30
INTERESTED IN MAERSK SEALAND?
• M.I.S.E. Program
• 2yr Rotational Management Training Program
• www.mise.edu
• Recruiting On Campus
• Oct 13 – Pre Night Info Session
• Oct 14 - On Campus Interview
• Maersk is registered with your career svc dept.

31
THANK YOU
Any Questions???