scope of meteo/gis in the international context olga wilhelmi ncar adaguc workshop knmi october 3-4...
Post on 21-Dec-2015
220 views
TRANSCRIPT

Scope of Meteo/GIS in the Scope of Meteo/GIS in the International ContextInternational Context
Olga Wilhelmi
NCAR
ADAGUC Workshop
KNMI
October 3-4 2006

OutlineOutline
Current state in integration of GIS and Atmospheric Sciences Progress Challenges
Usability of atmospheric data in GIS
Usability and uses of GIS for meteorological and climatological applications
Future directions

The PurposeThe Purpose
Challenges of earth system science research community include: integration of complex physical processes into weather
forecast and climate system models understanding interactions between climate, environment,
and society integrating social and environmental information with
weather and climate
It is important to make atmospheric science usable and data accessible to a wide community of users, including researchers, educators, practitioners and policy-makers

The ChallengeThe Challenge
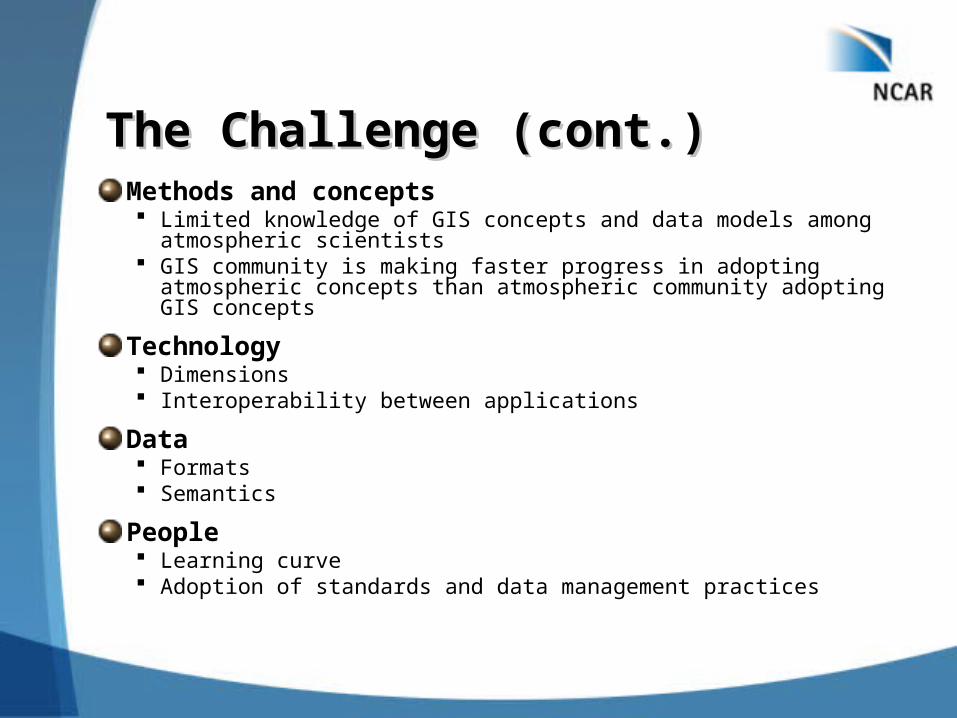
The Challenge (cont.)The Challenge (cont.)Methods and concepts Limited knowledge of GIS concepts and data models among
atmospheric scientists GIS community is making faster progress in adopting atmospheric
concepts than atmospheric community adopting GIS concepts
Technology Dimensions Interoperability between applications
Data Formats Semantics
People Learning curve Adoption of standards and data management practices

International Activities International Activities
COST 719 (2001-2006)
NCAR GIS Initiative (2001- present)
Professional societies (EGU, AMS)
University Consortium for Geographic Information Science
Open Geospatial Consortium
ESRI Atmospheric User Group
Others
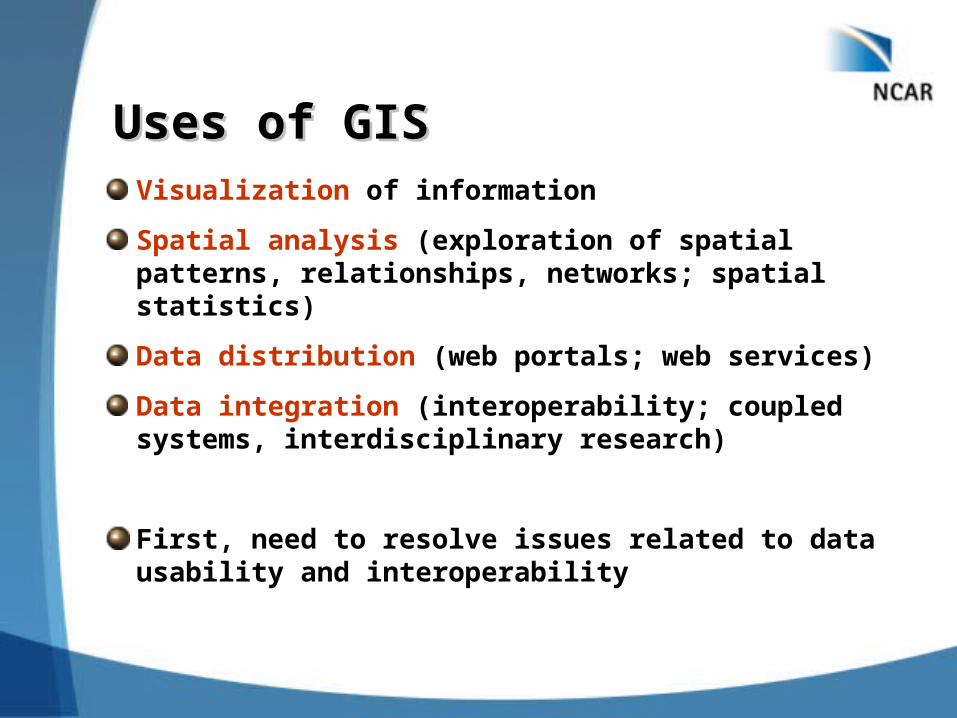
Uses of GISUses of GISVisualization of information
Spatial analysis (exploration of spatial patterns, relationships, networks; spatial statistics)
Data distribution (web portals; web services)
Data integration (interoperability; coupled systems, interdisciplinary research)
First, need to resolve issues related to data usability and interoperability
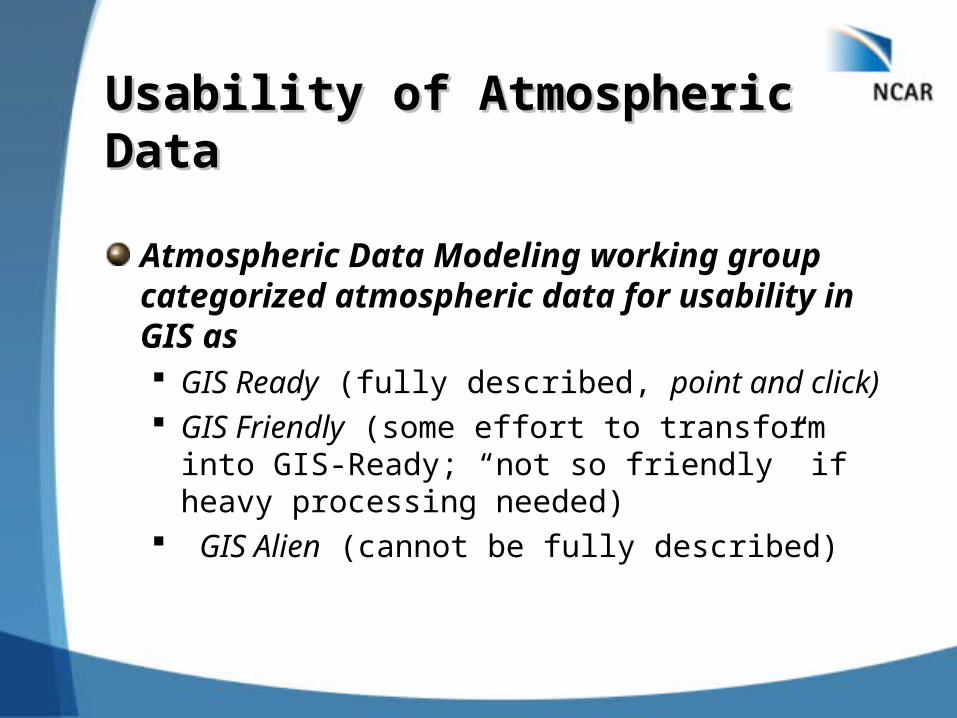
Usability of Atmospheric DataUsability of Atmospheric Data
Atmospheric Data Modeling working group categorized atmospheric data for usability in GIS as GIS Ready (fully described, point and click) GIS Friendly (some effort to transform into GIS-
Ready; “not so friendly” if heavy processing needed)
GIS Alien (cannot be fully described)
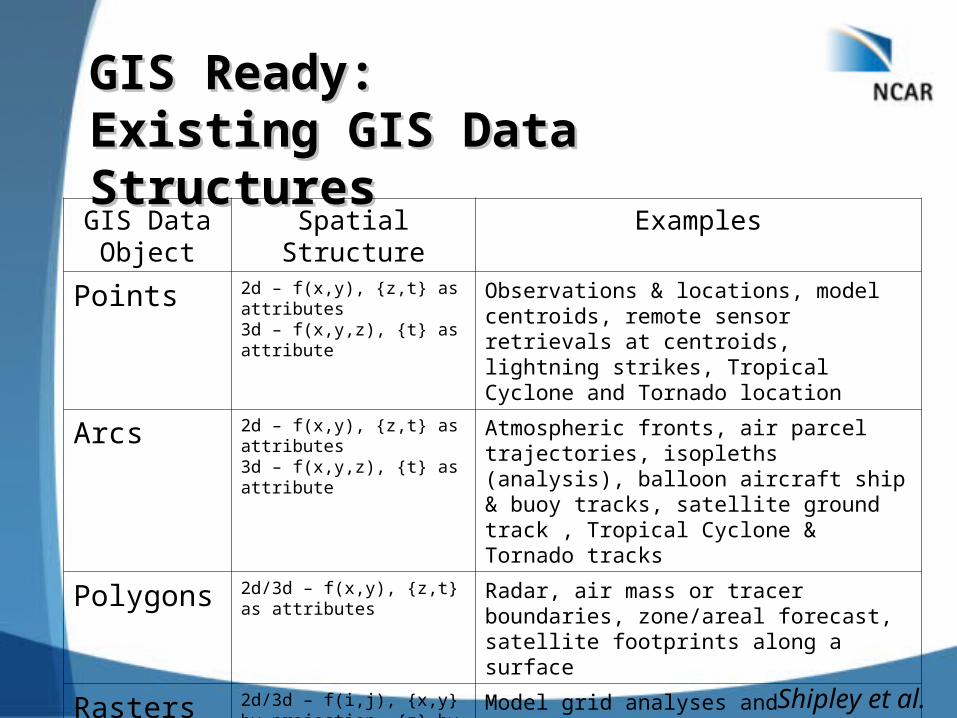
GIS Ready:GIS Ready:Existing GIS Data StructuresExisting GIS Data StructuresGIS Data
ObjectSpatial Structure Examples
Points 2d – f(x,y), {z,t} as attributes3d – f(x,y,z), {t} as attribute
Observations & locations, model centroids, remote sensor retrievals at centroids, lightning strikes, Tropical Cyclone and Tornado location
Arcs 2d – f(x,y), {z,t} as attributes3d – f(x,y,z), {t} as attribute
Atmospheric fronts, air parcel trajectories, isopleths (analysis), balloon aircraft ship & buoy tracks, satellite ground track , Tropical Cyclone & Tornado tracks
Polygons 2d/3d – f(x,y), {z,t} as attributes
Radar, air mass or tracer boundaries, zone/areal forecast, satellite footprints along a surface
Rasters 2d/3d – f(i,j), {x,y} by projection, {z} by value or external layer, attributes not supported
Model grid analyses and forecasts, satellite images
Shipley et al.

GIS Friendly:GIS Friendly:Images require additional infoImages require additional info
14861.3-36.775-5.697-14922.7-12838043.010927734.5
14861.3-36.775-5.697-14922.7-12838043.010927734.5
QTUA11.tif
QTUA11.tfw
QTUA11.aux
World FileWorld File
Projection
500 hPa chart500 hPa charton ArcGlobeon ArcGlobe
Shipley et al.
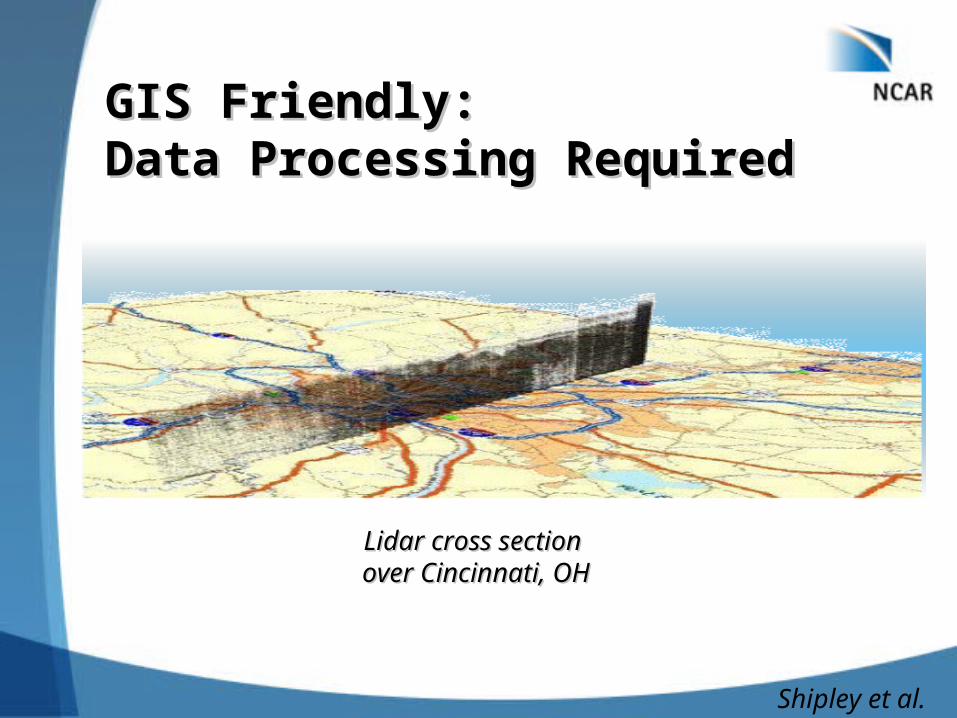
GIS Friendly: GIS Friendly: Data Processing RequiredData Processing Required
Lidar cross section Lidar cross section over Cincinnati, OHover Cincinnati, OH
Shipley et al.
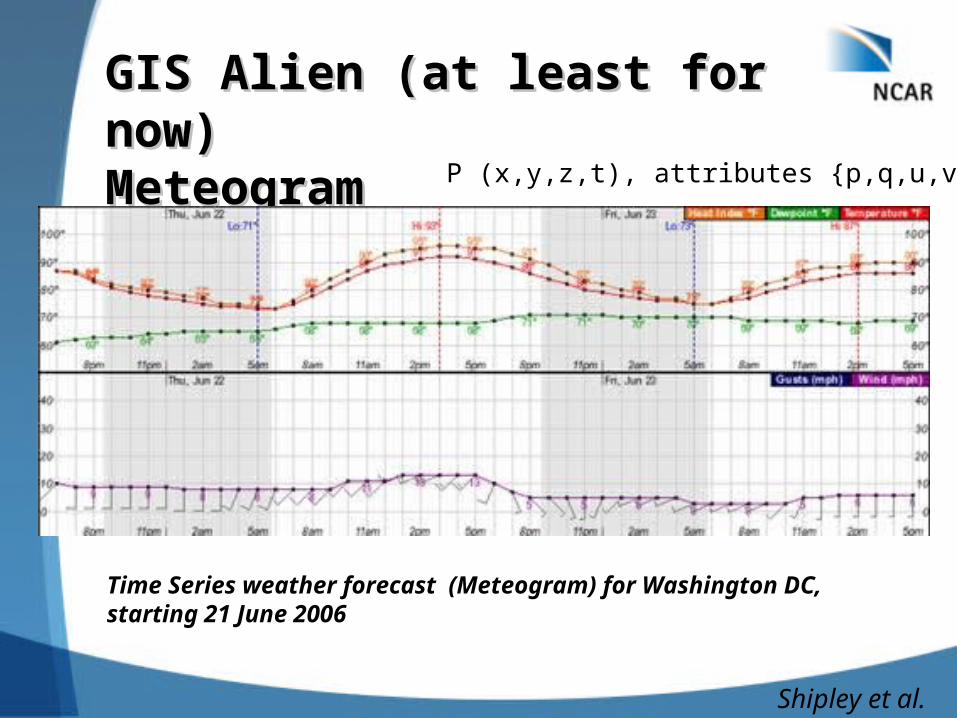
GIS Alien (at least for now)GIS Alien (at least for now)MeteogramMeteogram
Time Series weather forecast (Meteogram) for Washington DC, starting 21 June 2006
P (x,y,z,t), attributes {p,q,u,v,…}
Shipley et al.

Potential GIS Data StructuresPotential GIS Data Structures4d points P (x,y,z,t), attributes
{p,q,u,v,…}
Observations, model grid products, time series, moving observation platforms
Points in arbitrary dimensions
Thermodynamic diagrams, z = f(T), p = f(θ); time series f(t); hyperspectral information, I = f(x,y,p,λ)
Moving arcs
Pl (x,y,z,t), attributes Time series of atmospheric fronts, isopleths (aka “analysis”), streamlines, intersections of volumes
Arcs in arbitrary dimensions Change of state or constituent transformation during transport of a point along a Lagrangian path, intersections of surfaces
Moving polygons
Py (x,y,z,t), attributes Radar feature morphology, air mass or tracer boundary deformation and motion,
Polygons in arbitrary dimensions
Identification of “spatial” patterns in data of arbitrary dimensions, event detection and identification
Surfaces Defined by a set of points in multiple dimensions
Pollutant layer or tracer (water vapor, potential vorticity) transport and transformation
Volumes Defined by a closed surface
Radar feature morphology, air mass or tracer boundary deformation and motion,
n-dim grids & rasters
R (i,j,k,…), attributes embedded
VisAD
Shipley et al.
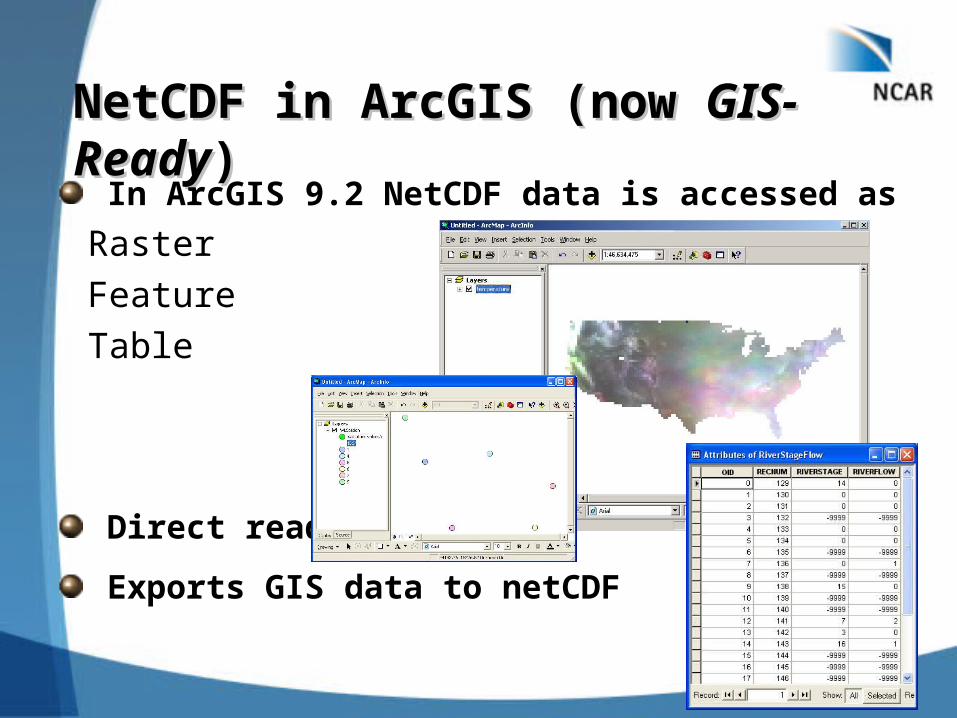
NetCDF in ArcGIS (now NetCDF in ArcGIS (now GIS-ReadyGIS-Ready))In ArcGIS 9.2 NetCDF data is accessed as
Raster
Feature
Table
Direct read
Exports GIS data to netCDF
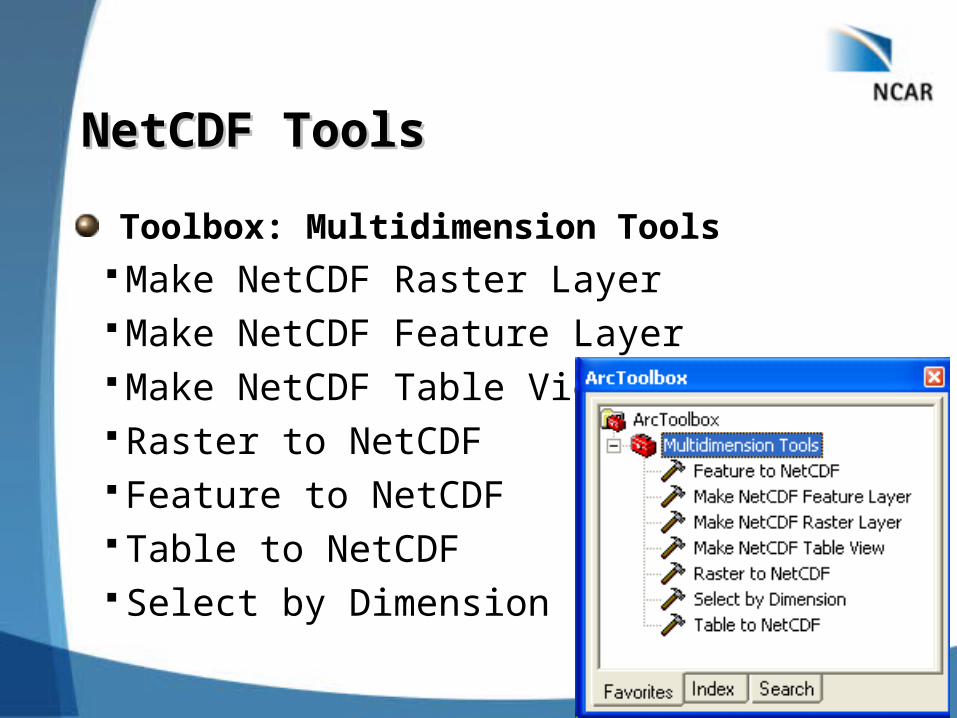
NetCDF ToolsNetCDF Tools
Toolbox: Multidimension Tools Make NetCDF Raster Layer Make NetCDF Feature Layer Make NetCDF Table View Raster to NetCDF Feature to NetCDF Table to NetCDF Select by Dimension
Using NetCDF DataUsing NetCDF Data Display Same display tools for raster and feature layers will work on netCDF
raster and netCDF feature layers.
Graphing Driven by the table just like any other chart.
Animation Multidimensional data can be animated through a dimension (e.g. time,
pressure, elevation)
Analysis Tools A netCDF layer or table will work just like any other raster layer, feature
layer, or table. (e.g. create buffers around netCDF points, re-project rasters, query tables, etc.)
Python
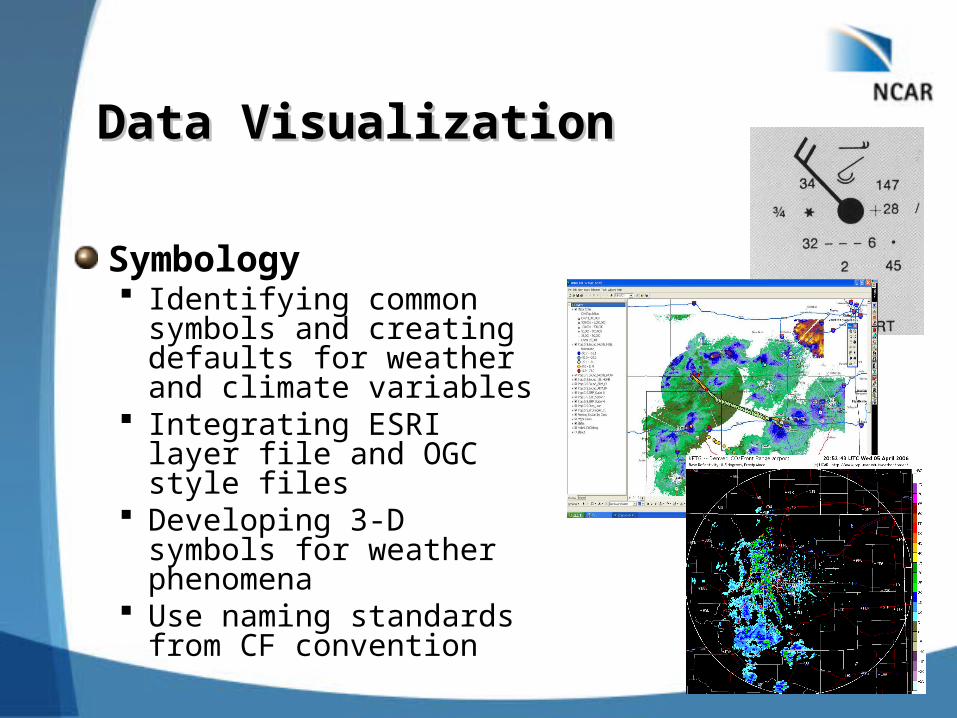
Data VisualizationData Visualization
Symbology Identifying common
symbols and creating defaults for weather and climate variables
Integrating ESRI layer file and OGC style files
Developing 3-D symbols for weather phenomena
Use naming standards from CF convention
Spatial AnalysisSpatial Analysis Interpolation methods More progress in interpolating climate data than
weather data
Challenges Temporal analysis (e.g., time series statistics,
temporal interpolation, analysis and modeling of transitions, raster time series)
Working across scales (upscaling, downscaling)
Many suitable existing geoprocessing tools for Model verification Impact and risk assessment (interdisciplinary) Spatial patterns and suitability analysis

Example: Impacts of Climate Example: Impacts of Climate Change Change
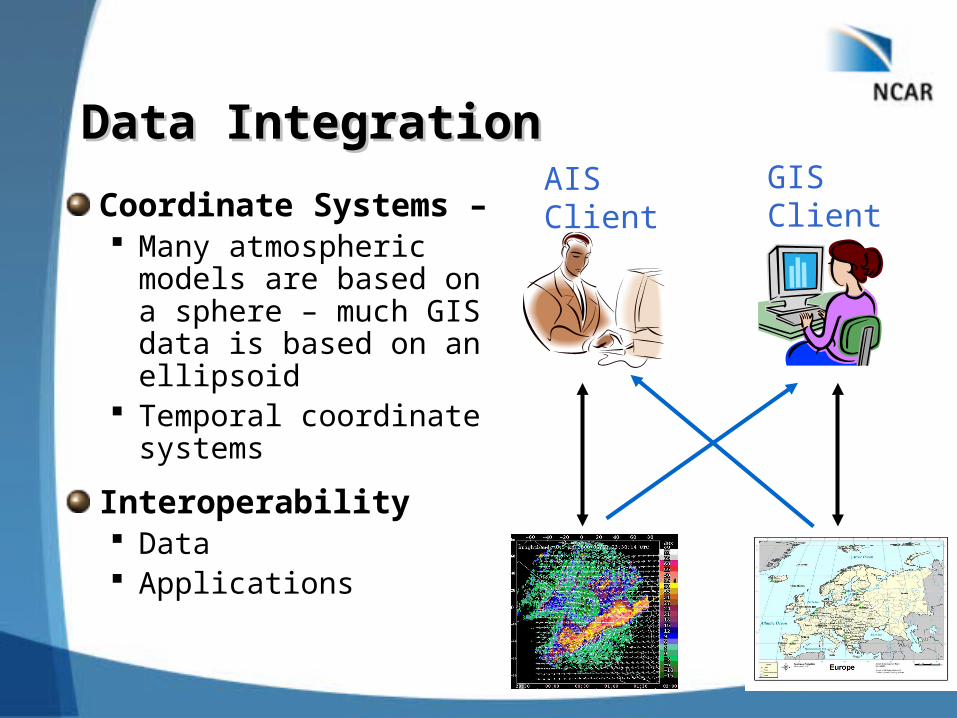
Data Integration Data Integration
Coordinate Systems – Many atmospheric
models are based on a sphere – much GIS data is based on an ellipsoid
Temporal coordinate systems
Interoperability Data Applications
AIS Client
GISClient

Data DistributionData Distribution
Web portals
Data Discovery

Distributing outputs from NCAR’s Global Climate Model (CCSM) in a GIS format (shapefile, text file)
Ongoing work: downscaling
http://www.gisClimateChange.org
Example: GIS Climate Change Example: GIS Climate Change Data PortalData Portal
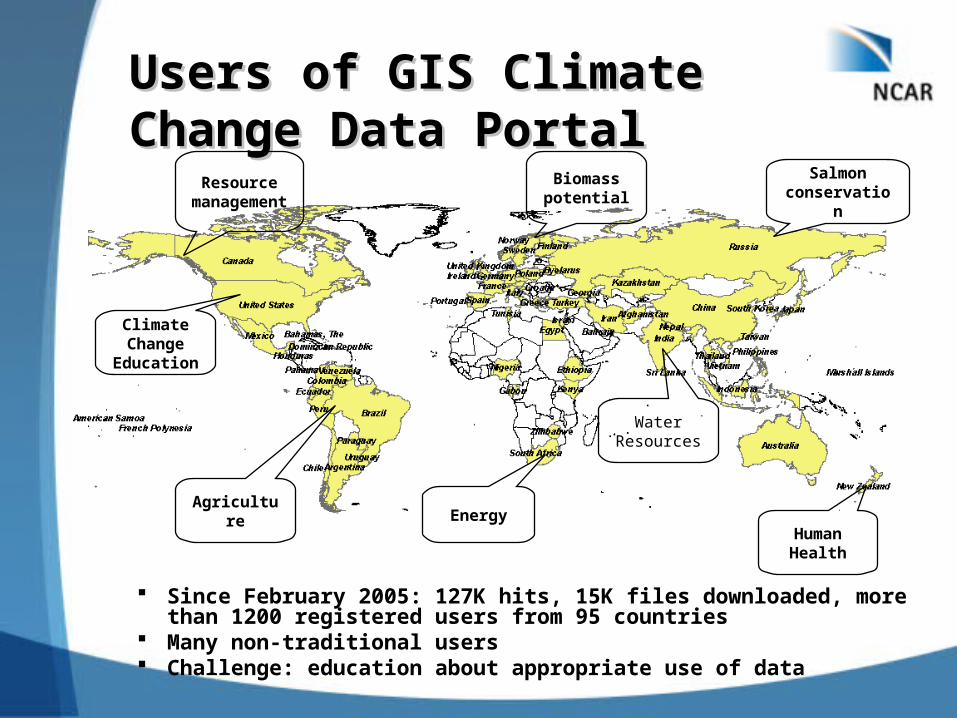
Users of GIS Climate Change Users of GIS Climate Change Data PortalData Portal
Since February 2005: 127K hits, 15K files downloaded, more than 1200 registered users from 95 countries
Many non-traditional users Challenge: education about appropriate use of data
Resource management
Salmon conservation
Human Health
Energy
Water Resources
Agriculture
Biomass potential
Climate Change
Education
Future DirectionFuture Direction
Distributed collaboratories for geosciences Increased computing capacity and capability Increased focus on multidisciplinary research
Web services Self-contained, modular applications that can be described,
published, and accessed over the Internet promote interoperability by minimizing the requirements for
understanding between client and service and between services
Extensible, interoperable web services for data discovery, access and transformation Data services (e.g., WMS, WFC, WCS, ArcGIS server) Geoprocessing services (web GIS, ArcGIS server) Catalog services (e.g., THREDDS, CS-W)
SummarySummary
We are seeing progress in integration of GIS with atmospheric sciences, however many challenges remain
Ongoing work with international data standards, web services, and integration of atmospheric and geospatial data make steps towards better understanding of the Earth System and solving societally relevant problems
ADAGUC is on the right track for addressing challenging questions of data distribution and interoperability

Thank You!Thank You!
For more information:For more information:
http://www.gis.ucar.edu
E-mail: [email protected]