scope workshop sdsc march 19 - 22, 2008 margaret waterman southeast missouri state university ethel...
TRANSCRIPT
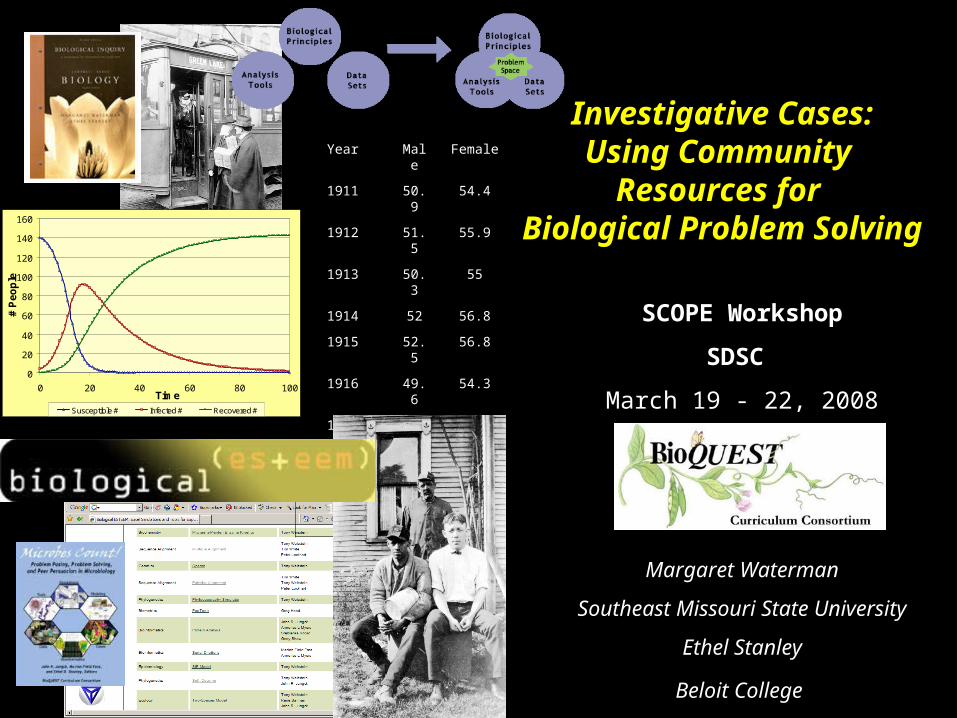
SCOPE Workshop
SDSC
March 19 - 22, 2008
Margaret Waterman
Southeast Missouri State University
Ethel Stanley
Beloit College
Investigative Cases:Using Community
Resources for Biological Problem
Solving
Year Male Female
1911 50.9 54.4
1912 51.5 55.9
1913 50.3 55
1914 52 56.8
1915 52.5 56.8
1916 49.6 54.3
1917 48.4 54
1918 36.6 42.2
1919 53.5 560
20
40
60
80
100
120
140
160
0 20 40 60 80 100Time
# P
eo
ple
Susceptible # Infected # Recovered #
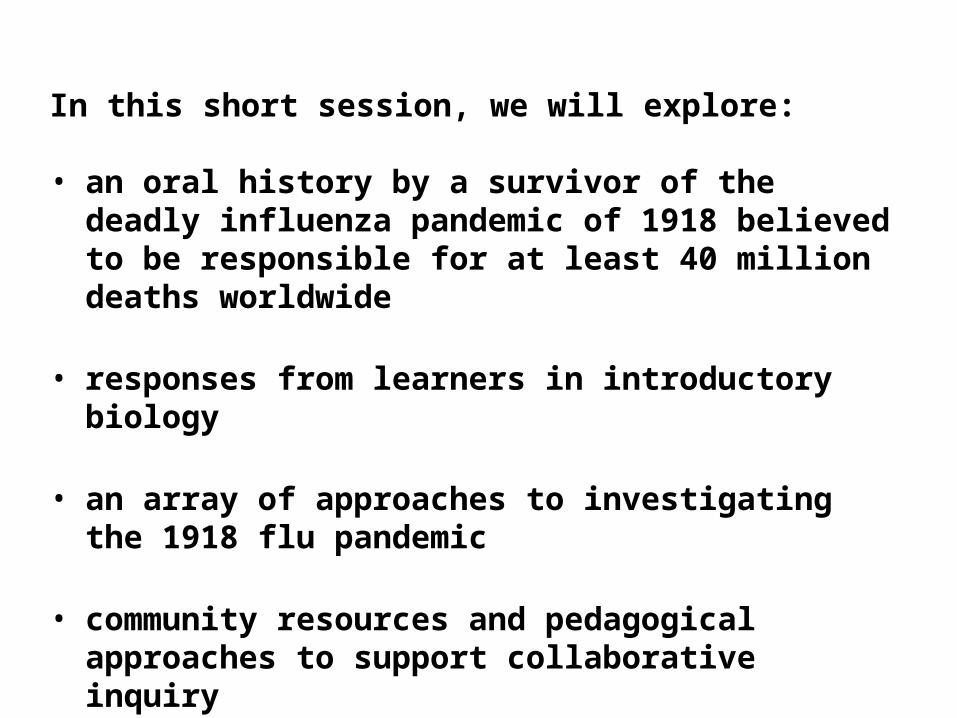
In this short session, we will explore:
• an oral history by a survivor of the deadly influenza pandemic of 1918 believed to be responsible for at least 40 million deaths worldwide
• responses from learners in introductory biology
• an array of approaches to investigating the 1918 flu pandemic
• community resources and pedagogical approaches to support collaborative inquiry
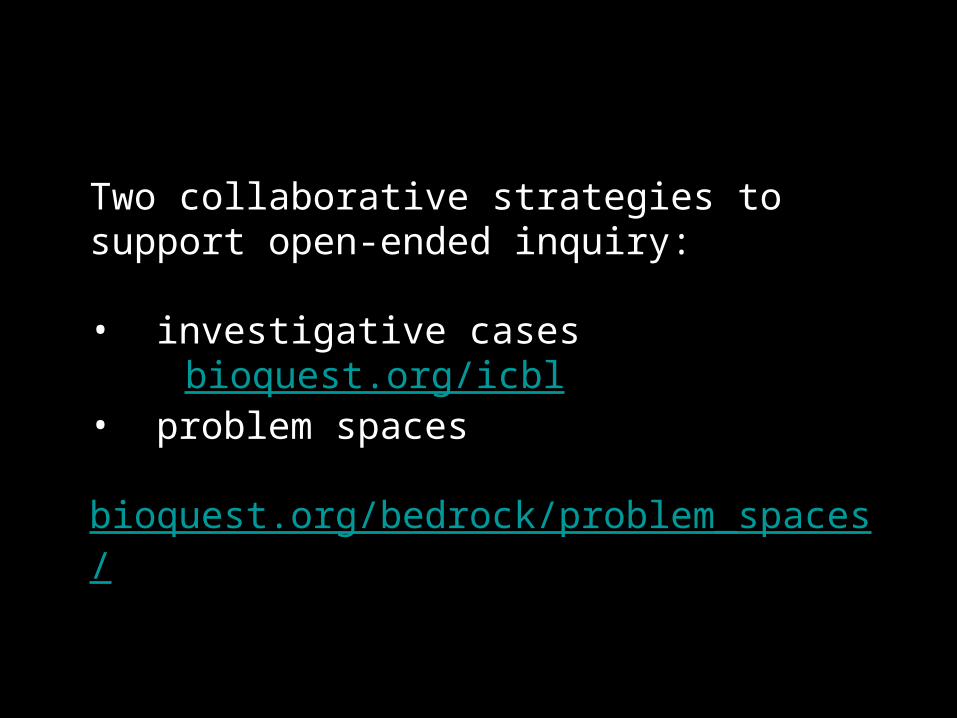
Two collaborative strategies to support open-ended inquiry:
• investigative casesbioquest.org/icbl
• problem spacesbioquest.org/bedrock/problem_spaces/
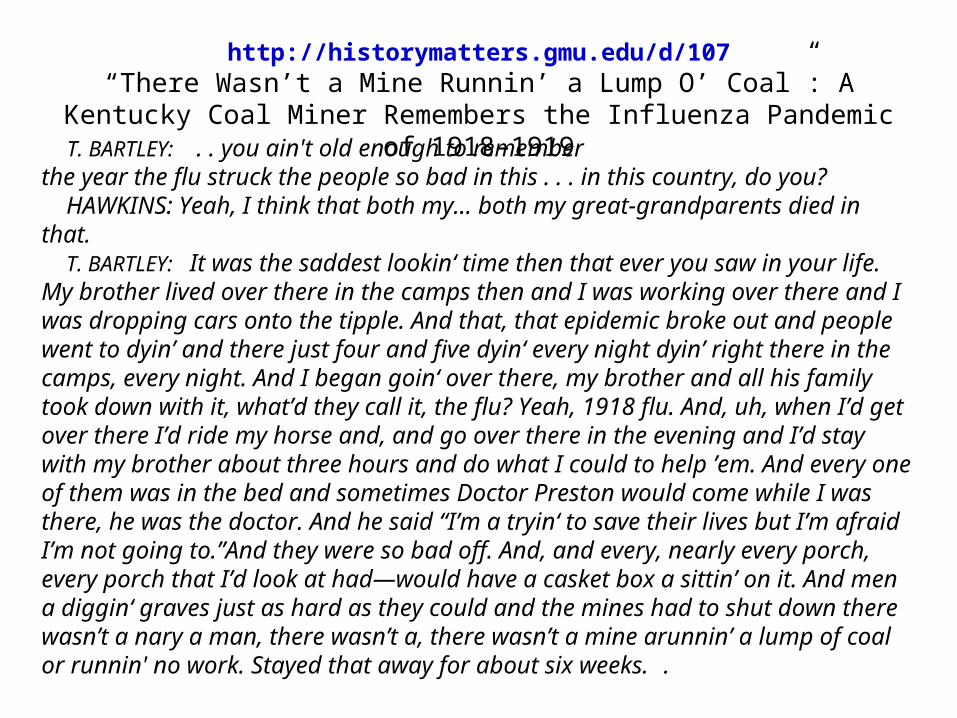
T. BARTLEY: . . you ain't old enough to rememberthe year the flu struck the people so bad in this . . . in this country, do you? HAWKINS: Yeah, I think that both my… both my great-grandparents died in that. T. BARTLEY: It was the saddest lookin‘ time then that ever you saw in your life. My brother lived over there in the camps then and I was working over there and I was dropping cars onto the tipple. And that, that epidemic broke out and people went to dyin’ and there just four and five dyin‘ every night dyin’ right there in the camps, every night. And I began goin‘ over there, my brother and all his family took down with it, what’d they call it, the flu? Yeah, 1918 flu. And, uh, when I’d get over there I’d ride my horse and, and go over there in the evening and I’d stay with my brother about three hours and do what I could to help ’em. And every one of them was in the bed and sometimes Doctor Preston would come while I was there, he was the doctor. And he said “I’m a tryin‘ to save their lives but I’m afraid I’m not going to.”And they were so bad off. And, and every, nearly every porch, every porch that I’d look at had—would have a casket box a sittin’ on it. And men a diggin‘ graves just as hard as they could and the mines had to shut down there wasn’t a nary a man, there wasn’t a, there wasn’t a mine arunnin’ a lump of coal or runnin' no work. Stayed that away for about six weeks. .
http://historymatters.gmu.edu/d/107“There Wasn’t a Mine Runnin’ a Lump O’ Coal”: A Kentucky Coal Miner
Remembers the Influenza Pandemic of 1918–1919
1.What is this narrative about?
2.What do you already know? What would you like to know more about?
KNOW WISH TO KNOW
1.What is this case about?Flu of 1918 and its effects on coal mining, community
Know Wish to Know
There was a pandemic of flu in 1918.It killed many people.It interrupted work, mines closed.Some people lived in camps.It lasted about 6 weeks, according to the transcript.The doctor felt he couldn’t help people get better.Dealing with the dead was a huge issue.In 1918, World War I was ending.There were no vaccines then.Viruses were unknown.Influenza is caused by a virus.There’s a flu shot that you get every year.
Did soldiers/sailors bring the flu from elsewhere?Was there flu in other countries besides the US?How long did it last? What treatments were available then?What treatments were available now? How is flu spread?Why did so many people die of it?What made this particular flu so deadly?Do people die of flu today, like the annual flu? Have there been other epidemics of flu?Could it happen again?

Currently, 16 antigenically distinct groups of H molecules and 9 distinct groups of N molecules have been identified. The immune system responds specifically to each of the H and N surface proteins found in a virus particle. How many possible combinations of H and N could occur?
Human glycoprotein receptors (eyes, nose, upper throat) for H1, H2 and H3 influenza A facilitate transmission of these strains among humans. How many of the total influenza A combinations above would you expect to be easily transmissible to humans?
Content, directive

Interactive Maps
• http://news.bbc.co.uk/1/shared/spl/hi/world/05/bird_flu_map/html/1.stm
• http://www.msnbc.msn.com/id/12375868/from/ET/
http://www.demog.berkeley.edu/~andrew/1918/
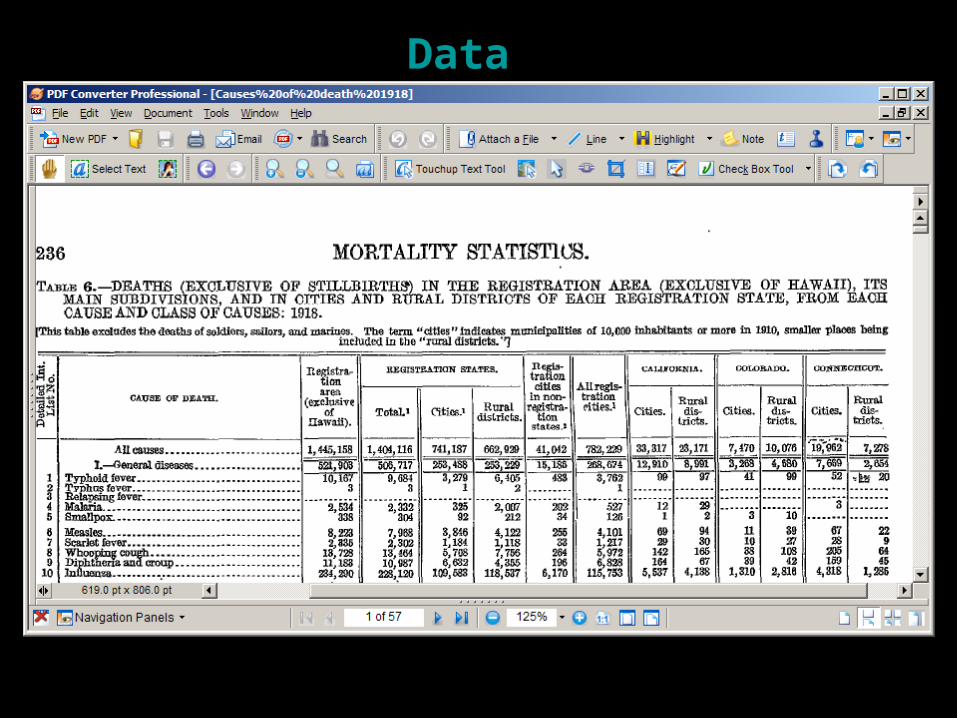
Data
Year Male Female
1911 50.9 54.4
1912 51.5 55.9
1913 50.3 55
1914 52 56.8
1915 52.5 56.8
1916 49.6 54.3
1917 48.4 54
1918 36.6 42.2
1919 53.5 56
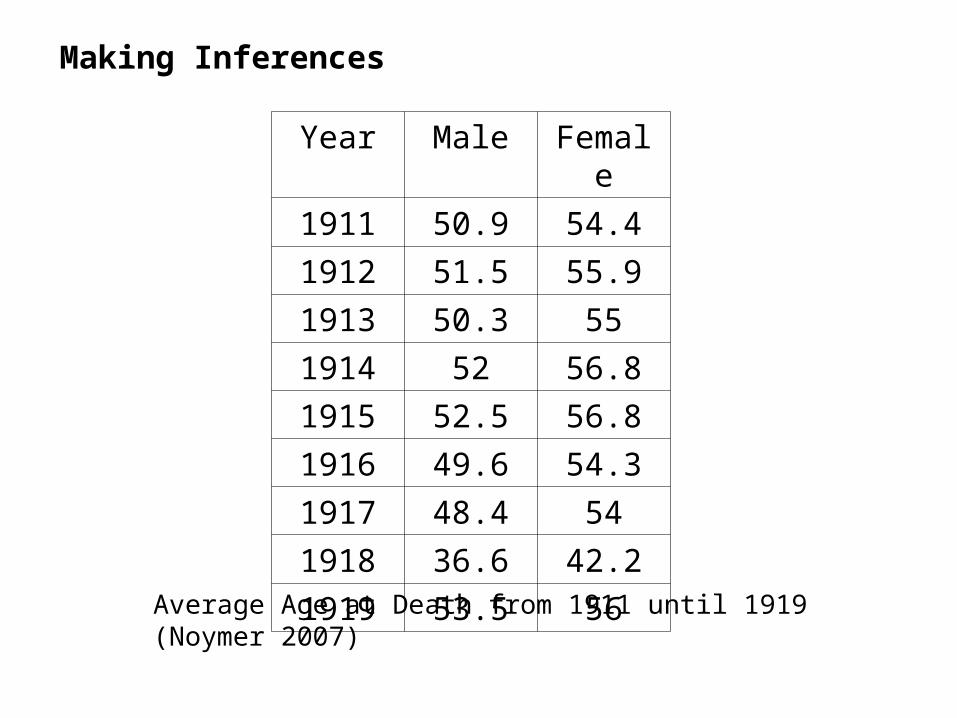
Average Age at Death from 1911 until 1919 (Noymer 2007)
Making Inferences
Age 1917 1918
<1 2944.5 4540.9
1--4 422.7 1436.2
5--14 47.9 352.7
15-24 78 1175.7
25-34 117.7 1998
35-44 193.2 1097.6
45-54 292.3 686.8
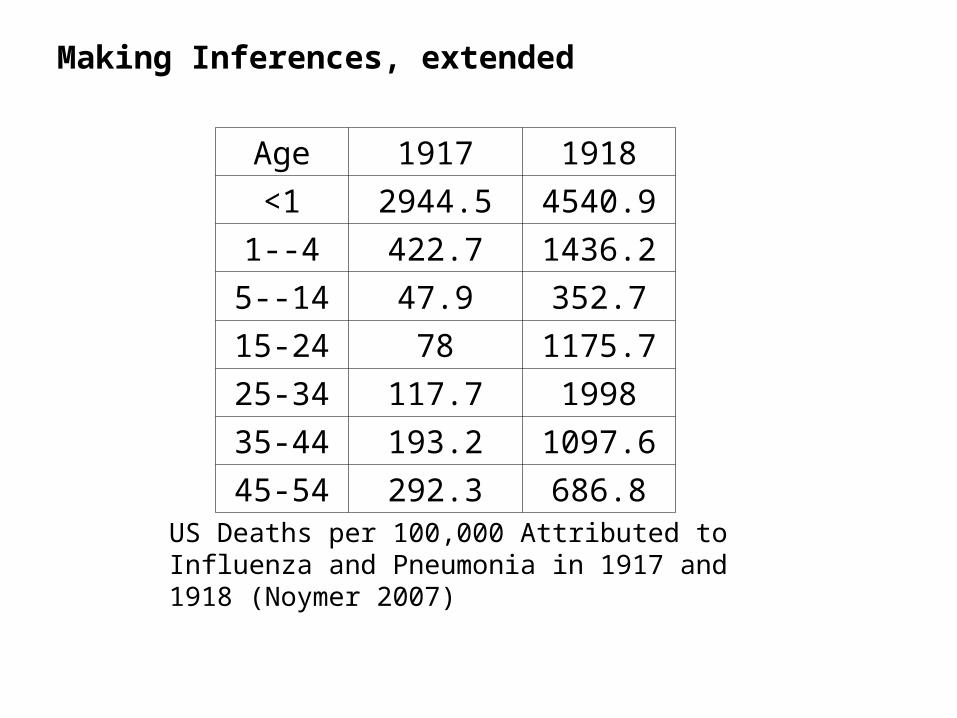
US Deaths per 100,000 Attributed to Influenza and Pneumonia in 1917 and 1918 (Noymer 2007)
Making Inferences, extended
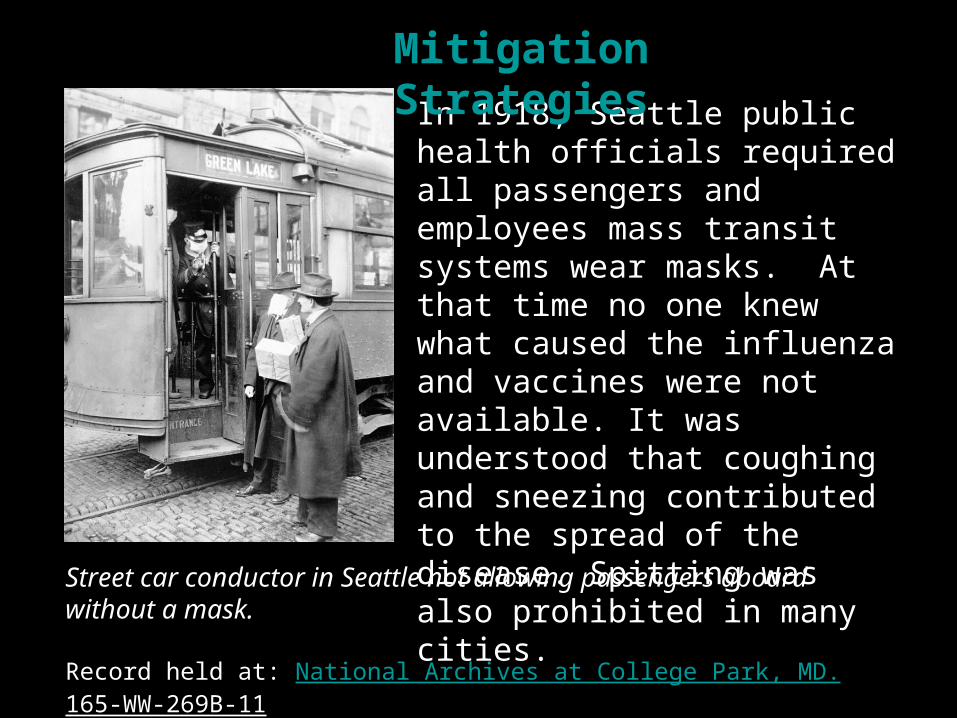
Street car conductor in Seattle not allowing passengers aboard without a mask.
Record held at: National Archives at College Park, MD. 165-WW-269B-11
In 1918, Seattle public health officials required all passengers and employees mass transit systems wear masks. At that time no one knew what caused the influenza and vaccines were not available. It was understood that coughing and sneezing contributed to the spread of the disease. Spitting was also prohibited in many cities.
Mitigation Strategies
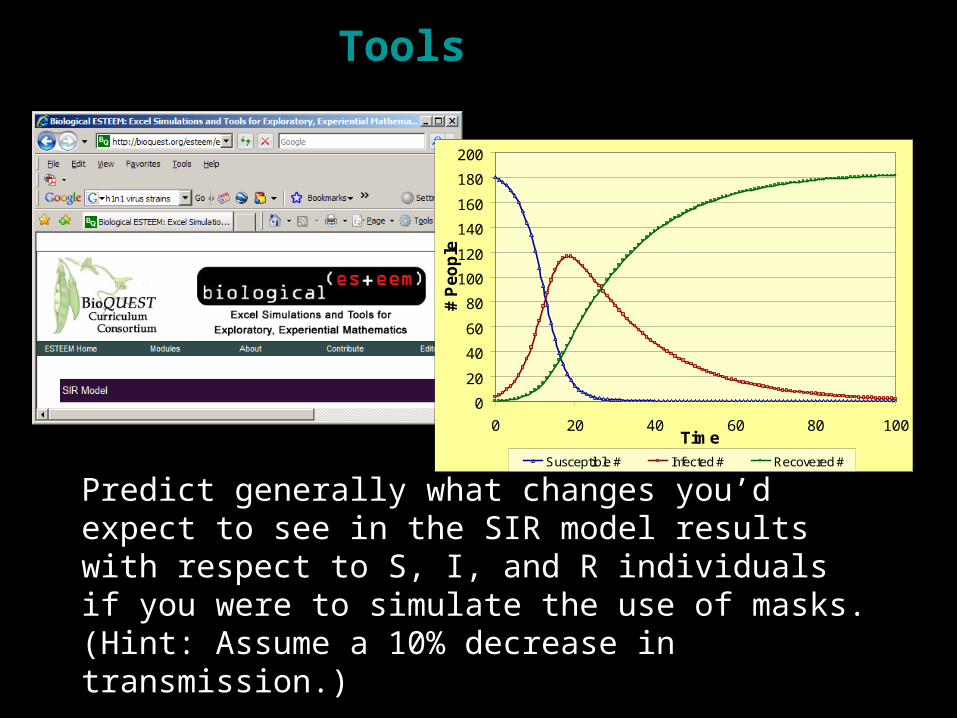
Predict generally what changes you’d expect to see in the SIR model results with respect to S, I, and R individuals if you were to simulate the use of masks. (Hint: Assume a 10% decrease in transmission.)
0
20
40
60
80
100
120
140
160
180
200
0 20 40 60 80 100Time
# P
eo
ple
Susceptible # Infected # Recovered #
Tools

Resources from Biological ESTEEM: Excel Simulations and Tools for Exploratory, Experiential Mathematics
http://bioquest.org/
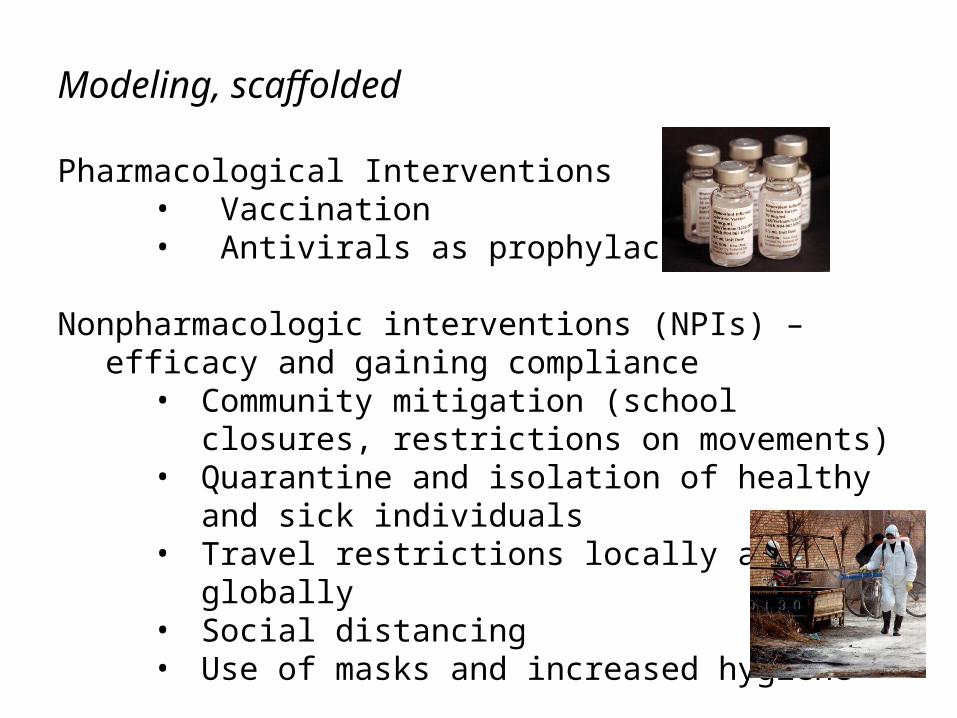
Modeling, scaffolded
Pharmacological Interventions• Vaccination• Antivirals as prophylactics
Nonpharmacologic interventions (NPIs) – efficacy and gaining compliance
• Community mitigation (school closures, restrictions on movements)
• Quarantine and isolation of healthy and sick individuals
• Travel restrictions locally and globally• Social distancing • Use of masks and increased hygiene
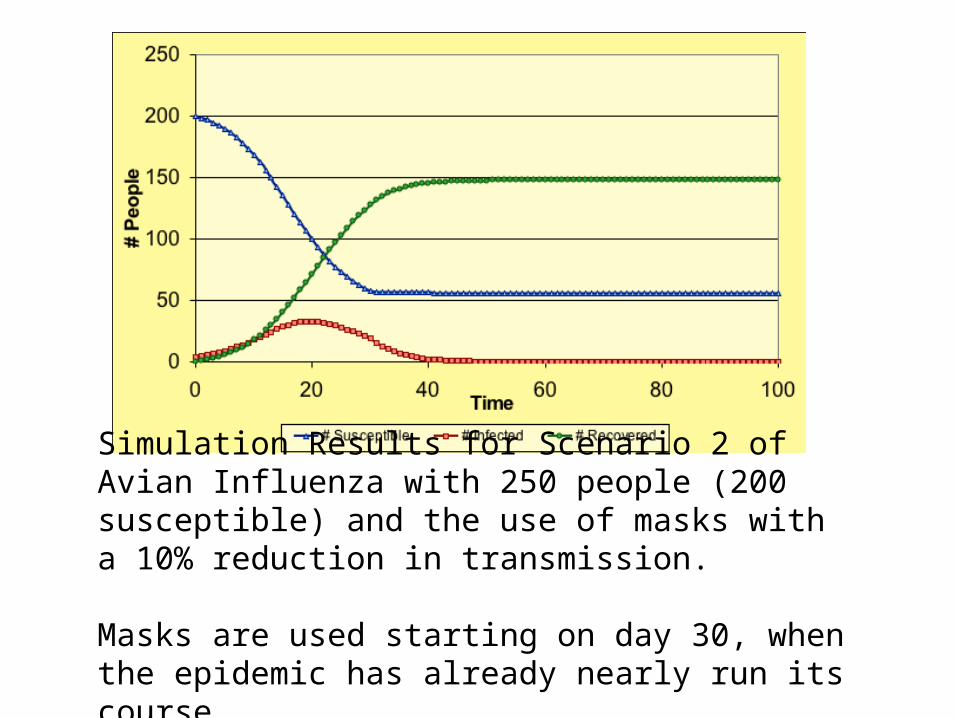
Simulation Results for Scenario 2 of Avian Influenza with 250 people (200 susceptible) and the use of masks with a 10% reduction in transmission.
Masks are used starting on day 30, when the epidemic has already nearly run its course.
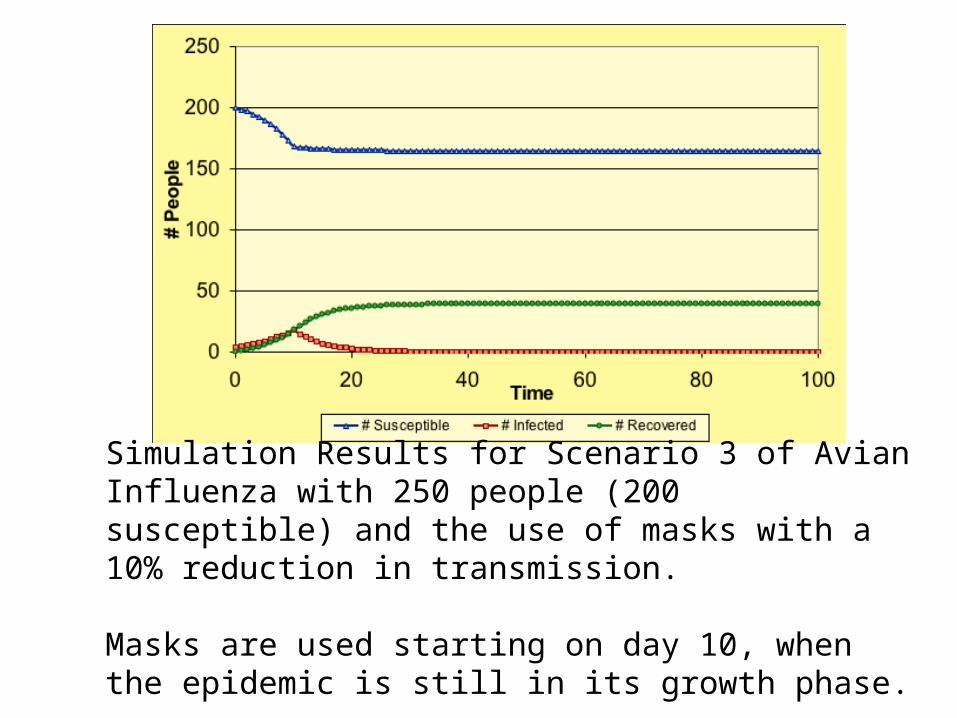
Simulation Results for Scenario 3 of Avian Influenza with 250 people (200 susceptible) and the use of masks with a 10% reduction in transmission.
Masks are used starting on day 10, when the epidemic is still in its growth phase.
Extended, open-ended
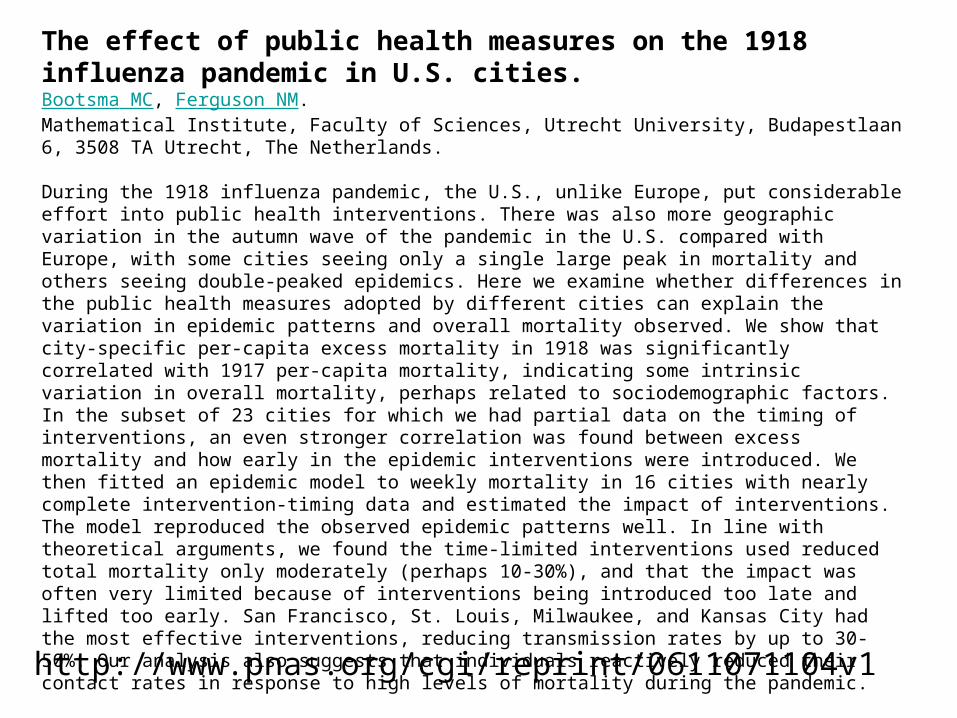
The effect of public health measures on the 1918 influenza pandemic in U.S. cities.Bootsma MC, Ferguson NM.Mathematical Institute, Faculty of Sciences, Utrecht University, Budapestlaan 6, 3508 TA Utrecht, The Netherlands.
During the 1918 influenza pandemic, the U.S., unlike Europe, put considerable effort into public health interventions. There was also more geographic variation in the autumn wave of the pandemic in the U.S. compared with Europe, with some cities seeing only a single large peak in mortality and others seeing double-peaked epidemics. Here we examine whether differences in the public health measures adopted by different cities can explain the variation in epidemic patterns and overall mortality observed. We show that city-specific per-capita excess mortality in 1918 was significantly correlated with 1917 per-capita mortality, indicating some intrinsic variation in overall mortality, perhaps related to sociodemographic factors. In the subset of 23 cities for which we had partial data on the timing of interventions, an even stronger correlation was found between excess mortality and how early in the epidemic interventions were introduced. We then fitted an epidemic model to weekly mortality in 16 cities with nearly complete intervention-timing data and estimated the impact of interventions. The model reproduced the observed epidemic patterns well. In line with theoretical arguments, we found the time-limited interventions used reduced total mortality only moderately (perhaps 10-30%), and that the impact was often very limited because of interventions being introduced too late and lifted too early. San Francisco, St. Louis, Milwaukee, and Kansas City had the most effective interventions, reducing transmission rates by up to 30-50%. Our analysis also suggests that individuals reactively reduced their contact rates in response to high levels of mortality during the pandemic.
http://www.pnas.org/cgi/reprint/0611071104v1
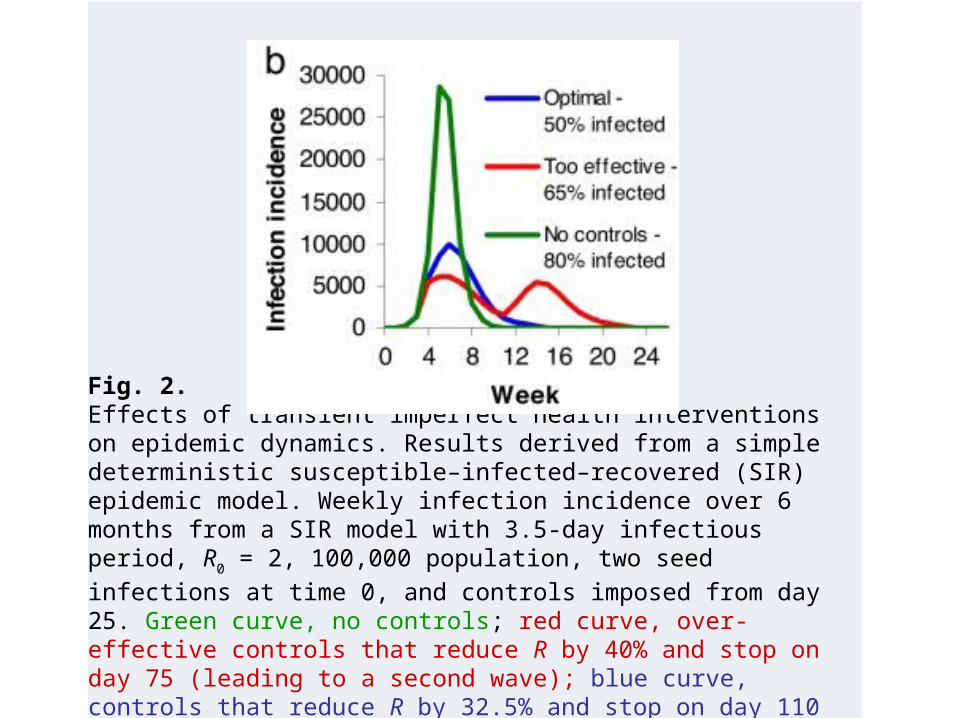
Fig. 2.Effects of transient imperfect health interventions on epidemic dynamics. Results derived from a simple deterministic susceptible–infected–recovered (SIR) epidemic model. Weekly infection incidence over 6 months from a SIR model with 3.5-day infectious period, R0 = 2, 100,000
population, two seed infections at time 0, and controls imposed from day 25. Green curve, no controls; red curve, over-effective controls that reduce R by 40% and stop on day 75 (leading to a second wave); blue curve, controls that reduce R by 32.5% and stop on day 110 (giving the minimal possible epidemic size).

Questions?