· pdf filescores highest among gcc on ... as can also be seen in the fall in dubai property...
TRANSCRIPT

Mashreq
INVESTOR PRESENTATION
December 2017
2
50 years…
S P I R I TSocially
Responsible
Passionate
about clientsInnovative
Respect for
colleaguesIntegrity Transparent
“To be the region’s most progressive bank
enabling innovative possibilities for our
clients, colleagues and communities”
3
Mashreq
Investor
Presentation
UAE economy
Mashreq heritage
Structure and Leadership
Strategy
Financial track record
Trading history, rating and dividends
Corporate governance
Accolades

4
3.53.23.0
2.62.0
1.7
KSA Bahrain Oman Qatar UAE Kuwait
UAE is the 2nd largest economy in the GCC, with promising economic growth
prospects
UAE - The second largest economy in the GCC Real GDP Growth Potential
– 2017-22F (%)
A1 B1 Baa2 Aa3 Aa2 Aa2
Sovereign Rating
by Moody’s
72 679 34 118 379 166
Nominal GDP per Capita – 2017
(USD thousand)
GDP Breakdown by Sector – 2016
(%)Nominal GDP
2017 (USD billion)
Source: IMF WEO October 2017,CIA & OPEC, Moody‘s Ratings, National Bureau of Statistics
UAE ECONOMY – MACROECONOMIC OUTLOOK
▪ Second largest economy in the GCC with nominal GDP of
USD 379bn in 2017
▪ Well diversified economy with oil & gas contributing only
~21% of the total GDP
▪ Despite fall in oil prices, UAE economy remained strong
with current account surplus at 2.1% of GDP in 2017
▪ Holds 8.0% of the proven OPEC crude oil reserves,
primarily concentrated in Abu Dhabi
▪ Young population with ~61.1% aged between 25-54 years
and a literacy rate of ~94%
60.8
37.3
21.017.425.2 27.2
KSAOman UAEKuwaitBahrain Qatar
9%10%
10%
7%
13%
15%
7%
7%
1%
21%Construction
Government Services
Wholesale Retail Trade
Other
Transport, Storage & Communication
Real Estate
Financial Corporations
Manufacturing
Crude Oil and Natural Gas
Agriculture

5
1 Rank out of 137 economies
UAE ECONOMY – MACROECONOMIC OUTLOOK
Current Account Balance to GDP – 2017
(%)
Govt. Net Borrowing to GDP – 2017
(%)
Global Competitiveness Index – 2017-18 Ranking1 Inflation to Remain Stable Over the Medium Term
(%)
One of the best ranked economies on global competitive index among the
GCC nations
Source: IMF WEO October 2017, World Economics Forum-Global Competitiveness Index 2017
1.5
-1.0-3.7
-8.6-13.0-13.2
Bahrain Oman KSA UAE Qatar Kuwait
2517
30
UAE Qatar
44
KSA
52
Bahrain
62
Kuwait Oman
2.32.10.6
-0.6-4.6
-14.3
Kuwait KSA QatarUAEOman Bahrain
1.9
2.32.42.3
2.9
2.1
2018E2017E 2019E 2021E 2022E2020E
6
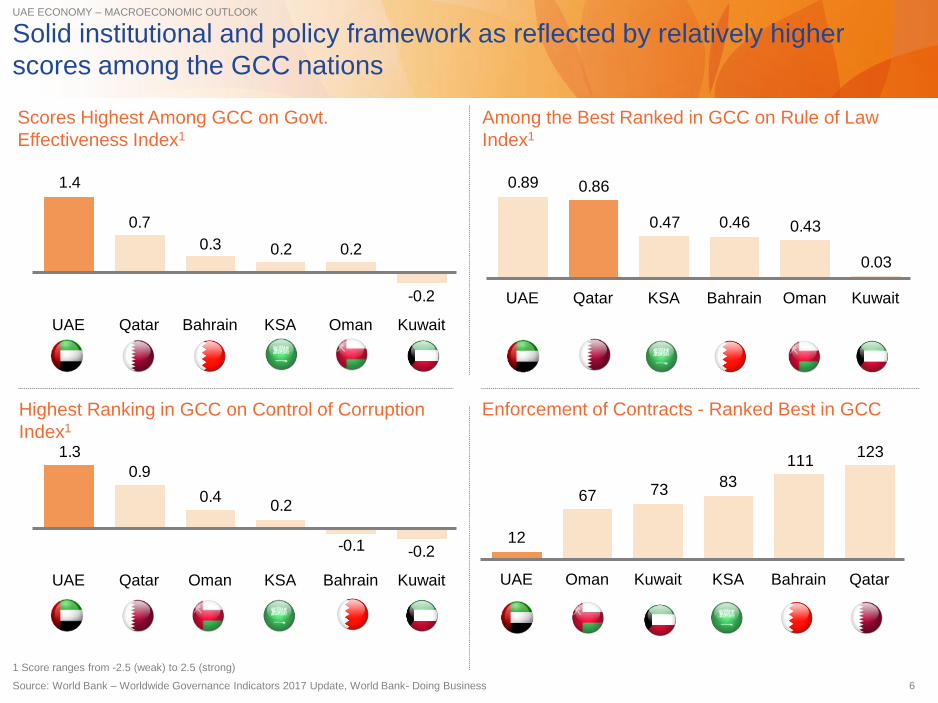
UAE ECONOMY – MACROECONOMIC OUTLOOK
Scores Highest Among GCC on Govt.
Effectiveness Index1
Among the Best Ranked in GCC on Rule of Law
Index1
Highest Ranking in GCC on Control of Corruption
Index1
Enforcement of Contracts - Ranked Best in GCC
Solid institutional and policy framework as reflected by relatively higher
scores among the GCC nations
0.03
0.430.460.47
0.860.89
KuwaitUAE Qatar KSA Bahrain Oman
-0.2-0.1
0.20.4
0.9
1.3
KSAOman KuwaitBahrainUAE Qatar
-0.2
0.20.20.3
0.7
1.4
BahrainQatarUAE KSA Oman Kuwait
123111
837367
12
OmanUAE QatarBahrainKuwait KSA
1 Score ranges from -2.5 (weak) to 2.5 (strong)
Source: World Bank – Worldwide Governance Indicators 2017 Update, World Bank- Doing Business

7
Non-oil growth is supported by strong hospitality and logistics sectors
UAE ECONOMY – MICROECONOMIC OUTLOOK
Non-oil growth continues to be steady with PMI remaining
above 50
Emirates NBD UAE PMI index
Increasing rate of growth
The hospitality sector, especially in Dubai, is one of the major
growth drivers …
Hotel guests (million) Air passengers (million)
50 – no change on previous month
Increasing rate of contraction
15.814.9
14.213.2
11.010.0
4.94.44.13.52.82.4
201720162015201420132012
8884
7870
6658
252523201715
201720162015201420132012
Abu DhabiDubai
2.3 2.4 2.4 2.5 2.6 2.7
2017
3.5
0.8
2016
3.4
0.8
2015
3.3
0.8
2014
3.2
0.8
2013
3.1
0.7
2012
2.9
0.6
Abu DhabiDubai
21.020.421.220.218.618.0
668 685 696952 969
170
185 195219 232 244
419 400
944
185
433
1,563
1,057
1,5641,556
1,072
132
1,065
148
20162013 20152012 2014 2017
… along with the logistic sector
UAE container volumes (TEU million)
UAE air freight (million tonnes)
Non-oil direct trade flows have witnessed steady growth over the
last few years
UAE non-oil direct trade flows (AED billion)
CAGR
’12-’17
7.2%
1.8%
14.6%
Source: Emirates NBD, Federal Customs Authority, Hotel and Airport authorities of UAE, World Bank, Khaleej Times, National
40
45
50
55
60
65
585756
55
585656
55565756
5555
Dec-
16
SepAugJulJunMayAprMarFebJan Oct Nov Dec-
17
ImportsExportsRe-exports

8
40
45
50
55
60
65
Consumer borrowing has slowed due to flat employment levels
Source: JLL, UAE Central Bank, Emirates NBD
UAE ECONOMY – MICROECONOMIC OUTLOOK
… due to flat employment levels
Emirates NBD Employment index (#)
Increasing rate of growth
50 – no change on previous month
338326311283
265
+6%
20172016201520142013
5151515152515051
5251515252
SepAugJulJun NovOct Dec-17
MayAprMarFebJanDec-
16
Increasing rate of contraction
… as can also be seen in the fall in Dubai property prices over the
year
Mashreq Property Price Index (%)
Domestic credit to Individuals (AED Bn)
Consumer borrowing growth has slowed…
Rents continue to be falling …
Dubai 4Q ‘17 Abu Dhabi 4Q ‘17
Residential Office Retail Hotel
Rent
falling
Rent
bottoming
out
Rent
growth
slowing
Rent
growth
acceler-
ating
Rent
falling
Rent
bottoming
out
Rent
growth
slowing
Rent
growth
acceler-
ating
0.0-0.1-0.1-0.2-0.2-0.2-0.2-0.2-0.2-0.2-0.2-0.5-0.2
13.713.713.813.914.014.314.414.714.815.015.315.515.9
-5
0
5
10
15
20
Oct-
17
Sep-1
7
Aug-1
7
Jul-
17
Jun-1
7
May-1
7
Apr-
17
Mar-
17
Feb-1
7
Jan-1
7
De
c-1
6
Dec-1
7
Nov-1
7
Avg MPPI inc (%) Cum MPPI inc (%)

9
UAE ECONOMY – BANKING SECTOR OVERVIEW
Diversified and Well Regulated Banking Sector GCC Banking Assets1 – 2017 (AED billion)
UAE – Gross Credit & Deposits (AED billion) UAE – Loans by Sector – 9M 2017 (%)
Total Banking Assets to GDP Ratio
Regulated & Diversified Banking Environment
194% 91% 226% 178% 101% 173%
215267774
1,378
2,2602,695
BahrainKSA Qatar KuwaitUAE Oman
▪ As of December 2017, UAE banking sector comprised 49
banks
– 22 National Banks with 771 branches and
– 27 Foreign Banks with 82 branches
▪ Diversified loan portfolio - Real Estate and Construction
sector accounted for only ~20% of loan book in 9M 2017
▪ Well regulated banking system, in line with internationally
followed best practices
▪ UAE Banking sector has a long-standing track record of
Government support during crisis situations
Deposit
Gross credit
1,5811,5741,485
1,2761,378
1,6271,5631,472
1,2791,168
1,421
2012 20152013 2014
1,184
20172016
CAGR 2012- 2017: 6.0%
Source: UAE Central Bank, Central Bank of other respective countries, IMF WEO October 2017, Khaleej Times
6%
5%
10%
11%
1%
20%
9%
22%
0%1%
4%
9%
Electricity, Gas and Water
Transport, Storage & Comm
Personal Loans for Business
Manufacturing
Trade
Government
Others2
Mining and Quarrying
Construction and Real Estate
Financial Institutions (Ex. Banks)
Personal Loans for Consumption
AgricultureCAGR 2012- 2017: 6.9%
1Data for Bahrain relates to Nov 2017

10
Mashreq
Investor
Presentation
UAE economy
Mashreq heritage
Structure and Leadership
Strategy
Financial track record
Trading history, rating and dividends
Corporate governance
Accolades

11
Mashreq is one of UAE's leading financial institutions
Established in 1967 by the Al-Ghurair Group
51 years in UAE banking and financial services marketHeritage
Oldest regional bank based out of UAE
Combines the entrepreneurial spirit of Dubai with enduring trade banking relationships across the region
Listed on the DFM on creation of local stock exchange
Publicly listed
Prominent Regional bank with presence in most GCC countries and leading international network with
24 branches / rep-offices in MENA, Asia, Europe and United States
Well positioned to finance regional trade flows
Strong
regional /
international
presence
Universal bank offering a comprehensive suite of products and services to individuals and corporates
across all lines of business
Most diversified revenue streams with fee and other income contributing over 40% of total income; high
degree of geographic diversification with 21% of revenue coming from outside UAE
Diversified
business case
Long serving senior executives along with international management expertise delivering a robust
growth model
Led by Abdul Aziz Abdulla Al-Ghurair, Chief Executive Officer for 28 years
Strong
management
team
Al-Ghurair Group, the main shareholders of the bank, are a leading conglomerate in the UAE with
numerous business interests
Featured in the Forbes billionaire list for the last 10 years
Mashreq is the flagship business for the family for over 50 years
Strong and
supportive
ownership
structure
MASHREQ HERITAGE

12
Ownership – Al-Ghurair flagship brand
Key shareholders (December 2017)
Stable and supportive ownership structure
MASHREQ HERITAGE
Mashreq’s Leadership
Mr. Abdulla Bin Ahmad Al-Ghurair
Chairman
H.E. Abdul Aziz Abdulla Al-Ghurair
Chief Executive Officer & Director
9.6%
3.5%
3.6%
12.7%
31.1%
39.5%
Other shareholders
National Cement Company
Majid Capital
Masar Investments
Abdulla Ahmed Al Ghurair Inv. Co.
Saif Al Ghurair Investment LLC
▪ One of the most prominent businessmen and
industrialists in the UAE
▪ Former Chairman of the UAE Banks Association
▪ Chairman of UAE Banks Federation
▪ Vice Chairman of the higher board of DIFC
▪ Chairman of Masafi
▪ Chairman of Oman Insurance
▪ Board Member of Emirates Foundation
▪ Former Speaker of the Federal National Council
▪ Al-Ghurair families holds the majority stake in
Mashreq (approximately 87%) and are the
founders of the Bank
▪ Al-Ghurair family has a strong commitment to
the continued growth and financial solidity of
Mashreq
▪ Al-Ghurair family is one of the oldest and
wealthiest families in the UAE
– Featured in Forbes billionaire list for over
10 years
– Business interests include shopping
malls, real estate, cement manufacturing,
food industries, Masafi (mineral) water,
contracting, trading, retailing, shipping,
printing & packaging, aluminium
extrusion, building materials, oil refinery,
manufacturing, steel and canning
▪ Mashreq’s shares are listed and traded on
the Dubai Financial Market

13
Strong distribution network in the UAE with 26 branches in Dubai
MASHREQ HERITAGE
Umm Al Quwain
1 branch
Abu Dhabi
12 branches
Ajman
1 branch
Ras Al Khaimah
1 branch
Fujairah
1 branch
Sharjah
8 branches
Dubai
26 branches
Alternate Channels
▪ 50 branches (out of which Mashreq Gold has
presence in 29 branches and SME Banking has
presence in 24 branches) and a Retail Customer
Service Center in UAE serving ~500K customers
▪ ATMs and CCDMs increased coverage to 343 units
in UAE
▪ 35,000 POS machines spread 14,000 merchant
location in the UAE. Second Largest Merchant
acquirer in the UAE with close to 30% market share
▪ Internet Banking through Mashreq Online (Retail incl.
Brokerage), Mashreq Business online (Corporate),
Mashreq-FI online (Correspondent Banking); 306,662
active users are registered with online banking
▪ Mobile banking services: Snapp registration has
grown up by 29% year on year and financial
transactions has grown by 21% as compared to last
year figures. Snapp has been recently upgraded with
unique new features such as transfer your credit card
balance from other banks card control, Quick remit to
Pakistan, Mashreq Pay and Samsung Pay.
▪ Fully integrated electronic platform for transaction
banking (GTS)
▪ State of the art Polaris System (mashreqMATRIX) to
provide online services to corporate customers
▪ 24 x 7 Direct Banking Call Centre

14
Regional and international banking presence with 21% of revenues from
outside of UAE
International
branches
Financial Institution
branches
New York
London
Representative
Offices
Hong KongIndia
Bangladesh
NepalPakistan
EgyptKuwait
Bahrain
Qatar
MASHREQ HERITAGE

15
Strong track record in International expansion
972
1967
1971
1980
1984
2009
1978
1981
2001
2010
UAEEgypt, London,
Pakistan, Hong Kong Nepal
Qatar India Kuwait
10
11
12
Presence in number of countries
Bahrain
New York
Bangladesh
MASHREQ HERITAGE
16
Mashreq
Investor
Presentation
UAE economy
Mashreq heritage
Structure and Leadership
Strategy
Financial track record
Trading history, rating and dividends
Corporate governance
Accolades

17
Mashreq organization chart
STRUCTURE AND LEADERSHIP
Note: Financials as of 30 December 2017
Board of Directors
Chief Executive Officer
Corporate Banking
Group (CBG)(23% of revenue)
Treasury & Capital
Markets (TCM)(10% of revenue)
Retail Banking
Group (RBG) (26% of revenue)
International Banking
Group (IBG)(21% of revenue)
Corporate Affairs
(CA)
Audit , Fraud &
Compliance Group
(AFCG)
Risk
Management (RM)
Operations &
Technology (O&T)

18
Mashreq is a well diversified universal bank that covers significant lines of
business with a full product and channel suite
Corporate Banking
Group (CBG)
Energy, Services &
Manufacturing
Trading
Contracting Finance
Real Estate
NBFI
Emerging Corporates
Division
Global Transaction
Services
Corporate Finance
Islamic Banking products
Offers wholesale banking
Treasury & Capital
Markets (TCM)
FX and Investments
Rates & Structured
Solutions
Mashreq Capital
Islamic banking products
Equity Derivatives &
Institutional Sales
Mashreq Securities
Investments
Offers treasury &
investment products
Retail Banking Group
(RBG)
Personal Banking
SME
Mashreq Gold
Private Banking
Payments
Islamic banking products
Distribution
Alternate Channels
Direct Sales
Direct Banking Centre
Offers personal banking
International Banking
Group (IBG)
Wholesale and
investment banking
Treasury and investment
products
Personal banking
Financial Institutions
globally
Islamic banking products
Offers banking services
outside UAE
Note: Islamic banking and Insurance segments contributes the remaining revenue
STRUCTURE AND LEADERSHIP

19
Oman Insurance is the largest subsidiary of Mashreq
Mashreqbank Psc
Note: Figures are based on draft audited statements
Mashreq Al Islami Finance (99.8%)
▪ Islamic Finance Company
▪ Provides full range of Islamic Products & Services
▪ Dec ’17 Equity: AED 832 Mn
▪ FY 2017 profit: AED 37 Mn
Mashreq Securities (99.98%)
▪ Securities brokerage Company registered at Dubai
Financial Market
▪ One of the leading brokerage in the UAE
▪ Dec ’17 Equity: AED 79 Mn
▪ FY 2017 Profit: AED 3 Mn
Oman Insurance Company (63.94%)
▪ Largest insurance company in the UAE
▪ Provides full range of Insurance Products &
Services
▪ Dec ’17 Equity: AED 2,039 Mn
▪ FY 2017 profit: AED 105 Mn
Mashreq Capital (100%)
▪ Registered in DIFC for Brokerage, Asset
Management and Fund Management services
▪ One of the largest asset management in UAE with
USD 800 mn in asset under management
▪ Funds rated highest in the market
▪ Dec ’17 Equity: AED 26 Mn
▪ FY 2017 profit: AED 4 Mn
STRUCTURE AND LEADERSHIP

20
Corporate Banking (CIBG) business
STRUCTURE AND LEADERSHIP
1,3611,3191,324
+3%
2017
0%
20162015
CIBG Revenues (AED million)Business highlights
CIBG Assets (AED million)
▪ Corporate banking is the biggest segment in Mashreq in
terms of assets (26% of total assets) & liabilities (31% of
total liabilities)
▪ Corporate Banking Group provides financing solutions to
corporate and commercial customers in the UAE
▪ Major products offered include trade finance, contracting
finance, project finance, corporate finance advisory and
cash management
▪ Corporate Banking has moved to a best-in-class, expertise-
led coverage model for clients. The relationship teams have
been realigned into industry verticals that best serve the
corporate financial needs. Our diverse industry coverage
includes among others: Contracting Finance, Services &
Manufacturing, Government, Multinational Corporates, Real
Estate, Trading Companies, Non-Banking financial
Institutions and Emerging Corporates – including DXB NE &
Abu Dhabi.
▪ The Corporate Finance team has retained its position
amongst the premier institutions for debt capital raising in
the region. Mashreq was amongst the top 5 loan
Bookrunners in the GCC per Bloomberg
▪ Mashreq’s Global Transaction Services team maintained its
regional dominance in the transaction banking space by
winning 8 awards in 2017 for Trade finance, Factoring and
Cash Management.
▪ In line with its Mission Mashreq continued to lead
innovation, GTS won the innovators award 2017 by Global
Finance for providing cardless cash to its corporate clients,
a first in the region solution. Mashreq was also the first bank
to go live in the region with SWIFT ‘s Global Payment
Initiative.
32,79830,91129,501
+5%+6%
Dec-17Dec-16Dec-15
21
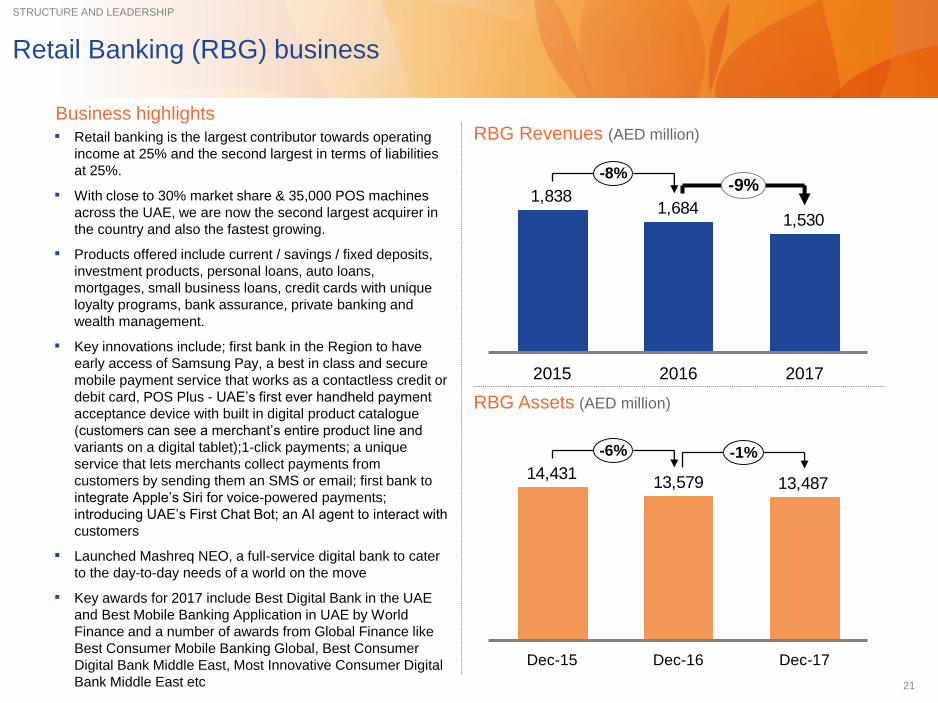
Retail Banking (RBG) business
13,48713,57914,431
-6% -1%
Dec-17Dec-16Dec-15
STRUCTURE AND LEADERSHIP
1,5301,684
1,838
2017
-8%
20162015
-9%
Business highlights
▪ Retail banking is the largest contributor towards operating
income at 25% and the second largest in terms of liabilities
at 25%.
▪ With close to 30% market share & 35,000 POS machines
across the UAE, we are now the second largest acquirer in
the country and also the fastest growing.
▪ Products offered include current / savings / fixed deposits,
investment products, personal loans, auto loans,
mortgages, small business loans, credit cards with unique
loyalty programs, bank assurance, private banking and
wealth management.
▪ Key innovations include; first bank in the Region to have
early access of Samsung Pay, a best in class and secure
mobile payment service that works as a contactless credit or
debit card, POS Plus - UAE’s first ever handheld payment
acceptance device with built in digital product catalogue
(customers can see a merchant’s entire product line and
variants on a digital tablet);1-click payments; a unique
service that lets merchants collect payments from
customers by sending them an SMS or email; first bank to
integrate Apple’s Siri for voice-powered payments;
introducing UAE’s First Chat Bot; an AI agent to interact with
customers
▪ Launched Mashreq NEO, a full-service digital bank to cater
to the day-to-day needs of a world on the move
▪ Key awards for 2017 include Best Digital Bank in the UAE
and Best Mobile Banking Application in UAE by World
Finance and a number of awards from Global Finance like
Best Consumer Mobile Banking Global, Best Consumer
Digital Bank Middle East, Most Innovative Consumer Digital
Bank Middle East etc
RBG Revenues (AED million)
RBG Assets (AED million)

22
Treasury and Capital Markets (TCM) business
17,58517,00415,657
+9% +3%
Dec-17Dec-16Dec-15
STRUCTURE AND LEADERSHIP
616564553
2017
+2%
20162015
+9%
Business highlights
▪ Treasury & Capital markets accounts for 14% of
assets and 9% of liabilities as of December 2017
▪ Treasury and Capital Markets business consists of
customer flow business and proprietary business.
Customer flow business includes transactions for
FX, derivatives, hedging, investment products,
equities and regional asset management undertaken
on behalf of customers. Proprietary business
includes trading and investing activity undertaken on
behalf of the bank
▪ Mashreq was able to grow its Treasury product suite
across asset classes, supported by an online trading
platform and 24 hour dealing room
▪ The Rates & Structured Solutions business closed
several large ticket hedging transactions for clients
across the region, including a structured profit rate
swap for a real estate loan
▪ Makaseb Income Fund won Thomson Reuters
Lipper Fund award for Best Fund Performance over
5 Years
TCM Revenues (AED million)
TCM Assets (AED million)
23
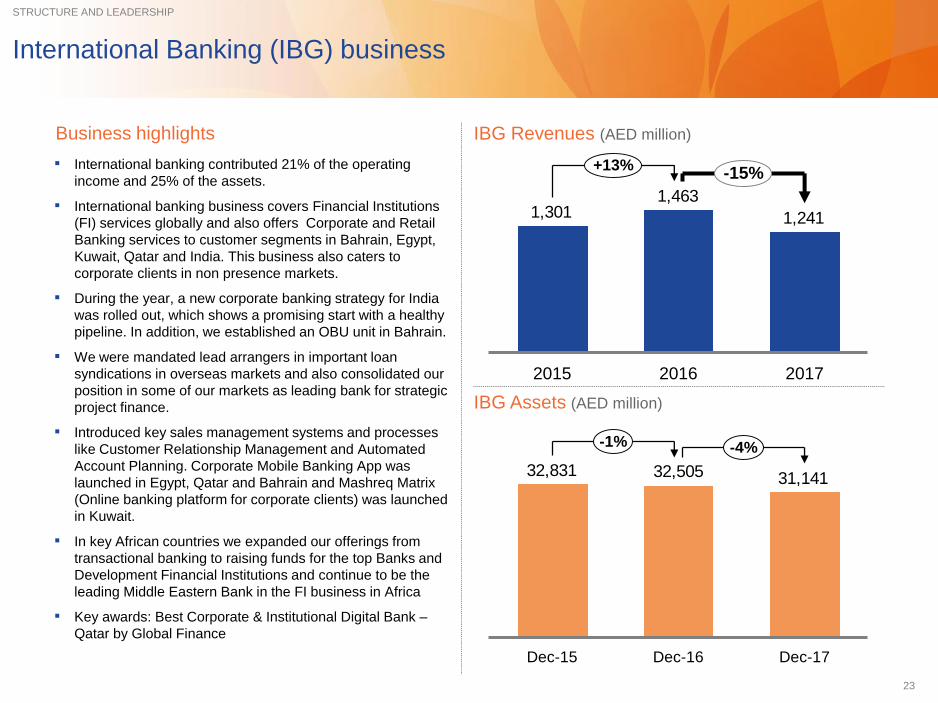
1,241
1,4631,301
2017
+13%
20162015
-15%
International Banking (IBG) business
31,14132,50532,831
-1% -4%
Dec-17Dec-16Dec-15
STRUCTURE AND LEADERSHIP
Business highlights
▪ International banking contributed 21% of the operating
income and 25% of the assets.
▪ International banking business covers Financial Institutions
(FI) services globally and also offers Corporate and Retail
Banking services to customer segments in Bahrain, Egypt,
Kuwait, Qatar and India. This business also caters to
corporate clients in non presence markets.
▪ During the year, a new corporate banking strategy for India
was rolled out, which shows a promising start with a healthy
pipeline. In addition, we established an OBU unit in Bahrain.
▪ We were mandated lead arrangers in important loan
syndications in overseas markets and also consolidated our
position in some of our markets as leading bank for strategic
project finance.
▪ Introduced key sales management systems and processes
like Customer Relationship Management and Automated
Account Planning. Corporate Mobile Banking App was
launched in Egypt, Qatar and Bahrain and Mashreq Matrix
(Online banking platform for corporate clients) was launched
in Kuwait.
▪ In key African countries we expanded our offerings from
transactional banking to raising funds for the top Banks and
Development Financial Institutions and continue to be the
leading Middle Eastern Bank in the FI business in Africa
▪ Key awards: Best Corporate & Institutional Digital Bank –
Qatar by Global Finance
IBG Revenues (AED million)
IBG Assets (AED million)

24
Islamic Banking (ISB) business
10,342
8,797
7,595
+16%
+18%
Dec-17Dec-16Dec-15
STRUCTURE AND LEADERSHIP
479
321308
2017
+5%
20162015
+49%
Business highlights
▪ Mashreq Al Islami is the Islamic Banking arm of Mashreq
(Mashreq Al Islami Finance Company PJSC and Islamic
Banking Division, Mashreqbank PSC) and offers a wide
range of Shari’ah compliant products and services
▪ Amongst the top ten Islamic institutions in the UAE based
on market share as per MEED
▪ Products offered include Ijara home finance, Mudarabah
deposit and savings, Musharaka finance, Murabaha
commodity finance, Ijara equipment finance, sukuk
underwriting, Musharaka LC, Murabaha LC, TR Murabaha,
Kafala, Wakala deposit, Reserve Murabaha deposit and
sukuk advisory
▪ Successfully closed a 5 year USD 500 million senior
secured syndicated facility for Ezdan Holding Group
Company, the largest private sector real estate developer in
Qatar - Mashreq Al Islami UAE acted as Mandated Lead
Arranger, Sole Book Runner and Facility Agent for the
facility
▪ “Most Innovative Islamic Banking Solution Provider” by
Global Banking & Finance Review
ISB Revenues (AED million)
ISB Assets (AED million)
25
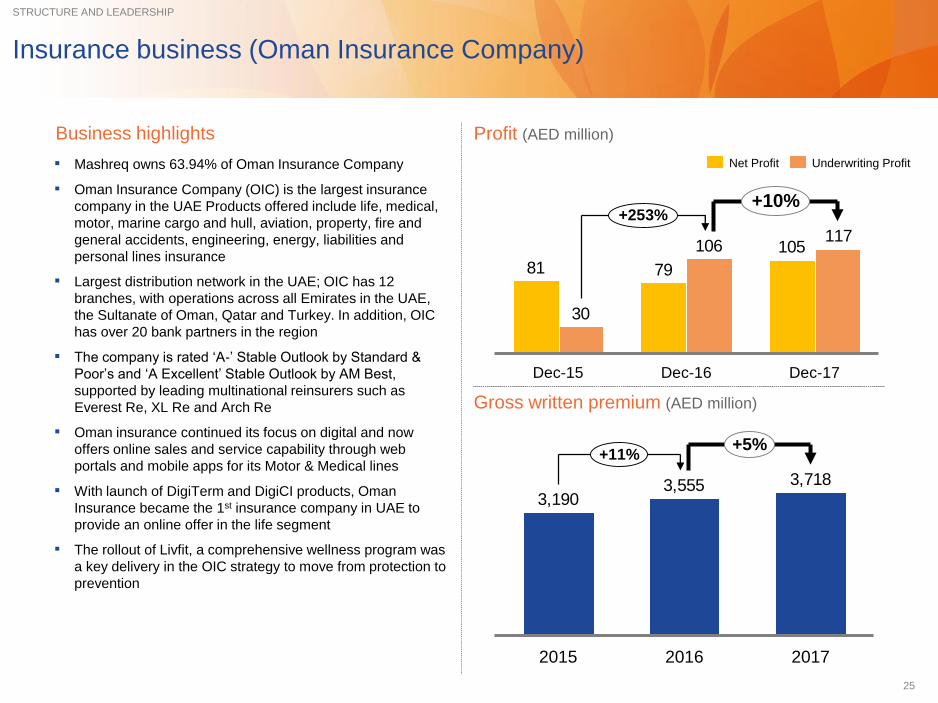
Insurance business (Oman Insurance Company)
STRUCTURE AND LEADERSHIP
Business highlights
▪ Mashreq owns 63.94% of Oman Insurance Company
▪ Oman Insurance Company (OIC) is the largest insurance
company in the UAE Products offered include life, medical,
motor, marine cargo and hull, aviation, property, fire and
general accidents, engineering, energy, liabilities and
personal lines insurance
▪ Largest distribution network in the UAE; OIC has 12
branches, with operations across all Emirates in the UAE,
the Sultanate of Oman, Qatar and Turkey. In addition, OIC
has over 20 bank partners in the region
▪ The company is rated ‘A-’ Stable Outlook by Standard &
Poor’s and ‘A Excellent’ Stable Outlook by AM Best,
supported by leading multinational reinsurers such as
Everest Re, XL Re and Arch Re
▪ Oman insurance continued its focus on digital and now
offers online sales and service capability through web
portals and mobile apps for its Motor & Medical lines
▪ With launch of DigiTerm and DigiCI products, Oman
Insurance became the 1st insurance company in UAE to
provide an online offer in the life segment
▪ The rollout of Livfit, a comprehensive wellness program was
a key delivery in the OIC strategy to move from protection to
prevention
Profit (AED million)
Gross written premium (AED million)
3,7183,5553,190
2017
+11%
20162015
+5%
105
7981
117106
30
+10%
Dec-17
+253%
Dec-16Dec-15
Underwriting ProfitNet Profit
26
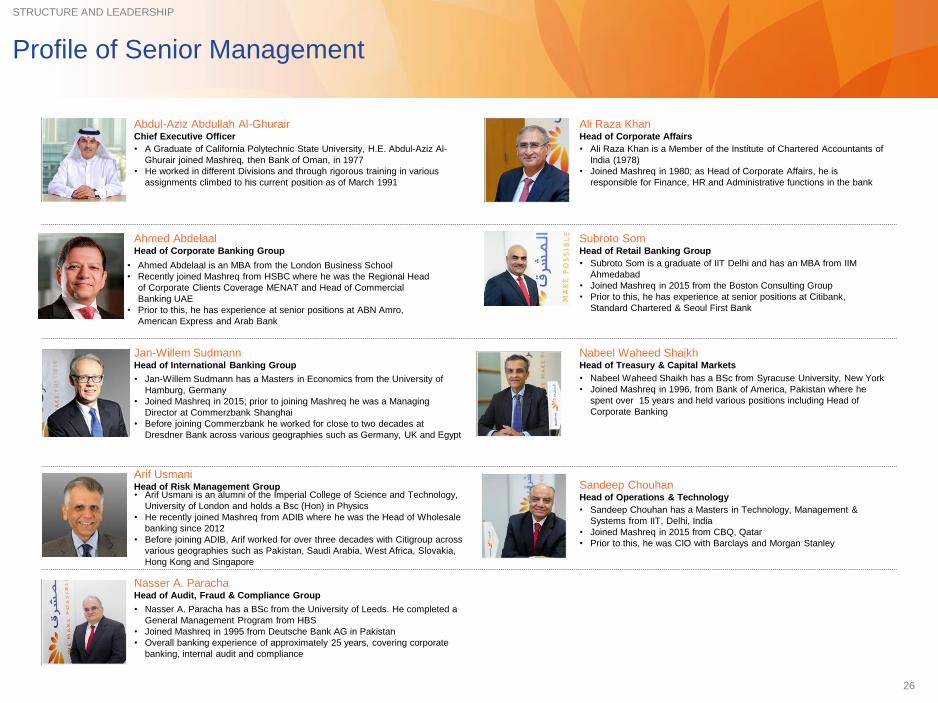
Profile of Senior Management
STRUCTURE AND LEADERSHIP
Abdul-Aziz Abdullah Al-GhurairChief Executive Officer
• A Graduate of California Polytechnic State University, H.E. Abdul-Aziz Al-
Ghurair joined Mashreq, then Bank of Oman, in 1977
• He worked in different Divisions and through rigorous training in various
assignments climbed to his current position as of March 1991
Ali Raza KhanHead of Corporate Affairs
• Ali Raza Khan is a Member of the Institute of Chartered Accountants of
India (1978)
• Joined Mashreq in 1980; as Head of Corporate Affairs, he is
responsible for Finance, HR and Administrative functions in the bank
Nabeel Waheed ShaikhHead of Treasury & Capital Markets
• Nabeel Waheed Shaikh has a BSc from Syracuse University, New York
• Joined Mashreq in 1996, from Bank of America, Pakistan where he
spent over 15 years and held various positions including Head of
Corporate Banking
• Jan-Willem Sudmann has a Masters in Economics from the University of
Hamburg, Germany
• Joined Mashreq in 2015; prior to joining Mashreq he was a Managing
Director at Commerzbank Shanghai
• Before joining Commerzbank he worked for close to two decades at
Dresdner Bank across various geographies such as Germany, UK and Egypt
Jan-Willem Sudmann Head of International Banking Group
Arif UsmaniHead of Risk Management Group• Arif Usmani is an alumni of the Imperial College of Science and Technology,
University of London and holds a Bsc (Hon) in Physics
• He recently joined Mashreq from ADIB where he was the Head of Wholesale
banking since 2012
• Before joining ADIB, Arif worked for over three decades with Citigroup across
various geographies such as Pakistan, Saudi Arabia, West Africa, Slovakia,
Hong Kong and Singapore
Sandeep ChouhanHead of Operations & Technology
• Sandeep Chouhan has a Masters in Technology, Management &
Systems from IIT, Delhi, India
• Joined Mashreq in 2015 from CBQ, Qatar
• Prior to this, he was CIO with Barclays and Morgan Stanley
• Nasser A. Paracha has a BSc from the University of Leeds. He completed a
General Management Program from HBS
• Joined Mashreq in 1995 from Deutsche Bank AG in Pakistan
• Overall banking experience of approximately 25 years, covering corporate
banking, internal audit and compliance
Nasser A. Paracha Head of Audit, Fraud & Compliance Group
Ahmed AbdelaalHead of Corporate Banking Group
Subroto SomHead of Retail Banking Group
• Subroto Som is a graduate of IIT Delhi and has an MBA from IIM
Ahmedabad
• Joined Mashreq in 2015 from the Boston Consulting Group
• Prior to this, he has experience at senior positions at Citibank,
Standard Chartered & Seoul First Bank
• Ahmed Abdelaal is an MBA from the London Business School
• Recently joined Mashreq from HSBC where he was the Regional Head
of Corporate Clients Coverage MENAT and Head of Commercial
Banking UAE
• Prior to this, he has experience at senior positions at ABN Amro,
American Express and Arab Bank

27
Mashreq
Investor
Presentation
UAE economy
Mashreq heritage
Structure and Leadership
Strategy
Financial track record
Trading history, rating and dividends
Corporate governance
Accolades

28
Well Defined Strategic Objectives…
“To be the
region’s most progressive
bank enabling innovative
possibilities for our clients,
colleagues and
communities”
VISION
Strategic Objectives
Become primary bank & grow
‘New to Bank’
Enhance brand
Foster innovation & drive digital
transformation
Strategic cost management & middle
office rationalization
Enhance human capital
Leader in service excellence/ customer
experience
Ethical, regulatory, internal policy
compliance – zero tolerance
Additional risk taken into
consideration
Delivering superior service to clients
Actively contributing to the community
through responsible banking
Leading with innovation
Treating colleagues with dignity
and fairness
Pursuing opportunities that grow
shareholders’ value
Mission
Build longterm relationships by:
Further leverage Islamic Banking
opportunities
STRATEGIC OBJECTIVES

29
…Supported by Clearly Laid Down Business Objectives
Accelerate
domestic growth
Win new customers and increase customer penetration through a differentiated customer
centric, service oriented approach and focus on continued product innovation
Leverage balance sheet strength and liquidity position to grow market share
Capitalize on leadership position in fee-generating businesses
Grow international
contribution
Support franchise client needs internationally and international client needs in our franchise
by providing solutions to corporate clients across network
Provide cross border accessibility to clients, such as offshore booking location for private and
gold customers and non-resident proposition across the network
Maintain momentum in our core South Asia FI market and build scale in Egypt & Africa
Optimize balance
sheet
Optimize liability mix to lower cost of funds and enhance margins
Increase leverage and deploy liquid assets into higher yielding opportunities
Drive operational
efficiencies
Leverage existing infrastructure to drive growth and returns
Significantly improve efficiencies across the bank to bring cost/income ratio in line with
market
Strengthen risk
management and
asset quality
Reduce charge-to-loans ratio through continued focus on portfolio and asset quality
Selective portfolio / asset sales as part of an ongoing portfolio balancing strategy
Business objectives are strongly integrated with the long-term strategic direction of Mashreq
BUSINESS OBJECTIVES

30
Business segments outlook
Diversified earnings base with strong growth potential
Gross Loans portfolio split as of December 2017
27.3%
2.6%15.4%
6.0%
13.4%
14.5%7.1%
13.7%
Financial institutions
Personal
Services
Govt/GRE
Transport & Comm.
Trade
Construction
Manufacturing
DIVERSIFICATION
Revenue split FY 2017 Asset split as of December 2017
25.4%
22.6%
10.2%
5.8%7.3%
8.0%
20.6%
53.1%15.5%
11.2%
8.2%
12.0%Cash and balances with CB
Loans & Advances
Interbank deposits & balances
Other assets
Financial Investments
Retail
International
Corporate
Treasury &
Capital markets
Insurance
Others
Islamic
(AED 66.1 bn)
(AED 6.0 bn) (AED 125.2 bn)
▪ UAE Retail: Pick up in mortgage business; strong growth in
cards and payment business and wealth management
▪ UAE Corporate: Strong growth from trade, manufacturing,
tourism and logistics driving overall UAE GDP in the coming
years leading to increased demand for credit & trade services
▪ International Banking: Tap and strengthen Regional market
footprint to assist local corporations operating regionally
▪ Insurance: As the largest insurance company in the UAE,
Mashreq’s Oman Insurance Company (OIC) subsidiary is
expected to grow in line with the market
▪ Treasury: Build on the market leading menu of TCM products
including hedging and FX products and increase cross-sell

31
Strategic Advantage through Product and Service Innovation
Introduce a comprehensive corporate
cash management solution offering (GTS)
Integrate Emirates ID with bank account
and allow its usage as a Debit Card
Introduce Point-of-Sale terminalsCentralized branch operations and
foreign trade services
Introduce “Branch of the future – self
service autonomous branches”
Introduce “Tap & Go”, mobile NFC
sticker payment method
Offer Visa Connectivity across the
worldInstall ATM cash dispensers
Issue debit/credit cards Offer a direct banking centre
Launch full service digital bank “Mashreq
Neo“
Launch UAE’s first fully EMV Chip & PIN
compliant mobile POS solution
Innovation
Introduce consumer
loans
Mashreq was the first bank in the UAE to:
INNOVATION

32
Mashreq
Investor
Presentation
UAE economy
Mashreq heritage
Structure and Leadership
Strategy
Financial track record
Trading history, rating and dividends
Corporate governance
Accolades

33
Solid performance over the past decade
FINANCIAL TRACK RECORD
Net loans and advances (AED billion)
Net profit (AED million)
2,0521,9261,806
1,312
8208031,000
1,6431,901
2,4022,401
+1%
20172016201520142013201220112010200920082007
63616058
50
4138
41
48
55
35
2015
+6%
2016 20172008 2009 2010 2011 2012 20132007 2014

34
Rapid improvement in performance over the last four years
FINANCIAL TRACK RECORD
Loans & Advances (AED billion) Customer deposits (AED billion)
Total Revenue (AED million)
62.761.060.258.050.4
2017
6%
2016201520142013
76.177.073.668.558.6
2017
7%
2016201520142013
Net profit (AED million)
2,445 3,125 3,423 3,567 3,579
2,3932,720 2,555
2017
6%
2016
6,169
2,602
2015
5,978
2014
5,845
2013
4,837
6,016
2,437
Net interest income1)Fee and other income
13.1% 15.7%ROE
2,0521,9262,4022,401
1,806
20172016
3%
201520142013
1 NII component booked under net investment income as per IFRS, reclassified under NII
14.2% 10.6% 10.5%
35
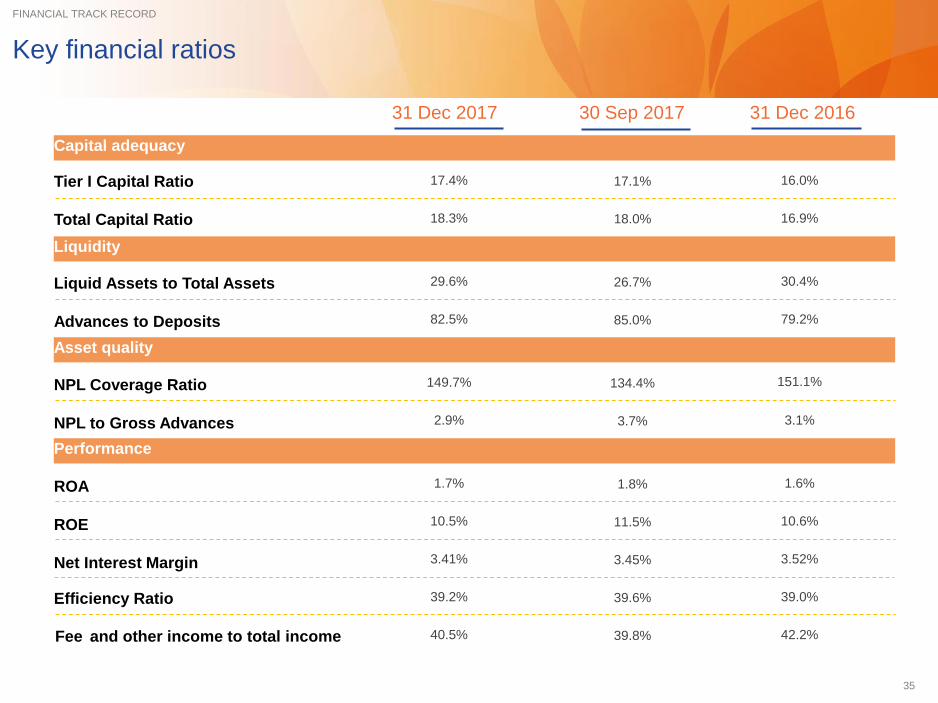
Tier I Capital Ratio
Total Capital Ratio
Efficiency Ratio
Liquid Assets to Total Assets
Advances to Deposits
NPL Coverage Ratio
NPL to Gross Advances
ROA
Net Interest Margin
ROE
Capital adequacy
Liquidity
Asset quality
Performance
Fee and other income to total income
16.0%
16.9%
39.0%
30.4%
79.2%
31 Dec 2016
151.1%
3.1%
1.6%
3.52%
10.6%
42.2%
Key financial ratios
FINANCIAL TRACK RECORD
17.1%
18.0%
39.6%
26.7%
85.0%
30 Sep 2017
134.4%
3.7%
1.8%
3.45%
11.5%
39.8%
17.4%
18.3%
39.2%
29.6%
82.5%
31 Dec 2017
149.7%
2.9%
1.7%
3.41%
10.5%
40.5%

36
Well-funded balance sheet …
FINANCIAL TRACK RECORD
Operating leverage (%)
Liquidity (%)
29.6%30.4%
20172016
26.5%29.9%
2014
27.7%
20152013
2015 2016
81.7% 79.2%84.8%
2013
86.1%
2014
82.5%
2017
Loan to Deposits
Liability by type as of December 2017
73.1%
9.5%
1.5%
6.0%
9.9%
Liquid Assets to Total Assets
Customer deposits
Due to Banks
Insurance Funds
Med. Term FRN
Other Liabilities
18.7%
7.1%
2.3%
7.2%
8.9%24.5%
31.3%
International
Islamic
Insurance
Others
Treasury &
Capital markets
Retail
Corporate
(AED 104.1 bn)
Liability segment split as of December 2017
(AED 104.1 bn)

37
Capital adequacy (%)
Risk weighted assets (AED million) Tier 1 and Tier 2 capital (AED million)
…along with stable adequacy
20172016
16.9%16.0%
2015
16.9%15.9%
2014
16.6%15.3%
2013
18.1%16.4%
17.4% 18.3%Total Capital ratio
Tier I Capital ratio
117,969118,874113,514
106,628
88,975
20172016201520142013
20,042
1,077
18,965
2016 20172015
1,178
18,001
2014
17,726
1,450
16,277
2013
16,146
1,568
14,578
21,627
20,514
1,11319,179
Tier 2 capitalTier 1 capital
FINANCIAL TRACK RECORD

38
123
125
+1.9%
7971,961
AUHDXB
+5.3%
1,165
1,1341,863 730
63
61
+2.9%
DXB
+3.6%
AUH
428 6451,073
1,112 471 641
76
77
-1.3%
7385541,292
AUHDXB
+6.1%
506 7111,217
6.0
6.2
-2.5%
64.2 29.7
DXB
27.965.6 37.7
34.5
AUH
-2.1%
Total assets (AED billionn)
Peer group1) Mashreq
Total deposits (AED billionn)
Peer group1) Mashreq
Total loans (AED billion)
Total revenue (AED billion)
Peer group1) Mashreq
Peer group1) Mashreq
Dec '16
9.2% 2.7% 9.8% (0.5%)
9.5% 3.8% 6.2% (8.3%)
Dec ‘17
Dec '16
Dec ‘17
Dec '16
Dec ‘17
YE ’16
YE ’17
Market performance in YE 2017
FINANCIAL TRACK RECORD
Source: Banks’ financial statements
1 Peer group includes 8 banks: ENBD, FAB, ADCB, CBD, UNB, ADIB, DIB and RAK

39
Bank
FAB
UNB
Total assets
RAK
ADIB
Mashreq
49
70
108
123
125
207
265
470
669
Total loans (net) Total deposits
Growth vs
Dec '17
CBD
3%
14%
10%
3%
1%
2%
3%
5%
18%
32
47
71
77
63
133
163
258
330 (1%)
12%
13%
(3%)
(2%)
3%
3%
6%
16%
163
327
396
147
32
48
79
100
76
4%
9%
11%
2%
1%
(1%)
5%
5%
20%
Growth vs
Dec '17
Growth vs
Dec '17
ENBD
ADCB
DIB
Source: Banks’ financial statements
1) Total growth over the period and not CAGR
Market position in UAE
FINANCIAL TRACK RECORD – DECEMBER’17 (AED BILLION)

40
Bank Revenue Net interest income Fee & other income
YoYgrowth
YoYgrowth
YoYgrowth
2.6
16.4
3.6
3.8
5.6
6.0
7.7
8.9
15.5
UNB
RAK
ADIB
Mashreq
(19%)
7%
4%
(1%)
5%
(2%)
5%
4%
14%
CBD
(16%)
6%
1%
(4%)
(4%)
4%
8%
7%
14%
(26%)
12%
15%
7%
27%
(10%)
(4%)
(1%)
14%
Source: Banks’ financial statements
1) Total growth over the period and not CAGR
ENBD
ADCB
DIB
1.8
2.6
2.7
3.8
3.5
5.3
6.7
10.8
11.4
2.4
2.2
2.5
0.8
1.0
1.1
1.9
4.7
5.0FAB
Market position in UAE
FINANCIAL TRACK RECORD – DECEMBER’17 (AED BILLION)

41
Source: Banks’ financial statements
1) Shareholders equity excludes tier 1 capital notes and their interest expense is deducted from net profits
2) Total net profits (including minority) divided by total assets
ROE1) [%]
ROA2) [%]
1.31.51.51.61.71.71.71.82.0
RA
K
DIB
Ø 1.6
FA
B
UN
B
CB
D
AD
CB
MA
SQ
EN
BD
AD
IB
Bank Net profit [AED billion]
8.3
9.1
0.8
1.0
1.6
2.1
2.3
4.3
4.3
YoYgrowth
(19%)
21%
0%
5%
7%
18%
20%
15%
3%
UNB
RAK
ADIB
Mashreq
CBD
9.410.010.410.511.315.016.520.721.5
Ø 14
UN
B
FA
B
RA
K
MA
SQ
CB
D
AD
CB
EN
BD
AD
IB
DIBReturn on RWA [%]
1.51.71.81.82.12.12.52.52.9D
IB
EN
BD
Ø 2.1
UN
B
MA
SQ
CB
D
FA
B
AD
CB
AD
IB
RA
K
ENBD
ADCB
DIB
FAB
Market position in UAE
FINANCIAL TRACK RECORD – DECEMBER’17 (AED BILLION)
42
Mashreq
Investor
Presentation
UAE economy
Mashreq heritage
Structure and Leadership
Strategy
Financial track record
Trading history, rating and dividends
Corporate governance
Accolades
43
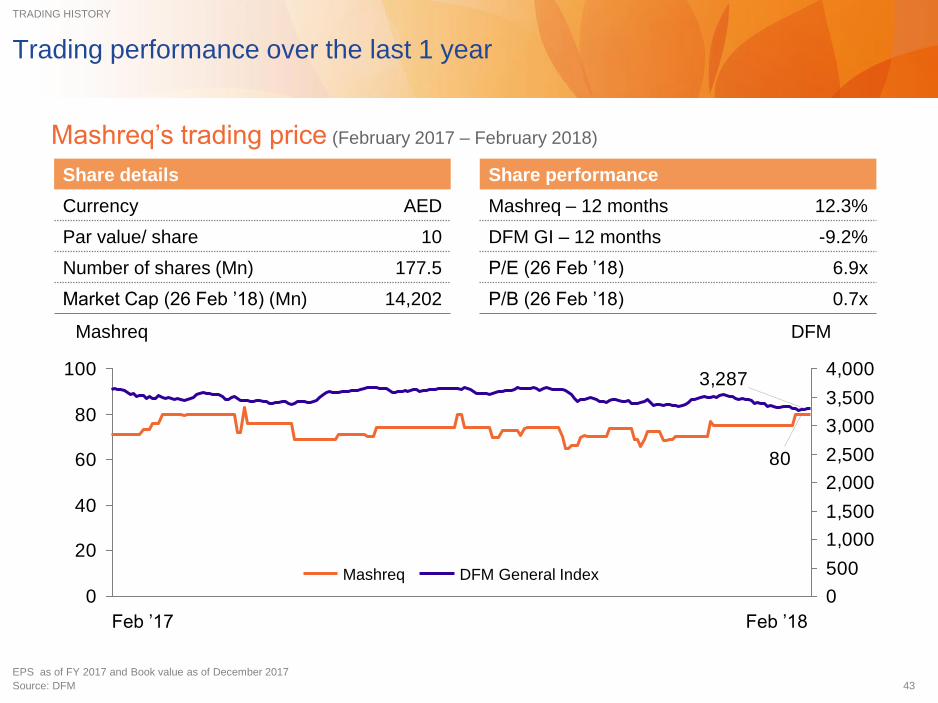
Trading performance over the last 1 year
Mashreq’s trading price (February 2017 – February 2018)
Feb ’17 Feb ’18
80
3,287
0
20
40
60
80
100
0
500
1,000
1,500
2,000
2,500
3,000
3,500
4,000
Mashreq DFM
DFM General IndexMashreq
Share performance
Mashreq – 12 months 12.3%
DFM GI – 12 months -9.2%
P/E (26 Feb ’18) 6.9x
P/B (26 Feb ’18) 0.7x
Share details
Currency AED
Par value/ share 10
Number of shares (Mn) 177.5
Market Cap (26 Feb ’18) (Mn) 14,202
TRADING HISTORY
EPS as of FY 2017 and Book value as of December 2017
Source: DFM

44
2,0521,926
2,4022,401
1,806
710710710676676
0
500
1,000
1,500
2,000
2,500
20162014 201720152013
Progressive dividend policy based on solid performance
Net profit and Cash Payout (AED million) and Cash dividend (%)
Net profit Cash payout
10.68 11.5613.53 13.53 10.56EPS
(AED)
1)
85.45 119.0091.04 100.09 105.66BVPS
(AED)
DIVIDENDS
40%40%40%40%38%
Cash dividend (%)
1 Plus 5% Bonus Shares

45
Rated by four rating agencies
Rating Agency Long term Short term
Baa1 P-2
BBB+ A-2
A F1
A- A1
CREDIT RATING

46
Mashreq
Investor
Presentation
UAE economy
Mashreq heritage
Structure and Leadership
Strategy
Financial track record
Trading history, rating and dividends
Corporate governance
Accolades

47
Mashreq is regulated by the UAE Central Bank and follows international
banking standards
Basel II and III Accounting Standard
Bank monitoring - liquidity Credit Limit
CORPORATE GOVERNANCE
Supervisory Authority
▪ Mashreq’s home supervisory authority is the UAE Central Bank which is responsible for
licensing, monitoring and supervising banks, finance companies and exchange companies in
the UAE
▪ Internationally, Mashreq comes under the purview of respective country regulators such as
the Federal Reserve and NYSDFS in the USA and Prudential Regulation Authority &
Financial Conduct Authority in the UK
▪ Lending limits fixed by the Central Bank in relation to capital:
– Commercial entities of Federal Govts and UAE Local Govts:
25%, 100% aggregate
– UAE Local Govts and non-Commercial entities: 25%
Individual, 100% aggregate
– Principal shareholders and their related entities: 20%
Individual, 50% aggregate
▪ Cash reserve ratio requirements (1% on Time Deposits and 14%
on Demand Savings and Call deposits)
▪ Maintenance of 1:1 ratio is mandatory, i.e. utilization of funds
should not exceed stable sources
▪ As per Basel III, liquidity coverage ratio (LCR) and net stable
funding ratio (NSFR) is under implementation. In the meantime
Central Bank has introduced ‘eligible liquid assets ratio (ELAR)’ as
a surrogate for LCR. Banks will continue to report Advances/
Stable resources in place of NSFR.
▪ UAE CB has approved Mashreq submission to follow LCR from
31st March 2018
▪ Banks are expected to follow the Standardized Approach for both
credit and operational risks.
▪ UAE CB has rolled out Capital Adequacy Ratio (CAR) as per
Basel III effective 1 Jan 2018
▪ The Central Bank made it mandatory in 2000 for all Banks to
publish their Annual Financial Statement as per International
Financial Reporting Standards (IFRS)
▪ Banks are expected to follow IFRS 9 w.e.f 1st Jan2018

48
Board and Management Committees
CORPORATE GOVERNANCE
Chairman, Vice-Chairman and 4 Directors form Mashreq’s Board. Two of the six board members are independent
CEO is the only executive director
The Board of Directors meet at least once every quarter
Management issues are raised at Board level where the bank’s senior management presents details to the Board
Board has delegated certain powers to CEO for effective day-to-day management
Information
Security
Committee
Audit &
Compliance
Committee
Risk
Committee
ALCO
Committee
Investment
Committee
Technology
Steering
Committee
Human
Resources
Committee
Management Supervision
Executive Management Committee
Board Supervision
Executive Management Committee (reporting to the CEO) discusses and debates bank-wide issues, develops
strategic plans for the Board’s approval and takes decisions on pan-bank issues.
Remuneration Committee Audit Committee

49
Mashreq
Investor
Presentation
UAE economy
Mashreq heritage
Structure and Leadership
Strategy
Financial track record
Trading history, rating and dividends
Corporate governance
Accolades

50
Key Awards
ACCOLADES
Gallup Great Workplace Award 2017, 2016, 2015,
2014
CSR Label – Dubai Chambers – 2017,2016,
2015, 2014, 2013, 2012 & 2011
Banker ME Product Awards
▪ Best Mobile Banking Service – Snapp
▪ Best Customer Loyalty Programme – Salaam
▪ Best Premium Credit Card – Solitaire
▪ Best Trade Finance Offering – Trade Finance
▪ Best Real Estate Advisory 2017
Global Finance 2017
▪ Innovator in Transaction Services (for the Card less
Cash Withdrawal Using Internet Banking offering in
the product innovation category for 2017)
▪ Best Treasury and Cash Management Bank in the
UAE
Banker ME Industry Awards
▪ Best Regional Retail Bank 2016, 2015, 2014
▪ Best Banking Innovation
▪ Best Real Estate Finance
Euromoney’s 13th annual private banking survey
▪ Best Private Bank for Super Affluent Clients in the
UAE
MEFTECH Innovation Awards
▪ Best Customer Experience Initiative
Annual Islamic Business & Finance Awards
▪ Best Innovation in Islamic Banking Solution
World Finance Awards
▪ Best Digital Bank – UAE
▪ Best Mobile Banking Application – UAE
Daman Corporate Health Awards
▪ Best Corporate Health and Wellness Organization
Award
Gulf Business Awards
▪ Business Leader of the Year – Banking Industry
(H.E. AbdulAziz Al Ghurair)
Retail Banking Conference & Awards: London
▪ Middle East Retail Bank of the Year
Global Banking & Finance Review Awards 2016
▪ Best Retail Bank UAE
▪ Best Customer Experience UAE
▪ Best Digital Bank UAE
▪ Best Corporate Bank Qatar
Cards & Payment Middle East 2016
▪ Best Credit Card
▪ Most Improved Payment Card
Islamic Finance News Awards
▪ Corporate Finance Deal of the Year – ENOC US$
1.5 Billion Syndicated Loan Facility
▪ Syndicated Deal of the Year – Aujan Coca Cola
Beverages AED900 Million Commodity Murabahah
Financing
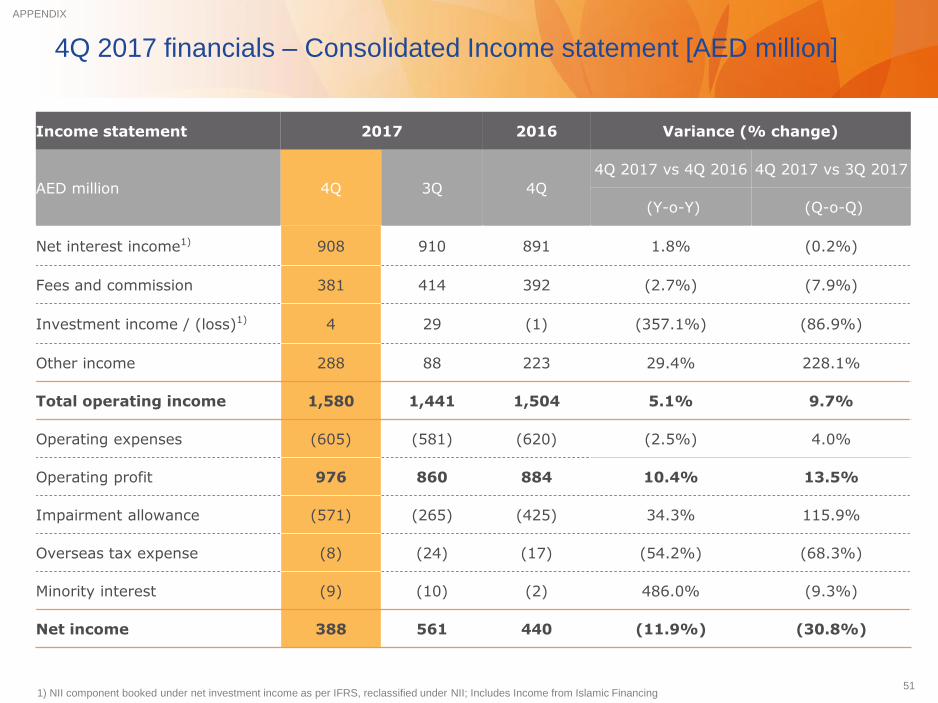
511) NII component booked under net investment income as per IFRS, reclassified under NII; Includes Income from Islamic Financing
4Q 2017 financials – Consolidated Income statement [AED million]
Income statement 2017 2016 Variance (% change)
AED million 4Q 3Q 4Q
4Q 2017 vs 4Q 2016 4Q 2017 vs 3Q 2017
(Y-o-Y) (Q-o-Q)
Net interest income1) 908 910 891 1.8% (0.2%)
Fees and commission 381 414 392 (2.7%) (7.9%)
Investment income / (loss)1) 4 29 (1) (357.1%) (86.9%)
Other income 288 88 223 29.4% 228.1%
Total operating income 1,580 1,441 1,504 5.1% 9.7%
Operating expenses (605) (581) (620) (2.5%) 4.0%
Operating profit 976 860 884 10.4% 13.5%
Impairment allowance (571) (265) (425) 34.3% 115.9%
Overseas tax expense (8) (24) (17) (54.2%) (68.3%)
Minority interest (9) (10) (2) 486.0% (9.3%)
Net income 388 561 440 (11.9%) (30.8%)
APPENDIX

521) NII component booked under net investment income as per IFRS, reclassified under NII; Includes Income from Islamic Financing
FY 2017 financials – Consolidated Income statement [AED million]
Income statement 2017 2016 Variance (% change)
AED million FY FY
FY 2017 vs FY 2016
(Y-o-Y)
Net interest income1) 3,579 3,567 0.3%
Fees and commission1,558
1,685 (7.5%)
Investment income / (loss)1) 107 58 84.9%
Other income 772 859 (10.1%)
Total operating income 6,016 6,169 (2.5%)
Operating expenses (2,361) (2,407) (1.9%)
Operating profit 3,655 3,762 (2.8%)
Impairment allowance (1,488) (1,734) (14.2%)
Overseas tax expense (78) (74) 4.5%
Non Controlling interest (37) (28) 35.3%
Net income 2,052 1,926 6.5%
APPENDIX
53
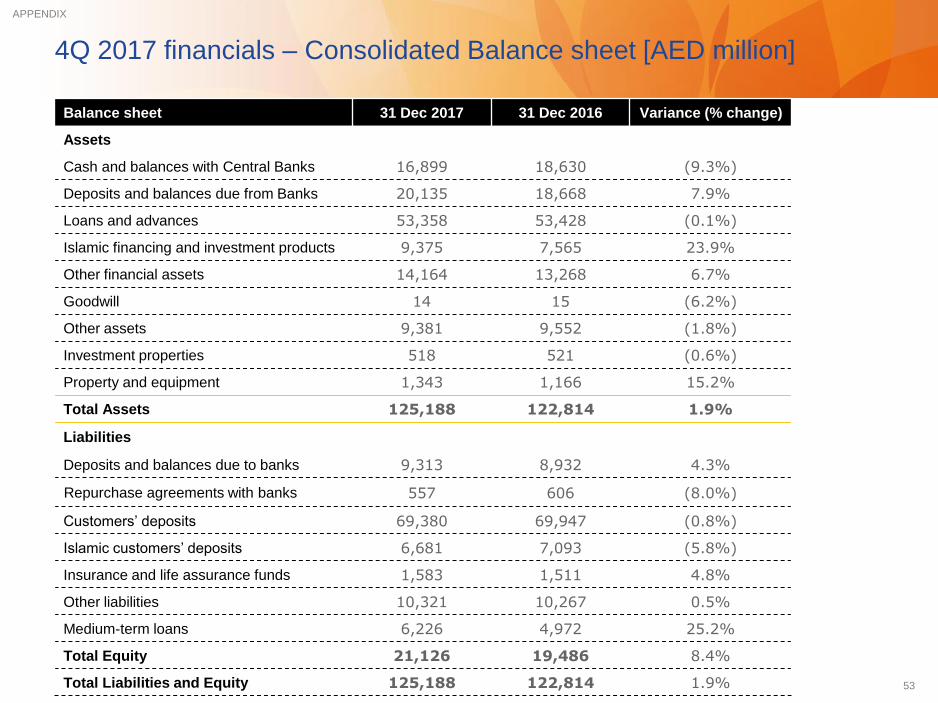
s
Balance sheet 31 Dec 2017 31 Dec 2016 Variance (% change)
Assets
Cash and balances with Central Banks 16,899 18,630 (9.3%)
Deposits and balances due from Banks 20,135 18,668 7.9%
Loans and advances 53,358 53,428 (0.1%)
Islamic financing and investment products 9,375 7,565 23.9%
Other financial assets 14,164 13,268 6.7%
Goodwill 14 15 (6.2%)
Other assets 9,381 9,552 (1.8%)
Investment properties 518 521 (0.6%)
Property and equipment 1,343 1,166 15.2%
Total Assets 125,188 122,814 1.9%
Liabilities
Deposits and balances due to banks 9,313 8,932 4.3%
Repurchase agreements with banks 557 606 (8.0%)
Customers’ deposits 69,380 69,947 (0.8%)
Islamic customers’ deposits 6,681 7,093 (5.8%)
Insurance and life assurance funds 1,583 1,511 4.8%
Other liabilities 10,321 10,267 0.5%
Medium-term loans 6,226 4,972 25.2%
Total Equity 21,126 19,486 8.4%
Total Liabilities and Equity 125,188 122,814 1.9%
4Q 2017 financials – Consolidated Balance sheet [AED million]
APPENDIX
54