scor’s new strategic plan · investor day 2016. 7 september 2016, paris. scor’s new strategic...
TRANSCRIPT

Investor Day 20167 September 2016, Paris
SCOR’s new Strategic Plan

Certain statements contained in this presentation and any documents referred herein are forward-looking statements, considered provisional. They are not historical facts and are based on a certain number of data and assumptions (both general and specific), risks and uncertainties that could cause actual results, performance or events to differ materially from those in such statements.
Forward-looking statements are typically identified by words or phrases such as, without limitation, "anticipate", "assume", "believe", "continue", "estimate", "expect", "foresee", "intend", "may increase" and "may fluctuate" and similar expressions or by future or conditional verbs such as, without limitations, "will", "should", "would" and "could."
Undue reliance should not be placed on such statements, as due to their nature they are subject to known and unknown risks and uncertainties.
As a result of the extreme and unprecedented volatility and disruption related to the financial crisis, SCOR is exposed to significant financial, capital market and other risks, including variations in interest rates, credit spreads, equity prices, currency movements, changes in government or regulatory practices, changes in rating agency policies or practices, and the lowering or loss of financial strength or other ratings. Forward-looking statements were developed in a given economic, competitive and regulatory environment and the Group may be unable to anticipate all the risks and uncertainties and/or other factors that may affect its business and to estimate their potential consequences.
Any figures for a period subsequent to 30 June 2016 should not be taken as a forecast of the expected financials for these periods and, except as otherwise specified, all figures subsequent to 30 June 2016 are presented in Euros. “Optimal Dynamics” figures previously disclosed have been maintained at unchanged foreign exchange rates unless otherwise specified.
In addition, such forward-looking statements are not “profit forecasts” in the sense of Article 2 of Regulation (EC) 809/2004.
The 2013 pro-forma figures in this presentation include estimates relating to Generali USA to illustrate the effect on the Group’s financial statements, as if the acquisition had taken place on 1 January 2013.
Certain prior year balance sheet, income statement items and ratios have been reclassified to be consistent with the current year presentation.
Additional information regarding risks and uncertainties that may affect SCOR’s business is set forth in the 2015 reference document filed on 4 March 2016 under number D.16-0108 with the French Autorité des marchés financiers (AMF) and posted on SCOR’s website www.scor.com. SCOR undertakes no obligation to publicly update or revise any of these forward-looking statements and information, whether to reflect new information, future events or circumstances or otherwise, other than to the extent required by applicable law. This presentation only reflects SCOR’s view as of the date of this presentation.
Without limiting the generality of the foregoing, the Group’s financial information contained in this presentation is prepared on the basis of IFRS and interpretations issued and approved by the European Union.
The first half 2016 financial information included in this presentation has been subject to the completion of a limited review by SCOR’s independent auditors.
Numbers presented throughout this report may not add up precisely to the totals in the tables and text. Percentages and percent changes are calculated on complete figures (including decimals); therefore the presentation might contain immaterial differences in sums and percentages due to rounding.
Unless otherwise specified, the sources for the business ranking and market positions are internal.
2
Disclaimer

SCOR IR Day 2016
3
09:00 – 09:30 Registration Page
09:30 – 10:00 SCOR puts its vision into action Denis Kessler 5
10:00 – 10:45 SCOR Global P&C, building on strong foundations to continue to outperform Victor Peignet 16
10:45 – 11:00 Coffee Break outside auditorium
11:00 – 11:45 SCOR Global Life, succeeding in a changing environment Paolo De Martin 37
11:45 – 12:15 Q&A Panel 1
12:15 – 13:45 Lunch on the Terrasse
13:45 – 14:30 SCOR Global Investments normalizes its asset management policy François de Varenne 60
14:30 – 15:15SCOR builds upon an established ERM framework and a strong solvency positionSCOR maximizes value creation thanks to its active capital management
Frieder Knüpling
Mark Kociancic
81
92
15:15 – 15:45 Q&A Panel 2
15:45 – 16:00 Closing remarks Denis Kessler 111

4
This page has been intentionally left blank

Investor Day 20167 September 2016, Paris
SCOR puts its vision into action
Denis KesslerChairman and CEO

Why is the reinsurance industry attractive: six reasons (1/2)
6
Rapidly expanding risk universe
Expanding demand for (re)insurance cover
Benefiting from technological and financial revolution
Expansion in nature and size of the “raw material” of reinsurance
Risks appearing due to general economic growth, globalization and concentration of populations in the most exposed areas
New risks emerging and developing (new technologies, reconfiguration of the world)
Increasing aversion to risk as populations become wealthier
Gradual withdrawal of state welfare (crisis of social security, public deficit)
Companies are bearing higher risks (e.g. environmental and social risks) which they are ceding
Reinsurers to contribute to bridge the protection gap
Development of Insurance-Linked Securities has enlarged the overall reinsurance capacity
Complementarity between alternative capital and reinsurance has outweighed substitutability
Technological revolution (cyber, connected objects, big data, automation) will benefit the reinsurance industry
The reinsurance industry creates value for its clients and the economy while contributing to the common good
1 2 3

Why is the reinsurance industry attractive: six reasons (2/2)
7
Exceptional economic and financial conditions to normalize
Strong potential for innovation
Resilience to the most extreme events
Strong negative impact of financial repression on reinsurance: low interest rates, quantitative easing
Economic stagnation reducing reinsurance demand
Financial cycles to eventually turn: normalization in central banks’ policy increasing the return on invested asset
Return to a sustainable recovery increasing reinsurance demand
Reinsurance to benefit from a stream of innovations: on products, processes and modelling
Reinsurance to displace the limits of insurability
Innovation to improve risk knowledge and modelling
Technology to offer a vast playing field for future optimization of reinsurance covers (cyber risk coverage to deepen…)
Strong ability of the European reinsurance to historically absorb the most extreme shocks (historical cats, terrorist attacks, financial crises, worldwide wars, etc.)
Resilience of the reinsurance model demonstrated over time
Over the medium to long term, the reinsurance industry generates a high level of profitability
4 5 6

SCOR almost triples its gross written premiums and doubles its shareholders’ equity over the last 10 years
8
4.85.8
6.4 6.77.6
9.510.3
11.3
13.0 ~13.7
2007 2008 2009 2010 2011 2012 2013 2014 2015 2016E
3.6 3.43.9
4.3 4.44.8 5.0
5.76.3 6.3
2007 2008 2009 2010 2011 2012 2013 2014 2015 H1 16
▐ GWP in EUR billions (rounded) ▐ Shareholders’ equity in EUR billions (rounded)
Since 2013, gross written premiums have increased by EUR 3.4 billion or +34%
Over “Optimal Dynamics”, shareholders’ equity increased by ~EUR 1.5 billion or +33%
+EUR 8.9bn since 2007
+EUR 2.7bn since 2007

9
SCOR has an outstanding track record of successfully achieving the targets of its strategic plans

10
SCOR further enhances its Tier 1 positioning thanks to the perfect execution of “Optimal Dynamics”
Market Leader
Industry Trendsetter
Tools & Processes Developer
Independent Group
Global Player
Strong Technical
Profitability
1
Global Tier 1 reinsurer
All rating agencies give a positive assessment of SCOR’s current financial strength and capitalization, confirming its Tier 1 position
Stable outlook Positive outlook Positive outlook
AA- AA- A A1Stable outlook

Profitability and solvency: two equally-weighted
targets
Normalize the asset management policy
Expand and deepen the franchise
Build on continuity and consistency
1) Based on a 5-year rolling average of 5-year risk-free rates
11
SCOR’s new strategic plan “Vision in Action” builds on its successful strategy to expand profitably
“VISION IN ACTION”2016-2019
1
2
3
4
Leverage on proven principles and cornerstones
Pursue a twin-engine strategy, combining Life and P&C reinsurance
Focus on reinsurance
Controlled risk appetite and robust capital shield
Deepen franchise through organic growth development
Leverage existing and new platforms
RoE ≥ 800 bps above 5-year risk-free rate over the cycle1)
Solvency ratio in the optimal 185% - 220% range
Maintain an upper mid-level risk appetite
Align investment risk appetite to the Group’s overall risk appetite
Reduce the very high level of prudence
SCOR values its principles

A challenging target for management in both a normal and administered interest rate environment
RoE target principle maintained in “Vision in Action” with a more flexible benchmark adapted to market conditions:
- A minimum RoE to reflect current environment and potential upside turn in the cycle
- 5-year risk-free rates are consistent with the duration of SCOR’s liabilities
- 5-year rolling average of risk-free rate better manages the volatility of financial markets
SCOR’s solvency scale outlined in “Optimal Dynamics” is unchanged for “Vision in Action”
SCOR continues to provide an upper mid-level risk appetite
SCOR continues to provide an attractive level of profitability while maintaining solvency in the optimal range
“Vision in Action” provides two equally weighted targets: Profitability and Solvency
121) Based on a 5-year rolling average of 5-year risk-free rates
Solvency targetProfitability (RoE) target
RoE ≥ 800 bps above 5-year risk-free rate over the cycle1)
Solvency ratio in the optimal 185%-220% range

“Vision in Action” assumptions demonstrate continuity with regard to “Optimal Dynamics”
Profitability (RoE) target Solvency target
Estimated ranges1) Based on a 5-year rolling average of 5-year risk-free rates 13
RoE ≥ 800 bps above 5-year risk-free rate over the cycle1)
Solvency ratio in the optimal 185%-220% range
Flexible assumptions reflecting the uncertain environmentManagement will adapt its execution to achieve its two targets
GWP growth8% p.a. (modest market
recovery) -
3% p.a. (flat market)
Combined ratio~95%-96%
GWP growth5.0% - 6.0% p.a.
Technical margin6.8% - 7.0%
Return on invested assets
3.2% (strong recovery) -
2.9% (gradual recovery)-
2.5% (convergence to a low speed regime with low
interest rates)
GWP growth~4% - 7% p.a.
Group cost ratio4.9% - 5.1%
Tax rate22% - 24%

14
SCOR reconfirms its consistent and attractive shareholder remuneration policy
More than EUR 2 billion in dividends paid to shareholders, translating into an +11.6% CAGR between 2005 and 2015
SCOR favours cash dividends, and if relevant, does not exclude special dividend or share buy-backs
Minimum dividend payout ratio of 35%
Low variation in the dividend per share from year to year
37% 37% 35% 45% 48% 48%62% 53% 44% 51% 43%
0.50
0.80 0.80 0.80
1.001.10 1.10
1.201.30
1.401.50
2005 2006 2007 2008 2009 2010 2011 2012 2013 2014 2015
Distribution rateDividend per share (EUR)

15
SCOR’s success story will continue with “Vision in Action”
SCOR consistently delivers an outstanding track record of success
SCOR leverages on the positive prospects that reinsurance offers
SCOR’s strategic framework builds upon its successful strategy while deepening and expanding the franchise: “Vision in Action”
SCOR combines growth, profitability and solvency to ensure predictable and sustainable shareholder returns
SCOR leverages a global talent pool of human capital to grow the franchise

Investor Day 20167 September 2016, Paris
Building on strong foundations to continue to outperform
Victor PeignetCEO SCOR Global P&C

17
Key messages
“Optimal Dynamics” is successfully achieved
SCOR Global P&C outperforms the industry Tier 1 leadership positions
Relatively stable pricing
Strong cycle management
Franchise: client loyalty
Efficient retrocession
New strategic plan “Vision in Action” will build on strong foundations
“Vision in Action” focuses on opportunities in four businesses US
Lloyd’s
SCOR Business Solutions (SBS)
Managing General Agents (MGAs)
SCOR Global P&C’s strategy is based on five pillars

1) Specifically, certain forms of large commercial insurance, Lloyd’s, and business written via a limited number of highly capable MGAs under certain circumstances and with aligned interests – while avoiding competing directly with our clients. SCOR Global P&C will not develop a retail platform 18
Five strategic pillars - SCOR Global P&C
1
2
3
5
4
Reinsurance is the core business. SCOR Global P&C generates better-than-market returns by assuming and managing clients’ volatility as a Tier 1 reinsurer
The core is complemented with compatible insurance risk1). Insurance leverages the platform in closely-related but diversifying forms of risk with attractive margins
Using “owned” capital and underwriting produces better returns. Leading in local markets produces a well-diversified, capital-efficient portfolio. Buying retrocession improves the portfolio further
Platforms, people, and systems should be highly integrated. Integration is required to respond quickly to market conditions and serve customers broadly and consistently
Four critical markets: US reinsurance: ~half the global market International reinsurance & specialties: profitable and diversifying, serve customers globally Large corporate insurance: complementary to the reinsurance platform Broad distribution capabilities: to access business
“Vision in Action” develops specific businesses in each of the four areasBe well-positioned for profitable opportunities, especially when pricing improves
Five strat. pillars
OD achieved
Vision in Action
SCOR outperforms
Four developments

“Optimal Dynamics” is successfully achieved, validating the strategy
Building the business Delivering profitability
2016E figures at 30/06/2016 exchanges rates unless stated otherwise1) Achieved without reserve releases in 2014 & 20152) At 31/12/2012 exchange rates 19
▐ SCOR Global P&C GWP - in EUR billions ▐ SCOR Global P&C published Net Combined Ratio
2008 2013 2016E 2016E
~57% 57.7% 56.9% 56.9% 54.6%
~7% 6.4% 4.2% 2.2% 6.9%
~23% 23.1% 23.8% 25.2% 25.3%
~6% 6.7% 6.5% 6.8% 7.0%
"OptimalDynamics"
2013 2014 2015 H1 2016
P&C EMEA
P&C Americas
P&C Asia-Pacific
Specialty Lines
SBS
3.1
4.8
~5.8~6.2
assumption“Optimal Dynamics”
assumption2)
~94% 93.9% 91.4% 91.1% 93.8%
Over “Optimal Dynamics”1): 92.5% achieved
Attritionalratio
Cat ratio
Commissionratio
Expense ratio
Up-scale core reinsurance Alternative/complementary platforms Cat & retro capacity optimization
Meeting Strategic
Objectives
Five strat. pillars
OD achieved
Vision in Action
SCOR outperforms
Four developments
CAGR+6%

Note: - China, Japan and India figures exclude the domestic reinsurer (China Re for China, Toa Re for Japan, GIC Re for India)- Estimated market share for 2016 and Lead in % of GWP for 2015 underwriting year- Market share calculated with 2015 figures for South Eastern Europe countries
1) Rankings in the targeted regional segment20
Leading and influencing global markets as a Tier 1 reinsurer
Position
Leads as % of GPW
Africa Middle East
India China
47%54%
44%
63%
France Italy Germany BeLux Nordic countries
Central & Eastern Europe
Spain
39% 33%41%
65%
35%48%
14%
#X
8% 12% 6% 10% 12% 7% 6%
4% 12% 10% 7%
USARegional1)
Canada Latam & Caribbean
17%
34%26%
4% 8% 3%#5 #5 #5
X% Market share
#3 #3 #5 #3 #2#3 #4
#2 #2 #2 #4
Five strat. pillars
OD achieved
Vision in Action
SCOR outperforms
Four developments

Resilience to pricing pressures; growing when pricing is more attractive
Price change1) Renewal growth2)
1) As published. Year-on-year price changes on a “same stores” basis2) As published. Year-on-year renewal growth at constant exchange rates,
e.g. 2012 growth computed with 31/12/2011 exchange rates and “same stores” basis. Hence different from annual premium growth
21
2009
2016
2012
2016
January renewals
Aprilrenewals
June-JulyRenewals
~10% of renewable3)
EGPI
Cycle management: growth stronger in times of rising prices
Stability: less pricing volatility than the market
~10% of renewable3)
EGPI
~70% of renewable3)
EGPI
3%
0%-1%
-3%1%
7%
-1%
0%-2%
-3%-3%
3%
-1%0%
2%2%
0%2%
24%4)5%
8%24%
5%6%
9%6%
11%
2%2%
5%9%
14%13%
7%3%
14%5)
3) On average for the last three underwriting years4) Excluding three specific large deals, growth
would have been ~14%5) Excluding specific large deals, growth would
have been ~4%
2012
2016
Five strat. pillars
OD achieved
Vision in Action
SCOR outperforms
Four developments

Portfolio management: reducing less attractive business in favor of better-priced business
1) Based on priced profitability for 2016 January to July renewals. Scope: Priced business excluding facultative business. Figures at 31/12/2015 exchange rates
2) Source: Dowling & Partners, based on Schedule F filings of Florida specialist insurers 22
Expected profitability1)
Cancelled portfolio New Business
Portfolio average
~EUR 350 million in 2016~EUR 280 million in 2016
New business is better-priced than business that is shed
Alternative capital has had a more limited impact on SCOR Global P&C than on the market:− Less cat-exposed;
underweight in areas targeted by alternative capital: SCOR is #5 globally, #27 in Florida2)
− Minimal appetite for writing inward retrocession
Five strat. pillars
OD achieved
Vision in Action
SCOR outperforms
Four developments
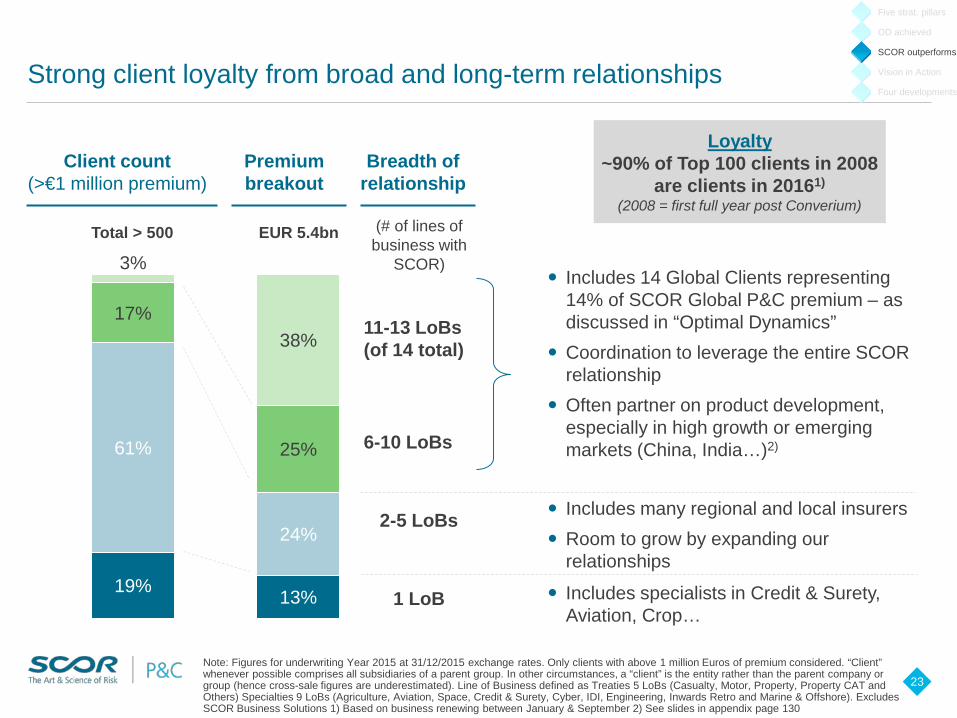
Note: Figures for underwriting Year 2015 at 31/12/2015 exchange rates. Only clients with above 1 million Euros of premium considered. “Client” whenever possible comprises all subsidiaries of a parent group. In other circumstances, a “client” is the entity rather than the parent company or group (hence cross-sale figures are underestimated). Line of Business defined as Treaties 5 LoBs (Casualty, Motor, Property, Property CAT and Others) Specialties 9 LoBs (Agriculture, Aviation, Space, Credit & Surety, Cyber, IDI, Engineering, Inwards Retro and Marine & Offshore). Excludes SCOR Business Solutions 1) Based on business renewing between January & September 2) See slides in appendix page 130
23
Strong client loyalty from broad and long-term relationships
Breadth of relationship
19% 13%
61%
24%
17%
25%
3%
38%
2-5 LoBs
1 LoB
6-10 LoBs
11-13 LoBs(of 14 total)
Total > 500 EUR 5.4bn (# of lines of business with
SCOR) Includes 14 Global Clients representing
14% of SCOR Global P&C premium – as discussed in “Optimal Dynamics”
Coordination to leverage the entire SCOR relationship
Often partner on product development, especially in high growth or emerging markets (China, India…)2)
Includes specialists in Credit & Surety, Aviation, Crop…
Includes many regional and local insurers Room to grow by expanding our
relationships
Loyalty~90% of Top 100 clients in 2008
are clients in 20161)
(2008 = first full year post Converium)
Five strat. pillars
OD achieved
Vision in Action
SCOR outperforms
Four developments
Premium breakout
Client count(>€1 million premium)

Buying retrocession reduces tail risk to shareholders and improves the portfolio’s efficiency
Note: AEP (Aggregate Exceedance Probability): measure the probability that one or more occurrences will combine in a year to exceed the threshold. AEP is the annual losses from all events in a year.1) See appendix page 141 24
Global all cat perilsSCOR Global P&C Gross and Net Losses YE 2016
Purchasing retrocession nearly halves Catastrophe exposure at most return periods
Softening pricing is impacting retrocession more than most markets− SCOR Global P&C benefits as
large retro buyer− Controlled exposure to a retro
market upturn thanks to long-term approach & diversification
Net portfolio is highly optimized among perils – highly efficient use of shareholder capital
Low earnings volatility compared to peers1)
Five strat. pillars
OD achieved
Vision in Action
SCOR outperforms
Four developments
10 100 1 000
AEP Gross
AEP Net
45% risk reduction
Return period (Log scale)250

Note: Figures are approximations. The hypothetical and illustrative event shown is not meant to imply that a certain event would or would not affect market-wide pricing – only to illustrate theoretical payback and effect on industry equity Source: Holborn (2006 RoE data), Guy Carpenter (Global RoL), Willis (2015 RoE). Industry equity estimated based on various reports, excluding convergence capital
25
What could turn pricing? Return-period losses need to be considered relative to forward earnings, not just to equity
50
100
150
200
250
300
350
400
Ten years ago~$250bn / ~15%
Today~$350bn / ~3%
10% of equity8 months of earnings
7% of equity2 years of earnings
Reinsurer value destroyed by a $50bn US windstorm
(assume 50% of insured loss reinsured;similar return period as Katrina)
GC
Glo
bal C
at R
ate
on L
ine
inde
x
Industry equity / cat-normalized AY RoE:
All reinsurers are not equal: SCOR Global P&C’s controlled US
cat exposure and efficient retrocession program would help
to preserve the year’s profitability
Five strat. pillars
OD achieved
Vision in Action
SCOR outperforms
Four developments

Strong foundation for today’s market; ready when pricing improves
Foundations are in place Act quickly when market turns
26
Deep knowledge of local markets and reinsurance programs
Integrated systems, tools, and organization
Comprehensive infrastructure: legal entities, claims, accounting, etc.
Active portfolio management: capacity and line sizes well controlled
Strong positions with clients who will be with SCOR Global P&C through the cycle
Efficient retrocession program / tools
Globally integrated systems will detect market changes in real time
Integrated, centrally-managed organization can redeploy quickly
Fungible capital to reallocate without delay
Customers have been supported through the cycle – SCOR Global P&C first in line to grow
Five strat. pillars
OD achieved
Vision in Action
SCOR outperforms
Four developments

2016E 2019E
“Vision in Action” – SCOR Global P&C can grow profitably even if market pricing is flat
Figures at 30/06/2016 exchange rates1) Compound Annual Growth Rate 27
Manage growth according to market conditions
Higher growth assumes modest pricing improvements in core markets:
− Low-single-digit percentage point improvements in loss or commission ratios in US Treaty business
− Large corporate insurance market to return to 2012 pricing levels (~20% price improvement over the strategic plan)
▐ GWP - in EUR billions
~5.8
~6.4
~7.3
Flat market
+8%1)
Modest market
recovery
Five strat. pillars
OD achieved
Vision in Action
SCOR outperforms
Four developments
+3%1)

SCOR Global P&C will continue to deliver better-than-industry technical profitability
1) Starting from the following position, based on 2015 actuals: 21% long tail, 34% mid tail, 45% short tail2) Source: Standard & Poors, “Softer for Longer”, 6 September 2016. Estimate for 2016 is 97%-102%. Assumes a “normal” cat load and
6pp of positive reserve development 28
“Vision in Action” Net Combined Ratio assumption
Evolution of business mix explains higher combined ratio assumption: in particular, increase in the relative weights of long-tail1) and Lloyd’s
Compares favourably to S&P’s2)
estimate of 100-104% for the global reinsurance industry in 2017
Divisional RoE further benefits from capital diversification: ~26% benefit from being part of SCOR Group
56-57%
57-58%
6% 6%
24.5-25%
25-25.5%
6.5-7% 7-7.5%
2016E 2016E-2019E
~94% ~95-96%
Attritional ratio
Cat ratio
Commissionratio
Expense ratio
Five strat. pillars
OD achieved
Vision in Action
SCOR outperforms
Four developments

Note: A segment can be a Specialty Line or a Treaty market
29
“Vision in Action” focuses on developing four critical areas of the business while the underlying strategy remains unchanged
Development goals
If fully executed, each development would have a similar premium impact as the average of any of the existing 31 P&C businesses: EUR 150-300 million
US P&C US is ~ half the global P&C market
Continue to build towards a clear Tier 1 reinsurer status. Restrained growth at current pricing
InternationalP&C
(incl. Lloyd’s)
Diversifies US peaks, adds profit, helps serve
global customers
Consolidate position in international markets
Build Channel Syndicate to sustained profit
Large corporate insurance
Complements reinsurance,adds profit
Transition SCOR Business Solutions towards a customer-centric model and expanding the sectors and products offered to large corporations
Managing General Agents
Access to business
Develop MGA platform to promote new business channels using the P&C division’s infrastructure
1
2
3
4
Five strat. pillars
OD achieved
Vision in Action
SCOR outperforms
Four developments
Why?Market

US P&C: penetrate national accounts while maintaining Tier 1 status with regional and global clients
SCOR Global P&C US client base by 2015 premium1) Tactics
1) Includes business written by SCOR Global P&C’s US entities and from Zurich, excluding specialties (except US Cat) and SBS2) Worldwide ranking: AmBest Top 50 Reinsurers 2016 (based on GWP 2015). US Platforms ranking: SNL Financial Insurer Statutory
Financials, 2015 data 30
1
23%
48%
9%
20%
Long-term goal: US position commensurate with SCOR’s global position.Currently SCOR Global P&C ranks #13 by US premium, vs. SCOR at #5 globally2)
Global clients
Large national clients
E&S, MGAs, captives, other niche / specialty
Regional clients
Continue to serve with global coordination
Growth: SCOR Global P&C is under-penetrated relative to peers of comparable size / rating
Maintain and grow Tier 1 position in various niches and specialist segments
Leverage global specialist expertise
Maintain Tier 1 position: relatively steady business with high barriers to entry
Five strat. pillars
OD achieved
Vision in Action
SCOR outperforms
Four developments

Portfolio management in third-party capital provisioning
Improve inward business reinsuring Lloyd’s syndicates
Develop leadership: capabilities, larger participations and branding
SCOR and Syndicate working closely, e.g. leverage SCOR local offices to build business
Selective entry to 2-3 new lines Distribution initiatives Innovation team
140
80
120
220
100
1 000100
40
60
2010
Channel 2015
Source: Lloyd’s Top Graph: Each bar represents the gross gross premium of a single syndicate in 2015Bottom Graph: note that prior year reserve releases have featured heavily in Lloyd's results recently (annual average of 7 points between 2007 and 2014 for the Lloyd’s market as a whole)
31
International P&C: build Channel 2015’s scale and profitabilityvia organic growth in attractive lines and segments2
£0b
£1b
£2b
4 ye
ar a
vera
ge
Com
bine
d R
atio
Larger syndicates tend to be more profitable
20112016E
2015median
Channel
2015 stamp capacity, £m (log-scale)
Gro
ss g
ross
prem
ium
201
5
From start-up to top half of Syndicates in four years
Five strat. pillars
OD achieved
Vision in Action
SCOR outperforms
Four developments
Maintain Tier 1 Internationally
Continue to build emerging markets (~30% of 2015 SCOR Global P&C premiums)
Syndicate tactics
Other Lloyd’s-related tactics
Other international tactics

Large corporate insurance: shift SBS from a product-focused to a client-centric model, while retaining technical capabilities
Note: Framework adapted from Aon Inpoint analysis
32
Why SBS ?
3
Transition to focus on Key Client Management while retaining technical capabilities
Deepen expertise in selected target sectors
Continue to broadenproduct offering
Complementary insurance and facultative reinsurance
Excellent profitability
SBS future
From product focus
To client focus
SBS current
Competitor position
Retailer
TrustedPartner
TechnicalExpert
Five strat. pillars
OD achieved
Vision in Action
SCOR outperforms
Four developments
Tactics

Managing General Agents: develop platform to access business outside the shared & layered reinsurance market
MGAs: a $67 billion market Tactics
Source: Bespoke analysis of various external data sources1) On a loss ratio basis comparing companies with more than 75% of their business through MGA channel with the P&C market loss ratio. Based on SNL data 33
4
SCOR is an appealing partner60%
15%
11%5%5%4%
Category 1
US
UK
Other Europe
CanadaAustralia
Others
US MGA industry has outperformed the broader P&C market over the last 10 years1)
Strong rating
Insurance licenses
Long-term orientation
Not competitive with the MGA partner
Global footprint
Best-in-class MGA partners, primarily in North America
Dedicated resources & tools:
− Underwriters, risk managers
− State-of-the-art IT system (under development)
− SCOR Global P&C licenses (incl. admitted in the US)
Methods of aligning incentives
Five strat. pillars
OD achieved
Vision in Action
SCOR outperforms
Four developments

34
Stay at the forefront of innovation by managing businesses along the risk & product lifecycle from a reinsurer’s perspective
Risk & new business identification through R&D, academics Innovation Council Start-up partnerships SCOR Foundation
Product design & roll-out with a set underwriting strategy & framework
Expertise embedded within underwriting teams with continuous training and external experts to deliver services
Adapt/redesign product features to fit client needs
TechnologicalRegulatory
Socio-politicalEnvironmental
Cyber &intangible
risks
Alternative Solutions
SBS lines
Motor
“Protection gap”Microinsurance
Sharing economyUsage-basedPeer-to-peer
Driverless cars, telematics
Nascent Emerging Mature Stagnating / Declining
Supply chain

SCOR IR Day 2016
35
Live Q&A onSCOR Global P&C

SCOR IR Day 2016
36
Coffee break

Investor Day 20167 September 2016, Paris
SCOR Global Life, succeeding in a changing environment
Paolo De MartinCEO SCOR Global Life

SCOR Global Life has delivered on all “Optimal Dynamics” expectations and has a clear vision to succeed in a changing environment
Life has met or exceeded all “Optimal Dynamics” targets & assumptions...
... and has a clear vision to succeed in a changing environment
38
Grew strongly and profitably, self-funded, while returning EUR 1 billion cash to the Group
Further energized organization with new setup while completing Generali USA integration
Successfully grew franchise while improving Life competitive position
Fully leverage healthy and performing in-force as the bedrock of the Life entity portfolio
Seize opportunities created by the changing environment through the Life division’s unique set of capabilities
Leverage an efficient, innovative and inclusive organization

Since 2013, SCOR Global Life grew strongly and profitably, self-funded, while returning EUR 1 billion cash to the Group
Met or exceeded all “Optimal Dynamics” targets & assumptions
Strong growth generating strong profitability
1) Constant FX growth calculated based on exchange rates as of 30/06/2016; 6.2% CAGR over 2013-2016 2) NTM = Net Technical Margin3) Return above pricing “Risk-free rate” (reflecting average duration of treaties); 2016 estimate based on Q1 2016Note: 2014-2015 actuals as reported; 2013 pro forma actuals
39
▐ GWP - in EUR billions (rounded) ▐ Technical Result - in EUR millions
2016E
~500
2013
~400
▐ Cash flow upstream to the Group - in EUR millions
236326183
~EUR 1bn
2016E
~225
201520142013 Total2013-2016
6.1
2014
6.4
5.1
1.0
2013
6.1
5.1
+6% CAGRat constant FX1)
Protection
FinancialSolutions
Longevity
2016OD
7.6
6.0
2016E
8.0
6.4
2015
7.7
NTM2) 7.1% 7.2% 7%7.0%
New BusinessRoE3) >10% >10% 10.0%>10%
+6% CAGR
0.61.0
0.61.00.20.1
0.9
Self-funded growth while returning EUR 1bn cash to the group

Three key achievements allowed SCOR Global Life to complete its transformation, closing the gap with key competitors
2013-2016: three key achievements
Significantly improvedcompetitive position
1) Target market composed of 400 insurers globally identified as key clients or prospectsSource: NMG Consulting global Life reinsurance studies
2) Based on gross written premiums growth over 2013-2016 40
#6 to #3
Pee
r #1
Pee
r #2
Pee
r #3
Pee
r #4
Pee
r #5
▐ NMG 2015 Business Capability Index – All respondents – SCOR target market1)
Successfully completed Generali USA acquisition & maintained US leadership position
#1Life Reinsurer of the Year,North America
Further energized organization with new setup− Created 3 regions to enhance expertise− Established Global Financial Solutions &
Longevity and Global Distribution lines
Successfully grew franchise both in Protection footprint and product lines2)
− x4 Longevity − x2 Protectionin Asia-Pacific
2015
2015
2015
2015
2015
2013
2015

SCOR Global Life, with an established franchise, is well positioned for the future
Tier 1 global franchiseComplete offering withstrict biometric focus
1) Includes Medical, Critical Illness, Disability and Long-Term Care2) As at end June 20163) SCOR own estimates & research 41
▐ 2016E GWP estimate – in EUR billions ▐ 2016E GWP estimate – in EUR billions ▐ SCOR Global Life main locations and resources2)
Australia& NZ
Korea
France
UK/Ireland
Asia-Pacific
EMEA
Americas
6%
7%10%
50%
8.0
13%
32%
55% US
2%
127
Asia-Pacific
331
EMEA
404
Americas
Global product lines & central functions169
#1
#2
#1
#1
#4
#1
Top3
#1
Top3Health1)
LifeProtection
FinancialSolutions
Longevity
18%
62%
8.0
80%
13%
7%
Presence in all key markets & strong leadership positions
▐ SCOR Global Life competitive position3)

42
Shifting of growth to emerging & evolving markets
Changing demographics; increasing longevity awareness and demand in retirement
Prolonged low yield environment changing product mix & putting pressure on profitability
Widening protection gap presents opportunities
Changing regulatory environment impacts clients' solvency & go-to-market strategies
Reduced public spending increases reliance on private coverage
Technology potentially disrupting offering and distribution channels
SCOR Global Life's environment is changing, creating overall strong tailwinds for Life reinsurance

43
SCOR Global Life has a clear vision to succeed in this environment
Ensure a thorough understanding and active management of in-force
book's risks and opportunities
II
Ensure an efficient, innovative and inclusiveorganization attracting and
retaining the best talent
III
Implementcomprehensive
franchise strategyto seize market opportunities
I
No material changein the risk profileor risk appetite

Healthy in-force book is the bedrock of SCOR Global Life's portfolio and has showed consistently strong performance over time
~75% of SCOR Global Life's book is long-term in-force from prior years of activity
Excellent MCEV results with aconsistent profitability
1) In-force book = all long-term treaties signed in 2015 or earlier2) Market Consistent Embedded Value3) Embedded Value 44
I
▐ 2016E GWP estimate - in EUR billions ▐ MCEV2) (in EUR billions) & EV3)
operating result (in EUR millions)8.0
Total
3.8
1.2
6.0
In-force1)
0.50.5
75%
25%
FinancialSolutions
Protection
Longevity
Long-term in-force from
previous years1)
New and renewed business
US
RoW
In-force book delivers consistent value while funding SCOR Global Life growth
426362
402
2014
4.5 4.7
2015
5.6
2013
+12% p.a.
Assumptions changes and other operating variances
Experience varianceMCEV2)
EV3) operating result
VarianceCorridor
+2%
-2%

Five developments will enable the delivery of the in-force portfolio’s full value
Five developments to strengthen in-force management and unlock value
Manage and optimize a healthy profitable in-force book1) to deliver consistent result
1) In-force book = all long-term treaties signed in 2015 or earlier2) Technical Result 45
I
Intensify R&D efforts
Pursue streamlining of data flows
Continue in-force optimization work
Explore possibility of accelerating cash-flows
Increase operational efficiencies
▐ GWP (in EUR billions) & TR2) (in EUR millions)
~350
~5.6
2016E
~400
~6.0
2019E
TRGWP
2016 in-force book expected to deliver ~EUR 350 million of technical result in 2019

Note: the three key elements of the “Deepen the franchise” section of the plan are deeply interconnected, therefore premium volumes and results cannot be added up 46
Comprehensive franchise strategy to seize market opportunities, leveraging a unique set of capabilities
Expansion of footprintin Protection to defend and strengthen market presence
around the world
Diversification of risk profile
by growing health and longevity
Growth of consumer demand
by supporting clients with unique distribution solutions
II

Expansion of footprint: three different strategies required to address shifting growth patterns in Protection markets
Three areas of focus to address the shift in growth patterns…
…leading to a greater diversification of geographies
1) Source: SCOR own estimates & research2) New business contribution reflects the impact in 2019 of new business written over 2016-2019 47
II
▐ Protection GWP - in EUR billions
Differentiate
Reinforce
Expand
2019E
~7.2
~75%
~10%
~15%
2016E
~6.4
82%
8%
10%
~45%
~40%
~15%
New Bus. Contribution2)
~1.3
High
Mid
LowHighMidLow
Growth potential for SCOR
Global Life1)
ExpandAsia-Pacific footprint
Differentiate to maintain leadership positions
Weight in SCOR Global Life’s
portfolio1)
Reinforceexisting platforms

IIExpanding the Asia-Pacific Protection footprint: market is growing due to favourable macro-trends and a shift to protection
Strong tailwinds from changing environment…
…resulting in an expanding reinsurance market
1) Share of global GDP growth; Source: International Monetary Fund2) Source: OECD
ncludes new cessions on both new and existing treaties by insurers, and short-term business up for renewal; “Core protection”, excluding Health, Financial Solutions and Longevity
3) I 48
▐ Yearly Contestable Cessions3), GWP - in EUR billions
2.3
2016E
1.9
+7% p.a.
2019E
~5%
3-5%
>10%
>10%
Favourable macro-trends
Shift to protection
Estimated2016-2019 CAGR
—
Shifting of growth to emerging markets:− Asia-Pacific:~50% of global growth1)
Aging population:− Japan population over 65: from ~25% in
2015 to 40% in 20502)
− China: from 10% to 24%2)
Fast growing middle class:− Share of ~30%-50% by 20202)
Evolving prudential regulation:− China: C-ROSS
Shifting product mix:− Shifting from savings to protection due to
low yield environment
Increasing reliance on private coverage:− Gradual withdrawal of state welfare
systems towards private sector
Widening protection gap:− China, South East Asia

Expanding the Asia-Pacific Protection footprint Example of China: strong fundamentals driving long-term growth
Massive protection gapto be filled
~70% population as high-income class and Mass
affluent by 2025
1) Richer households referring to: High-end and Mass-affluent classes. Source: Towers Watson2) High-end > 500,000 RMB > Mass-affluent > 100,000 RMB > Mass > 37,000 RMB > Low-income. Source: Roland Berger 49
II
▐ Proportion of the richer households1) with at least one Life Insurance policy
Reinsurance cessions expected to grow >10% p.a. by 2019
81%
57%
25%
6%11%11%
2025E
58%
11%
2015E
7%
28%
2010
▐ Population structure by household income2)
4%1%
Low-income
Mass
Mass affluent
Highend
87% 92%
29%
Protection gap
China Hong-Kong Taiwan
“Pension & Health government measures” to boost industry:
− New National 10-year Guidelines
− Tax incentives for individual health
− Tax deferral policies under study
Expected positive impact from C-ROSS on Protection products:
− Implementation of capital charges favourable to protection products
Government & Regulatory directions to provide stimulus

Expanding the Asia-Pacific Protection footprint: building on strong foundations to “Surf the wave” in Asia-Pacific
Established presencein Asia-Pacific with
careful entry strategyMaterial growth expected,
thanks to strong fundamentals
1) Gross Written Premiums; all product lines2) Technical Result 50
II
▐ Asia-Pacific GWP1) – in EUR billions
Strong macro-fundamentalsprovided tailwinds
2019E
1.1
1.7
2016E
+16%p.a.
~EUR 55m ~EUR 115mTR2)
Continuation of investments:
− Pursue selected and profitable growth in Group & Individual Life
− Further strengthen strong position thanks to new product development
Launching of new investments:
− Expand through product development, Health offering and C-ROSS solutions
− Expand through product development, Group business and large tenders
− Establish presence in individual life market with Fac Underwriting capabilities
Established longstanding presence in the region, reaching 8 offices in all key markets with over 120 people
Built strong regional platform, with key capabilities and excellent understanding of risks & context
Carefully grew the book, with sound profitability
Building on strong foundations

Diversification of risk profile: unique set of capabilities coupled with changing environment driving Health & Longevity growth
Overall share of Longevity and Health to grow by 5 points by 2019
Longevity and Health to represent half of new business contribution by 2019
1) Broader definition of Health including Medical, Critical Illness, Disability, Long-term Care2) New business contribution reflects the impact in 2019 of new business written over 2016-2019 51
II
▐ GWP - in EUR billions▐ Total GWP - in EUR billions
FinancialSolutions
~9.4
~12%
~61%
2016E
~8.0
~13%
~65%Life
Health1)
Longevity
2019E
FinancialSolutions
Life
Health1)
Longevity
2016-2019 New business contribution2)
~2.2
~14%
~37%
~49%
~25%
~24%
~7%
~15%
~11%
~16%~27%
~22%

Diversification of risk profile – Health: leverage existing capabilities and client relationships to grow Health business
Favorable macro-trends driving demand for Health insurance
Leverage unique set of capabilities to build strong Health offering
1) Broader definition of Health including Medical, Critical Illness, Disability, Long-term Care2) Health GWP also included in the “expanding the Asia-Pacific footprint” figures on page 493) Technical Result 52
II
Clients withMedical
business
Top 50SGL clients
66%
Strong macro-trends: aging population, growing middle class, gradual withdrawal of State welfare
Increase in treatment cost and growing Health spending
Sizeable reinsurance market expectedto grow ~6% per annum worldwide
Medical and the broader Health offering are at the core of our clients’ business
▐ Health1) GWP - in EUR billions
Asia2)
RoW
1.2
0.4
0.8
2019E
1.5
0.7
0.9
2016E
~EUR 65m ~EUR 100mTR3)
+8%p.a.
Focus on APAC& Middle East Focus on US & EMEA
Critical illness
AlzheimerCI
DiabetesStroke
HIVHeart Attack
Cancer
Disability
Care solutions
Medical
Focus onAsia-Pacific
& EMEA
Clients withHealth1)
business
Top 50SGL clients
84%
Potentialto reach
EUR 1.8bnin 2021

Diversification of risk profile – Longevity: growing awareness of longevity risk supporting strong growth
Strong macro trends increasing awareness of longevity risk…
…and strong track record will enable Longevity to keep growing
1) Source: OECD Factbook 2009, Council for Economic Planning and Development2) Technical Result 53
II
10%
0%2050204020302020201020001990
40%35%30%
20%25%
15%
% of aged (65+) people1)
Super-aged societies
Societies are rapidly aging
Prolonged low yield environment putting pressure on asset returns
Increasing capital charges (e.g. Solvency II) for Longevity risk
▐ GWP - in EUR billions (rounded)
2019E
~1.0
2016E
~0.6
x2New business
kept at constant levels
~EUR 20m ~EUR 40mTR2)
UK to remain the cornerstone of longevity strategy, thanks to strong track record
Ready to capture opportunities in North America & EMEA
Strict biometric focus maintained
Levels of Longevity new business set to maximize diversification, within SCOR’s risk appetite
Growth of consumer demand: support clients to establish valuable and sustainable relationships with their consumers
SCOR Global Life’s Clientsare facing a challenging environment
Global Distribution Solutions already has strong capabilities to support SCOR Global Life’s clients
1) Example of European insurers (Continental Europe, excluding UK & Ireland)Source: NMG Consulting 2015 global Life reinsurance study 54
Technological disruption:− Digitalization affecting traditional distribution models− Data becoming a valuable commodity
Untapped Protection gap:− Decreasing levels of coverage globally
▐ Perceived relevance of reinsurers for distribution support – continental Europe1)
Insurers consider reinsurer support to be key in developing new distribution channels
~EUR 250 million of premiums (+17% p.a.) and ~EUR 30 million of technical resultenabled by distribution solutions by the end of the plan
Small insurers
Relevant 52%
Large insurers
78%
All insurers
58%
II
Email Advertising
Social media
Viral Mobile
VideoLanding pages
Digital marketing
tools

Growth of consumer demand: two examples of SCOR Global Life capabilities, Velogica and an e-underwriting tool
Adding new data sources to address fully underwritten space
Creating consumer journeys with e-underwriting experience
1) Other data sources including MIB reports & MVR
55
II
Basic lifestyle questions
Credit & Bank information
Guarantee & Rate offers
Insurance certificatewith paperless underwriting
VelogicaAlgorithm
Determine decision based on weighted average scoring
Expected to process 1 million applications in 2017
Data Sources
Potential Data Sources
ElectronicHealthrecords
Electroniclab data
Criminalhistory
Credithistory
Smokerinformation
Rx Profiles
Application Other dataSources1)

Ensure an efficient, innovative and inclusive organization attracting and retaining the best talent
Pave the way for the future Increase productivity through innovation
1) Productivity calculated as Premium / Direct cost2) Direct costs includes costs directly controllable by SCOR Global LifeNote: based on Q4 closing FX 56
▐ Productivity gain (in %), index 100 in 2016
III
Develop further value innovation
Leverage Digital strategy to propose new client services & optimize processes
Increase focus on R&D to enhance offering
Manage our talents
Help talents & experts grow
Promote pride on belonging
Become a client-centric organization Enrich the value
proposition to clients Adapt resource allocation
to business potentials
Leverage our diversity
Define a shared and more consistent identity
Encourage best practice sharing
Attract& retaintalent
Building an innovative and inclusive organization +10% productivity gain over the plan
2019E
100
2016E
+10%
Productivity1)
Direct costs2)
Premium
17 projects in progress or under study to drive innovation and process efficiency
Streamlining of back office to allow increased focus on front-office
→ 28% efficiencies to be reached in the US platform by the end of 2017

“Vision in Action” will deliver sustainable value and dividends through strong profitable growth
Strongfranchise growth…
…increasing technicalresult…
1) (Own funds – SCR); SGL SE gross of retro to Group2) Return above pricing “Risk-free rate” (reflecting average duration of treaties)
; estimate
57
I
II
III
2019E
~9.4
~4.8
~2.9
~1.7
2016E
~8.0
4.4
2.5
1.1
Strong growth across all geographies
EMEA
Asia-Pacific
Americas
▐ GWP - in EUR billions ▐ Technical results - in EUR millions
New business RoE > 10%2)
Net Technical margin: 6.8% - 7.0%
2019E
~600
2016E
~500
▐ Capital surplus1) - in EUR billions
~EUR 0.9 billion of capital surplus creation
Continue strong repatriation to Group
~1.9
~0.9bn
2019E
~2.8
2016E
+5.5%p.a.
…with significantvalue creation

SCOR IR Day 2016
58
Live Q&A onSCOR Global Life

SCOR IR Day 2016
59
Lunch break

Investor Day 20167 September 2016, Paris
SCOR Global Investments normalizes its asset management policy
François de VarenneCEO SCOR Global Investments

61
Key messages
The financial environment should be affected during 2016-2019 by a probable prolonged period of low growth / low yield / low inflation
SCOR Global Investments successfully delivers its two “Optimal Dynamics” assumptions
SCOR benefits from its unique invested assets currency mix to implement a differentiated investment strategy by currency
Normalization of the asset management policy during “Vision in Action” will enable SCOR to achieve higher investment returns

SCOR Global Investments successfully delivers its two “Optimal Dynamics” assumptions
Achieve higher investment returnsAccelerate SCOR Investment Partners’
positioning as a niche third-party asset manager
1) “Optimal Dynamics” Return on Invested Assets (“RoIA”) refers to the Q3 2013 – Q2 2016 average of quarterly RoIA2) Assets under Management (“AuM”) managed by SCOR Investment Partners on behalf of third party clients, including
undrawn commitments 62
▐ Return on invested assets (in %) ▐ Assets under Management evolution (in € bn)2)
0.1 0.10.3
0.70.9
1.31.6
2.1
Q42012
Q22013
Q42013
Q22014
Q42014
Q22015
Q42015
Q22016
“Optimal Dynamics” objective: € 1.5 bn AuM
4.0%3.7%
2.9%2.6%
2.9% 3.1% 3.1%
3.2%
2.3%1.8% 1.7% 1.6%
1.0% 0.9%
2010 2011 2012 2013 2014 2015 H12016
Return on invested assetsSGI risk-free duration-adjusted benchmark
“Optimal Dynamics” average RoIA: 3.0%1)
Return on invested assets > 3.0% by the end of “Optimal Dynamics”
Assets managed on behalf of third-party clients > € 1.5 billion by the end of 2016

Unexpected extremely and historically low interest rates challenged the initial assumptions on which “Optimal Dynamics” plan was relying
10-year government rates – USA1) 10-year government rates – Eurozone1)
1) Source: Bloomberg, data as of 31/08/2016. Blue line shows historical interest rates levels. Purple line shows interest rates market forwards at the end of July 2013 at launch of “Optimal Dynamics”
2) For the Eurozone, government rates correspond to German 10-year Bund yield 63
▐ 10-year yield (%) ▐ 10-year yield (%)2)
-0.50.00.51.01.52.02.53.03.54.04.5
2012 2013 2014 2015 2016
July 2013 forwards (Optimal Dynamics)Actuals
-0.50.00.51.01.52.02.53.03.54.04.5
2012 2013 2014 2015 2016
July 2013 forwards (Optimal Dynamics)Actuals
Current spread: -252bps Average spread since OD: -123bps
“Optimal Dynamics” launch
Current spread: -188bps Average spread since OD: -84bps
“Optimal Dynamics” launch

All figures are as of 30/06/20161) Including cash, coupons and redemption 64
Current portfolio positioning reflects a very high level of prudence
Total investments of
EUR 27.6 billionwith total invested assets of EUR 18.8 billion and funds withheld of EUR 8.8 billion
Financial cash flows1) of
EUR 7.3 billionexpected over the next 24 months, representing 39% of the invested assets portfolio
Average rating and duration per asset class
RATING EFFECTIVE DURATION
Short-term investments AA+ 0.3 yrs
Government bonds & assimilated AA 3.0 yrs
Covered bonds & Agency MBS AAA 4.3 yrs
Corporate bonds A- 5.2 yrs
Structured & securitized products AA+ 0.8 yrs
Global – Fixed income AA- 4.0 yrs
▐ In % (rounded) Liquidity 14%Cash 11%
Fixed income 76%
Short-term investments 3%
Covered bonds & agency MBS 9%
Corporate bonds 33%
Structured & securitized products 2%
Loans 4%Equities 2%
Real estate 4%Others 3%
EUR 18.8 billionGovernment & assimilated bonds 29%
Total invested assets

SCOR has historically adopted a defensive risk profile on its investment portfolio, in a global context of rating downgrades
Evolution of invested assets’ capital intensity1)
during “Optimal Dynamics”Rating structure of fixed income investment universe4)
1) Capital intensity is defined as the VaR 99.5% 1-year of the portfolio (in % of invested assets)
2) As at 30/06/2016, including non interest sensitive assets 65
Current versus neutral duration
Current duration2)
Neutralduration3)
P&C division 2.9 3.7
Life division 3.4 7.2
Average Group 3.0 5.1
12345678
Q4'08 Q4'09 Q4'10 Q4'11 Q4'12 Q4'13 Q4'14 Q4'15 Q2'16
12345678
Q4'08 Q4'09 Q4'10 Q4'11 Q4'12 Q4'13 Q4'14 Q4'15 Q2'16
12345678
Q42008
Q42009
Q42010
Q42011
Q42012
Q42013
Q42014
Q42015
Q22016
AAA AA+
AAAA-A+
AA-
BBB+
AAA AA+
AAAA-A+
AA-
BBB+
AAA AA+
AAAA-A+
AA-
BBB+
Glo
bal f
ixed
in
com
e in
dex
Glo
bal
gove
rnm
ent
bond
s in
dex
Glo
bal
corp
orat
e bo
nds
inde
x
AA
AA
A-
0%
2%
4%
6%
8%
août-13 févr.-14 août-14 févr.-15 août-15 févr.-16
Capital intensityOptimal Dynamics limit
3) The neutral duration corresponds to the duration of invested assets which immunizes the Basic Own Funds relative to interest rate changes (estimated on the economic balance sheet as at 31/12/2015)
4) Source: Bank of America Merrill Lynch indices
6.6%7.0%

66
Since 2007, SCOR Global Investments has successfully detected all major shocks and prevented the Group from severe investment losses
Liquidity crisisdetected early 2007
Aug-07Beginning of the subprime crisis
Sept-08Lehman Brothers bankruptcy
Jul-11Equity market turmoil
European sovereign debt crisisdetected in November 2008
Double dipdetected mid-2010
May-10Greece bailout
2013Recession in Europe
US muni bonds crisisdetected in summer 2011
Mounting global headwindsdetected early 2015
Diverging monetary policies / FX volatilitydetected mid 2013
Dec-15FED rates hike
Q2 2007
Q4 2007
Q2 2008
Q4 2008
Q22009
Q4 2009
Q2 2010
Q4 2010
Q2 2011
Q4 2011
Q2 2012
Q42012
Q2 2013
Q4 2013
Q2 2014
Q42014
Q2 2015
Q4 2015
Q2 2016
Capital preservation• Derisking of the investment portfolio• Reduced duration of the fixed income
portfolio• Reduction of equity exposure started
early 2007 and down to less than 5% in Q1 2009
• Very marginal exposure to subprimes
Inflection program• € 2.1 billion of cash and ST investments
reinvested between Q1 and Q4 2009• Targeted asset classes: medium-term
govies, corporate bonds and equities
Assets and capital in strong currencies / countries
Reduced exposure to French public debt, down to € 221m in Q4 2011 from € 733m in Q4 2010
No exposure to US municipal bonds (Q3 2011 results)
Progressive and selective increase of the fixed income portfolio duration, mainly on USD and GBP-denominated buckets
Decrease of cash bucket (at 5% in Q4 2014 vs. 14% in Q4 2013)
Deliberate and significant reduction of equity exposure (-27%) executed mid-June 2011
No exposure to sovereign debts issued by countries under scrutiny (March 2010, Full year 2009 pres.)
2011/2012Sovereign downgrades (USA, France)
Jun-16Brexit vote
Capital preservation• Derisking of the investment
portfolio• Increase of liquidity• Halt of the rebalancing
strategy and duration increase
Reduced exposure to energy, metals & mining and banking sectors completed in January 2016
Very defensive GBP portfolio with high quality fixed income (AA-), no equity and short duration
Equity market turmoil
detected in June 2011
Jul-13Detroitfile for bankruptcy
Jan-15ECB QE(sovereign)

Since June 2015, SCOR has temporarily adapted its investment strategy to cope with the very high level of uncertainty
67
Evolution of the effective duration of the fixed income portfolio
▐ In years
Evolution of liquidity (cash and short-term investments)
▐ In % of invested assets
16.1%13.8%
11.2%
5.3%
9.2%10.8%
14.2%
Q2'13 Q4'13 Q2'14 Q4'14 Q2'15 Q4'15 Q2'16
2.93.4
3.8 4.0 4.1 3.9 4.0
Q2'13 Q4'13 Q2'14 Q4'14 Q2'15 Q4'15 Q2'16
June 2015 onwards:increased prudence
Sept. 2013 – May 2015: rebalancing phase
After having reached its target level of 5% in Q1 2015, liquidity has been further increased to cope with the uncertain economic and financial environment from June 2015 onwards
The progressive increase of the fixed income portfolio duration has been momentarily halted given the high uncertainty on interest rates

68
The financial environment should be affected during 2016-2019 by a probable prolonged period of low growth / low yield / low inflation
US
Margins to tighten monetary policy?
UK
Cost of Brexit?
EMERGING COUNTRIES
Soft or hard landing in China limiting growth
prospects?
EUROZONE
Vulnerability in the absence of structural
reforms?Worldwide convergence to a low speed regime
Higher volatility
Sluggish growth
Low interest rates
Low inflation
SCOR Global Investments scenarios for the next 3 years are based on conservative macroeconomic assumptions given the high level of uncertainty, allowing for potential upsides

USD 47%
EUR 31%
GPB 9%
CAD 4%CNY 3%
Other 6%
In this low yield environment, SCOR benefits from its unique currency mix to implement a differentiated investment strategy by currency
SCOR continues to benefit from a well diversified currency exposure, providing high flexibility
Investment drivers are analysed by currency block, leading to differentiated investment strategies
69
▐ Total invested assets currency split as at 30/06/2016, in % (rounded) ▐ Key investment drivers
Average rates level + - -Steepness of yield curves + - =Corporate credit market = + =Valuation of equities - = -
+ Positive view = Neutral view - Negative view

USD portfolio: some value can still be extracted from the steepness of the yield curve, in a context of potential rates increase by the Fed
USD portfolio Current asset allocation
Investment themes in USDfor “Vision in Action”
All figures are as of 30/06/2016
70
Benefit from the steepness of the curve through fixed-rate products
Monetize the convexity of the fixed income portfolio through increased exposure to agency MBS
Focus on high quality issuers in the corporate bond space
Cash 9%
Fixed income 85%
Short-term investments 3%
Covered bonds & agency MBS 5%
Corporate bonds 47%
Structured & securitized products 2%
Loans 0%Equities 2%Real estate 1% Others 3%
Government & assimilated bonds 28%
Fixed income portfolio duration4.4 years$
▐ In % (rounded)
EUR 8.8 billion

EUR portfolio: absolute rate levels are a challenge, but credit markets are still resilient and will be used to enhance the recurring yield
EUR portfolio Current asset allocation
Investment themes in EUR for “Vision in Action”
All figures are as of 30/06/2016
71
Cash 16%
Fixed income 55%
Short-term investments 0%
Covered bonds & agency MBS 20%
Corporate bonds 24%
Structured & securitized products 2%
Loans 11%
Equities 3%
Real estate 12%
Others 3%
Government & assimilated bonds 9%
Fixed income portfolio duration3.9 years€
Avoid negative rates by decreasing exposure to cash, government bonds and covered bonds
Enhance recurring yield through credit risk with an increased focus on loans while benefitting from their protective features
▐ In % (rounded)
EUR 5.8 billion

1) No GBP-denominated exposure2) At current market conditions 72
EUR portfolio: Loans keep a very compelling risk / return profile in order to enhance the recurring yield of the portfolio
Corporateloans
Real estateloans
Infrastructure loans
SCOR’s investment strategy
Focus on first lien senior secured loans, syndicated by banksBenefit from a Libor / Euribor floor on most of the loans to avoid negative interest rates
Invest mostly in EUR-denominated assets1)
Key features
Sponsored / acquisition corporate financing
Syndicated and standardizedloans
Value-added real estatefinancing
Average loan-to-value < 65%
Infrastructure and renewable energy
Defensive portfolio mostlyinvested in brownfield projects
Geographical focus Europe France Europe
Targeted return2) Libor / Euribor+ 450-500 bps
Libor / Euribor+ 200-300 bps
Libor / Euribor+ 180-200bps
Average life 3-5 yrs 3-5 yrs 10-12yrs
Average risk profile Sub investment grade Low investment grade Low investment grade
Expected loss given default 25% 15% 20%
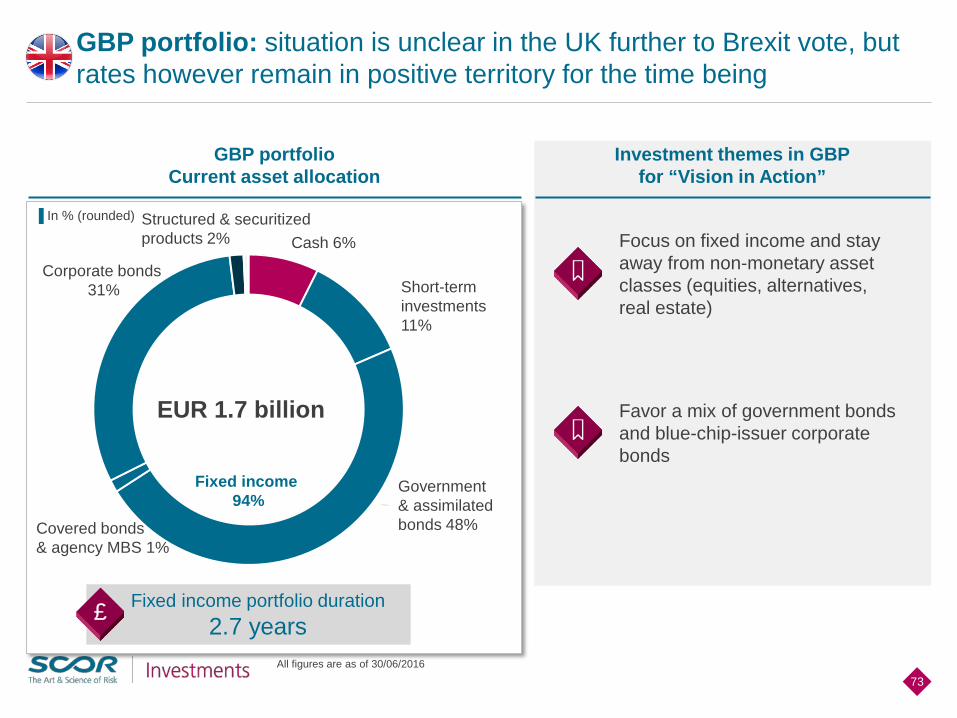
GBP portfolio: situation is unclear in the UK further to Brexit vote, but rates however remain in positive territory for the time being
GBP portfolio Current asset allocation
Investment themes in GBPfor “Vision in Action”
All figures are as of 30/06/2016
73
Cash 6%
Fixed income 94%
Short-term investments 11%
Covered bonds& agency MBS 1%
Corporate bonds 31%
Structured & securitized products 2%
Government & assimilated bonds 48%
Fixed income portfolio duration2.7 years£
Focus on fixed income and stay away from non-monetary asset classes (equities, alternatives, real estate)
Favor a mix of government bonds and blue-chip-issuer corporate bonds
▐ In % (rounded)
EUR 1.7 billion

1) Definition of “ALM buckets”: split of the Economic Balance Sheet (EBS) into homogeneous characteristics (P&C and Life for business, long-term capital) 74
The investment portfolio is dynamically positioned through a strict ALM process, integrating economic and market expectations
TARGET ASSET ALLOCATION
P&C bucket1) asset allocation
Life bucket1) asset allocation
Long-term capital bucketasset allocation
Risk appetiteRisk preferencesRisk tolerances
StrictALM process
Economicand marketexpectations
Dynamic aggregated asset allocation designed to optimize financial contribution and capital allocation
75
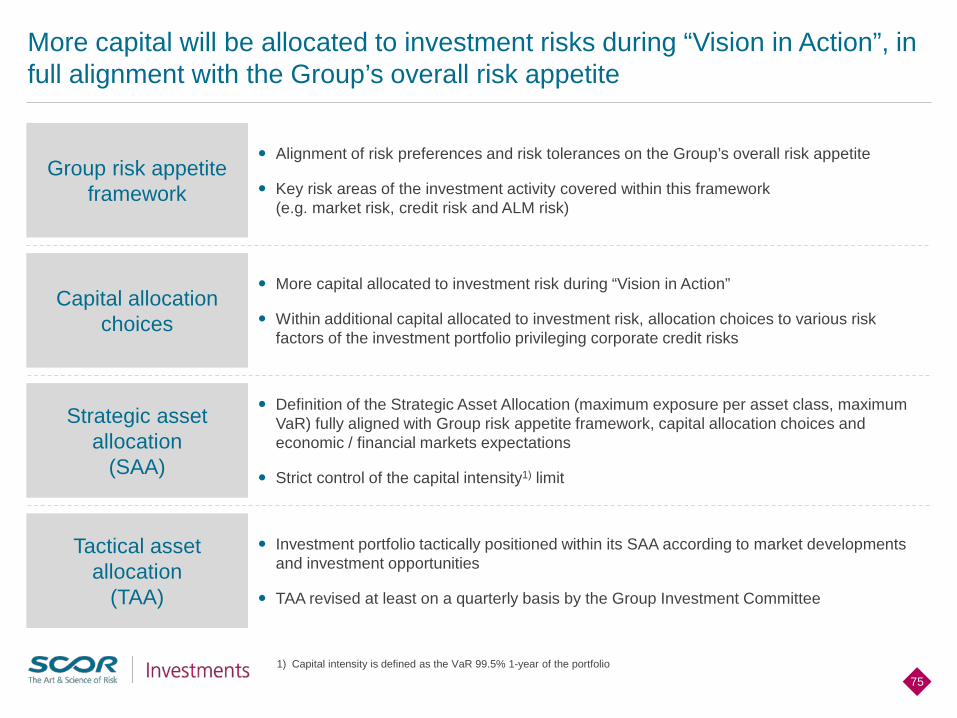
More capital will be allocated to investment risks during “Vision in Action”, in full alignment with the Group’s overall risk appetite
Group risk appetite framework
Capital allocation choices
Strategic asset allocation
(SAA)
Tactical asset allocation
(TAA)
Alignment of risk preferences and risk tolerances on the Group’s overall risk appetite
Key risk areas of the investment activity covered within this framework (e.g. market risk, credit risk and ALM risk)
More capital allocated to investment risk during “Vision in Action”
Within additional capital allocated to investment risk, allocation choices to various risk factors of the investment portfolio privileging corporate credit risks
Definition of the Strategic Asset Allocation (maximum exposure per asset class, maximum VaR) fully aligned with Group risk appetite framework, capital allocation choices and economic / financial markets expectations
Strict control of the capital intensity1) limit
Investment portfolio tactically positioned within its SAA according to market developments and investment opportunities
TAA revised at least on a quarterly basis by the Group Investment Committee
1) Capital intensity is defined as the VaR 99.5% 1-year of the portfolio

Normalization of the asset management policy will enable to achieve higher investment returns
Normalization of the asset management policy
“Vision in Action” Strategic Asset Allocation (SAA)
1) Minimum cash + short-term investments is 5%2) Including listed equities, convertible bonds, convex equity strategies3) Including alternative investments, infrastructure, ILS strategies, private and non-listed equities4) Capital intensity is defined as the VaR 99.5% 1-year of the portfolio (in % of invested assets)
76
Liquidity at 5%
Additional degrees of freedom in the Strategic Asset Allocation controlled by a strict capital intensity limit
Duration gap closed by the end of “Vision in Action”, by increasing invested assets duration
Min Max
Cash 5.0%1) -
Fixed Income 70.0% -Short-term investments 5.0%1) -Government bonds & assimilated - 100.0%Covered bonds & Agency MBS - 20.0%Corporate bonds - 50.0%Structured & securitized products - 10.0%
Loans - 10.0%
Equities2) - 10.0%
Real estate - 10.0%
Other investments3) - 10.0%Capital intensity4)
Duration of invested assetsFixed income average rating
-2.0 years
A+
8.5%--
Additional expected financial contribution with a marginal impact on the SCR and Solvency Ratio
▐ In % of invested assets

Q2 2016 Potential portfolio
Cash 11% 4%
Fixed Income 76% 80%
Short-term investments 3% 1%
Government bonds & assimilated 29% 17%
Covered bonds & Agency MBS 9% 14%
Corporate bonds 33% 45%
Structured & securitized products 2% 3%
Loans 4% 7%
Equities1) 2% 2%
Real estate 4% 4%
Other investments2) 3% 3%
Capital intensity3) 6.6% 8.5%Duration (invested assets) 3.0 years > 3.0 yearsAverage rating (fixed income) AA- A+
Potential invested assets portfolio deployed during the next strategic plan
1) Including listed equities, convertible bonds, convex equity strategies2) Including alternative investments, infrastructure, ILS strategies, private and non-listed equities3) Capital intensity is defined as the VaR 99.5% 1-year of the portfolio (in % of invested assets) 77
The normalization strategy, privileging corporate credit risks, will be implemented at the beginning of “Vision in Action”, as market conditions permit
▐ In % of invested assets (rounded) Cash and short-term investments reduced to the minimum level of 5%
Government bonds exposure decreased in order to:− avoid negative yields in EUR− rebalance the USD investment portfolio
Increased exposure to US Agency MBS to monetize the negative convexity of the fixed income portfolio
Increased proportion of corporate bonds, with a moderate increase of lower rated securities
Potential opportunities in structured and securitized products
Continued ramp-up of the loan portfolio, mainly in EUR
Pursued rebalancing of equities towards convertible bonds
Stable exposure to real estate, in a context of very high valuations

Environmental
78
Throughout “Vision in Action”, ESG policy will be reinforced
Social Governance
Strong focus on climate change topics, consistent with the 2°C
objective
Enhanced monitoring of the investment portfolio’s carbon
footprint
Up to EUR 500m of new investments in renewable energy
projects and energy-efficient buildings by 2019
Continued promotion of ILS and catbond investments to a wide
range of investors
Up to EUR 50m of new investments in life science
companies by 2019
Active role in the knowledge society, through SCOR’s
Foundation for Science and dedicated private equity
investments up to EUR 50m
Adhesion to UNPRI (United Nations Principles for
Responsible Investment)
Native integration of ESG criteria in all investment decisions and
partner selection
Active voting policy to challenge corporate decisions on ESG topics
SCOR Global Investments is dedicated to respect its ESG policy

Strong recovery Sustained growth in the US Accelerating recovery in the Eurozone Oil and commodities back to normalAverage level of interest rates up ~60 bps compared to 31 December 2015
Expected average RoIAduring “Vision in Action”1)
1) Expected average of IFRS Return on Invested Assets (RoIA)
79
Thanks to differentiated investment strategy by currency, SGI will provide a strong and recurring financial contribution throughout “Vision in Action”
Gradual recovery, in a context of high uncertainty Fed’s monetary policy progressively getting back to normal Eurozone remaining entangled in a context of negative rates Concerns on emerging economiesBased on forward rates as of 31 December 2015
Convergence to a low speed regime with low interest rates Prolonged period of low growth and low interest rates, surrounded by a
high level of risk Monetary policies remaining extremely accommodative globallyBased on forward rates as of 30 June 2016(average level of interest rates down ~90 bps compared to 31 December 2015)
2.5%
2.9%
3.2%

SCOR IR Day 2016
80
Live Q&A onSCOR Global Investments
Investor Day 20167 September 2016, Paris
SCOR builds upon an established ERM framework and a strong solvency position
Frieder KnüplingCRO

82
Key messages
Established and robust ERM framework covering existing and emerging risks
Continuously enhanced risk management framework supporting business developments
Solvency scale confirmed for “Vision in Action” without change
Well-balanced risk composition ensures superior diversification benefit
Strong solvency position in the optimal range

SCOR’s comprehensive ERM framework covers the entire risk spectrum
Overview of SCOR’s risk profile ERM mechanisms aligned with risk profile
83
Nat cat
P&C long-tail reserves
deterioration
Long-term mortality
deterioration
Pandemic
Market risk
Longevity
Credit risk
Terrorism
Operational risk
Lapse risk
Emerging risks
Risk appetite framework
Solvency management
Capital shield strategy
Exposure monitoring
Risk analyses
ALM
Capital model
Reserving
Internal controls
Gro
up e
xpos
ure
leve
l

Risk appetite will remain stable in relative terms
Risk exposure will increase on an absolute basis consistently with SCOR’s increased size and capital base
SCOR will maintain throughout “Vision in Action”:
- A high level of diversification - An upper mid-level risk appetite - A robust Capital Shield
Strategy
SCOR pursues an approach of thorough risk selection to optimize its risk profile and aims:
- To actively seek risks related to reinsurance and selected primary insurance
- To assume a moderate level of interest rate risk, credit risk, FX and other market risks
- To minimize its own operational and reputational risks
- To minimize underwriting of cedants’ asset-related risks
84
Risk appetite framework for “Vision in Action” ensures full alignment between growth, profitability and solvency
Risk appetite framework broadly unchanged and consistent with previous plans
Solvency target
Capitalization level: Solvency target driving a process of gradual escalation and management responses
Exposurelimits
Risk drivers: Maximum net1:200 annual aggregate loss
Extreme scenarios: Maximum net 1:200 per-event loss
Investments: Duration limits and risk exposure limits for overall portfolio and investment categories
Limits per risk in the underwriting and investment guidelines
Footprint scenarios (deterministic)complement the exposure limits
Risk appetite Risk preferences Risk tolerances

SCOR’s ERM team supports business developments by ensuring an optimized balance between risk and return with the Group’s risk appetite
ERM approach to business development
New business expansion supported through a robust ERM approach
1) Managing General Agents
85
Provide expertise on risk analysis, risk and return quantification, cross-divisional accumulation control etc.
Comprehensive risk assessments of the strategic business developments
Risk assessments and recommendations discussed at Board level
Risk assessments also include a view of controls required to keep the strategic developments within risk appetite
Health
Comprehensive quantification of capital needs, diversification benefits and return metrics
Ensure sufficient retrocession and/or other risk transfer mechanisms are available on acceptable terms
Robust and established referral process for large or unusual opportunities
Close monitoring of business via state-of-the-art IT platform
Careful selection and monitoring of MGA partners
Intensive modelling support Full inclusion in existing accumulation
controls
MGAs1)
Work with wider industry on Cyber risk categorization to promote and facilitate data capture
Improve cross functional governance towards cyber risks
Set up SCOR Security Operating Center Monitor development of cyber insurance
market
Cyber risks
Example Risk management recommendation and contribution

86
Solvency scale well established and confirmed for “Vision in Action”
Action Possible management responses (examples)
Escalation level
Redeploy capital
Consider special dividends Consider acquisitions Buyback shares / hybrid debt Increase dividend growth rate Reconsider risk profile, including capital shield strategy Enlarge growth of profitable business
Board/AGM
Fine-tune underwritingand investment strategy No specific risk or capital management actions Executive
Committee
Re-orient underwritingand investment strategy
towards optimal area
Improve selectiveness in underwriting and investment Improve the composition of the risk portfolio Optimize retrocession and risk-mitigation instruments (including
ILS) Consider securitizations
Executive Committee
Improve efficiency of capital use
Issue hybrid debt Reduce dividend and / or dividends from other means (e.g.
shares) Reconsider risk profile, including more protective capital shield Slow down growth of business Consider securitizations
Board/AGM
Restore capital position Consider private placement / large capital relief deal Consider rights issue (as approved by the AGM) Restructure activities
Board/AGM
Below minimum range - submission of a recovery plan to the supervisor Board/AGM
~210%Q2 2016 estimated
solvency ratio1)
GROUP SCR
Alert
Sub-Optimal
Comfort
Over capitalised
Sub-Optimal
OPTIMALRANGE
185% SR
100% SR
150% SR
300% SR
220% SR
125% SR
1) The Q2 2016 estimated solvency ratio of 210% has been adjusted for the calls of the two debts redeemed in August 2016

SCOR’s robust capital shield strategy ensures that exposures remain within the risk tolerance limits using the whole range of protection mechanisms
Capital shield protection mechanisms
1) Insurance-Linked Securities (Cat bonds, mortality bonds and side car)
87
SCOR’s capital shield strategy ensures efficient protection of the Group’s shareholders thanks to different protection layers
Illustrative
Retention
Traditional retrocession
Capital markets solutions
Solvency buffer
Contingent capital facility
Size of loss
Traditional retrocession
Wide range of protections including Proportional and Non-Proportional covers (Per event/Aggregate)
Significant experience in ILS over the last 10 years SCOR’s outstanding ILS1) currently provide $685.5 million capacity
protection, including a $180 million extreme mortality bond to ensure that the pandemic risk exposure is well controlled throughout the plan
Capital markets solutions
SCOR has set out a solvency scale with clear and well-defined buffers safeguarding the Group's franchise
Solvency buffer
SCOR’s innovative EUR 200 million contingent capital facility protects the solvency of the Group from either extreme Nat Cat or Life events
The contingent capital is designed to act as a last resort, a pre-defined scheme to raise new capital and replenish equity in case of extreme events
Contingent capital facility

1-in-200 year impact on Eligible Own Funds (EOFs)
Exposures as at YE 2015 including expected New Business for 2016
88
Close monitoring of risk drivers and extreme scenario exposures against risk tolerance limits
Optimal range US earthquake
Optimal range
North Atlantic hurricane
Optimal range EU wind
Optimalrange Japan earthquake
Optimal range Terrorist attack
Comfort range
Pandemic
170
200
500
760
420
1 330
2016 limit10% EOF (EUR 920m)Solvency range
Immediate post-shock
2016 limit20% EOF
(EUR 1 840m)
▐ in EUR millions

Q2 2016 “Vision in Action”
Min Max
Capital intensity1) 6.6% 8.5%
Strategic Asset allocation
Cash 11% 5.0%2) -
Fixed Income 76% 70.0% -
Loans 4% - 10.0%
Equities3) 2% - 10.0%
Real estate 4% - 10.0%
Other investments4) 3% - 10.0%
Average rating of fixed income portfolio AA- A+
Duration of total invested assets 3.0 years 2.0 years
89
SCOR’s asset exposures are closely monitored against strict risk limits
Closely monitor capital intensity against exposure limit
Individual asset class exposures
Credit risk
1) The capital intensity is measured by dividing the VaR 99.5% 1 year by the total invested assets2) Including cash and short-term investments3) Including listed equities, convertible bonds, convex equity strategies4) Including alternative investments, infrastructure, ILS strategies, private and non-listed equities
ALM risk
Aggregate portfolio risk
Monitor each asset class exposure against strategic plan limit
Tight control of average rating of investment portfolio
Minimum duration of invested assets limits duration gap and interest rate exposure

The balance between Life and P&C risks ensures a high diversification benefit
From the divisional view…… to risk category split:
VaR 99.5% according to Solvency II
90
4.4
5.8
2.7
1.4
3.1
SCOR SCR Diversified
Diversification
Required capitalbefore diversification
Life division standalone capital
P&C divisionstandalone capital
-26%
▐ in EUR billions (rounded) – as at year-end 2015 ▐ in EUR billions (rounded) – as at year-end 2015
High diversification through a well balanced Life and P&C portfolio SCR is mainly driver by underwriting risks Moderate Credit and Market risks
4.439%
35%
45%
35%
8%
22%
1%
4%
7%
4%
0.5
4.0
0.4
0.3
1.9
3.1
3.1
SCOR SCR
Taxes
Diversification
Required capital beforediversification
Operational
Credit
Market
L&H underwriting
P&C underwriting
-45%
8.9
4.4

With its Internal Model, SCOR is ready to move beyond Solvency II requirements with a full economic value approach
Leveraging the Solvency II framework … to steer business on economic basis
91
Approval of full internal model in 2015 by the supervisory authorities for use under Solvency II
No use of any transitional measures, volatility or matching adjustments and no sensitivity to Ultimate Forward Rate (UFR)
Dynamic use of internal model to steer business and support management decision
Proceed with implementation of economic valuation and analysis framework over the course of the plan
Accurately reflect value creation for shareholders over the long term
Leverage on SCOR’s established MCEV and Solvency II bases
Powerful complement to current metrics for the steering of the business

Investor Day 20167 September 2016, Paris
SCOR maximizes value creation thanks to its active capital management
Mark KociancicCFO

“Vision in Action” strategic targets in the continuity of the previous plans
1) Based on a 5-year rolling average of 5-year risk-free rates
93
Key messages
Successful achievement of “Optimal Dynamics” targets
Profitability target: RoE ≥ 800 bps above 5-year risk-free rates over the cycle1)
Capacity to generate up to EUR 200 million of solvency capital through the potential restructuring of French SCOR SE entities
Reconfirmation of an attractive and consistent shareholders’ remuneration policy

94
SCOR applies guiding principles for setting the profitability target
Readily calculable
Clear and understood
Market acceptance Transparent
RoE target offering an attractive value proposition to shareholders
RoE target consistent and comparable to peers
RoE target consistent with the previous plan targets
Timely
21
22
23

Adapting the profitability target with a more flexible benchmark to better manage the volatile risk-free rates environment
“Vision in Action”Profitability target
1) Based on a 5-year rolling average of 5-year risk-free rates
95
SCOR keeps the RoE target and adapts its benchmark to market conditions− the new benchmark is more flexible to
the volatile risk-free rate environment, especially given that short-term rates are administered by Central Banks
− better alignment with SCOR business model
− 5-year risk-free rates are more in line with the duration of SCOR’s liabilities
− 5-year rolling average better manages the volatility of financial markets
RoE ≥ 800 bps above5-year risk-free rate
over the cycle1)

SCOR keeps the RoE target and adapts its benchmark to market conditions
Profitability target of “Vision in Action” over the cycle is comparable to the “Optimal Dynamics” target in a normal risk-free rate environment ranging from 10-11% RoE
Expectation to meet or exceed an RoE of 800 bps above 5-year risk-free rate over the cycle1)
1) Based on a 5-year rolling average of 5-year risk-free rates
96
2013 2014 2015 H1 2016
Ben
chm
ark
RoE
Targ
et “Optimal Dynamics” target:
RoE 1 000 bps over 3-month RFR
10.2% 10.1% 10.0% 10.1%
“Vision in Action”target:
RoE ≥800 bps over 5-year RFR1)
9.5% 9.2% 9.0% 8.8%
Act
uals
Actual RoE 11.5% 9.9% 10.6% 8.9%
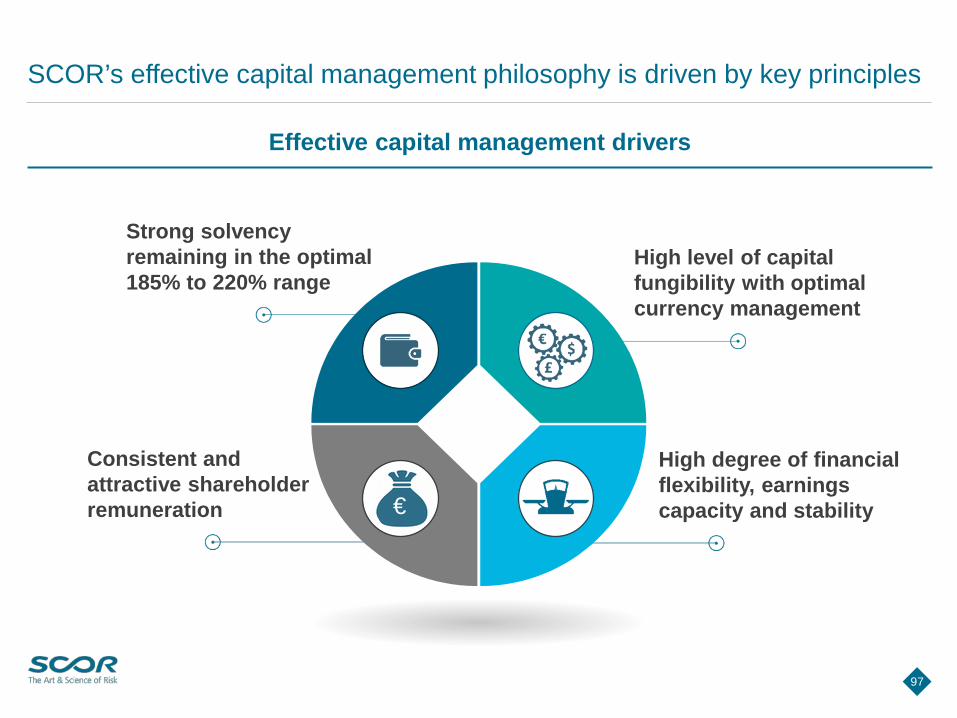
Effective capital management drivers
97
SCOR’s effective capital management philosophy is driven by key principles
€
Strong solvency remaining in the optimal185% to 220% range
High level of capital fungibility with optimal currency management
Consistent and attractive shareholder remuneration
High degree of financial flexibility, earnings capacity and stability

SCOR’s capitalization is extremely strong and benefits from a maximum level of flexibility given its high solvency level
SCOR is well within the “Optimal” range of the Solvency scale SCOR carries capital far above the S&P AAA level2)
1) S&P model required capital depending on target risk level2) Total Available Capital after Q3 2016 debt repayments. SCOR estimates using S&P standard model, it does not reflect S&P’s opinion on SCOR’s
capital adequacy, assuming no solvency I capital limit on hybrid debt 98
▐ In EUR billions (rounded)
~210%Optimal range 185% - 220%
9.3
4.4
Eligible own funds
Solvency capital requirement
Q2 2016Q2 2016
The optimal range represents ~EUR 1.5 bnof eligible own funds at Q2 2016
+/-1 bp of the Solvency II ratio amounts to approximately EUR 44 million of eligible own funds at Q2 2016
Over “Vision in Action”, SCOR is expected to operate in the Optimal Solvency range
▐ YE 2015 figures - in EUR billions (rounded)
SCOR’s estimated capital level presents excess capital of EUR 0.7bn above the AAA level in S&P model
AA1) – 6.8
AAA1) – 7.5
Total Available Capital2) – S&P
Required capital in S&P Model
8.20.7

SCOR’s debt principles
99
SCOR utilizes its debt efficiently, with expected financial leverage in the range of 20% to 25%
High quality debt, primarily subordinated hybrid debt
Longer-term duration issuances are favoured
Issuance in EURO or in a strong currency with a hedge in EURO
Compliance with stakeholders’ expectations (regulators, rating agencies & others)
21
22
23
24

SCOR maintains high financial flexibility and has secured low-cost long-term financing to support the new plan and beyond
1) After cross-currency swap
100
▐ SCOR’s first call date schedule - nominal value in EUR millions (rounded)
2021)
114
2611)
250
600
250
500
2018 2019 2020 … 2025 2026 2027 2028
EURCHF
1)
5.60%
3.95%
at a very low cost1)
Start of “Optimal Dynamics” average debt cost
Current average debt cost
SCOR has secured the financing of “Vision in Action” plan developments

SCOR has a high quality capital structure under Solvency II, with 84% in Tier 1 capital, providing the Group with flexibility and capacity
Eligible own funds are mainly Tier 1 Significant remaining capacity2)
1) Tier 3 capital position corresponds to the net DTA position in the Economic Balance Sheet2) Post Q3 2016 debt repayment 101
▐ As at 30/06/2016 - in EUR billions (rounded) ▐ As at 30/06/2016 - in EUR millions (rounded)
6.9
0.9
1.4
0.1
Tier 1Unrestricted
Tier 2 - Hybrid
Tier 31) - Hybrid
EUR 9.3bn
Tier 1
Total
Tier 3 579
Tier 2 - Hybrid 719
Tier 1 - Hybrid 801
Tier 1 – Unrestricted (e.g. equity) Unlimited
Tier 1 - Hybrid

SCOR explores ways to optimize its legal entities’ structure under Solvency II to create operational and capital efficiencies
Current legal entity structure1)
1) Simplified legal chart 2) “SCOR Investment Partners” AMF regulated3) SE: Societas Europaea 102
Current organization put in place before the adoption of the Solvency II framework: − SCOR SE, SGP&C SE, SGL SE as
operating entities− Network of subsidiaries in Europe
Solvency II rules do not recognize diversification across legal entities in the risk margin
The merger of the three SE3) entities in France would materialize diversification benefits via reduction of the risk margin
Potential benefits reach up to EUR 200 million of solvency capital and a significant operational simplification
SCOR SE
Subsidiaries Subsidiaries Subsidiaries SIP2)
• Americas• Australia• Ireland
• US• Canada• UK• Asia-Pacific• Hong Kong• Switzerland
• Russia• Africa• Brazil
SCOR SE
SGP&C SE
Subsidiaries Subsidiaries
SGL SE
Subsidiaries
SIP2)
• US• Canada• UK• Asia-Pacific• Hong Kong• Switzerland
• Russia• Africa• Brazil
• Americas• Australia• Ireland
Potential new legal entity structure1)

SCOR’s capital is fungible, secure and efficiently allocated, with most of its capital in advanced economies with major currencies
Three pools of capital1) ~90% of capital held in USD, EUR and GBP
1) Split of IFRS Shareholder’s equity and Subordinated Debts as at 30 June 20162) Advanced and Emerging economies as defined by Standard and Poor’s Ratings Services 103
Three pools of capital secured and principally located in mature and advanced economies2)
Limited number of subsidiaries, enhancing fungibility of capital while supporting local business presence
Active and prudent FX management at local entity level to naturally hedge its capital and in major currencies
Strict IFRS FX congruency policy to hedge monetary assets and liabilities
Asia-PacificEMEAAmericas
28% 9%63%
▐ Q2 2016 shareholders’ equity by currency – in %
53%
31%
6%
3%2%
2% 4%
USD
EUR
GBP
AUD
CAD
Other Mature
Emerging
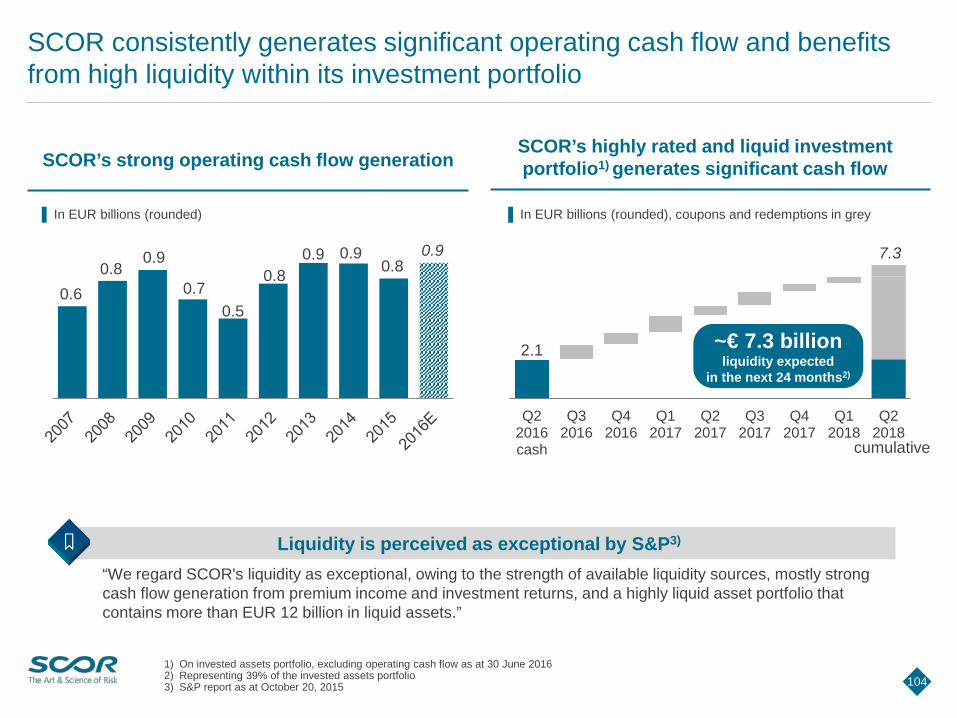
SCOR consistently generates significant operating cash flow and benefits from high liquidity within its investment portfolio
SCOR’s strong operating cash flow generationSCOR’s highly rated and liquid investment portfolio1) generates significant cash flow
1) On invested assets portfolio, excluding operating cash flow as at 30 June 20162) Representing 39% of the invested assets portfolio3) S&P report as at October 20, 2015 104
0.60.8
0.9
0.70.5
0.80.9 0.9
0.80.9
Q22016cash
Q32016
Q42016
Q12017
Q22017
Q32017
Q42017
Q12018
Q22018
~€ 7.3 billion liquidity expected
in the next 24 months2)
▐ In EUR billions (rounded) ▐ In EUR billions (rounded), coupons and redemptions in grey
Liquidity is perceived as exceptional by S&P3)
“We regard SCOR's liquidity as exceptional, owing to the strength of available liquidity sources, mostly strong cash flow generation from premium income and investment returns, and a highly liquid asset portfolio that contains more than EUR 12 billion in liquid assets.”
2.1
7.3
cumulative

SCOR manages to consistently improve both its productivity and its cost management
SCOR improves its productivity SCOR reduces its cost ratio
105
3.6
4.0 4.04.2
4.4 4.44.7
5.2
2008 2009 2010 2011 2012 2013 2014 2015
5.9%5.4% 5.5%
5.3% 5.3%5.1% 5.0% 5.0%
2008 2009 2010 2011 2012 2013 2014 2015
▐ Gross written premiums per employee - in EUR millions (rounded) ▐ Cost ratio - in %
Increasing productivity
resulting from:
Economies of scale through premium growth
Investment in technology
Talent attraction and retention& &

More than EUR 2 billion in dividends paid to shareholders, translating into a +11.6% CAGR between 2005 and 2015
Step 1: the Group ensures the projected solvency position is in the optimal range
Step 2: SCOR estimates and allocates capital to support future accretive growth
Step 3: the Group defines an amount of dividend accordingly
SCOR favours cash dividends, and if relevant does not exclude special dividends or share buy-backs
Minimum dividend payout ratio of 35% Low variation in the dividend per share from year
to year
SCOR remunerates shareholders on the basis of a well-defined dividend policy
106
37% 37% 35% 45% 48% 48% 62% 53% 44% 51% 43%
0.50
0.80 0.80 0.80
1.001.10 1.10
1.201.30
1.401.50
2005 2006 2007 2008 2009 2010 2011 2012 2013 2014 2015
Distribution rate Dividend per share (EUR)
SCOR manages its capital optimally thanks to a disciplined process

Return: average quarterly RoE in % 2005 – 2015; Risk: standard deviation of quarterly RoE 2005 – 2015Source: company reports including (in alphabetical order: Axis, Everest Re, Hannover Re, Munich Re, Renaissance Re, RGA, Swiss Re, XL Catlin) 107
SCOR optimizes the use of its capital with an excellent risk/reward profile
0%
2%
4%
6%
8%
10%
12%
14%
16%
18%
20%
0% 5% 10% 15% 20%
Risk
Ret
urn
Outperformingrisk / return
Underperformingrisk / return
Peer 8
Peer 7Peer 6
Peer 5
Peer 4
Peer 3
Peer 2Peer 1

108
SCOR’s book value per share increased by 42% over the past 5 years
In addition to the strong increase of the book value per share, ~EUR 1.4 billion in dividends has been paid to shareholders between 2011 and 2016
€23.83€26.18 €26.64
€30.60
€34.03 €33.79
2011 2012 2013 2014 2015 H1 2016
+42%
▐ SCOR’s book value per share

SCOR delivers an attractive shareholder return and dividend yield thanks to a consistent and robust RoE
Strategy Execution
109
16.9%
14.0%
9.0%10.2% 10.2%
7.7%9.1%
11.5%9.9%
10.6%
4.2% 4.1%5.4%
6.1% 6.3% 6.0% 6.1% 5.5% 5.7%4.7%
2006 2007 2008 2009 2010 2011 2012 2013 2014 2015
RoE Dividend Yield
Mid-level risk appetite promotes low volatility results thanks to optimal use of capital
10-year average RoE: 10.9% 10-year average dividend yield:
5.4%
Consistent utilization of profitability and solvency targets over the cycle
Results

SCOR IR Day 2016
110
Live Q&A onERM and capital
managment

Investor Day 20167 September 2016, Paris
Closing remarks
Denis KesslerCEO and Chairman

112
SCOR will continue its success story with “Vision in Action”
Continue to build US towards a clear Tier 1 reinsurer status
Consolidate position in international markets while building Channel Syndicate to sustained profit
Transition SCOR Business Solutions towards a customer-centric model and expanding the sectors and products offered to large corporations
Develop MGA platform to promote new business channels using the P&C division’s infrastructure
Strengthen Life leadership position in the US
Enhance strong EMEA franchise
Expand in fast-growing Asia-Pacific markets
Further manage and optimize in-force book
Pursue Longevity growth
Leverage strong existing Global Distribution Solutions capabilities
Build a franchise in Japan
Liquidity at 5%
Duration gap closedby the end of “Vision in Action”, by increasing invested assets duration
Additional degrees of freedom in the Strategic Asset Allocation controlled by a strict capital intensity limit
3% - 8% GWP growth p.a.
~95 - 96% combined ratio
5% - 6% GWP growth p.a.
6.8% - 7.0% technical margin
2.5% - 3.2% RoIA
HIGH RETURN ON EQUITYRoE ≥ 800 basis points above the
five-year risk-free rate over the cycle
OPTIMAL SOLVENCY RATIOBetween 185% and 220% of the SCR

SCOR IR Day 2016
113
APPENDICESSCOR Group
SCOR Global P&C
SCOR Global Life
SCOR Global Investments
ERM
Capital management
Glossary
2
1
6
3
4
5
7

SCOR successfully reaches its “Optimal Dynamics” targets combining profitability and solvency
Profitability (RoE) target Solvency target
1) “Risk-free rate” is based on 3-month risk-free rates
114
1 000 bps above risk-free rate1) over the cycle Ratio in the optimal 185% - 220% range
1 537
972 1 055 8811 111
H2 2013 2014 2015 H1 2016 Onaverageover the
plan
Target
Optimal range 185% - 220%
231%
202%211% 210%
YE 2013 YE 2014 YE 2015 Q2 2016
Solvency ratioAchievement

1) Life gross written premium growth at 13.2% on a proforma basis2) Excluding Generali USA acquisition gain. Tax rate would stand at 21.8% including the badwillGross written premium growth rates are CAGR H2 2013- H1 2016; P&C combined ratio, Life technical margin, tax rate, Group cost ratio and financial leverage are calculated on average; Return on invested assets corresponds to H1 2016 figure
115
SCOR’s “Optimal Dynamics” assumptions have been fulfilled
Gross written
premium growth
+11.5%vs ~7%
P&C combined ratio
92.5%vs ~94%
Life technical margin
7.2%vs ~7%
Return on invested assets
3.1%vs >3% by 2016
Financial leverage(adjusted)
22.6%vs ≤25%
Group cost ratio
5.0%vs ~4.8%
Tax rate
23.9%2)
vs 22%-24%
P&C gross written premium growth
+5.9%vs ~7%
Life gross written premium growth
+16.3%1)
vs ~6%~
~

1) “Risk-free rate” based on 3-month risk-free rates 2) Normalized for Generali USA acquisition gain 116
SCOR has successfully achieved its “Optimal Dynamics” targets and assumptions in a deteriorating environment
~
OPTIMAL DYNAMICS H2 2013 2014 2015 H1 2016
RoE above Risk-Free-Rate (bps) over the cycle1) 1 000 bps 1 537 972 1 055 881
Solvency ratio 185%-220% 231% 202% 211% 210%
Gross written premium growth ~7% +8.0% +10.4% +18.6% +3.7%
P&C combined ratio ~94% 93.5% 91.4% 91.1% 93.8%
Life technical margin ~7% 7.5% 7.1% 7.2% 7.1%
Return on invested assets >3% by 2016 2.8% 2.9% 3.1% 3.1%
Effective tax rate ~22% 19.6%2) 24.4% 26.0% 25.5%
Group cost ratio ~4.8% 5.1% 5.0% 5.0% 5.1%
Shareholder’s equity growth - +5.1% +15.0% +11.1% -1.3%
Dividend Growth - +8.3% +7.7% +7.1% n/a
Operating Cash Flows (annual) - €0.9bn €0.9bn €0.8bn €0.9bn
Book value per share growth - +5.7% +14.9% +11.2% -0.7%
Assu
mpt
ions
Targ
ets
Oth
erm
etric
s
SCOR’s track record in consistently delivering on “Optimal Dynamics” targets proves the effectiveness and the relevance of the Group’s strategy

1) Based on a 5-year rolling average of 5-year risk-free rates2) CAGR 2016-20193) Assuming prevailing tax rates in all major countries remain as of Q2 2016 117
“Vision in Action” new targets and assumptions are in the continuity of “Optimal Dynamics”
RoE above 5-year risk-free ratesover the cycle1) ≥800 bps
Assu
mpt
ions
Two
Targ
ets
Gross written premium growth ~4% to 7%2)
P&C GWP growth 3% to 8%2)
Life GWP growth 5% to 6%2)
P&C combined ratio 95% to 96%
Life technical margin 6.8% to 7.0%
Return on invested assets 2.5% to 3.2%
Group cost ratio 4.9% to 5.1%
Tax rate 22% to 24%3)
Solvency ratio 185%-220%

Highly diversified business mix
Full internal model to manage the Group approved for Solvency II
Strong ERM across the Group
Efficient and flexible capital management
Disciplined technical underwriting
Active portfolio management
Innovation and new business lines
Strong technical performance with a focus on biometric risks
Economic value largely insensitive to low interest rates
High quality and highly liquid fixed income portfolio
Prudent investment policy
118
“Vision in Action” draws upon continuity and consistency

119
“Vision in Action” leverages on SCOR’s ways and means to deepen and enhance the franchise
Continue to build US towards a clear Tier 1 reinsurer status
Consolidate position in international markets while building Channel Syndicate to sustained profit
Transition SCOR Business Solutions towards a customer-centric model and expanding the sectors and products offered to large corporations
Develop MGA platform to promote new business channels using the P&C division’s infrastructure
1. Deepen franchise through organic growth
2. Leverage on new and existing platforms
Strengthen Life leadership position in the US
Enhance strong EMEA franchise
Expand in fast-growing Asia-Pacific markets
Further manage and optimize in-force book
Pursue Longevity growth Leverage strong existing
Global Distribution Solutions capabilities
Build a franchise in Japan

120
Within “Vision in Action”, SCOR will progressively normalize its asset management policy
Duration gap closedby the end of
“Vision in Action”, by increasing invested
assets duration
Liquidity at 5%
Additional degrees of freedom in the Strategic Asset
Allocation controlled by a strict capital
intensity limit
Normalization of the asset management policy will enable the Group to achieve higher investment returns

121
SCOR continues to leverage on its proven strategic cornerstones
Make SCOR the preferred choice for its clients
Strong Franchise
HighDiversification
Robust Capital Shield
Controlled Risk Appetite
Strong client relationships
Best-in-class services
Product innovation
Consistent expansion into new markets
Increase the return on equity through required capital diversification benefits
Between Life and P&C
By geography
By lines of business
By types of retrocession
Improve the stability of results
No annuities in the Life portfolio
Limited US casualty business
Low US cat exposure
Conservative asset management
Protect shareholders’ equity
Traditional retrocession
Alternative risk transfer solutions
Buffer capital
Contingent capital facility
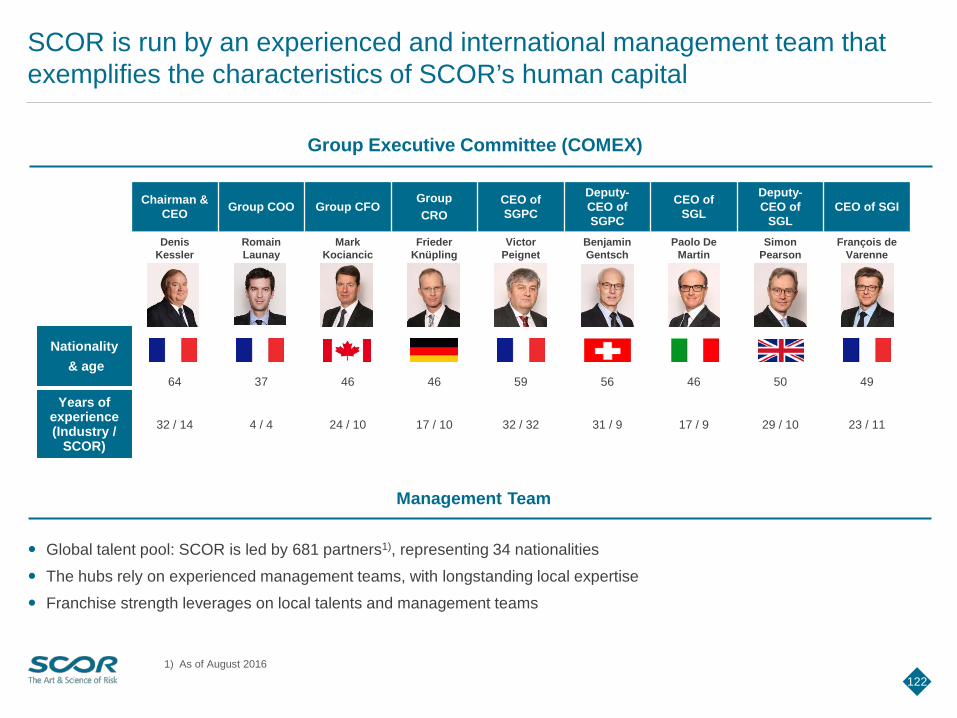
Group Executive Committee (COMEX)
1) As of August 2016
122
SCOR is run by an experienced and international management team that exemplifies the characteristics of SCOR’s human capital
Chairman & CEO Group COO Group CFO
Group CRO
CEO of SGPC
Deputy-CEO of SGPC
CEO of SGL
Deputy-CEO of
SGLCEO of SGI
Denis Kessler
Romain Launay
Mark Kociancic
Frieder Knüpling
Victor Peignet
Benjamin Gentsch
Paolo De Martin
Simon Pearson
François de Varenne
64 37 46 46 59 56 46 50 49
32 / 14 4 / 4 24 / 10 17 / 10 32 / 32 31 / 9 17 / 9 29 / 10 23 / 11
Nationality& age
Years of experience (Industry /
SCOR)
Global talent pool: SCOR is led by 681 partners1), representing 34 nationalities
The hubs rely on experienced management teams, with longstanding local expertise
Franchise strength leverages on local talents and management teams
Management Team

SCOR’s Financial Strength Rating has improved dramatically since 2005Se
cure
Very
st
rong
AA+
AA
AA-
Stro
ng
A+
A
A-
Goo
d
BBB+BBB
BBB-
2005 2006 2007 2008 2009 2010 2011 2012 2013 2014 2015
++
+
LegendRevios acquisition (11/06) Converium acquisition (08/07) TaRe acquisition (08/11)
Stable outlook Positive outlook / cwp1)+- Credit watch negative
Secu
re Stro
ng
A1
A2
A3
Goo
d
Baa1
Baa2
Baa3
2005 2006 2007 2008 2009 2010 2011 2012 2013 2014 2015
+
+
+
+
Secu
reVe
ry
stro
ng
AA+
AA
AA-
Stro
ng
A+
A
A-
Goo
d BBB+
BBB
BBB-Vulnerable Moderatly
weak BB+
2005 2006 2007 2008 2009 2010 2011 2012 2013 2014 2015
Secu
re Exce
llent A
A-
Very
goo
d
B++
B+
2005 2006 2007 2008 2009 2010 2011 2012 2013 2014 2015
+
+-
X Issuer Credit Rating to “a+”
Generali US acquisition (10/13)
X
+
AA-Stable Outlook
A1 Positive Outlook
AA-Stable Outlook
A Positive Outlook
+
+-
+
+
+
1) Credit watch with positive implications
123
Evolution of SCOR’s S&P rating Evolution of SCOR’s Moody’s rating
Evolution of SCOR’s Fitch rating Evolution of SCOR’s AM Best rating

1) On September 11, 2015, AM Best raised to “positive” the outlook on SCOR’s “A” rating2) On December 15, 2015, MOODY’S raised to “positive” the outlook on SCOR’s “A1” rating 124
The strength of the SCOR group’s strategy is recognized by industry experts
2013 2014
7 September 2015from “A+” to “AA-”
9 May 2012, from “A2” to “A1”
21 July 2015, from “A+” to “AA-”
2 May 2012, ICR from “a” to “a+”
AA- A positive outlook1) A1positive outlook2) AA-
2015
SCOR: “Reinsurance Company CEO
of the Year“
SCOR “Most Popular Foreign-Capital Insurance Company”
“Most Dynamic Reinsurer of the Year” Romanian Insurance Market Award
“Best Reinsurance Company for US Life”/“Best Reinsurance Company for International Life”
Denis Kessler: “Insurance Hall of Fame in 2014 by IIS”
Cat bond Atlas IX awarded as “Deal of the year 2014”
SCOR: “Reinsurance Company of the Year“
"Prize for Best Financial Operation -M&A" by the Club des Trente for Generali US acquisition
Denis Kessler is elected "Outstanding
Contributor of the year -Risk"
SCOR Investment Partners: “InstitutionalInvestor of the Year”
SCOR: “Best reinsurer in Argentina”
Kory Sorenson and Fields Wicker-Miurin, elected “Influential Women in Insurance”
SCOR Global Life: “Best Life reinsurer of the year”
Remark International: “Service Provider of the Year”
Denis Kessler: “2014 Strategy of the Year” award
2016
SCOR: “Latin American Reinsurer of the Year”

SCOR’s listing information
Euronext Paris listing Six Swiss Exchange listing
125
MAIN INFORMATION
DR Symbol SCRYY
CUSIP 80917Q106
Ratio 10 ADRs: 1 ORD
Country France
Effective Date June 5, 2007
Underlying SEDOL B1LB9P6
Underlying ISIN FR0010411983
U.S. ISIN US80917Q1067
Depositary BNY Mellon
MAIN INFORMATION
Valor symbol SCR
Valor number 2'844'943
ISIN FR0010411983
Trading currency CHF
Effective Date August 8, 2007
Security segment Foreign Shares
MAIN INFORMATION
Valor symbol SCR
ISIN FR0010411983
Trading currency EUR
Country France
SCOR’s shares are also tradable over the counter on the Frankfurt Stock Exchange
ADRprogramme
SCOR’s ADR shares trade on the OTC market
SCOR’s shares are publicly traded on the Eurolist by the Euronext Paris stock market
SCOR’s shares are publicly traded on the SIX Swiss Exchange (formerly known as the SWX Swiss Exchange)

SCOR IR Day 2016
126
APPENDICESSCOR Group
SCOR Global P&C
SCOR Global Life
SCOR Global Investments
ERM
Capital management
Glossary
2
1
6
3
4
5
7

Local operations in 130+ countries Strong Nat Cat modelling expertise is a key differentiator
Broad product & services offering Global Specialty Lines servicing
clients worldwide
Fast-growing infrastructure with strong technical backing and clear underwriting processes
Strong, longstanding local presences Expanding local staff
Local staff 12
Underwriting centers 2
Local staff 513
Underwriting centers 12
Local staff 101
Underwriting centers 7
Local staff 59
Underwriting centers 5
127
A network of on-the-ground underwriters and risk staff giving access to the most attractively priced business
Western Europe, Japan, South Korea
Emerging Markets: Latin America, Eastern Europe,
Middle-East & Africa, Asia Pacific
China, India
Capital: Fungible, managed centrally and locally Expertise, products, solutions: Shared experience across regions Systems & tools: One integrated global system Synergies between Treaty and Specialties
Industry and commodities driven countries:
Canada, Australia, South Africa, IndonesiaChile, Colombia, Mexico, Turkey
Shared
Local staff 103
Underwriting centers 3
USA
Note : Figures exclude SCOR Business Solutions & Channel 2015 staff

P&C
REINSURANCE ANALYTICS & GLOBAL
DATA CENTRE
GROUP’S CENTRAL BUSINESS MANAGEMENT
SYSTEM
RESERVING TOOL
PLANNINGTOOL
FACULTATIVEUNDERWRITING
PLATFORM
INTERNALMODEL
Using a global integrated information system – a key asset to manage risk and serve clients
128
SCOR Global P&C current integrated global information system
Continuously update and improve IT infrastructure to incorporate new analytical capabilities
Promote a uniform and integrated approach to all tools
New Client Relation Management tool integration
Consistency to meet:
1. Management needs2. Regulatory demands3. Rating agencies requirements4. Financial markets expectations
ACTUARIALTREATY PRICING
TOOL
CATPLATFORM

129
Serving global insurers across many countries and lines of business, enabling access to risk on favorable terms
Number of contracts U
SAIn
dia
UK
Can
ada
Ger
man
yAr
gent
ina
Aust
ralia
Azer
baija
nB
elgi
umB
razi
lC
hile
Chi
naC
olom
bia
Ecua
dor
Egyp
tEl
Sal
vado
rJa
pan
Mor
occo
Pana
ma
Net
herla
nds
Phili
ppin
esSi
ngap
ore
Swed
enSw
itzer
land
Line 1 28 7 2 13 5 1 4 1 2 1 3 1 3 1 1 1 2 2 1 1 2 2Line 2 7 8 17 1Line 3 3 1 2Line 4 4 1Line 5 1 3Line 6 2 2Line 7 17Line 8 4Line 9 2Line 10 1
Example: 1 GlobalClient 10 Lines of
business 24 Countries 160 Contracts
Vision of expected profitability is mutually shared, enhancing buy-in to the Global approach from all stakeholders of the client relationship
In dealing with this client, 19 business segments are involved, across more
than 10 underwriting centres

130
Partnering with selected clients to develop products and providing reinsurance support, leveraging the insurer’s infrastructure
Development of new products through knowledge sharingSupport for existing products
Example: Large developing market insurer
P&C Treaty
Property
Engineering
Motor
Agriculture
Credit & Surety
Aviation
Motor ExtendedWarranty
New Cars
Used CarsCar Loan Channel
Crop, Livestock, Forest Satellite Projects
Pre-paid Cards
Trade Credit InsurancePerformance Bonds
General AviationLRA
Space(Fac Open Cover & LRS)
SBS FacultativeHigh-tech Property
High-speed Railway CAR
Heavy Equipment Trial Insurance
IDI IDI
Specialties

Shift towards proportional driven by portfolio management to benefit from resilience in primary insurance and fewer competitors
Note: 2016E figures at 30/06/2016 exchange rates
131
SCOR Global P&C Premium
▐ GWP - in EUR billions (rounded)
55%52%
56%
24%
24%
21%
14%
14%
12%
7%
10%
11%
2008 2013 2016E
Lloyd’s
SBS
Non-Prop
Proportional
Proportional reflects underlying insurance dynamics more than excess-of-loss reinsurance
Often less volatile
Can consume less capital
Can have higher barriers to entry
May have lower loss ratios, partially offset by the commission ratio
Similar moves apparent at top-tier peers
3.1
4.8
5.8
Flat

Continued geographic diversification and Specialties growth
P&C Treaties Premium P&C Specialties Premium
Note: 2016E figures at 30/06/2016 exchange rates
132
▐ GWP - in EUR billions (rounded) ▐ GWP - in EUR billions (rounded)
28%29% 26%
26%
25%29%
20%
18%
19%
26%
28%
26%
2008 2013 2016E
65%55% 40%
21%
26% 39%
14%
19%
21%
2008 2013 2016E
APAC
Americas
EMEASBS
Partnerships(Lloyd’s, LRA, GAUM)
Specialty Lines 2(Aviation, Space, C&S, IDI, Cyber & Alt. Solutions)
Specialty Lines 1(Agriculture, Engineering, Marine & US CAT NAT)
1.6
2.6
3.2
1.5
2.2
2.6

Premium mix will continue to shift, driven by the US, SBS and Lloyd’s (assuming full execution of the plan)
Note: 2016E & 2019E figures at 30/06/2016 exchange rates
133
SCOR Global P&C Premium Mix Evolution
55%52%
56%53%24%
24%
21%
19%
14%
14%
12%
15%
7%
10%
11%
13%
2008 2013 2016E 2019E
Growth of non-Cat and long-tailed business will be limited by the combined ratio constraint
Lloyd’s scaling up to sustained profitability
Lloyd’s
SBS
Non-Proportional
Proportional
3.1
4.8
5.8
7.3▐ GWP - in EUR billions (rounded)

Geographies: growth in Specialties (driven by Lloyd’s), SBS, and Americas, while EMEA is flatter (assuming full execution)
P&C Treaties Premium Specialties Premium
Note: 2016E & 2019E figures at 30/06/2016 exchange rates
134
▐ GWP - in EUR billions (rounded) ▐ GWP - in EUR billions (rounded)
28% 29% 26%29%
72%
71%74%
71%
2008 2013 2016E 2019E
65%55% 40% 34%
21%
26% 39%47%
14%
19%
21%
19%
2008 2013 2016E 2019E
APAC
Americas
EMEASBS
Specialty Lines
1.6
2.6
3.2
1.5
2.6
3.5
3.8
2.2

SCOR Global P&C Premium Mix Evolution
Note: 2016E & 2019E figures at 30/06/2016 exchange rates
135
The weight of the US market (and USD currency) will increase
▐ GWP - in EUR billions (rounded)
59% 48% 41%39%
12%
18%27%
31%
11%
18%
18%
18%
10%
8%
7%
6%
8%
8%
7%
6%
2008 2013 2016E 2019E
North America
Latin America
Europe
Asia
Africa & Middle East
3.1
4.8
5.8
7.3

136
SBS will expand its sector expertise
Market Leader Oil & Gas (Onshore & Integrated
Companies) Mining Infrastructure (CAR) Construction companies (US & Europe)
Niche Player Consumer Goods Professional services High Tech Automotive Transportation Environmental services & industries Aerospace and Defense industry Agro & Life Sciences
2015 SBS presence
Influential Player
Oil & Gas : Upstream – Offshore Industrial conglomerates Heavy industries : Steel – aluminum,
Pulp & paper Power & utility
Market Leader Oil & Gas (Onshore & Integrated
Companies) Mining Infrastructure (All potential LoBs) Construction Companies (worldwide) Power & utility
Niche player Consumer Goods Agro & Life Sciences High Tech Healthcare
Influential Player
Oil & Gas : Upstream – Offshore Industrial conglomerates Heavy industries : Steel – aluminum,
Pulp & paper Automotive Transportation Environmental services & industries Professional Services Aerospace and Defense industry
SBS will anchor Key Client Management (KCM) into its business model
KCM will help us develop strategic relationships, thus participating to deepening sectors expertise
2019 SBS target presence

The SCOR Global P&C “Optimal Dynamics” initiatives are achieved
“Optimal Dynamics” initiatives Measurable results
137
Key assumption: Flat market pricing from 2013 through 2016
Up-scalecore reinsurance
Alternative/ comple-mentaryplatforms
Cat & retro capacity optimization
Continue to focus on Global Insurers
Develop US Client-focusedinitiative
Further expand Emerging Markets franchise
Leverage large corporate: SCOR Business Solutions
Continue building Channel 2015 Lloyd’s Syndicate
Range of alternative risk transfer solutions
Increase cat capacities
Optimize retrocession strategy
1.1
1.2
1.3
2.1
2.2
2.3
3.1
3.2
Notable increases in SCOR’s share of business among most of 14 coordinated Globals
Improved efficiency of outwards retro placement
On track for additional $150 million casualty by 2016. Growth limited by market conditions + Multiline penetration by client
Expanded franchise, esp. in Asia. Focus on limited number of core clients (two in China) and innovation (e.g. IDI, MEW)
Accomplished tactical goals while maintaining discipline on premium due to declining large commercial pricing
Closed the gap vs. median syndicate. Built profitable book and strong team with own managing agency.
Built Alternative Solutions and teams. Growth limited by broad appetite of traditional market
Cat portfolio is well-balanced by peril and geography – very efficient use of capital, well-controlled exposures

Normalized1) Combined Ratio Quarter-To-Date
1) Normalized from WTC one-off impacts and reserve releases, with Cat at 6% until 2012, 7% since 2013 and 6% since 2016 as per budget 138
SCOR Global P&C normalized combined ratio1) has trended down, stabilizing around 94%
85%
87%
89%
91%
93%
95%
97%
99%
101%
103%
105%
Q12008
Q32008
Q12009
Q32009
Q12010
Q32010
Q12011
Q32011
Q12012
Q32012
Q12013
Q32013
Q12014
Q32014
Q12015
Q32015
Q12016
Specific items Normalized Combined ratio QTD
Reserves release
(EUR 70 million)Reserves release(EUR 90 million)
WTC subrogation
(EUR 47 million)
WTC indemnification
(EUR - 39 million)
Reserves release(EUR 30 million)
Offshore Platforms,
Tianjin
Reserves release(EUR 40 million)

Net Technical Cash Flows
139
SCOR Global P&C produces strong and steady net technical cash flows
▐ EUR million
Weeks
2013
20122011
2010
2009
20142015
2016
829770740683612
485
357
-200
-100
0
100
200
300
400
500
600
700
800
900
0 2 4 6 8 10 12 14 16 18 20 22 24 26 28 30 32 34 36 38 40 42 44 46 48 50 52

SCOR Global P&C Reported Combined Ratio
140
Evolution of Net Combined Ratio & Net Technical Ratio excluding cat and specific one-off items - QTD
70%
75%
80%
85%
90%
95%
100%
105%
110%
Q1 2009QTD
Q3 2009QTD
Q1 2010QTD
Q3 2010QTD
Q1 2011QTD
Q3 2011QTD
Q1 2012QTD
Q3 2012QTD
Q1 2013QTD
Q3 2013QTD
Q1 2014QTD
Q3 2014QTD
Q1 2015QTD
Q3 2015QTD
Q1 2016QTD
Net Techn Ratio incl ULAE excl Cat , WTC & Reserve release Combined Ratio
108.6%135.2%
Trend

50%
70%
90%
110%
130%
150%
170%
Q12008
Q32008
Q12009
Q32009
Q12010
Q32010
Q12011
Q32011
Q12012
Q32012
Q12013
Q32013
Q12014
Q32014
Q12015
Q32015
Q12016
Peer 1
Peer 2
Peer 3
SCOR
141
Continuing to generate lower volatility and competitive technical returns
Net Technical ratioEQ Japan
EQ New ZelandAustralian floods
Ike
Klaus
Chile EQXynthia
Thaifloods Sandy
European & Canadian
Floods
Note: Net technical ratio is equal to Net Loss Ratio + Acquisition Costs. P&C ratios only taken into accountSource: company reports, SCOR Global P&C internal data
Tianjin

1) Western Europe: Austria, Cyprus, Greece, Italy, Malta, Portugal, Spain, Switzerland
2) Northern Europe: Belgium, Luxembourg, The Netherlands, Nordics3) South East Asia: Indonesia, Malaysia, Singapore, Thailand,
Philippine, Vietnam
142
SCOR Global P&C’s assessment of current segment attractiveness, based on the profitability of its own book (1/2)
Fran
ce
Ger
man
y
UK
Nor
ther
n Eu
rope
2)
Rus
sia
& C
IS
Mid
dle
East
Wes
tern
Eur
ope1)
East
ern
Euro
pe
Afric
a
USA
Latin
Am
eric
a
Can
ada
Japa
n
Sout
h Ko
rea
Chi
na
Indi
a
Car
ibbe
an
Aust
ralia
Nor
ther
n A
sia4
)
Sout
h Ea
st A
sia3)
PNP
CAT
ProportionalNon-proportionalNatural Catastrophe
Business attractiveness5)
Attractive
Adequate
Inadequate
Very attractive
Not material premium amount
Monte Carlo 2016 January 2016 Monte Carlo 2015
2% 4% 3%
18% 24% 21%
57% 42% 49%
7% 11% 9%
16% 19% 19%
Property P
NP
CAT
Casualty P
NP
Motor P
NP
4) Northern Asia: Hong Kong, Taiwan, Macau5) Percentages are based on the number of segments in
each category, not taking into account the respective segments’ premium volume
Treaty P&C

1) SUL, Channel & Alternative Solutions not considered2) Including GAUM3) Mainly non-proportional business4) Energy and Natural Resources Property & Casualty
(Energy Onshore + Offshore & Mines & Power)
143
SCOR Global P&C’s assessment of current segment attractiveness, based on the profitability of its own book (2/2)
Attractive
Adequate
Inadequate
Very attractive
Monte Carlo 2016 January 2016 Monte Carlo 2015
0% 0% 0%
5% 0% 14%
86% 91% 77%
9% 9% 9%
Agric
ultu
re
Engi
neer
ing
Cre
dit &
Su
rety
Mar
ine
& O
ffsho
re
Ener
gy
Avia
tion1)
IDI
Spac
e
Busi
ness
So
lutio
ns
Int. Airlines
Gen. Aviation
Prod. Liability
CAR
EAR
B&M
Credit
Surety
Hull
Cargo2)
P&I2)
Energy
Hail
MPCI
Live-stock
ENR3)
Worldwide
C&S4)
Worldwide
CPC5)
EMEA
CPC5) APAC
CPC5)
Americas
Total Agriculture
Total Engineering
Total Credit & Surety
Total Marine & Offshore
Total Aviation IDI Space
Total Business Solutions
Business attractiveness6)
4) Construction and Specialties (Professional Indemnity & Captives protection)
5) Corporate Property & Casualty (large industrial & commercial risks)6) Percentages are based on the number of segments in each category, not
taking into account the respective segments’ premium volume
Specialty lines and business solutions1)

SCOR IR Day 2016
144
APPENDICESSCOR Group
SCOR Global P&C
SCOR Global Life
SCOR Global Investments
ERM
Capital management
Glossary
2
1
6
3
4
5
7

Split of 2019 Gross Written Premiums by regions, product lines and types of business
1) Gross Written Premiums2) All long-term treaties signed in 2015 or earlier3) New business contribution reflects the impact in 2019 of new business written over 2016-2019 145
All product linesGWP1) in EUR
billions
2016 Total Short-term 1.6
2016 In-force2) 6.0
In-force run-off 2016-20192) -0.4
New business contribution 2016-20193) 2.2
Total Gross Written Premiums 2019 9.4
Protection onlyGWP1) in EUR
billions
2016 Total Short-term 1.2
2016 In-force2) 5.0
In-force run-off 2016-20192) -0.3
New business contribution 2016-20193) 1.3
Total Gross Written Premiums 2019 7.2
+
+
+
=
2016E 2019E
Americas 4.4 4.8
Europe, Middle-East & Africa 2.5 2.9
Asia-Pacific 1.1 1.7
Total Gross Written Premiums 8.0 9.4
2016E 2019E
Protection 6.4 7.2
Financial Solutions 1.0 1.2
Longevity 0.6 1.0
Total Gross Written Premiums 8.0 9.4
+
+
+
=
▐ GWP1) rounded - in EUR billions

SCOR IR Day 2016
146
APPENDICESSCOR Group
SCOR Global P&C
SCOR Global Life
SCOR Global Investments
ERM
Capital management
Glossary
2
1
6
3
4
5
7

Third party assets under management illustrative development
1) Assets under management, including undrawn commitments
147
SCOR Investment Partners’ third-party asset management activity will be further developed during “Vision in Action”
If market conditions remain supportive, SCOR Investment Partners intends to leverage on the strong momentum of its third-party asset management activity towards institutional investors
This development will rely on a focalization on the existing areas of expertise (corporate credit, loans, ILS), supported by an enhanced distribution setup in Europe
▐ Assets under Management projection in € billion1)
0.10.3
0.9
1.5
5.0
2012 2013 2014 2015 2016E 2017E 2018E 2019E
CAGR+34%

SCOR IR Day 2016
148
APPENDICESSCOR Group
SCOR Global P&C
SCOR Global Life
SCOR Global Investments
ERM
Capital management
Glossary
2
1
6
3
4
5
7

Key sensitivities in percentage point of solvency ratio
149
SCOR continues to leverage on a strong diversification benefit and maintains a resilient solvency position
No use of any transitional measures, volatility or matching adjustments
No sensitivity to Ultimate Forward Rate (UFR)
~0
-2
-7
-1
1
-1
-15
16
Change in Ultimate Forward Rate
+100 bps in credit spread gov. Bonds
+100 bps in credit spread corp. Credit
-10% in equity returns
-10% in USD
+10% in USD
-100 bps in interest rate
+100 bps in interest rate
Balance between Life and P&C leads to high diversification

SCOR IR Day 2016
150
APPENDICESSCOR Group
SCOR Global P&C
SCOR Global Life
SCOR Global Investments
ERM
Capital management
Glossary
2
1
6
3
4
5
7

151
Average spread between 3-month risk-free rates and 5-year rolling average of 5-year is averaging to 160 bps in a range of 40 bps to 280 bps
-100
0
100
200
300
400
500
600
700
Standard Deviation
Standard Deviation
160 bps
280 bps
40 bpsSpre
ad in
bas
is p
oint
s
3-month RFR 5-year rolling average of 5-year RFR
Average 160 bps
Start of “Optimal Dynamics”
~120 bps
~120 bps

SCOR is benefiting from its:
1) Greece, Italy, Ireland, Spain, Portugal2) Europe, Middle East and Africa 152
SCOR is global and has minimal exposure to sovereign risks
2)
among which France represents ~7% and UK represents ~12% of the total GWP
16%41%
43%
▐ In % of 2015 GWP (rounded) ▐ Investment portfolio as at 30/06/2016 excluding cash – in %.Total EUR 16.6 billion
Exposure to UK stands at EUR 1.4 billion of the invested assets (excluding cash)
Exposure to France stands at EUR 2.6 billion or 16% of the invested assets (excluding cash)
28%
47%
9%
16%
EU (non-UK)
North America
UK
Other
Global positioning, serving more than 4,000 clients around the world through 38 offices and covering risks in more than 160 countries
Well-balanced portfolio between Life and P&C Highly diversified and secured allocation of capital, held for ~90% in USD, EUR and GBP Minimal exposure to sovereign risks and notably no exposure to GIIPS1)

4.4 4.8 5.05.7
6.4 6.3
1.01.2
1.4
1.7
1.7 2.2
0.90.9
2011 2012 2013 2014 2015 H1 2016
Shareholders' equity Hybrid capital Book value per shareFinancial leverage
18%20% 21%
23%21%1)
25.5%1)
1) Gross financial leverage ratio would be approximately 27.5% in 2015 and 31.8% in H1 2016 unadjusted from the repayment of the CHF 650 million and EUR 257 million subordinated debts called in Q3 2016 153
SCOR has a very strong capitalization, which grows sustainably over the years, proving the Group’s ability to absorb shocks
Debtscalled
in Q3 2016
€ 23.83 € 26.18 € 26.64 € 30.60 € 34.03
5.46.0
6.3
7.4
9.0
€
+74%
€ 33.79
9.4
▐ In EUR billions (rounded)

154
SCOR benefits from a best-in-class rating with all agencies giving a positive assessment of its current financial strength and capitalization
AA-
A
A1
Stable outlook
Positive outlook
Positive outlook
“Very strong capital and earnings, strong financial profile and
exceptional liquidity”
“Very strong level of capitalization”
“Robust risk-adjusted capitalization, resilient overall earnings”
“Consistently good profitability with a very low level of volatility, strong
financial flexibility”
AA-Stable outlook
The best-in-class rating provides SCOR with considerable benefits from a franchise and a financial perspective

155
SCOR resists shocks and consistently increases its Net Asset Value
0.5
1
1.5
2
2.5
3
3.5
4
4.5
0
500
1 000
1 500
2 000
2 500
3 000
3 500
4 000
4 500
5 000
5 500
6 000
6 500 European sovereign debt crisisLiquidity crisis
Acquisition of Converium
Acquisition of Revios
EUR 6.3 bn
European storm Kyrill
Hurricanes Gustav & Ike in the US
Fires in Southern California
European storm Klaus
German Hailstorms
SCOR shareholders’ equity
EUR depreciation
Chinese slowdown
Greek crisis
Beginning of the subprime crisis
Lehman Brothers bankruptcy
Greece bailout
Acquisition of Transamerica Re
Acquisition of Generali US
European & Alberta Floods
Earthquake in Chile
Floods in Australia Earthquakes in New ZealandEarthquake and tsunami in Japan
Floods in Thailand
Hurricane Sandy
Loss of AAA rating by France
Loss of AAA rating by the US
AA-
A+
A
A-
S&P ratingHistorically low European
yield environment
Brexit

TSR since January 2006 (10 years)
Source: Factset as of September 5, 2016 (in alphabetical order: Hannover Re, Munich Re, Swiss Re) 1) Total shareholder return (TSR) = share price appreciation + dividend paid2) Share price appreciation = price return excluding dividends 156
Over the past years, SCOR has provided attractive total shareholder returns compared to its European peers
Source of total shareholder return (TSR)1) including share buy-back effects
212%
55% 44%
-12%
73%
66%59%
34%
12%
12%
297%
121%103%
34%
Peer 1 SCOR Peer 3 Peer 2
Dividend paid Ordinary Special
Share price appreciation2)

Calculation of the risk-free rate component of “Vision in Action”’s RoE target
Average of 5Y daily rates Currency mix Weighted average 5Y RFR
USD EUR GBP USD EUR GBP 5Y RFR2011 H2 1.04 1.26 1.27 28.3% 58.0% 13.7% 1.20
2012 FY 0.76 0.57 0.84 28.3% 58.0% 13.7% 0.66
2013 FY 1.16 0.64 1.23 30.3% 57.2% 12.5% 0.87
2014 FY 1.63 0.39 1.75 32.2% 55.1% 12.8% 0.97
2015 FY 1.53 0.00 1.30 35.6% 51.2% 13.2% 0.71
2016 H1 1.31 -0.33 0.87 35.6% 51.2% 13.2% 0.41
0.802016 H1 5Y Rolling average of
the 5Y RFR
1 2
31
2
3
Average of the daily RFR of the 3 main currencies of the last 60 months (from the 1st July 2011 to 30th June 2016)
Currency mix based on SCOR’s net technical reserves by quarter
5Y (60 months) rolling average of the 5Y RFR including currency mix
Example approach - 2016 H1 RFR calculation
157

SCOR IR Day 2016
158
APPENDICESSCOR Group
SCOR Global P&C
SCOR Global Life
SCOR Global Investments
ERM
Capital management
Glossary
2
1
6
3
4
5
7

159
Abbreviations (1/2)
AEP Aggregate Exceedance Probability FAC Facultative reinsurance
ALM Asset Liability Management Fed US Federal Reserve
AMF Autorité des marchés financiers GIIPS Greece, Italy, Ireland, Portugal, and Spain
APAC Asia-Pacific GWP Gross Written Premiums
AuM Assets under Management IDI Inherent Defects Insurance
B&M Boiler and Machinery ILS Insurance Linked Security
CAGR Compound Annual Growth Rate LOB Line of Business
CAR Construction All Risks MBS Mortgage Backed Securities
CPC Corporate Property & Casualty MCEV Market Consistent Embedded Value
C-ROSS China Risk Oriented Solvency System MGA Managing General Agent
C&S Credit and Security MPCI Multiple Peril Crop Insurance
EAR Erection All Risks NTR Net Technical Results
EBS Economic Balance Sheet OD Optimal Dynamics
ECB European Central Bank ORSA Own Risk and Solvency Assessment
EGPI Estimated Gross Premium Income P&I Protection and Indemnity
EMEA Europe, Middle East and Africa QE Quantitative Easing
ENR Energy and Natural Resources RFR Risk-free Rate
EOF Eligible Own Funds RoE Return on Equity
ERM Enterprise Risk Management RoIA Return on Invested Assets
ESG Environmental, Social and Governance ROL Rate on Line
E&S Excess and Surplus RORAC Return on Risk-Adjusted Capital
FAC Facultative reinsurance SAA Strategic Asset Allocation

160
Abbreviations (2/2)
SBS SCOR Business Solutions
SCR Solvency Capital Requirement
SE SCOR SE
SGPC SCOR Global P&C
SGI SCOR Global Investments
SGL SCOR Global Life
SIP SCOR Investment Partners
SR Solvency Ratio
TAA Tactical Asset Allocation
TSR Total Shareholder Return
VaR Value at Risk
VIF Value in Force

161
Glossary (1/4)A-C
ALM (Asset Liability Management)
Risk-management technique aimed at earning adequate returns and protecting capital by simultaneously managing the duration and other relevant characteristics of assets and liabilities
AEP (Aggregate Exceedance Probability)
Measure the probability that one or more occurrences will combine in a year to exceed the threshold. AEP is the annual losses from all events in a year
Biometric risk Category covering all risks related to human life including mortality risk, disability risk, critical illness, personal accident, health, long- term care and longevity risks
Capital (contingent) Funds that would be available under a pre-negotiated agreement if a specific contingency (such as a natural disaster or a pandemia) occurs
Catastrophe (or Cat) bonds
A high performance bond which is generally issued by an insurance or reinsurance company. If a predefined occurrence takes place(such as an earthquake, tsunami, hurricane etc.), the bondholder loses all or part of his investment in the bond.This type of insurance-linked security allows insurance and reinsurance companies to transfer peak risks (such as those arising from natural catastrophes) to capital markets, thereby reducing their own risks
Combined ratio Sum of the Non-Life net attritional ratio, natural catastrophe ratio, commission ratio and the management expense ratio
Cycle Stands for the combination of the financial & monetary cycle as well as the P&C cycle
Deposit, Funds Withheld Amounts which may be deposited with the ceding company to guarantee the reinsurer’s liability. These funds withhelds are remunerated to the reinsurer
Diversification Diversification reduces accumulated risks whose occurrences are not fully dependent

162
Glossary (2/4)D-I
EBS (Economic Balance Sheet)
Economic valuation of the balance sheet whereby values are assigned to the balance sheet positions that are as close as possible to market prices
Effective Duration The effective duration is defined as the interest rate sensitivity to a parallel shift of the yield curve of +/- 100bps
EOFs (Eligible Own Funds)
Amount of capital which is available and eligible to cover the Solvency II capital requirement (SCR). It is made up of the IFRS shareholders’ equity, the eligible hybrid debt and the impact of economic adjustments on the economic balance sheet. It is the nominator of the solvency ratio
E&S (Excess and Surplus Lines)
Companies are also referred to as “non-admitted” companies. These companies are not licensed by the state but are approved by the department of insurance to write business in a state. An E&S company can charge any amount it wants for a policy and can also use any policy form that it wants without seeking regulatory approval
Exposure A measure of the current level of the risk of SCOR’s actual portfolio with a return period of 1 in 200 years
Footprint Scenario Footprint scenarios are an innovative and complementary risk management tool. Whereas risk drivers and extreme scenarios are probability-based, the footprint approach consists in carrying out an impact assessment on the Group under a deterministic scenario
IDI (Inherent Defects Insurance)
First-party property insurance that covers physical damage or the imminent collapse of newly-constructed property caused by faulty design, engineering, workmanship, or materials in load-bearing elements
ILS (Insurance Linked Securities)
Financial instruments whose values are driven by insurance loss events. These instruments, which are linked to property losses due to natural catastrophes, represent a unique asset class, whose return is uncorrelated to that of the general financial market
In-force business Part of the Life premiums composed of accumulated generations of business written over time
In-payment longevity Longevity risk for persons already receiving their pension, typically aged 65-70 with expected duration of around 30-35 years

163
Glossary (3/4)L-R
Life technical margin The ratio of the Life technical results (including interest on deposits on funds withheld) divided by the net earned premiums of SCOR Global Life
Limit The maximum risk to which the company is committed to exposing itself
Longevity risk Type of biometric risk. The risk that actual payments exceed their expected level due to mortality rates being lower than expected
LTC (Long-Term Care) Insurance covers policyholders unable to perform predefined activities of daily life who consistently need the assistance of another person for every aspect. The loss of autonomy is permanent and irreversible
MCEV (Market Consistent Embedded Value)
Measures the value of expected future cash flows in Life insurance and Life reinsurance from the shareholder’s point of view, expressed as the value of net assets plus the present value of expected profits on the insurance portfolio less cost of capital and administrative expenses
Mortality bond This is a bond covering extreme mortality
ORSA (Own-Risk and Solvency Assessment) Process which provides forward-looking information on SCOR’s risks, capital needs and solvency position over the ORSA time horizon.
Peak (Non –peak) perils
While natural catastrophes can happen in most countries, for convenience SCOR draws a distinction between so-called Peak and Non-Peak region-peril combinations. Peak Perils are characterized by a combination of high severity hazards in large economies with high insurance penetration. This leads to a strong demand for risk transfer by primary insurers and typically represents the largest accumulations of risk for reinsurers and retrocessionaires. Specifically, the set of Peak perils comprises Atlantic Hurricane, US Earthquake, European Windstorm, Japanese Earthquake and Japanese Typhoon. All other region perils are considered as non-peak
Retention Share of the risk retained by the insurer or reinsurer for its own account
Retrocession Transaction in which the reinsurer transfers (or lays off) all or part of the risks it has assumed to another reinsurer, in return for payment of a premium
Risk appetite Defines the target risk profile (assets and liabilities combined) that SCOR actively seeks in order to achieve its expected return. The target risk profile is represented as the Group's target profit/loss probability distribution

164
Glossary (4/4)R-ZRisk appetite framework Consistently defines the three following metrics: SCOR’s risk appetite, SCOR’s risk preference and SCOR’s risk tolerance
Risk map Map developped for the Group and European legal entities, which captures risk profile, through the identification of risk factors whichcould potentially impact the Economic Balance Sheet (EBS) items, and assesses whether these risks are included in the internal model
Risk margin The risk margin is designed to represent the amount an insurance company would require to take on the obligations of a given insurance company on top of the best estimate liabilities. It is calculated using a cost of capital approach
Risk preference Defines the kinds of risks SCOR wants to take (in which segment of the industry, in which LoB, in which country etc.)
Risk tolerance It defines the quantitative risk limits, at Group, LoB or geographical levels, which SCOR does not want to exceed
Run off The cessation of all underwriting of new business on a risk portfolio. As a result, all reserves are “run off” over time until their complete extinction. Run off may take up to several decades depending on the class of business
SCR (Solvency Capital Requirement)
Required capital calculated by SCOR’s internal model ensuring the Group can meet its obligations over the following 12 months with a 99.5% probability. It is the denominator of the solvency ratio.
Solvency scaleScale developed by SCOR to achieve the best balance between a strong solvency level and an efficient use of its capital. The solvency scale drives a process of gradual escalation and management actions, depending on the optimal capital range of the solvency scale based on the Group Internal Model
Solvency ratio Ratio of eligible own funds (EOF) to solvency capital requirement (SCR)
Tail (long/short)The period of time that elapses between either the writing of the applicable insurance or reinsurance policy or the loss event (or the insurer’s or reinsurer’s knowledge of the loss event) and the payment in respect thereof. A “short-tail” product is one where ultimate losses are known comparatively quickly; ultimate losses under a “long-tail” product are sometimes not known for many years
Technical profitability Profitability related to underwriting (i.e. underwriting result defined as Premiums minus losses not including investment income minus commissions)
Total capital The sum of the shareholders equity, the senior debt and the subordinated debt
Value-in-Force The present value of expected future profit flows from the portfolio of in-force retained business, discounted by a currency-specific risk discount rate. It is determined in accordance with local accounting principles