scotch plains .. fanwood . regional school district · scotch plains .. fanwood . regional school...
TRANSCRIPT
SCOTCH PLAINS .. FANWOOD .
REGIONAL SCHOOL DISTRICT
Scotch Plains-Fanwood Regional School District Board of Education
Scotch Plains, New Jersey
Comprehensive Annual Financial Report For the Fiscal Year Ended June 30, 2014
Comprehensive Annual Financial Report
of the
Scotch Plains-Fanwood Regional School District Board of Education
Scotch Plains, New Jersey
For the Fiscal Year Ended June 30, 2014
Prepared by
Scotch Plains-Fanwood Regional School District Board of Education
Finance Department
SCOTCH PLAINS-FANWOOD REGIONAL SCHOOL DISTRICT TABLE OF CONTENTS
FISCAL YEAR ENl)ED JUNE 30, 2014
INTRODUCTORY SECTION (Unaudited)
Letter of Transmittal ..................................................................................................................................... 1 Organizational Chart ..................................................................................................................................... 7 Roster of Officials ......................................................................................................................................... 8 Consultants and Advisors ............................................................................................................................. 9
FINANCIAL SECTION ................................................................................................................................ 10
Independent Auditors' Report .................................................................................................................... 11
Required Supplementary Information ......................................................................................................... 14
Management's Discussion and Analysis (Unaudited) .......................................................................... 15 Post-Retirement Benefits - Schedule of Funding Progress (Unaudited) ............................................. 25
Basic Financial Statements (Sections A. and B.) ........................................................................................ 26
A. District-Wide Financial Statements ...................................................................................................... 27 A-1 Statement of Net Position ........................................................................................................... 28 A-2 Statement of Activities ............................................................................................................... 29
B. Fund Financial Statements ................................................................................................................... 31 B-1 Balance Sheet - Governmental Funds ........................................................................................ 32 B-2 Statement of Revenue, Expenditures and Changes in Fund Balance
Governmental Funds ............................................................................................................... 33 B-3 Reconciliation of the Statement of Revenue, Expenditures and Changes in
Fund Balances of Governmental Funds to the Statement of Activities ................................... 34 B-4 Statement of Net Position Proprietary Funds .......................................................................... 35 B-5 Statement of Revenue, Expenses and Changes in Fund Net
Position - Proprietary Funds ................................................................................................... 36 B-6 Statement of Cash Flows - Proprietary Funds ........................................................................... 3 7 B-7 Statement of Fiduciary Net Position Fiduciary Funds ............................................................. 38 B-8 Statement of Changes in Fiduciary Net Position Fiduciary Funds .......................................... 39
Notes to the Basic Financial Statements .............................................................................................. 40
Supplementary Schedules (Sections C. to I.) C. Budgetary Comparison Schedules (Unaudited) ................................................................................... 67
C-1 Budgetary Comparison Schedule General Fund ...................................................................... 68 C-2 Budgetary Comparison Schedule Special Revenue Fund ....................................................... 81 C-3 Budgetary Comparison Schedule Note to Required Supplementary Information ................... 82
D. School Level Schedules (Not Applicable) ........................................................................................... 84
E. Special Revenue Fund .......................................................................................................................... 85 E-1 Combining Schedule of Revenue and Expenditures Special Revenue
Fund - Budgetary Basis .......................................................................................................... 86 E-2 Preschool Education Aid Schedule of Expenditures Special Revenue
Fund Budgetary Basis ......................................................................................................... 90
SCOTCH PLAINS-FANWOOD REGIONAL SCHOOL DISTRICT TABLE OF CONTENTS
FISCAL YEAR ENDED JUNE 30, 2014 (Continued)
FINANCIAL SECTION (Cont'd)
Supplementary Schedules (Sections C. to I.) (Cont'd) F. Capital Projects Fund ........................................................................................................................... 91
F-1 Summary Schedule of Revenues, Expenditures, and Changes in Fund Balance -Budgetary Basis ....................................................................................................................... 92
F-1 a Schedule of Project Revenues, Expenditures, Project Balance and Project Status Budgetary Basis - Scotch Plains-Fanwood High School - HV AC Replacement Project ..................................................................................................................................... 93
F-1 b Schedule of Project Revenues, Expenditures, Project Balance and Project Status -Budgetary Basis Park Middle School - Waterproof Below Grade Portions of Front Wall Project ................................................................................................................... 94
F-lc Schedule of Project Revenues, Expenditures, Project Balance and Project Status Budgetary Basis - William J. McGinn Elementary School - HVAC Upgrades Project ..................................................................................................................................... 95
F-1 d Schedule of Project Revenues, Expenditures, Project Balance and Project Status Budgetary Basis Terrill Middle School Roof Replacement Project.. ................................ 96
F-1 e Schedule of Project Revenues, Expenditures, Project Balance and Project Status -Budgetary Basis -Evergreen Elementary School- Roof Replacement Project.. ................... 97
F-1 f Schedule of Project Revenues, Expenditures, Project Balance and Project Status -Budgetary Basis - Scotch Plains-Fanwood High School - Fire Alarm Replacement Project ..................................................................................................................................... 98
F-lg Schedule of Project Revenues, Expenditures, Project Balance and Project Status Budgetary Basis - Terrill Middle School Fire Alarm Replacement Project.. ...................... 99
F-1 h Schedule of Project Revenues, Expenditures, Project Balance and Project Status -Budgetary Basis - Scotch Plains-Fanwood High School - Science Lab Project.. ................ I 00
G. Proprietary Funds ............................................................................................................................... 10 l Enterprise Funds: G-1 Combining Statement of Net Position ...................................................................................... 102 G-2 Combining Statement of Revenue, Expenses and Changes in Fund Net Position ................... 103 G-3 Combining Statement of Cash Flows ....................................................................................... I 04
H. Fiduciary Funds .................................................................................................................................. 105 H-1 Combining Statement of Fiduciary Net Position ...................................................................... 106 H-2 Statement of Changes in Fiduciary Net Position ...................................................................... 107 H-3 Student Activity Agency Fund Schedule of Receipts and Disbursements ............................... 108 H-4 Student Activity Agency Fund Statement of Activity .............................................................. 109 H-5 Payroll Agency Fund Schedule of Receipts and Disbursements .............................................. 110
I. Long-Term Debt ................................................................................................................................. 111 I-1 Schedule of Serial Bonds .......................................................................................................... 112 I-2 Schedule of Obligations Under Capital Leases ........................................................................ 113 I-3 Debt Service Fund Budgetary Comparison Schedule (Unaudited) .......................................... 114
SCOTCH PLAINS-FANWOOD REGIONAL SCHOOL DISTRICT TABLE OF CONTENTS
FISCAL YEAR ENDED JUNE 30, 2014 (Continued)
STATISICAL SECTION J. Statistical Section (Unaudited) ........................................................................................................... 115
J-1 Net Position by Component. ..................................................................................................... 116 J-2 Changes in Net Position ........................................................................................................... 117 J-3 Fund Balances - Governmental Funds ...................................................................................... 119 J-4 Changes in Fund Balances - Governmental Funds ................................................................... 120 J-5 General Fund Other Local Revenue by Source ........................................................................ 122 J-6 Assessed Value and Estimated Actual Value of Taxable Property .......................................... 123 J-7 Direct and Overlapping Property Tax Rates ............................................................................. 124 J-8 Principal Property Taxpayers ................................................................................................... 125 J-9 Property Tax Levies and Collections ........................................................................................ 126 J-10 Ratios of Outstanding Debt by Type ........................................................................................ 127 J-11 Ratios of Net General Bonded Debt Outstanding ..................................................................... 128 J-12 Ratios of Overlapping Governmental Activities Debt... ........................................................... 129 J-13 Legal Debt Margin Information ............................................................................................... 130 J-14 Demographic and Economic Statistics ..................................................................................... 131 J-15 Principal Employers ................................................................................................................. 132 J-16 Full-Time Equivalent District Employees by Function/Program ............................................. 133 J-17 Operating Statistics ................................................................................................................... 134 J-18 School Building Information .................................................................................................... 134 J-19 Schedule of Required Maintenance for School Facilities ......................................................... 137 J-20 Insurance Schedule ................................................................................................................... 138
K. SINGLE AUDIT SECTION .............................................................................................................. 140 K-1 Independent Auditor's Report on Internal Control Over Financial Reporting and
on Compliance and Other Matters Based on an Audit of Financial Statements Performed in Accordance with Government Auditing Standards ......................................... 141
K-2 Independent Auditor's Report on Compliance For Each Major Federal and State Program; Report on Internal Control Over Compliance Required by OMB Circular A-133 and New Jersey's OMB Circular 04-04 ..................................................................... 143
Schedule of Expenditures of Federal Awards .......................................................................... 145 Schedule of Expenditures of State Awards .............................................................................. 14 7 Notes to Schedules of Expenditures of Federal and State Awards ........................................... 149 Schedule of Findings and Questioned Costs ............................................................................ 151 Summary Schedule of Prior Audit Findings ............................................................................. 153
INTRODUCTORY SECTION
The Scotch Plains-Fanwood Public Schools
October 21, 2014
Evergreen A venue and Cedar Street SCOTCH PLAINS, NEW JERSEY 07076
The Honorable President and Members of the Board of Education
Scotch Plains-Fanwood Regional School District County of Union, New Jersey
Dear Board Members:
It is with pleasure that we submit the Comprehensive Annual Financial Report (CAFR) of the Scotch PlainsFanwood Regional School District (the "District") for the fiscal year ended June 30, 2014. Responsibility for both the accuracy of the data and completeness and fairness of the presentation, including all disclosures, rests with the management of the Board of Education (the "Board"). To the best of our knowledge and belief, the data presented in this report is accurate in all material respects and is reported in a manner designed to present fairly the basic financial statements and results of operations of the District. All disclosures necessary to enable the reader to gain an understanding of the District's financial activities have been included.
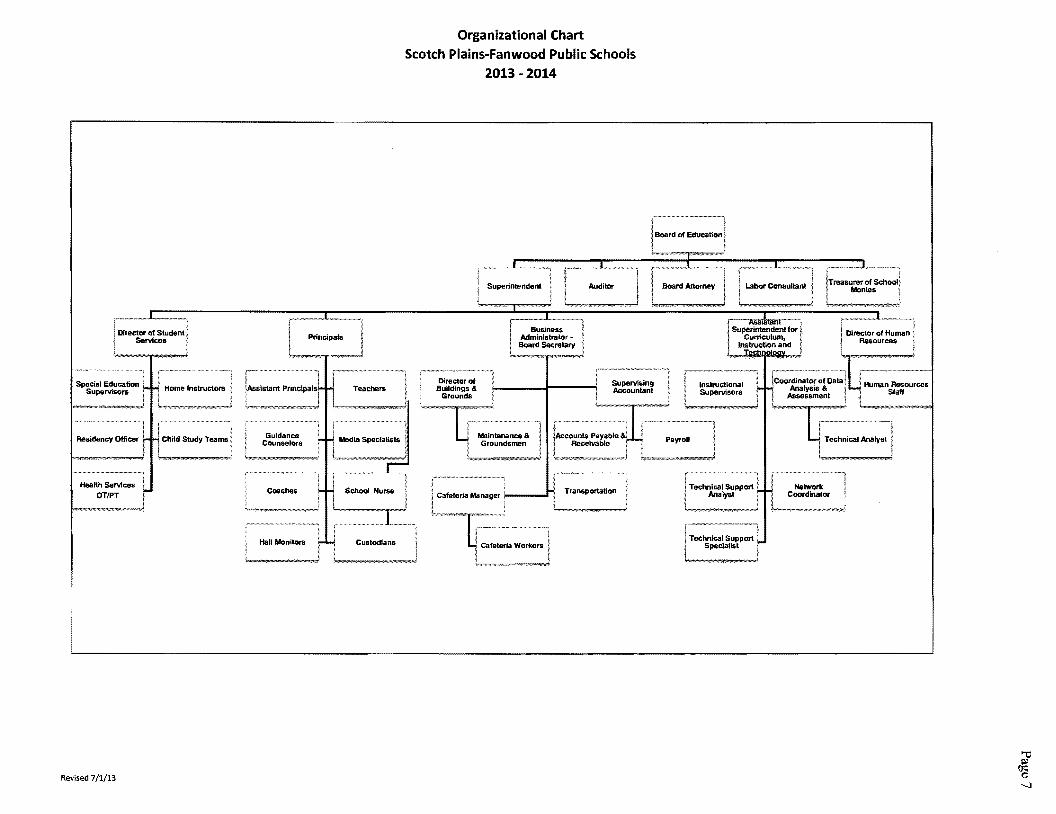
The comprehensive annual financial report is presented in four sections: introductory, financial, statistical and single audit. The introductory section includes this transmittal letter, the District's organizational chart and a list of principal officials. The financial section includes the Independent Auditors' Report, the management's discussion and analysis, the basic financial statements and notes providing an overview of the District's financial position and operating results, and supplementary schedules providing detailed budgetary information. The statistical section includes selected financial and demographic information, financial trends and the fiscal capacity of the District, generally presented on a multi-year basis. The District is required to undergo an annual single audit in conformity with the provisions of the Single Audit Act Amendments of 1996 and the U.S. Office of Management and Budget Circular A-133, Audits of States, Local Governments, and Non-Profit Organizations, and New Jersey's OMB Circular 04-04, Single Audit Policy for Recipients of Federal Grants, State Grants and State Aid. Information related to this single audit, including the auditors' reports on the internal control and compliance with applicable laws, regulations, contracts and grants along with findings and questioned costs, is included in the single audit section of this report.
SCHOOL DISTRICT ORGANIZATION
The Scotch Plains-Fanwood Regional School District is one of 603 school districts in the State of New Jersey and one of 21 school districts in the County of Union. The School District provides education to students in grade level Pre-K through twelve. Geographically, the District is comprised of the Borough of Fanwood and the Township of Scotch Plains.
An elected nine-member Board of Education (the "Board") serves as the policy maker for the School District. The Board adopts an annual budget and directly approves all expenditures which serve as the basis for control over and authorization for all expenditures of School District tax money.
The Superintendent is the chief executive officer of the School District, responsible to the Board for total educational and support operations. The Business Administrator/Board Secretary is the chief financial officer of the School District, responsible to the Board for maintaining all financial records, issuing warrants in payment of liabilities incurred by the School District, acting as custodian of all School District funds, and investing idle funds as permitted by New Jersey law.
Pagel
The Honorable President and Members of the Board of Education
Scotch Plains-Fanwood Regional School District Page2 October 21, 2014
1) REPORTING ENTITY AND ITS SERVICES: The Scotch Plains-Fanwood Regional School District is an independent reporting entity within the criteria adopted by the Governmental Accounting Standards Board ("GASB") in codification section 2100. All funds of the District are included in this report. The Scotch Plains-Fanwood Regional School District and all its schools constitute the District's reporting entity.
The District continues to maintain a high quality of education. The Scotch Plains-Fanwood Regional School District is a comprehensive educational organization that provides a full range of programs and services appropriate to grade levels Pre-K through 12. These programs and services include regular, vocational as well as special education for disabled youngsters. The District completed the 2013-2014 school year with an average daily enrollment of 5,463 students, compared to 5,475 students as of June 30, 2013. Enrollment is defined as students on roll and students placed out of district.
2) EDUCATIONAL PROGRAMS: Pre-Kindergarten to Grade 4 elementary, middle school (grades 5-8), and high school (grades 9-12) programs continue to provide students with appropriate and motivational educational experiences in the Core Content areas. Our co-curricular, fine arts, and athletic programs continue to enhance and foster the development of well-rounded students. In addition, community service is an integral part of many of these programs.
3) MAJOR INITIATIVES: Students continue to score above the State and National averages on District administered tests. As measured by the HSPA, 97.5% of our eleventh grade students scored proficient or above in language arts literacy and 89.9% of our eleventh grade students scored proficient or above in mathematics. In the areas of NJ ASK results, the elementary and middle schools always scored above the state and similar to other schools in District Factor Group I.
Technology
A range of technology initiatives occurred during 2013-2014 school year. Park Middle School received a mobile cart of Chromebooks to pilot in the Writing Workshop. The high school received 5 iPad carts for the l l 1h grade Global Perspectives course. Wireless upgrades, including switches and backbone equipment, were conducted in both middle schools. Infrastructure to support district wireless access was upgraded at the high school. Scheduled faculty received new laptop computers. Additionally, classroom amplification systems, LCD projectors, Apple TVs, document cameras were purchased and installed. Software licenses were renewed including Casper licenses (that provides management for all Mac OS X devices), PowerSchool, Rubicon, Destiny, Type 2 Learn, Microsoft Office, Schoolwires, and Symantec Ghost Solution. Furthermore, professional services were utilized to provide additional expertise to support district initiatives.
Mathematics
During the 2013-2014 school year, the mathematics department professional development activities focused on the identification of secure skills and the design of end-of-year assessments. Elementary school teachers used a mastery scope and sequence to select secure skills for their grade level. In addition, the teachers conducted an audit of the Everyday Mathematics end-of-year assessments to ensure inclusion of these skills. At the middle school level, the Math Explorations curriculum was revised to emphasize skills in need of reinforcement. Additionally, all seventh and eighth grade teachers received training on the Connected Mathematics 3 program, which was newly adopted. The high school teachers compared the curriculum in Algebra I, Algebra & Analytic Geometry, and Algebra II to the PARCC assessment performance level descriptors. Consequently, the teachers conducted an audit of the curriculum and modified it as needed. At all levels, modifications were made to existing benchmarks.
Page2
The Honorable President and Members of the Board of Education
Scotch Plains-Fanwood Regional School District Page3 October 21, 2014
Language Arts
In the Language Arts Department, the textbook and trade book resource inventory continued to be replenished during the 2013-2014 school year. These resources included some of the following titles: Brave New World, Pygmalion, 1984 and Nickel and Dimed. We also purchased teacher professional development texts, to support continued professional development in reading instruction. Notice and Note, Falling in Love with Close Reading and What Readers Really Do helped us continue to work towards this. The department also continues to expand our global and nonfiction literature selections to better address district priorities and the new Common Core Standards. Most notably, we purchased Cal, Blood Brothers and The Immortal Life of Henrietta Lacks to help support these goals. Funds at the elementary level continued to support the purchase of our new standards-aligned balanced literacy program, Good Habits Great Readers and Words Their Way. Additional resources were provided to classroom teachers in order to build their individual classroom libraries. Beyond replenishing and increasing resources, teachers were provided with multiple opportunities to insure that the curriculum was aligned to the Common Core Standards.
Social Studies
The Social Studies Department budget allocations in 2013-2014 focused on our continuing efforts to bring more globally-oriented materials to classrooms, the infusion of literacy instruction in the social studies, and to support the diverse range of learners in our classrooms. At the elementary level, a variety of fiction and nonfiction texts were purchased to support literacy and global perspectives. In addition, hands-on materials and manipulatives were purchased to engage students in collaborative inquiry-based instruction. At the middle school level, materials were purchased to support a diverse range of learners, such as leveled texts. Many of these resources also help to enhance integration of non-fiction text analysis to further promote student achievement of the Common Core Standards in Literacy. At the high school level, a variety of materials, such as document-based question resources, were purchased to support teachers in implementing the Common Core State Standards in Literacy. Materials were also purchased to support the differentiation of instruction through the use of varied texts and resources, such as electronic databases and texts at varied levels.
Science
For the 2013-2014 school year, the continued focus of the department is to provide and support learning environments that promote hands-on, inquiry-based activities. Elementary teachers continue to receive support materials and resources to support their science classes as they utilize both the GEMS and FOSS modules in their classrooms. At the middle and high school levels, the teachers continue to work on inquirybased lessons to further student engagement and to bring real-world applications into the classroom. Teachers continue to utilize technology through the instructional usage of LCD projectors and through student usage of laptop carts and Vernier Labquest devices to acquire laboratory data. Advanced Placement Biology and Chemistry teachers, as a result of attending workshops sponsored by the College Board that informed them of crucial changes in those courses of study, are collaborating to move their courses to a broad based, inquirybased curriculum. Additionally the AP Chemistry teachers are making use of the media edition of the textbook as a teaching and learning resource. This enables students to access information, use on-line tutorials for extra help and complete and submit assignments on-line. Teachers at the middle and high school have continued to use the Rubicon Atlas website as a means to share and collaborate the development of units, lessons, and assessments.
Page3
The Honorable President and Members of the Board of Education
Scotch Plains-Fanwood Regional School District Page4 October 21, 2014
World Languages
Since World Languages is primarily a non-textbook based content area, a good part of the budget continued to go towards supplies and resources that supported instruction, promoted the development of students' language proficiency, and facilitated collaborative global projects. In particular, additional instructional materials were purchased to support our growing Mandarin program. Purchases for all languages included manipulatives, audio resources, cultural DVDs and authentic literary and cultural resources, such as Scholastic Books and Magazines and authentic language magazines for upper level courses. At the high school level, we purchased instructional materials and resources to support the recent change in format and focus of the AP courses and exams. Additionally, we purchased e-texts for all Spanish II students at the high school. All teachers received copies of the ACTFL text, The Keys to Planning for Leaming, to guide effective curriculum, unit and lesson design.
Fine Arts
This year the budget supported all of the Fine Arts curriculum with financial assistance being allocated to all co-curricular activities, and scheduled classes. Money was allocated for additional repairs, new equipment, and additional transportation when needed. A new trailer was added to the marching band fleet to provide safe travel for most percussion instruments.
At Terrill, the auditorium has received a complete revision which will enhance the musical and theatrical productions. At the high school, new lighting is being installed to provide a professional atmosphere for annual performances.
Additional funds have been allocated for the increase in art supplies. Staff has expanded their classroom projects to benefit the students with the additional supplies. Digital photography is being introduced at the middle school level and overall technology continues to be implemented into the arts curriculum.
Professional Development
In 2013-2014 the district continued to provide three in-service days of staff development as well as optional summer workshop opportunities. Staff development also took place in department and faculty meetings, in district study groups, program visitations, and out-of-district workshops. In August 2013, a two-day orientation program for first year teachers, as well as teachers new to the district, provided guidance for new staff. This support continued through New Teacher Roundtable Workshops provided throughout the year.
4) INTERNAL ACCOUNTING CONTROLS: Management of the District is responsible for establishing and maintaining an internal control system designed to ensure that the assets of the District are protected from loss, theft or misuse and to ensure that adequate accounting data is compiled to allow for the preparation of financial statements in conformity with generally accepted accounting principles (GAAP). The internal control system is designed to provide reasonable, but not absolute, assurance that these objectives are met. The concept of reasonable assurance recognizes that: (1) the cost of a control should not exceed the benefits likely to be derived; and (2) the valuation of costs and benefits requires estimates and judgments by management.
As a recipient of federal and state awards, the District also is responsible for ensuring that an adequate internal control system is in place to ensure compliance with applicable laws and regulations related to those programs. This internal control system is also subject to periodic evaluation by the District's management.
Page4
The Honorable President and Members of the Board of Education
Scotch Plains-Fanwood Regional School District Page5 October 21, 2014
4) INTERNAL ACCOUNTJNG CONTROLS: (Cont'd) As part of the District's single audit described earlier, tests are made to determine the adequacy of the internal control, including that portion related to major federal and state award programs, as well as to determine that the District has complied with applicable laws, regulations, contracts and grants.
5) BUDGETARY CONTROLS: In addition to internal accounting controls, the District maintains budgetary controls. The objective of these budgetary controls is to ensure compliance with legal provisions embodied in the annual appropriated budget approved by the voters of the municipality. Annual appropriated budgets are adopted for the general fund, the special revenue fund and the debt service fund. Project length budgets are approved for the capital improvements accounted for in the capital projects fund. The final budget amount as amended for the fiscal year is reflected in the financial section.
An encumbrance accounting system is used to record outstanding purchase commitments on a line item basis. Open encumbrances at year-end are either canceled or are included as reappropriations of fund balance in the subsequent year. Those amounts to be reappropriated are reported as fund balance restrictions, commitments and assignments at June 30, 2014.
6) ACCOUNTJNG SYSTEM AND REPORTS: The District's accounting records reflect generally accepted accounting principles, as promulgated by the GASB. The accounting system of the District is organized on the basis of funds. These funds are explained in "Notes to the Basic Financial Statements", Note 1.
7) CASH MANAGEMENT: The investment policy of the District is guided in large part by state statute as detailed in "Notes to the Basic Financial Statements", Note 3. The District has adopted a cash management plan which requires it to deposit public funds in public depositories protected from loss under the provisions of the Governmental Unit Deposit Protection Act ("GUDPA"). GUDPA was enacted in 1970 to protect governmental units from a loss of funds on deposit with a failed banking institution in New Jersey. The law requires governmental units to deposit public funds only in public depositories located in New Jersey, where the funds are secured in accordance with the Act.
8) RISK MANAGEMENT: The Board carries various forms of insurance, including, but not limited to, general liability, excess liability, automobile liability and comprehensive/collision, hazard and theft insurance on property and contents, and fidelity bonds. A schedule of insurance coverage is found on Exhibit J-20.
The District is a member of the South Bergen Region VII Workers' Compensation Pool (the "Pool"). The Pool is a risk-sharing public entity risk management pool that is both an insured and self-administered group of school districts established for the purpose of providing low-cost insurance coverage to its members. Additional information on the Pool is included in Note 11 to the Basic Financial Statements.
9) OTHER INFORMATION: Independent Audit - State statutes require an annual audit by independent certified public accountants or registered municipal accountants. The accounting firm of Nisivoccia LLP, CPAs, was selected by the Board of Education. In addition to meeting the requirements set forth in state statutes, the audit also was designed to meet the requirements of the Single Audit Act Amendments of 1996 and the related Federal OMB Circular A-133, Audits of States, Local Governments, and Non-Profit Organizations, and New Jersey's OMB Circular 04-04, Single Audit Policy for Recipients of Federal Grants, State Grants and State Aid. The auditors' report on the basic financial statements and specific required supplementary information is included in the financial section of this report. The auditors' reports related specifically to the single audit and Government Auditing Standards are included in the single audit section of this report.
Page 5
The Honorable President and Members of the Board of Education
Scotch Plains-Fanwood Regional School District Page6 October 21, 2014
10) ACKNOWLEDGMENTS: We would like to express our appreciation to the members of the Scotch Plains-Fanwood Regional School Board for their concern in providing fiscal accountability to the citizens and taxpayers of the School District and thereby contributing their full support to the development and maintenance of our financial operation. The preparation of this report could not have been accomplished without the efficient and dedicated services of our business office staff.
Respectfully submitted,
J.&µ1 alt-_ xf .Ja.bd.:rL/lcl~L Deborah S. Saridaki
Superintendent of Schools School Business Administrator/Board Secretary
Page 6
Healtll Services OT/PT
Revised 7 /1/13
Organizational Chart Scotch Plains-Fanwood Public Schools
2013-2014
Business Administrator -Board Secretary
Auditor Board Attomey
Payroll
Technical Support Analyst
Network Coordinator
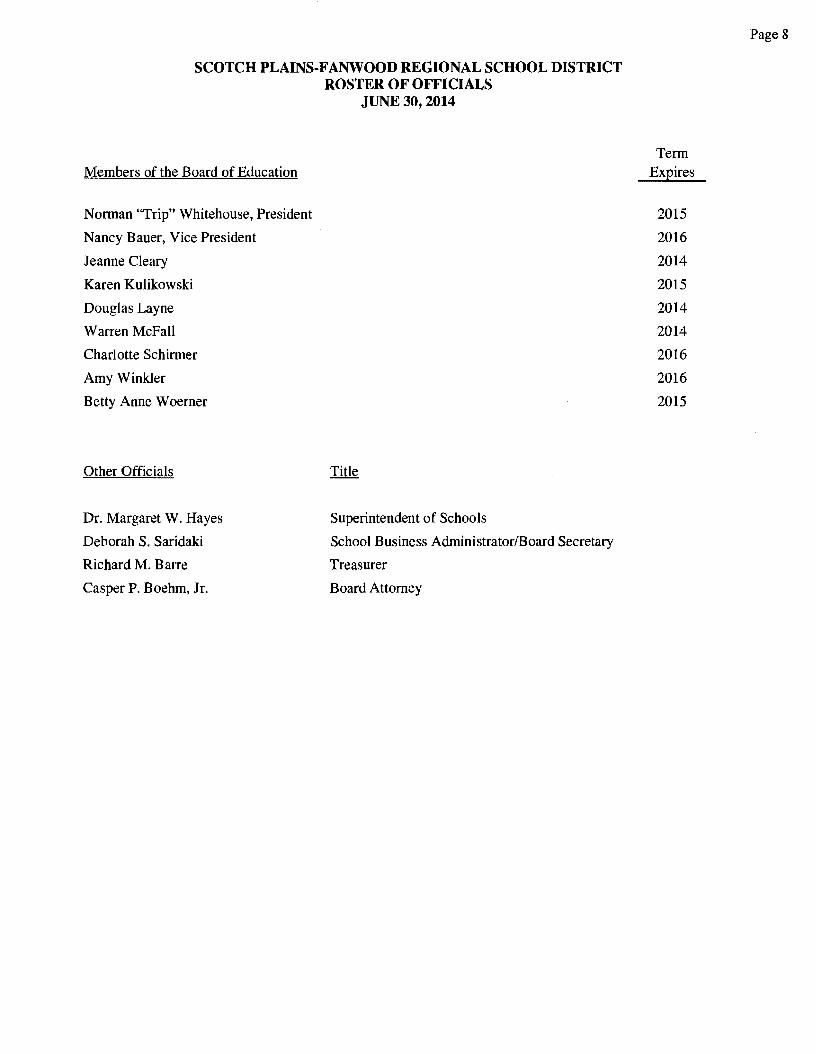
SCOTCH PLAINS-FANWOOD REGIONAL SCHOOL DISTRICT ROSTER OF OFFICIALS
Members of the Board of Education
Nonnan "Trip" Whitehouse, President
Nancy Bauer, Vice President
Jeanne Cleary
Karen Kulikowski
Douglas Layne
Warren McFall
Charlotte Schinner
Amy Winkler
Betty Anne W oemer
Other Officials
Dr. Margaret W. Hayes
Deborah S. Saridaki
Richard M. Barre
Casper P. Boehm, Jr.
JUNE 30, 2014
Superintendent of Schools
School Business Administrator/Board Secretary
Treasurer
Board Attorney
Page8
Tenn Expires
2015
2016
2014
2015
2014
2014
2016
2016
2015
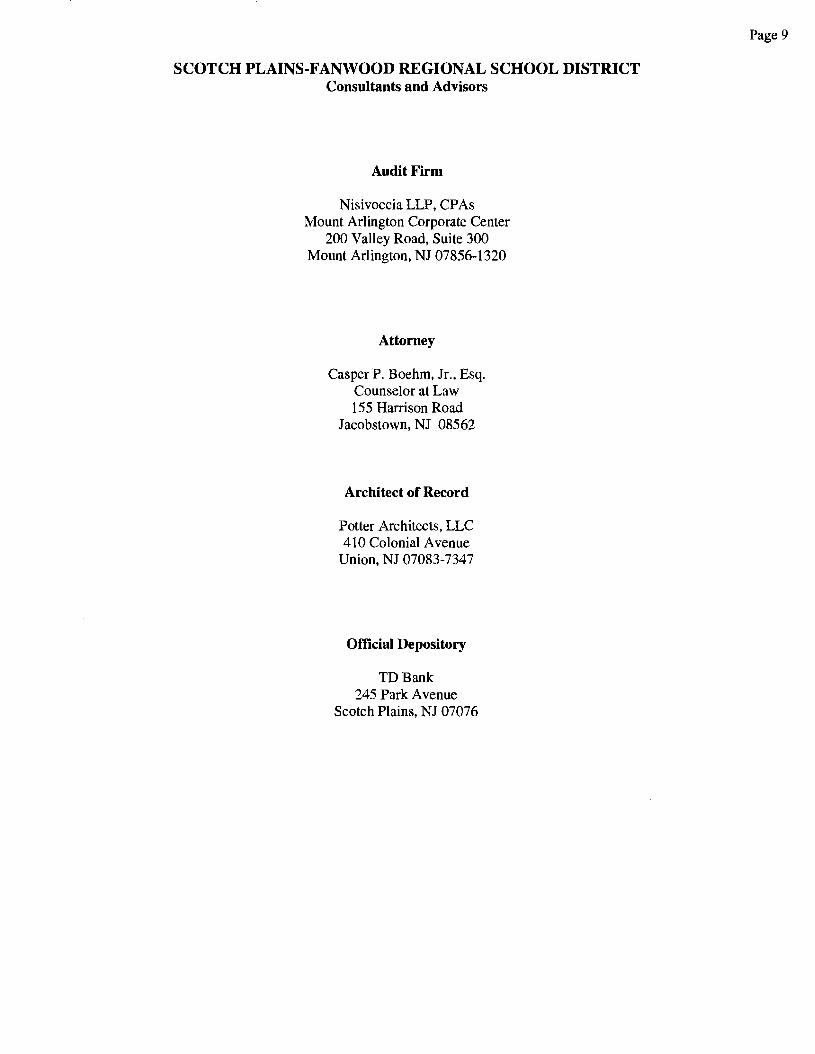
SCOTCH PLAINS-FANWOOD REGIONAL SCHOOL DISTRICT Consultants and Advisors
Audit Firm
Nisivoccia LLP, CPAs Mount Arlington Corporate Center
200 Valley Road, Suite 300 Mount Arlington, NJ 07856-1320
Attorney
Casper P. Boehm, Jr., Esq. Counselor at Law 155 Harrison Road
Jacobstown, NJ 08562
Architect of Record
Potter Architects, LLC 410 Colonial A venue
Union, NJ 07083-7347
Official Depository
TD Bank 245 Park A venue
Scotch Plains, NJ 07076
Page9
Page 10
FINANCIAL SECTION
N I s Iv 0 L c I A LLP Certirled Public Account on ts & Advisors
The Honorable President and Members of the Board of Education
Independent Auditors' Report
Scotch Plains-Fanwood Regional School District County of Union, New Jersey
Report on the Financial Statements
Mount Arlington Corporate Center 200 Valley Road, Suite 300
Mt. Arlington, NJ 07856 973-328-1825 I 973-328-0507 Fax
Lawrence Business Center 11 Lawrence Road Newton, NJ 07860
973-383-6699 I 973·383-6555 Fax
We have audited the accompanying financial statements of the governmental activities, the business-type activities, each major fund, and the aggregate remaining fund information of the Scotch Plains/Fanwood Regional Board of Education (the "District") in the County of Union, as of and for the fiscal year ended June 30, 2014, and the related notes to the financial statements, which collectively comprise the District's basic financial statements as listed in the table of contents.
Management's Responsibility for the Financial Statements
Management is responsible for the preparation and fair presentation of these financial statements in accordance with accounting principles generally accepted in the United States of America; this includes the design, implementation, and maintenance of internal control relevant to the preparation and fair presentation of financial statements that are free from material misstatement, whether due to fraud or error.
Auditors' Responsibility
Our responsibility is to express opinions on these financial statements based on our audit. We conducted our audit in accordance with auditing standards generally accepted in the United States of America, the standards applicable to financial audits contained in Government Auditing Standards, issued by the Comptroller General of the United States, and audit requirements as prescribed by the Office of School Finance, Department of Education, State of New Jersey. Those standards require that we plan and perform the audit to obtain reasonable assurance about whether the financial statements are free from material misstatement.
An audit involves performing procedures to obtain audit evidence about the amounts and disclosures in the financial statements. The procedures selected depend on the auditor's judgment, including the assessment of the risks of material misstatement of the financial statements, whether due to fraud or error. In making those risk assessments, the auditor considers internal control relevant to the District's preparation and fair presentation of the financial statements in order to design audit procedures that are appropriate in the circumstances, but not for the purpose of expressing an opinion on the effectiveness of the District's internal control. Accordingly, we express no such opinion. An audit also includes evaluating the appropriateness of accounting policies used and the reasonableness of significant accounting estimates made by management, as well as evaluating the overall presentation of the financial statements.
We believe that the audit evidence we have obtained is sufficient and appropriate to provide a basis for our audit opinions.
www.nisivoccia.com Independent Member of BKR International
Page 11
The Honorable President and Members of the Board of Education Scotch Plains-Fanwood Regional School District Page2
Opinions
In our opinion, the financial statements referred to above present fairly, in all material respects, the respective financial position of the governmental activities, the business-type activities, each major fund, and the aggregate remaining fund information of the Scotch Plains/Fanwood Regional Board of Education, in the County of Union, as of June 30, 2014, and the respective changes in financial position and, where applicable, cash flows thereof for the fiscal year then ended in accordance with accounting principles generally accepted in the United States of America.
Other Matters
Required Supplementary Information
Accounting principles generally accepted in the United States of America require that the management's discussion and analysis and post-retirement benefits funding progress, which follow this report, and the budgetary comparison information in Exhibits C-1 through C-3 and I-3 be presented to supplement the basic financial statements. Such information, although not a part of the basic financial statements, is required by the Governmental Accounting Standards Board who considers it to be an essential part of financial reporting for placing the basic financial statements in an appropriate operational, economic, or historical context. We have applied certain limited procedures to the required supplementary information in accordance with auditing standards generally accepted in the United States of America, which consisted of inquiries of management about the methods of preparing the information and comparing the information for consistency with management's responses to our inquiries, the basic financial statements, and other knowledge we obtained during our audit of the basic financial statements. We do not express an opinion or provide any assurance on the information because the limited procedures do not provide us with sufficient evidence to express an opinion or provide any assurance.
Other Information
Our audit was conducted for the purpose of forming opinions on the financial statements that collectively comprise the District's basic financial statements. The accompanying supplementary information such as the combining and individual non-major fund financial statements are presented for purposes of additional analysis and are not a required part of the basic financial statements. The accompanying schedules of expenditures of federal and state awards, as required by the U. S. Office of Management and Budget Circular A-133, Audits of States, Local Governments, and Non-Profit Organizations; and New Jersey's OMB Circular 04-04, Single Audit Policy for Recipients of Federal Grants, State Grants and State Aid, are also presented for purposes of additional analysis and are not a required part of the basic financial statements.
The accompanying supplementary schedules such as the combining and individual non-major fund financial statements and the schedules of expenditures of federal and state awards are the responsibility of management and were derived from and relate directly to the underlying accounting and other records used to prepare the basic financial statements. Such information has been subjected to the auditing procedures applied in the audit of the basic financial statements and certain additional procedures, including comparing and reconciling such information directly to the underlying accounting and other records used to prepare the basic financial statements or to the basic financial statements themselves, and other additional procedures in accordance with auditing standards generally accepted in the United States of America. In our opinion, the supplementary schedules and the schedules of expenditures of federal and state awards are fairly stated, in all material respects, in relation to the basic financial statements as a whole.
Page 12
The Honorable President and Members of the Board of Education
Scotch Plains-Fanwood Regional School District Page3
The accompanying other information such as the introductory and statistical sections has not been subjected to the auditing procedures applied in the audit of the basic financial statements, and accordingly, we do not express an opinion or provide any assurance on it.
Other Reporting Required by Government Auditing Standards
In accordance with Government Auditing Standards, we have also issued our report dated October 21, 2014 on our consideration of the District's internal control over financial reporting and on our tests of its compliance with certain provisions of laws, regulations, contracts, and grant agreements and other matters. The purpose of that report is to describe the scope of our testing of internal control over financial reporting and compliance and the results of that testing, and not to provide an opinion on internal control over financial reporting or on compliance. That report is an integral part of an audit performed in accordance with Government Auditing Standards in considering the District's internal control over financial reporting and compliance.
Mount Arlington, New Jersey October 21, 2014
NISIVOCCIA LLP
Heidi A. Wohlleb \ Licensed Public School Accountant #2140 Certified Public Accountant
Page 13
REQUIRED SUPPLEMENTARY INFORMATION MANAGEMENT'S DISCUSSION AND ANALYSIS
Page 14
Scotch Plains-Fanwood Regional School District Management's Discussion and Analysis For the Fiscal Year Ended June 30, 2014
(Unaudited)
This section of Scotch Plains-Fanwood Regional School District's annual financial report presents its discussion and analysis of the District's financial performance during the fiscal year ending June 30, 2014. Please read it in conjunction with the transmittal letter at the front of this report and the District's basic financial statements, which immediately follow this section.
Financial Highlights
• The District's financial status remains strong and improved significantly on a District-wide basis and on a fund basis.
• Overall revenue was $92.5 million on a District-wide basis. • District enrollment and the cost per pupil both decreased slightly.
Overview of the Financial Statements
This annual report consists of three parts: management's discussion and analysis (this section), the basic financial statements, and required supplementary information. The basic financial statements include two kinds of statements that present different views of the District:
• The first two statements are District-wide financial statements that provide both short-term and longterm information about the District's overall financial status.
• The remaining statements are fund financial statements that focus on individual parts of the District, reporting the District's operations in more detail than the District-wide statements.
• The governmental funds statements tell how basic services such as regular and special education were financed in the short-term as well as what remains for future spending.
• Proprietary funds statements offer short- and long-term financial information about the activities the District operates like a business, such as food service and summer community education programs.
• Fiduciary funds statements provide information about the financial relationships in which the District acts solely as a trustee or agent for the benefit of others.
The financial statements also include notes that explain some of the information in the statements and provide more detailed data. The statements are followed by a section of required supplementary information that further explains and supports the financial statements with a comparison of the District's budget for the year. Figure A-1 shows how the various parts of this annual report are arranged and related to one another.
Page 15
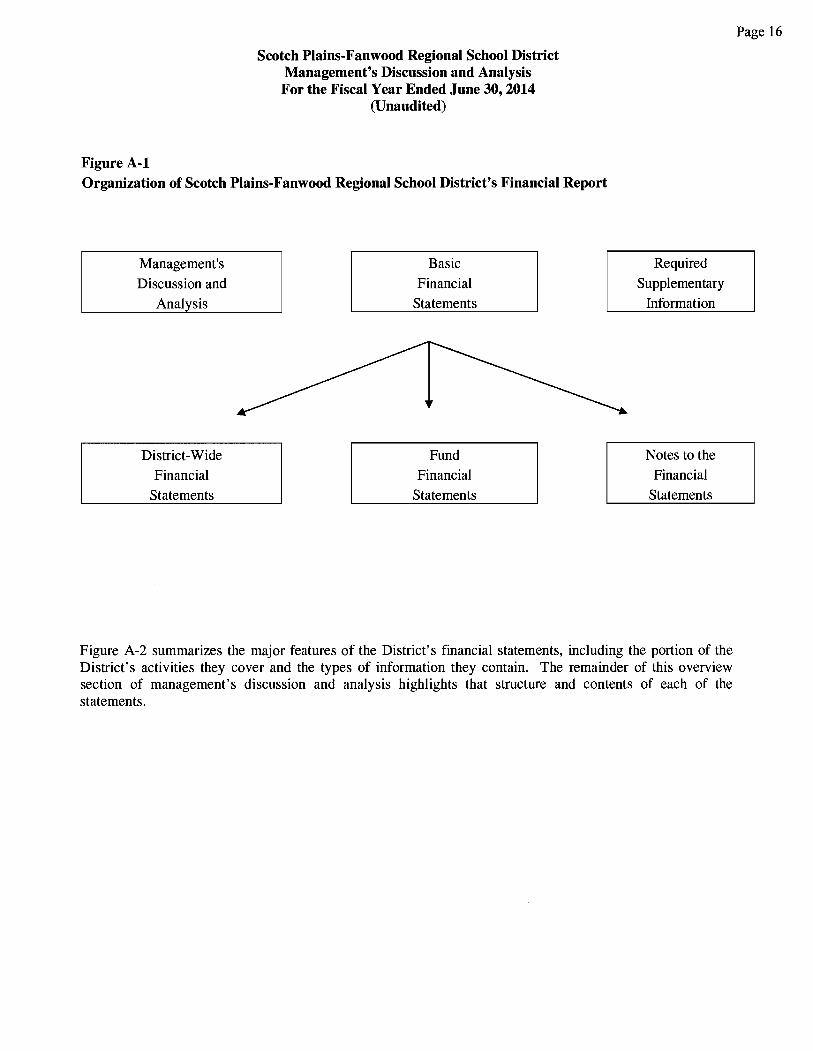
Figure A-1
Scotch Plains-Fanwood Regional School District Management's Discussion and Analysis
For the Fiscal Year Ended June 30, 2014 (Unaudited)
Organization of Scotch Plains-Fanwood Regional School District's Financial Report
Management's
Discussion and Analysis
District-Wide Financial
Statements
Basic Financial
Statements
Fund
Financial Statements
Required
Supplementary Information
Notes to the Financial
Statements
Figure A-2 summarizes the major features of the District's financial statements, including the portion of the District's activities they cover and the types of information they contain. The remainder of this overview section of management's discussion and analysis highlights that structure and contents of each of the statements.
Page 16
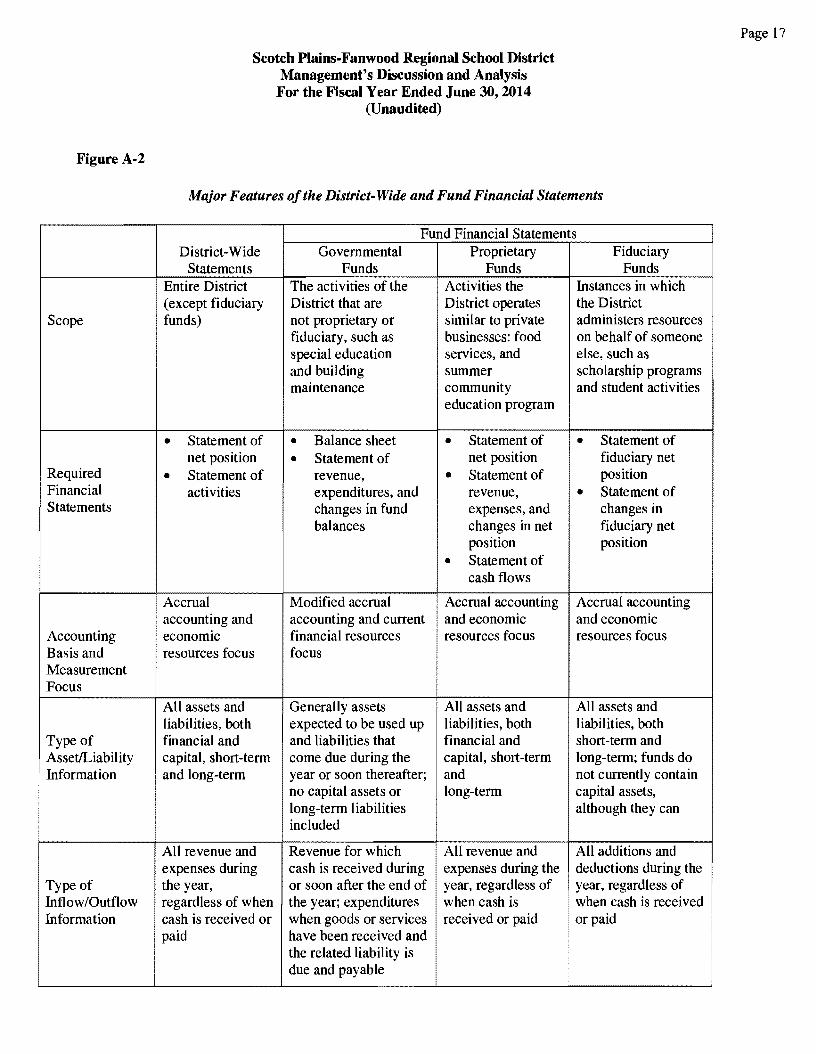
Figure A-2
Scope
Required Financial Statements
Accounting Basis and Measurement Focus
Type of Asset/Liability Information
Type of Inflow/Outflow Information
Scotch Plains-Fanwood Regional School District Management's Discussion and Analysis
For the Fiscal Year Ended June 30, 2014 (Unaudited)
Major Features of the District· Wide and Fund Financial Statements
Fund Financial Statements District-Wide Governmental Proprietary Fiduciary
Statements Funds Funds Funds Entire District The activities of the Activities the Instances in which (except fiduciary District that are District operates the District funds) not proprietary or similar to private administers resources
fiduciary, such as businesses: food on behalf of someone special education services, and else, such as and building summer scholarship programs maintenance community and student activities
education program
• Statement of • Balance sheet • Statement of • Statement of net position • Statement of net position fiduciary net
• Statement of revenue, • Statement of position activities expenditures, and revenue, • Statement of
changes in fund expenses, and changes in balances changes in net fiduciary net
position position
• Statement of cash flows
Accrual Modified accrual Accrual accounting Accrual accounting accounting and accounting and current and economic and economic economic financial resources resources focus resources focus resources focus focus
Al I assets and Generally assets All assets and All assets and liabilities, both expected to be used up liabilities, both liabilities, both financial and and liabilities that financial and short-term and capital, short-term come due during the capital, short-term long-term; funds do and long-term year or soon thereafter; and not currently contain
no capital assets or long-term capital assets, long-term liabilities although they can included
All revenue and Revenue for which All revenue and All additions and expenses during cash is received during expenses during the deductions during the the year, or soon after the end of year, regardless of year, regardless of regardless of when the year; expenditures when cash is when cash is received cash is received or when goods or services received or paid or paid paid have been received and
the related liability is due and payable
Page 17
.
District-wide Statements
Scotch Plains-Fanwood Regional School District Management's Discussion and Analysis For the Fiscal Year Ended June 30, 2014
(Unaudited)
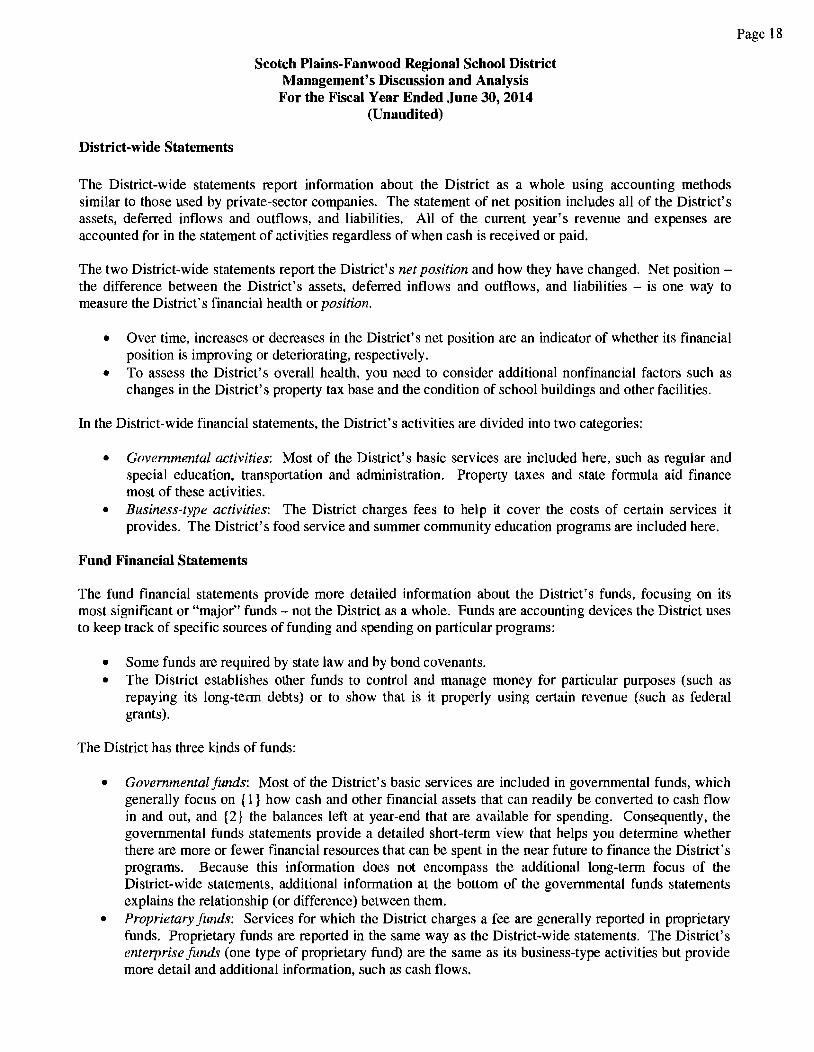
The District-wide statements report information about the District as a whole using accounting methods similar to those used by private-sector companies. The statement of net position includes all of the District's assets, deferred inflows and outflows, and liabilities. All of the current year's revenue and expenses are accounted for in the statement of activities regardless of when cash is received or paid.
The two District-wide statements report the District's net position and how they have changed. Net position -the difference between the District's assets, deferred inflows and outflows, and liabilities is one way to measure the District's financial health or position.
• Over time, increases or decreases in the District's net position are an indicator of whether its financial position is improving or deteriorating, respectively.
• To assess the District's overall health, you need to consider additional nonfinancial factors such as changes in the District's property tax base and the condition of school buildings and other facilities.
In the District-wide financial statements, the District's activities are divided into two categories:
• Governmental activities: Most of the District's basic services are included here, such as regular and special education, transportation and administration. Property taxes and state formula aid finance most of these activities.
• Business-type activities: The District charges fees to help it cover the costs of certain services it provides. The District's food service and summer community education programs are included here.
Fund Financial Statements
The fund financial statements provide more detailed information about the District's funds, focusing on its most significant or "major" funds not the District as a whole. Funds are accounting devices the District uses to keep track of specific sources of funding and spending on particular programs:
• Some funds are required by state law and by bond covenants. • The District establishes other funds to control and manage money for particular purposes (such as
repaying its long-term debts) or to show that is it properly using certain revenue (such as federal grants).
The District has three kinds of funds:
• Governmental funds: Most of the District's basic services are included in governmental funds, which generally focus on { 1 } how cash and other financial assets that can readily be converted to cash flow in and out, and { 2} the balances left at year-end that are available for spending. Consequently, the governmental funds statements provide a detailed short-term view that helps you determine whether there are more or fewer financial resources that can be spent in the near future to finance the District's programs. Because this information does not encompass the additional long-term focus of the District-wide statements, additional information at the bottom of the governmental funds statements explains the relationship (or difference) between them.
• Proprietary funds: Services for which the District charges a fee are generally reported in proprietary funds. Proprietary funds are reported in the same way as the District-wide statements. The District's enterprise funds (one type of proprietary fund) are the same as its business-type activities but provide more detail and additional information, such as cash flows.
Page 18
Fund Financial Statements
Scotch Plains-Fanwood Regional School District Management's Discussion and Analysis For the Fiscal Year Ended June 30, 2014
(Unaudited)
• Fiduciary funds: The District is the trustee, or fiduciary, for assets that belong to others, such as scholarship funds and the student activities funds. The District is responsible for ensuring that the assets reported in these funds are used only for their intended purposes and by those to whom the assets belong. The District excludes these activities from the District-wide financial statements because it cannot use these assets to finance its operations.
Notes to the basic financial statements: The notes provide additional information that is essential to a full understanding of the data provided in the District-wide and fund financial statements. The notes to the basic financial statements can be found immediately following the fund financial statements.
Financial Analysis of the District as a Whole
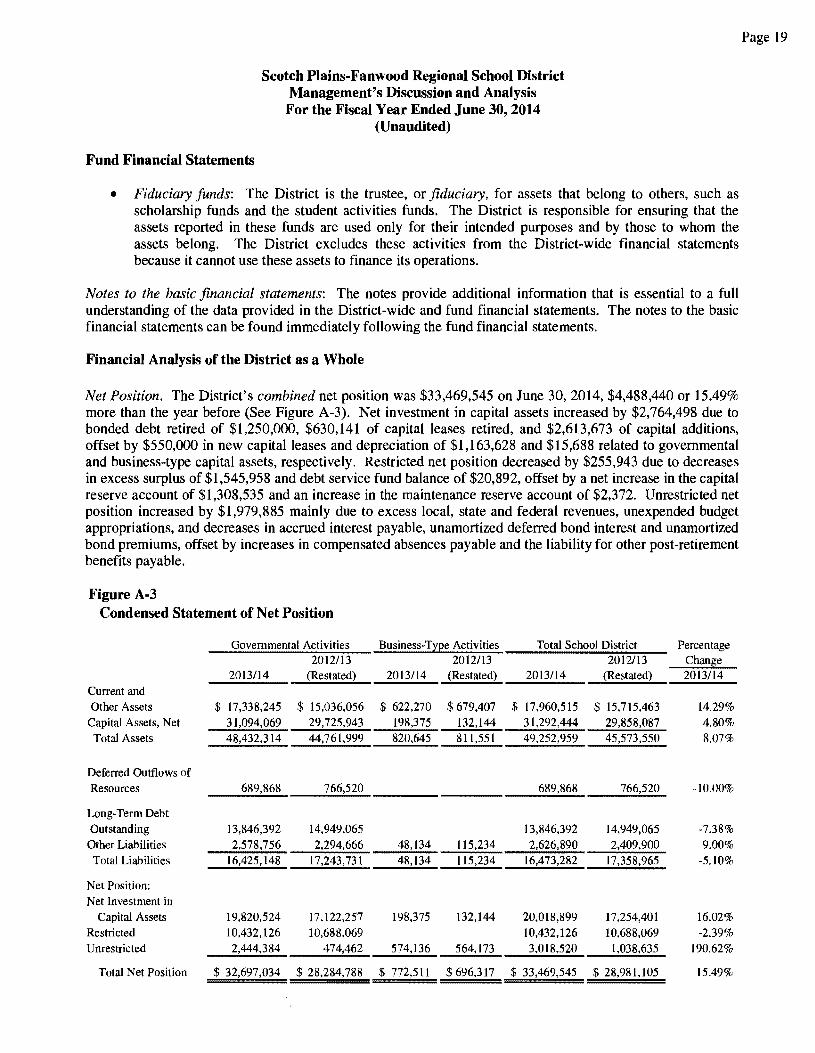
Net Position. The District's combined net position was $33,469,545 on June 30, 2014, $4,488,440 or 15.49% more than the year before (See Figure A-3). Net investment in capital assets increased by $2,764,498 due to bonded debt retired of $1,250,000, $630,141 of capital leases retired, and $2,613,673 of capital additions, offset by $550,000 in new capital leases and depreciation of $1,163,628 and $15,688 related to governmental and business-type capital assets, respectively. Restricted net position decreased by $255,943 due to decreases in excess surplus of $1,545,958 and debt service fund balance of $20,892, offset by a net increase in the capital reserve account of $1,308,535 and an increase in the maintenance reserve account of $2,372. Unrestricted net position increased by $1,979,885 mainly due to excess local, state and federal revenues, unexpended budget appropriations, and decreases in accrued interest payable, unamortized deferred bond interest and unamortized bond premiums, offset by increases in compensated absences payable and the liability for other post-retirement benefits payable.
Figure A-3 Condensed Statement of Net Position
Governmental Activities Business-Ty2e Activities Total School District Percentage 2012113 2012/13 2012/13 Chan!i"ie
2013/14 (Restated) 2013/14 (Restated) 2013/14 (Restated) 2013/14 Current and Other Assets $ 17,338.245 $ 15,036,056 $ 622,270 $ 679,407 $ 17,960,515 $ 15,715,463 14.29%
Capital Assets, Net 31,094,069 29,725,943 198,375 132,144 31,292,444 29,858,087 4.80% Total Assets 48,432,314 44,761,999 820,645 811,551 49,252,959 45,573,550 8.07%
Deferred Outflows of Resources 689,868 766,520 689,868 766,520 -10.00%
Long-Term Debt Outstanding 13,846,392 14,949,065 13,846,392 14,949,065 -7.38%
Other Liabilities 2,578,756 2,294,666 48,134 115,234 2,626,890 2,409,900 9.00% Total Liabilities 16,425, 148 17,243,731 48,134 115,234 16,473,282 17,358,965 -5.10%
Net Position: Net Investment in
Capital Assets 19,820,524 17,122,257 198,375 132,144 20,018.899 17,254,401 16.02% Restricted 10,432,126 10,688,069 10,432,126 10,688,069 -2.39% Unrestricted 2,444,384 474,462 574,136 564,173 3,018,520 1,038,635 190.62%
Total Net Position $ 32,697,034 $ 28,284,788 $ 772,511 $ 696,317 $ 33,469,545 $ 28,981,105 15.49%
Page 19
Scotch Plains-Fanwood Regional School District Management's Discussion and Analysis
For the Fiscal Year Ended June 30, 2014 (Unaudited)
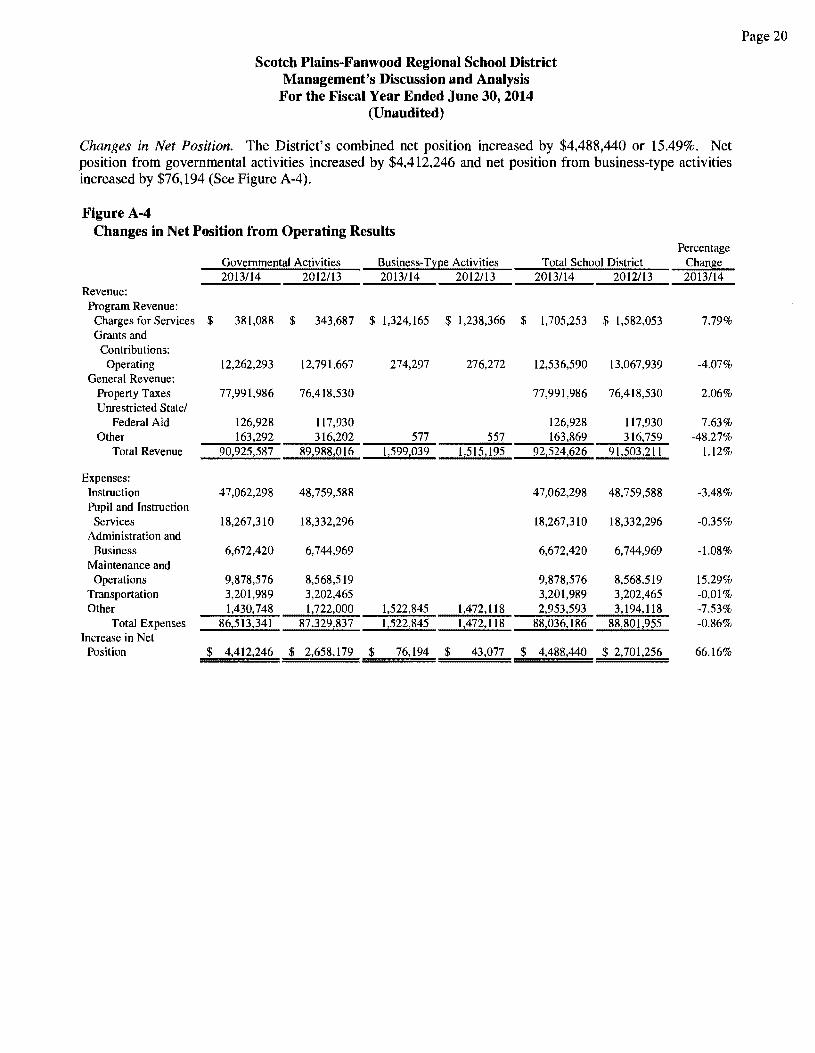
Changes in Net Position. The District's combined net position increased by $4,488,440 or 15.49%. Net position from governmental activities increased by $4,412,246 and net position from business-type activities increased by $76,194 (See Figure A-4).
Figure A-4 Changes in Net Position from Operating Results
Percentage Governmental Activities Business-T;i::ee Activities Total School District Chan~e 2013/14 2012/13 2013/14 2012/13 2013/14 2012/13 2013/14
Revenue: Program Revenue:
Charges for Services $ 381,088 $ 343,687 $ 1,324,165 $ 1,238,366 $ 1,705,253 $ 1,582,053 7.79% Grants and
Contributions: Operating 12,262,293 12,791,667 274,297 276,272 12,536,590 13,067,939 -4.07%
General Revenue: Property Taxes 77,991,986 76,418,530 77,991,986 76,418,530 2.06% Unrestricted State/
Federal Aid 126,928 117,930 126,928 117,930 7.63% Other 163,292 316,202 577 557 163,869 316,759 -48.27%
Total Revenue 90,925,587 89,988,016 1,599,039 1,515,195 92,524,626 91,503,211 1.12%
Expenses: Instruction 47,062,298 48,759,588 47,062,298 48,759,588 -3.48% Pupil and Instruction Services 18,267,310 18,332,296 18,267,310 18,332,296 -0.35%
Administration and Business 6,672,420 6,744,969 6,672,420 6,744,969 -1.08%
Maintenance and Operations 9,878,576 8,568,519 9,878,576 8,568,519 15.29%
Transportation 3,201,989 3,202,465 3,201,989 3,202,465 -0.01% Other 1,430,748 1,722,000 1,522,845 1,472,118 2,953,593 3,194,118 -7.53%
Total Expenses 86,513,341 87,329,837 1,522,845 1,472,118 88,036,186 88,801,955 -0.86% Increase in Net
Position $ 4,412,246 $ 2,658,179 $ 76,194 $ 43,077 $ 4,488,440 $ 2,701,256 66.16%
Page 20
Scotch Plains-Fanwood Regional School District Management's Discussion and Analysis
For the Fiscal Year Ended June 30, 2014 (Unaudited)
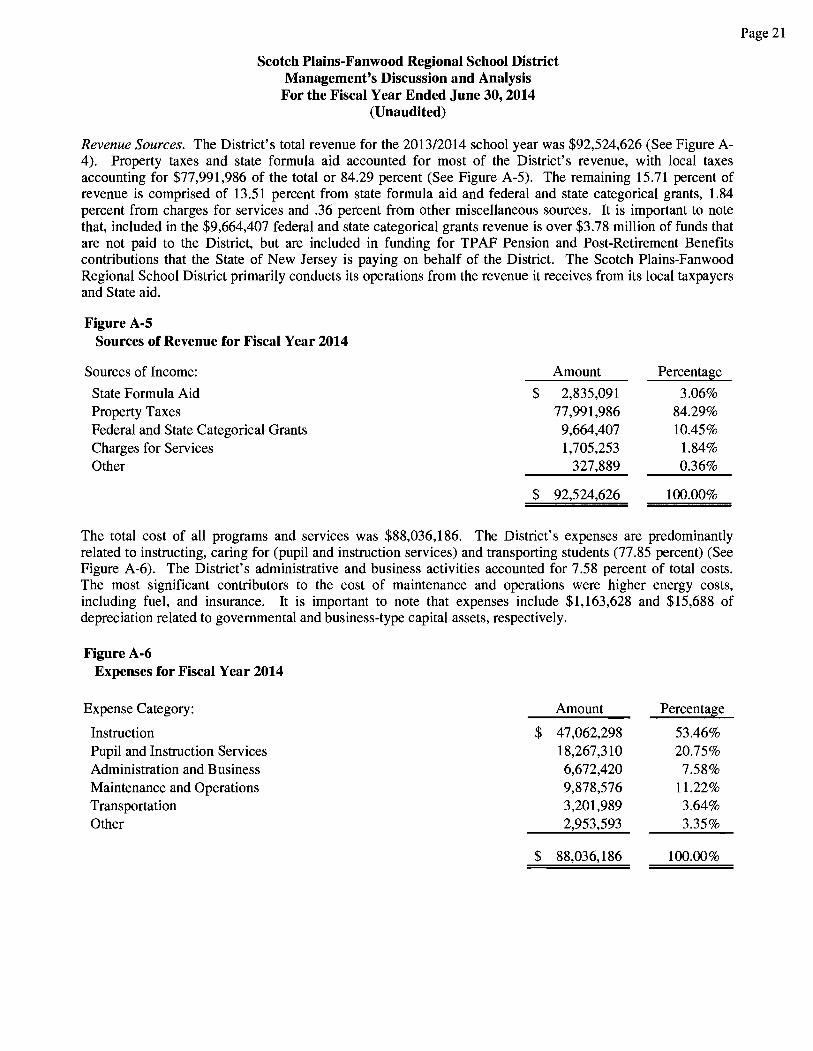
Revenue Sources. The District's total revenue for the 2013/2014 school year was $92,524,626 (See Figure A-4 ). Property taxes and state formula aid accounted for most of the District's revenue, with local taxes accounting for $77,991,986 of the total or 84.29 percent (See Figure A-5). The remaining 15.71 percent of revenue is comprised of 13 .51 percent from state formula aid and federal and state categorical grants, 1.84 percent from charges for services and .36 percent from other miscellaneous sources. It is important to note that, included in the $9,664,407 federal and state categorical grants revenue is over $3.78 million of funds that are not paid to the District, but are included in funding for TPAF Pension and Post-Retirement Benefits contributions that the State of New Jersey is paying on behalf of the District. The Scotch Plains-Fanwood Regional School District primarily conducts its operations from the revenue it receives from its local taxpayers and State aid.
Figure A-5 Sources of Revenue for Fiscal Year 2014
Sources of Income: Amount PercentaBe
State Formula Aid $ 2,835,091 3.06% Property Taxes 77,991,986 84.29% Federal and State Categorical Grants 9,664,407 10.45% Charges for Services 1,705,253 1.84% Other 327,889 0.36%
$ 92,524,626 100.00%
The total cost of all programs and services was $88,036, 186. The District's expenses are predominantly related to instructing, caring for (pupil and instruction services) and transporting students (77.85 percent) (See Figure A-6). The District's administrative and business activities accounted for 7.58 percent of total costs. The most significant contributors to the cost of maintenance and operations were higher energy costs, including fuel, and insurance. It is important to note that expenses include $1,163,628 and $15,688 of depreciation related to governmental and business-type capital assets, respectively.
Figure A-6 Expenses for Fiscal Year 2014
Expense Category: Amount PercentaBe
Instruction $ 47,062,298 53.46% Pupil and Instruction Services 18,267,310 20.75% Administration and Business 6,672,420 7.58% Maintenance and Operations 9,878,576 11.22% Transportation 3,201,989 3.64% Other 2,953,593 3.35%
$ 88,036,186 100.00%
Page 21
Scotch Plains-Fanwood Regional School District Management's Discussion and Analysis
Governmental Activities
For the Fiscal Year Ended June 30, 2014 (Unaudited)
The financial position of the District improved significantly. However, maintaining existing programs with increased enrollment, the provision of a multitude of special programs/services for disabled pupils and the cost of employee benefits place a great demand on the District's resources. As a result, careful management of expenses remains essential for the District to sustain its financial health.
It is crucial that the District monitor its expenses carefully. Increasing parental and student demands for new activities and programs must be evaluated thoroughly.
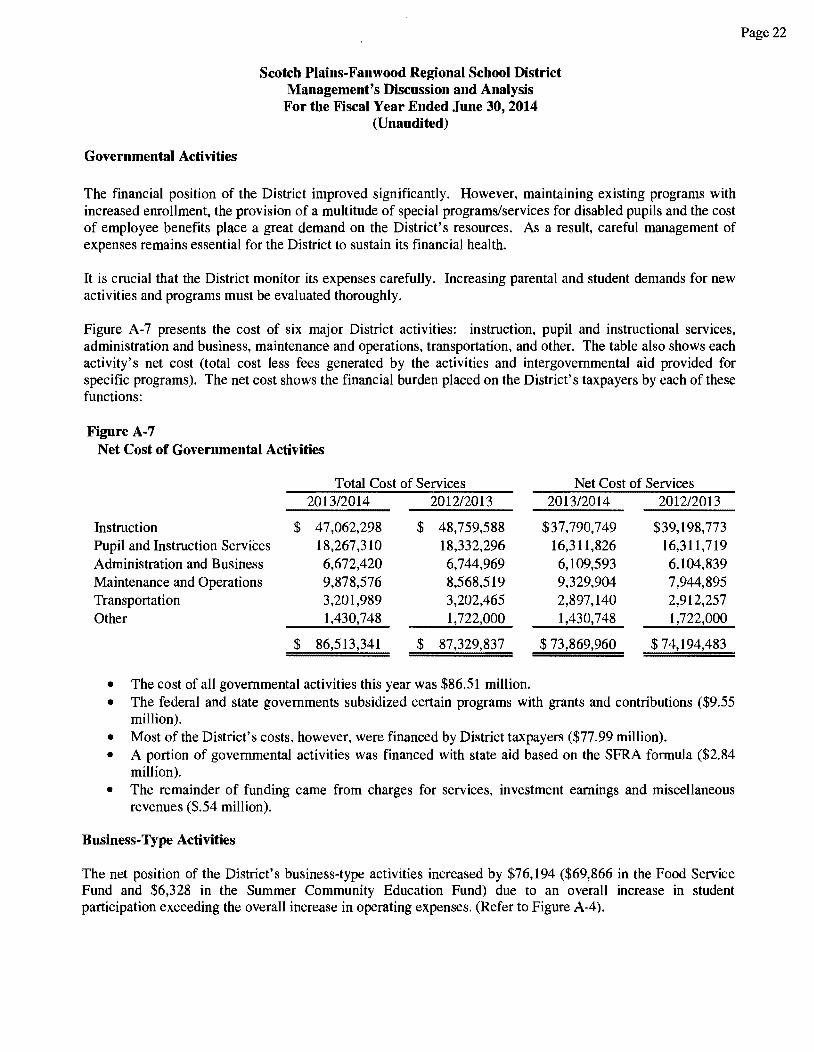
Figure A-7 presents the cost of six major District activities: instruction, pupil and instructional services, administration and business, maintenance and operations, transportation, and other. The table also shows each activity's net cost (total cost less fees generated by the activities and intergovernmental aid provided for specific programs). The net cost shows the financial burden placed on the District's taxpayers by each of these functions:
Figure A-7 Net Cost of Governmental Activities
Instruction Pupil and Instruction Serviees Administration and Business Maintenance and Operations Transportation Other
Total Cost of Services 2013/2014 2012/2013
$ 47,062,298 18,267,310 6,672,420 9,878,576 3,201,989 1,430,748
$ 86,513,341
$ 48,759,588 18,332,296 6,744,969 8,568,519 3,202,465 1,722,000
$ 87,329,837
• The cost of all governmental activities this year was $86.51 million.
Net Cost of Services 2013/2014 2012/2013
$37,790,749 $39,198,773 16,311,826 16,311,719 6, 109,593 6, 104,839 9,329,904 7,944,895 2,897,140 2,912,257 1,430,748 1,722,000
$ 73,869,960 $ 74,194,483
• The federal and state governments subsidized certain programs with grants and contributions ($9.55 million).
• Most of the District's costs, however, were financed by District taxpayers ($77.99 million). • A portion of governmental activities was financed with state aid based on the SFRA formula ($2.84
million). • The remainder of funding came from charges for services, investment earnings and miscellaneous
revenues ($.54 million).
Business-Type Activities
The net position of the District's business-type activities increased by $76, 194 ($69,866 in the Food Service Fund and $6,328 in the Summer Community Education Fund) due to an overall increase in student participation exceeding the overall increase in operating expenses. (Refer to Figure A-4).
Page22
Scotch Plains-Fanwood Regional School District Management's Discussion and Analysis
For the Fiscal Year Ended June 30, 2014 (Unaudited)
Financial Analysis of the District's Funds
The District's financial condition increased significantly despite the difficult economic times. Interest from investments increased slightly during the current fiscal year. The District has had a multi-year practice of utilizing funds from the General Fund unassigned fund balance to both reduce the tax levy as well as invest in the maintenance of District facilities. As overall revenue for the District diminishes, the amount of funds generated for this purpose decreases. Ratables of the municipalities remain more or less stable, thus generating concern for the impact on the local taxpayers in the future.
All of these factors are likely to continue for the near future. To maintain a stable financial position, the District must continue to practice sound fiscal management.
General Fund Budgetary Highlights
Over the course of the year, the District revised the annual operating budget several times. These budget amendments were for changes made within budgetary line items for changes in school-based needs for programs, supplies and equipment.
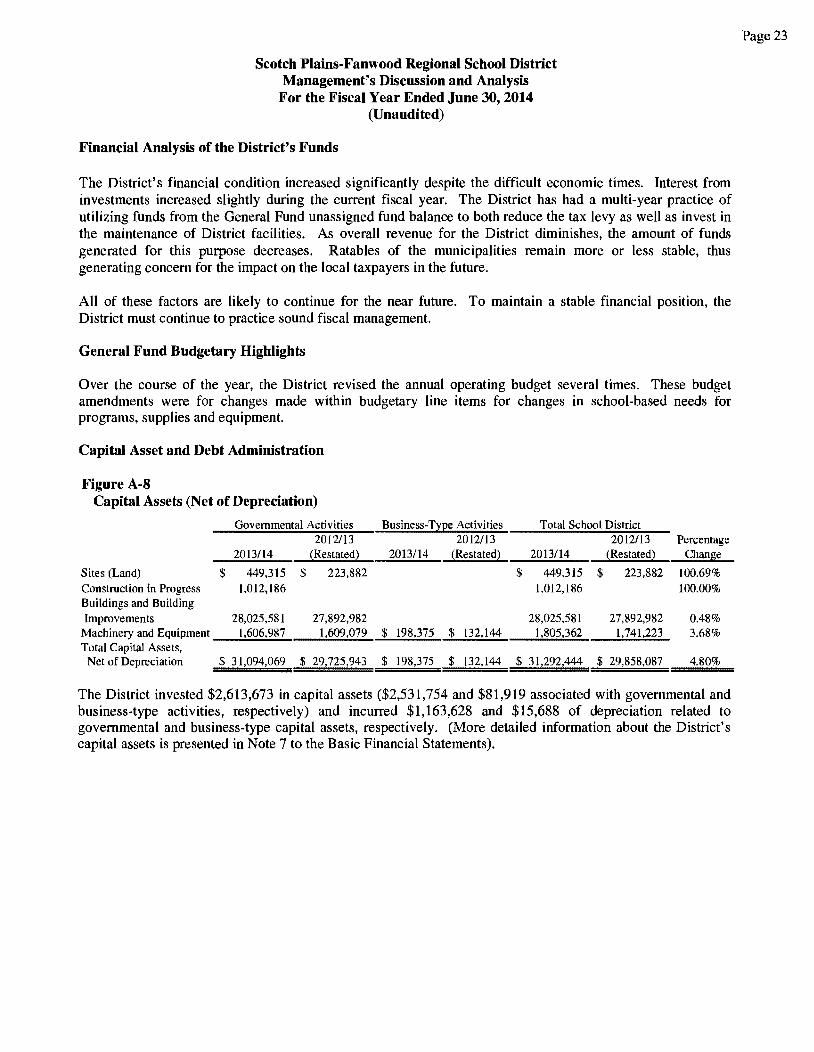
Capital Asset and Debt Administration
Figure A-8 Capital Assets (Net of Depreciation)
Governmental Activities Business-Type Activities __ T.;...o;...ta..;..l...;.S_ch...;oo...;._I D_ist_ri..;..ct __ 2012/13 2012/13 2012/13 Percentage
Sites (Land) Construction in Progress Buildings and Building
2013/14 (Restated) _2_0_13_/_14 _ _._(R_.e_st_at_ed_.)_ 2013/14 (Restated)
$ 449,315 $ 223,882 $ 449,315 $ 223,882 l,012,186 1,012,186
Change
100.69% 100.00%
Improvements 28,025,581 27,892,982 28,025,581 27,892,982 0.48% 3.68% Machinery and Equipment _ __..1,6_0_6_,9_87 ___ ..;..l ,:.;.609.;;.;;..,., 0.;;..7..;..9 __ ;;;..$ ...;l;;.;.9..;;.8.:.;;;,3.;...75;;...._..;..$_..;;.13;;.;;2;;.;.,1;;..;44'"'-_ _..;;.l ,:.;.80 .... 5_.,3;..;6;.;;;;..2 _ __..I, 7_4_1,_,2_23_
Total Capital Assets, Net of Depreciation $ 31,094,069 $ 29,725,943 $ 198,375 $ 132,144 $ 31,292,444 $ 29,858,087 4.80%
===================== The District invested $2,613,673 in capital assets ($2,531,754 and $81,919 associated with governmental and business-type activities, respectively) and incurred $1,163,628 and $15,688 of depreciation related to governmental and business-type capital assets, respectively. (More detailed information about the District's capital assets is presented in Note 7 to the Basic Financial Statements).
Page 23
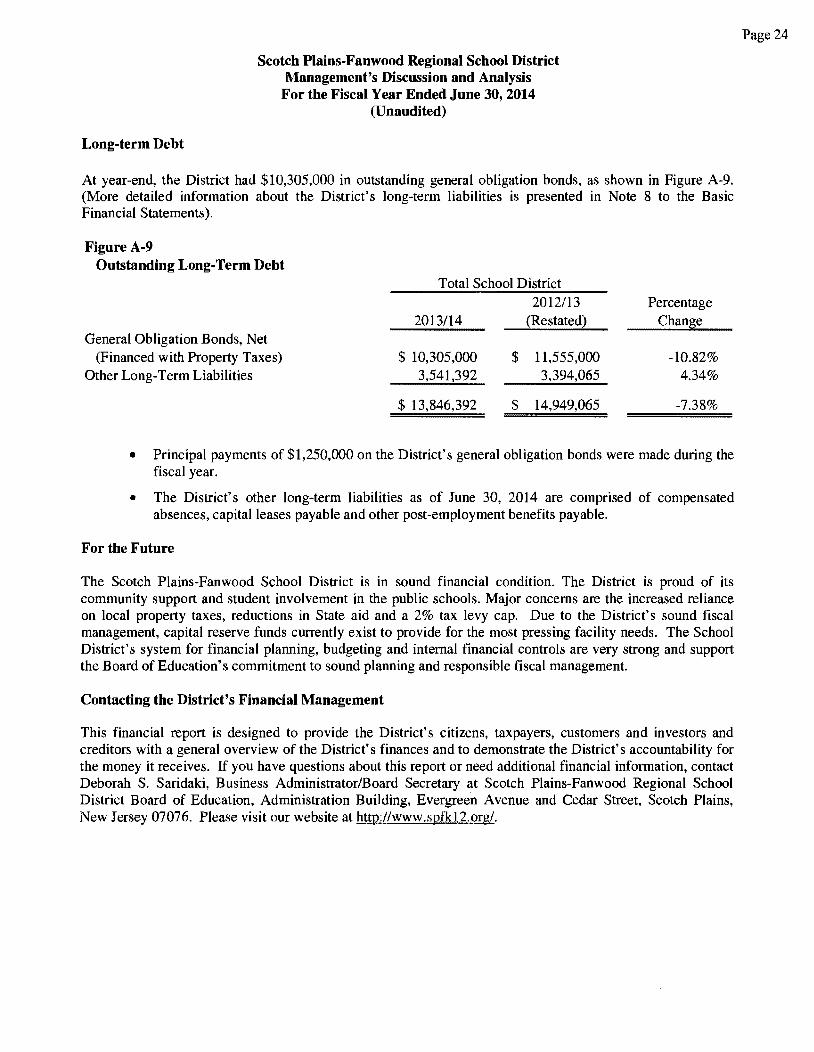
Long-term Debt
Scotch Plains-Fanwood Regional School District Management's Discussion and Analysis
For the Fiscal Year Ended June 30, 2014 (Unaudited)
At year-end, the District had $10,305,000 in outstanding general obligation bonds, as shown in Figure A-9. (More detailed infonnation about the District's long-tenn liabilities is presented in Note 8 to the Basic Financial Statements).
Figure A-9 Outstanding Long-Term Debt
Total School District 2012/13 Percentage
2013/14 (Restated) Chan~e
General Obligation Bonds, Net (Financed with Property Taxes) $ 10,305,000 $ 11,555,000 -10.82%
Other Long-Tenn Liabilities 3,541,392 3,394,065 4.34%
$ 13,846,392 $ 14,949,065 -7.38%
• Principal payments of $1,250,000 on the District's general obligation bonds were made during the fiscal year.
• The District's other long-tenn liabilities as of June 30, 2014 are comprised of compensated absences, capital leases payable and other post-employment benefits payable.
For the Future
The Scotch Plains-Fanwood School District is in sound financial condition. The District is proud of its community support and student involvement in the public schools. Major concerns are the increased reliance on local property taxes, reductions in State aid and a 2% tax levy cap. Due to the District's sound fiscal management, capital reserve funds currently exist to provide for the most pressing facility needs. The School District's system for financial planning, budgeting and internal financial controls are very strong and support the Board of Education's commitment to sound planning and responsible fiscal management.
Contacting the District's Financial Management
This financial report is designed to provide the District's citizens, taxpayers, customers and investors and creditors with a general overview of the District's finances and to demonstrate the District's accountability for the money it receives. If you have questions about this report or need additional financial infonnation, contact Deborah S. Saridaki, Business Administrator/Board Secretary at Scotch Plains-Fanwood Regional School District Board of Education, Administration Building, Evergreen Avenue and Cedar Street, Scotch Plains, New Jersey 07076. Please visit our website at http://www.sptkl2.org/.
Page24
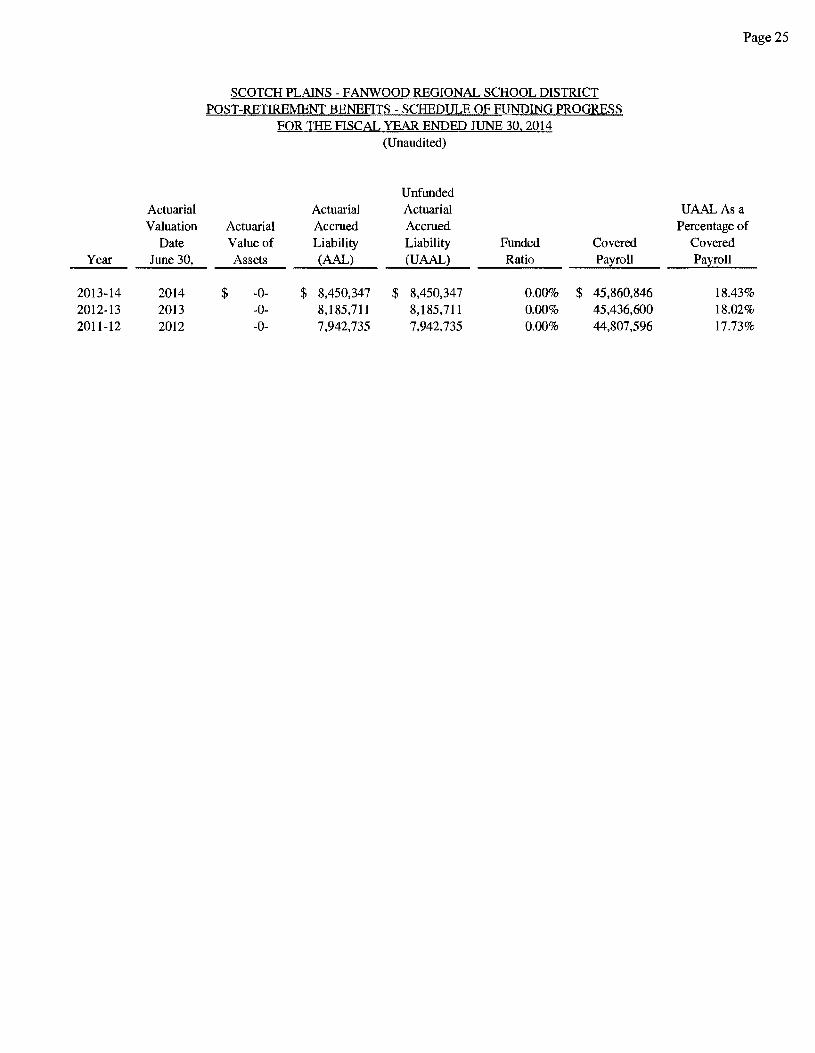
Actuarial Valuation
Date Year June 30,
2013-14 2014 2012-13 2013 2011-12 2012
SCOTCH PLAINS - FANWOOD REGIONAL SCHOOL DISTRICT POST-RETIREMENT BENEFITS - SCHEDULE OF FUNDING PROGRESS
FOR THE FISCAL YEAR ENDED JUNE 30, 2014 (Unaudited)
Unfunded Actuarial Actuarial
Actuarial Accrued Accrued Value of Liability Liability Funded Covered Assets (AAL) (UAAL) Ratio Payroll
$ -0- $ 8,450,347 $ 8,450,347 0.00% $ 45,860,846 -0- 8,185,711 8,185,711 0.00% 45,436,600 -0- 7,942,735 7,942,735 0.00% 44,807,596
Page 25
UAALAsa Percentage of
Covered Payroll
18.43% 18.02% 17.73%
Page 26
BASIC FINANCIAL STATEMENTS
Page 27
DISTRICT-WIDE FINANCIAL STATEMENTS
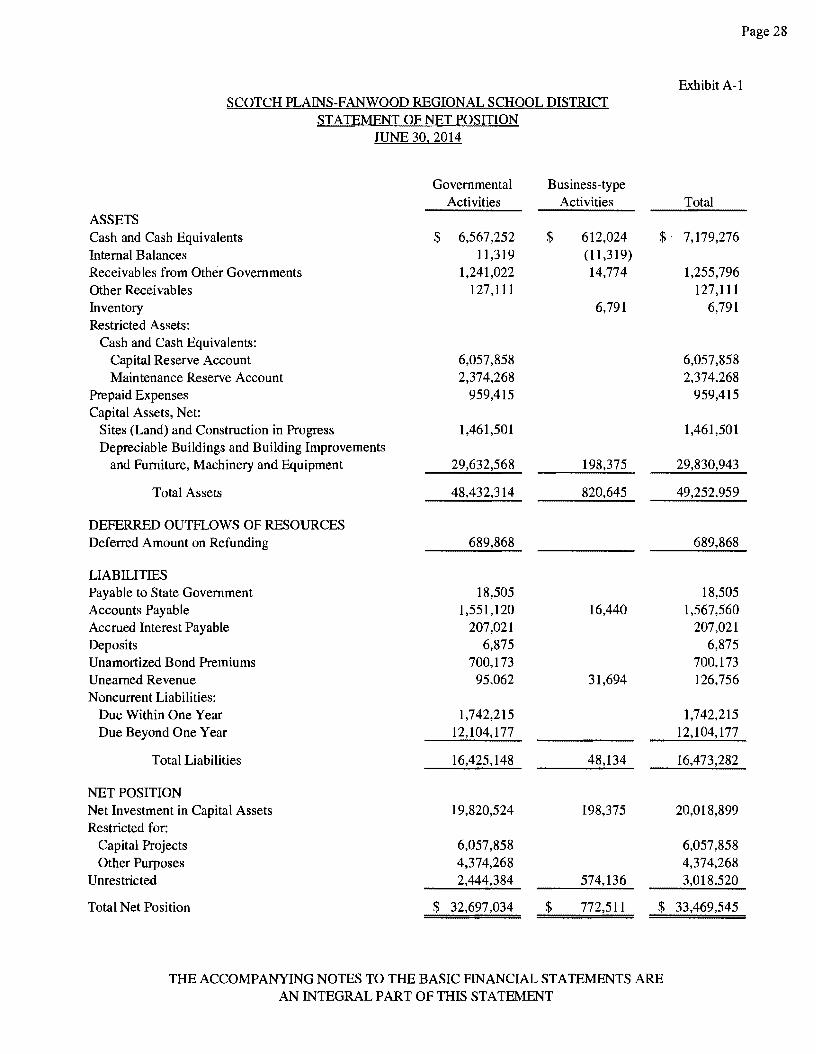
SCOTCH PLAINS-FANWOOD REGIONAL SCHOOL DISTRICT STATEMENT OF NET POSITION
JUNE 30, 2014
Governmental Business-type Activities Activities
ASSETS Cash and Cash Equivalents $ 6,567,252 $ 612,024 $ Internal Balances 11,319 (11,319) Receivables from Other Governments 1,241,022 14,774 Other Receivables 127,111 Inventory 6,791 Restricted Assets:
Cash and Cash Equivalents: Capital Reserve Account 6,057,858 Maintenance Reserve Account 2,374,268
Prepaid Expenses 959,415 Capital Assets, Net:
Sites (Land) and Construction in Progress 1,461,501 Depreciable Buildings and Building Improvements
and Furniture, Machinery and Equipment 29,632,568 198,375
Total Assets 48,432,314 820,645
DEFERRED OUTFLOWS OF RESOURCES Deferred Amount on Refunding 689,868
LIABILITIES Payable to State Government 18,505 Accounts Payable 1,551,120 16,440 Accrued Interest Payable 207,021 Deposits 6,875 Unamortized Bond Premiums 700,173 Unearned Revenue 95,062 31,694 Noncurrent Liabilities:
Due Within One Year 1,742,215 Due Beyond One Year 12,104,177
Total Liabilities 16,425,148 48,134
NET POSITION Net Investment in Capital Assets 19,820,524 198,375 Restricted for:
Capital Projects 6,057,858 Other Purposes 4,374,268
Unrestricted 2,444,384 574,136
Total Net Position $ 32,697,034 $ 772,511 $
THE ACCOMPANYING NOTES TO THE BASIC FINANCIAL STATEMENTS ARE AN INTEGRAL PART OF THIS STATEMENT
Page28
Exhibit A-1
Total
7,179,276
1,255,796 127,111
6,791
6,057,858 2,374,268
959,415
1,461,501
29,830,943
49,252,959
689,868
18,505 1,567,560
207,021 6,875
700,173 126,756
1,742,215 12,104,177
16,473,282
20,018,899
6,057,858 4,374,268 3,018,520
33,469,545
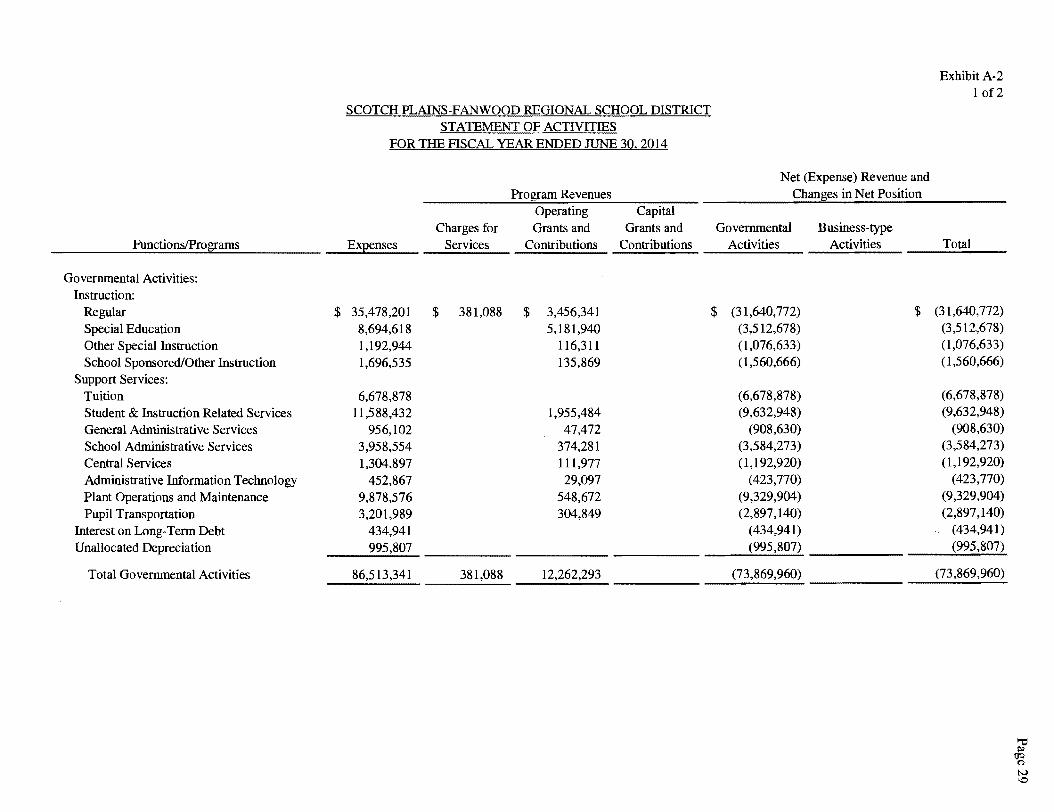
Functions/Programs
Governmental Activities: Instruction:
Regular Special Education Other Special Instruction School Sponsored/Other Instruction
Support Services: Tuition Student & Instruction Related Services General Administrative Services School Administrative Services Central Services Administrative Information Technology Plant Operations and Maintenance Pupil Transportation
Interest on Long-Term Debt Unallocated Depreciation
Total Governmental Activities
$
SCOTCH PLAINS-FANWOOD REGIONAL SCHOOL DISTRICT STATEMENT OF ACTIVITIES
FOR THE FISCAL YEAR ENDED JUNE 30, 2014
Expenses
35,478,201 8,694,618 1,192,944 1,696,535
6,678,878 11,588,432
956,102 3,958,554 1,304,897
452,867 9,878,576 3,201,989
434,941 995,807
86,513,341
Charges for Services
$ 381,088
381,088
Program Revenues Operating Grants and
Contributions
$ 3,456,341 5,181,940
116,311 135,869
1,955,484 47,472
374,281 111,977 29,097
548,672 304,849
12,262,293
Capital Grants and
Contributions
Net (Expense) Revenue and Changes in Net Position
Governmental Activities
$ (31,640, 772) (3,512,678) (1,076,633) (1,560,666)
(6,678,878) (9,632,948)
(908,630) (3,584,273) (1,192,920)
(423,770) (9,329,904) (2,897,140)
(434,941) (995,807)
(73,869,960)
Business-type Activities
$
ExhibitA-2 1 of2
Total
(31,640, 772) (3,512,678) (1,076,633) (1,560,666)
(6,678,878) (9,632,948)
(908,630) (3,584,273) (1,192,920)
(423,770) (9,329,904) (2,897,140)
(434,941) (995,807)
(73 ,869 '960)
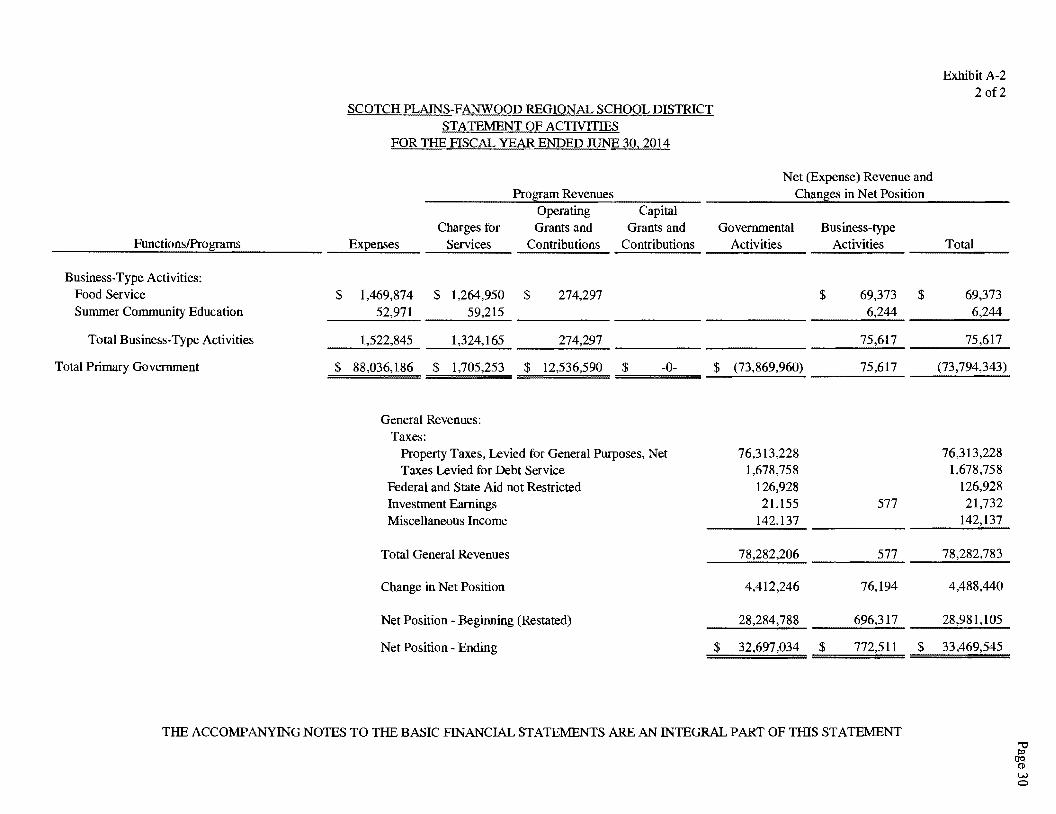
Functions/Programs
Business-Type Activities: Food Service Summer Community Education
Total Business-Type Activities
Total Primary Government
SCOTCH PLAINS-FANWOOD REGIONAL SCHOOL DISTRICT STATEMENT OF ACTIVITIES
FOR THE FISCAL YEAR ENDED JUNE 30, 2014
Expenses
$ l,469,874 52,971
l,522,845
Charges for Services
Program Revenues Operating Grants and
Contributions
$ 1,264,950 $ 59,215
274,297
l,324,165 274,297
Capital Grants and
Contributions
$ 88,036, 186 $ l,705,253 $ 12,536,590 $ -0-=====
General Revenues: Taxes:
Property Taxes, Levied for General Purposes, Net Taxes Levied for Debt Service
Federal and State Aid not Restricted Investment Earnings Miscellaneous Income
Total General Revenues
Change in Net Position
Net Position - Beginning (Restated)
Net Position - Ending
Net (Expense) Revenue and Changes in Net Position
Governmental Activities
$ (73,869,960)
76,313,228 l,678,758
126,928 21,155
142,137
78,282,206
4,412,246
28,284,788
$ 32,697,034
Business-type Activities
$ 69,373 6,244
75,617
75,617 ------
577
577
76,194
696,317
$ 772,511
$
$
THE ACCOMPANYING NOTES TO THE BASIC FINANCIAL STATEMENTS ARE AN INTEGRAL PART OF THIS STATEMENT
ExhibitA-2 2of2
Total
69,373 6,244
75,617
(73,794,343)
76,313,228 1,678,758
126,928 21,732
142,137
78,282,783
4,488,440
28,981,105
33,469,545
Page 31
FUND FINANCIAL STATEMENTS
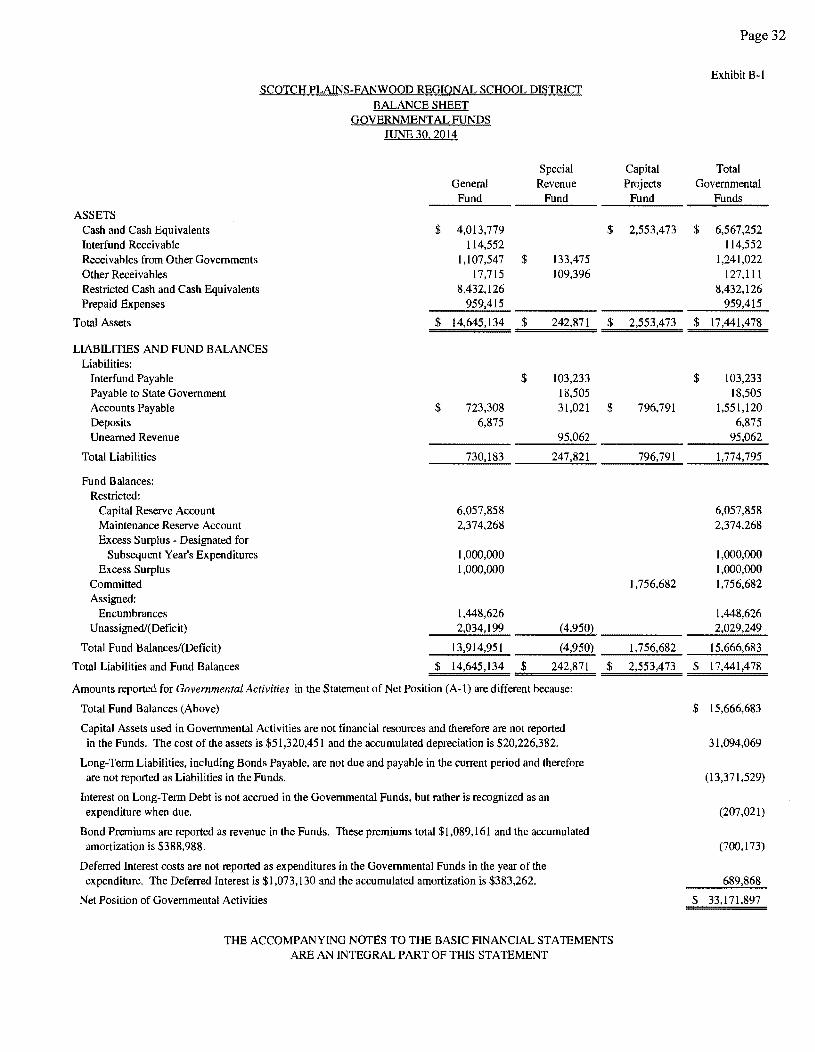
SCOTCH PLAINS-FANWOOD REGIONAL SCHOOL DISTRICT BALANCE SHEET
GOVERNMENTAL FUNDS JUNE 30, 2014
Special General Revenue
Fund Fund
ASSETS Cash and Cash Equivalents $ 4,013,779 Interfund Receivable 114,552 Receivables from Other Governments l,107,547 $ 133,475 Other Receivables 17,715 109,396 Restricted Cash and Cash Equivalents 8,432,126 Prepaid Expenses 959,415
Total Assets $ 14,645,134 $ 242,871
LIABILITIES AND FUND BALANCES Liabilities:
Interfund Payable $ 103,233 Payable to State Government 18,505 Accounts Payable $ 723,308 31,021 Deposits 6,875 Unearned Revenue 95,062
Total Liabilities 730,183 247,821
Fund Balances: Restricted:
Capital Reserve Account 6,057,858 Maintenance Reserve Account 2,374,268 Excess Surplus - Designated for
Subsequent Year's Expenditures 1,000,000 Excess Surplus 1,000,000
Committed Assigned:
Encumbrances 1,448,626 Unassignerl/(Deficit) 2,034,199 (4,950)
Total Fund Balances/(Deficit) 13,914,951 (4,950)
Total Liabilities and Fund Balances $ 14,645,134 $ 242,871
Amounts reported for Governmental Activities in the Statement of Net Position (A-1) are different because:
Total Fund Balances (Above)
Capital Assets used in Governmental Activities are not financial resources and therefore are not reported in the Funds. The cost of the assets is $51,320,451 and the accumulated depreciation is $20,226,382.
Long-Term Liabilities, including Bonds Payable, are not due and payable in the current period and therefore are not reported as Liabilities in the Funds.
Interest on Long-Term Debt is not accrued in the Governmental Funds, but rather is recognized as an expenditure when due.
Bond Premiums are reported as revenue in the Funds. These premiums total $1,089,161 and the accumulated amortization is $388,988.
Deferred Interest costs are not reported as expenditures in the Governmental Funds in the year of the expenditure. The Deferred Interest is $1,073,130 and the accumulated amortization is $383,262.
Net Position of Governmental Activities
$
$
$
$
THE ACCOMPANYING NOTES TO THE BASIC FINANCIAL STATEMENTS ARE AN INTEGRAL PART OF TIDS STATEMENT
Page 32
Exhibit B-1
Capital Total Projects Governmental
Fund Funds
2,553,473 $ 6,567,252 114,552
1,241,022 127,111
8,432,126 959,415
2,553,473 $ 17,441,478
$ 103,233 18,505
796,791 1,551,120 6,875
95,062
796,791 1,774,795
6,057,858 2,374,268
1,000,000 1,000,000
1,756,682 1,756,682
1,448,626 2,029,249
1,756,682 15,666,683
2,553,473 $ 17,441,478
$ 15,666,683
31,094,069
(13,371,529)
(207,021)
(700,173)
689,868
$ 33,171,897
Page 33
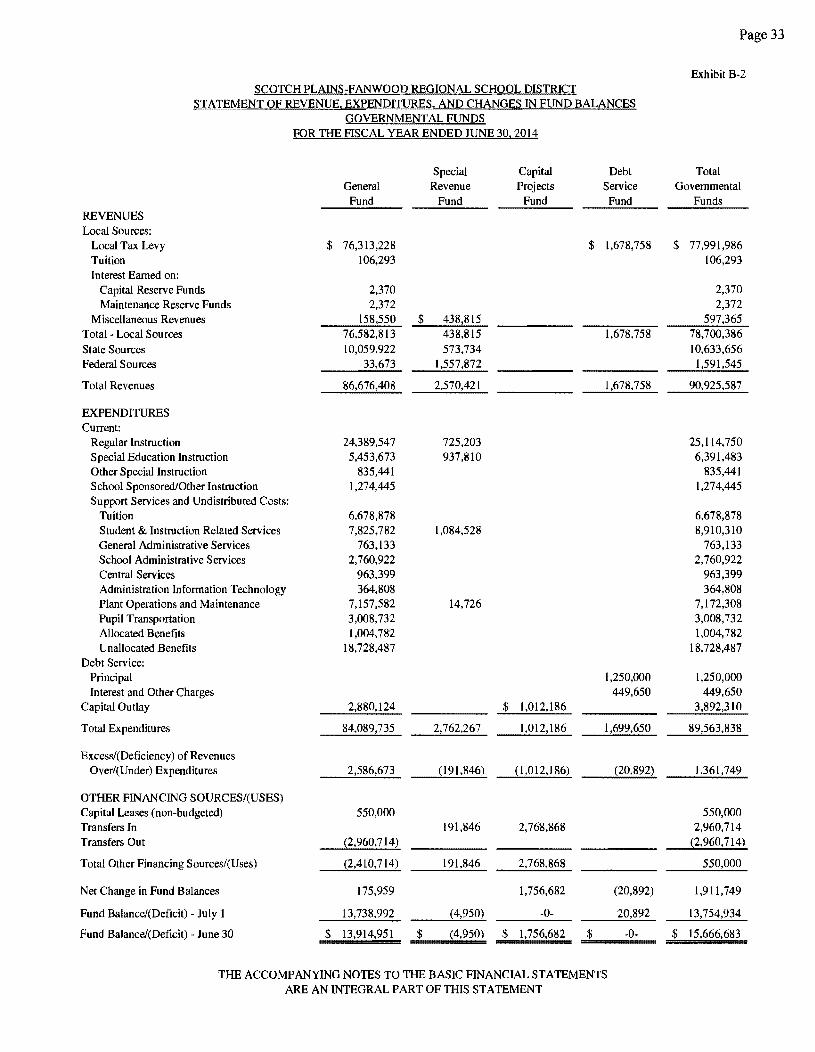
Exhibit B-2 S~OTCH PLAINS-FANWOOD REGIONAL SCHOOL DISTRICT
STATEMENT OF REVENUE, EXPENDITURES, AND CHANGES IN FUND BALANCES GOVERNMENTAL FUNDS
FOR THE FISCAL YEAR ENDED JUNE 30. 2014
Special Capital Debt Total General Revenue Projects Service Governmental
Fund Fund Fund Fund Funds REVENUES Local Sources:
Local Tax Levy $ 76,313,228 $ 1,678,758 $ 77,991,986 Tuition 106,293 106,293 Interest Earned on:
Capital Reserve Funds 2,370 2,370 Maintenance Reserve Funds 2,372 2,372
Miscellaneous Revenues 158,550 $ 438,815 597,365 Total - Local Sources 76,582,813 438,815 1,678,758 78,700,386
State Sources 10,059,922 573,734 10,633,656 Federal Sources 33,673 1,557,872 1,591,545
Total Revenues 86,676,408 2,570,421 1,678,758 90,925,587
EXPENDITURES Current:
Regular Instruction 24,389,547 725,203 25,114,750 Special Education Instruction 5,453,673 937,810 6,391,483 Other Special Instruction 835,441 835,441 School Sponsored/Other Instruction 1,274,445 1,274,445 Support Services and Undistributed Costs:
Tuition 6,678,878 6,678,878 Student & Instruction Related Services 7,825,782 1,084,528 8,910,310 General Administrative Services 763,133 763,133 School Administrative Services 2,760,922 2,760,922 Central Services 963,399 963,399 Administration Information Technology 364,808 364,808 Plant Operations and Maintenance 7,157,582 14,726 7,172,308 Pupil Transportation 3,008,732 3,008,732 Allocated Benefits l,004,782 1,004,782 Unallocated Benefits 18,728,487 18,728,487
Debt Service: Principal 1,250,000 l,250,000 Interest and Other Charges 449,650 449,650
Capital Outlay 2,880,124 $ 1,012,186 3,892,310
Total Expenditures 84,089,735 2,762,267 1,012,186 1,699,650 89,563,838
Excess/(Deficiency) of Revenues Over/(Under) Expenditures 2,586,673 (191,846) (1,012,186) (20,892) 1,361,749
OTHER FINANCING SOURCES/(USES) Capital Leases (non-budgeted) 550,000 550,000 Transfers In 191,846 2,768,868 2,960,714 Transfers Out (2,960,714) ~2,960,714)
Total Other Financing Sources/(Uses) (2,410,714) 191,846 2,768,868 550,000
Net Change in Fund Balances 175,959 1,756,682 (20,892) 1,911,749
Fund Balance/(Deficit) July 1 13,738,992 (4,950) -0- 20,892 13,754,934
Fund Balance/(Deficit) - June 30 $ 13,914,951 $ (4,950) $ 1,756,682 $ -0- $ 15,666,683
THE ACCOMPANYING NOTES TO THE BASIC FINANCIAL STATEMENTS ARE AN INTEGRAL PART OF THIS STATEMENT
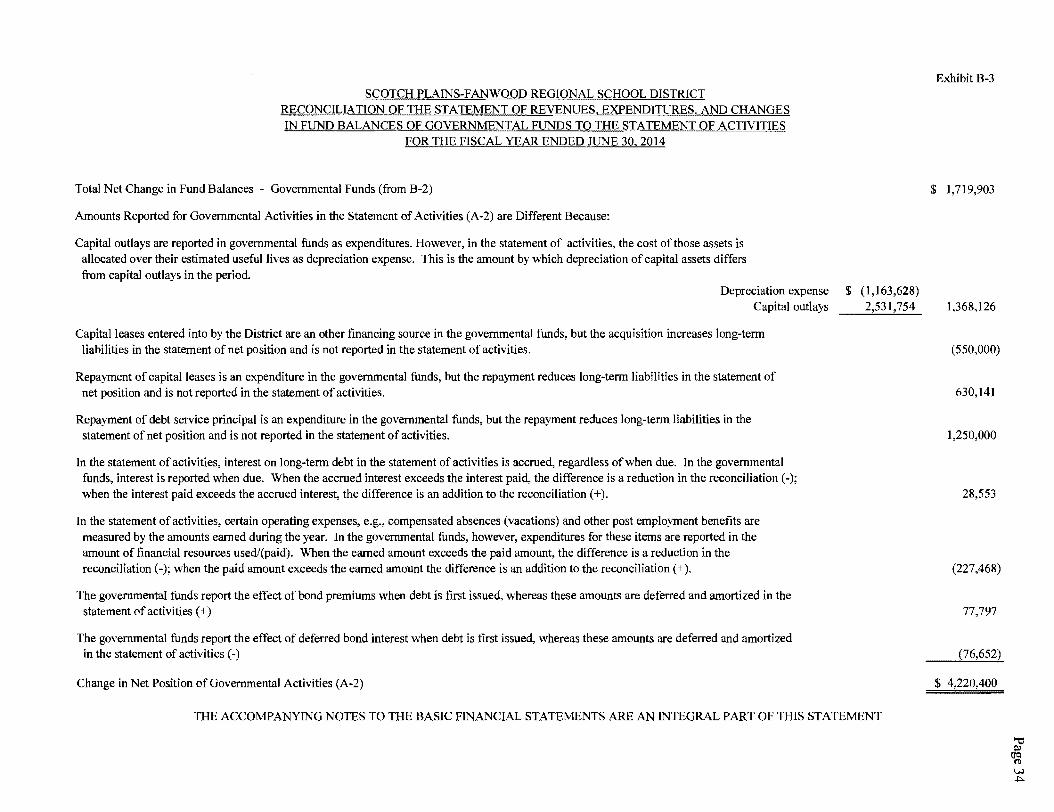
SCOTCH PLAINS-FANWOOD REGIONAL SCHOOL DISTRICT RECONCILIATION OF THE STATEMENT OF REVENUES, EXPENDITURES, AND CHANGES IN FUND BALANCES OF GOVERNMENTAL FUNDS TO THE STATEMENT OF ACTIVITIES
FOR THE FISCAL YEAR ENDED JUNE 30, 2014
Total Net Change in Fund Balances - Governmental Funds (from B-2)
Amounts Reported for Governmental Activities in the Statement of Activities (A-2) are Different Because:
Capital outlays are reported in governmental funds as expenditures. However, in the statement of activities, the cost of those assets is allocated over their estimated useful lives as depreciation expense. This is the amount by which depreciation of capital assets differs from capital outlays in the period.
Depreciation expense Capital outlays
Capital leases entered into by the District are an other financing source in the governmental funds, but the acquisition increases long-term liabilities in the statement of net position and is not reported in the statement of activities.
Repayment of capital leases is an expenditure in the governmental funds, but the repayment reduces long-term liabilities in the statement of net position and is not reported in the statement of activities.
Repayment of debt service principal is an expenditure in the governmental funds, but the repayment reduces long-term liabilities in the statement of net position and is not reported in the statement of activities.
In the statement of activities, interest on long-term debt in the statement of activities is accrued, regardless of when due. In the governmental funds, interest is reported when due. When the accrued interest exceeds the interest paid, the difference is a reduction in the reconciliation (-); when the interest paid exceeds the accrued interest, the difference is an addition to the reconciliation(+).
In the statement of activities, certain operating expenses, e.g., compensated absences (vacations) and other post employment benefits are measured by the amounts earned during the year. In the governmental funds, however, expenditures for these items are reported in the amount of financial resources used/(paid). When the earned amount exceeds the paid amount, the difference is a reduction in the reconciliation(-); when the paid amount exceeds the earned amount the difference is an addition to the reconciliation(+).
The governmental funds report the effect of bond premiums when debt is first issued, whereas these amounts are deferred and amortized in the statement of activities ( +)
The governmental funds report the effect of deferred bond interest when debt is first issued, whereas these amounts are deferred and amortized in the statement of activities (-)
Change in Net Position of Governmental Activities (A-2)
$ (1,163,628) 2,531,754
THE ACCOMPANYING NOTES TO THE BASIC FINANCIAL STATEMENTS ARE AN INTEGRAL PART OF THIS STATEMENT
Exhibit B-3
$ 1,719,903
1,368,126
(550,000)
630,141
1,250,000
28,553
(227,468)
77,797
(76,652)
$ 4,220,400
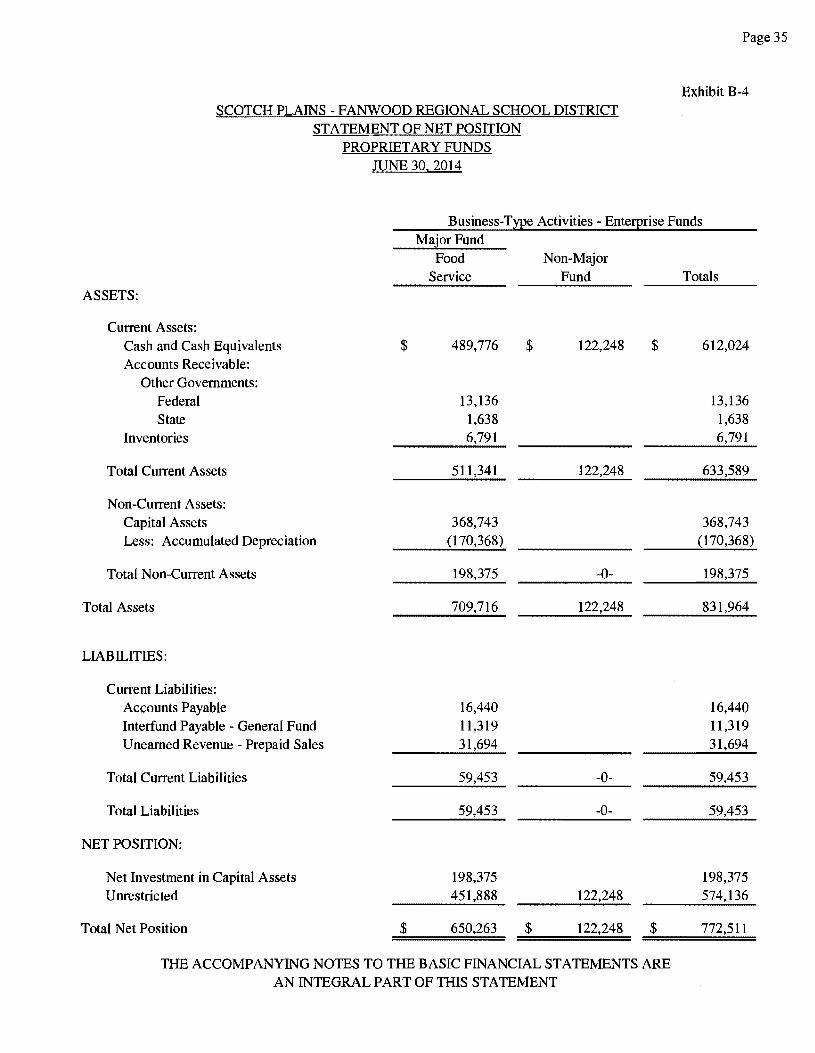
SCOTCH PLAINS - FANWOOD REGIONAL SCHOOL DISTRICT STATEMENT OF NET POSITION
PROPRIETARY FUNDS JUNE 30. 2014
Page 35
Exhibit B-4
Business-Type Activities - Ente~rise Funds Major Fund
Food Non-Major Service Fund Totals
ASSETS:
Current Assets: Cash and Cash Equivalents $ 489,776 $ 122,248 $ 612,024 Accounts Receivable:
Other Governments: Federal 13,136 13,136 State 1,638 1,638
Inventories 6,791 6,791
Total Current Assets 511,341 122,248 633,589
Non-Current Assets: Capital Assets 368,743 368,743 Less: Accumulated Depreciation (170,368) (170,368)
Total Non-Current Assets 198,375 -0- 198,375
Total Assets 709,716 122,248 831,964
LIABILITIES:
Current Liabilities: Accounts Payable 16,440 16,440 Interfund Payable - General Fund 11,319 11,319 Unearned Revenue - Prepaid Sales 31,694 31,694
Total Current Liabilities 59,453 -0- 59,453
Total Liabilities 59,453 -0- 59,453
NET POSITION:
Net Investment in Capital Assets 198,375 198,375 Unrestricted 451,888 122,248 574,136
Total Net Position $ 650,263 $ 122,248 $ 772,511
THE ACCOMPANYING NOTES TO THE BASIC FINANCIAL STATEMENTS ARE AN INTEGRAL PART OF THIS STATEMENT
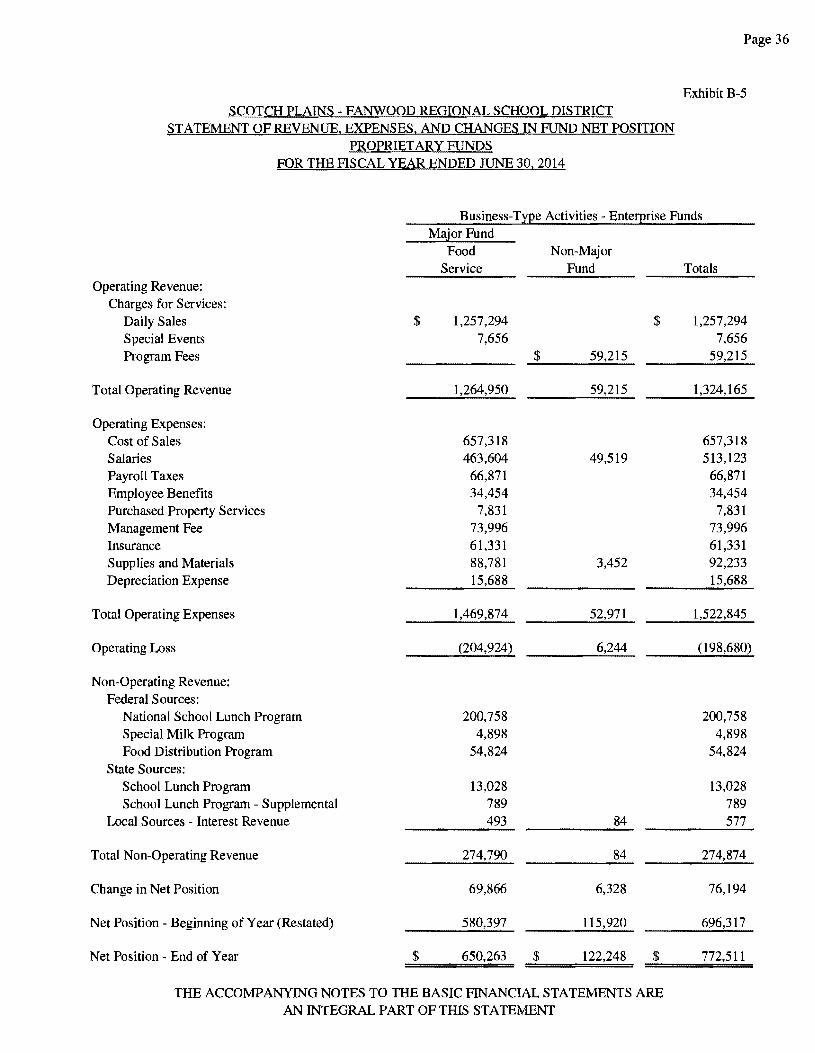
SCOTCH PLAINS - FANWOOD REGIONAL SCHOOL DISTRICT STATEMENT OF REVENUE, EXPENSES, AND CHANGES IN FUND NET POSITION
PROPRIETARY FUNDS FOR THE FISCAL YEAR ENDED JUNE 30, 2014
Page 36
Exhibit B-5
Business-Type Activities - Enterprise Funds
Operating Revenue: Charges for Services:
Daily Sales Special Events Program Fees
Total Operating Revenue
Operating Expenses: Cost of Sales Salaries Payroll Taxes Employee Benefits Purchased Property Services Management Fee Insurance Supplies and Materials Depreciation Expense
Total Operating Expenses
Operating Loss
Non-Operating Revenue: Federal Sources:
National School Lunch Program Special Milk Program Food Distribution Program
State Sources: School Lunch Program School Lunch Program - Supplemental
Local Sources - Interest Revenue
Total Non-Operating Revenue
Change in Net Position
Net Position - Beginning of Year (Restated)
Net Position - End of Year
$
$
Major Fund Food
Service
1,257,294 7,656
1,264,950
657,318 463,604
66,871 34,454
7,831 73,996 61,331 88,781 15,688
1,469,874
(204,924)
200,758 4,898
54,824
13,028 789 493
274,790
69,866
580,397
650,263
$
$
Non-Major Fund
59,215
59,215
49,519
3,452
52,971
6,244
84
84
6,328
115,920
122,248
$
$
THE ACCOMPANYING NOTES TO THE BASIC FINANCIAL STATEMENTS ARE AN INTEGRAL PART OF THIS STATEMENT
Totals
1,257,294 7,656
59,215
1,324,165
657,318 513,123
66,871 34,454
7,831 73,996 61,331 92,233 15,688
1,522,845
(198,680)
200,758 4,898
54,824
13,028 789 577
274,874
76,194
696,317
772,511
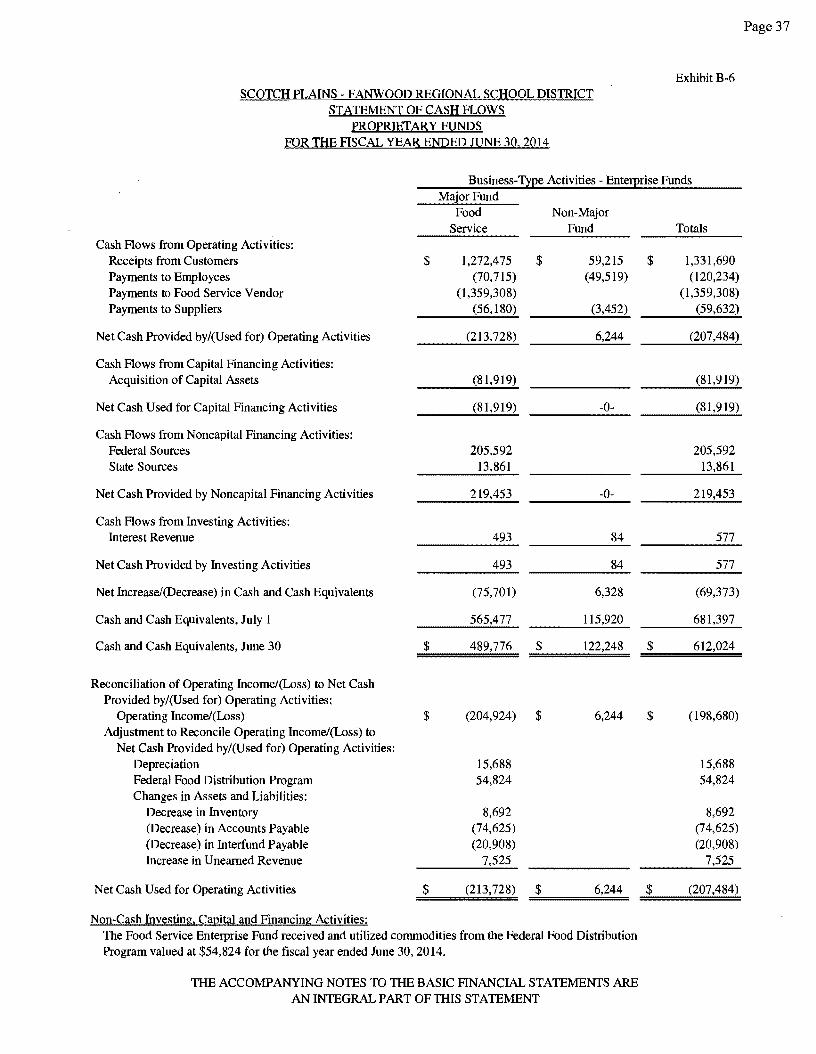
scarcH PLAINS - FANWOOD REGIONAL SCHOOL DISTRICT STATEMENT OF CASH FLOWS
PROPRIETARY FUNDS FOR THE FISCAL YEAR ENDED JUNE 30, 2014
Exhibit B-6
Business-Type Activities - Ente!:_Erise Funds Major Fund
Food Non-Major Service Fund
Cash Flows from Operating Activities: Receipts from Customers $ 1,272,475 $ 59,215 Payments to Employees (70,715) (49,519) Payments to Food Service Vendor (1,359,308) Payments to Suppliers (56,180) (3,452)
Net Cash Provided by/(Used for) Operating Activities (213,728) 6,244
Cash Flows from Capital Financing Activities: Acquisition of Capital Assets (81,919)
Net Cash Used for Capital Financing Activities (81,919) -0-
Cash Flows from Noncapital Financing Activities: Federal Sources 205,592 State Sources 13,861
Net Cash Provided by Noncapital Financing Activities 219,453 -0-
Cash Flows from Investing Activities: Interest Revenue 493 84
Net Cash Provided by Investing Activities 84
Net Increase/(Decrease) in Cash and Cash Equivalents (75,701) 6,328
Cash and Cash Equivalents, July 1 115,920
Cash and Cash Equivalents, June 30 $ 489,776 $ 122,248
Reconciliation of Operating Income/(Loss) to Net Cash Provided by/(Used for) Operating Activities:
Operating Income/(Loss) $ (204,924) $ 6,244 Adjustment to Reconcile Operating Income/(Loss) to
Net Cash Provided by/(Used for) Operating Activities: Depreciation 15,688 Federal Food Distribution Program 54,824 Changes in Assets and Liabilities:
Decrease in Inventory 8,692 (Decrease) in Accounts Payable (74,625) (Decrease) in Interfund Payable (20,908) Increase in Unearned Revenue 7,525
Net Cash Used for Operating Activities $ (213,728)
Non-Cash Investing, Canital and Financing Activities: The Food Service Enterprise Fund received and utilized commodities from the Federal Food Distribution Program valued at $54,824 for the fiscal year ended June 30, 2014.
THE ACCOMPANYING NOTES TO THE BASIC FINANCIAL STATEMENTS ARE AN INTEGRAL PART OF THIS STATEMENT
Totals
$ l,331,690 (120,234)
(1,359,308) (59,632)
(207,484)
(81,919)
(81,919)
205,592 13,861
219,453
577
577
(69,373)
681,397
$ 612,024
$ (198,680)
15,688 54,824
8,692 (74,625) (20,908)
7,525
$ (207,484)
Page 37
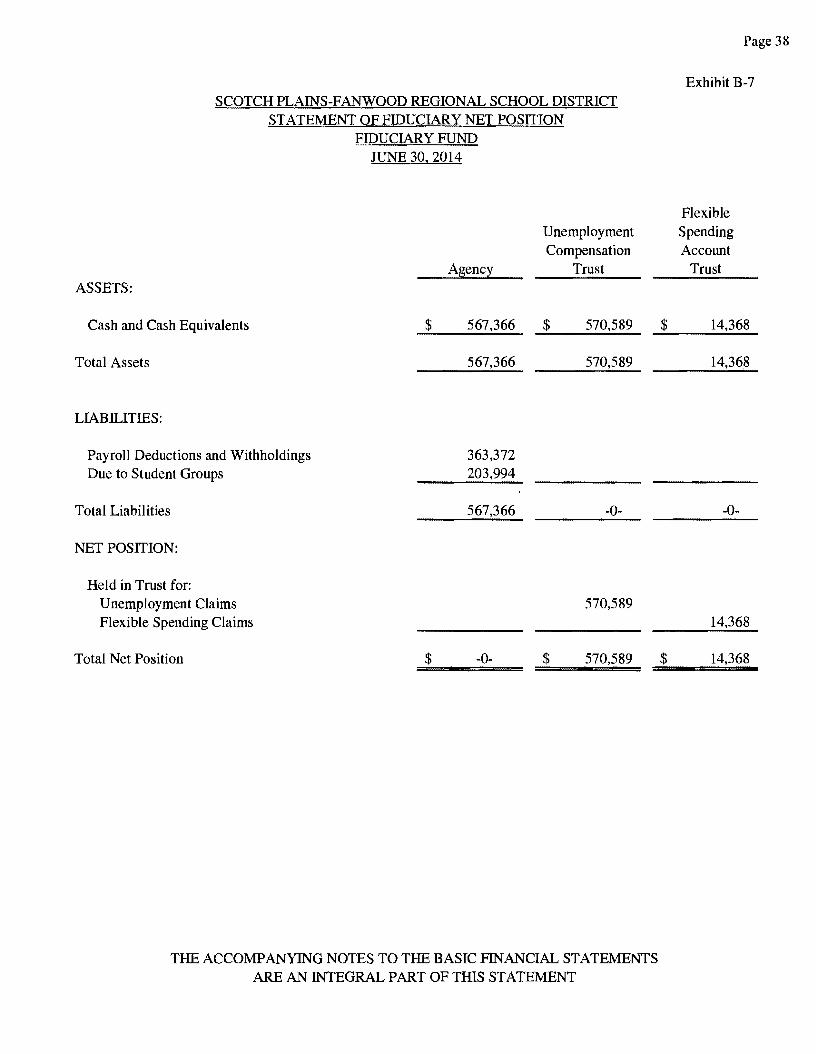
SCOTCH PLAINS-FANWOOD REGIONAL SCHOOL DISTRICT STATEMENT OF FIDUCIARY NET POSITION
FIDUCIARY FUND JUNE 30, 2014
Unemployment Compensation
Agency Trust ASSETS:
Cash and Cash Equivalents $ 567,366 $ 570,589
Total Assets 567,366 570,589
LIABILITIES:
Payroll Deductions and Withholdings 363,372 Due to Student Groups 203,994
Total Liabilities 567,366 -0-
NET POSITION:
Held in Trust for: Unemployment Claims 570,589 Flexible Spending Claims
Total Net Position $ -0- $ 570,589
THE ACCOMPANYING NOTES TO THE BASIC FINANCIAL STATEMENTS ARE AN INTEGRAL PART OF THIS STATEMENT
Page 38
Exhibit B-7
Flexible Spending Account
Trust
$ 14,368
14,368
-0-
14,368
$ 14,368
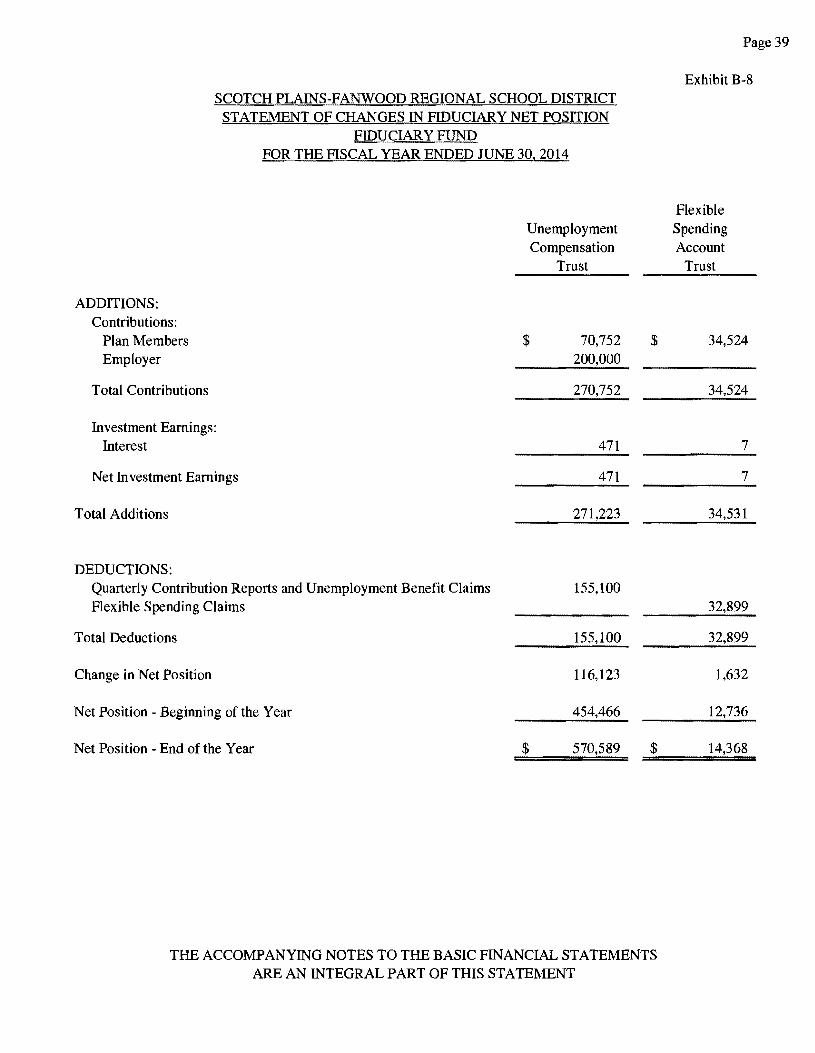
SCOTCH PLAINS-FANWOOD REGIONAL SCHOOL DISTRICT STATEMENT OF CHANGES IN FIDUCIARY NET POSITION
FIDUCIARY FUND FOR THE FISCAL YEAR ENDED JUNE 30, 2014
ADDITIONS: Contributions:
Plan Members Employer
Total Contributions
Investment Earnings: Interest
Net Investment Earnings
Total Additions
DEDUCTIONS: Quarterly Contribution Reports and Unemployment Benefit Claims Flexible Spending Claims
Total Deductions
Change in Net Position
Net Position - Beginning of the Year
Net Position - End of the Year
Unemployment Compensation
Trust
$ 70,752 200,000
270,752
471
471
271,223
155,100
155,100
116,123
454,466
$ 570,589
$
$
THE ACCOMPANYING NOTES TO THE BASIC FINANCIAL STATEMENTS ARE AN INTEGRAL PART OF THIS STATEMENT
Page 39
Exhibit B-8
Flexible Spending Account
Trust
34,524
34,524
7
7
34,531
32,899
32,899
1,632
12,736
14,368
SCOTCH PLAINS-FANWOOD REGIONAL SCHOOL DISTRICT NOTES TO THE BASIC FINANCIAL STATEMENTS
FOR THE FISCAL YEAR ENDED JUNE 30. 2014
NOTE 1. SUMMARY OF SIGNIFICANT ACCOUNTING POLICIES
The financial statements of the Board of Education (the "Board") of Scotch Plains-Fanwood Regional School District (the "District") have been prepared in conformity with generally accepted accounting principles (GAAP) as applied to government units. The Governmental Accounting Standards Board (GASB) is the accepted standard-setting body for establishing governmental accounting and financial reporting principles. The more significant of the Board's accounting policies are described below.
A. Reporting Entity:
The Board is an instrumentality of the State of New Jersey, established to function as an educational institution. The Board consists of elected officials and is responsible for the fiscal control of the District. A superintendent is appointed by the Board and is responsible for the administrative control of the District.
Governmental Accounting Standards Board publication, Codification of Governmental Accounting and Financial Reporting Standards, Section 2100, "Defining the Financial Reporting Entity" establishes standards to determine whether a governmental component unit should be included in the financial reporting entity. The basic criterion for inclusion or exclusion from the financial reporting entity is the exercise of oversight responsibility over agencies, boards and commissions by the primary government. The exercise of oversight responsibility includes financial interdependency and a resulting financial benefit or burden relationship, selection of governing authority, designation of management, ability to significantly influence operations, and accountability for fiscal matters. In addition, certain legally separate, tax-exempt entities that meet specific criteria (i.e. benefit of economic resources, access/entitlement to economic resources, and significance) should be included in the financial reporting entity. The combined financial statements include all funds of the District over which the Board exercises operating control. The operations of the District include five elementary schools, two middle schools and one high school which comprise the Scotch Plains-Fanwood Regional School District. There were no additional entities required to be included in the reporting entity under the criteria as described above, in the current fiscal year. Furthermore, the District is not includable in any other reporting entity on the basis of such criteria.
B. Basis of Presentation:
District-Wide Financial Statements:
The statement of net position and the statement of activities present financial information about the District's governmental and business-type activities. These statements include the financial activities of the overall District in its entirety, except those that are fiduciary. Eliminations have been made to minimize the double counting of internal transactions. These statements distinguish between the governmental and business-type activities of the District. Governmental activities generally are financed through taxes, intergovernmental revenue and other nonexchange transactions. Businesstype activities are financed in part by fees charged to external parties.
The statement of activities presents a comparison between direct expenses and program revenue for business-type activities and for each function of the District's governmental activities. Direct expenses are those that are specifically associated with and are clearly identifiable to a particular function. Indirect expenses are allocated to the functions using an appropriate allocation method or association with the specific function. Indirect expenses include health benefits, employer's share of payroll taxes, compensated absences and tuition reimbursements. Program revenue includes (a) charges paid by the recipients of goods or services offered by the programs, and (b) grants and contributions that are restricted to meeting the operational or capital requirements of a particular program. Revenue that is not classified as program revenue, including all taxes, is presented as general revenue. The comparison of direct expenses in the program revenues identifies the extent to which each government function or business segment is self-financing or draws from the general revenues of the District.
Page 40
SCOTCH PLAINS-FANWOOD REGIONAL SCHOOL DISTRICT NOTES TO THE BASIC FINANCIAL STATEMENTS
FOR THE FISCAL YEAR ENDED JUNE 30. 2014 (Continued)
NOTE 1. SUMMARY OF SIGNIFICANT ACCOUNTING POLICIES (Cont'd)
B. Basis of Presentation: (Cont'd)
Fund Financial Statements:
During the fiscal year, the School District segregates transactions related to certain School District functions or activities in separate funds in order to aid financial management and to demonstrate legal compliance. The fund financial statements provide information about the District's funds, including its fiduciary funds. Separate statements for each fund category - governmental, proprietary and fiduciary - are presented. The New Jersey Department of Education (NJDOE) has elected to require New Jersey districts to treat each governmental fund as a major fund in accordance with the option noted in GASB No. 34, paragraph 76. The NJDOE believes that the presentation of all funds as major is important for public interest and to promote consistency among district financial reporting models.
The District reports the following governmental funds:
General Fund: The General Fund is the general operating fund of the District and is used to account for and report all expendable financial resources not accounted for and reported in another fund. Included are certain expenditures for vehicles and movable instructional or noninstructional equipment which are classified in the capital outlay subfund.
As required by the NJDOE, the District includes budgeted capital outlay in this fund. GAAP, as it pertains to governmental entities, states that general fund resources may be used to directly finance capital outlays for long-lived improvements as long as the resources in such cases are derived exclusively from unrestricted revenue. Resources for budgeted capital outlay purposes are normally derived from State of New Jersey Aid, District taxes and appropriated fund balance. Expenditures are those that result in the acquisition of or additions to capital assets for land, existing buildings, improvements of grounds, construction of buildings, additions to or remodeling of buildings and the purchase of built-in equipment. These resources can be transferred from and to current expenses by Board resolution.
Special Revenue Fund: The Special Revenue Fund is used to account for and report the proceeds of specific revenue sources that are restricted or committed to expenditure for specified purposes other than debt service or capital projects. Thus, the Special Revenue Fund is used to account for the proceeds of specific revenue from State and Federal Governments (other than major capital projects, debt service or the enterprise funds) and local appropriations that are legally restricted or committed to expenditures for specified purposes.
Capital Projects Fund: The Capital Projects Fund is used to account for and report financial resources that are restricted, committed or assigned to expenditure for capital outlays, including the acquisition or construction of capital facilities and other capital assets (other than those financed by proprietary funds). The financial resources are derived from temporary notes or serial bonds that are specifically authorized by the voters as a separate question on the ballot either during the annual election or at a special election, funds appropriated from the General Fund, and from aid provided by the state to offset the cost of approved capital projects.
Debt Service Fund: The Debt Service Fund is used to account for and report financial resources that are restricted, committed or assigned to expenditures for principal and interest.
Page41
SCOTCH PLAINS-FANWOOD REGIONAL SCHOOL DISTRICT NOTES TO THE BASIC FINANCIAL STATEMENTS
FOR THE FISCAL YEAR ENDED JUNE 30, 2014 (Continued)
NOTE 1. SUMMARY OF SIGNIFICANT ACCOUNTING POLICIES (Cont'd)
B. Basis of Presentation: (Cont'd)
The District reports the following proprietary funds:
Enterprise (Food Service and Summer Community Education Programs) Funds: The Enterprise Funds account for all revenue and expenses pertaining to the Board's cafeteria and summer community education program operations. The food service and summer community education programs are utilized to account for operations that are financed and operated in a manner similar to private business enterprises. The stated intent is that the cost (i.e., expenses including depreciation and indirect costs) of providing goods or services to the students on a continuing basis are financed or recovered primarily through user charges.
Additionally, the District reports the following fund type:
Fiduciary Funds: The Fiduciary Funds are used to account for assets held by the District on behalf of others and include the Student Activities Fund, the Payroll Agency Fund, the Unemployment Compensation Insurance Trust Fund and the Flexible Spending Account Trust Fund.
C. Measurement Focus and Basis of Accounting
The District-wide financial statements and the proprietary and fiduciary fund financial statements are reported using the economic resources measurement focus and the accrual basis of accounting. Revenue is recorded when earned and expenses are recorded at the time liabilities are incurred, regardless of when the related cash transaction takes place. Nonexchange transactions, in which the District gives or receives value without directly receiving or giving equal value in exchange, include property taxes, grants, entitlements and donations. On an accrual basis, revenue from property taxes is recognized in the fiscal year for which the taxes are levied. Revenue from grants, entitlements and donations is recognized in the fiscal year in which all eligibility requirements have been satisfied.
The governmental fund financial statements are reported using the current financial resources measurement focus and the modified accrual basis of accounting. Under this method, revenue is recognized when measurable and available. The District considers all revenue reported in the governmental funds to be available if the revenue is collected within sixty days after the end of the fiscal year. Expenditures are recorded when the related fund liability is incurred, except for principal and interest on general long-term debt, claims and judgments, and compensated absences which are recognized as expenditures to the extent they have matured. Capital asset acquisitions are reported as expenditures in governmental funds. Proceeds of longterm debt and acquisitions under capital leases are reported as other financing sources.
It is the District's policy, that when an expenditure is incurred for purposes for which both restricted and unrestricted (committed, assigned, or unassigned) amounts are available, to apply restricted resources first followed by unrestricted resources. Similarly, within unrestricted fund balance, it is the District's policy to apply committed resources first followed by assigned resources and then unassigned resources when an expenditure is incurred for purposes for which amounts in any of those unrestricted fund balance classifications could be used.
Page42
SCOTCH PLAINS-FANWOOD REGIONAL SCHOOL DISTRICT NOTES TO THE BASIC FINANCIAL STATEMENTS
FOR THE FISCAL YEAR ENDED JUNE 30, 2014 (Continued)
NOTE l. SUMMARY OF SIGNIFICANT ACCOUNTING POLICIES (Cont'd)
C. Measurement Focus and Basis of Accounting (Cont'd)
Under the terms of grant agreements, the District may fund certain programs by a combination of specific costreimbursement grants, categorical block grants and general revenue. Therefore, when program expenses are incurred, both restricted and unrestricted net position may be available to finance the program. It is the District's policy to first apply cost-reimbursement grant resources to such programs, followed by general revenue.
D. Budgets/Budgetary Control:
Annual appropriated budgets are prepared in the spring of each year for the general, special revenue and debt service funds. The budget for the fiscal year ended June 30, 2014 was submitted to the County office and was approved by a vote of the Board of Education. Budgets are prepared using the modified accrual basis of accounting. The legal level of budgetary control is established at line item accounts within each fund. Line item accounts are defined as the lowest (most specific) level of detail as established pursuant to the minimum chart of accounts referenced in NJ.AC. 6:20-2A.2 (m) 1. All budget amendments/transfers must be made by School Board resolution. All budgeting amounts presented in the accompanying supplementary information reflect the original budget and the amended budget (which have been adjusted for legally authorized revisions of the annual budget during the year).
Formal budgetary integration into the accounting system is employed as a management control device during the year. For governmental funds, there are no substantial differences between the budgetary basis of accounting and generally accepted accounting principles, with the exception of the special revenue fund as noted below. Encumbrance accounting is also employed as an extension of formal budgetary integration in the governmental fund types. Unencumbered appropriations lapse at fiscal year end.
The accounting records of the special revenue fund are maintained on the grant accounting budgetary basis. The grant accounting budgetary basis differs from GAAP in that the grant accounting budgetary basis recognizes encumbrances as expenditures and also recognizes the related revenue, whereas the GAAP basis does not. Sufficient supplemental records are maintained to allow for the presentation of GAAP basis financial reports.
The General Fund and Special Revenue Fund budgetary revenue differs from GAAP revenue due to a difference in recognition of the June state aid payments for the current year. Since the State is recording the June state aid payments in the subsequent fiscal year, the District cannot recognize these payments on the GAAP financial statements.
The Capital Projects Fund budgetary revenue differs from GAAP revenue due to a difference in the recognition of SDA grants. These grants are recognized on the budgetary basis in full when they are awarded but recognized on the GAAP basis only to the extent of expenditures which have been submitted for reimbursement.
Page43
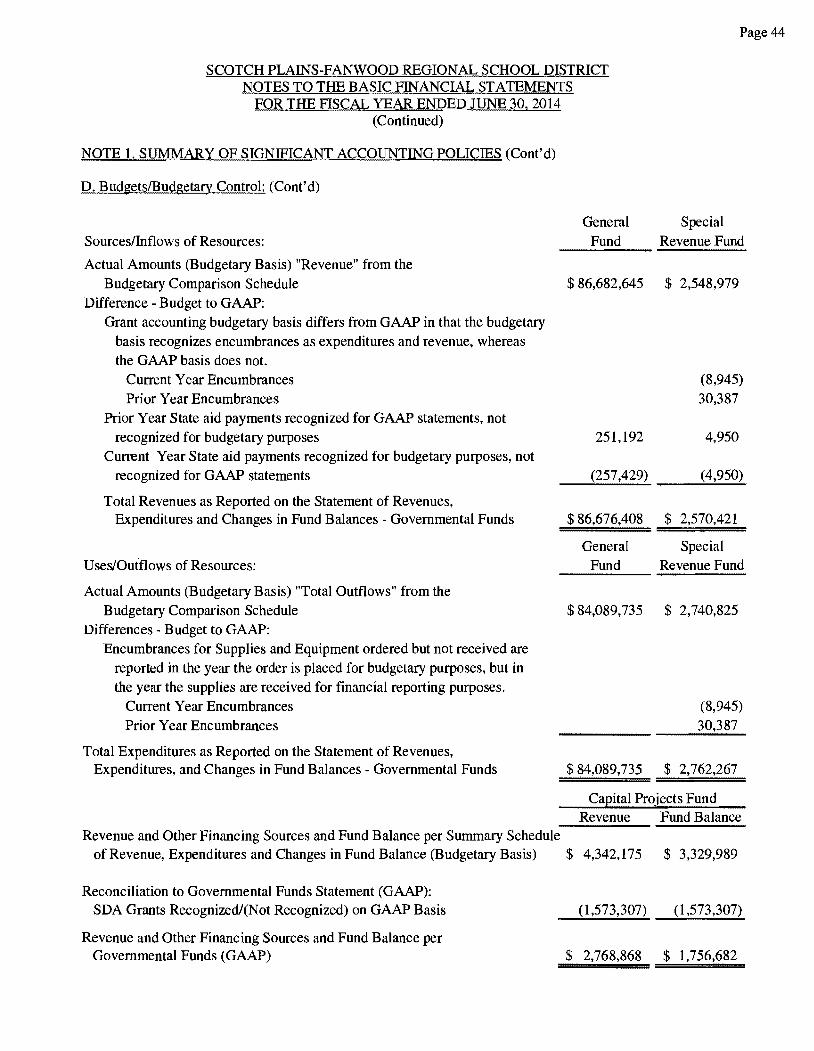
Page 44
SCOTCH PLAINS-FANWOOD REGIONAL SCHOOL DISTRICT NOTES TO THE BASIC FINANCIAL STATEMENTS
FOR THE FISCAL YEAR ENDED JUNE 30, 2014 (Continued)
NOTE 1. SUMMARY OF SIGNIFICANT ACCOUNTING POLICIES (Cont'd)
D. Budgets/Budgetary Control: (Cont'd)
General Special Sources/Inflows of Resources: Fund Revenue Fund
Actual Amounts (Budgetary Basis) "Revenue" from the Budgetary Comparison Schedule $ 86,682,645 $ 2,548,979
Difference -Budget to GAAP: Grant accounting budgetary basis differs from GAAP in that the budgetary
basis recognizes encumbrances as expenditures and revenue, whereas the GAAP basis does not.
Current Year Encumbrances Prior Year Encumbrances
Prior Year State aid payments recognized for GAAP statements, not recognized for budgetary purposes
Current Year State aid payments recognized for budgetary purposes, not recognized for GAAP statements
Total Revenues as Reported on the Statement of Revenues, Expenditures and Changes in Fund Balances - Governmental Funds
Uses/Outflows of Resources:
Actual Amounts (Budgetary Basis) "Total Outflows" from the Budgetary Comparison Schedule
Differences - Budget to GAAP: Encumbrances for Supplies and Equipment ordered but not received are
reported in the year the order is placed for budgetary purposes, but in the year the supplies are received for financial reporting purposes.
Current Year Encumbrances Prior Year Encumbrances
Total Expenditures as Reported on the Statement of Revenues, Expenditures, and Changes in Fund Balances - Governmental Funds
Revenue and Other Financing Sources and Fund Balance per Summary Schedule
251,192
(8,945) 30,387
4,950
(257,429) ( 4,950) ----'-...;..__--'-
$ 86,676,408
General Fund
$ 84,089,735
$ 84,089,735
$ 2,570,421
Special Revenue Fund
$ 2,740,825
(8,945) 30,387
$ 2,762,267
Capital Projects Fund Revenue Fund Balance
of Revenue, Expenditures and Changes in Fund Balance (Budgetary Basis) $ 4,342,175 $ 3,329,989
Reconciliation to Governmental Funds Statement (GAAP): SDA Grants Recognized/(Not Recognized) on GAAP Basis
Revenue and Other Financing Sources and Fund Balance per Governmental Funds (GAAP)
(1,573,307) (1,573,307)
$ 2,768,868 $ 1,756,682
SCOTCH PLAINS-FANWOOD REGIONAL SCHOOL DISTRICT NOTES TO THE BASIC FINANCIAL STATEMENTS
FOR THE FISCAL YEAR ENDED JUNE 30. 2014 (Continued)
NOTE 1. SUMMARY OF SIGNIFICANT ACCOUNTING POLICIES (Cont'd)
E. Cash and Cash Eguivalents and Investments:
Cash and cash equivalents include petty cash and cash in banks. Certificates of deposit with maturities of one year or less when purchased are stated at cost.
New Jersey school districts are limited as to type of investments and types of financial institutions they may invest in. New Jersey Statute 18A:20-37 provides a list of permissible investments that may be purchased by New Jersey school districts. Additionally, the District has adopted a cash management plan that requires it to deposit public funds in public depositories protected from loss under the provisions of the Governmental Unit Deposit Protection Act (GUDP A). GUDPA was enacted in 1970 to protect Governmental Units from a loss of funds on deposit with a failed banking institution in New Jersey.
N.J.S.A. 17:9-41 et seq. establishes the requirements for the security of deposits of governmental units. The statute requires that no governmental unit shall deposit public funds in a depository unless such funds are secured in accordance with the Act. Public depositories include Savings and Loan institutions, banks (both state and national banks) and savings banks the deposits of which are federally insured. All public depositories must pledge collateral, having a market value of at least equal to five percent of the average daily balance of collected public funds, to secure the deposits of Government Units. If a public depository fails, the collateral it has pledged, plus the collateral of all the other public depositories, is available to pay the full amount of their deposits to the Governmental Units.
F. Interfund Transactions:
Transfers between governmental and business-type activities on the District-wide statements are reported in the same manner as general revenues. Flows of cash or goods from one fund to another without a requirement for repayment are reported as interfund transfers. Interf und transfers are reported as other financing sources/uses in governmental funds and after non-operating revenues/expenses in the enterprise funds. Repayments from funds responsible for particular expenditures/expenses to the funds that initially paid for them are not presented on the financial statements.
On fund financial statements, short-term interfund loans are classified as interfund receivables/payables. These amounts are eliminated in the statement of net position, except for amounts due between governmental and business-type activities, which are presented as internal balances.
G. Allowance for Uncollectible Accounts:
No allowance for uncollectible accounts has been recorded as all amounts are considered collectible.
H. Encumbrances:
Under encumbrance accounting purchase orders, contracts and other commitments for the expenditure of resources are recorded to reserve a portion of the applicable appropriation. Open encumbrances in governmental funds other than the special revenue fund are reported as restricted, committed or assigned fund balances at fiscal year-end as they do not constitute expenditures or liabilities but rather commitments related to unperformed contracts for goods and services.
Open encumbrances in the special revenue fund for which the District has received advances are reflected in the balance sheet as unearned revenue at fiscal year end.
Page 45
SCOTCH PLAINS-FANWOOD REGIONAL SCHOOL DISTRICT NOTES TO THE BASIC FINANCIAL STATEMENTS
FOR THE FISCAL YEAR ENDED JUNE 30, 2014 (Continued)
NOTE l. SUMMARY OF SIGNIFICANT ACCOUNTING POLICIES (Cont'd)
H. Encumbrances: (Cont'd)
The encumbered appropriation authority carries over into the next fiscal year. An entry will be made at the beginning of the next fiscal year to increase the appropriation reflected in the certified budget by the outstanding encumbrance amount as of the current fiscal year end.
I. Short-term Interfund Receivables/Payables:
Short-term interfund receivables/payables represent amounts that are owed, other than charges for goods or services rendered to/from a particular fund in the District and that are due within one year.
J. Inventories and Prepaid Expenses:
Inventories which benefit future periods, other than those recorded in the enterprise fund, are recorded as an expenditure during the year of purchase.
Enterprise fund inventories are valued at cost, which approximates market, using the first-in, first-out (FIFO) method. Prepaid expenses in the enterprise and general funds represent payments made to vendors for services that will benefit periods beyond June 30, 2014.
K. Capital Assets:
During the year ended June 30, 1994, the District established a formal system of accounting for its capital assets. Capital assets acquired or constructed subsequent to June 30, 1994, are recorded at historical cost, including ancillary charges necessary to place the asset into service. Capital assets acquired or constructed prior to the establishment of the formal system are valued at cost based on historical records or through estimation procedures performed by an independent appraisal company. Land has been recorded at estimated historical cost. Donated capital assets are valued at their estimated fair market value on the date received. The cost of normal maintenance and repairs is not capitalized. The District does not possess any infrastructure. Capital assets have been reviewed for impairment.
The capitalization threshold (the dollar value above which asset acquisitions are added to the capital asset accounts) is $2,000. The depreciation method is straight-line. The estimated useful lives of capital assets reported in the District-wide statements and proprietary funds are as follows:
Buildings Building Improvements Machinery and Equipment Office and Computer Equipment Vehicles
Estimated Useful Life
50 years 20 to 30 years 10 to 15 years 5 to 10 years 8 years
In the fund financial statements, capital assets used in governmental fund operations are accounted for as capital outlay expenditures in the governmental fund upon acquisition. Capital assets are not capitalized and related depreciation is not reported in the fund financial statements.
Page 46
SCOTCH PLAINS-FANWOOD REGIONAL SCHOOL DISTRICT NOTES TO THE BASIC FINANCIAL STATEMENTS
FOR THE FISCAL YEAR ENDED JUNE 30, 2014 (Continued)
NOTE l. SUMMARY OF SIGNIFICANT ACCOUNTING POLICIES (Cont'd)
L. Long Term Liabilities:
In the District-wide and enterprise fund statements of net position, long-term debt and other long-term obligations are reported as liabilities in the applicable government activities, business-type activities, or enterprise funds. Bond premium and discounts, are reported as deferred charges and amortized over the term of the related debt using the straight-line method of amortization. In the fund financial statements, governmental fund types recognize bond discounts as expenditures in the current period. The face amount of debt issued is reported as other financing sources. Premiums received on debt issuances are reported as other financing sources while discounts on debt issuances are reported as other financing uses.
M. Accrued Salaries and Wages:
The District does not allow employees who provide services over the ten-month academic year the option to have their salaries evenly distributed during the entire twelve-month year; therefore, there are no accrued salaries and wages as of June 30, 2014.
N. Compensated Absences:
The District accounts for compensated absences (e.g., unused vacation, sick leave) as directed by Governmental Accounting Standards Board Statement No. 16 (GASB 16), Accounting for Compensated Absences. A liability for compensated absences attributable to services already rendered and not contingent on a specific event that is outside the control of the employer and employee is accrued as employees earn the rights to the benefits.
District employees are granted varying amounts of vacation and sick leave in accordance with the District's personnel policy. Upon termination, employees are paid for accrued vacation. The District's policy permits employees to accumulate unused sick leave and carry forward the full amount to subsequent years. Upon retirement, employees shall be paid by the District for the unused sick leave in accordance with the District's agreements with the various employee unions.
In addition, the Board of Education has cooperated with the Education Association in the establishment of a Sick Leave Bank. Any Association member may participate in the Bank on a voluntary basis by donating one personal day to the Sick Leave Bank.
In the District-wide Statement of Net Position, the liabilities whose average maturities are greater than one year should be reported in two components - the amount due within one year and the amount due beyond one year.
0. Unearned Revenue:
Unearned revenue in the special revenue fund represents cash which has been received but not yet earned. See Note l(D) regarding the special revenue fund.
Page 47
SCOTCH PLAINS-FANWOOD REGIONAL SCHOOL DISTRICT NOTES TO THE BASIC FINANCIAL STATEMENTS
FOR THE FISCAL YEAR ENDED JUNE 30, 2014 (Continued)
NOTE 1. SUMMARY OF SIGNIFICANT ACCOUNTING POLICIES (Cont'd)
P. Fund Balance Appropriated:
General Fund: Of the $13,914,951 General Fund balance at June 30, 2014, $1,448,626 is assigned for encumbrances; $8,432,126 is restricted ($6,057,858 in the capital reserve account and $2,374,268 in the maintenance reserve account); $2,000,000 is restricted for excess surplus in accordance with N.J.S.A. 18A:7F-7, as amended ($1,000,000 is prior year excess surplus which is included as anticipated revenue for the fiscal year ending June 30, 2015 and the remaining $1,000,000 is current year excess surplus which will be included as anticipated revenue for the fiscal year ending June 30, 2016); and $2,034,199 is unassigned which is $257,429 less on the GAAP basis than the calculated maximum unassigned fund balance due to the June state aid payments that are not recognized until the fiscal year ending June 30, 2015.
Special Revenue Fund: There is a deficit fund balance of $4,950 in the Special Revenue Fund on a GAAP basis due to the June state aid payments that are not recognized until the fiscal year ending June 30, 2015.
Capital Projects Fund: The Capital Projects Fund balance at June 30, 2014 of $1,756,682 is committed for capital projects which is $1,573,307 less on the GAAP basis due to SDA grants which have not been recognized.
Calculation of Excess Surplus: In accordance with N.J.S.A. 18A:7F-7 as amended, the designation for Restricted Fund Balance-Excess Surplus is a required calculation pursuant to the New Jersey Comprehensive Educational Improvement and Financing Act of 1996 (CEJFA). New Jersey school districts are required to restrict General Fund balance at the fiscal year end of June 30 if they did not appropriate a required minimum amount as budgeted fund balance in their subsequent year's budget. The District had excess surplus at June 30, 2014 as defined above.
The District's unassigned fund balance in the General Fund is less on a GAAP basis than the budgetary basis by $257,429 as reported in the fund statements (modified accrual basis) and the Special Revenue Fund by $4,950 as reported in the fund statements (grant accounting budgetary basis). N.J.A.C. 6A:23A-8.5(j) provides that in the event a state school aid payment is not made until the following school budget year, districts must record the delayed June state aid payments as revenue, for budget purposes only, in the current school budget year. The bill provides legal authority for school districts to recognize this revenue in the current budget year. For intergovernmental transactions, GASB Statement No. 33 requires that recognition (revenue, expenditure, asset, liability) should be in symmetry, i.e., if one government recognizes an asset, the other government recognizes a liability. Since the State is recording the June state aid payments in the subsequent fiscal year, the School District cannot recognize the June state aid payments on the GAAP financial statements until the year the State records the payable. The excess surplus calculation is calculated using the fund balance reported on the Budgetary Comparison Schedule, including the June state aid payments and not the fund balance reported on the fund statement which excludes the June state aid payments.
Page 48
SCOTCH PLAINS-FANWOOD REGIONAL SCHOOL DISTRICT NOTES TO THE BASIC FINANCIAL STATEMENTS
FOR THE FISCAL YEAR ENDED JUNE 30, 2014 (Continued)
NOTE 1. SUMMARY OF SIGNIFICANT ACCOUNTING POLICIES (Cont'd)
Q. Fund Balance Restrictions, Commitments and Assignments:
The restricted fund balance category includes amounts that can be spent only for the specific purposes stipulated by constitution, external resource providers, or through enabling legislation. The committed fund balance classification includes amounts that can be used only for the specific purposes determined for a formal action of the District's highest level of decision-making authority. Amounts in the assigned fund balance classification are intended to be used by the government for specific purposes but do not meet the criteria to be classified as restricted or committed. Unassigned fund balance is the residual classification for the District's General Fund and includes all spendable amounts not contained in the other classifications. In other funds, the unassigned classifications should be used only to report a deficit balance resulting from overspending for specific purposes for which amounts have been restricted, committed or assigned.
Fund balance restrictions have been established for excess surplus, a capital reserve and a maintenance reserve.
The District Board of Education has the responsibility to formally commit resources for specific purposes through a motion or a resolution passed by a majority of the Members of the Board of Education at a public meeting of that governing body. The Board of Education must also utilize a formal motion or a resolution passed by a majority of the Members of the Board of Education at a public meeting of that governing body in order to remove or change the commitment of resources. The District had committed resources in the Capital Projects Fund at June 30, 2014.
The assignment of resources is generally made by the District Board of Education through a motion or a resolution passed by a majority of the Members of the Board of Education. These resources are intended to be used for a specific purpose. The process is not as restrictive as the commitment of resources and the Board of Education may allow an official of the District to assign resources through policies adopted by the Board of Education. The District has assigned resources for encumbrances and for amounts designated for subsequent year's expenditures in the General Fund at June 30, 2014.
R. Deficit Fund Balance:
The District has a deficit in unassigned fund balance in the Special Revenue Fund of $4,950 as of June 30, 2014 due to the non-recognition of the June state aid payments as explained in Note IP on the previous page. This deficit does not indicate that the District is in financial difficulties and is a permitted practice under generally accepted accounting principles.
S. Net Position:
The District implemented GASB Statement No. 63, Financial Reporting of Deferred Outflows of Resources, Deferred Inflows of Resources, and Net Position, during the prior fiscal year. This statement defines net position as the residual of all other elements presented in a statement of financial position. It is the difference between (a) assets and deferred outflows of resources and (b) liabilities and deferred inflows of resources. This Statement provides guidance for reporting net position within a framework that includes deferred outflows of resources and deferred inflows of resources, in addition to assets and liabilities.
Page 49
SCOTCH PLAINS-FANWOOD REGIONAL SCHOOL DISTRICT NOTES TO THE BASIC FINANCIAL STATEMENTS
FOR THE FISCAL YEAR ENDED JUNE 30, 2014 (Continued)
NOTE 1. SUMMARY OF SIGNIFICANT ACCOUNTING POLICIES (Cont'd)
S. Net Position: (Cont'd)
The District implemented GASB No. 65, Items Previously Reported as Assets and Liabilities, during the current fiscal year. This statement establishes accounting and financial reporting standards that reclassify, as deferred outflows of resources or deferred inflows of resources, certain items that were previously reported as assets and liabilities and recognizes, as outflows of resources or inflows of resources, certain items that were previously reported as assets and liabilities.
A deferred outflow of resources is a consumption of net position by the District that is applicable to a future reporting period. The District had a deferred outflow of resources at June 30, 2014 for the deferred amount on refunding of debt related to the District's 2010 refunding bonds.
A deferred inflow of resources is an acquisition of net position by the District that is applicable to a future reporting period. The District did not have any deferred inflows of resources at June 30, 2014.
Net position is displayed in three components - net investment in capital assets; restricted and unrestricted.
The net investment in capital assets component of net position consists of capital assets, net of accumulated depreciation, reduced by the outstanding balances of borrowings that are attributable to the acquisition, construction, or improvement of those assets. Deferred outflows of resources and deferred inflows of resources that are attributable to the acquisition, construction, or improvement of those assets or related debt also would be included in this component of net position.
The restricted component of net position consists of restricted assets reduced by liabilities and deferred inflows of resources related to those assets.
The unrestricted component of net position is the net amount of the assets, deferred outflows of resources, liabilities, and def erred inflows of resources that are not included in the determination of net investment in capital assets or the restricted component of net position.
T. Revenue - Exchange and Nonexchange Transactions:
Revenue, resulting from exchange transactions in which each party gives and receives essentially equal value, is recorded on the accrual basis when the exchange takes place. On the modified accrual basis, revenue is recorded in the fiscal year in which the resources are measurable and become available. Available means the resources will be collected within the current fiscal year or are expected to be collected soon enough thereafter to be used to pay liabilities of the current fiscal year. For the District, available means within sixty days of the fiscal year end.
Nonexchange transactions, in which the School District receives value without directly giving equal value in return, include property taxes, grants, entitlements and donations. On the accrual basis, revenue from property taxes is recognized in the fiscal year for which the taxes are levied. Revenue from grants, entitlements and donations is recognized in the fiscal year in which all eligibility requirements have been satisfied. Eligibility requirements include timing requirements, which specify the year when the resources are required to be used or the fiscal year when use is first permitted; matching requirements, in which the School District must provide local resources to be used for a specified purpose; and expenditure requirements, in which the resources are provided to the School District on a reimbursement basis. On the modified accrual basis, revenue from nonexchange transactions must also be available before it can be recognized.
Page 50
SCOTCH PLAINS-FANWOOD REGIONAL SCHOOL DISTRICT NOTES TO THE BASIC FINANCIAL STATEMENTS
FOR THE FISCAL YEAR ENDED JUNE 30, 2014 (Continued)
NOTE 1. SUMMARY OF SIGNIFICANT ACCOUNTING POLICIES (Cont'd)
T. Revenue - Exchange and Nonexchange Transactions: (Cont'd)
Under the modified accrual basis, the following revenue sources are considered to be both measurable and available at fiscal year-end: property taxes, interest and tuition.
U. Operating Revenue and Expenses:
Operating revenue are those revenues that are generated directly from the primary activities of the Enterprise Funds. For the School District, these revenues are sales for food service and fees for the summer community education program. Operating expenses are necessary costs incurred to provide the services that are the primary activities of the Enterprise Funds.
V. Management Estimates:
The preparation of financial statements in conformity with GAAP requires management to make estimates and assumptions that affect the reported amounts of revenue and expenditures/expenses during the reporting period. Actual results could differ from those estimates.
NOTE 2. EXPLANATION OF CERTAIN DIFFERENCES BETWEEN GOVERNMENTAL FUND STATEMENTS AND DISTRICT-WIDE STATEMENTS
Due to the differences in the measurement focus and basis of accounting used on the governmental fund statements and District-wide statements, certain financial transactions are treated differently. The basic financial statements contain a full reconciliation of these items.
NOTE 3. CASH AND CASH EQUIVALENTS AND INVESTMENTS
Cash and cash equivalents include petty cash, change funds, amounts in deposits, money market accounts, and short-term investments with original maturities of three months or less.
Investments are stated at cost, which approximates market. The Board classifies certificates of deposit which have original maturity dates of more than three months but less than twelve months from the date of purchase, as investments.
GASB Statement No. 40, Governmental Accounting Standards Board Deposit and Investment Risk Disclosures, requires disclosure of the level of custodial credit risk assumed by the Board in its cash, cash equivalents and investments, if those items are uninsured or unregistered. Custodial credit risk is the risk that in the event of a bank failure, the government's deposits may not be returned.
Interest Rate Risk In accordance with its cash management plan, the Board ensures that any deposit or investment matures within the time period that approximates the prospective need for the funds, deposited or invested, so that there is not a risk to the market value of such deposits or investments.
Credit Risk - The Board limits its investments to those authorized in its cash management plan which are those permitted under state statute as detailed on the following page.
Deposits:
New Jersey statutes permit the deposit of public funds in institutions located in New Jersey, which are insured by the Federal Deposit Insurance Corporation (FDIC) or by any other agencies of the United States that insure deposits or the State of New Jersey Cash Management Fund.
Page 51
SCOTCH PLAINS-FANWOOD REGIONAL SCHOOL DISTRICT NOTES TO THE BASIC FINANCIAL STATEMENTS
FOR THE FISCAL YEAR ENDED JUNE 30, 2014 (Continued)
NOTE 3. CASH AND CASH EQUIVALENTS AND INVESTMENTS (Cont'd)
Deposits: (Cont'd)
New Jersey statutes require public depositories to maintain collateral for deposits of public funds that exceed insurance limits as follows:
The market value of the collateral must equal 5% of the average daily balance of public funds on deposit, and
In addition to the above collateral requirement, if public funds deposited exceed 75% of the capital funds of the depository, the depository must provide collateral having a market value at least equal to 100% of the amount exceeding 75%.
All collateral must be deposited with the Federal Reserve Bank, the Federal Home Loan Bank Board or a banking institution that is a member of the Federal Reserve System and has capital funds of not less than $25,000,000.
Investments:
New Jersey statutes permit the District to purchase the following types of securities:
( 1) Bonds or other obligations of the United States of America or obligations guaranteed by the United States of America;
(2) Government money market mutual funds;
(3) Any obligation that a federal agency or a federal instrumentality has issued in accordance with an act of Congress, which security has a maturity date not greater than 397 days from the date of purchase, provided that such obligation bears a fixed rate of interest not dependent on any index or other external factor;
(4) Bonds or other obligations, having a maturity date not more than 397 days from the date of purchase, approved by the Division of Investment of the Department of the Treasury for investment by local units;
(5) Local government investment pools;
(6) Deposits with the State of New Jersey Cash Management Fund; or
(7) Agreements for the repurchase of fully collateralized securities if:
(a) the underlying securities are permitted investments pursuant to paragraphs (1) and (3) above;
(b) the custody of collateral is transferred to a third party;
(c) the maturity of the agreement is not more than 30 days;
(d) the underlying securities are purchased through a public depository as defined in statute; and
( e) a master repurchase agreement providing for the custody and security of collateral is executed.
Page 52
SCOTCH PLAINS-FANWOOD REGIONAL SCHOOL DISTRICT NOTES TO THE BASIC FINANCIAL STATEMENTS
FOR THE FISCAL YEAR ENDED JUNE 30, 2014 (Continued)
NOTE 3. CASH AND CASH EQUIVALENTS AND INVESTMENTS (Cont'd)
As of June 30, 2014, cash and cash equivalents and investments of the District consisted of the following:
Checking Accounts
Cash and Cash Equivalents
$ 8,331,599
Restricted Cash and Cash Equivalents Reserve Accounts
Capital Maintenance
$ 6,057,858 $ 2,374,268
Total
$ 16,763,725
During the period ended June 30, 2014, the District did not hold any investments other than certificates of deposit. The carrying amount of the Board's cash and cash equivalents at June 30, 2014 was $16,763,725 and the bank balance was $19,081,940.
NOTE 4. CAPITAL RESERVE ACCOUNT
A capital reserve account was established by the Board for the accumulation of funds for use as capital outlay expenditures in subsequent fiscal years. The capital reserve account is maintained in the general fund and its activity is included in the general fund annual budget.
Funds placed in the capital reserve account are restricted to capital projects in the District's approved Long Range Facilities Plan (LRFP). Upon submission of the LRFP to the State Department of Education, a district may increase the balance in the capital reserve by appropriating funds in the annual general fund budget certified for taxes or by transfer by Board resolution at year end of any unanticipated revenue or unexpended line item appropriation amounts or both. A district may also appropriate additional amounts when the express approval of the voters has been obtained either by a separate proposal at budget time or by a special question at one of the four special elections authorized pursuant to N.J.S.A. 19:60-2. Pursuant to NJ.AC. 6:23A-5.l(d)7, the balance in the account cannot at any time exceed the local support costs of uncompleted capital projects in its approved LRFP.
The activity of the capital reserve for the July 1, 2013 to June 30, 2014 fiscal year is as follows:
Beginning Balance, July l, 2013
Interest Earnings Deposit by Budget Appropriation Deposit by Board Resolution - June 26, 2014 Withdrawals
Ending Balance, June 30, 2014
$ 4,749,323
2,370 274,596
3,926,467 (2,894,898)
$ 6,057,858
The balance in the capital reserve account at June 30, 2014 does not exceed the balance of local support costs of uncompleted capital projects in the District's Long Range Facilities Plan ("LRFP"). Withdrawals from the capital reserve were for use in DOE approved facilities projects, consistent with the District's LRFP.
Page 53
SCOTCH PLAINS-FANWOOD REGIONAL SCHOOL DISTRICT NOTES TO THE BASIC FINANCIAL STATEMENTS
FOR THE FISCAL YEAR ENDED JUNE 30, 2014 (Continued)
NOTE 5. MAINTENANCE RESERVE ACCOUNT
A maintenance reserve account in the amount of $200,000 was established by Board resolution on June 25, 2009. These funds may be used for specific activities necessary for the purpose of keeping a school facility open and safe for use or in its original condition, and for keeping its constituent buildings systems fully and efficiently functional and for keeping their warranties valid but cannot be used for routine or capital maintenance. The purpose of the reserve is to provide funds for anticipated expenditures required to maintain a building.
Pursuant to N.J.A.C. 6A:26A-4.2 funds may be deposited into the maintenance reserve account at any time by board resolution to meet the required maintenance of the District by transferring unassigned general fund balance or by transferring excess unassigned general fund balance that is anticipated to be deposited during the current year in the advertised recapitulation of balances of the subsequent year's budget that is certified for taxes. Funds may be withdrawn from the maintenance reserve account and appropriated into the required maintenance account lines at budget time or any time during the year by Board resolution for use on required maintenance activities by school facility as reported in the comprehensive maintenance plan. Funds withdrawn from the maintenance reserve account are restricted to required maintenance appropriations and may not be transferred to any other line-item account. In any year that maintenance reserve account funds are withdrawn, unexpended required maintenance appropriations, up to the amount of maintenance reserve account funds withdrawn, shall be restored to the maintenance reserve account at year-end. At no time, shall the maintenance reserve account have a balance that exceeds four percent of the replacement cost of the current year of the District's school facilities. If the account exceeds this maximum amount at June 30, the excess shall be restricted and designated in the subsequent year's budget. The maintenance reserve account is maintained in the general fund and its activity is included in the general fund annual budget.
The activity of the maintenance reserve for the July 1, 2013 to June 30, 2014 fiscal year is as follows:
Beginning Balance, July 1, 2013
Interest Earnings
Ending Balance, June 30, 2014
NOTE 6: TRANSFERS TO CAPITAL OUTLAY
$ 2,371,896
2,372
$ 2,374,268
During the year ended June 30, 2014, the District transferred $271,283 to the capital outlay accounts; $67,530 for equipment for which approval from the County Superintendent was not required and $203,753 for facilities acquisition and construction services which required approval from the County Superintendent.
Page 54
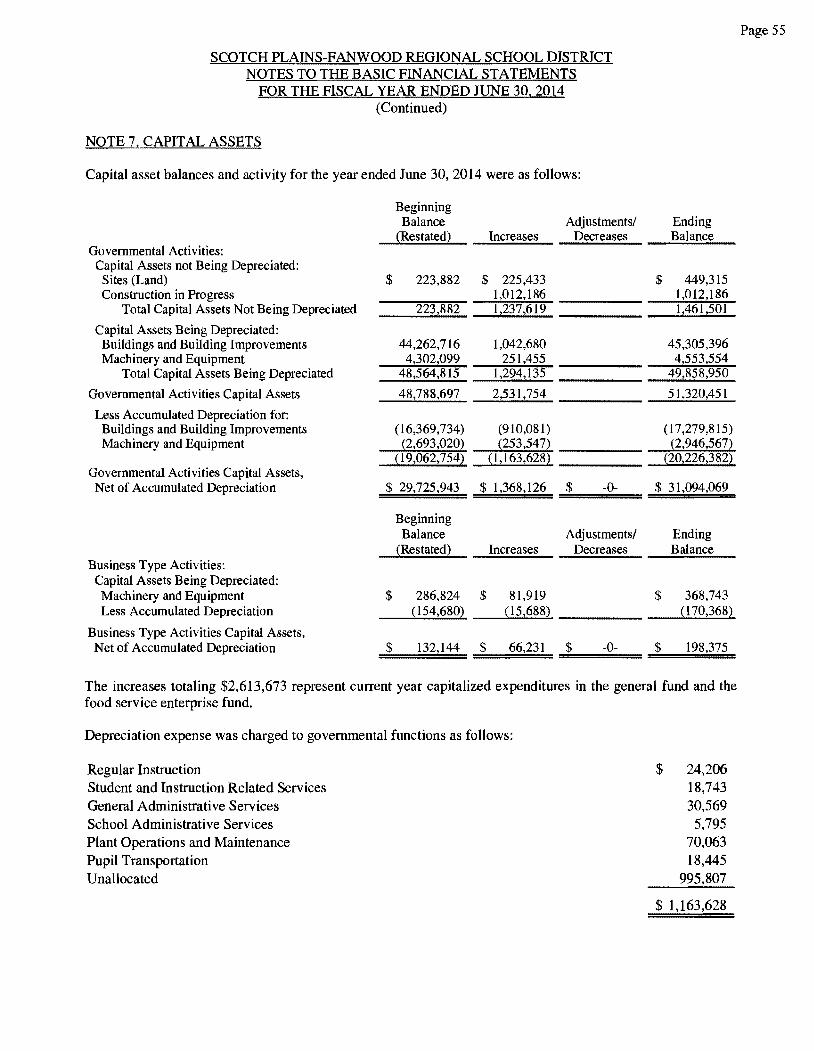
SCOTCH PLAINS-FANWOOD REGIONAL SCHOOL DISTRICT NOTES TO THE BASIC FINANCIAL STATEMENTS
FOR THE FISCAL YEAR ENDED JUNE 30. 2014 (Continued)
NOTE 7. CAPITAL ASSETS
Capital asset balances and activity for the year ended June 30, 2014 were as follows:
Beginning Balance Adjustments/ ~Restated2 Increases Decreases
Governmental Activities: Capital Assets not Being Depreciated: Sites (Land) $ 223,882 $ 225,433 Construction in Progress 1,012,186
Total Capital Assets Not Being Depreciated 223,882 1,237,619
Capital Assets Being Depreciated: Buildings and Building Improvements 44,262,716 1,042,680 Machinery and Equipment 4,302,099 251,455
Total Capital Assets Being Depreciated 48,564,815 1,294,135
Governmental Activities Capital Assets 48,788,697 2,531,754
Less Accumulated Depreciation for: Buildings and Building Improvements (16,369,734) (910,081) Machinery and Equipment {2,693,020) ~253,547)
~19,062,7542 ~l,163,6282 Governmental Activities Capital Assets, Net of Accumulated Depreciation $ 29,725,943 $ 1.368,126 $ -0-
Beginning Balance Adjustments/ ~Restated) Increases Decreases
Business Type Activities: Capital Assets Being Depreciated: Machinery and Equipment $ 286,824 $ 81,919 Less Accumulated Depreciation ~154,6802 ~15,688~
Business Type Activities Capital Assets, Net of Accumulated Depreciation $ 132,144 $ 66,231 $ -0-
Ending Balance
$ 449,315 l,012,186 1,461,501
45,305,396 4,553,554
49,858,950
51,320,451
(17,279,815) (2,946,5672
~20,226,3822
$ 31,094,069
Ending Balance
$ 368,743 il70,3682
$ 198,375
The increases totaling $2,613,673 represent current year capitalized expenditures in the general fund and the food service enterprise fund.
Depreciation expense was charged to governmental functions as follows:
Regular Instruction Student and Instruction Related Services General Administrative Services School Administrative Services Plant Operations and Maintenance Pupil Transportation Unallocated
$ 24,206 18,743 30,569 5,795
70,063 18,445
995,807
$ 1,163,628
Page 55
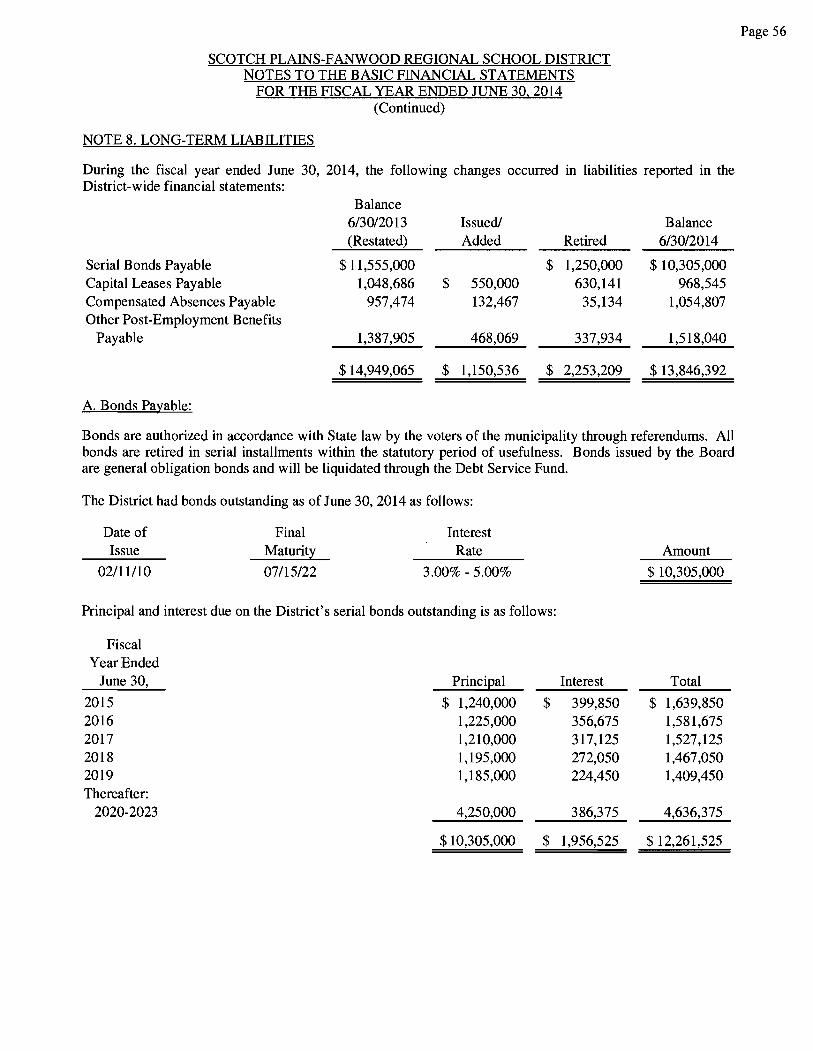
SCOTCH PLAINS-FANWOOD REGIONAL SCHOOL DISTRICT NOTES TO THE BASIC FINANCIAL STATEMENTS
FOR THE FISCAL YEAR ENDED JUNE 30. 2014 (Continued)
NOTE 8. LONG-TERM LIABILITIES
During the fiscal year ended June 30, 2014, the following changes occurred in liabilities reported in the District-wide financial statements:
Balance 6/30/2013 Issued/ Balance (Restated) Added Retired 6/30/2014
Serial Bonds Payable $ 11,555,000 $ 1,250,000 $ 10,305,000 Capital Leases Payable 1,048,686 $ 550,000 630,141 968,545 Compensated Absences Payable 957,474 132,467 35,134 1,054,807 Other Post-Employment Benefits
Payable 1,387,905 468,069 337,934 1,518,040
$ 14,949,065 $ 1,150,536 $ 2,253,209 $ 13,846,392
A. Bonds Payable:
Bonds are authorized in accordance with State law by the voters of the municipality through referendums. All bonds are retired in serial installments within the statutory period of usefulness. Bonds issued by the Board are general obligation bonds and will be liquidated through the Debt Service Fund.
The District had bonds outstanding as of June 30, 2014 as follows:
Date of Issue
02/11/10
Final Maturity
07/15/22
Interest Rate
3.00% - 5.00%
Principal and interest due on the District's serial bonds outstanding is as follows:
Fiscal Year Ended
June 30, PrinciEal
2015 $ 1,240,000 $ 2016 1,225,000 2017 1,210,000 2018 1,195,000 2019 1,185,000 Thereafter:
2020-2023 4,250,000
$ 10,305,000 $
Amount
$ 10,305,000
Interest Total
399,850 $ 1,639,850 356,675 1,581,675 317,125 1,527,125 272,050 1,467,050 224,450 1,409,450
386,375 4,636,375
1,956,525 $ 12,261,525
Page 56
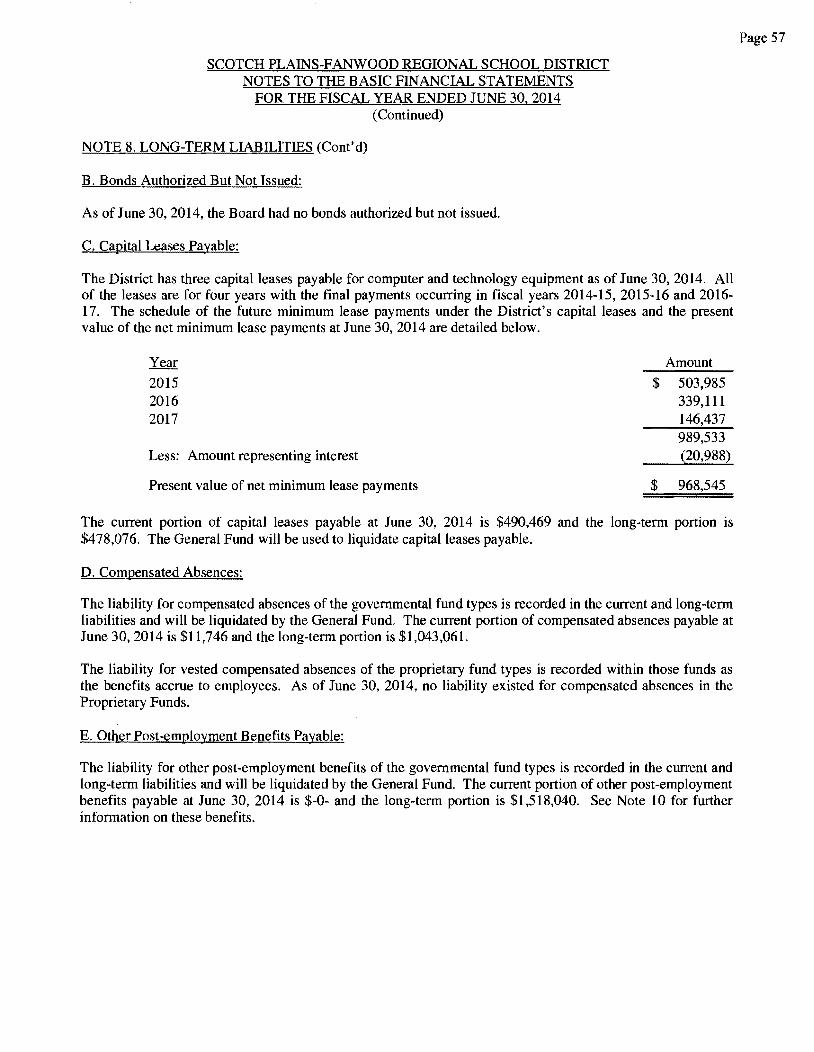
SCOTCH PLAINS-FANWOOD REGIONAL SCHOOL DISTRICT NOTES TO THE BASIC FINANCIAL STATEMENTS
FOR THE FISCAL YEAR ENDED JUNE 30, 2014 (Continued)
NOTE 8. LONG-TERM LIABILITIES (Cont'd)
B. Bonds Authorized But Not Issued:
As of June 30, 2014, the Board had no bonds authorized but not issued.
C. Capital Leases Payable:
The District has three capital leases payable for computer and technology equipment as of June 30, 2014. All of the leases are for four years with the final payments occurring in fiscal years 2014-15, 2015-16 and 2016-17. The schedule of the future minimum lease payments under the District's capital leases and the present value of the net minimum lease payments at June 30, 2014 are detailed below.
Year
2015 2016 2017
Less: Amount representing interest
Present value of net minimum lease payments
Amount
$ 503,985 339,111 146,437 989,533 (20,988)
$ 968,545
The current portion of capital leases payable at June 30, 2014 is $490,469 and the long-term portion is $478,076. The General Fund will be used to liquidate capital leases payable.
D. Compensated Absences:
The liability for compensated absences of the governmental fund types is recorded in the current and long-term liabilities and will be liquidated by the General Fund. The current portion of compensated absences payable at June 30, 2014 is $11,746 and the long-term portion is $1,043,061.
The liability for vested compensated absences of the proprietary fund types is recorded within those funds as the benefits accrue to employees. As of June 30, 2014, no liability existed for compensated absences in the Proprietary Funds.
E. Other Post-employment Benefits Payable:
The liability for other post-employment benefits of the governmental fund types is recorded in the current and long-term liabilities and will be liquidated by the General Fund. The current portion of other post-employment benefits payable at June 30, 2014 is $-0- and the long-term portion is $1,518,040. See Note 10 for further information on these benefits.
Page 57
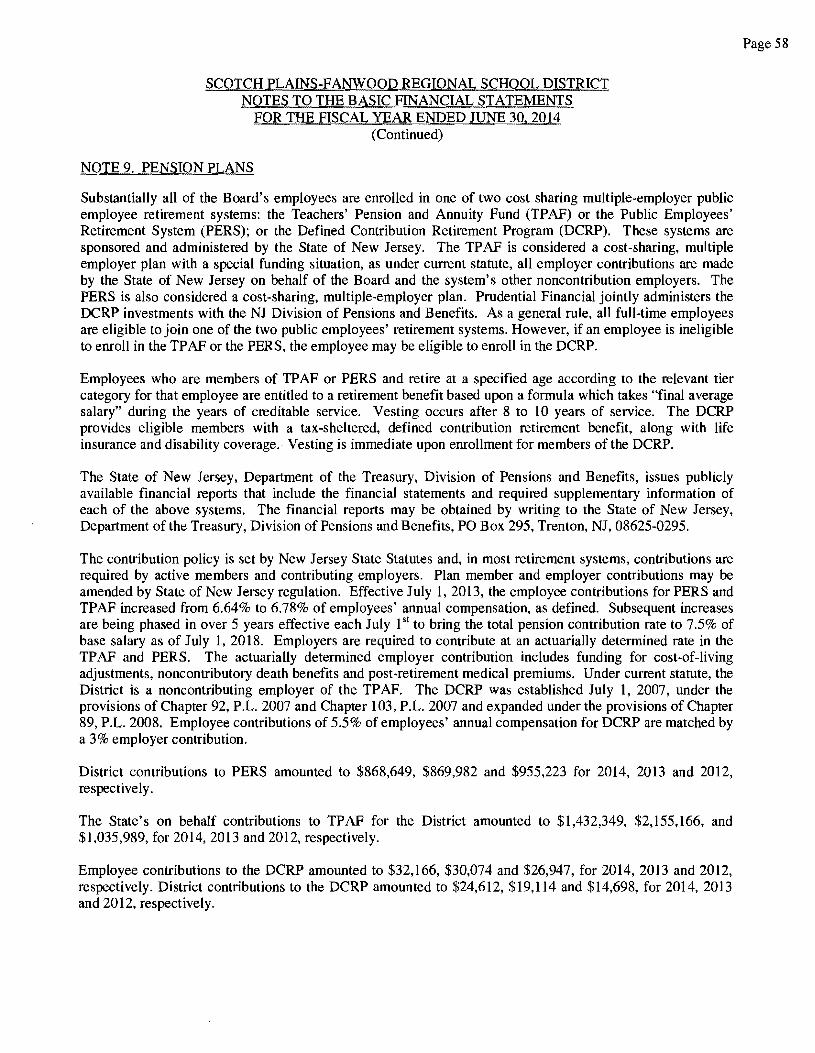
SCOTCH PLAINS-FANWOOD REGIONAL SCHOOL DISTRICT NOTES TO THE BASIC FINANCIAL STATEMENTS
NOTE 9. PENSION PLANS
FOR THE FISCAL YEAR ENDED JUNE 30, 2014 (Continued)
Substantially all of the Board's employees are enrolled in one of two cost sharing multiple-employer public employee retirement systems: the Teachers' Pension and Annuity Fund (TPAF) or the Public Employees' Retirement System (PERS); or the Defined Contribution Retirement Program (DCRP). These systems are sponsored and administered by the State of New Jersey. The TPAF is considered a cost-sharing, multiple employer plan with a special funding situation, as under current statute, all employer contributions are made by the State of New Jersey on behalf of the Board and the system's other noncontribution employers. The PERS is also considered a cost-sharing, multiple-employer plan. Prudential Financial jointly administers the DCRP investments with the NJ Division of Pensions and Benefits. As a general rule, all full-time employees are eligible to join one of the two public employees' retirement systems. However, if an employee is ineligible to enroll in the TPAF or the PERS, the employee may be eligible to enroll in the DCRP.
Employees who are members of TP AF or PERS and retire at a specified age according to the relevant tier category for that employee are entitled to a retirement benefit based upon a formula which takes "final average salary" during the years of creditable service. Vesting occurs after 8 to 10 years of service. The DCRP provides eligible members with a tax-sheltered, defined contribution retirement benefit, along with life insurance and disability coverage. Vesting is immediate upon enrollment for members of the DCRP.
The State of New Jersey, Department of the Treasury, Division of Pensions and Benefits, issues publicly available financial reports that include the financial statements and required supplementary information of each of the above systems. The financial reports may be obtained by writing to the State of New Jersey, Department of the Treasury, Division of Pensions and Benefits, PO Box 295, Trenton, NJ, 08625-0295.
The contribution policy is set by New Jersey State Statutes and, in most retirement systems, contributions are required by active members and contributing employers. Plan member and employer contributions may be amended by State of New Jersey regulation. Effective July 1, 2013, the employee contributions for PERS and TPAF increased from 6.64% to 6.78% of employees' annual compensation, as defined. Subsequent increases are being phased in over 5 years effective each July 1st to bring the total pension contribution rate to 7.5% of base salary as of July 1, 2018. Employers are required to contribute at an actuarially determined rate in the TP AF and PERS. The actuarially determined employer contribution includes funding for cost-of-living adjustments, noncontributory death benefits and post-retirement medical premiums. Under current statute, the District is a noncontributing employer of the TPAF. The DCRP was established July 1, 2007, under the provisions of Chapter 92, P.L. 2007 and Chapter 103, P.L. 2007 and expanded under the provisions of Chapter 89, P.L. 2008. Employee contributions of 5.5% of employees' annual compensation for DCRP are matched by a 3% employer contribution.
District contributions to PERS amounted to $868,649, $869,982 and $955,223 for 2014, 2013 and 2012, respectively.
The State's on behalf contributions to TPAF for the District amounted to $1,432,349, $2,155,166, and $1,035,989, for 2014, 2013 and 2012, respectively.
Employee contributions to the DCRP amounted to $32,166, $30,074 and $26,947, for 2014, 2013 and 2012, respectively. District contributions to the DCRP amounted to $24,612, $19,114 and $14,698, for 2014, 2013 and 2012, respectively.
Page 58
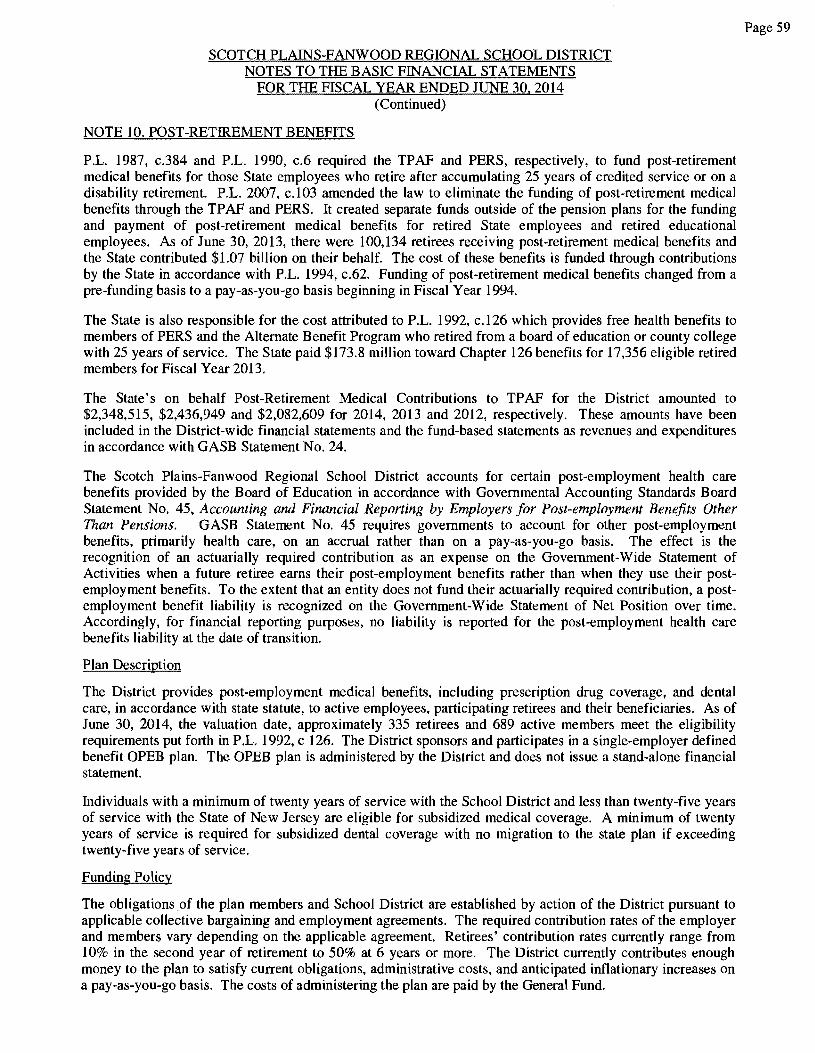
SCOTCH PLAINS-FANWOOD REGIONAL SCHOOL DISTRICT NOTES TO THE BASIC FINANCIAL STATEMENTS
FOR THE FISCAL YEAR ENDED JUNE 30, 2014 (Continued)
NOTE 10. POST-RETIREMENT BENEFITS
P.L. 1987, c.384 and P.L. 1990, c.6 required the TPAF and PERS, respectively, to fund post-retirement medical benefits for those State employees who retire after accumulating 25 years of credited service or on a disability retirement. P.L. 2007, c.103 amended the law to eliminate the funding of post-retirement medical benefits through the TP AF and PERS. It created separate funds outside of the pension plans for the funding and payment of post-retirement medical benefits for retired State employees and retired educational employees. As of June 30, 2013, there were 100,134 retirees receiving post-retirement medical benefits and the State contributed $1.07 billion on their behalf. The cost of these benefits is funded through contributions by the State in accordance with P.L. 1994, c.62. Funding of post-retirement medical benefits changed from a pre-funding basis to a pay-as-you-go basis beginning in Fiscal Year 1994.
The State is also responsible for the cost attributed to P.L. 1992, c.126 which provides free health benefits to members of PERS and the Alternate Benefit Program who retired from a board of education or county college with 25 years of service. The State paid $173.8 million toward Chapter 126 benefits for 17,356 eligible retired members for Fiscal Year 2013.
The State's on behalf Post-Retirement Medical Contributions to TPAF for the District amounted to $2,348,515, $2,436,949 and $2,082,609 for 2014, 2013 and 2012, respectively. These amounts have been included in the District-wide financial statements and the fund-based statements as revenues and expenditures in accordance with GASB Statement No. 24.
The Scotch Plains-Fanwood Regional School District accounts for certain post-employment health care benefits provided by the Board of Education in accordance with Governmental Accounting Standards Board Statement No. 45, Accounting and Financial Reporting by Employers for Post-employment Benefits Other Than Pensions. GASB Statement No. 45 requires governments to account for other post-employment benefits, primarily health care, on an accrual rather than on a pay-as-you-go basis. The effect is the recognition of an actuarially required contribution as an expense on the Government-Wide Statement of Activities when a future retiree earns their post-employment benefits rather than when they use their postemployment benefits. To the extent that an entity does not fund their actuarially required contribution, a postemployment benefit liability is recognized on the Government-Wide Statement of Net Position over time. Accordingly, for financial reporting purposes, no liability is reported for the post-employment health care benefits liability at the date of transition.
Plan Description
The District provides post-employment medical benefits, including prescription drug coverage, and dental care, in accordance with state statute, to active employees, participating retirees and their beneficiaries. As of June 30, 2014, the valuation date, approximately 335 retirees and 689 active members meet the eligibility requirements put forth in P.L. 1992, c 126. The District sponsors and participates in a single-employer defined benefit OPEB plan. The OPEB plan is administered by the District and does not issue a stand-alone financial statement.
Individuals with a minimum of twenty years of service with the School District and less than twenty-five years of service with the State of New Jersey are eligible for subsidized medical coverage. A minimum of twenty years of service is required for subsidized dental coverage with no migration to the state plan if exceeding twenty-five years of service.
Funding Policy
The obligations of the plan members and School District are established by action of the District pursuant to applicable collective bargaining and employment agreements. The required contribution rates of the employer and members vary depending on the applicable agreement. Retirees' contribution rates currently range from 10% in the second year of retirement to 50% at 6 years or more. The District currently contributes enough money to the plan to satisfy current obligations, administrative costs, and anticipated inflationary increases on a pay-as-you-go basis. The costs of administering the plan are paid by the General Fund.
Page 59
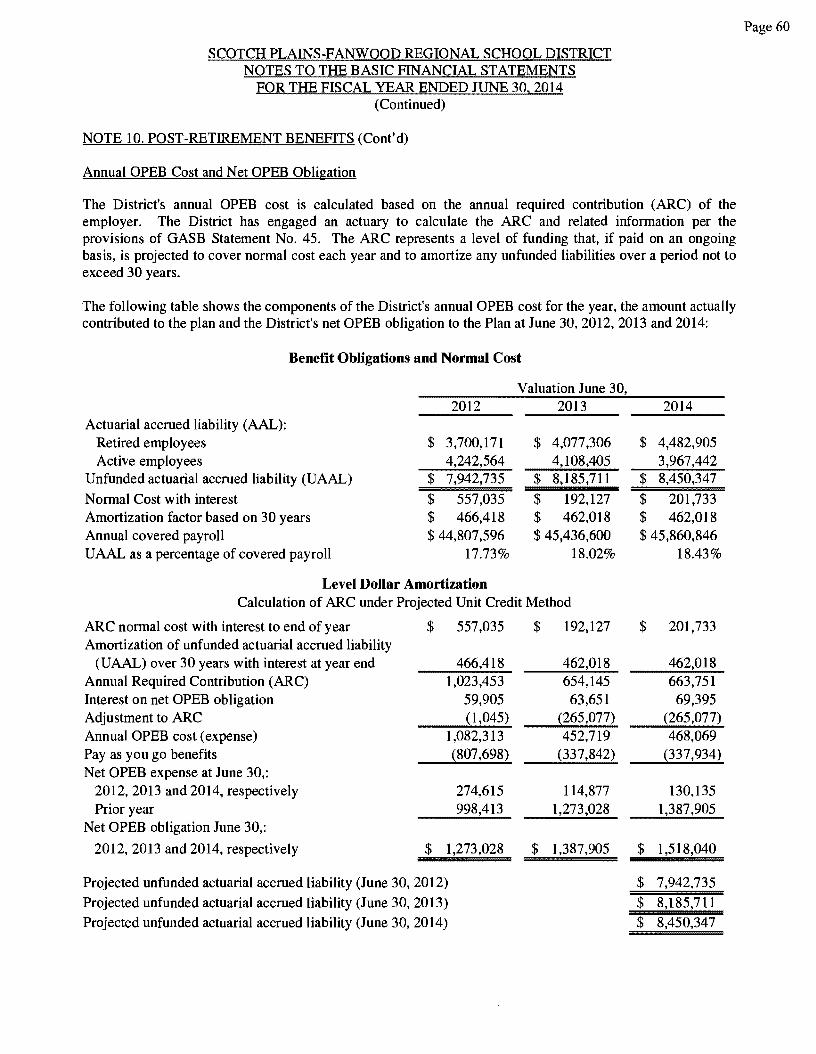
SCOTCH PLAINS-FANWOOD REGIONAL SCHOOL DISTRICT NOTES TO THE BASIC FINANCIAL STATEMENTS
FOR THE FISCAL YEAR ENDED JUNE 30, 2014 (Continued)
NOTE 10. POST-RETIREMENT BENEFITS (Cont'd)
Annual OPEB Cost and Net OPEB Obligation
The District's annual OPEB cost is calculated based on the annual required contribution (ARC) of the employer. The District has engaged an actuary to calculate the ARC and related information per the provisions of GASB Statement No. 45. The ARC represents a level of funding that, if paid on an ongoing basis, is projected to cover normal cost each year and to amortize any unfunded liabilities over a period not to exceed 30 years.
The following table shows the components of the District's annual OPEB cost for the year, the amount actually contributed to the plan and the District's net OPEB obligation to the Plan at June 30, 2012, 2013 and 2014:
Benefit Obligations and Normal Cost
Valuation June 30, 2012 2013
Actuarial accrued liability (AAL): Retired employees $ 3,700,171 $ 4,077,306 Active employees 4,242,564 4,108,405
Unfunded actuarial accrued liability (UAAL) $ 7,942,735 $ 8,185,711
Normal Cost with interest $ 557,035 $ 192,127 Amortization factor based on 30 years $ 466,418 $ 462,018 Annual covered payroll $ 44,807 ,596 $ 45,436,600 UAAL as a percentage of covered payroll 17.73% 18.02%
Level Dollar Amortization Calculation of ARC under Projected Unit Credit Method
ARC normal cost with interest to end of year Amortization of unfunded actuarial accrued liability
(UAAL) over 30 years with interest at year end Annual Required Contribution (ARC) Interest on net OPEB obligation Adjustment to ARC Annual OPEB cost (expense) Pay as you go benefits Net OPEB expense at June 30,:
2012, 2013 and 2014, respectively Prior year
Net OPEB obligation June 30,:
2012, 2013 and 2014, respectively
$ 557,035
466,418 1,023,453
59,905 (1,045)
1,082,313 (807,698)
274,615 998,413
$ 1,273,028
Projected unfunded actuarial accrued liability (June 30, 2012) Projected unfunded actuarial accrued liability (June 30, 2013) Projected unfunded actuarial accrued liability (June 30, 2014)
$ 192,127
462,018 654,145 63,651
(265,077) 452,719
(337,842)
114,877 1,273,028
$ 1,387,905
2014
$ 4,482,905 3,967,442
$ 8,450,347
$ 201,733 $ 462,018 $ 45,860,846
18.43%
$ 201,733
462,018 663,751
69,395 (265,077) 468,069
(337,934)
130,135 1,387,905
$ 1,518,040
$ 7,942,735 $ 8,185,711 $ 8,450,347
Page 60
SCOTCH PLAINS-FANWOOD REGIONAL SCHOOL DISTRICT NOTES TO THE BASIC FINANCIAL STATEMENTS
FOR THE FISCAL YEAR ENDED JUNE 30, 2014 (Continued)
NOTE 10. POST-RETIREMENT BENEFITS (Cont'd)
Actuarial Valuations
Actuarial valuations of an ongoing plan involve estimates of the value of reported amounts and assumptions about probability of occurrence of events far into the future. Examples include assumptions about future employment, mortality, and health care cost trends. Amounts determined regarding the funded status of the Plan and the annual required contributions of the District and Plan members are subject to continual revision as actual results are compared with past expectations and new estimates are made about the future.
Actuarial Methods and Assumptions
Projections of benefits for financial reporting purposes are based on the substantive Plan (as understood by the employer and Plan members) and include the types of benefits provided at the time of each valuation and the historical pattern of sharing of benefit costs between the District and the Plan members at that point. The actuarial methods and assumptions used include techniques that are designed to reduce the effects of shortterm volatility in actuarial accrued liabilities and the actuarial value of assets, consistent with the long-term perspective of the calculations.
In the June 30, 2014 actuarial valuation, the liabilities were computed using the projected unit credit method and level dollar amortization over 30 years. The actuarial assumptions include a 5% discount rate and an initial health care cost trend rate of 9% beginning in 2013, leveling off to 5% by 2021 with 0.5% annual decrements.
NOTE 11. RISK MANAGEMENT
The District is exposed to various risks of loss related to torts; theft of, damage to, and destruction of assets, errors and omissions; injuries to employees; and natural disasters.
Property and Liability Insurance
The District has commercial insurance coverage for general liability, property and auto insurance. Health benefits are provided through Horizon Blue Cross Blue Shield of NJ.
The Scotch Plains-Fanwood Regional School District is a member of the South Bergen Region VII Workers' Compensation Pool (the "Pool") through which the District is provided workers' compensation coverage. A complete schedule of insurance coverage can be found in the Statistical Section of this Comprehensive Annual Financial Report. The Pool is a risk-sharing public entity risk pool that is an insured and self-administered groups of school boards established for the purpose of providing low-cost insurance for its respective members in order to keep local property taxes to a minimum. Each member appoints an official to represent their respective entity for the purpose of creating a governing body from which officers for the Pool are elected.
As a member of the Pool, the District could be subject to supplemental assessments in the event of deficiencies. If the assets of the Pool were to be exhausted, members would become responsible for their respective shares of the Pool's liabilities. The Pool can declare and distribute dividends to members upon approval of the State of New Jersey Department of Banking and Insurance. These distributions are divided among the members in the same ratio as their individual assessment related to the total assessment of the membership body.
Page 61
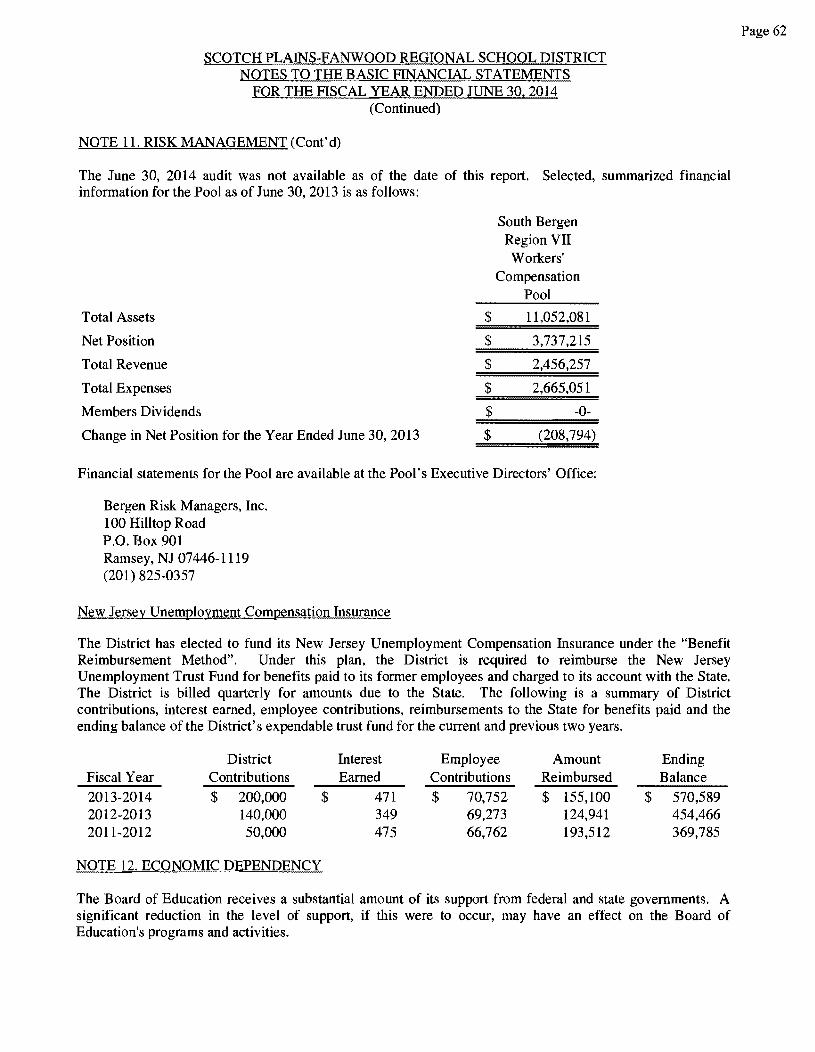
SCOTCH PLAINS-FANWOOD REGIONAL SCHOOL DISTRICT NOTES TO THE BASIC FINANCIAL STATEMENTS
FOR THE FISCAL YEAR ENDED JUNE 30, 2014 (Continued)
NOTE 11. RISK MANAGEMENT (Cont'd)
The June 30, 2014 audit was not available as of the date of this report. Selected, summarized financial information for the Pool as of June 30, 2013 is as follows:
Total Assets
Net Position
Total Revenue
Total Expenses
Members Dividends
Change in Net Position for the Year Ended June 30, 2013
$
$
$
$
$
$
South Bergen Region VII Workers'
Compensation Pool
11,052,081
3,737,215
2,456,257
2,665,051
-0-
(208,794)
Financial statements for the Pool are available at the Pool's Executive Directors' Office:
Bergen Risk Managers, Inc. 100 Hilltop Road P.O. Box 901 Ramsey, NJ 07446-1119 (201) 825-0357
New Jersey Unemployment Compensation Insurance
The District has elected to fund its New Jersey Unemployment Compensation Insurance under the "Benefit Reimbursement Method". Under this plan, the District is required to reimburse the New Jersey Unemployment Trust Fund for benefits paid to its former employees and charged to its account with the State. The District is billed quarterly for amounts due to the State. The following is a summary of District contributions, interest earned, employee contributions, reimbursements to the State for benefits paid and the ending balance of the District's expendable trust fund for the current and previous two years.
District Interest Employee Amount Ending Fiscal Year Contributions Earned Contributions Reimbursed Balance 2013-2014 $ 200,000 $ 471 $ 70,752 $ 155,lOO $ 570,589 2012-2013 140,000 349 69,273 124,941 454,466 2011-2012 50,000 475 66,762 193,512 369,785
NOTE 12. ECONOMIC DEPENDENCY
The Board of Education receives a substantial amount of its support from federal and state governments. A significant reduction in the level of support, if this were to occur, may have an effect on the Board of Education's programs and activities.
Page 62
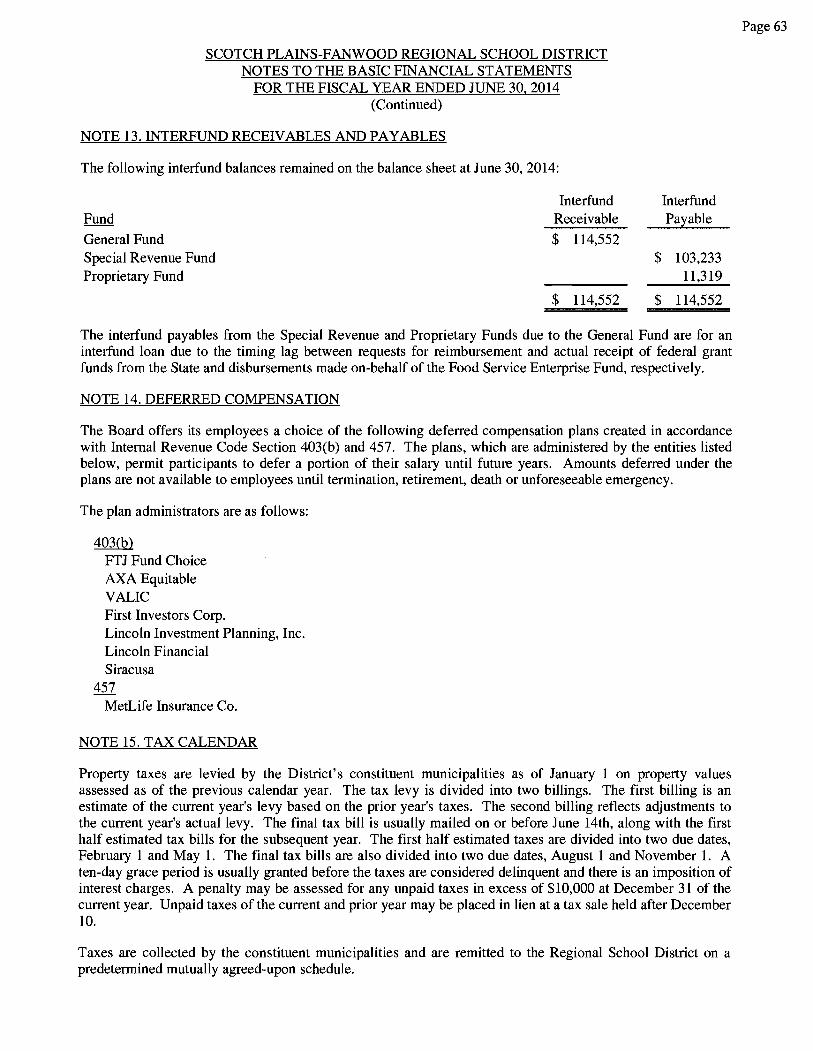
SCOTCH PLAINS-FANWOOD REGIONAL SCHOOL DISTRICT NOTES TO THE BASIC FINANCIAL STATEMENTS
FOR THE FISCAL YEAR ENDED JUNE 30, 2014 (Continued)
NOTE 13. INTERFUNDRECEIVABLES AND PAYABLES
The following interfund balances remained on the balance sheet at June 30, 2014:
Interfund Fund Receivable
General Fund $ 114,552 Special Revenue Fund Proprietary Fund
$ 114,552
Interfund Pa~able
$ 103,233 11,319
$ 114,552
The interfund payables from the Special Revenue and Proprietary Funds due to the General Fund are for an interfund loan due to the timing lag between requests for reimbursement and actual receipt of federal grant funds from the State and disbursements made on-behalf of the Food Service Enterprise Fund, respectively.
NOTE 14. DEFERRED COMPENSATION
The Board offers its employees a choice of the following deferred compensation plans created in accordance with Internal Revenue Code Section 403(b) and 457. The plans, which are administered by the entities listed below, permit participants to defer a portion of their salary until future years. Amounts deferred under the plans are not available to employees until termination, retirement, death or unforeseeable emergency.
The plan administrators are as follows:
403(b) FTJ Fund Choice AXA Equitable VALIC First Investors Corp. Lincoln Investment Planning, Inc. Lincoln Financial Siracusa
457 MetLife Insurance Co.
NOTE 15. TAX CALENDAR
Property taxes are levied by the District's constituent municipalities as of January 1 on property values assessed as of the previous calendar year. The tax levy is divided into two billings. The first billing is an estimate of the current year's levy based on the prior year's taxes. The second billing reflects adjustments to the current year's actual levy. The final tax bill is usually mailed on or before June 14th, along with the first half estimated tax bills for the subsequent year. The first half estimated taxes are divided into two due dates, February 1 and May 1. The final tax bills are also divided into two due dates, August 1 and November 1. A ten-day grace period is usually granted before the taxes are considered delinquent and there is an imposition of interest charges. A penalty may be assessed for any unpaid taxes in excess of $10,000 at December 31 of the current year. Unpaid taxes of the current and prior year may be placed in lien at a tax sale held after December IO.
Taxes are collected by the constituent municipalities and are remitted to the Regional School District on a predetermined mutually agreed-upon schedule.
Page 63
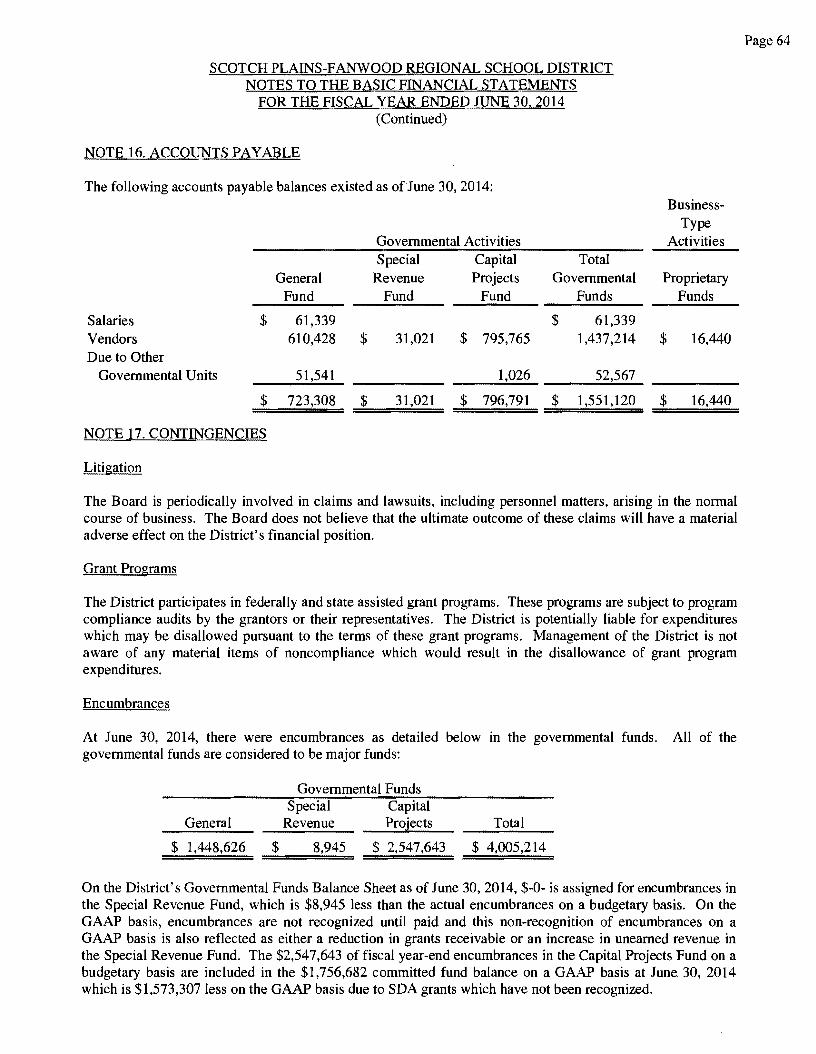
SCOTCH PLAINS-FANWOOD REGIONAL SCHOOL DISTRICT NOTES TO THE BASIC FINANCIAL STATEMENTS
FOR THE FISCAL YEAR ENDED JUNE 30, 2014 (Continued)
NOTE16.ACCOUNTSPAYABLE
The following accounts payable balances existed as ofJune 30, 2014:
Governmental Activities Special Capital Total
General Revenue Projects Governmental Fund Fund Fund Funds
Salaries $ 61,339 $ 61,339 Vendors 610,428 $ 31,021 $ 795,765 1,437,214 Due to Other
Governmental Units 51,541 1,026 52,567
$ 723,308 $ 31,021 $ 796,791 $ 1,551,120
NOTE 17. CONTINGENCIES
Litigation
Business-Type
Activities
Proprietary Funds
$ 16,440
$ 16,440
The Board is periodically involved in claims and lawsuits, including personnel matters, arising in the normal course of business. The Board does not believe that the ultimate outcome of these claims will have a material adverse effect on the District's financial position.
Grant Programs
The District participates in federally and state assisted grant programs. These programs are subject to program compliance audits by the grantors or their representatives. The District is potentially liable for expenditures which may be disallowed pursuant to the terms of these grant programs. Management of the District is not aware of any material items of noncompliance which would result in the disallowance of grant program expenditures.
Encumbrances
At June 30, 2014, there were encumbrances as detailed below in the governmental funds. All of the governmental funds are considered to be major funds:
Governmental Funds Special Capital
General Revenue Projects Total
$ 1,448,626 $ 8,945 $ 2,547,643 $ 4,005,214
On the District's Governmental Funds Balance Sheet as of June 30, 2014, $-0- is assigned for encumbrances in the Special Revenue Fund, which is $8,945 less than the actual encumbrances on a budgetary basis. On the GAAP basis, encumbrances are not recognized until paid and this non-recognition of encumbrances on a GAAP basis is also reflected as either a reduction in grants receivable or an increase in unearned revenue in the Special Revenue Fund. The $2,547,643 of fiscal year-end encumbrances in the Capital Projects Fund on a budgetary basis are included in the $1,756,682 committed fund balance on a GAAP basis at June. 30, 2014 which is $1,573,307 less on the GAAP basis due to SDA grants which have not been recognized.
Page 64
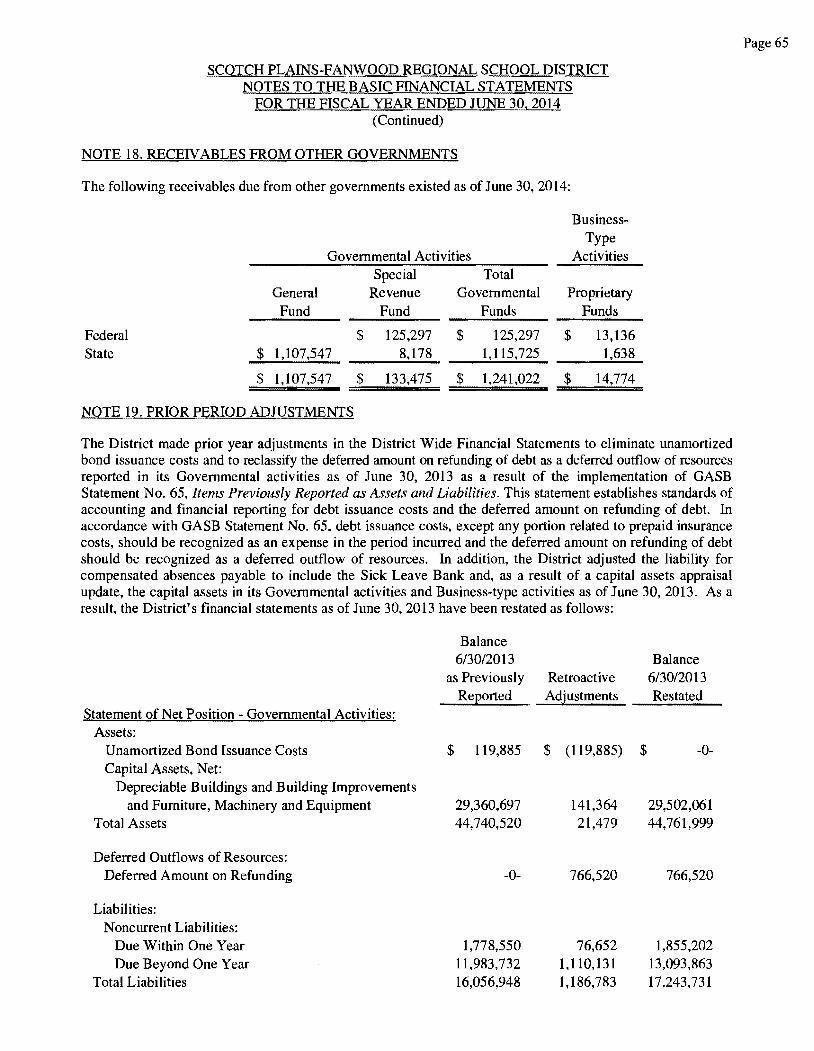
SCOTCH PLAINS-FANWOOD REGIONAL SCHOOL DISTRICT NOTES TO THE BASIC FINANCIAL STATEMENTS
FOR THE FISCAL YEAR ENDED JUNE 30, 2014 (Continued)
NOTE 18. RECEN ABLES FROM OTHER GOVERNMENTS
The following receivables due from other governments existed as of June 30, 2014:
Business-Type
Governmental Activities Activities Special Total
General Revenue Governmental Proprietary Fund Fund Funds Funds
Federal $ 125,297 $ 125,297 $ 13,136 State $ 1,107,547 8,178 1,115,725 1,638
$ 1,107,547 $ 133,475 $ 1,241,022 $ 14,774
NOTE 19. PRIOR PERIOD ADJUSTMENTS
The District made prior year adjustments in the District Wide Financial Statements to eliminate unamortized bond issuance costs and to reclassify the deferred amount on refunding of debt as a deferred outflow of resources reported in its Governmental activities as of June 30, 2013 as a result of the implementation of GASB Statement No. 65, Items Previously Reported as Assets and Liabilities. This statement establishes standards of accounting and financial reporting for debt issuance costs and the deferred amount on refunding of debt. In accordance with GASB Statement No. 65, debt issuance costs, except any portion related to prepaid insurance costs, should be recognized as an expense in the period incurred and the deferred amount on refunding of debt should be recognized as a deferred outflow of resources. In addition, the District adjusted the liability for compensated absences payable to include the Sick Leave Bank and, as a result of a capital assets appraisal update, the capital assets in its Governmental activities and Business-type activities as of June 30, 2013. As a result, the District's financial statements as of June 30, 2013 have been restated as follows:
Statement of Net Position - Governmental Activities: Assets:
Unamortized Bond Issuance Costs Capital Assets, Net:
Depreciable Buildings and Building Improvements and Furniture, Machinery and Equipment
Total Assets
Deferred Outflows of Resources: Deferred Amount on Refunding
Liabilities: Noncurrent Liabilities:
Due Within One Year Due Beyond One Year
Total Liabilities
Balance 6/30/2013
as Previously
$
Reported
119,885
29,360,697 44,740,520
-0-
1,778,550 11,983,732 16,056,948
Retroactive Adjustments
$ (119,885)
141,364 21,479
766,520
76,652 1,110,131 1,186,783
$
Balance 6/30/2013 Restated
-0-
29,502,061 44,761,999
766,520
1,855,202 13,093,863 17,243,731
Page 65
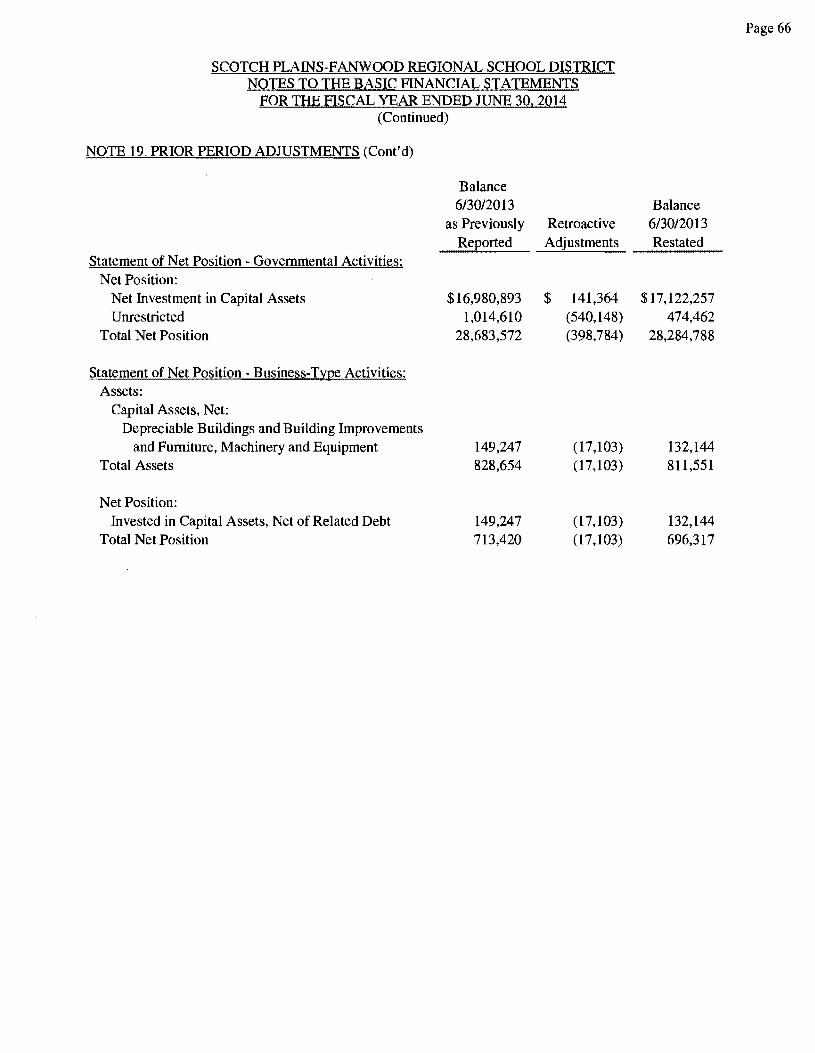
SCOTCH PLAINS-FANWOOD REGIONAL SCHOOL DISTRICT NOTES TO THE BASIC FINANCIAL STATEMENTS
FOR THE FISCAL YEAR ENDED JUNE 30, 2014 (Continued)
NOTE 19. PRIOR PERIOD ADJUSTMENTS (Cont'd)
Statement of Net Position - Governmental Activities: Net Position:
Net Investment in Capital Assets Unrestricted
Total Net Position
Statement of Net Position - Business-Type Activities: Assets:
Capital Assets, Net: Depreciable Buildings and Building Improvements
and Furniture, Machinery and Equipment Total Assets
Net Position: Invested in Capital Assets, Net of Related Debt
Total Net Position
Balance 6/30/2013
as Previously Reported
$16,980,893 1,014,610
28,683,572
149,247 828,654
149,247 713,420
Retroactive Adjustments
$ 141,364 (540,148) (398,784)
(17,103) (17,103)
(17,103) (17,103)
Balance 6/30/2013 Restated
$17, 122,257 474,462
28,284,788
132,144 811,551
132,144 696,317
Page 66
Page 67
BUDGETARY COMPARISON SCHEDULES
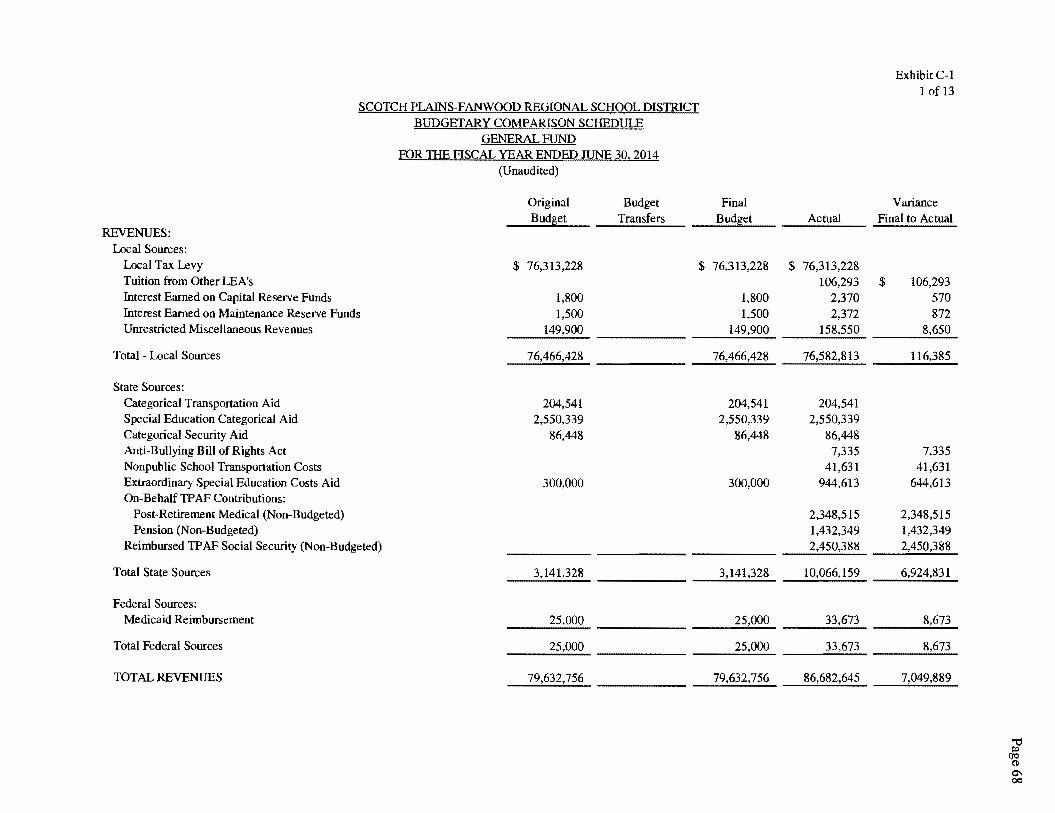
REVENUES: Local Sources:
SCOTCH PLAINS-FANWOOD REGIONAL SCHOOL DISTRICT BUDGETARY COMPARISON SCHEDULE
GENERAL FUND FOR THE FISCAL YEAR ENDED JUNE 30, 2014
(Unaudited)
Original Budget
Budget Transfers
Final Budget
Local Tax Levy $ 76,313,228 $ 76,313,228 Tuition from Other LEA's Interest Earned on Capital Reserve Funds Interest Earned on Maintenance Reserve Funds Unrestricted Miscellaneous Revenues
Total - Local Sources
State Sources: Categorical Transportation Aid Special Education Categorical Aid Categorical Security Aid Anti-Bullying Bill of Rights Act Nonpublic School Transportation Costs Extraordinary Special Education Costs Aid On-Behalf TP AF Contributions:
Post-Retirement Medical (Non-Budgeted) Pension (Non-Budgeted)
Reimbursed TP AF Social Security (Non-Budgeted)
Total State Sources
Federal Sources: Medicaid Reimbursement
Total Federal Sources
TOTAL REVENUES
1,800 1,500
149,900
76,466,428
204,541 2,550,339
86,448
300,000
3,141,328
25,000
25,000
79,632,756
1,800 1,500
149,900
76,466,428
204,541 2,550,339
86,448
300,000
3,141,328
25,000
25,000
79,632,756
$
Actual
76,313,228 106,293
2,370 2,372
76,582,813
204,541 2,550,339
86,448 7,335
41,631 944,613
2,348,515 1,432,349 2,450,388
10,066,159
33,673
33,673
86,682,645
ExhibitC-l
1of13
Variance Final to Actual
$ 106,293 570 872
8,650
116,385
7,335 41,631
644,613
2,348,515 1,432,349 2,450,388
6,924,831
8,673
8,673
7,049,889
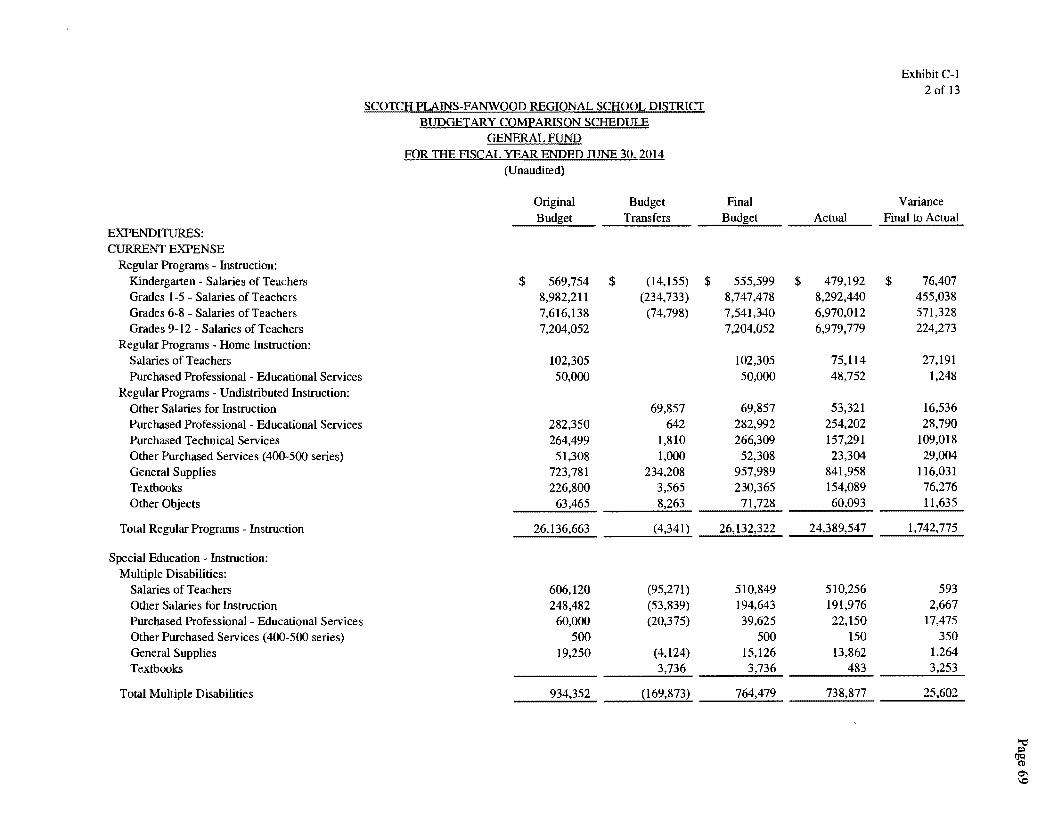
EXPENDITURES: CURRENT EXPENSE
Regular Programs - Instruction: Kindergarten - Salaries of Teachers Grades 1-5 - Salaries of Teachers Grades 6-8 - Salaries of Teachers Grades 9-12 Salaries of Teachers
Regular Programs Home Instruction: Salaries of Teachers Purchased Professional - Educational Services
Regular Programs - Undistributed Instruction: Other Salaries for Instruction Purchased Professional - Educational Services Purchased Technical Services Other Purchased Services (400-500 series) General Supplies Textbooks Other Objects
Total Regular Programs - Instruction
Special Education - Instruction: Multiple Disabilities:
Salaries of Teachers Other Salaries for Instruction Purchased Professional - Educational Services Other Purchased Services (400-500 series) General Supplies Textbooks
Total Multiple Disabilities
SCOTCH PLAINS-FANWOOD REGIONAL SCHOOL DISTRICT BUDGETARY COMPARISON SCHEDULE
GENERAL FUND FOR THE F1SCAL YEAR ENDED JUNE 30, 2014
(Unaudited)
Original
$ 569,754 $ 8,982,211 7,616,138 7,204,052
102,305 50,000
282,350 264,499
51,308 723,781 226,800
26,136,663
606,120 248,482
60,000 500
19,250
934,352
Budget Transfers
(14,155) (234,733)
(74,798)
69,857 642
1,810 1,000
234,208 3,565 8,263
(4,341)
(95,271) (53,839) (20,375)
(4,124) 3,736
(169,873)
$
Final Budget
555,599 8,747,478 7,541,340 7,204,052
102,305 50,000
69,857 282,992 266,309
52,308 957,989 230,365
26,132,322
510,849 194,643 39,625
500 15,126 3,736
764,479
$
Actual
479,192 8,292,440 6,970,012 6,979,779
75,114 48,752
53,321 254,202 157,291 23,304
841,958 154,089 60,093
24,389,547
510,256 191,976 22,150
150 13,862
483
738,877
ExhibitC-1 2of13
Variance Final to Actual
$ 76,407 455,038 571,328 224,273
27,191 1,248
16,536 28,790
109,018 29,004
116,031 76,276 11,635
593 2,667
17,475 350
1,264 3,253
25,602
~ ~
('JC1 (!>
°" \Cl
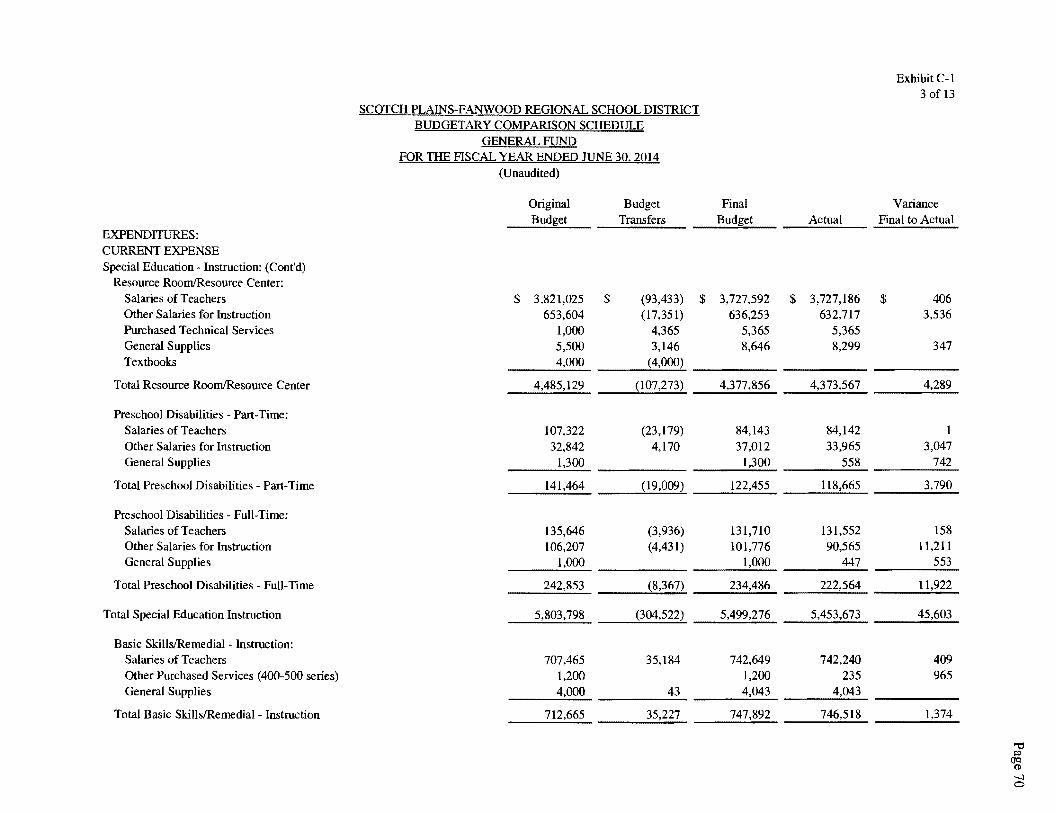
EXPENDITURES: CURRENT EXPENSE Special Education - Instruction: (Cont'd)
Resource Room/Resource Center: Salaries of Teachers Other Salaries for Instruction Purchased Technical Services General Supplies Textbooks
Total Resource Room/Resource Center
Preschool Disabilities - Part-Time: Salaries of Teachers Other Salaries for Instruction General Supplies
Total Preschool Disabilities - Part-Time
Preschool Disabilities Full-Time: Salaries of Teachers Other Salaries for Instruction General Supplies
Total Preschool Disabilities - Full-Time
Total Special Education Instruction
Basic Skills/Remedial - Instruction: Salaries of Teachers Other Purchased Services (400-500 series) General Supplies
Total Basic Skills/Remedial Instruction
SCOTCH PLAINS-FANWOOD REGIONAL SCHOOL DISTRICT BUDGETARY COMPARISON SCHEDULE
GENERAL FUND FOR THE FISCAL YEAR ENDED JUNE 30. 2014
(Unaudited)
Original Budget Budget Transfers
$ 3,821,025 $ (93,433) 653,604 (17,351)
1,000 4,365 5,500 3,146 4,000 (4,000)
4,485,129 (107,273)
107,322 (23,179) 32,842 4,170
1,300
141,464 (19,009)
135,646 (3,936) 106,207 (4,431)
1,000
242,853 (8,367)
5,803,798 (304,522)
707,465 35,184 1,200 4,000 43
712,665 35,227
Final Budget Actual
$ 3,727,592 $ 3,727,186 636,253 632,717
5,365 5,365 8,646 8,299
4,377,856 4,373,567
84,143 84,142 37,012 33,965
1,300 558
122,455 118,665
131,710 131,552 101,776 90,565
1,000 447
234,486 222,564
5,499,276 5,453,673
742,649 742,240 1,200 235 4,043 4,043
747,892 746,518
Exhibit C-1 3of13
Variance Final to Actual
$ 406 3,536
347
4,289
3,047 742
3,790
158 11,211
553
11,922
45,603
409 965
1,374
""d ~
(lq (1)
-.l 0
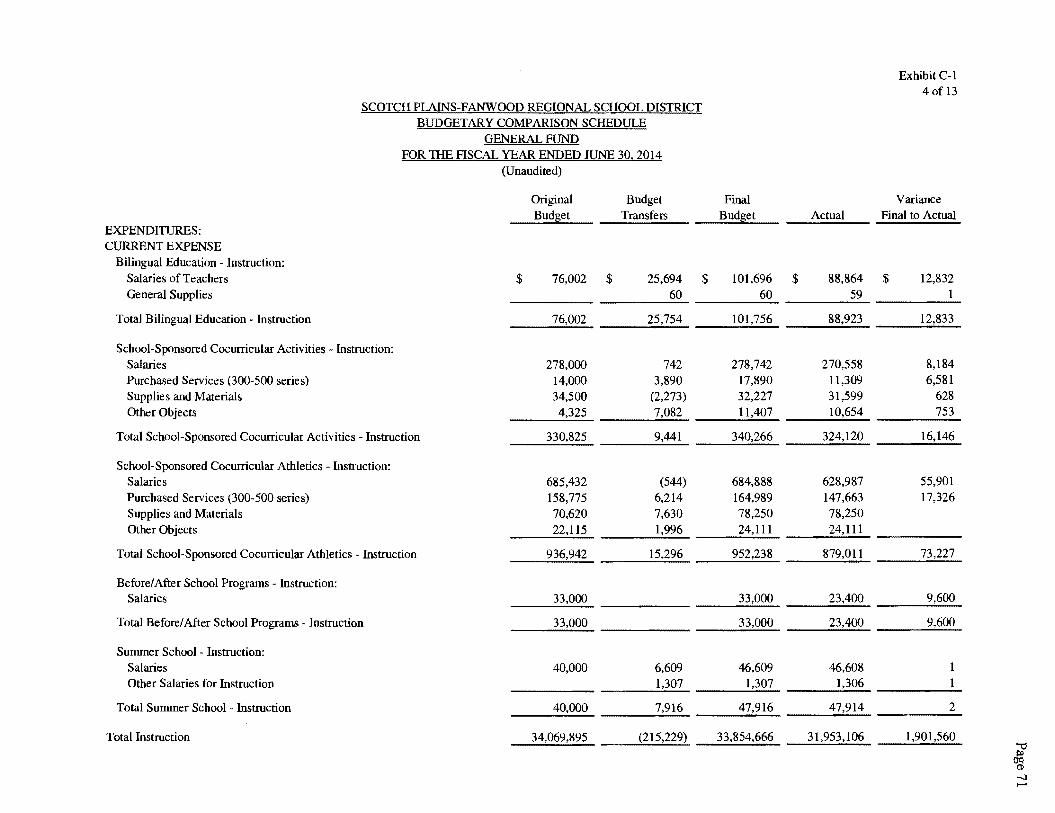
SCOTCH PLAINS-FANWOOD REGIONAL SCHOOL DISTRICT BUDGETARY COMPARISON SCHEDULE
GENERAL FUND FOR THE FISCAL YEAR ENDED JUNE 30, 2014
(Unaudited)
Original Budget Bud~et Transfers
EXPENDITURES: CURRENT EXPENSE
Bilingual Education - Instruction: Salaries of Teachers $ 76,002 $ 25,694 $ General Supplies 60
Total Bilingual Education - Instruction 76,002 25,754
School-Sponsored Cocurricular Activities Instruction: Salaries 278,000 742 Purchased Services (300-500 series) 14,000 3,890 Supplies and Materials 34,500 (2,273) Other Objects 4,325 7,082
Total School-Sponsored Cocurricular Activities - Instruction 330,825 9,441
School-Sponsored Cocurricular Athletics - Instruction: Salaries 685,432 (544) Purchased Services (300-500 series) 158,775 6,214 Supplies and Materials 70,620 7,630 Other Objects 22,115 1,996
Total School-Sponsored Cocurricular Athletics Instruction 936,942 15,296
Before/ After School Programs Instruction: Salaries 33,000
Total Before/After School Programs Instruction 33,000
Summer School Instruction: Salaries 40,000 6,609 Other Salaries for Instruction 1,307
Total Summer School - Instruction 40,000 7,916
Total Instruction 34,069,895 (215,229)
Final Budget Actual
101,696 $ 88,864 60 59
101,756 88,923
278,742 270,558 17,890 11,309 32,227 31,599 11,407 10,654
340,266 324,120
684,888 628,987 164,989 147,663 78,250 78,250 24,111 24,111
952,238 879,011
33,000 23,400
33,000 23,400
46,609 46,608 1,307 1,306
47,916 47,914
33,854,666 31,953,106
Exhibit C-1 4of 13
Variance Final to Actual
$ 12,832 1
12,833
8,184 6,581
628 753
16,146
55,901 17,326
73,227
9,600
9,600
2
1,901,560 "'t:I
~ ...:i ,......
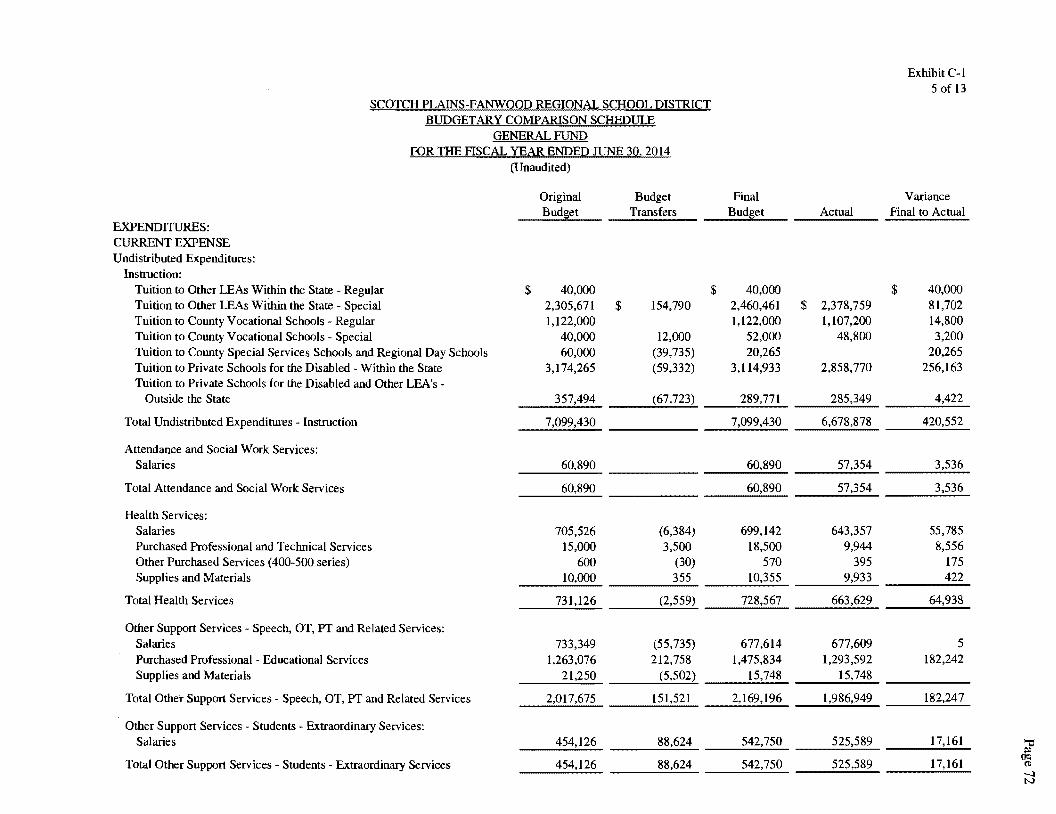
Exhibit C-1 5of13
SCOTCH PLAINS-FANWOOD REGIONAL SCHOOL DISTRICT BUDGETARY COMPARISON SCHEDULE
FOR THE FISCAL YEAR ENDED JUNE 30, 2014 (Unaudited)
Original Budget Final Variance Transfers Budget Actual Final to Actual
EXPENDITURES: CURRENT EXPENSE Undistributed Expenditures:
Instruction: Tuition to Other LEAs Within the State - Regular $ 40,000 $ 40,000 $ 40,000 Tuition to Other LEAs Within the State Special 2,305,671 $ 154,790 2,460,461 $ 2,378,759 81,702 Tuition to County Vocational Schools Regular l,122,000 1,122,000 1,107,200 14,800 Tuition to County Vocational Schools - Special 40,000 12,000 52,000 48,800 3,200 Tuition to County Special Services Schools and Regional Day Schools 60,000 (39,735) 20,265 20,265 Tuition to Private Schools for the Disabled - Within the State 3,174,265 (59,332) 3,114,933 2,858,770 256,163 Tuition to Private Schools for the Disabled and Other LEA's -
Outside the State 357,494 (67,723) 289,771 4,422
Total Undistributed Expenditures - Instruction 7,099,430 7,099,430 6,678,878 420,552
Attendance and Social Work Services: Salaries 60,890 60,890 57,354 3,536
Total Attendance and Social Work Services 60,890 57,354 3,536
Health Services: Salaries 705,526 (6,384) 699,142 643,357 55,785 Purchased Professional and Technical Services 15,000 3,500 18,500 9,944 8,556 Other Purchased Services (400-500 series) 600 (30) 570 395 175 Supplies and Materials 10,000 355 10,355 9,933 422
Total Health Services 731,126 728,567 663,629 64,938
Other Support Services Speech, OT, PT and Related Services: Salaries 733,349 (55,735) 677,614 677,609 5 Purchased Professional - Educational Services 1,263,076 212,758 1,475,834 1,293,592 182,242 Supplies and Materials 15,748 15,748
Total Other Support Services Speech, OT, PT and Related Services 2,169,196 l,986,949 182,247
Other Support Services Students - Extraordinary Services: Salaries 88,624 542,750 525,589 ""d
~
Total Other Support Services - Students - Extraordinary Services 454,126 88,624 542,750 525,589 l 7,161 (Jq ~
-.:i N
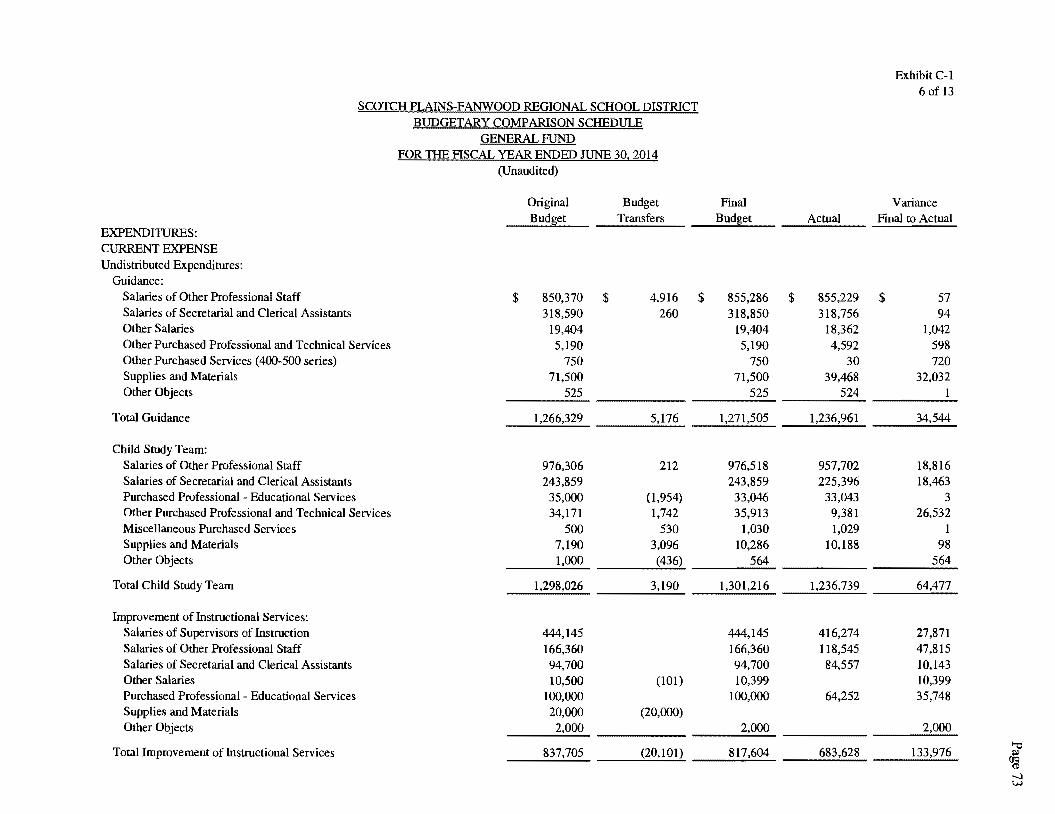
Exhibit C-1 6of13
SCOTCH PLAINS-FANWOOD REGIONAL SCHOOL DISTRICT BUDGET ARY COMPARISON SCHEDULE
GENERAL FUND FOR THE FISCAL YEAR ENDED JUNE 30, 2014
(Unaudited)
Original Budget Final Variance Budget Transfers Budget Actual Final to Actual
EXPENDITURES: CURRENT EXPENSE Undistributed Expenditures:
Guidance: Salaries of Other Professional Staff $ 850,370 $ 4,916 $ 855,286 $ 855,229 $ 57 Salaries of Secretarial and Clerical Assistants 318,590 260 318,850 318,756 94 Other Salaries 19,404 19,404 18,362 1,042 Other Purchased Professional and Technical Services 5,190 5,190 4,592 598 Other Purchased Services (400-500 series) 750 750 30 720 Supplies and Materials 71,500 71,500 39,468 32,032 Other Objects 525 525 524 1
Total Guidance 1,266,329 1,271,505 1,236,961 34,544
Child Study Team: Salaries of Other Professional Staff 976,306 212 976,518 957,702 18,816 Salaries of Secretarial and Clerical Assistants 243,859 243,859 225,396 18,463 Purchased Professional Educational Services 35,000 (1,954) 33,046 33,043 3 Other Purchased Professional and Technical Services 34,171 1,742 35,913 9,381 26,532 Miscellaneous Purchased Services 500 530 1,030 1,029 1 Supplies and Materials 7,190 3,096 10,286 10,188 98 Other Objects 1,000 (436) 564 564
Total Child Study Team 1,298,026 3,190 1,301,216 1,236,739 64,477
Improvement of Instructional Services: Salaries of Supervisors of Instruction 444,145 444,145 416,274 27,871 Salaries of Other Professional Staff 166,360 166,360 118,545 47,815 Salaries of Secretarial and Clerical Assistants 94,700 94,700 84,557 10,143 Other Salaries 10,500 (101) 10,399 10,399 Purchased Professional - Educational Services 100,000 100,000 64,252 35,748 Supplies and Materials 20,000 (20,000) Other Objects 2,000 2,000
Total Improvement of Instructional Services 837,705 (20,101) 817,604 683,628 133,976 "'O ll>
(Jq Cl)
-..l w
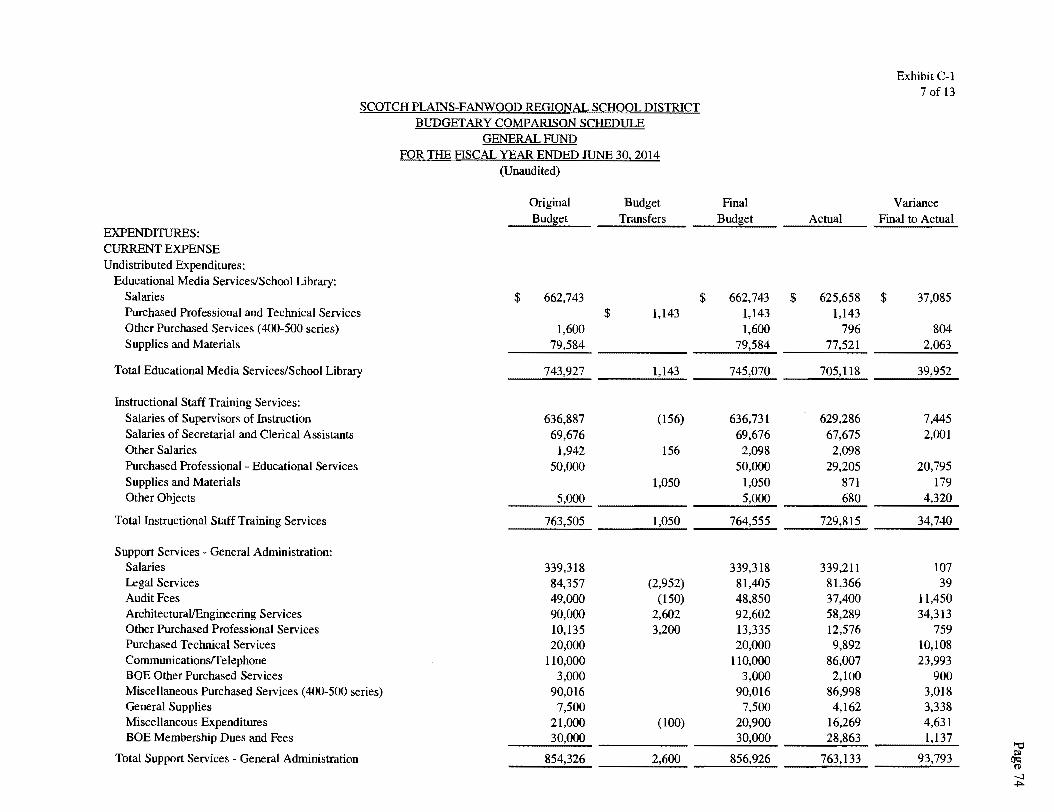
Exhibit C-1 7of13
SCOTCH PLAINS-FANWOOD REGIONAL SCHOOL DISTRICT BUDGETARY COMPARISON SCHEDULE
GENERAL FUND FOR THE FISCAL YEAR ENDED JUNE 30, 2014
(Unaudited)
Original Budget Final Variance Bud~et Transfers Bud~et Actual Final to Actual
EXPENDITURES: CURRENT EXPENSE Undistributed Expenditures:
Educational Media Services/School Library: Salaries $ 662,743 $ 662,743 $ 625,658 $ 37,085 Purchased Professional and Technical Services $ 1,143 1,143 l,143 Other Purchased Services (4()()..500 series) 1,600 1,600 796 804 Supplies and Materials 79,584 79,584 77,521 2,063
Total Educational Media Services/School Library 743,927 1,143 745,070 705,118 39,952
Instructional Staff Training Services: Salaries of Supervisors of Instruction 636,887 (156) 636,731 629,286 7,445 Salaries of Secretarial and Clerical Assistants 69,676 69,676 67,675 2,001 Other Salaries l,942 156 2,098 2,098 Purchased Professional - Educational Services 50,000 50,000 29,205 20,795 Supplies and Materials 1,050 1,050 871 179 Other Objects 5,000 5,000 680 4,320
Total Instructional Staff Training Services 763,505 1,050 764,555 729,815 34,740
Support Services - General Administration: Salaries 339,318 339,318 339,211 107 Legal Services 84,357 (2,952) 81,405 81,366 39 Audit Fees 49,000 (150) 48,850 37,400 11,450 Architectural/Engineering Services 90,000 2,602 92,602 58,289 34,313 Other Purchased Professional Services 10,135 3,200 13,335 12,576 759 Purchased Technical Services 20,000 20,000 9,892 10,108 Communications/Telephone 110,000 110,000 86,007 23,993 BOE Other Purchased Services 3,000 3,000 2,100 900 Miscellaneous Purchased Services (400-500 series) 90,016 90,016 86,998 3,018 General Supplies 7,500 7,500 4,162 3,338 Miscellaneous Expenditures 21,000 (100) 20,900 16,269 4,631 BOE Membership Dues and Fees 30,000 30,000 28,863 1,137
""O Total Support Services General Administration 854,326 2,600 856,926 763,133 93,793
j;I) O'C'.l 0 -i ~
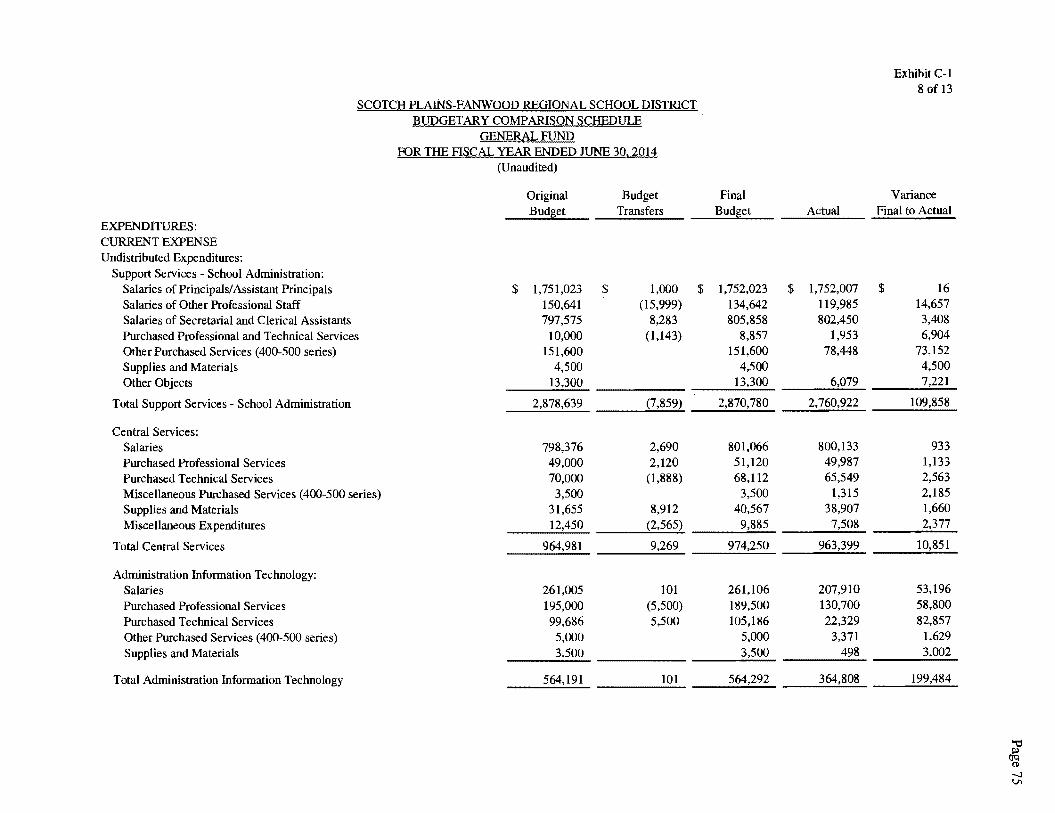
SCOTCH PLAINS-FANWOOD REGIONAL SCHOOL DISTRICT BUDGETARY COMPARISON SCHEDULE
GENERAL FUND FOR THE FISCAL YEAR ENDED JUNE 30, 2014
(Unaudited)
Original Budget Budget Transfers
EXPENDITURES: CURRENT EXPENSE Undistributed Expenditures:
Support Services - School Administration: Salaries of Principals/ Assistant Principals $ 1,751,023 $ 1,000 Salaries of Other Professional Staff 150,641 (15,999) Salaries of Secretarial and Clerical Assistants 797,575 8,283 Purchased Professional and Technical Services 10,000 (1,143) Other Purchased Services (400-500 series) 151,600 Supplies and Materials 4,500 Other Objects 13,300
Total Support Services - School Administration 2,878,639 (7,859)
Central Services: Salaries 798,376 2,690 Purchased Professional Services 49,000 2,120 Purchased Technical Services 70,000 (l,888) Miscellaneous Purchased Services (400-500 series) 3,500 Supplies and Materials 31,655 8,912 Miscellaneous Expenditures 12,450 (2,565)
Total Central Services 964,981 9,269
Administration Information Technology: Salaries 261,005 101 Purchased Professional Services 195,000 (5,500) Purchased Technical Services 99,686 5,500 Other Purchased Services (400-500 series) 5,000 Supplies and Materials 3,500
Total Administration Information Technology 564,191 101
Final Budget Actual
$ 1,752,023 $ 1,752,007 134,642 119,985 805,858 802,450
8,857 1,953 151,600 78,448
4,500 13,300 6,079
2,870,780 2,760,922
801,066 800,133 51,120 49,987 68,112 65,549
3,500 1,315 40,567 38,907
9,885 7,508
974,250 963,399
261,106 207,910 189,500 130,700 105,186 22,329
5,000 3,371 3,500 498
564,292 364,808
Exhibit C-1 8of13
Variance Final to Actual
$ 16 14,657 3,408 6,904
73,152 4,500 7,221
109,858
933 1,133 2,563 2,185 1,660 2,377
10,851
53,196 58,800 82,857
1,629 3,002
199,484
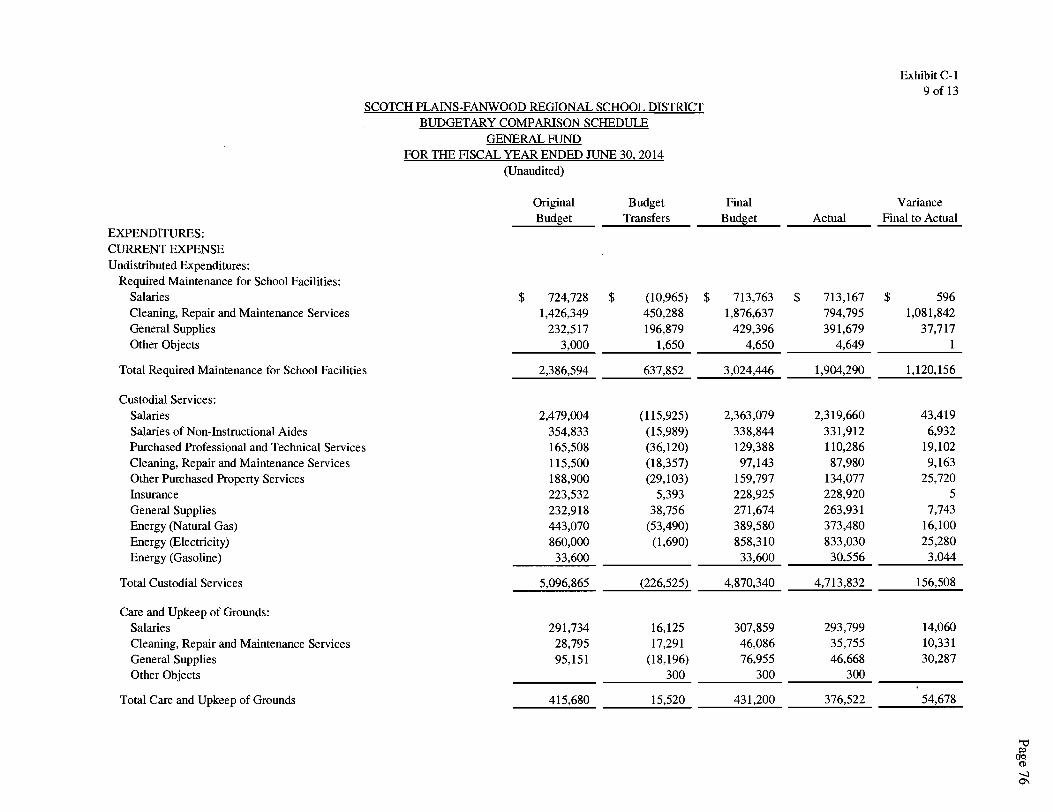
EXPENDITURES: CURRENT EXPENSE Undistributed Expenditures:
Required Maintenance for School Facilities: Salaries Cleaning, Repair and Maintenance Services General Supplies Other Objects
SCOTCH PLAINS-FANWOOD REGIONAL SCHOOL DISTRICT BUDGETARY COMPARISON SCHEDULE
GENERAL FUND FOR THE FISCAL YEAR ENDED JUNE 30, 2014
(Unaudited)
$
Original Budget
724,728 1,426,349
232,517 3,000
$
Budget Transfers
(10,965) 450,288 196,879
1,650
Total Required Maintenance for School Facilities 2,386,594 637,852
Custodial Services: Salaries 2,479,004 (115,925) Salaries of Non-Instructional Aides 354,833 (15,989) Purchased Professional and Technical Services 165,508 (36,120) Cleaning, Repair and Maintenance Services 115,500 (18,357) Other Purchased Property Services 188,900 (29,103) Insurance 223,532 5,393 General Supplies 232,918 38,756 Energy (Natural Gas) 443,070 (53,490) Energy (Electricity) 860,000 (1,690) Energy (Gasoline) 33,600
Total Custodial Services 5,096,865 (226,525)
Care and Upkeep of Grounds: Salaries 291,734 16,125 Cleaning, Repair and Maintenance Services 28,795 17,291 General Supplies 95,151 (18,196) Other Objects 300
Total Care and Upkeep of Grounds 415,680 15,520
$
Final Budget
713,763 1,876,637
429,396 4,650
3,024,446
2,363,079 338,844 129,388 97,143
159,797 228,925 271,674 389,580 858,310
33,600
4,870,340
307,859 46,086 76,955
300
431,200
Actual
$ 713,167 794,795 391,679
4,649
1,904,290
2,319,660 331,912 110,286 87,980
134,077 228,920 263,931 373,480 833,030
30,556
4,713,832
293,799 35,755 46,668
300
376,522
Exhibit C-1 9of13
Variance Final to Actual
$ 596 1,081,842
37,717 1
1,120,156
43,419 6,932
19,102 9,163
25,720 5
7,743 16,100 25,280
3,044
156,508
14,060 10,331 30,287
54,678
"'C ~
OCl (tl
-..J 0\
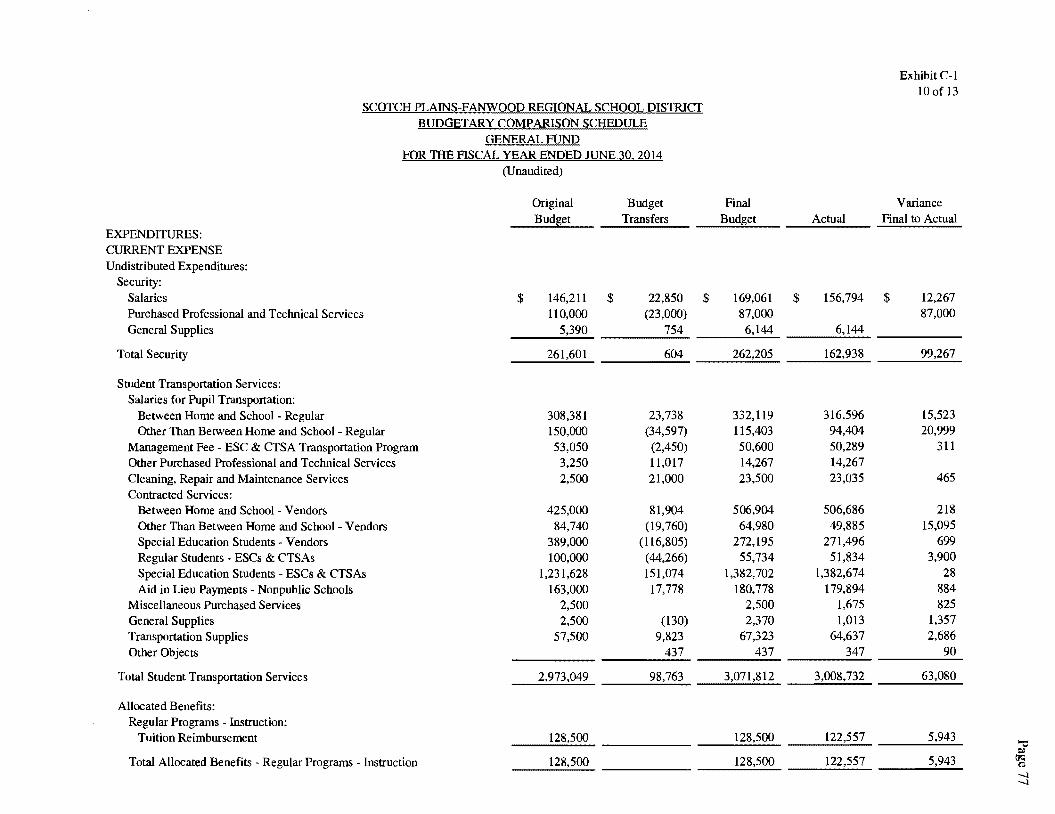
SCOTCH PLAINS-FANWOOD REGIONAL SCHOOL DISTRICT BUDGETARY COMPARISON SCHEDULE
GENERAL FUND FOR THE FISCAL YEAR ENDED JUNE.30, 2014
(Unaudited)
Original Budget Budget Transfers
EXPENDITURES: CURRENT EXPENSE Undistributed Expenditures:
Security: Salaries $ 146,211 $ 22,850 Purchased Professional and Technical Services 110,000 (23,000) General Supplies 5,390 754
Total Security 261,601 604
Student Transportation Services: Salaries for Pupil Transportation:
Between Home and School - Regular 308,381 23,738 Other Than Between Home and School - Regular 150,000 (34,597)
Management Fee - ESC & CTSA Transportation Program 53,050 (2,450) Other Purchased Professional and Technical Services 3,250 11,017 Cleaning, Repair and Maintenance Services 2,500 21,000 Contracted Services:
Between Home and School - Vendors 425,000 81,904 Other Than Between Home and School Vendors 84,740 (19,760) Special Education Students - Vendors 389,000 (116,805) Regular Students - ESCs & CTSAs 100,000 (44,266) Special Education Students - ESCs & CTSAs 1,231,628 151,074 Aid in Lieu Payments - Nonpublic Schools 163,000 17,778
Miscellaneous Purchased Services 2,500 General Supplies 2,500 (130) Transportation Supplies 57,500 9,823 Other Objects 437
Total Student Transportation Services 2,973,049 98,763
Allocated Benefits: Regular Programs - Instruction:
Tuition Reimbursement 128,500
Total Allocated Benefits - Regular Programs - Instruction 128,500
Final Budget Actual
$ 169,061 $ 156,794 87,000
6,144
162,938
332,119 316,596 115,403 94,404 50,600 50,289 14,267 14,267 23,500 23,035
506,904 506,686 64,980 49,885
272,195 271,496 55,734 51,834
1,382,702 1,382,674 180,778 179,894
2,500 1,675 2,370 1,013
67,323 64,637 437 347
3,071,812 3,008,732
128,500
128,500
Exhibit C-1 10of13
Variance Final to Actual
$ 12,267 87,000
99,267
15,523 20,999
311
465
218 15,095
699 3,900
28 884 825
1,357 2,686
90
63,080
5,943
5,943
'"O ~
(le; (1)
-.l -.l
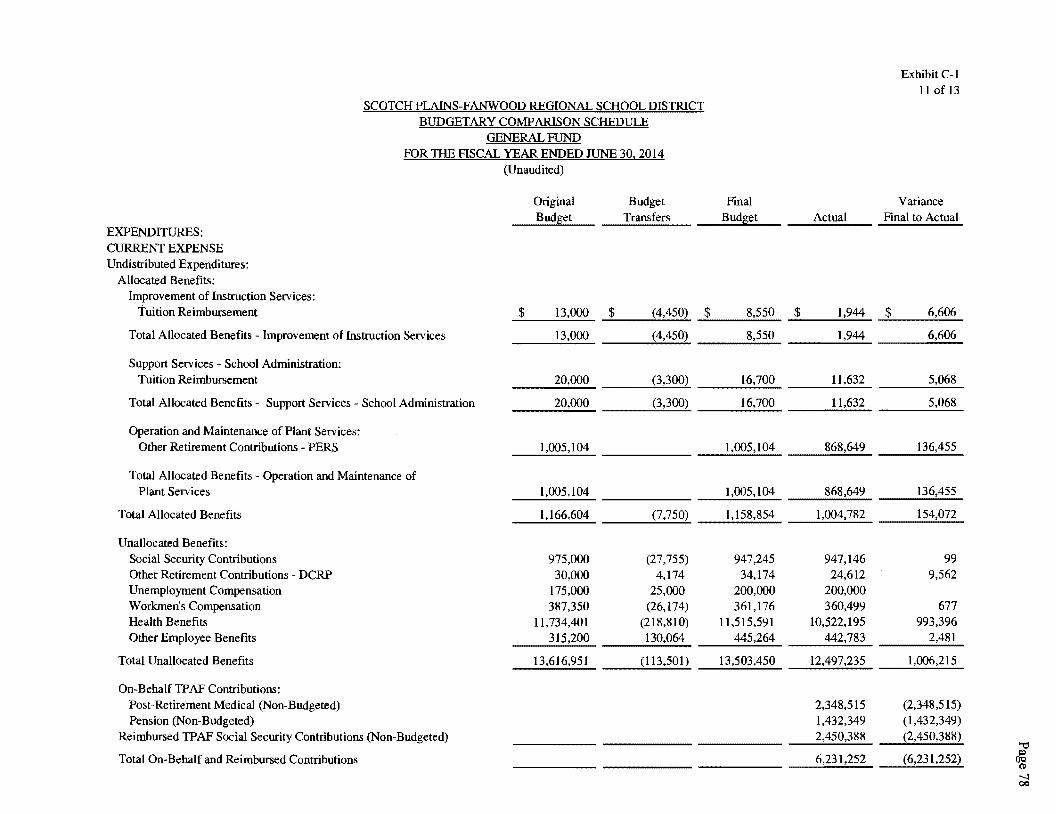
EXPENDITURES: CURRENT EXPENSE Undistributed Expenditures:
Allocated Benefits: Improvement of Instruction Services:
Tuition Reimbursement
SCOTCH PLAINS-FANWOOD REGIONAL SCHOOL DISTRICT BUDGETARY COMPARISON SCHEDULE
GENERAL FUND FOR THE FISCAL YEAR ENDED JUNE 30, 2014
(Unaudited)
Original Budget Budget Transfers
$ 13,000 $ (4,450) $
Total Allocated Benefits - Improvement of Instruction Services 13,000 (4,450)
Support Services - School Administration: Tuition Reimbursement 20,000 (3,300)
Total Allocated Benefits - Support Services School Administration 20,000 (3,300)
Operation and Maintenance of Plant Services: Other Retirement Contributions - PERS 1,005,104
Total Allocated Benefits - Operation and Maintenance of Plant Services 1,005,104
Total Allocated Benefits 1,166,604 (7,750)
Unallocated Benefits: Social Security Contributions 975,000 (27,755) Other Retirement Contributions - DCRP 30,000 4,174 Unemployment Compensation 175,000 25,000 Workmen's Compensation 387,350 (26,174) Health Benefits 11,734,401 (218,810) Other Employee Benefits 130,064
Total Unallocated Benefits 13,616,951 (113,501)
On-Behalf TP AF Contributions: Post-Retirement Medical (Non-Budgeted) Pension (Non-Budgeted)
Reimbursed TPAF Social Security Contributions (Non-Budgeted)
Total On-Behalf and Reimbursed Contributions
Final Bud~et Actual
8,550 $ 1,944
8,550 1,944
16,700
16,700
1,005,104
1,005,104 868,649
1,158,854 1,004,782
947,245 947,146 34,174 24,612
200,000 200,000 361,176 360,499
11,515,591 10,522,195 445,264 442,783
13,503,450 12,497,235
2,348,515 1,432,349 2,450,388
6,231,252
ExhibitC-1 11of13
Variance Final to Actual
$ 6,606
6,606
5,068
5,068
136,455
99 9,562
677 993,396
1,006,215
(2,348,515) (1,432,349) (2,450,388)
(6,231,252) '"d
~ -.:i QQ
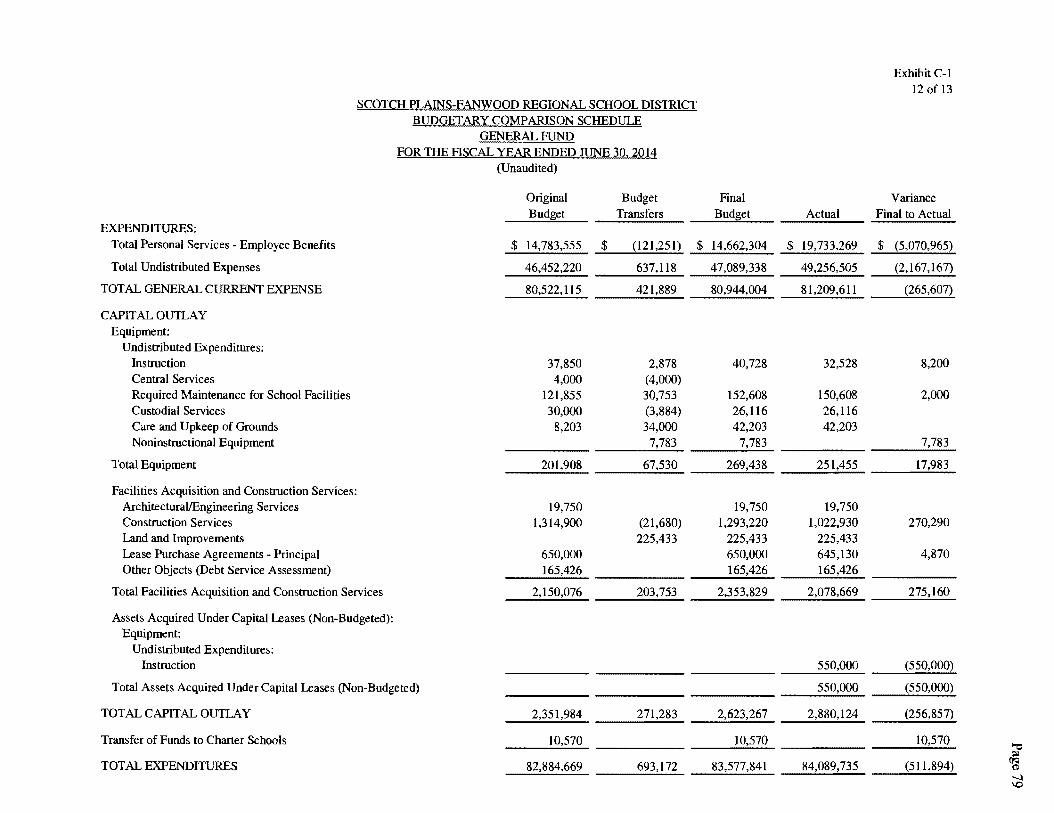
Exhibit C-1 12 of 13
SCOTCH PLAINS-FANWOOD REGIONAL SCHOOL DIS1RICT BUDGETARY COMPARISON SCHEDULE
GENERAL FUND FOR THE FISCAL YEAR ENDED JUNE 30, 2014
(Unaudited)
Original Budget Final Variance Budget Transfers Budget Actual Final to Actual
EXPENDITURES: Total Personal Services - Employee Benefits $ 14,783,555 $ (121,251) $ 14,662,304 $ 19,733,269 $ (5,070,965)
Total Undistributed Expenses 46,452,220 637,118 47,089,338 49,256,505 (2,167,167)
TOTAL GENERAL CURRENT EXPENSE 80,522,115 421,889 80,944,004 81,209,611 (265,607)
CAPITAL OUTLAY Equipment:
Undistributed Expenditures: Instruction 37,850 2,878 40,728 32,528 8,200 Central Services 4,000 (4,000) Required Maintenance for School Facilities 121,855 30,753 152,608 150,608 2,000 Custodial Services 30,000 (3,884) 26,116 26,116 Care and Upkeep of Grounds 8,203 34,000 42,203 42,203 Noninstructional Equipment 7,783 7,783 7,783
Total Equipment 201,908 67,530 269,438 17,983
Facilities Acquisition and Construction Services: Architectural/Engineering Services 19,750 19,750 19,750 Construction Services 1,314,900 (21,680) 1,293,220 1,022,930 270,290 Land and Improvements 225,433 225,433 225,433 Lease Purchase Agreements - Principal 650,000 650,000 645,130 4,870 Other Objects (Debt Service Assessment) 165,426 165,426 165,426
Total Facilities Acquisition and Construction Services 2,150,076 203,753 2,353,829 2,078,669 275,160
Assets Acquired Under Capital Leases (Non-Budgeted): Equipment:
Undistributed Expenditures: Instruction 550,000 (550,000)
Total Assets Acquired Under Capital Leases (Non-Budgeted) 550,000 (550,000)
TOTAL CAPITAL OUTLAY 2,351,984 271,283 2,623,267 2,880,124 (256,857)
Transfer of Funds to Charter Schools 10,570 10,570 10,570 ""O
TOTAL EXPENDITURES 82,884,669 693,172 83,577,841 84,089,735 (511,894) ~ -:i \0
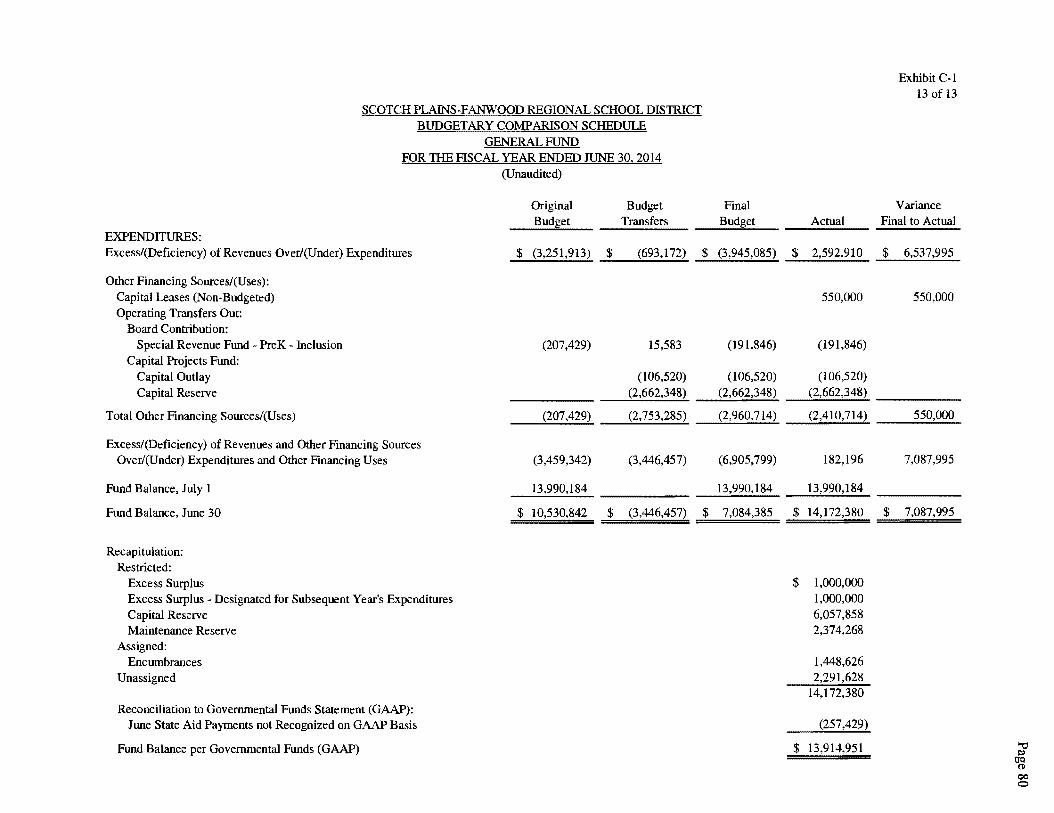
SCOTCH PLAINS-FANWOOD REGIONAL SCHOOL DISTRICT BUDGETARY COMPARISON SCHEDULE
GENERAL FUND FOR THE FISCAL YEAR ENDED JUNE 30, 2014
(Unaudited)
EXPENDITURES: Excess/(Deficiency) of Revenues Over/(Under) Expenditures
Other Financing Sources/(Uses): Capital Leases (Non-Budgeted) Operating Transfers Out:
Board Contribution: Special Revenue Fund PreK - Inclusion
Capital Projects Fund: Capital Outlay Capital Reserve
Total Other Financing Sourcesl(Uses)
Excess/(Deficiency) of Revenues and Other Financing Sources Over/(Under) Expenditures and Other Financing Uses
Fund Balance, July l
Fund Balance, June 30
Recapitulation: Restricted:
Excess Surplus Excess Surplus - Designated for Subsequent Year's Expenditures Capital Reserve Maintenance Reserve
Assigned: Encumbrances
Unassigned
Reconciliation to Governmental Funds Statement (GAAP): June State Aid Payments not Recognized on GAAP Basis
Fund Balance per Governmental Funds (GAAP)
Original Budget Budget Transfers
$ (3,251,913) $ (693,172)
(207,429) 15,583
(106,520) (2,662,348)
(207,429) (2,753,285)
(3,459,342) (3,446,457)
13,990,184
$ 10,530,842 $ (3,446,457)
Final Budget
$ (3,945,085) $
(191,846)
(106,520) (2,662,348)
(2,960,714)
(6,905,799)
13,990,184
$ 7,084,385 $
$
$
Actual
2,592,910
550,000
(191,846)
(106,520) (2,662,348)
(2,410,714)
182,196
13,990,184
14,172,380
1,000,000 1,000,000 6,057,858 2,374,268
1,448,626 2,291,628
14,172,380
(257,429)
13,914,951
Exhibit C-1 13of13
Variance Final to Actual
$ 6,537,995
550,000
550,000
7,087,995
$ 7,087,995
.,, ;:.:>
Otl 0 00 0
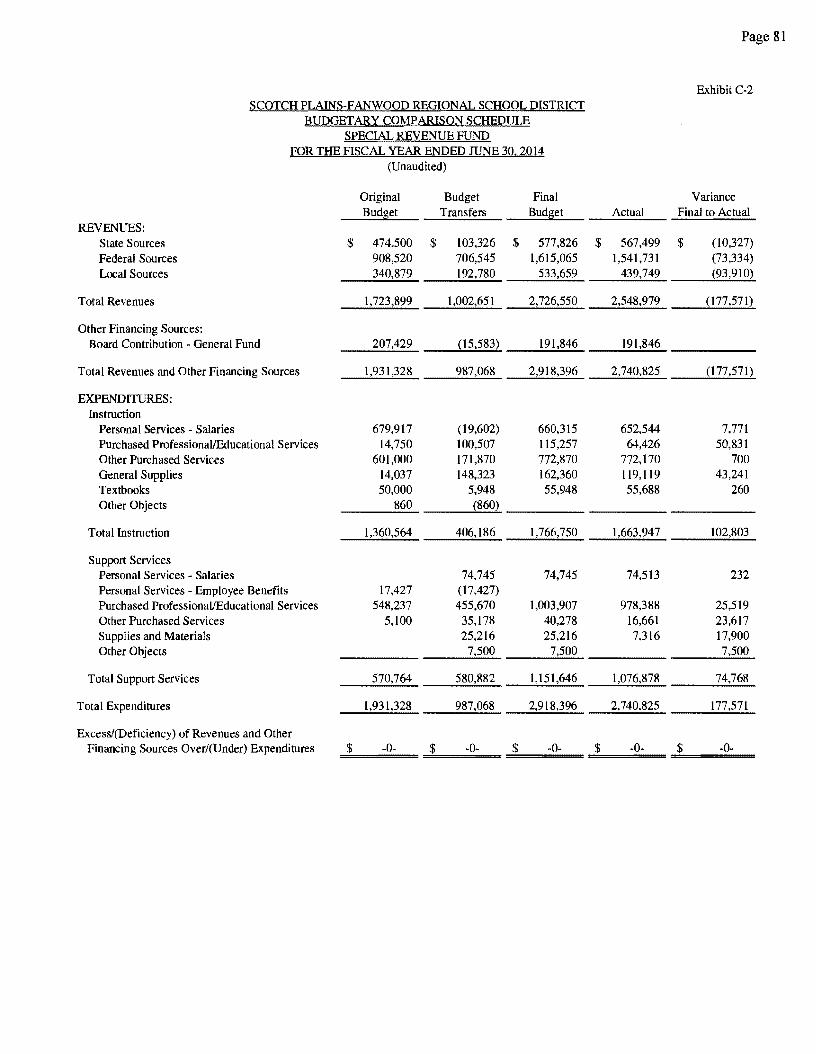
Page 81
Exhibit C-2 SCOTCH PLAINS-FANWOOD REGIONAL SCHOOL DISTRICT
BUDGETARY COMPARISON SCHEDULE SPECIAL REVENUE FUND
FOR THE FISCAL YEAR ENDED nJNE 30. 2014 (Unaudited)
Original Budget Final Variance Budget Transfers Budget Actual Final to Actual
REVENUES: State Sources $ 474,500 $ 103,326 $ 577,826 $ 567,499 $ (10,327) Federal Sources 908,520 706,545 1,615,065 1,541,731 (73,334) Local Sources 340,879 192,780 533,659 439,749 (93,910)
Total Revenues 1,723,899 1,002,651 2,726,550 2,548,979 (177,571)
Other Financing Sources: Board Contribution - General Fund 207,429 (15,583) 191,846 191,846
Total Revenues and Other Financing Sources 1,931,328 987,068 2,918,396 2,740,825 (177,571)
EXPENDITURES: Instruction
Personal Services - Salaries 679,917 (19,602) 660,315 652,544 7,771 Purchased Professional/Educational Services 14,750 100,507 115,257 64,426 50,831 Other Purchased Services 601,000 171,870 772,870 772,170 700 General Supplies 14,037 148,323 162,360 119,119 43,241 Textbooks 50,000 5,948 55,948 55,688 260 Other Objects 860 (860)
Total Instruction 1,360,564 406,186 1,766,750 1,663,947 102,803
Support Services Personal Services - Salaries 74,745 74,745 74,513 232 Personal Services - Employee Benefits 17,427 (17,427) Purchased Professional/Educational Services 548,237 455,670 1,003,907 978,388 25,519 Other Purchased Services 5,100 35,178 40,278 16,661 23,617 Supplies and Materials 25,216 25,216 7,316 17,900 Other Objects 7,500 7,500 7,500
Total Support Services 570,764 580,882 1,151,646 1,076,878 74,768
Total Expenditures 1,931,328 987,068 2,918,396 2,740,825 177,571
Excess/(Deficiency) of Revenues and Other Financing Sources Over/(Under) Expenditures $ -0- $ -0- $ -0- $ -0- $ -0-
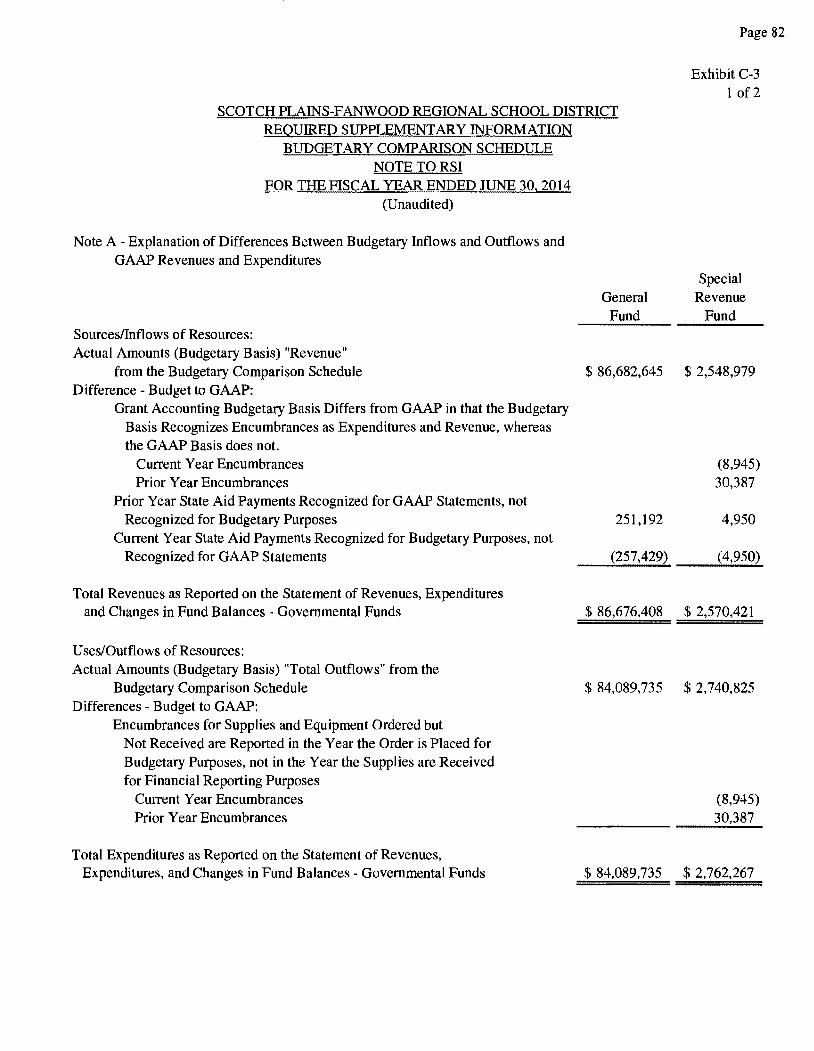
SCOTCH PLAINS-FANWOOD REGIONAL SCHOOL DISTRICT REQUIRED SUPPLEMENT ARY INFORMATION
BUDGETARY COMPARISON SCHEDULE NOTE TO RSI
FOR THE FISCAL YEAR ENDED JUNE 30, 2014 (Unaudited)
Note A - Explanation of Differences Between Budgetary Inflows and Outflows and GAAP Revenues and Expenditures
Sources/Inflows of Resources: Actual Amounts (Budgetary Basis) "Revenue"
General Fund
from the Budgetary Comparison Schedule $ 86,682,645 Difference - Budget to GAAP:
Grant Accounting Budgetary Basis Differs from GAAP in that the Budgetary Basis Recognizes Encumbrances as Expenditures and Revenue, whereas the GAAP Basis does not.
Current Year Encumbrances Prior Year Encumbrances
Prior Year State Aid Payments Recognized for GAAP Statements, not Recognized for Budgetary Purposes 251, 192
Current Year State Aid Payments Recognized for Budgetary Purposes, not Recognized for GAAP Statements (257,429)
Total Revenues as Reported on the Statement of Revenues, Expenditures and Changes in Fund Balances - Governmental Funds $ 86,676,408
Uses/Outflows of Resources: Actual Amounts (Budgetary Basis) "Total Outflows" from the
Budgetary Comparison Schedule $ 84,089,735 Differences - Budget to GAAP:
Encumbrances for Supplies and Equipment Ordered but Not Received are Reported in the Year the Order is Placed for Budgetary Purposes, not in the Year the Supplies are Received for Financial Reporting Purposes
Current Year Encumbrances Prior Year Encumbrances
Total Expenditures as Reported on the Statement of Revenues, Expenditures, and Changes in Fund Balances - Governmental Funds $ 84,089,735
Page 82
Exhibit C-3 1 of2
Special Revenue
Fund
$ 2,548,979
(8,945) 30,387
4,950
(4,950)
$ 2,570,421
$ 2,740,825
(8,945) 30,387
$ 2,762,267
Page 83
Exhibit C-3 2 of2
SCOTCH PLAINS-FANWOOD REGIONAL SCHOOL DISTRICT REQUIRED SUPPLEMENTARY INFORMATION
BUDGETARY COMPARISON SCHEDULE
Budgets/Budgetary Control:
NOTE TO RSI FOR THE FISCAL YEAR ENDED JUNE 30, 2014
(Unaudited)
Annual appropriated budgets are prepared in the spring of each year for the general, special revenue and debt service funds. The budget for the fiscal year ended June 30, 2014 was submitted to the County office and was approved by a vote of the Board of Education. Budgets are prepared using the modified accrual basis of accounting. The legal level of budgetary control is established at line item accounts within each fund. Line item accounts are defined as the lowest (most specific) level of detail as established pursuant to the minimum chart of accounts referenced in N.J.A.C. 6:20-2A.2(m)l. Transfers of appropriations may be made by School Board resolution at any time during the fiscal year. All budgetary amounts presented in the accompanying supplementary information reflect the original budget and the amended budget (which have been adjusted for legally authorized revisions of the annual budgets during the year).
Formal budgetary integration into the accounting system is employed as a management control device during the year. For governmental funds, there are no substantial differences between the budgetary basis of accounting and generally accepted accounting principles, with the exception of the special revenue fund as noted below. Encumbrance accounting is also employed as an extension of formal budgetary integration in the governmental fuµd types. Unencumbered appropriations lapse at fiscal year end.
The accounting records of the special revenue fund are maintained on the grant accounting budgetary basis. The grant accounting budgetary basis differs from GAAP in that the grant accounting budgetary basis recognizes encumbrances as expenditures and also recognizes the related revenue, whereas the GAAP basis does not. Sufficient supplemental records are maintained to allow for the presentation of GAAP basis financial reports.
The General and Special Revenue Fund budgetary revenue differs from GAAP revenue due to a difference in the recognition of the June state aid payments for the current year. Since the State is recording the June state aid payments in the subsequent fiscal year, the District cannot recognize these payments on the GAAP financial statements.
SCHOOL LEVEL SCHEDULES (NOT APPLICABLE)
Page 84
Page 85
SPECIAL REVENUE FUND
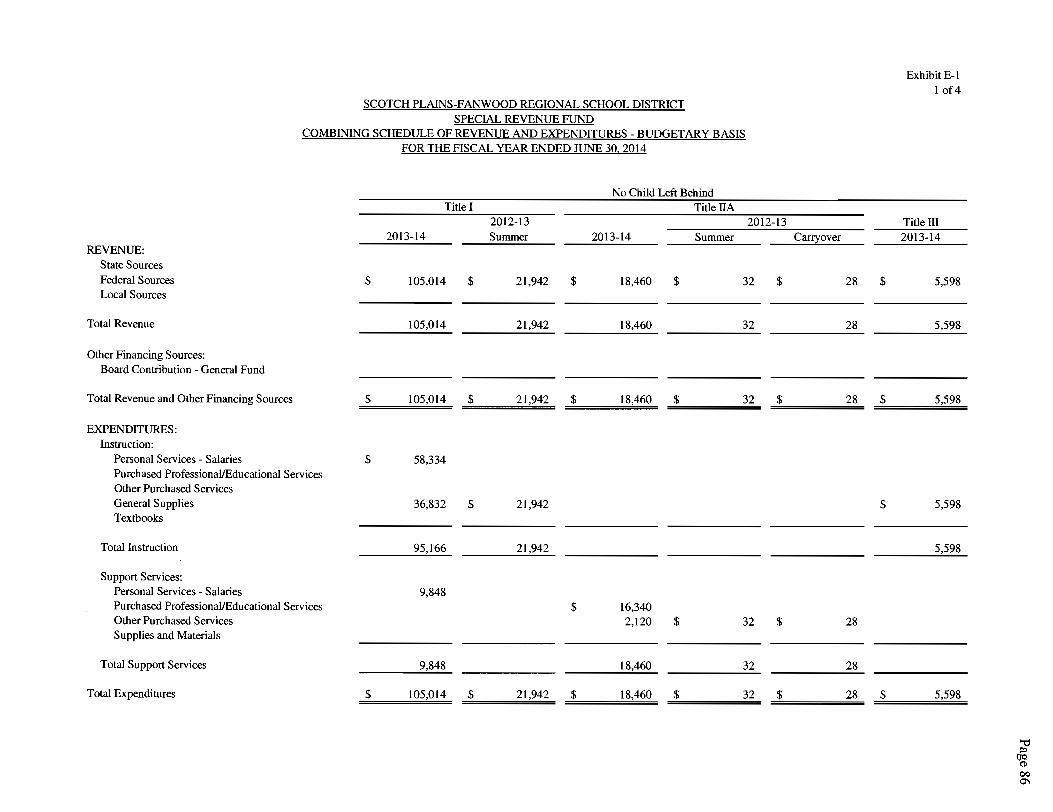
ExhibitE-1 1of4
SCOTCH PLAINS-FANWOOD REGIONAL SCHOOL DISTRICT SPECIAL REVENUE FUND
COMBINING SCHEDULE OF REVENUE AND EXPENDITURES - BUDGET ARY BASIS FOR THE FISCAL YEAR ENDED JUNE 30, 2014
No Child Left Behind Title I Title IIA
2012-13 2012-13 Title III 2013-14 Summer 2013-14 Summer Carryover 2013-14
REVENUE: State Sources Federal Sources $ 105,014 $ 21,942 $ 18,460 $ 32 $ 28 $ 5,598 Local Sources
Total Revenue 105,014 21,942 18,460 32 28 5,598
Other Financing Sources: Board Contribution - General Fund
Total Revenue and Other Financing Sources $ 105,014 $ 21,942 $ 18,460 $ 32 $ 28 $ 5,598
EXPENDITURES: Instruction:
Personal Services - Salaries $ 58,334 Purchased Professional/Educational Services Other Purchased Services General Supplies 36,832 $ 21,942 $ 5,598 Textbooks
Total Instruction 95,166 21,942 5,598
Support Services: Personal Services - Salaries 9,848 Purchased Professional/Educational Services $ 16,340 Other Purchased Services 2,120 $ 32 $ 28 Supplies and Materials
Total Support Services 9,848 18,460 32 28
Total Expenditures $ 105,014 $ 21,942 $ 18,460 $ 32 $ 28 $ 5,598
""O ~
IJC/ (!)
00 0\
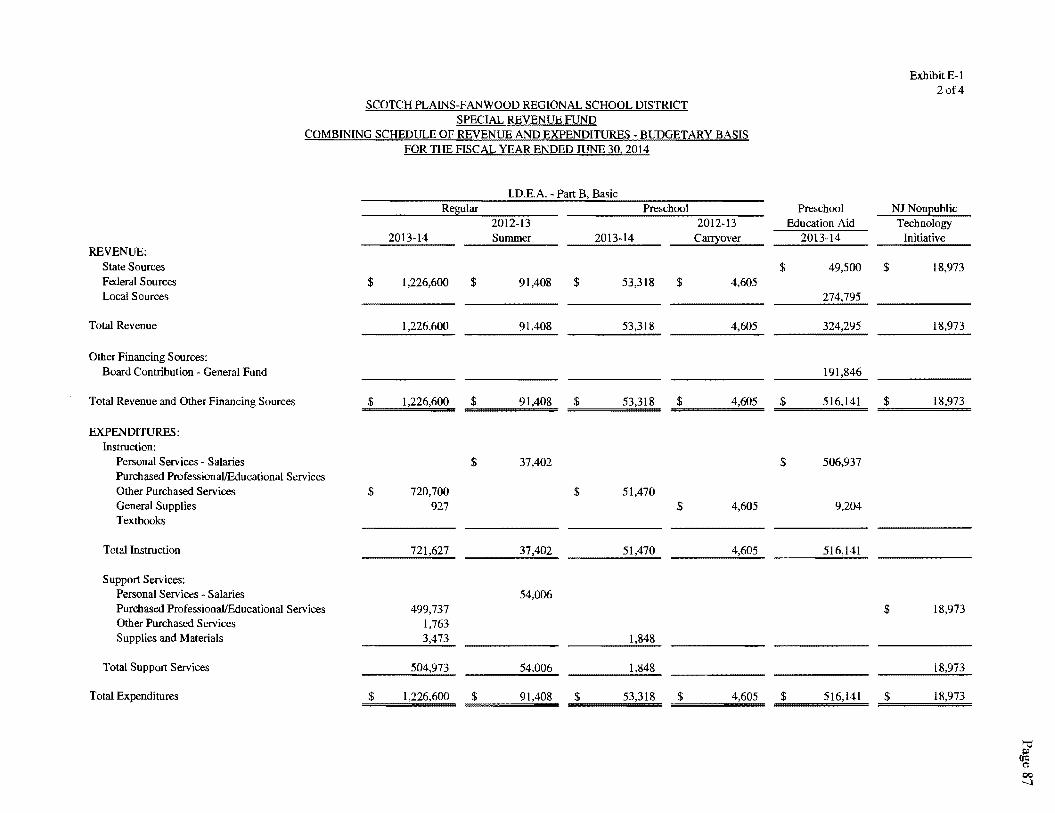
ExhibitE-1 2of4
SCOTCH PLAINS-FANWOOD REGIONAL SCHOOL DISTRICT SPECIAL REVENUE FUND
COMBINING SCHEDULE OF REVENUE AND EXPENDITURES - BUDGETARY BASIS FOR THE FISCAL YEAR ENDED JUNE 30, 2014
1.D.E.A. - Part B, Basic Regular Preschool Preschool NJ Noneublic
2012-13 2012-13 Education Aid Technology 2013-14 Summer 2013-14 Carryover 2013-14 Initiative
REVENUE: State Sources $ 49,500 $ 18,973 Federal Sources $ 1,226,600 $ 91,408 $ 53,318 $ 4,605 Local Sources 274,795
Total Revenue l,226,600 91,408 53,318 4,605 324,295 18,973
Other Financing Sources: Board Contribution General Fund 191,846
Total Revenue and Other Financing Sources $ l,226,600 $ 53,318 $ 4,605 $ 18,973
EXPENDITURES: Instruction:
Personal Services - Salaries $ 37,402 $ 506,937 Purchased Professional/Educational Services Other Purchased Services $ 720,700 $ 51,470 General Supplies 927 $ 4,605 9,204 Textbooks
Total Instruction 721,627 37,402 51,470 4,605 516,141
Support Services: Personal Services Salaries 54,006 Purchased Professional/Educational Services 499,737 $ 18,973 Other Purchased Services 1,763 Supplies and Materials 3,473 1,848
Total Support Services 504,973 54,006 l,848
Total Expenditures $ 91,408 $ 53,318 $ 4,605 $ 516,141
~ ~
(1Cl ('/)
00 ....;i

Exhibit E-1 3 of4
SCOTCH PLAINS-FANWOOD REGIONAL SCHOOL DISTRICT SPECIAL REVENUE FUND
COMBINING SCHEDULE OF REVENUE AND EXPENDITURES - BUDGET ARY BASIS FOR THE FISCAL YEAR ENDED JUNE 30, 2014
Non2ublic Auxili~ Services (Cha2ter 192) English asa
NJ Noni;:ublic Compensatory Second Home Textbooks Nursing Education Langua~e TransEortation Instruction
REVENUE: State Sources $ 55,688 $ 72,303 $ 64,711 $ 1,746 $ 11,251 $ 8,178 Federal Sources Local Sources
Total Revenue 55,688 72,303 64,711 1,746 11,251 8,178
Other Financing Sources: Board Contribution - General Fund
Total Revenue and Other Financing Sources $ 55,688 $ 72,303 $ 64,711 $ 1,746 $ 11,251 $ 8,178
EXPENDITURES: Instruction:
Personal Services Salaries Purchased Professional/Educational Services Other Purchased Services General Supplies Textbooks $ 55,688
Total Instruction 55,688
Support Services: Personal Services - Salaries Purchased Professional/Educational Services $ 72,303 $ 64,711 $ 1,746 $ 11,251 $ 8,178 Other Purchased Services Supplies and Materials
Total Support Services 72,303 64,711 1,746 11,251 8,178
Total Expenditures $ 55,688 $ 64,711 $ 1,746 $ 11,251 $ 8,178
"'O i::>
(Jq G OQ OQ
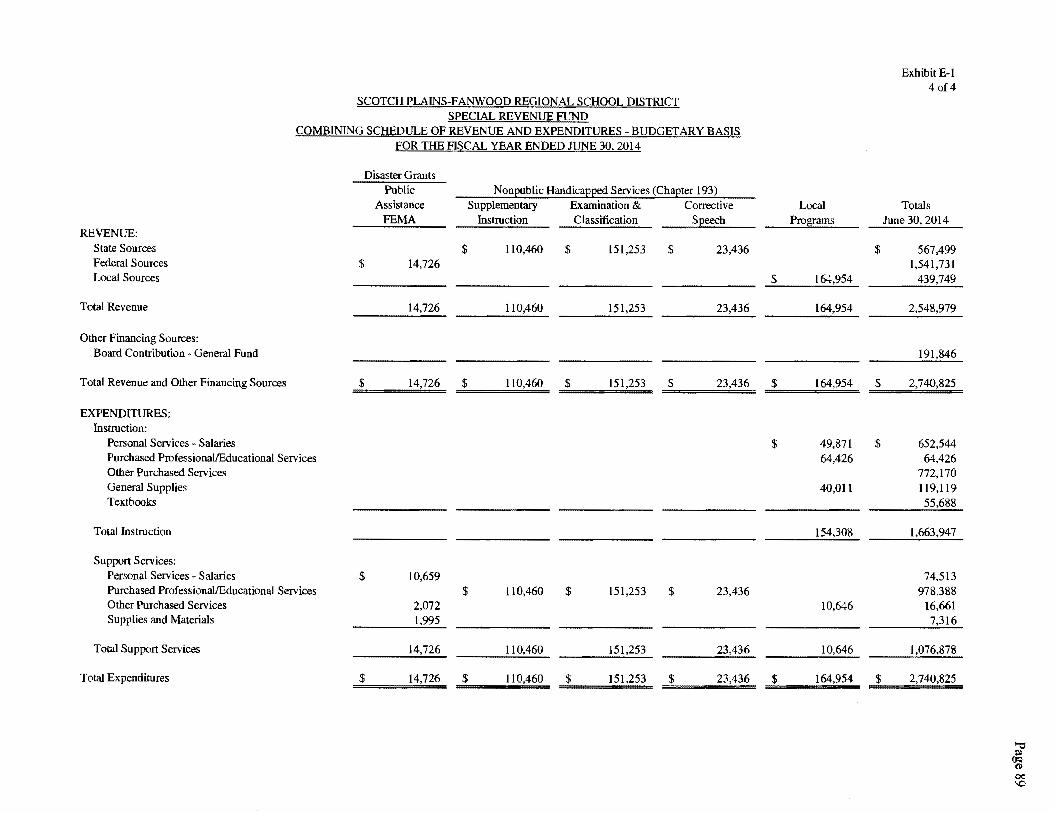
Exhibit E-1 4of4
SCOTCH PLAINS-FANWOOD REGIONAL SCHOOL DISTRICT SPECIAL REVENUE FUND
COMBINING SCHEDULE OF REVENUE AND EXPENDITURES - BUDGET ARY BASIS FOR THE FISCAL YEAR ENDED JUNE 30, 2014
Disaster Grants Public Non_eublic Handica_eped Services (ChaEter 193)
Assistance Supplementary Examination & Corrective Local Totals FEMA Instruction Classification SEeech Programs June 30, 2014
REVENUE: State Sources $ 110,460 $ 151,253 $ 23,436 $ 567,499 Federal Sources $ 14,726 l,541,731 Local Sources $ 164,954 439,749
Total Revenue 14,726 l I0,460 151,253 23,436 164,954 2,548,979
Other Financing Sources: Board Contribution - General Fund 191,846
Total Revenue and Other Financing Sources $ 14,726 $ 110,460 $ 151,253 $ 23,436 $ 164,954 $ 2,740,825
EXPENDITURES: Instruction:
Personal Services Salaries $ 49,871 $ 652,544 Purchased ProfessionalJEducational Services 64,426 64,426 Other Purchased Services 772,170 General Supplies 40,011 119,119 Textbooks 55,688
Total Instruction 154,308 1,663,947
Support Services: Personal Services Salaries $ I0,659 74,513 Purchased ProfessionallEducational Services $ 110,460 $ 151,253 $ 23,436 978,388 Other Purchased Services 2,072 10,646 16,661 Supplies and Materials 1,995 7,316
Total Support Services 14,726 110,460 151,253 23,436 10,646 1,076,878
Total Expenditures $ 14,726 $ I I0,460 $ 151,253 $ 23,436 $ 164,954 $ 2,740,825
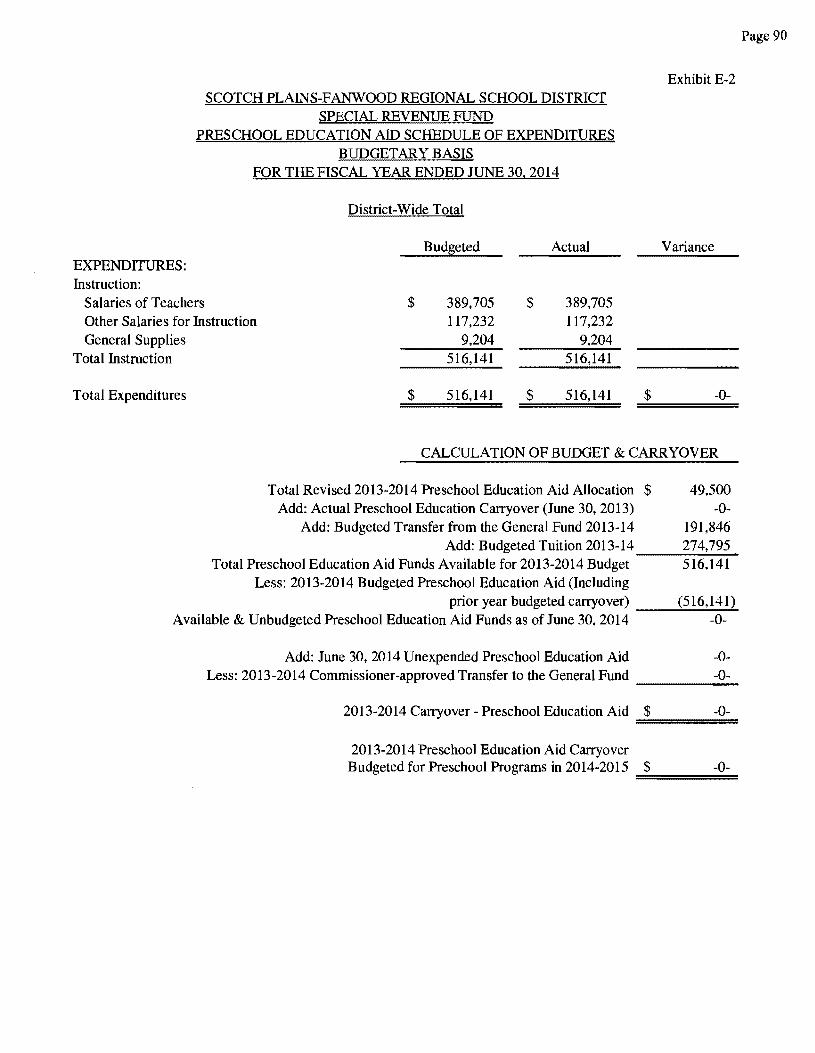
EXPENDITURES: Instruction:
SCOTCH PLAINS-FANWOOD REGIONAL SCHOOL DISTRICT SPECIAL REVENUE FUND
PRESCHOOL EDUCATION AID SCHEDULE OF EXPENDITURES BUDGETARY BASIS
FOR THE FISCAL YEAR ENDED JUNE 30, 2014
District-Wide Total
Bud~eted Actual
Exhibit E-2
Variance
Salaries of Teachers $ 389,705 $ 389,705 Other Salaries for Instruction 117,232 117,232
9,204 General Supplies 9,204 Total Instruction 516,141 516,141
Total Expenditures $ 516,141 $ 516,141 $ -0-
CALCULATION OF BUDGET & CARRYOVER
Total Revised 2013-2014 Preschool Education Aid Allocation $ 49,500 Add: Actual Preschool Education Carryover (June 30, 2013) -0-
Add: Budgeted Transfer from the General Fund 2013-14 191,846 Add: Budgeted Tuition 2013-14 274,795 ------
Total Preschool Education Aid Funds Available for 2013-2014 Budget 516,141 Less: 2013-2014 Budgeted Preschool Education Aid (Including
prior year budgeted carryover) (516,141) ----------Available & Unbudgeted Preschool Education Aid Funds as of June 30, 2014 -0-
Add: June 30, 2014 Unexpended Preschool Education Aid Less: 2013-2014 Commissioner-approved Transfer to the General Fund
2013-2014 Carryover - Preschool Education Aid
-0--0--------0-==========
2013-2014 Preschool Education Aid Carryover Budgeted for Preschool Programs in 2014-2015 $ -0-===========
Page 90
Page 91
CAPITAL PROJECTS FUND
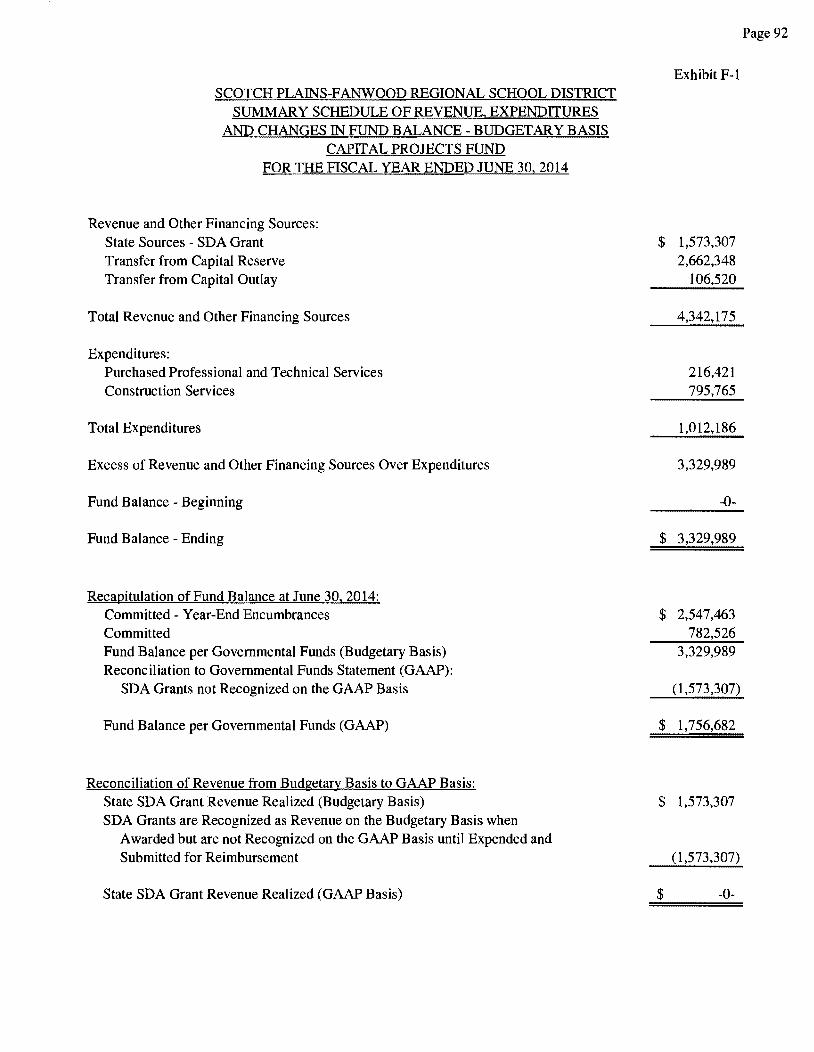
SCOTCH PLAINS-FANWOOD REGIONAL SCHOOL DISTRICT SUMMARY SCHEDULE OF REVENUE, EXPENDITURES
AND CHANGES IN FUND BALANCE - BUDGETARY BASIS CAPITAL PROJECTS FUND
FOR THE FISCAL YEAR ENDED JUNE 30, 2014
Revenue and Other Financing Sources: State Sources - SDA Grant Transfer from Capital Reserve Transfer from Capital Outlay
Total Revenue and Other Financing Sources
Expenditures: Purchased Professional and Technical Services Construction Services
Total Expenditures
Excess of Revenue and Other Financing Sources Over Expenditures
Fund Balance - Beginning
Fund Balance - Ending
Recapitulation of Fund Balance at June 30, 2014: Committed - Year-End Encumbrances Committed Fund Balance per Governmental Funds (Budgetary Basis) Reconciliation to Governmental Funds Statement (GAAP):
SDA Grants not Recognized on the GAAP Basis
Fund Balance per Governmental Funds (GAAP)
Reconciliation of Revenue from Budgetary Basis to GAAP Basis: State SDA Grant Revenue Realized (Budgetary Basis) SDA Grants are Recognized as Revenue on the Budgetary Basis when
A warded but are not Recognized on the GAAP Basis until Expended and Submitted for Reimbursement
State SDA Grant Revenue Realized (GAAP Basis)
Exhibit F-1
$ 1,573,307 2,662,348
106,520
4,342,175
216,421 795,765
1,012,186
3,329,989
-0-
$ 3,329,989
$ 2,547,463 782,526
3,329,989
( 1,573,307)
$ 1,756,682
$ 1,573,307
(1,573,307)
$ -0-
Page 92
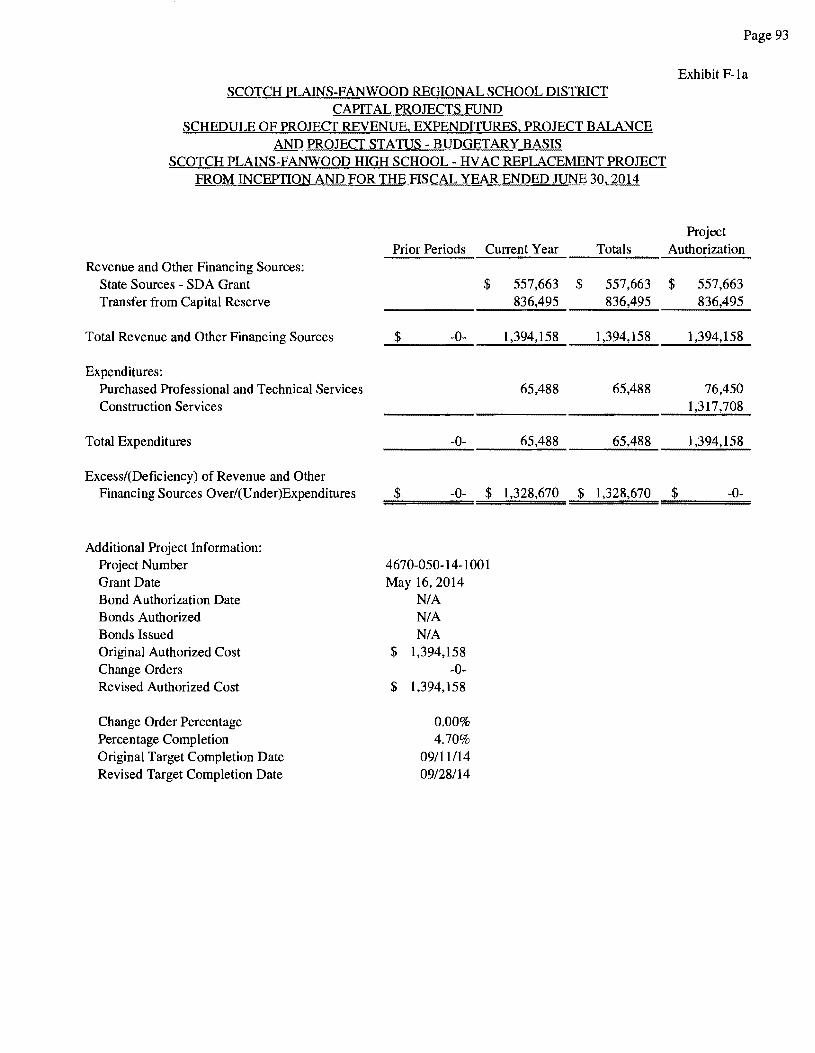
SCOTCH PLAINS-FANWOOD REGIONAL SCHOOL DISTRICT CAPITAL PROJECTS FUND
SCHEDULE OF PROJECT REVENUE. EXPENDITURES. PROJECT BALANCE AND PROJECT STATUS - BUDGETARY BASIS
SCOTCH PLAINS-FANWOOD HIGH SCHOOL - HV AC REPLACEMENT PROJECT FROM INCEPTION AND FOR THE FISCAL YEAR ENDED JUNE 30, 2014
Revenue and Other Financing Sources: State Sources - SDA Grant Transfer from Capital Reserve
Total Revenue and Other Financing Sources
Expenditures: Purchased Professional and Technical Services Construction Services
Total Expenditures
Excess/(Deficiency) of Revenue and Other Financing Sources Overl(Under)Expenditures
Additional Project Information: Project Number Grant Date Bond Authorization Date Bonds Authorized Bonds Issued Original Authorized Cost Change Orders Revised Authorized Cost
Change Order Percentage Percentage Completion Original Target Completion Date Revised Target Completion Date
Prior Periods Current Year
$
$ -0-
-0-
$ -0- $
4670-050-14-100 l May 16, 2014
NIA NIA NIA
$ 1,394,158 -0-
$ 1,394,158
0.00% 4.70%
09/11114 09/28/14
557,663 836,495
1,394,158
65,488
65,488
1,328,670
Totals
$ 557,663 836,495
1,394,158
65,488
65,488
$ 1,328,670
Page 93
Exhibit F- la
Project Authorization
$ 557,663 836,495
1,394,158
76,450 l,317,708
1,394,158
$ -0-
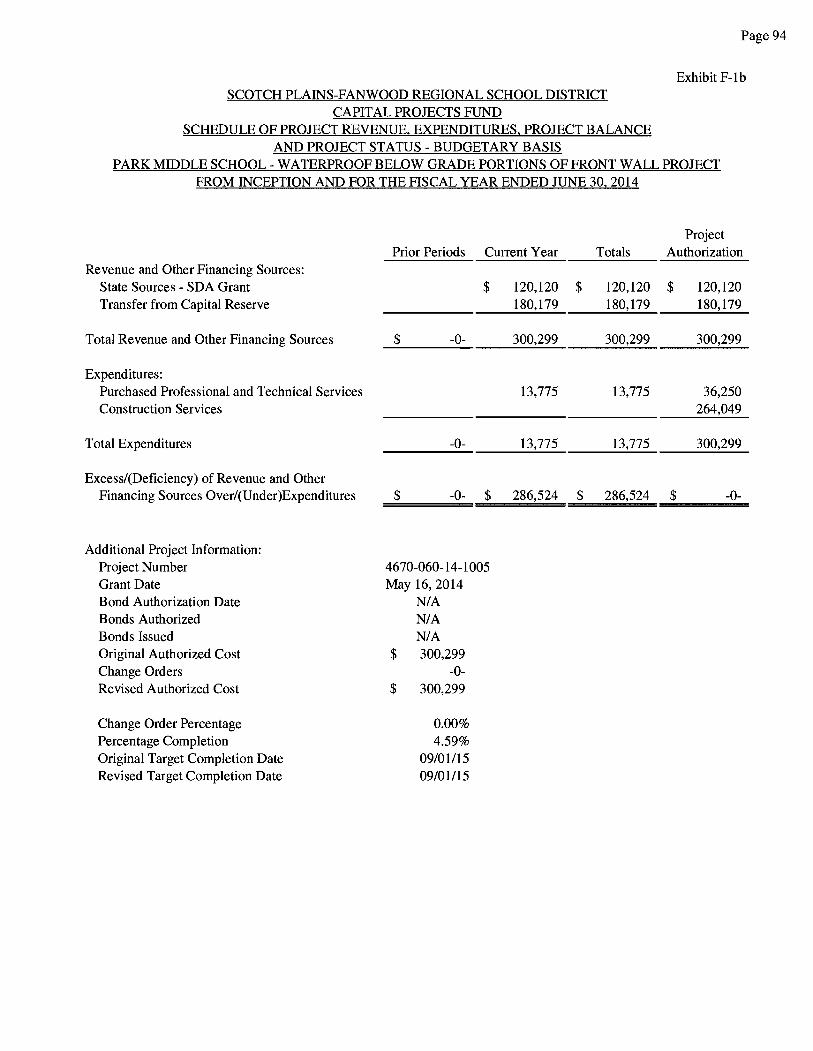
SCOTCH PLAINS-FANWOOD REGIONAL SCHOOL DISTRICT CAPITAL PROJECTS FUND
SCHEDULE OF PROJECT REVENUE, EXPENDITURES, PROJECT BALANCE AND PROJECT STATUS - BUDGETARY BASIS
Page 94
Exhibit F-1 b
PARK MIDDLE SCHOOL - WATERPROOF BELOW GRADE PORTIONS OF FRONT WALL PROJECT FROM INCEPTION AND FOR THE FISCAL YEAR ENDED JUNE 30, 2014
Revenue and Other Financing Sources: State Sources - SDA Grant Transfer from Capital Reserve
Total Revenue and Other Financing Sources
Expenditures: Purchased Professional and Technical Services Construction Services
Total Expenditures
Excessl(Deficiency) of Revenue and Other Financing Sources Overl(Under )Expenditures
Additional Project Information: Project Number Grant Date Bond Authorization Date Bonds Authorized Bonds Issued Original Authorized Cost Change Orders Revised Authorized Cost
Change Order Percentage Percentage Completion Original Target Completion Date Revised Target Completion Date
Prior Periods Current Year
$
$ -0-
-0-
$ -0- $
4670-060-14-1005 May 16, 2014
NIA NIA NIA
$ 300,299 -0-
$ 300,299
0.00% 4.59%
09101115 09101115
120,120 180,179
300,299
13,775
13,775
286,524
Project Totals Authorization
$ 120,120 $ 120,120 180,179 180,179
300,299 300,299
13,775 36,250 264,049
13,775 300,299
$ 286,524 $ -0-

SCOTCH PLAINS-FANWOOD REGIONAL SCHOOL DISTRICT CAPITAL PROJECTS FUND
SCHEDULE OF PROJECT REVENUE, EXPENDITURES, PROJECT BALANCE AND PROJECT STATUS- BUDGETARY BASIS
WILLIAM J. McGINN ELEMENTARY SCHOOL - HV AC UPGRADES PROJECT FROM INCEPTION AND FOR THE FISCAL YEAR ENDED JUNE 30, 2014
Revenue and Other Financing Sources: State Sources - SDA Grant Transfer from Capital Reserve
Total Revenue and Other Financing Sources
Expenditures: Purchased Professional and Technical Services Construction Services
Total Expenditures
Excessl(Deficiency) of Revenue and Other Financing Sources Overl(Under)Expenditures
Additional Project Information: Project Number Grant Date Bond Authorization Date Bonds Authorized Bonds Issued Original Authorized Cost Change Orders Revised Authorized Cost
Change Order Percentage Percentage Completion Original Target Completion Date Revised Target Completion Date
Prior Periods Current Year
$
$ -0-
-0-
$ -0- $
4670-105-14-1021 May 16, 2014
NIA NIA NIA
$ 107,956 -0-
$ 107,956
0.00% 13.39%
09111114 09128/14
43,182 64,774
107,956
14,450
14,450
93,506
Totals
$ 43,182 64,774
107,956
14,450
14,450
$ 93,506
Page 95
Exhibit F-1 c
Project Authorization
$ 43,182 64,774
107,956
17,000 90,956
107,956
$ -0-
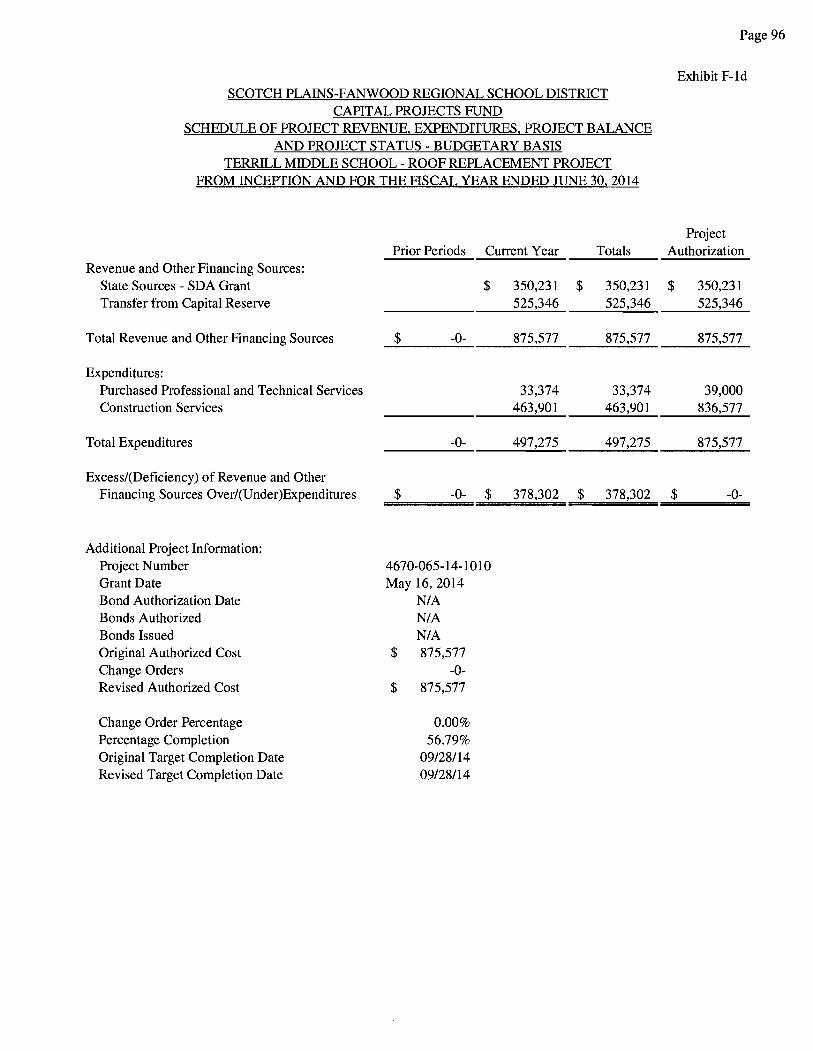
SCOTCH PLAINS-FANWOOD REGIONAL SCHOOL DISTRICT CAPITAL PROJECTS FUND
SCHEDULE OF PROJECT REVENUE, EXPENDITURES, PROJECT BALANCE AND PROJECT STATUS - BUDGETARY BASIS
TERRILL MIDDLE SCHOOL - ROOF REPLACEMENT PROJECT FROM INCEPTION AND FOR THE FISCAL YEAR ENDED JUNE 30, 2014
Revenue and Other Financing Sources: State Sources - SDA Grant Transfer from Capital Reserve
Prior Periods Current Year
$ 350,231 525,346
Total Revenue and Other Financing Sources $ -0- 875,577
Expenditures: Purchased Professional and Technical Services Construction Services
Total Expenditures
Excessl(Deficiency) of Revenue and Other Financing Sources Overl(Under)Expenditures
Additional Project Information: Project Number Grant Date Bond Authorization Date Bonds Authorized Bonds Issued Original Authorized Cost Change Orders Revised Authorized Cost
Change Order Percentage Percentage Completion Original Target Completion Date Revised Target Completion Date
-----
-0-
$ -0- $
4670-065-14-1010 May 16, 2014
NIA NIA NIA
$ 875,577 -0-
$ 875,577
0.00% 56.79%
09128/14 09/28/14
33,374 463,901
497,275
378,302
Totals
$ 350,231 525,346
875,577
33,374 463,901
497,275
$ 378,302
Page 96
Exhibit F-1 d
Project Authorization
$ 350,231 525,346
875,577
39,000 836,577
875,577
$ -0-
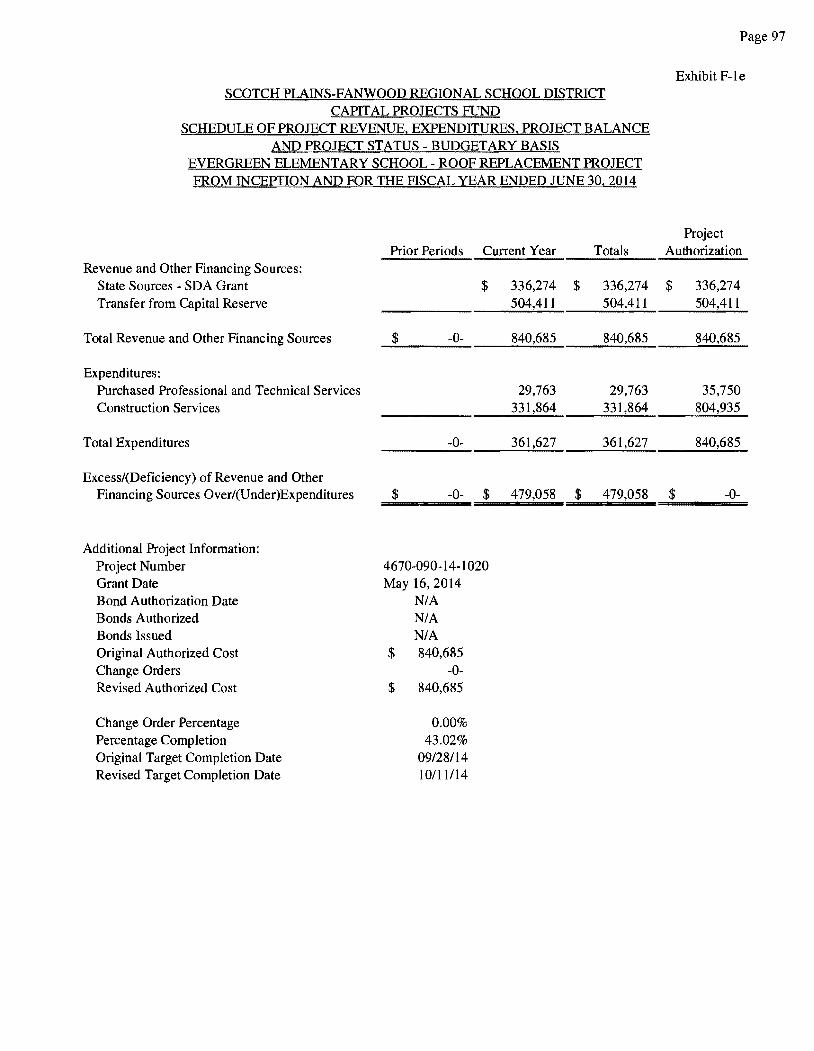
SCOTCH PLAINS-FANWOOD REGIONAL SCHOOL DISTRICT CAPITAL PROJECTS FUND
SCHEDULE OF PROJECT REVENUE. EXPENDITURES, PROJECT BALANCE AND PROJECT STATUS - BUDGETARY BASIS
EVERGREEN ELEMENTARY SCHOOL - ROOF REPLACEMENT PROJECT FROM INCEPfION AND FOR THE FISCAL YEAR ENDED JUNE 30, 2014
Page 97
Exhibit F-1 e
Project Prior Periods Current Year Totals Authorization
Revenue and Other Financing Sources: State Sources - SDA Grant Transfer from Capital Reserve
$
-0-Total Revenue and Other Financing Sources $ --'-----Expenditures:
Purchased Professional and Technical Services Construction Services
Total Expenditures
Excess/(Deficiency) of Revenue and Other Financing Sources Over/(Under)Expenditures
Additional Project Information: Project Number Grant Date Bond Authorization Date Bonds Authorized Bonds Issued Original Authorized Cost Change Orders Revised Authorized Cost
Change Order Percentage Percentage Completion Original Target Completion Date Revised Target Completion Date
-0-
$ -0- $
4670-090-14-1020 May 16, 2014
NIA NIA NIA
$ 840,685 -0-
$ 840,685
0.00% 43.02%
09128/14 10/11114
-----336,274 $ 336,274 $ 336,274 504,411 504,411 504,411
840,685 840,685 840,685
29,763 29,763 35,750 331,864 331,864 804,935
361,627 361,627 840,685
479,058 $ 479,058 $ -0-
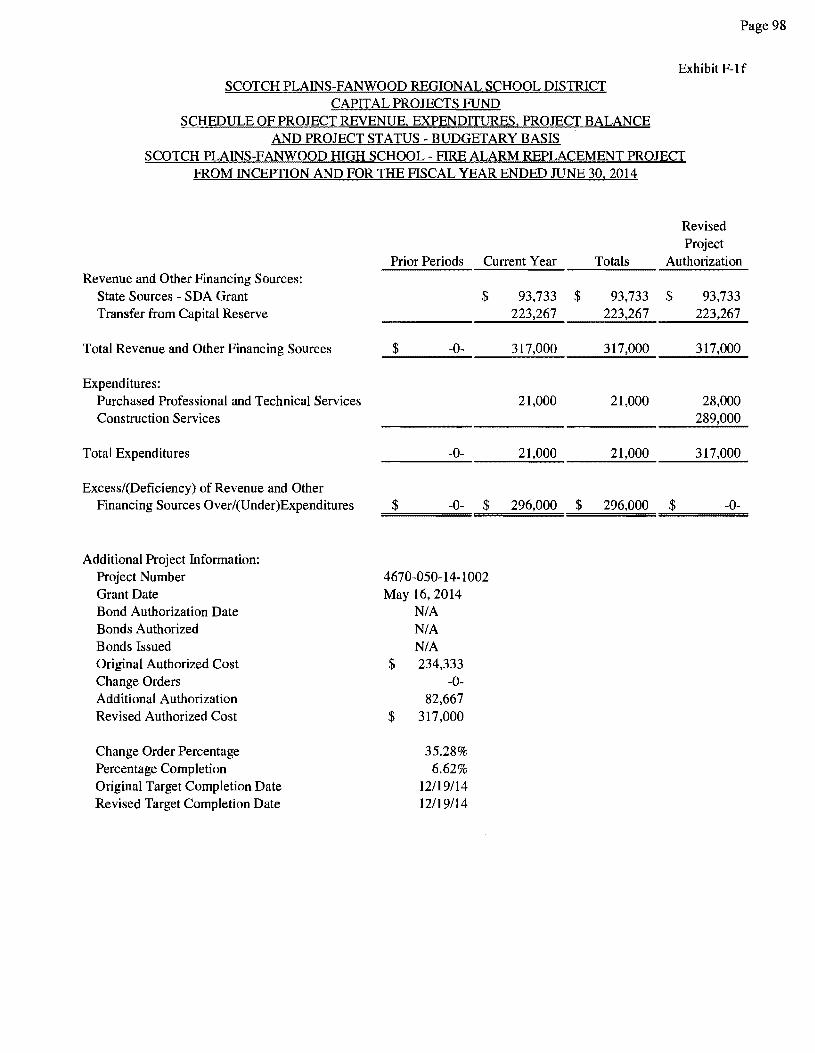
SCOTCH PLAINS-FANWOOD REGIONAL SCHOOL DISTRICT CAPITAL PROJECTS FUND
SCHEDULE OF PROJECT REVENUE. EXPENDITURES. PROJECT BALANCE AND PROJECT STATUS - BUDGETARY BASIS
Page 98
Exhibit F-1 f
SCOTCH PLAINS-FANWOOD HIGH SCHOOL - FIRE ALARM REPLACEMENT PROJECT FROM INCEPTION AND FOR THE FISCAL YEAR ENDED JUNE 30, 2014
Revenue and Other Financing Sources: State Sources - SDA Grant Transfer from Capital Reserve
Total Revenue and Other Financing Sources
Expenditures: Purchased Professional and Technical Services Construction Services
Total Expenditures
Excess/(Deficiency) of Revenue and Other Financing Sources Overl(Under)Expenditures
Additional Project Information: Project Number GrantDate Bond Authorization Date Bonds Authorized Bonds Issued Original Authorized Cost Change Orders Additional Authorization Revised Authorized Cost
Change Order Percentage Percentage Completion Original Target Completion Date Revised Target Completion Date
Prior Periods Current Year
$
$ -0-
-0-
$ -0- $
4670-050-14-1002 May 16, 2014
NIA NIA NIA
$ 234,333 -0-
82,667 $ 317,000
35.28% 6.62%
12119114 12119114
93,733 223,267
317,000
21,000
21,000
296,000
Revised Project
Totals Authorization
$ 93,733 $ 93,733 223,267 223,267
317,000 317,000
21,000 28,000 289,000
21,000 317,000
$ 296,000 $ -0-
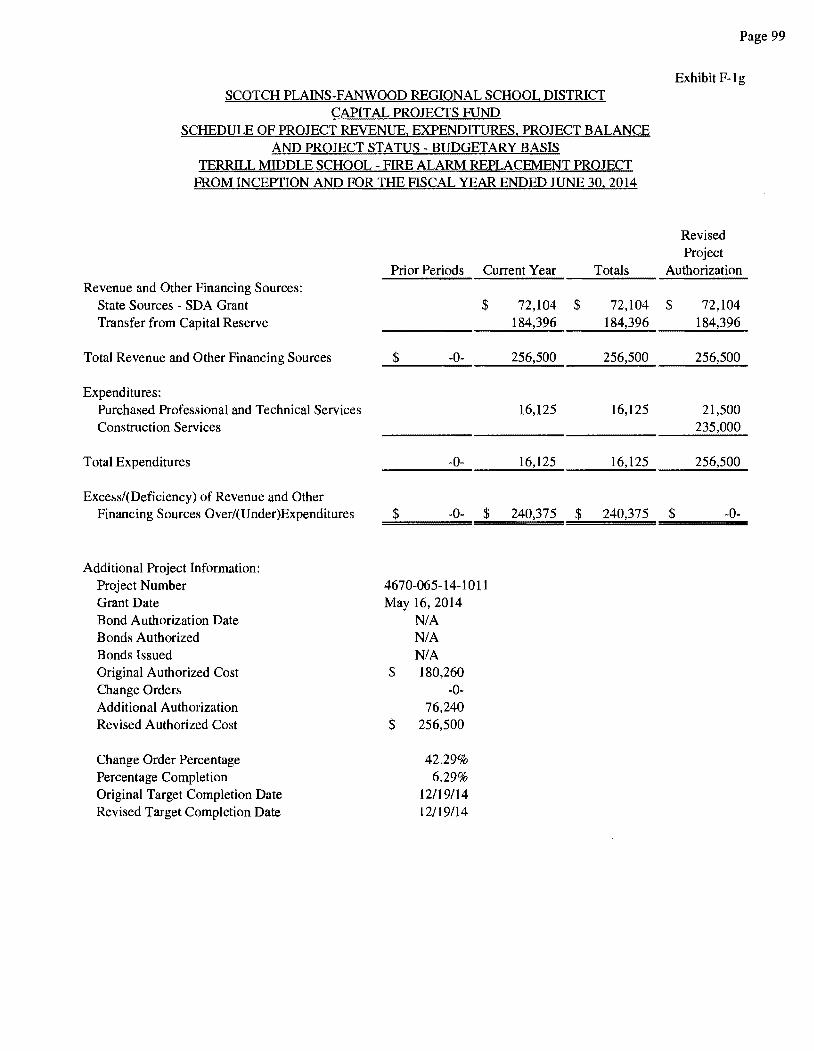
SCOTCH PLAINS-FANWOOD REGIONAL SCHOOL DISTRICT CAPITAL PROJECTS FUND
SCHEDULE OF PROJECT REVENUE, EXPENDITURES, PROJECT BALANCE AND PROJECT STATUS - BUDGETARY BASIS
TERRILL MIDDLE SCHOOL - FIRE ALARM REPLACEMENT PROJECT FROM INCEPTION AND FOR THE FISCAL YEAR ENDED JUNE 30, 2014
Revenue and Other Financing Sources: State Sources - SDA Grant Transfer from Capital Reserve
Total Revenue and Other Financing Sources
Expenditures: Purchased Professional and Technical Services Construction Services
Total Expenditures
Excessl(Deficiency) of Revenue and Other Financing Sources Overl(U nder)Expenditures
Additional Project Information: Project Number Grant Date Bond Authorization Date Bonds Authorized Bonds Issued Original Authorized Cost Change Orders Additional Authorization Revised Authorized Cost
Change Order Percentage Percentage Completion Original Target Completion Date Revised Target Completion Date
Prior Periods Current Year
$
$ -0-
-0-
$ -0- $
4670-065-14-1011 May 16, 2014
NIA NIA NIA
$ 180,260 -0-
76, 240 $ 256,500
42.29% 6.29%
12/19/14 12/19/14
72,104 184,396
256,500
16,125
16,125
240,375
Totals
$ 72,104 184,396
256,500
16,125
16,125
$ 240,375
Page 99
Exhibit F- lg
Revised Project
Authorization
$ 72,104 184,396
256,500
21,500 235,000
256,500
$ -0-
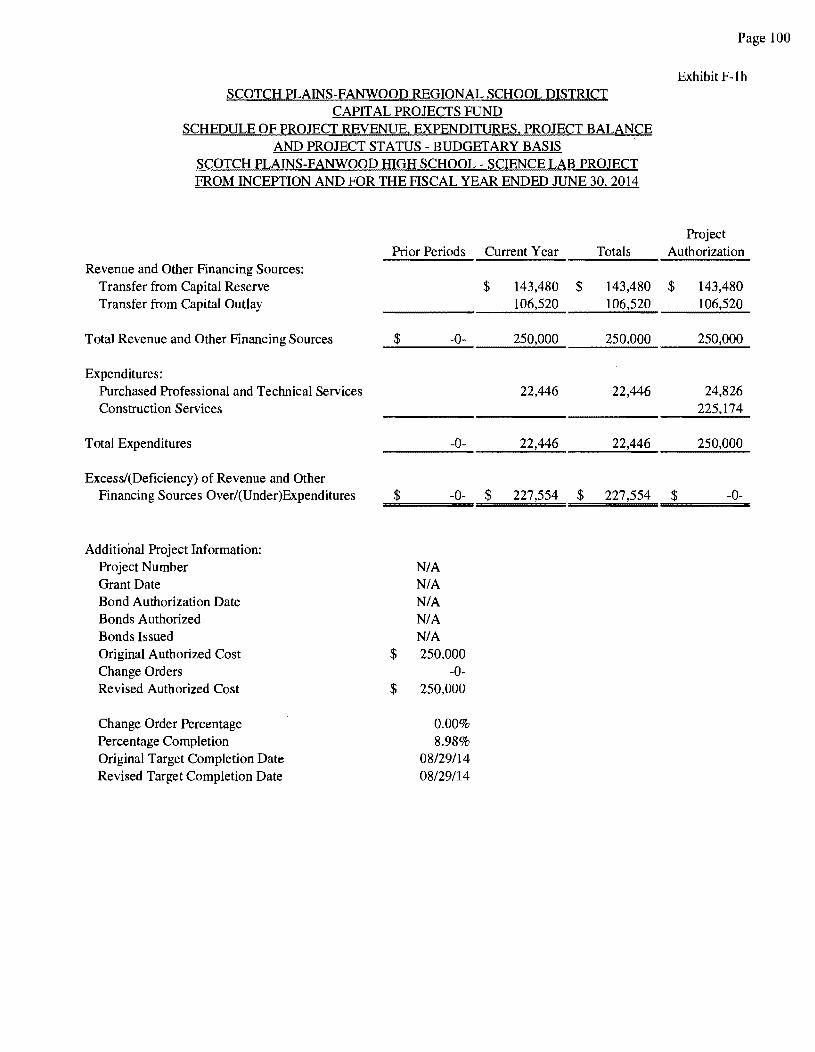
SCOTCH PLAINS-FANWOOD REGIONAL SCHOOL DISTRICT CAPITAL PROJECTS FUND
SCHEDULE OF PROJECT REVENUE, EXPENDITURES. PROJECT BALANCE AND PROJECT STATUS- BUDGETARY BASIS
SCOTCH PLAINS-FANWOOD HIGH SCHOOL - SCIENCE LAB PROJECT FROM INCEPTION AND FOR THE FISCAL YEAR ENDED JUNE 30, 2014
Prior Periods Current Year Totals Revenue and Other Financing Sources:
Transfer from Capital Reserve $ 143,480 $ 143,480 Transfer from Capital Outlay 106,520 106,520
Total Revenue and Other Financing Sources $ -0- 250,000 250,000
Expenditures: Purchased Professional and Technical Services 22,446 22,446 Construction Services
Total Expenditures -0- 22,446 22,446
Excess/(Deficiency) of Revenue and Other Financing Sources Overl(Under)Expenditures $ -0- $ 227,554 $ 227,554
Additional Project Information: Project Number NIA Grant Date NIA Bond Authorization Date NIA Bonds Authorized NIA Bonds Issued NIA Original Authorized Cost $ 250,000 Change Orders -0-Revised Authorized Cost $ 250,000
Change Order Percentage 0.00% Percentage Completion 8.98% Original Target Completion Date 08129114 Revised Target Completion Date 08129114
Page 100
Exhibit F-lh
Project Authorization
$ 143,480 106,520
250,000
24,826 225,174
250,000
$ -0-
Page 101
PROPRIETARY FUNDS
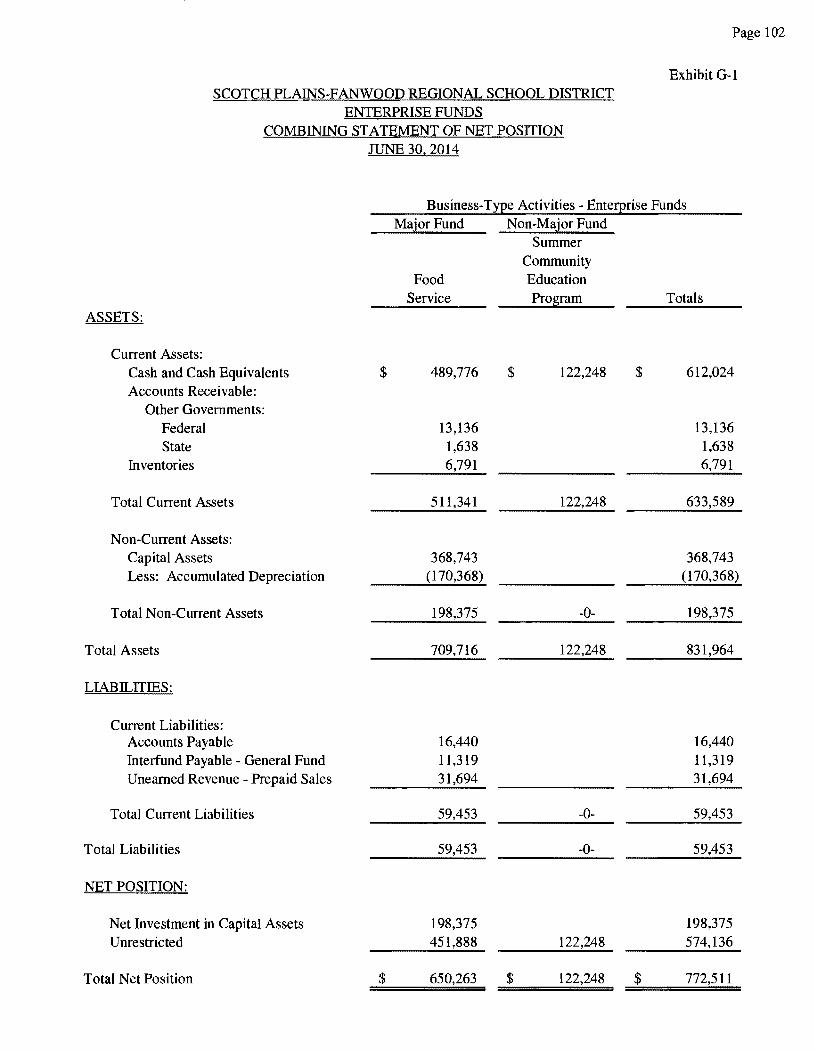
SCOTCH PLAINS-FANWOOD REGIONAL SCHOOL DISTRICT ENTERPRISE FUNDS
COMBINING STATEMENT OF NET POSITION JUNE 30, 2014
Page 102
Exhibit G-1
Business-TxEe Activities - Ente!Erise Funds Major Fund Non-Major Fund
Summer Community
Food Education Service Program Totals
ASSETS:
Current Assets: Cash and Cash Equivalents $ 489,776 $ 122,248 $ 612,024 Accounts Receivable:
Other Governments: Federal 13,136 13,136 State 1,638 1,638
Inventories 6,791 6,791
Total Current Assets 511,341 122,248 633,589
Non-Current Assets: Capital Assets 368,743 368,743 Less: Accumulated Depreciation (170,368) (170,368)
Total Non-Current Assets 198,375 -0- 198,375
Total Assets 709,716 122,248 831,964
LIABILITIES:
Current Liabilities: Accounts Payable 16,440 16,440 Interfund Payable - General Fund 11,319 11,319 Unearned Revenue - Prepaid Sales 31,694 31,694
Total Current Liabilities 59,453 -0- 59,453
Total Liabilities 59,453 -0- 59,453
NET POSITION:
Net Investment in Capital Assets 198,375 198,375 Unrestricted 451,888 122,248 574,136
Total Net Position $ 650,263 $ 122,248 $ 772,511
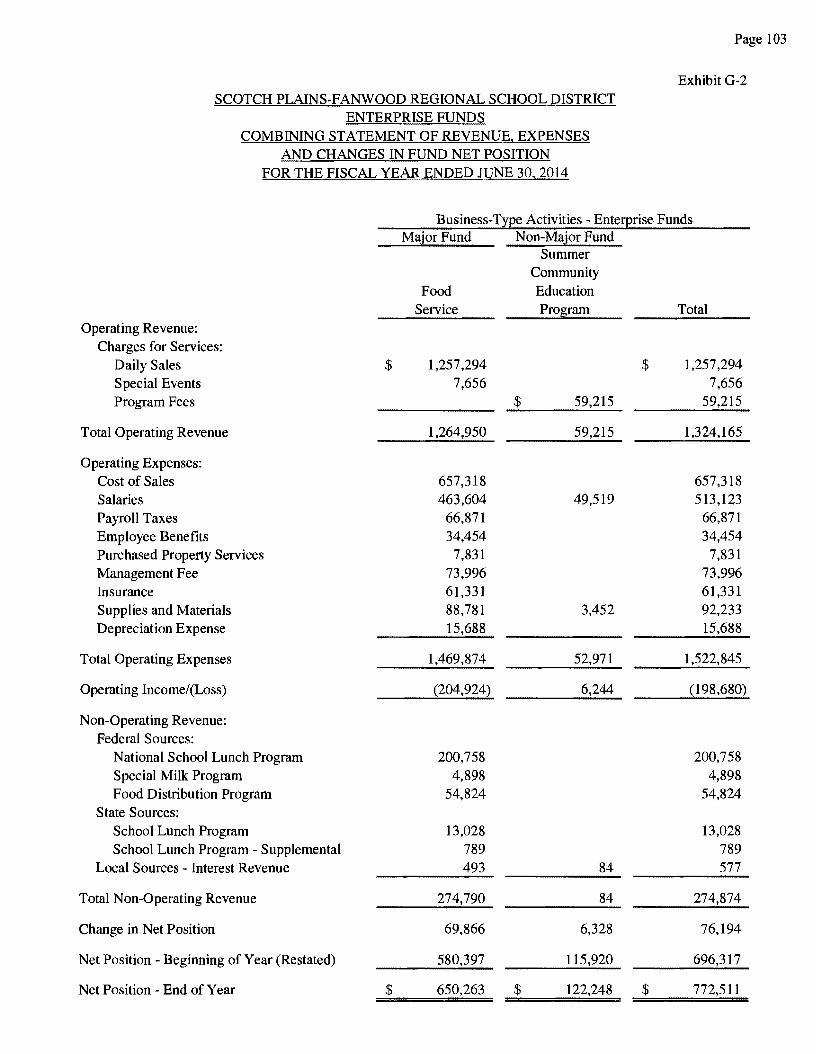
Page 103
Exhibit G-2 SCOTCH PLAINS-FANWOOD REGIONAL SCHOOL DISTRICT
ENTERPRISE FUNDS COMBINING STATEMENT OF REVENUE, EXPENSES
AND CHANGES IN FUND NET POSITION FOR THE FISCAL YEAR ENDED JUNE 30, 2014
B usiness-Ti'.Ee Activities - Ente!Erise Funds Major Fund Non-Major Fund
Summer Community
Food Education Service Prosram Total
Operating Revenue: Charges for Services:
Daily Sales $ 1,257,294 $ 1,257,294 Special Events 7,656 7,656 Program Fees $ 59,215 59,215
Total Operating Revenue 1,264,950 59,215 1,324,165
Operating Expenses: Cost of Sales 657,318 657,318 Salaries 463,604 49,519 513,123 Payroll Taxes 66,871 66,871 Employee Benefits 34,454 34,454 Purchased Property Services 7,831 7,831 Management Fee 73,996 73,996 Insurance 61,331 61,331 Supplies and Materials 88,781 3,452 92,233 Depreciation Expense 15,688 15,688
Total Operating Expenses 1,469,874 52,971 1,522,845
Operating Income/(Loss) (204,924) 6,244 (198,680)
Non-Operating Revenue: Federal Sources:
National School Lunch Program 200,758 200,758 Special Milk Program 4,898 4,898 Food Distribution Program 54,824 54,824
State Sources: School Lunch Program 13,028 13,028 School Lunch Program - Supplemental 789 789
Local Sources - Interest Revenue 493 84 577
Total Non-Operating Revenue 274,790 84 274,874
Change in Net Position 69,866 6,328 76,194
Net Position - Beginning of Year (Restated) 580,397 115,920 696,317
Net Position - End of Year $ 650,263 $ 122,248 $ 772,511
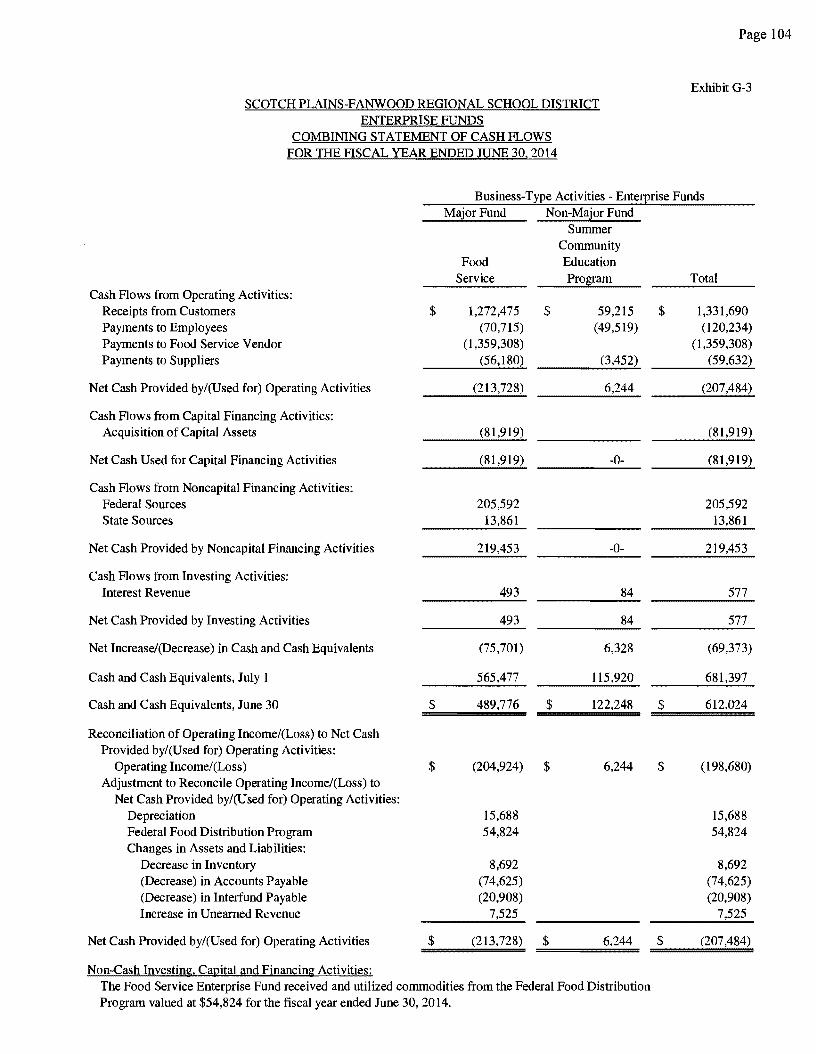
SCOTCH PLAINS-FANWOOD REGIONAL SCHOOL DISTRICT ENTERPRISE FUNDS
COMBINING STATEMENT OF CASH FLOWS FOR THE FISCAL YEAR ENDED JUNE 30, 2014
Page 104
ExhibitG-3
Business-Type Activities - Ente!}!rise Funds Major Fund Non-Major Fund
Summer Community
Food Education Service Pro~am Total
Cash Flows from Operating Activities: Receipts from Customers $ 1,272,475 $ 59,215 $ 1,331,690 Payments to Employees (70,715) (49,519) (120,234) Payments to Food Service Vendor (1,359,308) (l,359,308) Payments to Suppliers (56,180) (3,452) (59,632)
Net Cash Provided by/(Used for) Operating Activities (207,484)
Cash Flows from Capital Financing Activities: Acquisition of Capital Assets (81,919) (81,919)
Net Cash Used for Capital Financing Activities (81,919) -0- (81,919)
Cash Flows from Noncapital Financing Activities: Federal Sources 205,592 205,592 State Sources 13,861
Net Cash Provided by Noncapital Financing Activities 219,453 -0- 219,453
Cash Flows from Investing Activities: Interest Revenue 493 84 577
Net Cash Provided by Investing Activities 493 84 577
Net Increase/(Decrease) in Cash and Cash Equivalents (75,701) 6,328 (69,373)
Cash and Cash Equivalents, July 1 565,477 681,397
Cash and Cash Equivalents, June 30 $ 489,776 $ 612,024
Reconciliation of Operating lncome/(Loss) to Net Cash Provided by/(Used for) Operating Activities:
Operating Income/(Loss) $ (204,924) $ 6,244 $ (198,680) Adjustment to Reconcile Operating Income/(Loss) to
Net Cash Provided by/(Used for) Operating Activities: Depreciation 15,688 15,688 Federal Food Distribution Program 54,824 54,824 Changes in Assets and Liabilities:
Decrease in Inventory 8,692 8,692 (Decrease) in Accounts Payable (74,625) (74,625) (Decrease) in Interfund Payable (20,908) (20,908) Increase in Unearned Revenue 7,525
Net Cash Provided by/(Used for) Operating Activities $ (213,728) $ 6,244 $ (207,484)
Non-Cash Investing, Canital and Financing Activities: The Food Service Enterprise Fund received and utilized commodities from the Federal Food Distribution Program valued at $54,824 for the fiscal year ended June 30, 2014.

Page 105
FIDUCIARY FUNDS
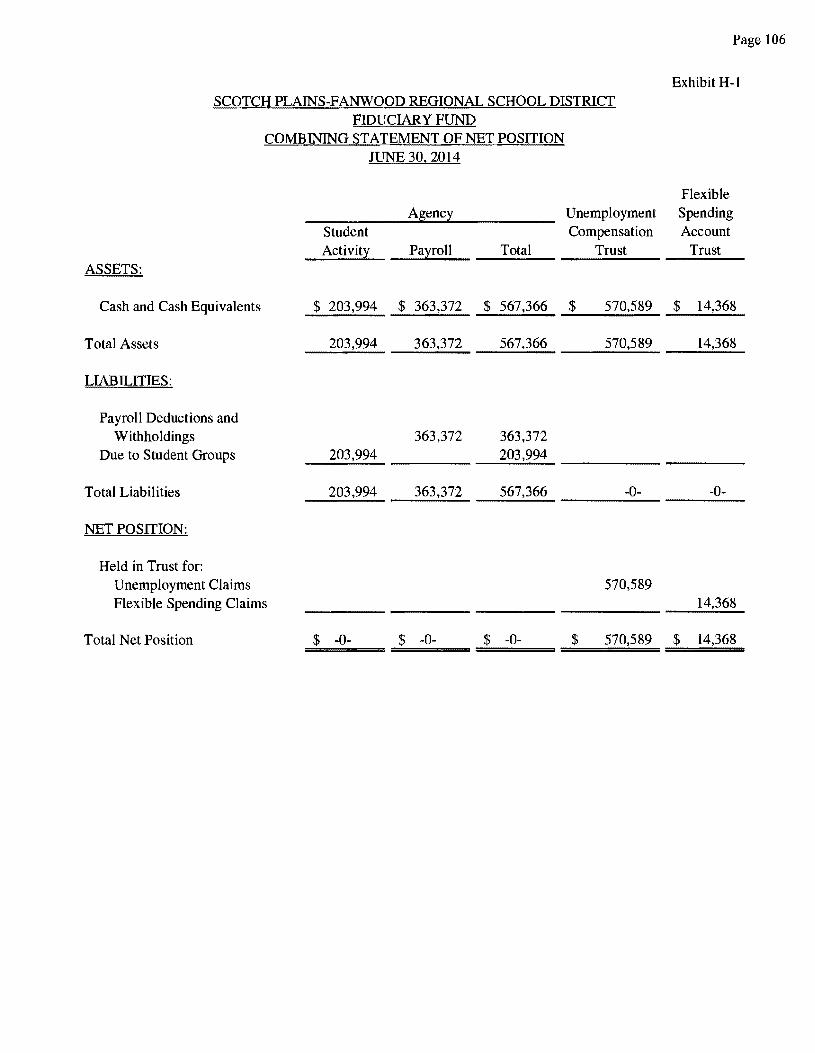
Page 106
Exhibit H-1 SCOTCH PLAINS-FANWOOD REGIONAL SCHOOL DISTRICT
FIDUCIARY FUND COMBINING STATEMENT OF NET POSITION
JUNE 30, 2014
Flexible
Agenc~ Unemployment Spending Student Compensation Account Activit~ Pa~roll Total Trust Trust
ASSETS:
Cash and Cash Equivalents $ 203,994 $ 363,372 $ 567,366 $ 570,589 $ 14,368
Total Assets 203,994 363,372 567,366 570,589 14,368
LIABILITIES:
Payroll Deductions and Withholdings 363,372 363,372
Due to Student Groups 203,994 203,994
Total Liabilities 203,994 363,372 567,366 -0- -0-
NET POSITION:
Held in Trust for: Unemployment Claims 570,589 Flexible Spending Claims 14,368
Total Net Position $ -0- $ -0- $ -0- $ 570,589 $ 14,368
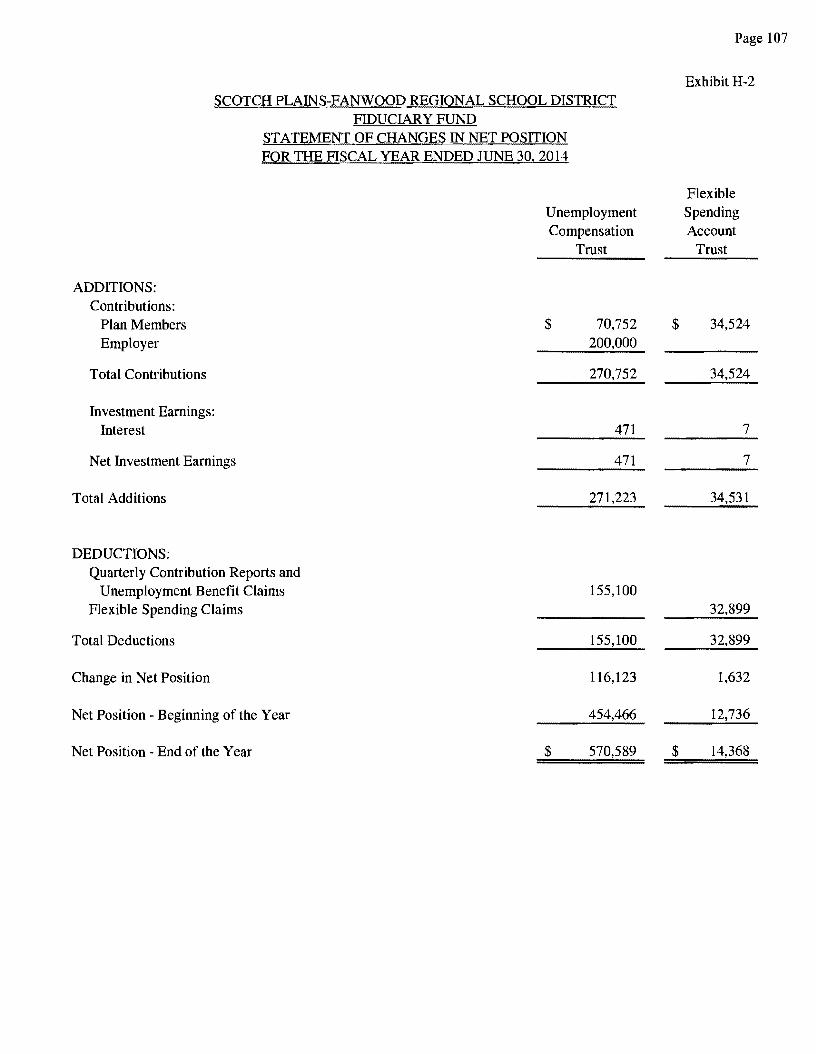
SCOTCH PLAINS-FANWOOD REGIONAL SCHOOL DISTRICT FIDUCIARY FUND
STATEMENT OF CHANGES IN NET POSITION FOR THE FISCAL YEARENDEDJUNE30, 2014
ADDITIONS: Contributions:
Plan Members Employer
Total Contributions
Investment Earnings: Interest
Net Investment Earnings
Total Additions
DEDUCTIONS: Quarterly Contribution Reports and
Unemployment Benefit Claims Flexible Spending Claims
Total Deductions
Change in Net Position
Net Position - Beginning of the Year
Net Position - End of the Year
Unemployment Compensation
Trust
$
$
70,752 200,000
270,752
471
471
271,223
155,100
155,100
116,123
454,466
570,589
$
$
Page 107
Exhibit H-2
Flexible Spending Account
Trust
34,524
34,524
7
7
34,531
32,899
32,899
1,632
12,736
14,368
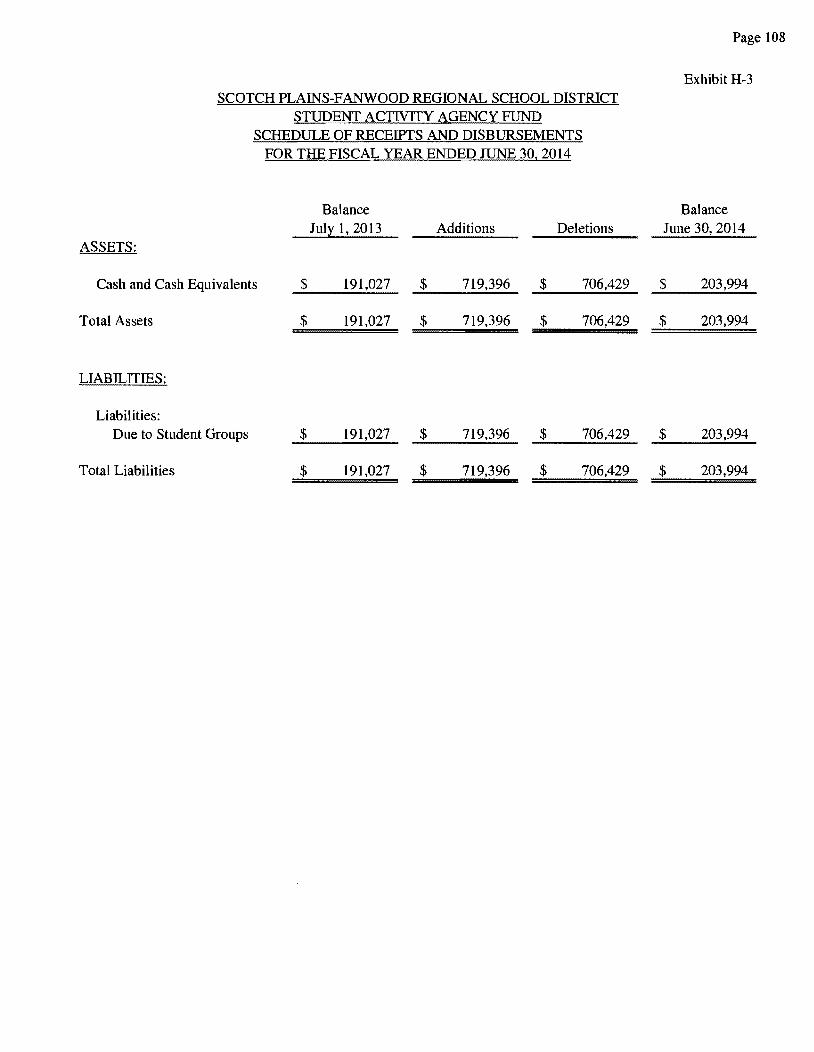
ASSETS:
SCOTCH PLAINS-FANWOOD REGIONAL SCHOOL DISTRICT STUDENT ACTIVITY AGENCY FUND
SCHEDULE OF RECEIPTS AND DISBURSEMENTS FOR THE FISCAL YEAR ENDED JUNE 30, 2014
Balance Jul~ 1, 2013 Additions Deletions
Cash and Cash Equivalents $ 191,027 $ 719,396 $ 706,429
Total Assets $ 191,027 $ 719,396 $ 706,429
LIABILITIES:
Liabilities: Due to Student Groups $ 191,027 $ 719,396 $ 706,429
Total Liabilities $ 191,027 $ 719,396 $ 706,429
Page 108
Exhibit H-3
Balance June 30, 2014
$ 203,994
$ 203,994
$ 203,994
$ 203,994
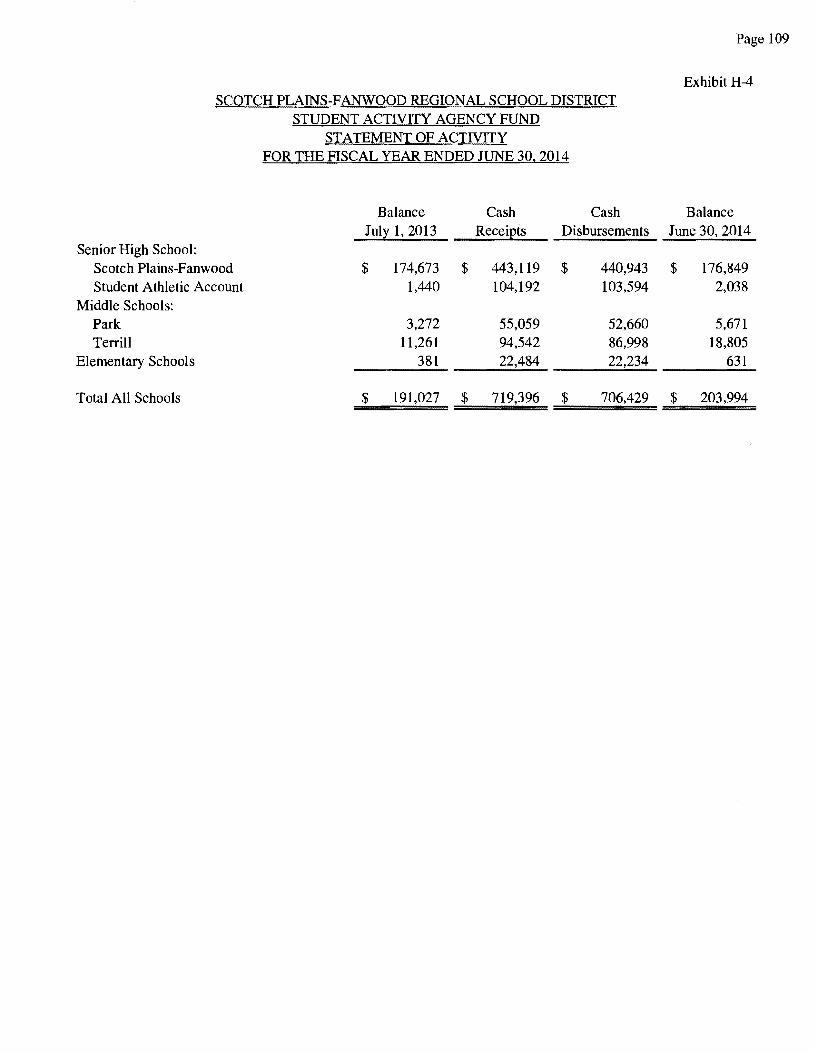
Senior High School:
SCOTCH PLAINS-FANWOOD REGIONAL SCHOOL DISTRICT STUDENT ACTIVITY AGENCY FUND
STATEMENT OF ACTIVITY FOR THE FISCAL YEAR ENDED JUNE 30, 2014
Balance Cash Cash Jul~ l, 2013 Recei~ts Disbursements
Scotch Plains-Fanwood $ 174,673 $ 443,119 $ 440,943 Student Athletic Account 1,440 104,192 103,594
Middle Schools: Park 3,272 55,059 52,660 Terrill 11,261 94,542 86,998
Elementary Schools 381 22,484 22,234
Total All Schools $ 191,027 $ 719,396 $ 706,429
Page 109
Exhibit H-4
Balance June 30, 2014
$ 176,849 2,038
5,671 18,805
631
$ 203,994
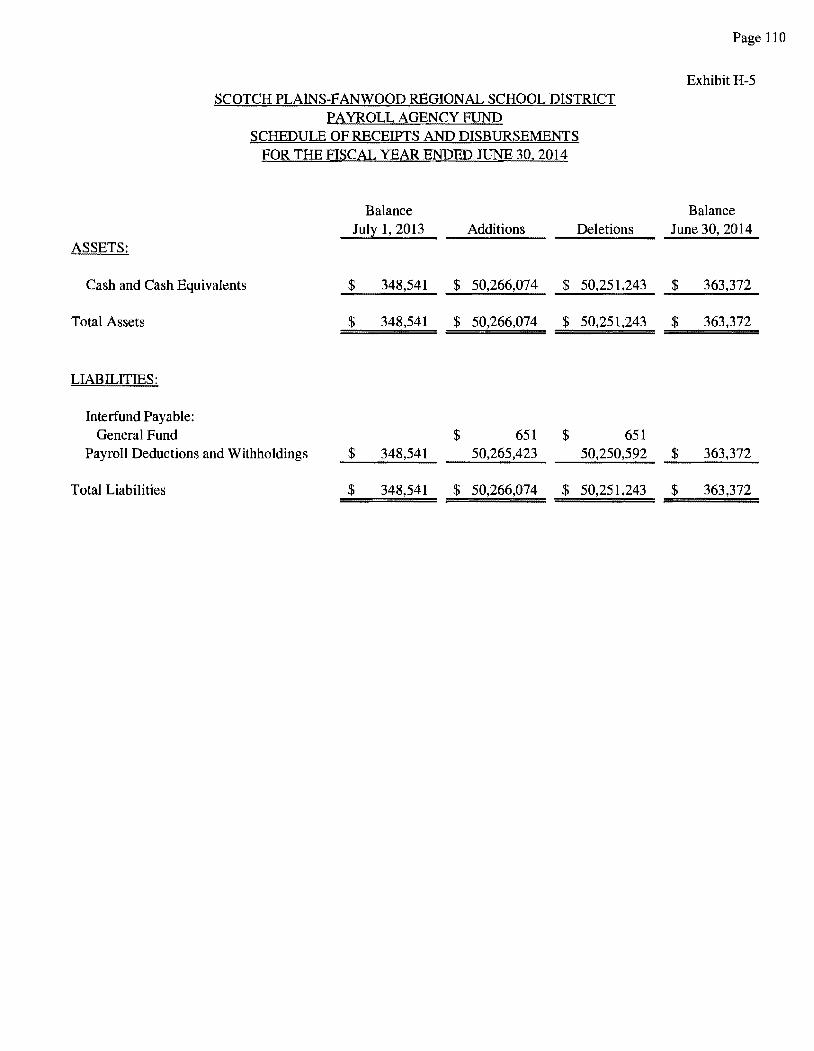
ASSETS:
SCOTCH PLAINS-FANWOOD REGIONAL SCHOOL DISTRICT PAYROLL AGENCY FUND
SCHEDULE OF RECEIPTS AND DISBURSEMENTS FOR THE FISCAL YEAR ENDED JUNE 30, 2014
Balance Jul~ 1, 2013 Additions Deletions
Cash and Cash Equivalents $ 348,541 $ 50,266,074 $ 50,251,243
Total Assets $ 348,541 $ 50,266,074 $ 50,251,243
LIABILITIES:
Interfund Payable: General Fund $ 651 $ 651
Payroll Deductions and Withholdings $ 348,541 50,265,423 50,250,592
Total Liabilities $ 348,541 $ 50,266,074 $ 50,251,243
Page 110
Exhibit H-5
Balance June 30, 2014
$ 363,372
$ 363,372
$ 363,372
$ 363,372
Page 111
LONG-TERM DEBT
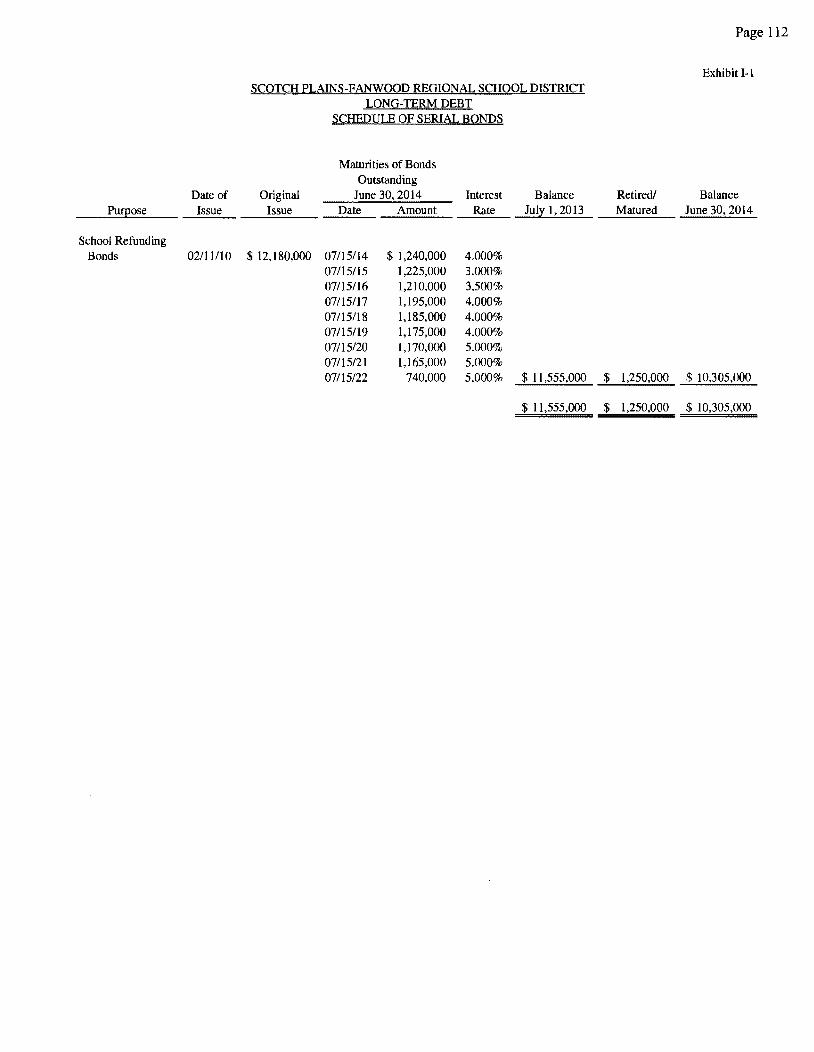
Date of Purpose Issue
School Refunding Bonds 02/11/10
SCOTCH PLAINS-FANWOOD REGIONAL SCHOOL DISTRICT LONG-TERM DEBT
SCHEDULE OF SERIAL BONDS
Maturities of Bonds Outstanding
Original June 30, 2014 Interest Balance Issue Date Amount Rate July 1, 2013
$ 12,180,000 07/15/14 $ 1,240,000 4.000% 07/15/15 1,225,000 3.000% 07/15/16 1,210,000 3.500% 07/15/17 1,195,000 4.000% 07/15/18 l,185,000 4.000% 07115/19 1,175,000 4.000% 07115/20 1,170,000 5.000% 07/15/21 1,165,000 5.000% 07/15/22 740,000 5.000% $ 11,555,000
$ 11,555,000
Page 112
Exhibit I-1
Retired/ Balance Matured June 30, 2014
$ 1,250,000 $ 10,305,000
$ 1,250,000 $ 10,305,000
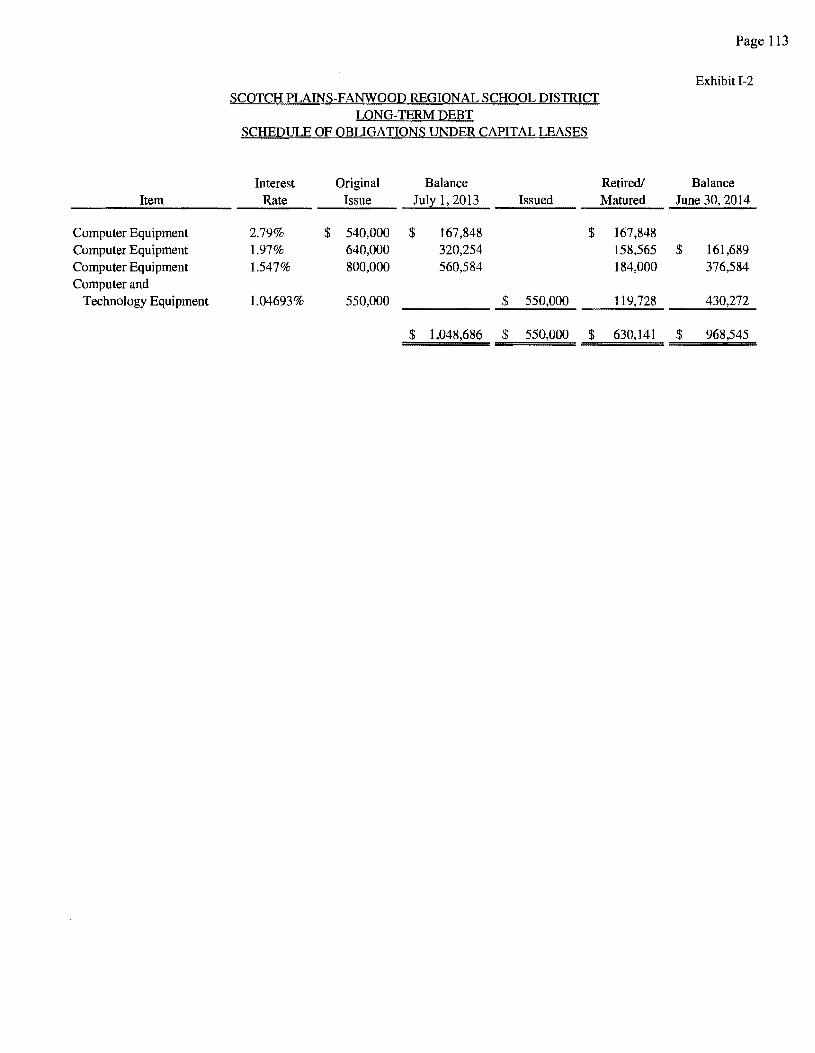
Item
Computer Equipment Computer Equipment Computer Equipment Computer and
Technology Equipment
SCOTCH PLAINS-FANWOOD REGIONAL SCHOOL DISTRICT LONG-TERM DEBT
SCHEDULE OF OBLIGATIONS UNDER CAPITAL LEASES
Interest Original Balance Rate Issue July l, 2013 Issued
2.79% $ 540,000 $ 167,848 $ l.97% 640,000 320,254 l.547% 800,000 560,584
l.04693% 550,000 $ 550,000
$ 1,048,686 $ 550,000 $
Page 113
Exhibit I-2
Retired/ Balance Matured June 30, 2014
167,848 158,565 $ 161,689 184,000 376,584
119,728 430,272
630,141 $ 968,545
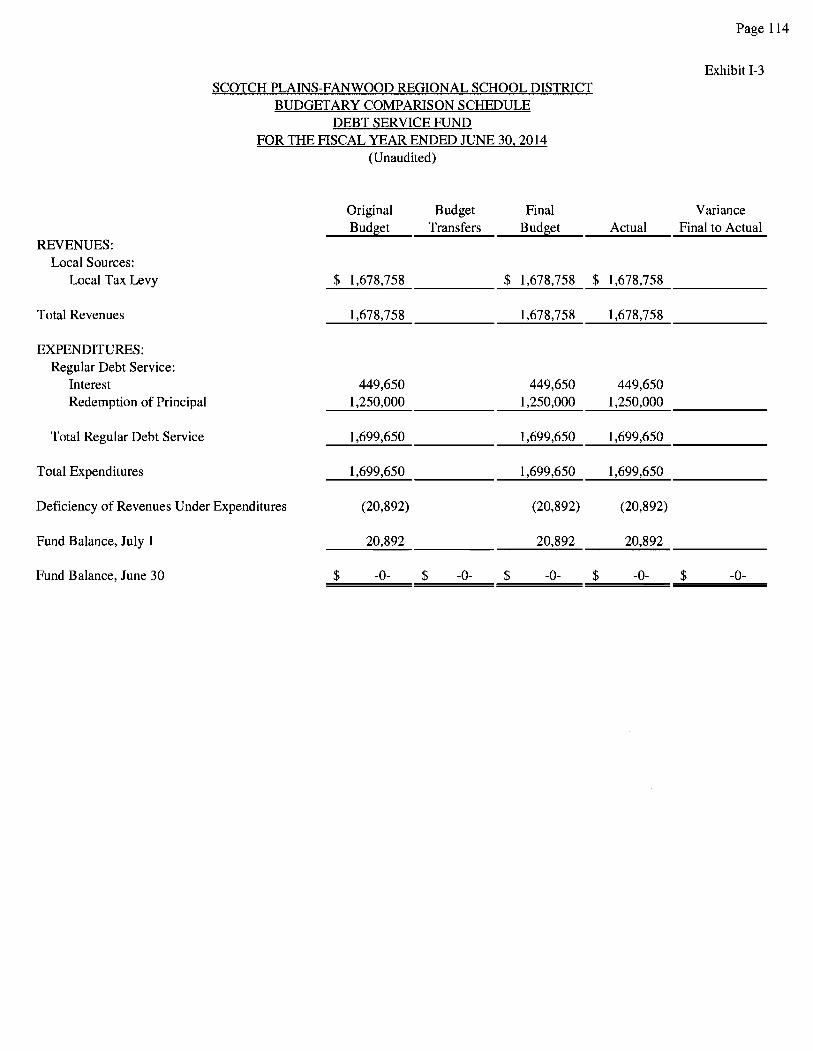
Page 114
Exhibit I-3 SCOTCH PLAINS-FANWOOD REGIONAL SCHOOL DISTRICT
BUDGETARY COMPARISON SCHEDULE DEBT SERVICE FUND
FOR THE FISCAL YEAR ENDED JUNE 30, 2014 (Unaudited)
Original Budget Final Variance Bud~et Transfers Bud~et Actual Final to Actual
REVENUES: Local Sources:
Local Tax Levy $ 1,678,758 $ 1,678,758 $ 1,678,758
Total Revenues 1,678,758 1,678,758 1,678,758
EXPENDITURES: Regular Debt Service:
Interest 449,650 449,650 449,650 Redemption of Principal 1,250,000 1,250,000 1,250,000
Total Regular Debt Service 1,699,650 1,699,650 1,699,650
Total Expenditures 1,699,650 1,699,650 1,699,650
Deficiency of Revenues Under Expenditures (20,892) (20,892) (20,892)
Fund Balance, July 1 20,892 20,892 20,892
Fund Balance, June 30 $ -0- $ -0- $ -0- $ -0- $ -0-
STATISTICAL SECTION (UNAUDITED)
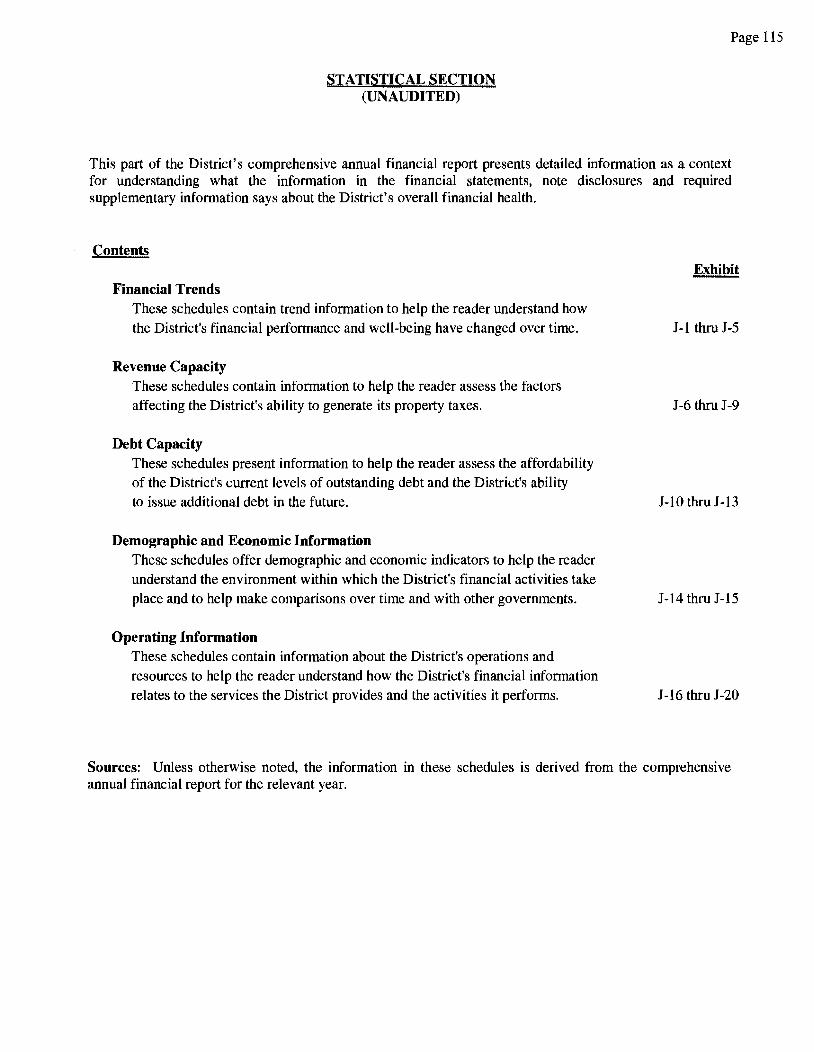
STATISTICAL SECTION (UNAUDITED)
Page 115
This part of the District's comprehensive annual financial report presents detailed information as a context for understanding what the information in the financial statements, note disclosures and required supplementary information says about the District's overall financial health.
Contents
Financial Trends These schedules contain trend information to help the reader understand how the District's financial performance and well-being have changed over time.
Revenue Capacity These schedules contain information to help the reader assess the factors affecting the District's ability to generate its property taxes.
Debt Capacity These schedules present information to help the reader assess the affordability of the District's current levels of outstanding debt and the District's ability to issue additional debt in the future.
Demographic and Economic Information These schedules offer demographic and economic indicators to help the reader understand the environment within which the District's financial activities take place and to help make comparisons over time and with other governments.
Operating Information These schedules contain information about the District's operations and resources to help the reader understand how the District's financial information relates to the services the District provides and the activities it performs.
Exhibit
J-1 thruJ-5
J-6 thru J-9
J-10 thru J-13
J-14 thru J-15
J-16 thru J-20
Sources: Unless otherwise noted, the information in these schedules is derived from the comprehensive annual financial report for the relevant year.
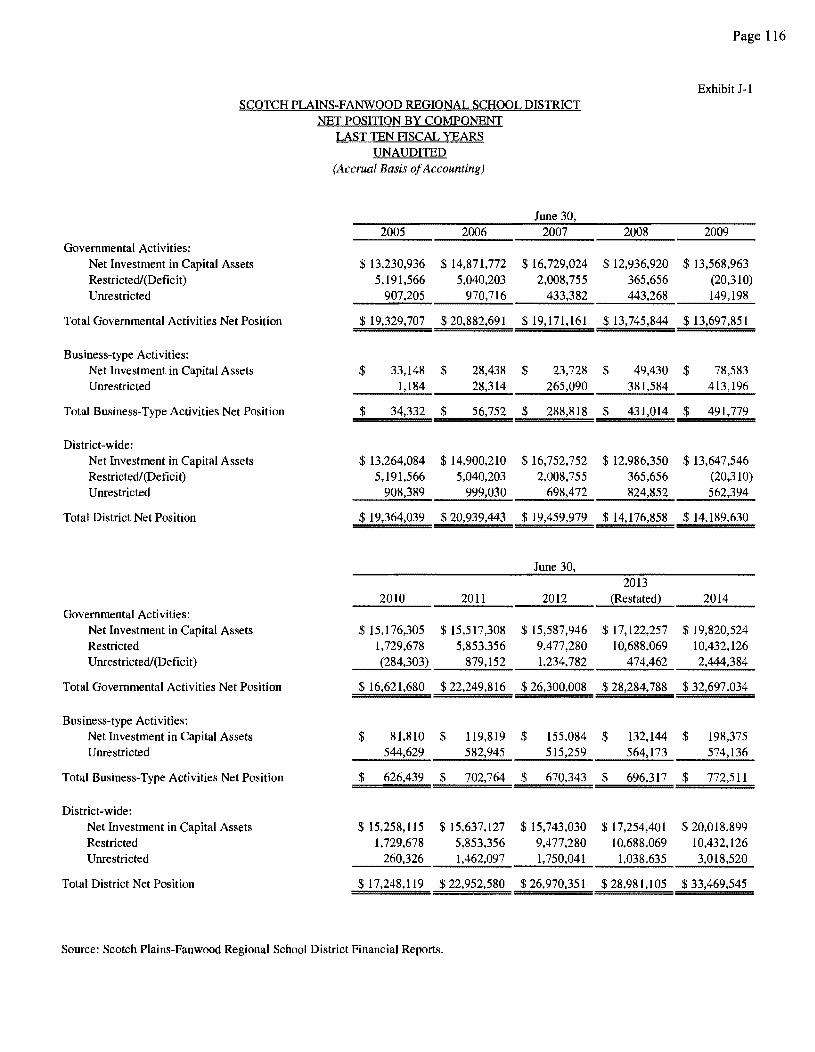
SCOTCH PLAINS-FANWOOD REGIONAL SCHOOL DISTRICT NET POSITION BY COMPONENT
Governmental Activities: Net Investment in Capital Assets Restricted/(Deficit) Unrestricted
Total Governmental Activities Net Position
Business-type Activities: Net Investment in Capital Assets Unrestricted
Total Business-Type Activities Net Position
District-wide: Net Investment in Capital Assets Restricted/(Deficit) Unrestricted
Total District Net Position
Governmental Activities: Net Investment in Capital Assets Restricted Unrestrictedl(Deficit)
Total Governmental Activities Net Position
Business-type Activities: Net Investment in Capital Assets Unrestricted
Total Business-Type Activities Net Position
District-wide: Net Investment in Capital Assets Restricted Unrestricted
Total District Net Position
LAST TEN FISCAL YEARS UNAUDITED
(Accrual Basis of Accounting)
2005 2006
$ 13,230,936 $ 14,871,772 5,191,566 5,040,203
907,205 970,716
$ 19,329,707 $ 20,882,691
$ 33,148 $ 28,438 l,184 28,314
$ 34,332 $ 56,752
$ 13,264,084 $ 14,900,210 5,191,566 5,040,203
908,389 999,030
$ 19,364,039 $ 20,939,443
2010 2011
$ 15,176,305 $ 15,517,308 1,729,678 5,853,356 (284,303) 879,152
$ 16,621,680 $ 22,249,816
$ 81,810 $ 119,819 544,629 582,945
$ 626,439 $ 702,764
$ 15,258, 115 $ 15,637,127 1,729,678 5,853,356
260,326 1,462,097
$ 17,248,119 $ 22,952,580
Source: Scotch Plains-Fanwood Regional School District Financial Reports.
June 30, 2007
$ 16,729,024 2,008,755
433,382
$ 19,171,161
$ 23,728 265,090
$ 288,818
$ 16,752,752 2,008,755
698,472
$ 19,459,979
June 30,
2012
$ 15,587,946 9,477,280 1,234,782
$ 26,300,008
$ 155,084 515,259
$ 670,343
$ 15,743,030 9,477,280 1,750,041
$ 26,970,351
Page 116
Exhibit J-1
2008 2009
$ 12,936,920 $ 13,568,963 365,656 (20,310) 443,268 149,198
$ 13,745,844 $ 13,697 ,851
$ 49,430 $ 78,583 381,584 413,196
$ 431,014 $ 491,779
$ 12,986,350 $ 13,647,546 365,656 (20,310) 824,852 562,394
$ 14,176,858 $ 14,189,630
2013 (Restated) 2014
$ 17, 122,257 $ 19,820,524 10,688,069 10,432,126
474,462 2,444,384
$ 28,284, 788 $ 32,697,034
$ 132,144 $ 198,375 564,173 574,136
$ 696,317 $ 772,511
$ 17,254,401 $ 20,018,899 10,688,069 10,432,126
1,038,635 3,018,520
$ 28,981,105 $ 33,469,545
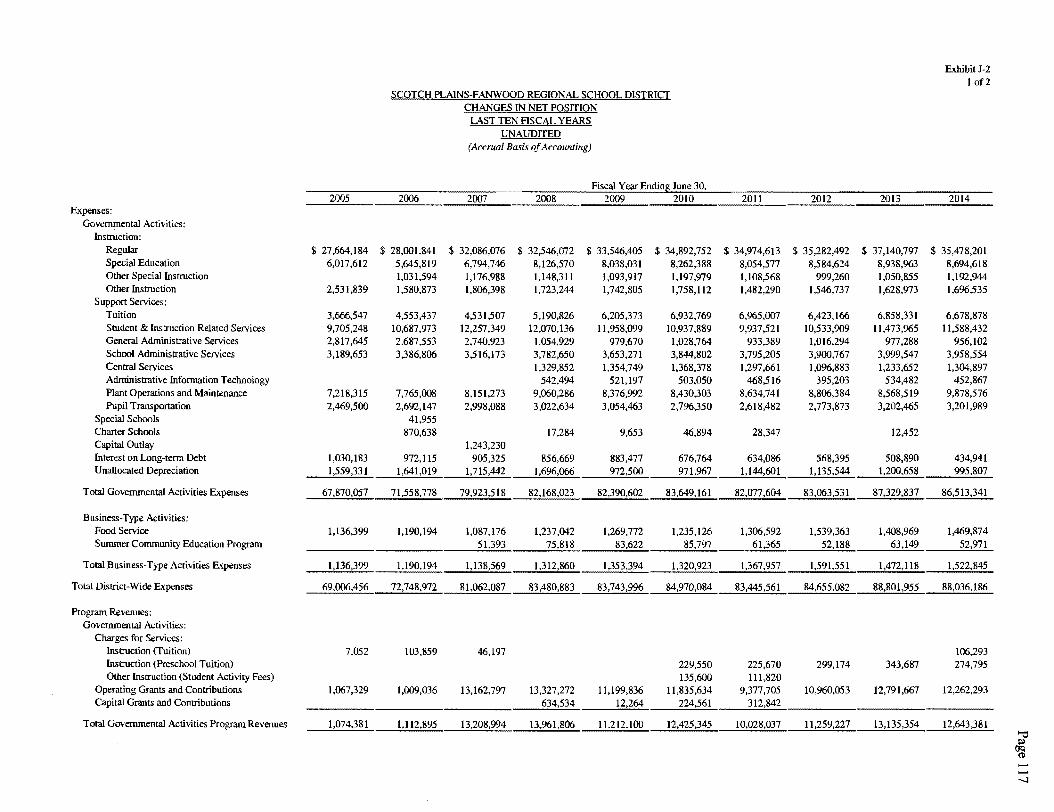
ExhibitJ-2 1 of2
S!:;OTCH PLAINS-FANWOOD REGIONAL SCHOOL DISTRICT CHANGES IN NET POSITION
LAST TEN FISCAL YEARS UNAUDITED
(Ace rual Basis of Accounting)
Fiscal Year Endinli! June 30, 2005 2006 2007 2008 2009 2010 2011 2012 2013 2014
Expenses: Governmental Activities:
Instruction: Regular $ 27,664,184 $ 28,001,841 $ 32,086,076 $ 32,546,072 $ 33,546,405 $ 34,892,752 $ 34,974,613 $ 35,282,492 $ 37,140,797 $ 35,478,201 Special Education 6,017,612 5,645,819 6,794,746 8,126,570 8,038,031 8,262,388 8,054,577 8,584,624 8,938,963 8,694,618 Other Special Ins traction 1,031,594 l,176,988 1,148,311 1,093,917 1,197,979 1,108,568 999,260 1,050,855 1,192,944 Other Instruction 2,531,839 1,580,873 1,806,398 1,723,244 l,742,805 1,758,112 1,482,290 1,546,737 1,628,973 l,696,535
Support Services: Tuition 3,666,547 4,553,437 4,531,507 5,190,826 6,205,373 6,932,769 6,965,007 6,423,166 6,858,331 6,678,878 Student & Instruction Related Services 9,705,248 10,687,973 12,257,349 12,070,136 11,958,099 10,937,889 9,937,521 10,533,909 11,473,965 11,588,432 General Administrative Services 2,817,645 2,687,553 2,740,923 1,054,929 979,670 1,028,764 933,389 1,016,294 977,288 956,102 School Administrative Services 3,189,653 3,386,806 3,516,173 3,782,650 3,653,271 3,844,802 3,795,205 3,900,767 3,999,547 3,958,554 Central Services 1,329,852 1,354,749 l,368,378 l,297,661 1,096,883 1,233,652 l,304,897 Administrative Information Technology 542,494 521,197 503,050 468,516 395,203 534,482 452,867 Plant Operations and Maintenance 7,218,315 7,765,008 8,151,273 9,060,286 8,376,992 8,430,303 8,634,741 8,806,384 8,568,519 9,878,576 Pupil Transportation 2,469,500 2,692,147 2,998,088 3,022,634 3,054,463 2,796,350 2,618,482 2,773,873 3,202,465 3,201,989
Special Schools 41,955 Charter Schools 870,638 17,284 9,653 46,894 28,347 12,452 Capital Outlay 1,243,230 Interest on Long-term Debt 1,030,183 972,ll5 905,325 856,669 883,477 676,764 634,086 568,395 508,890 434,941 Unallocated Depreciation 1,559,331 1,641,019 l,715,442 l,696,066 972,500 971,967 1,144,601 1,135,544 1,200,658 995,807
Total Governmental Activities Expenses 67,870,057 71,558,778 79,923,518 82,168,023 82,390,602 83,649,161 82,077,604 83,063,531 87,329,837 86,513,341
Business-Type Activities: Food Service 1,136,399 l,190,194 l,087,176 1,237,042 1,269,772 1,235,126 1,306,592 1,539,363 1,408,969 l,469,874 Summer Community Education Program 51,393 75,818 83,622 85,797 61,365 52,188 63,149 52,971
Total Business-Type Activities Expenses l,136,399 l,190,194 1,138,569 1,312,860 1,353,394 1,320,923 1,367,957 1,591,551 1,472,118 1,522,845
Total District-Wide Expenses 69,006,456 72,748,972 81,062,087 83,480,883 83,743,996 84,970,084 83,445,561 84,655,082 88,801,955 88,036,186
Program Revenues: Governmental Activities:
Charges for Services: Instruction (Tuition) 7,052 103,859 46,197 106,293 Instruction (Preschool Tuition) 229,550 225,670 299,174 343,687 274,795 Other Instruction (Student Activity Fees) 135,600 111,820
Operating Grants and Contributions 1,067,329 1,009,036 13,162,797 13,327,272 11,199,836 l l,835,634 9,377,705 10,960,053 12,791,667 12,262,293 Capital Grants and Contributions 634,534 12,264 224,561 312,842
Total Governmental Activities Program Revenues 1,074,381 1,112,895 13,208,994 13,961,806 11,212,100 12,425,345 10,028,037 11,259,227 13,135,354 12,643,381 "'d p:.
(Jq cu ---i
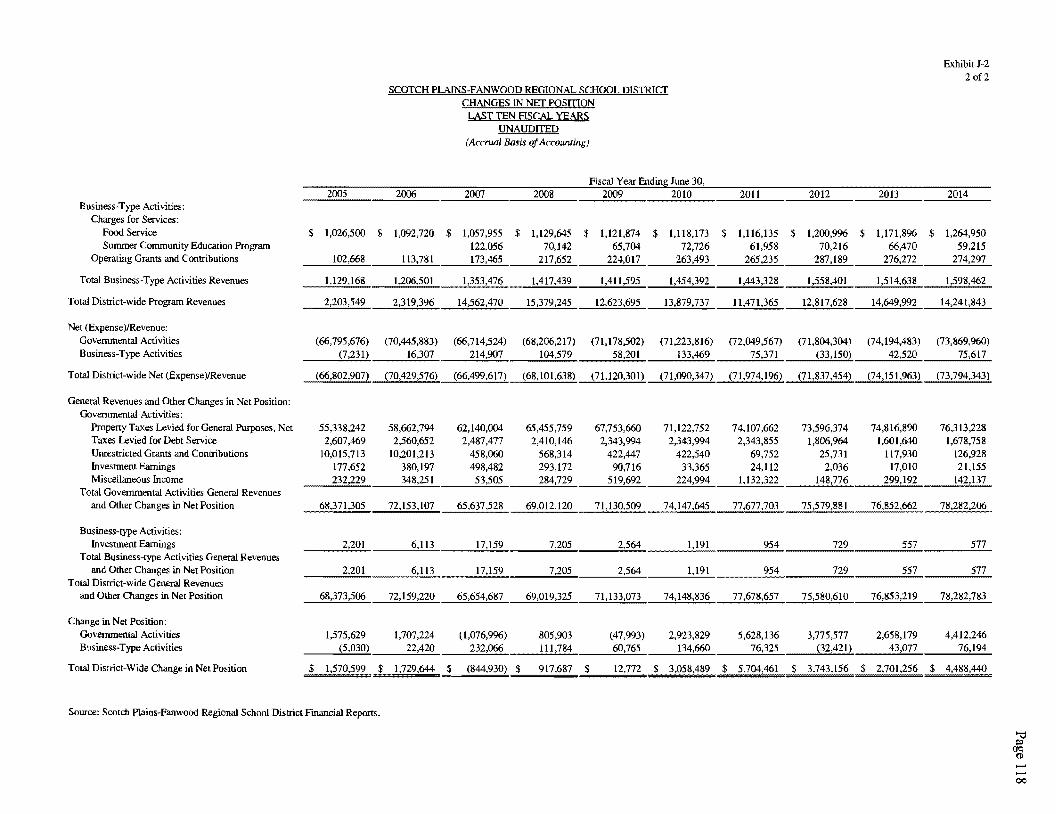
Exhibit J-2 2 of2
SCOTCH PLAINS-FANWOOD REGIONAL SCHOOL DISTRICT CHANGES IN NET POSITION
LAST TEN FISCAL YEARS UNAUDITED
(Accrual Basis of Accounting)
Fiscal Year EndinJ;; June 30, 2005 2006 2007 2008 2009 2010 2011 2012 2013 2014
Business-Type Activities: Charges for Services:
Food Service $ 1,026,500 $ 1,092,720 $ l,057,955 $ 1,129,645 $ l,121,874 $ 1,118,173 $ 1,116,135 $ 1,200,996 $ 1,171,896 $ 1,264,950 Summer Community Education Program 122,056 70,142 65,704 72,726 61,958 70,216 66,470 59,215
Operating Grants and Contributions 102,668 113,781 173,465 217,652 224,017 263,493 265,235 287,189 276,272 274,297
Total Business-Type Activities Revenues l,129,168 1,206,501 1,353,476 1,417,439 1,411,595 1,454,392 1,443,328 1,558,401 1,514,638 1,598,462
Total District-wide Program Revenues 2,203,549 2,319,396 14,562,470 15,379,245 12,623,695 13,879,737 11,471,365 12,817,628 14,649,992 14,241,843
Net (Expense)/Revenue: Governmental Activities (66,795,676) (70,445,883) (66,714,524) (68,206,217) (71,178,502) (71,223,816) (72,049,567) (71,804,304) (74,194,483) (73,869,960) Business-Type Activities (7,231) 16,307 214,907 104,579 58,201 133,469 75,371 (33,150) 42,520 75,617
Total District-wide Net (Expense)/Revenue (66,802,907) (70,429,576) (66,499,617) (68,101,638) (71,120,301) (71,090,347) (71,974,196) (71,837,454) (74,151,963) (73,794,343)
General Revenues and Other Changes in Net Position: Governmental Activities:
Property Taxes Levied for General Purposes, Net 55,338,242 58,662,794 62,140,004 65,455,159 67,753,660 71,122,752 74,107,662 73,596,374 74,816,890 76,313,228 Taxes Levied for Debt Service 2,607,469 2,560,652 2,487,477 2,410,l<Ui 2,343,994 2,343,994 2,343,855 1,806,964 1,601,640 1,678,758 Unrestricted Grants and Contributions 10,015,713 10,201,213 458,060 568,314 422,447 422,540 69,752 25,731 117,930 126,928 Investment Earnings 177,652 380,197 498,482 293,172 90,716 33,365 24,112 2,036 17,010 21,155 Miscellaneous Income 232,229 348,251 53,505 284,729 519,692 224,994 1,132,322 148,776 299,192 142,137
Total Governmental Activities General Revenues and Other Changes in Net Position 68,371,305 72,153,107 65,637,528 69,012,120 71,130,509 74,147,645 77,677,703 75,579,881 76,852,662 78,282,206
Business-type Activities: Investment Earnings 2,201 6,113 17,159 7,205 2,564 1,191 954 729 557 577
Total Business-type Activities General Revenues and Other Changes in Net Position 2,201 6,113 17,159 7,205 2,564 1,191 954 729 557 577
Total District-wide General Revenues and Other Changes in Net Position 68,373,506 72,159,220 65,654,687 69,019,325 71,133,073 74,148,836 77,678,657 75,580,610 76,853,219 78,282,783
Change in Net Position: Governmental Activities 1,575,629 1,707,224 (1,076,996) 805,903 (47,993) 2,923,829 5,628,136 3,775,577 2,658,179 4,412,24<; Business-Type Activities (5.030) 22,420 232,066 111,784 60,765 134,660 76,325 (32,421) 43,077 76,194
Total District-Wide Change in Net Position $ 1,570,599 $ 1,729,644 $ (844,930) $ 917,687 $ 12,772 $ 3,058,489 $ 5,704,<Uil $ 3,743,156 $ 2,701,256 $ 4,488,440
Source: Scotch Plains-Fanwood Regional School District Financial Reports.
"'O l':>l
(Jq (I>
-00
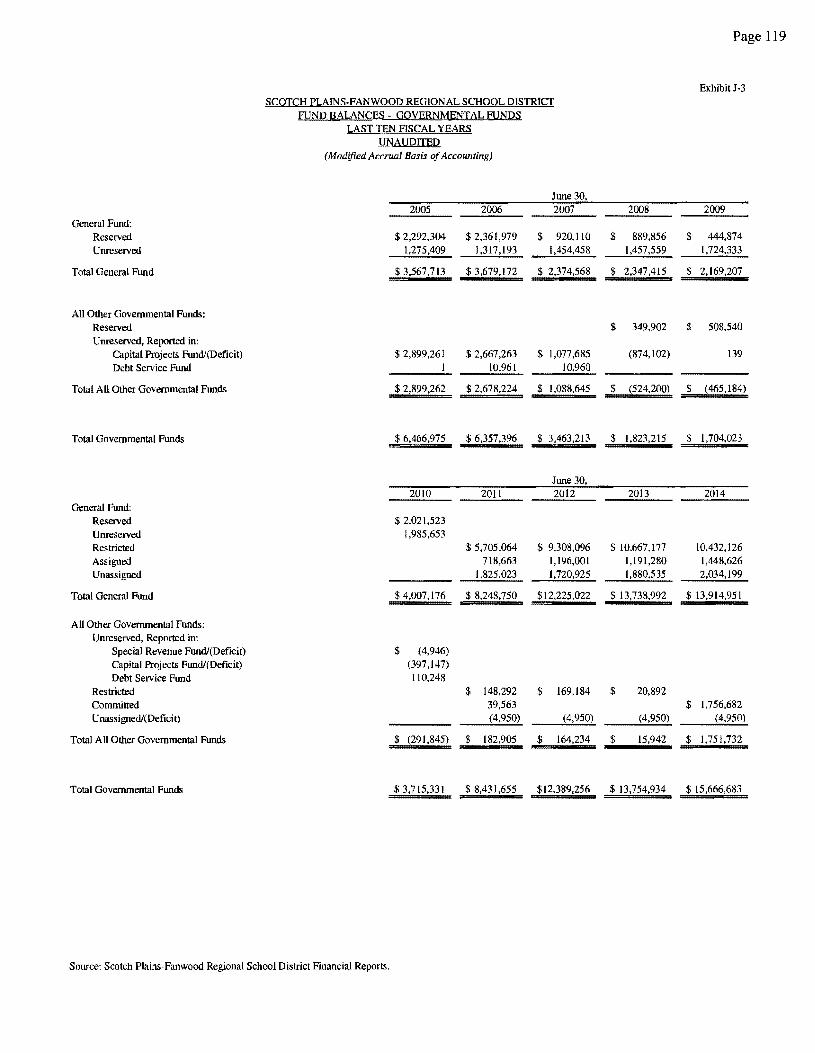
General Fund: Reserved Unreserved
Total General Fund
All Other Governmental Funds: Reserved Unreserved, Reported in:
Capital Projects Fund/(Deficit) Debt Service Fund
Total All Other Governmental Funds
Total Governmental Funds
General Fund: Reserved Unreserved Restricted Assigned Unassigned
Total General Fund
All Other Governmental Funds: Unreserved, Reported in:
Special Revenue Fund/(Deficit) Capital Projects Fund/(Deficit) Debt Service Fund
Restricted Committed Unassigned/(Deficit)
Total All Other Governmental Funds
Total Governmental Funds
SCOTCH PLAINS-FANWOOD REGIONAL SCHOOL DISTRICT FUND BALANCES - GOVERNMENTAL FUNDS
LAST TEN FISCAL YEARS UNAUDITED
(Modified Accrual Basis of Accounting)
June 30, 2005 2006 2007
$ 2,292,304 $ 2,361,979 $ 920,110 1,275,409 1,317,193 1,454,458
$ 3,567,713 $ 3,679,172 $ 2,374,568
$ 2,899,261 $ 2,667,263 $ 1,077,685 I 10,961 10,960
$ 2,899,262 $ 2,678,224 $ 1,088,645
$ 6,466,975 $ 6,357,396 $ 3,463,213
June 30, 2010 2011 2012
$ 2,021,523 1,985,653
$ 5,705,064 $ 9,308,096 718,663 1,196,001
1,825,023 l,720,925
$ 4,007,176 $ 8,248,750 $12,225,022
$ (4,946) (397,147) 110,248
$ 148,292 $ 169,184 39,563 (4,950) (4,950)
$ (291,845) $ 182,905 $ 164,234
$ 3,715,331 $ 8,431,655 $12,389,256
Source: Scotch Plains-Fanwood Regional School District Financial Reports.
Page 119
ExhibitJ-3
2008 2009
$ 889,856 $ 444,874 1,457,559 1,724,333
$ 2,347,415 $ 2,169,207
$ 349,902 $ 508,540
(874,102) 139
$ (524,200) $ (465,184)
$ 1,823,215 $ 1,704,023
2013 2014
$ 10,667,177 10,432,126 1,191,280 1,448,626 1,880,535 2,034,199
$ 13,738,992 $ 13,914,951
$ 20,892 $ 1,756,682
(4,950) (4,950)
$ 15,942 $ 1,751,732
$ 13,754,934 $ 15,666,683
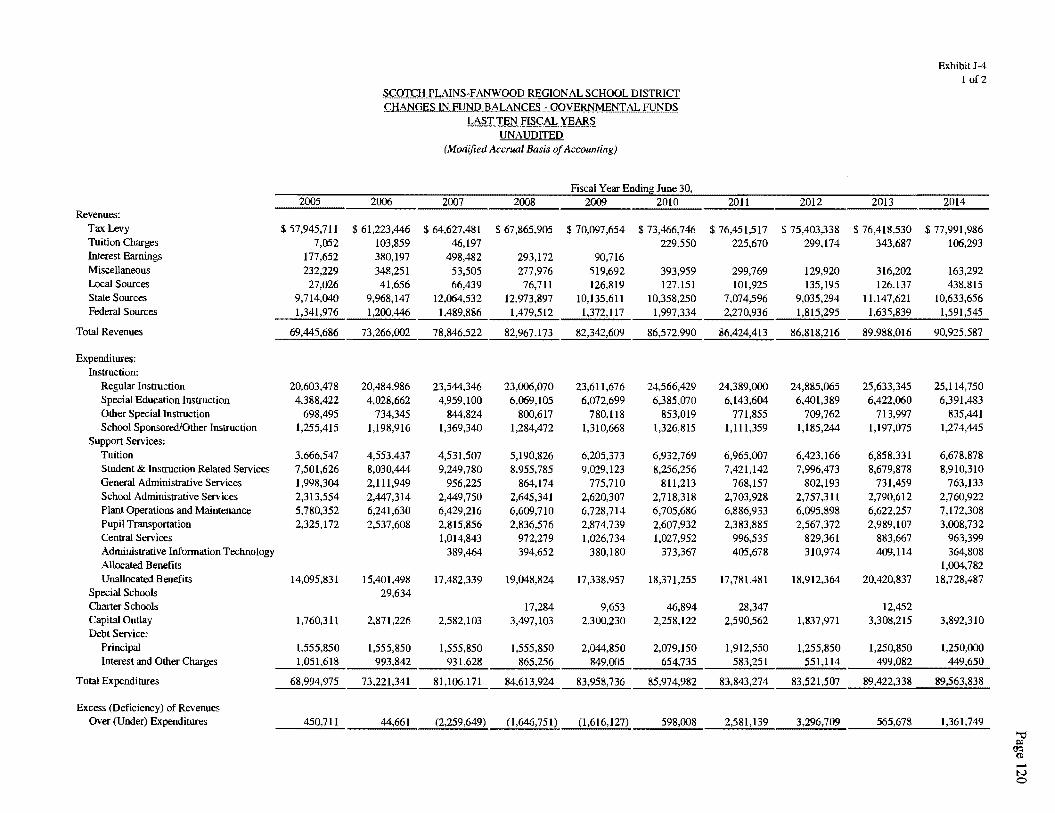
ExhibitJ-4 1of2
SCOTCH PLAINS-FANWOOD REGIONAL SCHOOL DISTRICT CHANGES IN FUND BALANCES - GOVERNMENT AL FUNDS
LAST TEN FISCAL YEARS UNAUDITED
(Modified Accrual Basis of Accounting)
Fiscal Year Endin~ June 30, 2005 2006 2007 2008 2009 2010 2011 2012 2013 2014
Revenues: Tax Levy $ 57,945,711 $ 61,223,446 $ 64,627,481 $ 67,865,905 $ 70,097 ,654 $ 73,466,746 $ 76,451,517 $ 75,403,338 $ 76,418,530 $ 77,991,986 Tuition Charges 7,052 103,859 46,197 229,550 225,670 299,174 343,687 106,293 Interest Earnings 177,652 380,197 498,482 293,172 90,716 Miscellaneous 232,229 348,251 53,505 277,976 519,692 393,959 299,769 129,920 316,202 163,292 Local Sources 27,026 41,656 66,439 76,711 126,819 127,151 101,925 135,195 126,137 438,815 State Sources 9,714,040 9,968,147 12,064,532 12,973,897 10,135,611 10,358,250 7,074,596 9,035,294 11,147,621 10,633,656 Federal Sources 1,341,976 1,200,446 1,489,886 1,479,512 l,372,117 1,997,334 2,270,936 1,815,295 1,635,839 1,591,545
Total Revenues 69,445,686 73,266,002 78,846,522 82,967,173 82,342,609 86,572,990 86,424,413 86,818,216 89,988,016 90,925,587
Expenditures: Instruction:
Regular Instruction 20,603,478 20,484,986 23,544,346 23,006,070 23,611,676 24,566,429 24,389,000 24,885,065 25,633,345 25,114,750 Special Education Instruction 4,388,422 4,028,662 4,959,100 6,069,105 6,072,699 6,385,070 6,143,604 6,401,389 6,422,060 6,391,483 Other Special Instruction 698,495 734,345 844,824 800,617 780,118 853,019 771,855 709,762 713,997 835,441 School Sponsored/Other Instruction 1,255,415 1,198,916 1,369,340 1,284,472 1,310,668 1,326,815 1,111,359 1,185,244 1,197,075 1,274,445
Support Services: Tuition 3,666,547 4,553,437 4,531,507 5,190,826 6,205,373 6,932,769 6,965,007 6,423,166 6,858,331 6,678,878 Student & Instruction Related Services 7,501,626 8,030,444 9,249,780 8,955,785 9,029,123 8,256,256 7,421,142 7,996,473 8,679,878 8,910,310 General Administrative Services 1,998,304 2,111,949 956,225 864,174 775,710 811,213 768,157 802,193 731,459 763,133 School Administrative Services 2,313,554 2,447,314 2,449,750 2,645,341 2,620,307 2,718,318 2,703,928 2,757,311 2,790,612 2,760,922 Plant Operations and Maintenance 5,780,352 6,241,630 6,429,216 6,609,710 6,728,714 6,705,686 6,886,933 6,095,898 6,622,257 7,172,308 Pupil Transportation 2,325,172 2,537,608 2,815,856 2,836,576 2,874,739 2,607,932 2,383,885 2,567,372 2,989,107 3,008,732 Central Services 1,014,843 972,279 1,026,734 1,027,952 996,535 829,361 883,667 963,399 Administrative Infonnation Technology 389,464 394,652 380,180 373,367 405,678 310,974 409,114 364,808 Allocated Benefits 1,004,782 Unallocated Benefits 14,095,831 15,401,498 17,482,339 19,048,824 17,338,957 18,371,255 17,781,481 18,912,364 20,420,837 18,728,487
Special Schools 29,634 Charter Schools 17,284 9,653 46,894 28,347 12,452 Capital Outlay 1,760,311 2,871226 2,582,103 3,497,103 2,300,230 2,258,122 2,590,562 1,837,971 3,308,215 3,892,310 Debt Service:
Principal 1,555,850 1,555,850 1,555,850 1,555,850 2,044,850 2,079,150 1,912,550 1,255,850 l,250,850 1,250,000 Interest and Other Charges 1,051,618 993,842 931,628 865,256 849,005 654,735 583,251 551,114 499,082 449,650
Total Expenditures 68,994,975 73,221,341 81,106,171 84,613,924 83,958,736 85,974,982 83,843,274 83,521,507 89,422,338 89,563,838
Excess (Deficiency) of Revenues Over (Under) Expenditures 450,711 44,661 (2,259,649) (l,646,751) (l,616,127) 598,008 2,581,139 3,296,709 565,678 1,361,749
"' ~ -N 0
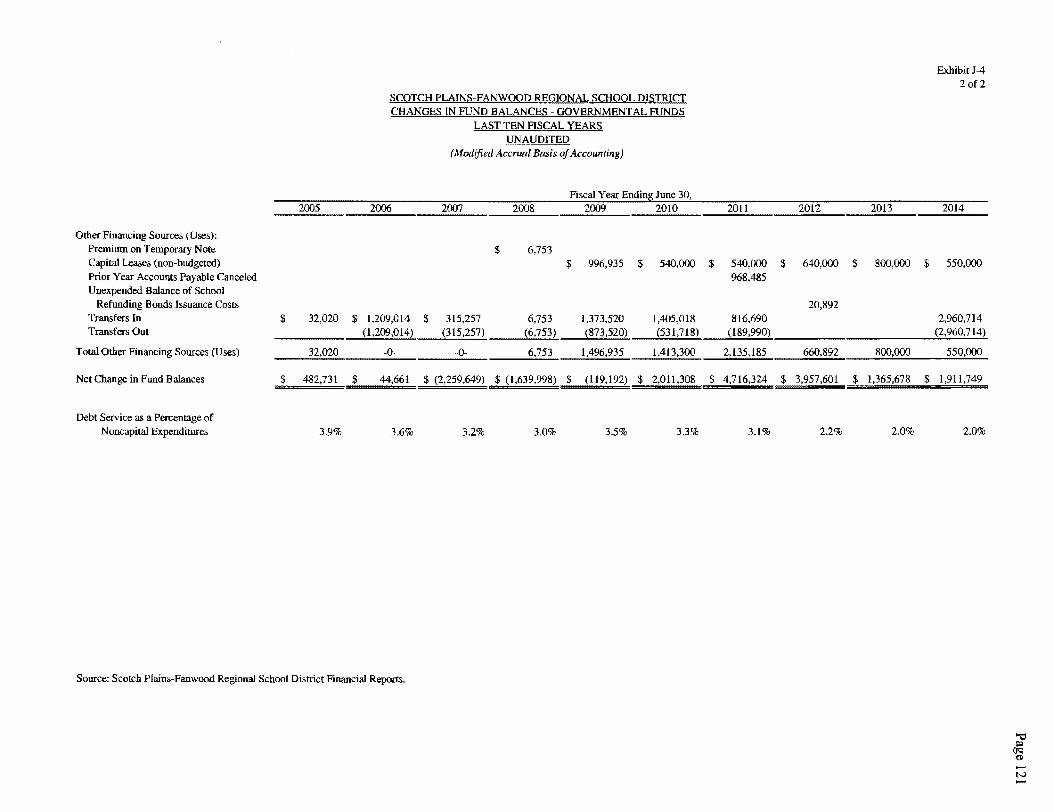
ExhibitJ-4 2of2
SCQTCH PLAINS-FANWOOD REGIONAL SCHOOL DISTRICT CHANGES IN FUND BALANCES GOVERNMENT AL FUNDS
LAST TEN FISCAL YEARS UNAUDITED
(Modified Accrual Basis of Accounting)
Fiscal Year Endini:1June30, 2005 2006 2007 2008 2009 2010 2011 2012 2013 2014
Other Financing Sources (Uses): Premium on Temporary Note $ 6,753 Capital Leases (non-budgeted) $ 996,935 $ 540,000 $ 540,000 $ 640,000 $ 800,000 $ 550,000 Prior Year Accounts Payable Canceled %8,485 Unexpended Balance of School
Refunding Bonds Issuance Costs 20,892 Transfers In $ 32,020 $ l,209,014 $ 315,257 6,753 1,373,520 1,405,018 816,690 2,%0,714 Transfers Out (l,209,014) (315,257) (6,753) (873,520) (531,718) (189,990) (2,960,714)
Total Other Financing Sources (Uses) 32,020 -0- -0- 6,753 1,496,935 1,413,300 2,135,185 660,892 800,000 550,000
Net Change in Fund Balances $ 482,731 $ 44,661 $ (2,259,649) $ (I,639,998) $ (119,192) $ 2,011,308 $ 4,716,324 $ 3,957,601 $ 1,365,678 $ 1,911,749
Debt Service as a Percentage of Noncapital Expenditures 3.9% 3.6% 3.2% 3.0% 3.5% 3.3% 3.1% 2.2% 2.0% 2.0%
Source: Scotch Plains-Fanwood Regional School District Financial Reports.
-N
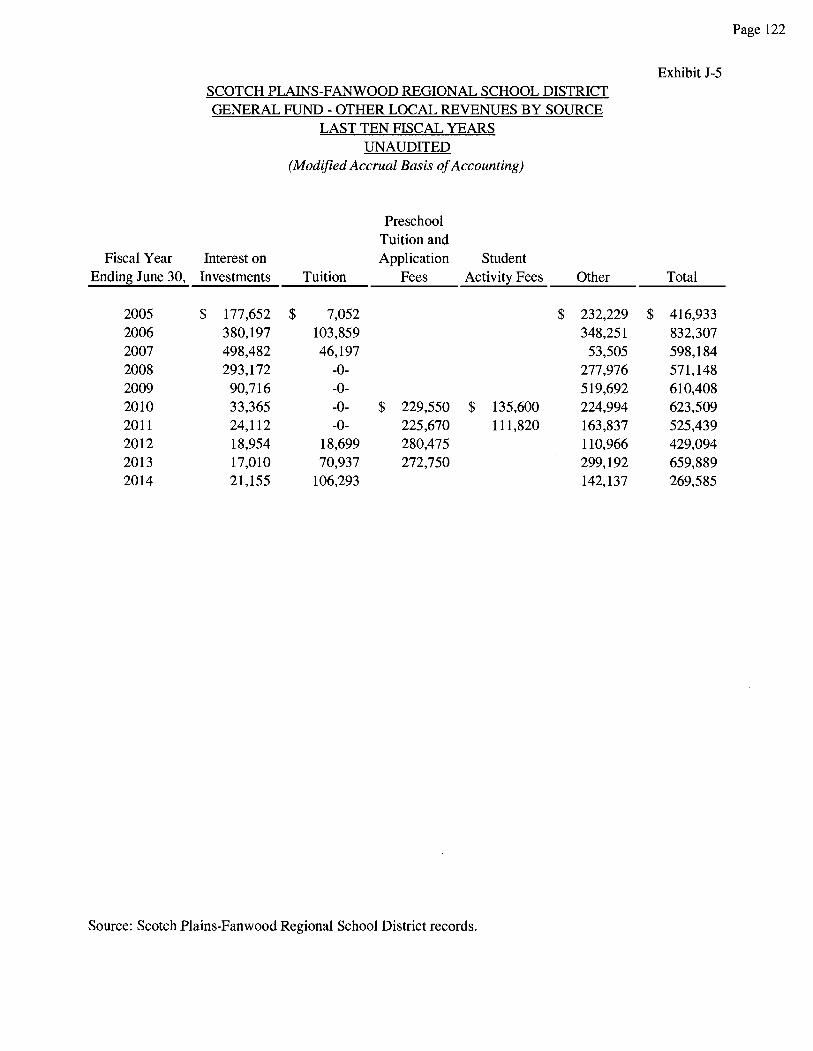
Fiscal Year Ending June 30,
2005 2006 2007 2008 2009 2010 2011 2012 2013 2014
SCOTCH PLAINS-FANWOOD REGIONAL SCHOOL DISTRICT GENERAL FUND - OTHER LOCAL REVENUES BY SOURCE
LAST TEN FISCAL YEARS UNAUDITED
(Modified Accrual Basis of Accounting)
Preschool Tuition and
Interest on Application Student Investments Tuition Fees Activity Fees Other
$ 177,652 $ 7,052 $ 232,229 380,197 103,859 348,251 498,482 46,197 53,505 293,172 -0- 277,976 90,716 -0- 519,692 33,365 -0- $ 229,550 $ 135,600 224,994 24,112 -0- 225,670 111,820 163,837 18,954 18,699 280,475 110,966 17,010 70,937 272,750 299,192 21,155 106,293 142,137
Source: Scotch Plains-Fanwood Regional School District records.
Page 122
Exhibit J-5
Total
$ 416,933 832,307 598,184 571,148 610,408 623,509 525,439 429,094 659,889 269,585
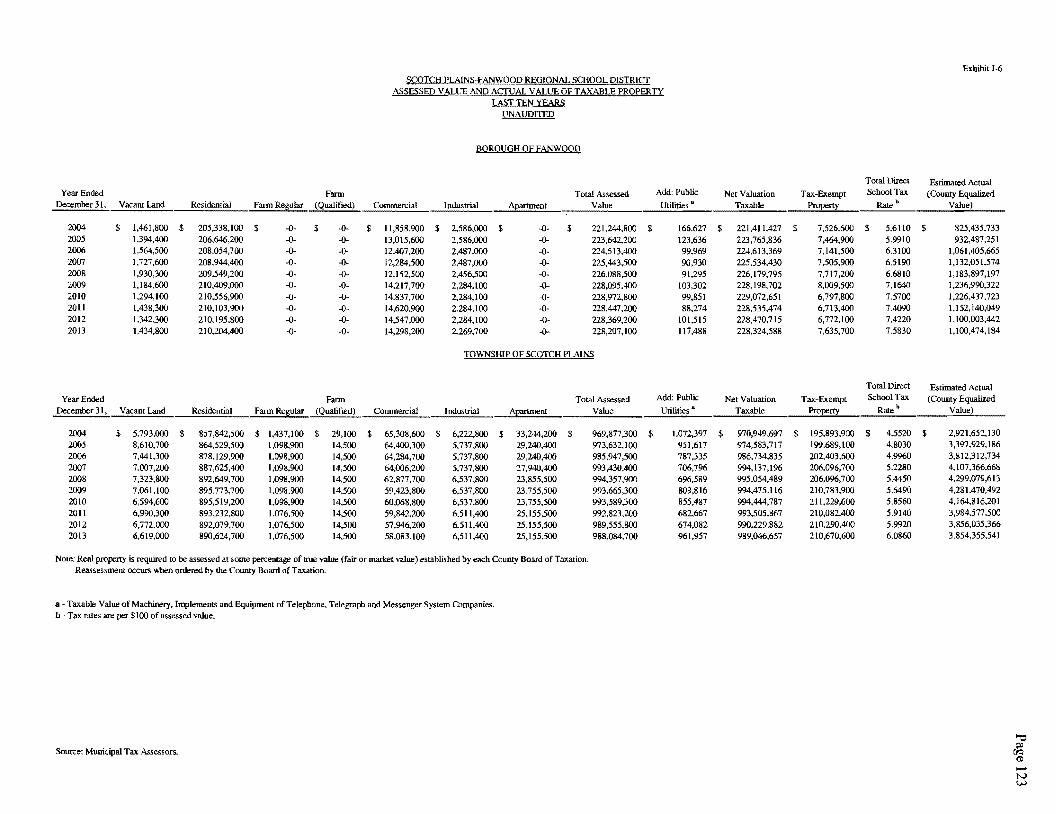
ExhibitJ-6 S!;QTCH PLAINS-FANWOOD REGIQNAL SCHOOL DISTRICT
ASSESSED VALUE AND ACTUAL VALUE QF TAXABLE PRQPERTY LAST TEN YEARS
UNAUDITED
BQROUGH OF FANWOOD
Total Direct Estimated Actual Year Ended Farm Total Assessed Add: Public Net Valuation Tax-Exempt School Tax (County Equalized
December 31. Vacant Land Residemial FarmRe!l!!lar (Qualified) Commercial Industrial AEartment Value Utilities a Taxable Property Rateb Value)
2004 $ 1,461,800 $ 205,338,100 $ -0- $ -0- $ 11,858,900 $ 2,586,000 $ -0- $ 221,244,800 $ 166,627 $ 221,411,427 $ 7,526,600 $ 5.6110 $ 825,435,733 2005 1,394,400 206,646,200 -0- -0- 13,015,600 2586,000 -0- 223,642,200 123,636 223,765,836 7,464,900 5.9910 932,487,251 2006 1,564,500 208,054,700 -0- -0- 12,407,200 2,487,000 -0- 224,513,400 99,969 224,613,369 7,141,500 6.3100 1,061,405,665 2007 1,727,600 208,944,400 -0- -0- 12,284,500 2,487,000 -0- 225,443,500 90,930 225,534,430 7,505,900 6.5190 1,132,051,574 2008 1,930,300 209,549,200 -0- -0- 12,152,500 2,456,500 -0- 226,088,500 91,295 226, l 79,795 7,717,200 6.6810 1,183,897,197 2009 1,184,600 210,409,000 -0- -0- 14,217,700 2,284,100 -0- 228,095,400 103,302 228,198,702 8,009,500 7.1640 1,236,990,322 2010 1,294,100 210,556,900 -0- -0- 14,837,700 2,284,100 -0- 228,972,800 99,851 229,072,651 6,797,800 7.5700 I,226,437.723 2011 1,438,300 210,103,900 -0- -0- 14,620,900 2,284,100 -0- 228,447,200 88,274 228,535,474 6,713,400 7.4090 l, 152, 140,049 2012 1,342,300 210.195,800 -0- -0- 14,547,000 2,284,100 -0- 228,369,200 101,515 228,470,715 6,772,100 7.4220 1,100,003,442 2013 l,434,800 210,204,400 ·O· -0- 14,298,200 2,269,700 -0· 228,207, I 00 117,488 228,324,588 7,635,700 7.5830 1,100,474,184
TOWNSHIP OF SCOTCH PLAINS
Total Direct Estimated Actual Year Ended Fann Total Assessed Add: Public Net Valuation Tax-Ex:empt School Tax (County Equalized
December 31, Vacant Land Residential Farm Regular (Qualified) Commercial Industrial ~artment Value Utilities• Taxable Property Rate• Value)
2004 $ 5,793,000 $ 857,842,500 $ 1,437,100 $ 29,100 $ 65,308,600 $ 6,222,800 $ 33,244,200 $ 969 ,877,300 $ 1,072,397 $ 970,949 ,697 $ 195,893 ,900 $ 4.5520 $ 2,921,652,130 2005 8,610,700 864,529,500 1,098,900 14,500 64,400,300 5,737,800 29,240,400 973,632,100 951,617 974,583,717 199,689,100 4.8030 3,397,929,186
2006 7,441,300 878, 129,900 1,098,900 14,500 64,284,700 5,737,800 29,240,400 985,947,500 787,335 986,734,835 202,403,600 4.9960 3,812,312,734
2007 7,007,200 887,625,400 1,098,900 14,500 64,006,200 5,737,800 27,940,400 993,430,400 706,796 994,137,196 206,096,700 5.2280 4,107,366,668 2008 7,323,800 892,649,700 1,098,900 14,500 62,877,700 6,537,800 23,855,500 994,357,900 696,589 995,054,489 206,096,700 5.4450 4,299,079,613 2009 7,061,100 895,773,700 1,098,900 14,500 59,423,800 6,537,800 23,755,500 993,665,300 809,816 994,475,116 210,783,900 5.6490 4,281,470,492 2010 6.594,600 895,519,200 1,098,900 14,500 60,068,800 6,537,800 23,755,500 993,589,300 855,487 994,444,787 211,229,600 5.8560 4,164,816,201 20ll 6,990,300 893,232,800 1,076,500 14,500 59,842,200 6,Sll,400 25,155,500 992,823,200 682,667 993,505,867 210,082,400 5.9140 3,984,577.500 2012 6,772,000 892,079,700 1,076,500 14,500 57,946,200 6,511,400 25,155,500 989,555,800 674,082 990,229,882 210,290,400 5.9920 3,856,035,366 2013 6,619,000 890,624, 700 1,076,500 14,500 58,083,100 6,511,400 25,155,500 988,084,700 961,957 989,046,657 210,670,600 6.0860 3,854,355,541
Note: Real property is required to be assessed at some percentage of true value (fair or market value) established by each County Board of Tax:ation. Reassessment occurs when ordered by the County Board of Taxation.
a · Taxable Value of Machinery, Implements and Equipment of Telephone, Telegraph and Messenger System Companies. b ·Tax rates are per $100 of assessed value.
Source: Municipal Tax: Assessors. -N w
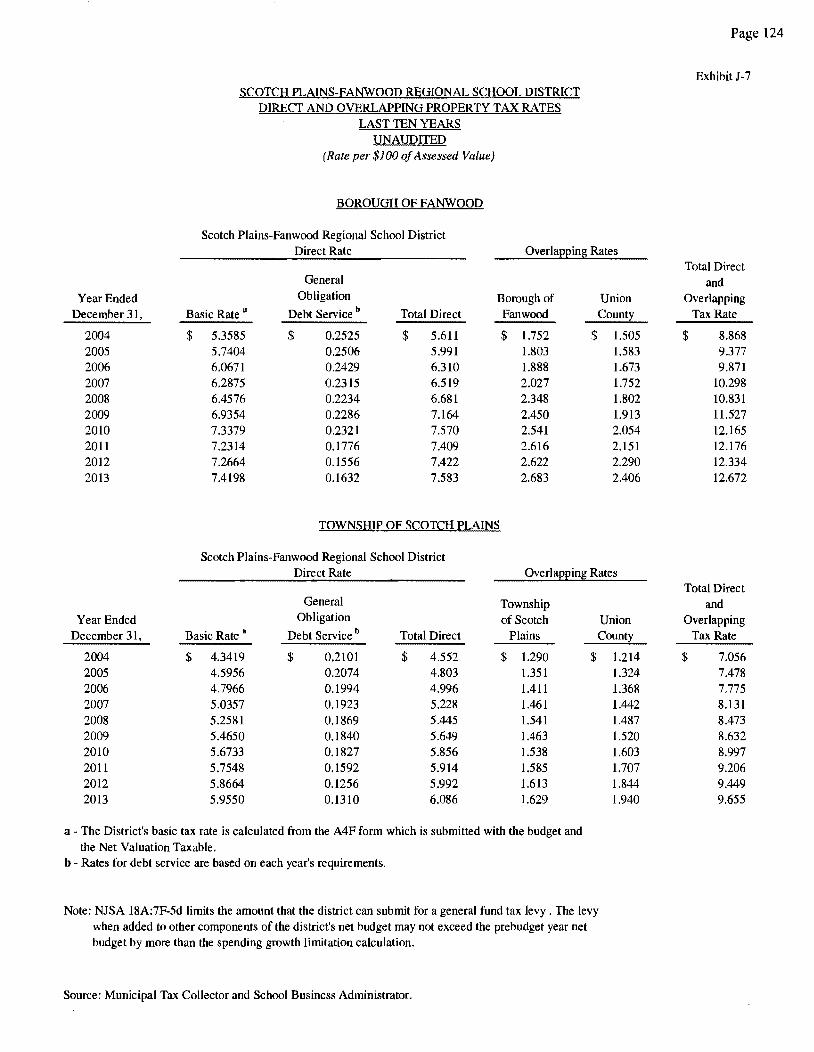
SCOTCH PLAINS-FANWOOD REGIONAL SCHOOL DISTRICT DIRECT AND OVERLAPPING PROPERTY TAX RATES
LAST TEN YEARS UNAUDITED
(Rate per $100 of Assessed Value)
BOROUGH OF FANWOOD
Scotch Plains-Fanwood Regional School District Direct Rate Overlapping Rates
General
Year Ended Obligation Borough of Union December 31, Basic Rate a Debt Service b Total Direct Fanwood County
2004 $ 5.3585 $ 0.2525 $ 5.611 $ l.752 $ 1.505 2005 5.7404 0.2506 5.991 1.803 1.583 2006 6.0671 0.2429 6.310 1.888 1.673 2007 6.2875 0.2315 6.519 2.027 1.752 2008 6.4576 0.2234 6.681 2.348 1.802 2009 6.9354 0.2286 7.164 2.450 1.913 2010 7.3379 0.2321 7.570 2.541 2.054 2011 7.2314 0.1776 7.409 2.616 2.151 2012 7.2664 0.1556 7.422 2.622 2.290 2013 7.4198 0.1632 7.583 2.683 2.406
TOWNSHIP OF SCOTCH PLAINS
Scotch Plains-Fanwood Regional School District Direct Rate Overlapping_ Rates
General Township Year Ended Obligation of Scotch Union
December 31, Basic Rate a Debt Service b Total Direct Plains County
2004 $ 4.3419 $ 0.2101 $ 4.552 $ 1.290 2005 4.5956 0.2074 4.803 1.351 2006 4.7966 0.1994 4.996 1.411 2007 5.0357 0.1923 5.228 1.461 2008 5.2581 0.1869 5.445 1.541 2009 5.4650 0.1840 5.649 1.463 2010 5.6733 0.1827 5.856 1.538 2011 5.7548 0.1592 5.914 1.585 2012 5.8664 0.1256 5.992 1.613 2013 5.9550 0.1310 6.086 1.629
a - The District's basic tax rate is calculated from the A4F form which is submitted with the budget and the Net Valuation Taxable.
b - Rates for debt service are based on each year's requirements.
$
Note: NJSA 18A:7F-5d limits the amount that the district can submit for a general fund tax levy. The levy when added to other components of the district's net budget may not exceed the prebudget year net budget by more than the spending growth limitation calculation.
Source: Municipal Tax Collector and School Business Administrator.
1.214 1.324 1.368 1.442 1.487 1.520 1.603 1.707 1.844 1.940
Page 124
Exhibit J-7
Total Direct and
Overlapping Tax Rate
$ 8.868 9.377 9.871
10.298 10.831 11.527 12.165 12.176 12.334 12.672
Total Direct and
Overlapping Tax Rate
$ 7.056 7.478 7.775 8.131 8.473 8.632 8.997 9.206 9.449 9.655
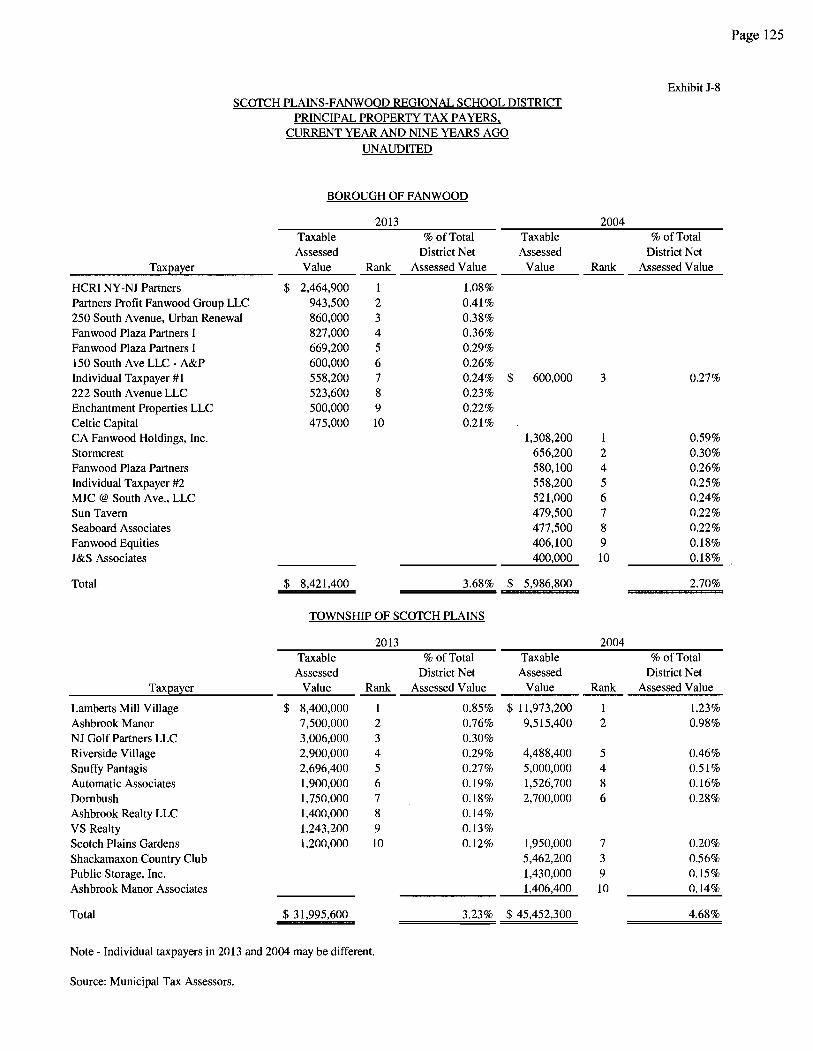
Page 125
Exhibit J-8 SCOTCH PLAINS-FANWOOD REGIONAL SCHOOL DISTRICT
PRINCIPAL PROPERTY TAXPAYERS, CURRENT YEAR AND NINE YEARS AGO
UNAUDITED
BOROUGH OF FANWOOD
2013 2004 Taxable % of Total Taxable % of Total Assessed District Net Assessed District Net
Tax2al'.er Value Rank Assessed Value Value Rank Assessed Value
HCRI NY-NJ Partners $ 2,464,900 1.08% Partners Profit Fanwood Group LLC 943,500 2 0.41% 250 South A venue, Urban Renewal 860,000 3 0.38% Fanwood Plaza Partners I 827,000 4 0.36% Fanwood Plaza Partners I 669,200 5 0.29% 150 South Ave LLC- A&P 600,000 6 0.26% Individual Taxpayer #1 558,200 7 0.24% $ 600,000 3 0.27% 222 South A venue LLC 523,600 8 0.23% Enchantment Properties LLC 500,000 9 0.22% Celtic Capital 475,000 10 0.21% CA Fanwood Holdings, Inc. 1,308,200 1 0.59% Stormcrest 656,200 2 0.30% Fanwood Plaza Partners 580,100 4 0.26% Individual Taxpayer #2 558,200 5 0.25% MIC@ South Ave., LLC 521,000 6 0.24% Sun Tavern 479,500 7 0.22% Seaboard Associates 477,500 8 0.22% Fanwood Equities 406,100 9 0.18% J&S Associates 400,000 10 0.18%
Total $ 8,421,400 3.68% $ 5,986,800 2.70%
TOWNSHIP OF SCOTCH PLAINS
2013 2004 Taxable % of Total Taxable % of Total Assessed District Net Assessed District Net
Tax2al'.er Value Rank Assessed Value Value Rank Assessed Value
Lamberts Mill Village $ 8,400,000 1 0.85% $ 11,973,200 1.23% Ashbrook Manor 7,500,000 2 0.76% 9,515,400 2 0.98% NJ Golf Partners LLC 3,006,000 3 0.30% Riverside Village 2,900,000 4 0.29% 4,488,400 5 0.46% Snuffy Pantagis 2,696,400 5 0.27% 5,000,000 4 0.51% Automatic Associates 1,900,000 6 0.19% 1,526,700 8 0.16% Dombush 1,750,000 7 0.18% 2,700,000 6 0.28% Ashbrook Realty LLC 1,400,000 8 0.14% VS Realty 1,243,200 9 0.13% Scotch Plains Gardens 1,200,000 10 0.12% 1,950,000 7 0.20% Shackamaxon Country Club 5,462,200 3 0.56% Public Storage, Inc. 1,430,000 9 0.15% Ashbrook Manor Associates 1,406,400 10 0.14%
Total $ 31,995,600 3.23% $ 45,452,300 4.68%
Note - Individual taxpayers in 2013 and 2004 may be different.
Source: Municipal Tax Assessors.
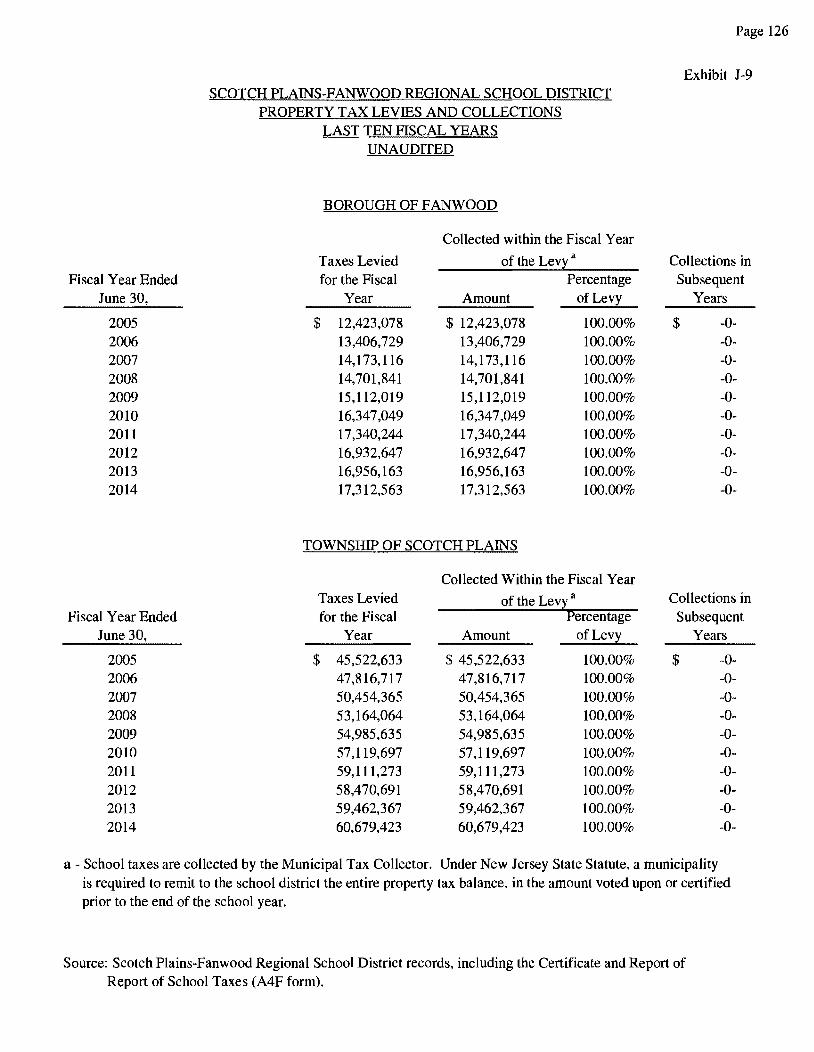
Fiscal Year Ended June 30,
2005 2006 2007 2008 2009 2010 2011 2012 2013 2014
Fiscal Year Ended June 30,
2005 2006 2007 2008 2009 2010 2011 2012 2013 2014
SCOTCH PLAINS-FANWOOD REGIONAL SCHOOL DISTRICT PROPERTY TAX LEVIES AND COLLECTIONS
LAST TEN FISCAL YEARS UNAUDITED
BOROUGH OF FANWOOD
Collected within the Fiscal Year
Taxes Levied of the Lev~a for the Fiscal Percentage
Year Amount of Levy
$ 12,423,078 $ 12,423,078 100.00% 13,406,729 13,406,729 100.00% 14,173,116 14,173,116 100.00% 14,701,841 14,701,841 100.00% 15,112,019 15,112,019 100.00% 16,347,049 16,347,049 100.00% 17,340,244 17,340,244 100.00% 16,932,647 16,932,647 100.00% 16,956,163 16,956,163 100.00% 17,312,563 17,312,563 100.00%
TOWNSHIP OF SCOTCH PLAINS
Collected Within the Fiscal Year Taxes Levied of the Levi
a
for the Fiscal Percentage Year Amount of Levy
$ 45,522,633 $ 45,522,633 100.00% 47,816,717 47,816,717 100.00% 50,454,365 50,454,365 100.00% 53,164,064 53,164,064 100.00% 54,985,635 54,985,635 100.00% 57,119,697 57,119,697 100.00% 59,111,273 59,111,273 100.00% 58,470,691 58,470,691 100.00% 59,462,367 59,462,367 100.00% 60,679,423 60,679,423 100.00%
Page 126
Exhibit J-9
Collections in Subsequent
Years
$ -0--0--0--0--0--0--0--0--0--0-
Collections in Subsequent
Years
$ -0--0--0--0--0--0--0--0--0--0-
a - School taxes are collected by the Municipal Tax Collector. Under New Jersey State Statute, a municipality is required to remit to the school district the entire property tax balance, in the amount voted upon or certified prior to the end of the school year.
Source: Scotch Plains-Fanwood Regional School District records, including the Certificate and Report of Report of School Taxes (A4F form).
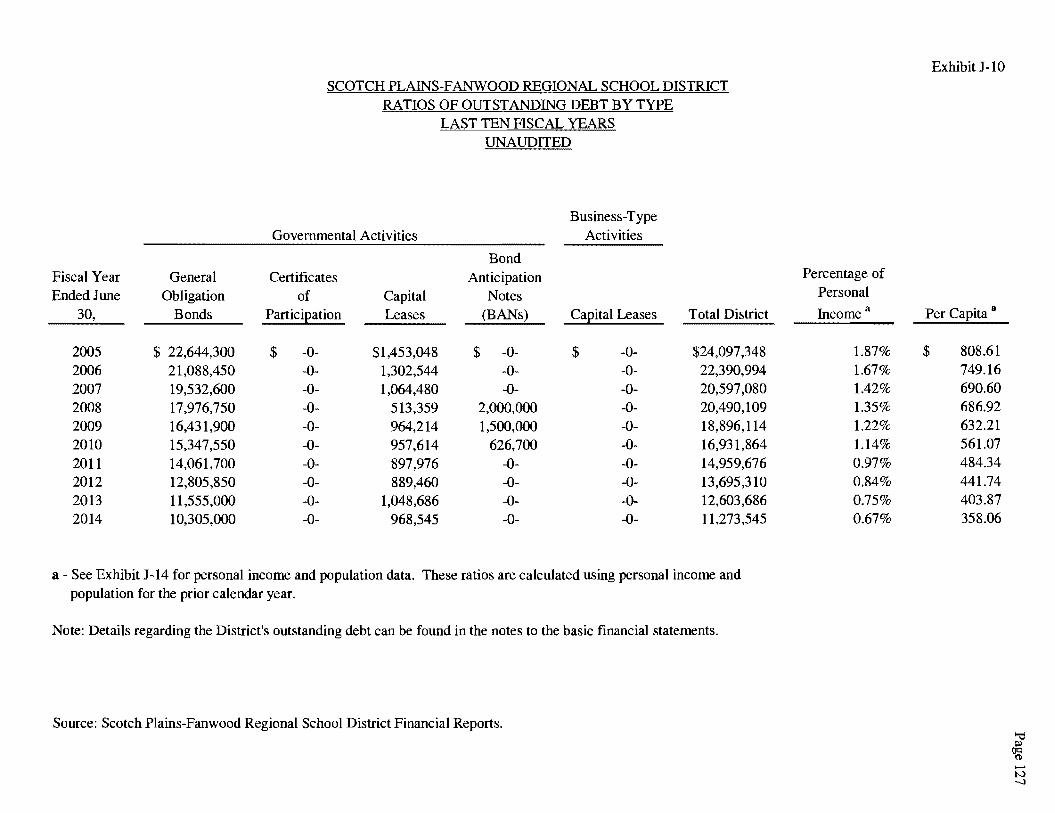
Fiscal Year General Ended June Obligation
30, Bonds
2005 $ 22,644,300 2006 21,088,450 2007 19,532,600 2008 17,976,750 2009 16,431,900 2010 15,347,550 2011 14,061,700 2012 12,805,850 2013 11,555,000 2014 10,305,000
SCOTCH PLAINS-FANWOOD REGIONAL SCHOOL DISTRICT RATIOS OF OUTSTANDING DEBT BY TYPE
LAST TEN FISCAL YEARS UNAUDITED
Business-Type Governmental Activities Activities
Bond Certificates Anticipation
of Capital Notes Participation Leases (BANs) Capital Leases Total District
$ -0- $1,453,048 $ -0- $ -0- $24,097 ,348 -0- 1,302,544 -0- -0- 22,390,994 -0- 1,064,480 -0- -0- 20,597,080 -0- 513,359 2,000,000 -0- 20,490,109 -0- 964,214 1,500,000 -0- 18,896,114 -0- 957,614 626,700 -0- 16,931,864 -0- 897,976 -0- -0- 14,959,676 -0- 889,460 -0- -0- 13,695,310 -0- 1,048,686 -0- -0- 12,603,686 -0- 968,545 -0- -0- 11,273,545
a - See Exhibit J-14 for personal income and population data. These ratios are calculated using personal income and population for the prior calendar year.
Note: Details regarding the District's outstanding debt can be found in the notes to the basic financial statements.
Source: Scotch Plains-Fanwood Regional School District Financial Reports.
Exhibit J-10
Percentage of Personal
Income a Per Capita a
1.87% $ 808.61 1.67% 749.16 1.42% 690.60 1.35% 686.92 1.22% 632.21 1.14% 561.07 0.97% 484.34 0.84% 441.74 0.75% 403.87 0.67% 358.06
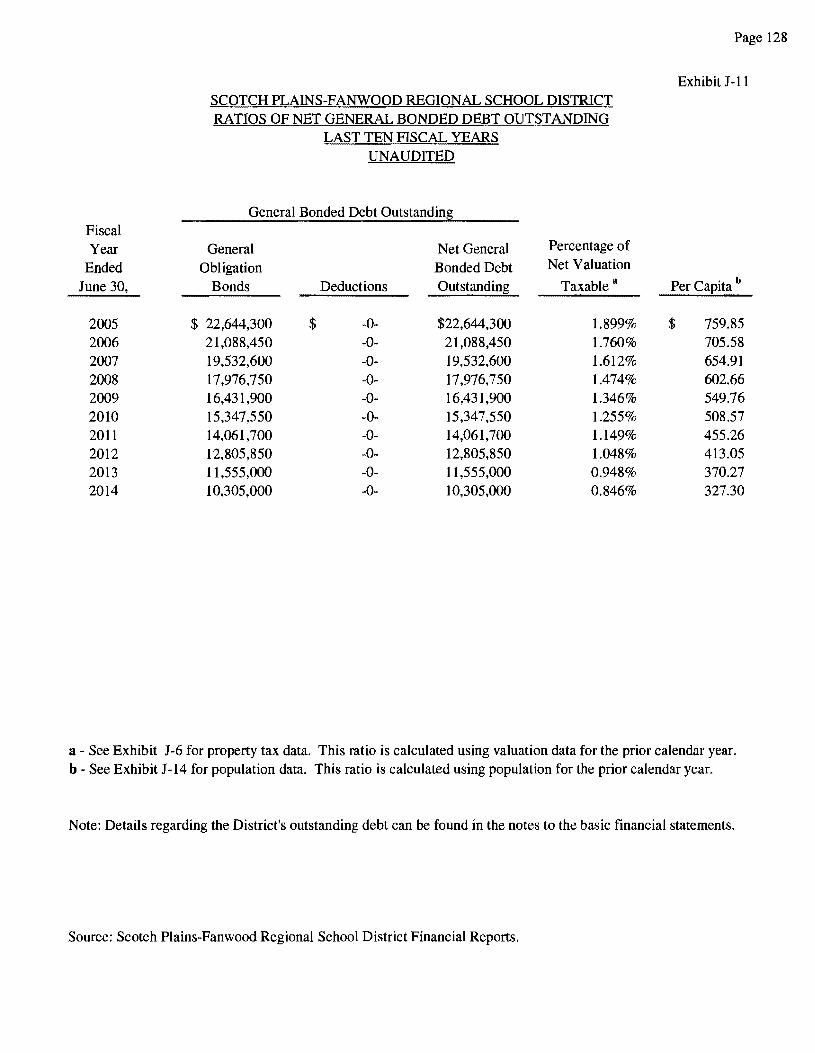
Fiscal Year
Ended June 30,
2005 2006 2007 2008 2009 2010 2011 2012 2013 2014
SCOTCH PLAINS-FANWOOD REGIONAL SCHOOL DISTRICT RATIOS OF NET GENERAL BONDED DEBT OUT ST ANDING
LAST TEN FISCAL YEARS UNAUDITED
General Bonded Debt Outstandin8
General Net General Percentage of
Obligation Bonded Debt Net Valuation
Bonds Deductions Outstanding Taxable a
$ 22,644,300 $ -0- $22,644,300 1.899% 21,088,450 -0- 21,088,450 1.760% 19,532,600 -0- 19,532,600 1.612% 17,976,750 -0- 17,976,750 1.474% 16,431,900 -0- 16,431,900 1.346% 15,347,550 -0- 15,347,550 1.255% 14,061,700 -0- 14,061,700 1.149% 12,805,850 -0- 12,805,850 1.048% 11,555,000 -0- 11,555,000 0.948% 10,305,000 -0- 10,305,000 0.846%
Page 128
Exhibit J-11
Per Capita b
$ 759.85 705.58 654.91 602.66 549.76 508.57 455.26 413.05 370.27 327.30
a - See Exhibit J-6 for property tax data. This ratio is calculated using valuation data for the prior calendar year. b - See Exhibit J-14 for population data. This ratio is calculated using population for the prior calendar year.
Note: Details regarding the District's outstanding debt can be found in the notes to the basic financial statements.
Source: Scotch Plains-Fanwood Regional School District Financial Reports.
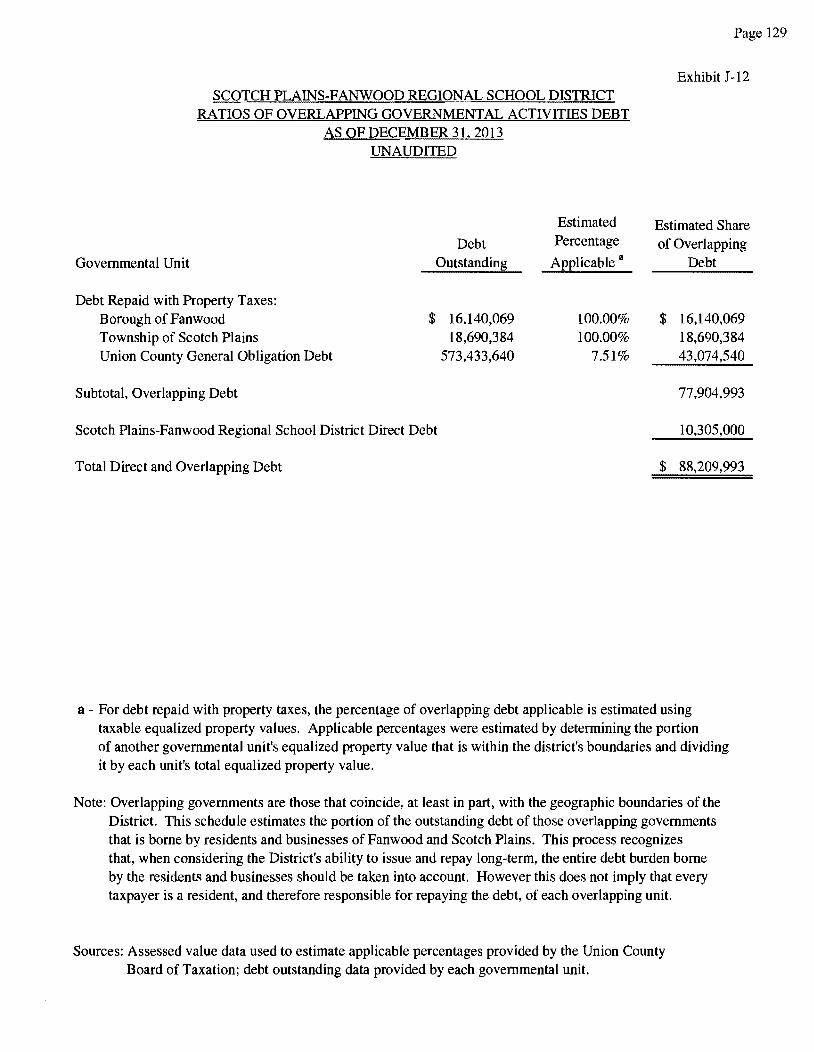
Page 129
Exhibit J-12 SCOTCH PLAINS-FANWOOD REGIONAL SCHOOL DISTRICT
RATIOS OF OVERLAPPING GOVERNMENT AL ACTNITIES DEBT AS OF DECEMBER 31. 2013
Governmental Unit
Debt Repaid with Property Taxes: Borough of Fanwood Township of Scotch Plains Union County General Obligation Debt
Subtotal, Overlapping Debt
UNAUDITED
Debt Outstanding
$ 16,140,069 18,690,384
573,433,640
Scotch Plains-Fanwood Regional School District Direct Debt
Total Direct and Overlapping Debt
Estimated Percentage
Applicable a
100.00% 100.00%
7.51%
Estimated Share of Overlapping
Debt
$ 16,140,069 18,690,384 43,074,540
77,904,993
10,305,000
$ 88,209,993
a - For debt repaid with property taxes, the percentage of overlapping debt applicable is estimated using taxable equalized property values. Applicable percentages were estimated by determining the portion of another governmental unit's equalized property value that is within the district's boundaries and dividing it by each unit's total equalized property value.
Note: Overlapping governments are those that coincide, at least in part, with the geographic boundaries of the District. This schedule estimates the portion of the outstanding debt of those overlapping governments that is borne by residents and businesses of Fanwood and Scotch Plains. This process recognizes that, when considering the District's ability to issue and repay long-term, the entire debt burden borne by the residents and businesses should be taken into account. However this does not imply that every taxpayer is a resident, and therefore responsible for repaying the debt, of each overlapping unit.
Sources: Assessed value data used to estimate applicable percentages provided by the Union County Board of Taxation; debt outstanding data provided by each governmental unit.
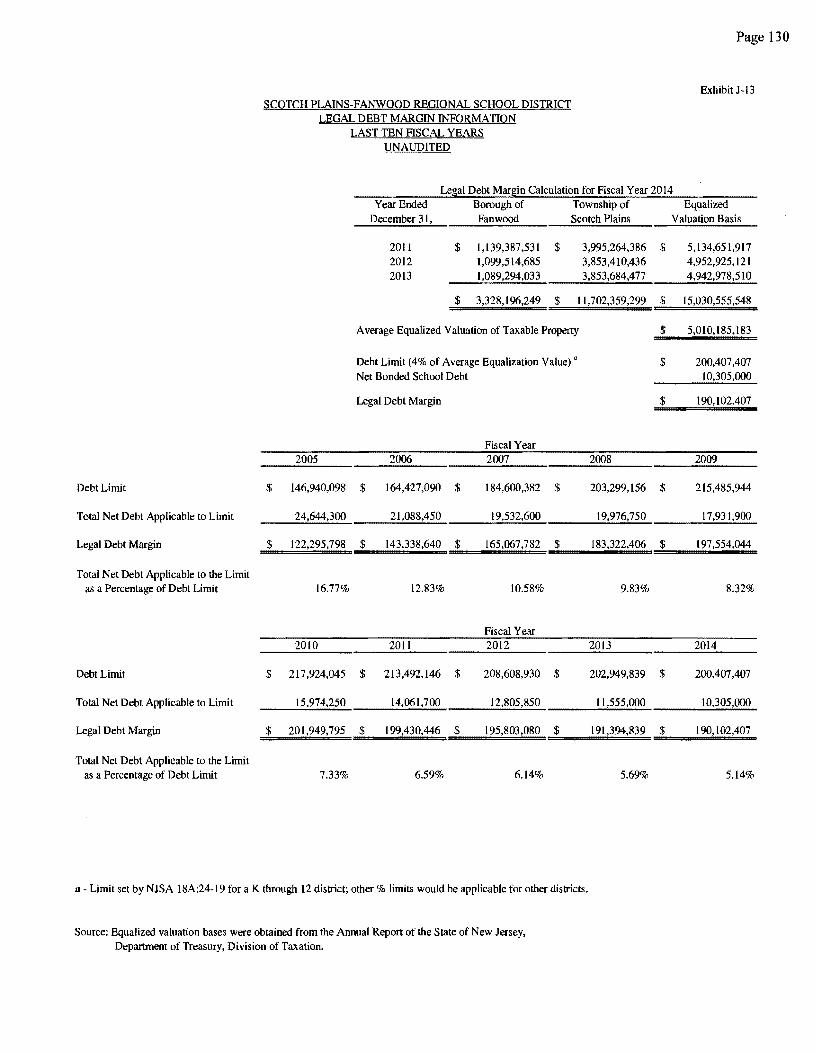
SCOTCH PLAINS-FANWOOD REGIONAL SCHOOL DISTRICT LEGAL DEBT MARGIN INFORMATION
LAST TEN FISCAL YEARS UNAUDITED
Legal Debt Margin Calculation for Fiscal Year 2014
Page 130
Exhibit J-13
Year Ended Borough of Township of Equalized December 31, Fanwood Scotch Plains Valuation Basis
2011 2012 2013
$ 1,139,387,531 $ 1,099,514,685 1,089,294,033
3,995,264,386 $ 3,853,410,436 3,853,684,477
5, 134,651,917 4,952,925, 121 4,942,978,510
$ 3,328,196,249 $ 11,702,359,299 $ 15,030,555,548
2005
Debt Limit $ 146,940,098
Total Net Debt Applicable to Limit 24,644,300
Legal Debt Margin $ 122,295,798
Total Net Debt Applicable to the Limit as a Percentage of Debt Limit 16.77%
2010
Debt Limit $ 217,924,045
Total Net Debt Applicable to Limit 15,974,250
Legal Debt Margin $ 201,949,795
Total Net Debt Applicable to the Limit as a Percentage of Debt Limit 7.33%
Average Equalized Valuation of Taxable Property
Debt Limit ( 4 % of Average Equalization Value) " Net Bonded School Debt
Legal Debt Margin
Fiscal Year 2006 2007
$ 164,427,090 $ 184,600,382 $
21,088,450 19,532,600
$ 143,338,640 $ 165,067,782 $
12.83% 10.58%
Fiscal Year 2011 2012
$ 213,492, 146 $ 208,608,930 $
14,061,700 12,805,850
$ 199,430,446 $ 195,803,080 $
6.59% 6.14%
a - Limit set by NJSA l 8A:24- l 9 for a K through 12 district; other% limits would be applicable for other districts.
Source: Equalized valuation bases were obtained from the Annual Report of the State of New Jersey, Department of Treasury, Division of Taxation.
$
$
$
2008
203,299,156 $
19,976,750
183,322,406 $
9.83%
2013
202,949,839 $
11,555,000
191,394,839 $
5.69%
5,010,185,183
200,407,407 10,305,000
190, I 02,407
2009
215,485,944
17,931,900
197,554,044
8.32%
2014
200,407,407
10,305,000
190, 102,407
5.14%
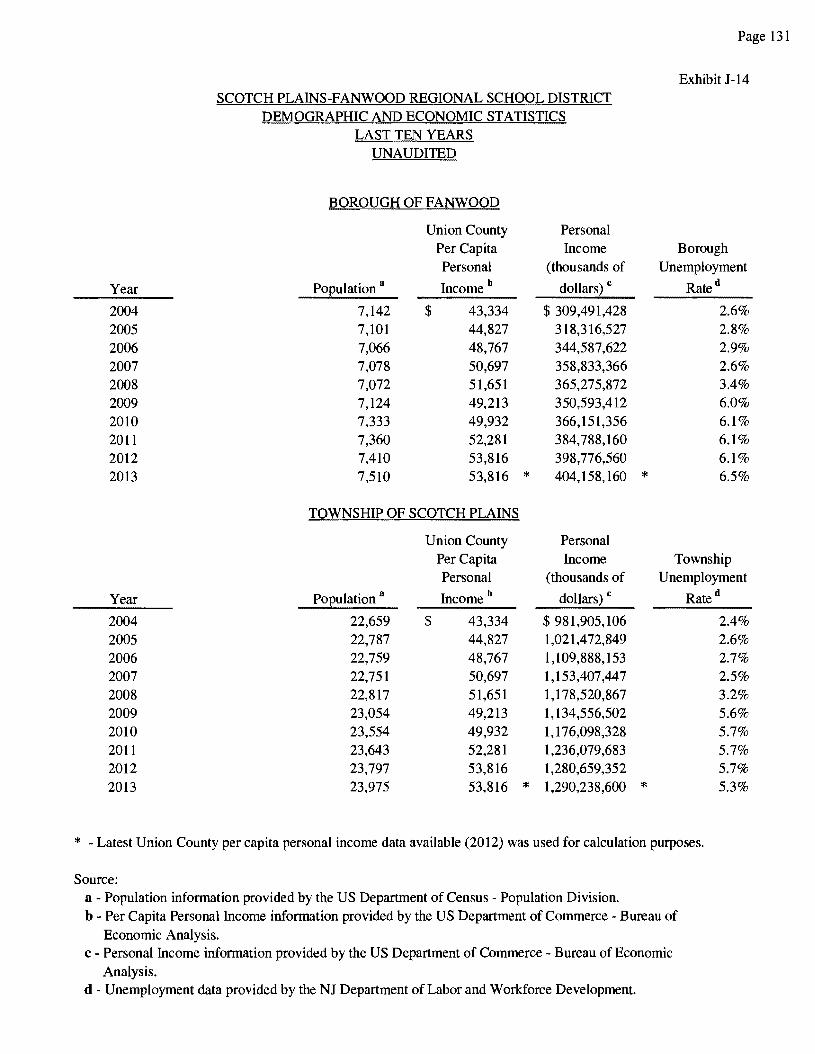
Page 131
Exhibit J-14 SCOTCH PLAINS-FANWOOD REGIONAL SCHOOL DISTRICT
DEMOGRAPHIC AND ECONOMIC STATISTICS LAST TEN YEARS
UNAUDITED
BOROUGH OF FANWOOD
Union County Personal Per Capita Income Borough Personal (thousands of Unemployment
Year Population a Income h dollars) c Rated
2004 7,142 $ 43,334 $ 309,491,428 2.6% 2005 7,101 44,827 318,316,527 2.8% 2006 7,066 48,767 344,587,622 2.9% 2007 7,078 50,697 358,833,366 2.6% 2008 7,072 51,651 365,275,872 3.4% 2009 7,124 49,213 350,593,412 6.0% 2010 7,333 49,932 366,151,356 6.1% 2011 7,360 52,281 384, 788, 160 6.1% 2012 7,410 53,816 398,776,560 6.1% 2013 7,510 53,816 * 404,158,160 * 6.5%
TOWNSHIP OF SCOTCH PLAINS
Union County Personal Per Capita Income Township Personal (thousands of Unemployment
Year Population a Income h dollars) c Rated
2004 22,659 $ 43,334 $ 981,905,106 2.4% 2005 22,787 44,827 1,021,472,849 2.6% 2006 22,759 48,767 1,109,888,153 2.7% 2007 22,751 50,697 1,153,407,447 2.5% 2008 22,817 51,651 1, 178,520,867 3.2% 2009 23,054 49,213 1, 134,556,502 5.6% 2010 23,554 49,932 1, 176,098,328 5.7% 2011 23,643 52,281 1,236,079 ,683 5.7% 2012 23,797 53,816 1,280,659,352 5.7% 2013 23,975 53,816 * 1,290,238,600 * 5.3%
* - Latest Union County per capita personal income data available (2012) was used for calculation purposes.
Source: a - Population information provided by the US Department of Census - Population Division. b - Per Capita Personal Income information provided by the US Department of Commerce - Bureau of
Economic Analysis. c - Personal Income information provided by the US Department of Commerce - Bureau of Economic
Analysis. d - Unemployment data provided by the NJ Department of Labor and Workforce Development.
SCOTCH PLAINS-FANWOOD REGIONAL SCHOOL DISTRICT PRINCIPAL EMPLOYERS,
CURRENT YEAR AND NINE YEARS AGO UNAUDITED
Information was not available as of the date of these financial statements.
Page 132
Exhibit J-15
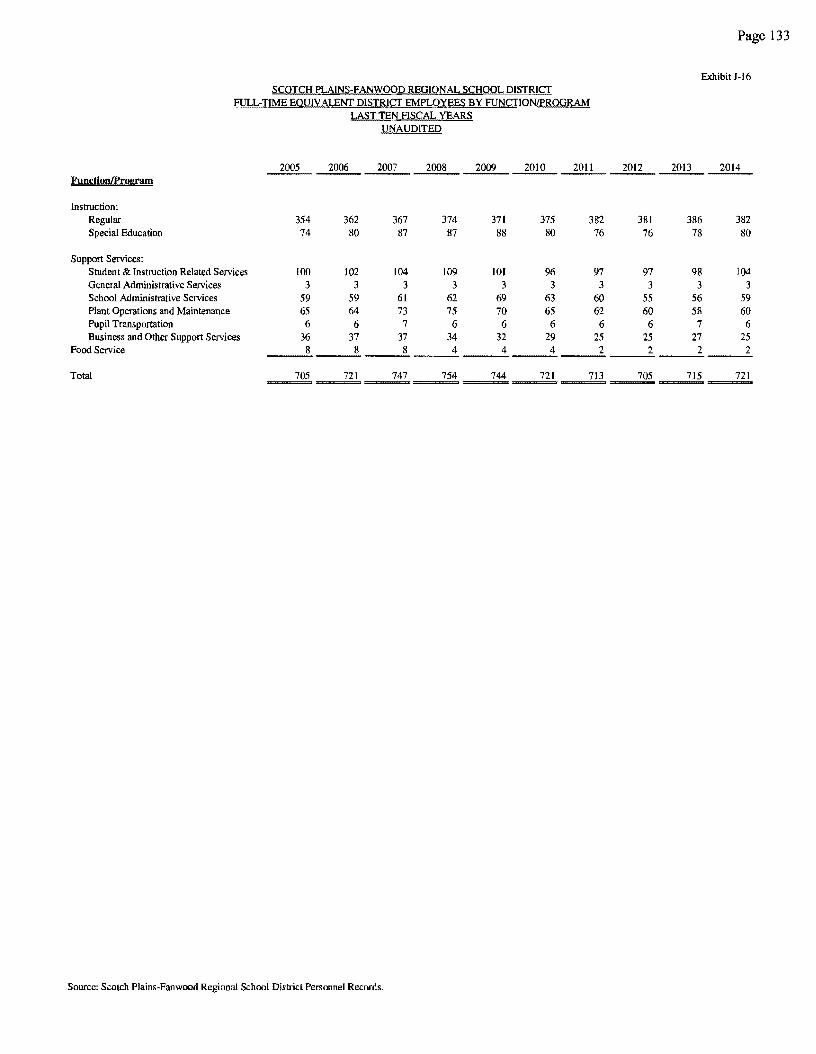
Page 133
Exhibit J-16 SCQT~H PLAINS-FANWOOD REGIONAL S~HOOL DISTRICT
FULL-IIME EQUIV AWNT DISIRICT EMPLOYEES BY RJ~CTION[fROGRAM LAST TEN FIS~AL YEARS
UNAUDITED
2005 2006 2007 2008 2009 2010 2011 2012 2013 2014 Function/Program
Instruction: Regular 354 362 367 374 371 375 382 381 386 382 S pedal Education 74 80 87 87 88 80 76 76 78 80
Support Services: Student & Instruction Related Services 100 102 104 109 101 96 97 97 98 104 General Administrative Services 3 3 3 3 3 3 3 3 3 3 School Administrative Services 59 59 61 62 69 63 60 55 56 59 Plant Operations and Maintenance 65 64 73 75 70 65 62 60 58 60 Pupil Transportation 6 6 7 6 6 6 6 6 7 6 Business and Other Support Services 36 37 37 34 32 29 25 25 27 25
Food Service 8 8 8 4 4 2 2 2 2
Total 705 721 747 754 744 721 713 705 715
Source: Scotch Plains-Fanwood Regional School District Personnel Records.
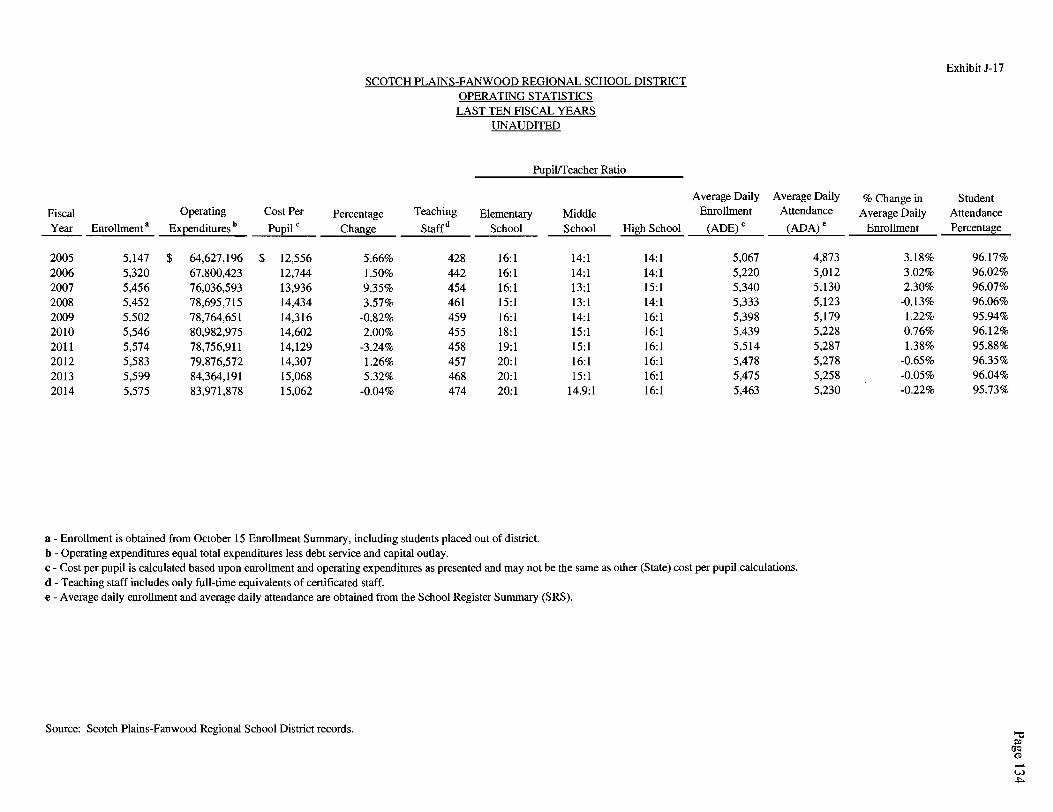
SCOTCH PLAINS-FANWOOD REGlONAL SCHOOL DISTRICT OPERATING ST ATlSTICS LAST TEN FlSCAL YEARS
UNAUDITED
PuEilffeacher Ratio
Fiscal Operating Cost Per Percentage Teaching Elementary Middle Year Enrollment a Expenditures b Pupil c Change Staffd School School High School
2005 5,147 $ 64,627,196 $ 12,556 5.66% 428 16:1 14:1 14:1 2006 5,320 67,800,423 12,744 l.50% 442 16:1 14:1 14:1 2007 5,456 76,036,593 13,936 9.35% 454 16:1 13:1 15:1 2008 5,452 78,695,715 14,434 3.57% 461 15:1 13:1 14:1 2009 5,502 78,764,651 14,316 -0.82% 459 16:1 14:1 16:1 2010 5,546 80,982,975 14,602 2.00% 455 18:1 15:1 16:1 2011 5,574 78,756,911 14,129 -3.24% 458 19:1 15:1 16:1 2012 5,583 79,876,572 14,307 l.26% 457 20:1 16:1 16:1 2013 5,599 84,364,191 15,068 5.32% 468 20:1 15:1 16:1 2014 5,575 83,971,878 15,062 -0.04% 474 20:1 14.9:1 16:1
a - Enrollment is obtained from October 15 Enrollment Summary, including students placed out of district. b - Operating expenditures equal total expenditures less debt service and capital outlay.
Average Daily Average Daily Enrollment Attendance
(ADE)• (ADA)•
5,067 4,873 5,220 5,012 5,340 5,130 5,333 5,123 5,398 5,179 5,439 5,228 5,514 5,287 5,478 5,278 5,475 5,258 5,463 5,230
c - Cost per pupil is calculated based upon enrollment and operating expenditures as presented and may not be the same as other (State) cost per pupil calculations. d - Teaching staff includes only full-time equivalents of certificated staff. e - Average daily enrollment and average daily attendance are obtained from the School Register Summary (SRS).
Source: Scotch Plains-Fanwood Regional School District records.
Exhibit J-17
% Change in Student Average Daily Attendance
Enrollment Percentage
3.18% 96.17% 3.02% 96.02% 2.30% 96.07%
-0.13% 96.06% l.22% 95.94% 0.76% 96.12% 1.38% 95.88%
-0.65% 96.35% -0.05% 96.04% -0.22% 95.73%
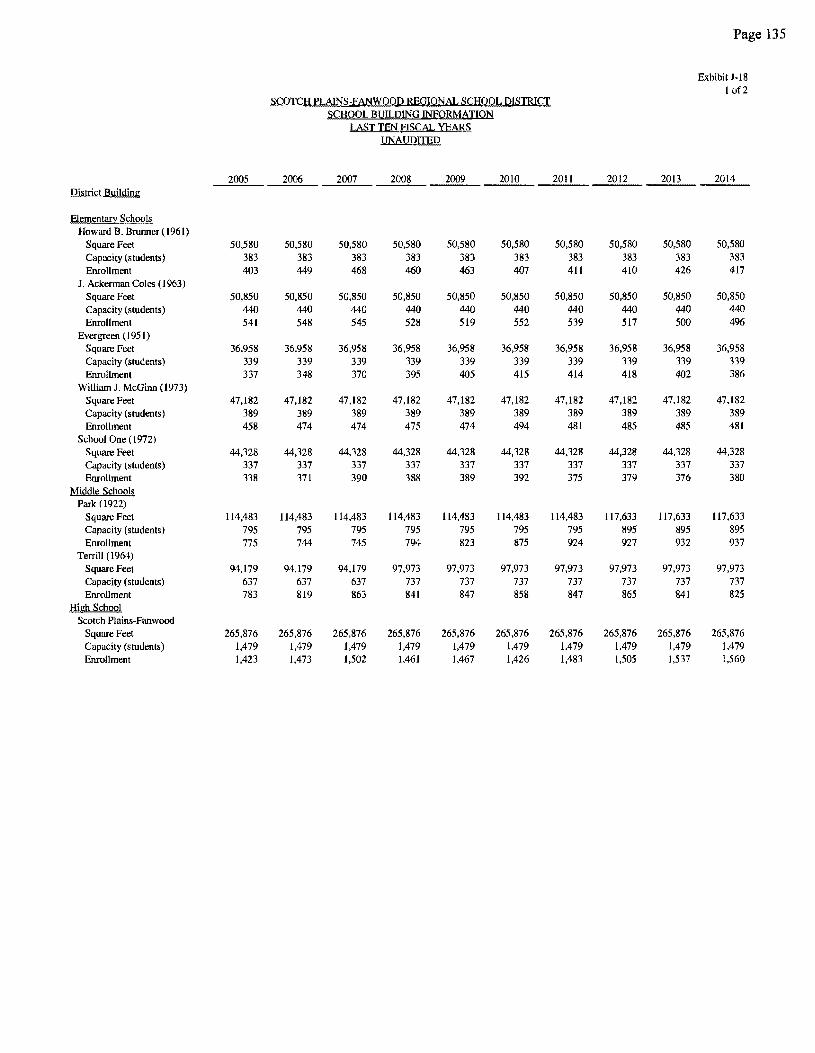
Page 135
Exhibit J-18 I of2
SCOTCH PL,AlNS-fANWOOD REGIOJ:::l:AL SCHOOL DlSTRICT SCHQOLB!..!ILDING INFQRMATIQN
LAST TEN FISCAL YEARS UNAUDITED
2005 2006 2007 2008 2009 2010 2011 2012 2013 2014 District Building
Elemen!fil:j'. Schools Howard B. Brunner (1961)
Square Feet 50,580 50,580 50,580 50,580 50,580 50,580 50,580 50,580 50,580 50,580 Capacity (students) 383 383 383 383 383 383 383 383 383 383 Enrollment 403 449 468 460 463 407 411 410 426 417
J. Ackerman Coles (1963) Square Feet 50,850 50,850 50,850 50,850 50,850 50,850 50,850 50,850 50,850 50,850 Capacity (students) 440 440 440 440 440 440 440 440 440 440 Enrollment 541 548 545 528 519 552 539 517 500 496
Evergreen (1951) Square Feet 36,958 36,958 36,958 36,958 36,958 36,958 36,958 36,958 36,958 36,958 Capacity (students) 339 339 339 339 339 339 339 339 339 339 Enrollment 337 348 370 395 405 415 414 418 402 386
William J. McGinn (1973) Square Feet 47,182 47,182 47,182 47,182 47,182 47,182 47,182 47,182 47,182 47,182 Capacity (students) 389 389 389 389 389 389 389 389 389 389 Enrollment 458 474 474 475 474 494 481 485 485 481
School One (1972) Square Feet 44,328 44,328 44,328 44,328 44,328 44,328 44,328 44,328 44,328 44,328 Capacity (students) 337 337 337 337 337 337 337 337 337 337 Enrollment 338 371 390 388 389 392 375 379 376 380
Middle Schools Park (1922)
Square Feet 114,483 114,483 114,483 114,483 114,483 114,483 114,483 117,633 117,633 117,633 Capacity (students) 795 795 795 795 795 795 795 895 895 895 Enrollment 775 744 745 794 823 875 924 927 932 937
Terrill (1964) Square Feet 94,179 94,179 94,179 97,973 97,973 97,973 97,973 97,973 97,973 97,973 Capacity (students) 637 637 637 737 737 737 737 737 737 737 Enrollment 783 819 863 841 847 858 847 865 841 825
High School Scotch Plains-Fanwood
Square Feet 265,876 265,876 265,876 265,876 265,876 265,876 265,876 265,876 265,876 265,876 Capacity (students) 1,479 1,479 1,479 1,479 1,479 l,479 1,479 1,479 1,479 J,479 Enrollment 1,423 1,473 1,502 1,461 1,467 1,426 1,483 1,505 1,537 l,560
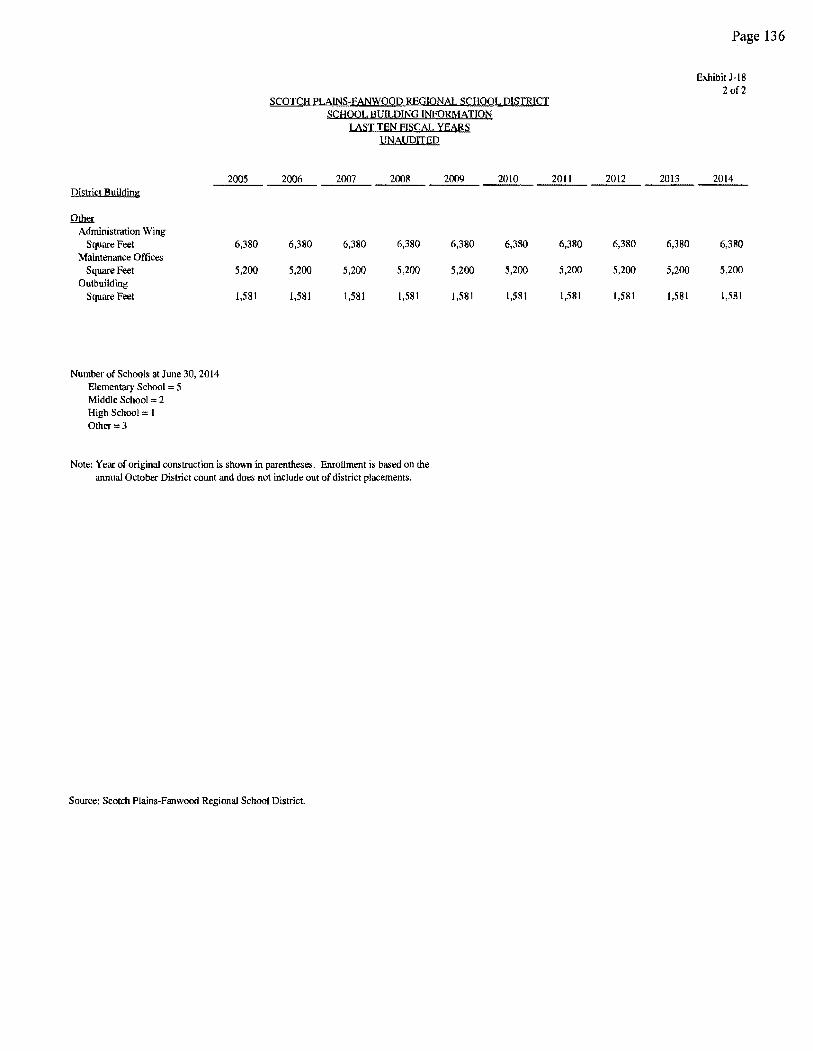
SCOTCH PLAINS-fANWOOD REGIONAL SCHOOL DISTRICT SCHOOL BUILDING INFORMATION
LAST TEN FISCAL YEARS
District Building
Other Administration Wing
Square Feet Maintenance Offices
Square Feet Outbuilding
Square Feet
Number of Schools at June 30, 2014 Elementary School 5 Middle School = 2 High School 1 Other=3
2005
6,380
5,200
1,581
UNAUDITED
2006 2007 2008
6,380 6,380 6,380
5,200 5,200 5,200
1,581 1,581 1,581
Note: Year of original construction is shown in parentheses. Enrollment is based on the annual October District count and does not include out of district placements.
Source: Scotch Plains-Fanwood Regional School District.
2009
6,380
5,200
1,581
2010
6,380
5,200
1,581
2011 2012
6,380 6,380
5,200 5,200
1,581 1,581
2013
6,380
5,200
1,581
Page 136
Exhibit J-18 2of2
2014
6,380
5,200
1,581
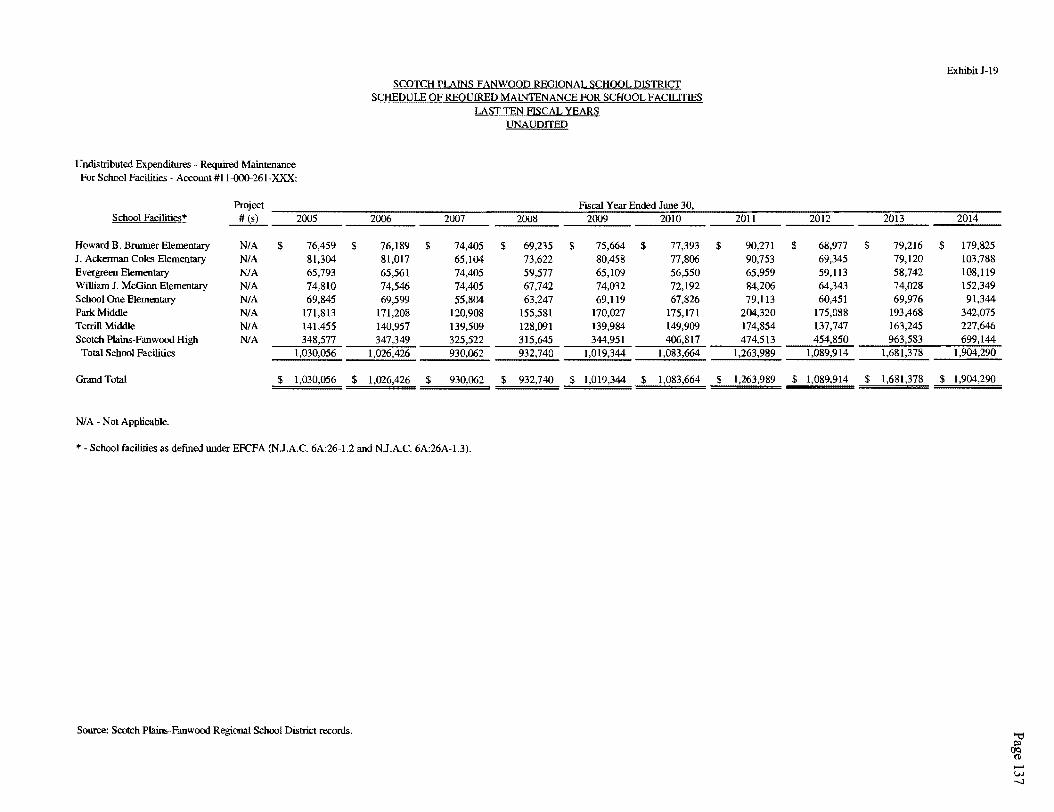
Exhibit J-19 SCOTCH PLAINS-FANWOOD REGIONAL SCHOOL DISTRICT
SCHEDULE OF REQUIRED MAINTENANCE FOR SCHOOL FACILITIES LAST TEN FISCAL YEARS
UNAUDITED
Undistributed Expenditures Required Maintenance For School Facilities Account #11--000-261-XXX:
Project Fiscal Year Ended June 30, School Facilities* ~ 2005 2006 2007 2008 2009 2010 201 l 2012 2013 2014
Howard B. Brunner Elementary NIA $ 76,459 $ 76,189 $ 74,405 $ 69,235 $ 75,664 $ 77,393 $ 90,271 $ 68,977 $ 79,216 $ 179,825 J. Ackennan Coles Elementary NIA 81,304 81,017 65,104 73,622 80,458 77,806 90,753 69,345 79,120 103,788 Evergreen Elementary NIA 65,793 65,561 74,405 59,577 65,109 56,550 65,959 59,113 58,742 108,119 William J. McGinn Elementary NIA 74,810 74,546 74,405 67,742 74,032 72,192 84,206 64,343 74,028 152,349 School One Elementary NIA 69,845 69,599 55,804 63,247 69,119 67,826 79,113 60,451 69,976 91,344 Park Middle NIA 171,813 171,208 120,908 155,581 170,027 175,171 204,320 175,088 193,468 342,075 Terrill Middle NIA 141,455 140,957 139,509 128,091 139,984 149,909 174,854 137,747 163,245 227,646 Scotch Plains-Fanwood High NIA 348,577 347,349 325,522 315,645 344,951 406,817 474,513 454,850 963,583 699,144 Total School Facilities 1,030,056 1,026,426 930,062 932,740 1,019,344 1,083,664 1,263,989 1,089,914 1,681,378 l,904,290
Grand Total $ 1,030,056 $ 1,026,426 $ 930,062 $ 932,740 s 1,019,344 $ 1,083,664 $ 1,263,989 s 1,089,914 s 1,681,378 $ 1,904,290
NIA - Not Applicable.
* - School facilities as defmed under EFCFA (N.J.A.C. 6A:26-l.2 and N.J.A.C. 6A:26A-1.3).
Source: Scotch Plains-Fanwood Regional School District records.
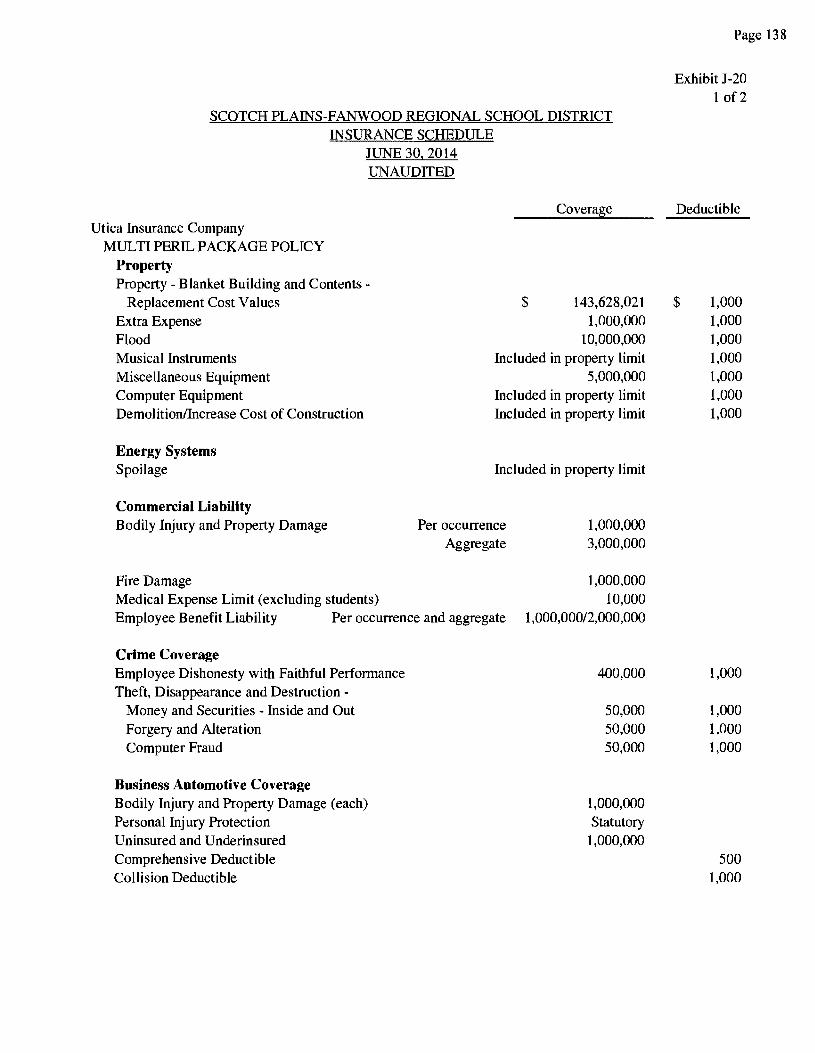
SCOTCH PLAINS-FANWOOD REGIONAL SCHOOL DISTRICT INSURANCE SCHEDULE
JUNE 30, 2014 UNAUDITED
Utica Insurance Company MULTI PERIL PACKAGE POLICY
Property Property - Blanket Building and Contents -
Replacement Cost Values Extra Expense Flood Musical Instruments Miscellaneous Equipment Computer Equipment Demolition/Increase Cost of Construction
Energy Systems Spoilage
Commercial Liability Bodily Injury and Property Damage
Fire Damage Medical Expense Limit (excluding students)
Coverage
$ 143,628,021 1,000,000
10,000,000 Included in property limit
5,000,000 Included in property limit Included in property limit
Included in property limit
Per occurrence Aggregate
1,000,000 3,000,000
Employee Benefit Liability Per occurrence and aggregate
1,000,000 10,000
l ,000,000/2,000,000
Crime Coverage Employee Dishonesty with Faithful Performance Theft, Disappearance and Destruction -
Money and Securities - Inside and Out Forgery and Alteration Computer Fraud
Business Automotive Coverage Bodily Injury and Property Damage (each) Personal Injury Protection Uninsured and Underinsured Comprehensive Deductible Collision Deductible
400,000
50,000 50,000 50,000
1,000,000 Statutory
1,000,000
Page 138
Exhibit J-20 1 of2
Deductible
$ 1,000 1,000 1,000 1,000 1,000 1,000 1,000
1,000
1,000 l,000 l,000
500 1,000
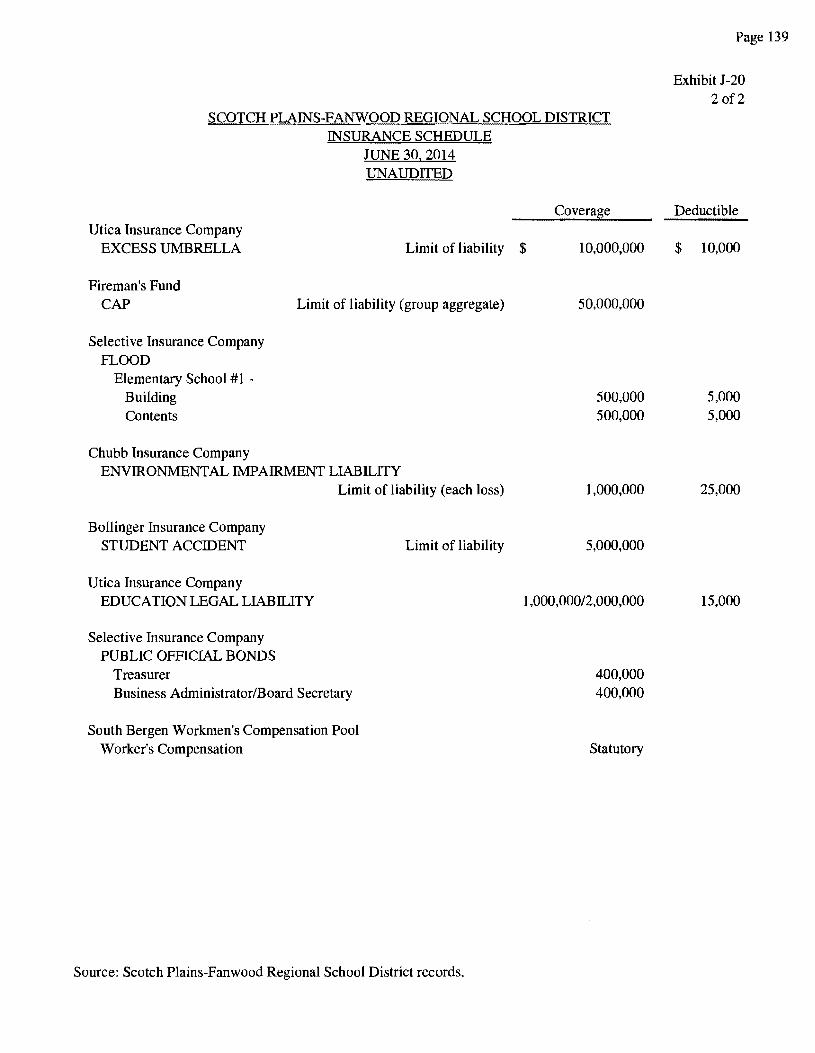
SCOTCH PLAINS-FANWOOD REGIONAL SCHOOL DISTRICT INSURANCE SCHEDULE
JUNE 30. 2014 UNAUDITED
Coverage Utica Insurance Company
EXCESS UMBRELLA Limit of liability $ 10,000,000
Fireman's Fund CAP Limit of liability (group aggregate)
Selective Insurance Company FLOOD
Elementary School #1 -Building Contents
Chubb Insurance Company ENVIRONMENTAL IMPAIRMENT LIABILITY
Limit of liability (each loss)
Bollinger Insurance Company STUDENT ACCIDENT
Utica Insurance Company EDUCATION LEGAL LIABILITY
Selective Insurance Company PUBLIC OFFICIAL BONDS
Treasurer Business Administrator/Board Secretary
South Bergen Workmen's Compensation Pool Worker's Compensation
Limit of liability
Source: Scotch Plains-Fanwood Regional School District records.
50,000,000
500,000 500,000
1,000,000
5,000,000
1,000,000/2,000,000
400,000 400,000
Statutory
Page 139
Exhibit J-20 2 of2
Deductible
$ 10,000
5,000 5,000
25,000
15,000
Page 140
I ~----------------------~
SINGLE AUDIT SECTION
NISIVUCCIALLP Cerlitied Public Accountanls & Advisors
Report on Internal Control Over Financial Reporting and
Page 141
Mount Arlington Corporate Center 200 Valley Road, Suite 300
Mt. Arlington, NJ 07856 973-328-1825 I 973-328-0507 Fa)(
Lawrence Buslness Center 11 Lawrence Road Newton. NJ 07860
973-383·6699 I 973-383-6555 Fa)(
on Compliance and Other Matters Based on an Audit of Financial Statements Performed in Accordance with Government Auditing Standards
The Honorable President and Members of the Board of Education
Independent Auditors' Report
Scotch Plains-Fanwood Regional School District County of Union, New Jersey
We have audited, in accordance with the auditing standards generally accepted in the United States of America, the standards applicable to financial audits contained in Government Auditing Standards issued by the Comptroller General of the United States and the audit requirements prescribed by the Office of School Finance, Department of Education, State of New Jersey (the "Department"), the financial statements of the governmental activities, the business-type activities, each major fund, and the aggregate remaining fund information of the Scotch Plains/Fanwood Regional Board of Education, in the County of Union (the "District") as of and for the fiscal year ended June 30, 2014, and the related notes to the financial statements, which collectively comprise the District's basic financial statements, and have issued our report thereon dated October 21, 2014.
Internal Control Over Financial Reporting
In planning and performing our audit of the financial statements, we considered the District's internal control over financial reporting (internal control) to determine the audit procedures that are appropriate in the circumstances for the purpose of expressing our opinions on the financial statements, but not for the purpose of expressing an opinion on the effectiveness of the District's internal control. Accordingly, we do not express an opinion on the effectiveness of the District's internal control.
A deficiency in internal control exists when the design or operation of a control does not allow management or employees, in the normal course of performing their assigned functions, to prevent, or detect and correct, misstatements on a timely basis. A material weakness is a deficiency, or a combination of deficiencies, in internal control such that there is a reasonable possibility that a material misstatement of the District's financial statements will not be prevented, or detected and corrected on a timely basis. A significant deficiency is a deficiency, or a combination of deficiencies, in internal control that is less severe than a material weakness, yet important enough to merit attention by those charged with governance.
Our consideration of the internal control was for the limited purpose described in the first paragraph of this section and was not designed to identify all deficiencies in internal control that might be material weaknesses or significant deficiencies. Given these limitations, during our audit we did not identify any deficiencies in internal control that we consider to be material weaknesses. However, material weaknesses may exist that have not been identified.
www.nisivoccia.com Independent Member of BKR International
The Honorable President and Members of the Board of Education Scotch Plains-Fanwood Regional School District Page2
Compliance and Other Matters
Page 142
As part of obtaining reasonable assurance about whether the District's financial statements are free of material misstatement, we performed tests of its compliance with certain provisions of laws, regulations, contracts, and grant agreements, noncompliance with which could have a direct and material effect on the determination of financial statement amounts. However, providing an opinion on compliance with those provisions was not an objective of our audit, and accordingly, we do not express such an opinion. The results of our tests disclosed no instances of noncompliance or other matters that are required to be reported under Government Auditing Standards.
Purpose of this Report
The purpose of this report is solely to describe the scope of our testing of internal control and compliance and the result of that testing, and not to provide an opinion on the effectiveness of the District's internal control or on compliance. This report is an integral part of an audit performed in accordance with Government Auditing Standards in considering the District's internal control and compliance. Accordingly, this communication is not suitable for any other purpose.
Mount Arlington, New Jersey October 21, 2014
NISIVOCCIA LLP
Heidi A. Wohlleb ~ Licensed Public School Accountant #2140 Certified Public Accountant
N 1s1vacc1 A LLP Cerlllled Public Account(rn!s & Advisors
Mount Arlington Corporate Center 200 Valley Road, Suite 300
Mt. Arlington, NJ 07856 973-328-18251973-328-0507 Fax
Lawrence Business Center 11 Lawrence Road Newton, NJ 07860
973-383-6699 I 973-383-6555 Fax
Report on Compliance For Each Major Federal and State Program; Report on Internal Control Over Compliance Required by OMB Circular A-133
and New Jersey's OMB Circular 04-04
The Honorable President and Members of the Board of Education
Independent Auditors' Report
Scotch Plains-Fanwood Regional School District County of Union, New Jersey
Report on Compliance for Each Major Federal and State Program
We have audited the Scotch Plains/Fanwood Regional Board of Education's (the "District's") compliance with the types of compliance requirements described in the OMB Circular A-133 Compliance Supplement and the New Jersey State Aid/ Grant Compliance Supplement that could have a direct and material effect on each of the District's major federal and state programs for the fiscal year ended June 30, 2014. The District's major federal and state programs are identified in the summary of auditors' results section of the accompanying schedule of findings and questioned costs.
Management's Responsibility
Management is responsible for compliance with the requirements of laws, regulations, contracts, and grants applicable to its federal and state programs.
Auditors' Responsibility
Our responsibility is to express an opinion on compliance for each of the District's major federal and state programs based on our audit of the types of compliance requirements referred to above. We conducted our audit of compliance in accordance with auditing standards generally accepted in the United States of America; the standards applicable to financial audits contained in Government Auditing Standards, issued by the Comptroller General of the United States; OMB Circular A-133, Audits of States, Local Governments, and Non-Profit Organizations and New Jersey's OMB Circular 04-04, Single Audit Policy for Recipients of Federal Grants, State Grants, and State Aid. Those standards, OMB Circular A-133 and New Jersey's OMB Circular 04-04 require that we plan and perform the audit to obtain reasonable assurance about whether noncompliance with the types of compliance requirements referred to above that could have a direct and material effect on a major federal or state program occurred. An audit includes examining, on a test basis, evidence about the District's compliance with those requirements and performing such other procedures as we considered necessary in the circumstances.
We believe that our audit provides a reasonable basis for our opinion on compliance for each major federal and state program. However, our audit does not provide a legal determination of the District's compliance.
www.nisivoccia.com Independent Member of BKR International
Page 143
The Honorable President and Members of the Board of Education
Scotch Plains-Fanwood Regional School District Page 2
Opinion on Each Major Federal and State Program
Page 144
In our opinion, the District complied, in all material respects, with the types of compliance requirements referred to above that could have a direct and material effect on each of its major federal and state programs for the fiscal year ended June 30, 2014.
Report on Internal Control Over Compliance
Management of the District is responsible for establishing and maintaining effective internal control over compliance with the types of compliance requirements referred to above. In planning and performing our audit of compliance, we considered the District's internal control over compliance with the types of requirements that could have a direct and material effect on each major federal and state program to determine the auditing procedures that are appropriate in the circumstances for the purpose of expressing an opinion on compliance for each major federal and state program and to test and report on internal control over compliance in accordance with OMB Circular A-133 and NJOMB 04-04, but not for the purpose of expressing an opinion on the effectiveness of internal control over compliance. Accordingly, we do not express an opinion on the effectiveness of District's internal control over compliance.
A deficiency in internal control over compliance exists when the design or operation of a control over compliance does not allow management or employees, in the normal course of performing their assigned functions, to prevent, or detect and correct, noncompliance with a type of compliance requirement of a federal or state program on a timely basis. A material weakness in internal control over compliance is a deficiency, or combination of deficiencies, in internal control over compliance, such that there is a reasonable possibility that material noncompliance with a type of compliance requirement of a federal or state program will not be prevented, or detected and corrected, on a timely basis. A significant deficiency in internal control over compliance is a deficiency, or a combination of deficiencies, in internal control over compliance with a type of compliance requirement of a federal or state program that is less severe than a material weakness in internal control over compliance, yet important enough to merit attention by those charged with governance.
Our consideration of internal control over compliance was for the limited purpose described in the first paragraph of this section and was not designed to identify all deficiencies in internal control over compliance that might be material weaknesses or significant deficiencies. We did not identify any deficiencies in internal control over compliance that we consider to be material weaknesses. However, material weaknesses may exist that have not been identified.
The purpose of this report on internal control over compliance is solely to describe the scope of our testing of internal control over compliance and the results that the testing based on the requirements of OMB Circular A-133 or NJOMB 04-04. Accordingly, this report is not suitable for any other purpose.
Mount Arlington, New Jersey October 21, 2014
NISNOCCIA LLP
Heidi A. Wohlle~> Licensed Public School Accountant #2140 Certified Public Accountant
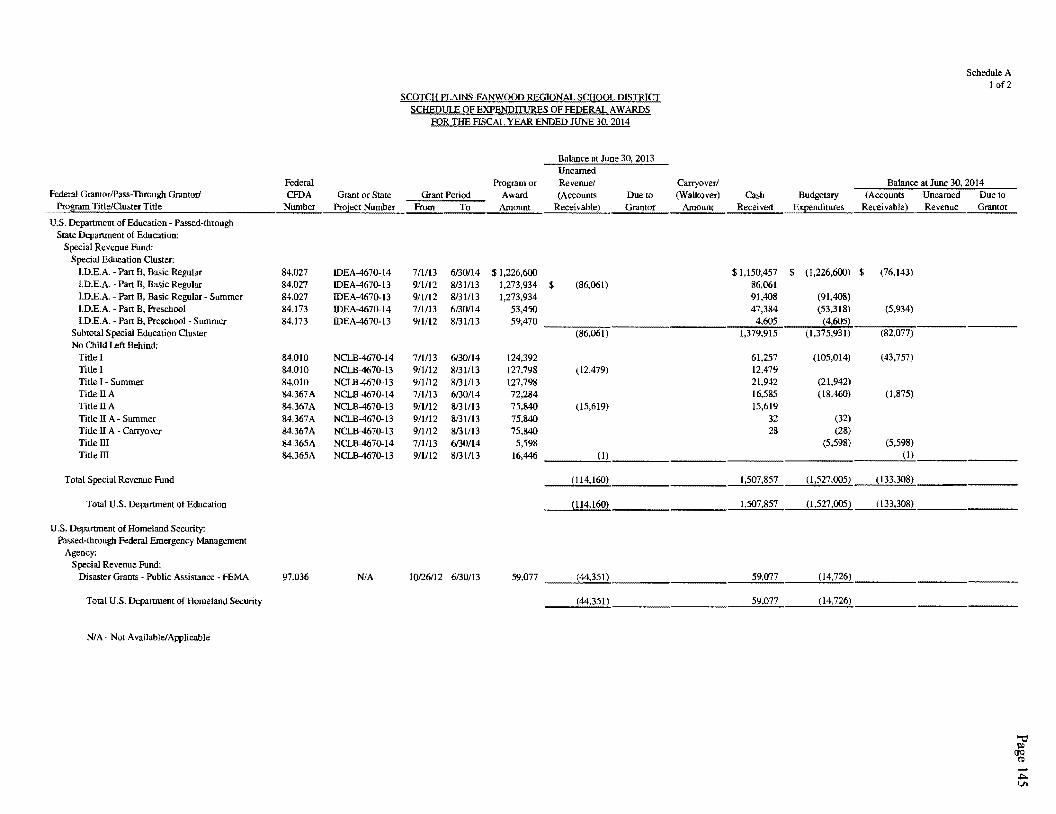
Federal Grantor/Pass-Through Grantor/ Program Title/Cluster Title
U.S. Department of Education - Passed-through State Department of Education:
Special Revenue Fund: Special Education Cluster:
l.D.E.A. - Part B, Basic Regular I.D.E.A. - Part B, Basic Regular l.D.E.A. - Part B, Basic Regular - Summer I.D.E.A. - Part B, Preschool I.D.E.A. - Part B, Preschool Summer
Subtotal Special Education Cluster No Child Left Behind:
Title I Title I Title I - Summer Title IIA Title II A Title II A Summer Title II A - Carryover Title Ill Title III
Total Special Revenue Fund
Total U.S. Department of Education
U.S. Department of Homeland Security: Passed-through Federal Emergency Management
Agency: Special Revenue Fund:
Disaster Grants Public Assistance - FEMA
Total U.S. Department of Homeland Security
NIA - Not Available/Applicable
Federal CFDA Grant or State
Number Project Number
84.027 IDEA-4670-14 84.027 IDEA-4670-13 84.027 IDEA-4670-13 84.173 IDEA-4670-14 84.173 IDEA-4670-13
84.010 NCLB-4670-14 84.010 NCLB-4670-13 84.010 NCLB-4670-13 84.367A NCLB-4670-14 84.367A NCLB-4670-13 84.367A NCLB-4670-13 84.367A NCLB-4670-13 84.365A NCLB-4670-14 84.365A NCLB-4670-13
97.036 NIA
SCOTCH PLAINS-FANWOOD REGIONAL SCHOOL DISTRICT SCHEDUI.E OF EXPENDITURES OF FEDERAL AW ARDS
FOR THE FISCAL YEAR ENDED JUNE 30. 2014
Balance at June 30. 2013 Unearned
Program or Revenue/ Grant Period Award (Accounts
From __ T_o ___ -'Am_o_u_n_t _ Receivable)
7/1/13 6/30114 $1,226,600 9/1/12 8/31/13 1,273,934 $ (86,061) 9/1/12 8131/13 1,273,934 7/1/13 6/30/14 53,450 9/1/12 8/31/13 59,470
(86,061)
7/1/13 6/30/14 124,392 911/12 8/31113 127,798 (12,479) 9/1112 8/31/13 127,798 7/1/13 6/30/14 72,284 9/1/12 8/31/13 75.840 (15,619) 911112 8/31/13 75,840 9/1/12 8/31/13 75,840 7/1/13 6/30/14 5,598 9/1/12 8/31/13 16,446 ( 1)
(114,160)
(ll4,160)
Due to Grantor
Carryover/ (Walkover) Cash
Amount Received
$1,150,457 86,061 91,408 47,384 4,605
1,379,915
61,257 12,479 21,942 16,585 15,619
32 28
1,507,857
1,507,857
Schedule A I of2
Balance atJune 30, 2014 Budgetary (Accounts Unearned Due to
Expenditures Receivable) Revenue Grantor
$ (l ,226,600) $ (76,143)
(91,408) (53,318) (5,934)
(4,605) (1,375,931) (82,077)
(105,014) (43,757)
(21,942) (18,460) (1,875)
(32) (28)
(5,598) (5,598) (!)
(1,527 ,005) (133,308)
(l,527 ,005) (133,308)
10/26/12 6/30/13 59,077 __ _c(,_,44-"''""35::..:1""-) ____________ _c5;..;9..:.;,07;..;..;_7 ___ __;("'"14""',7-'2'"'"'-6) -------------
(44,351) 59,077 (14,726)
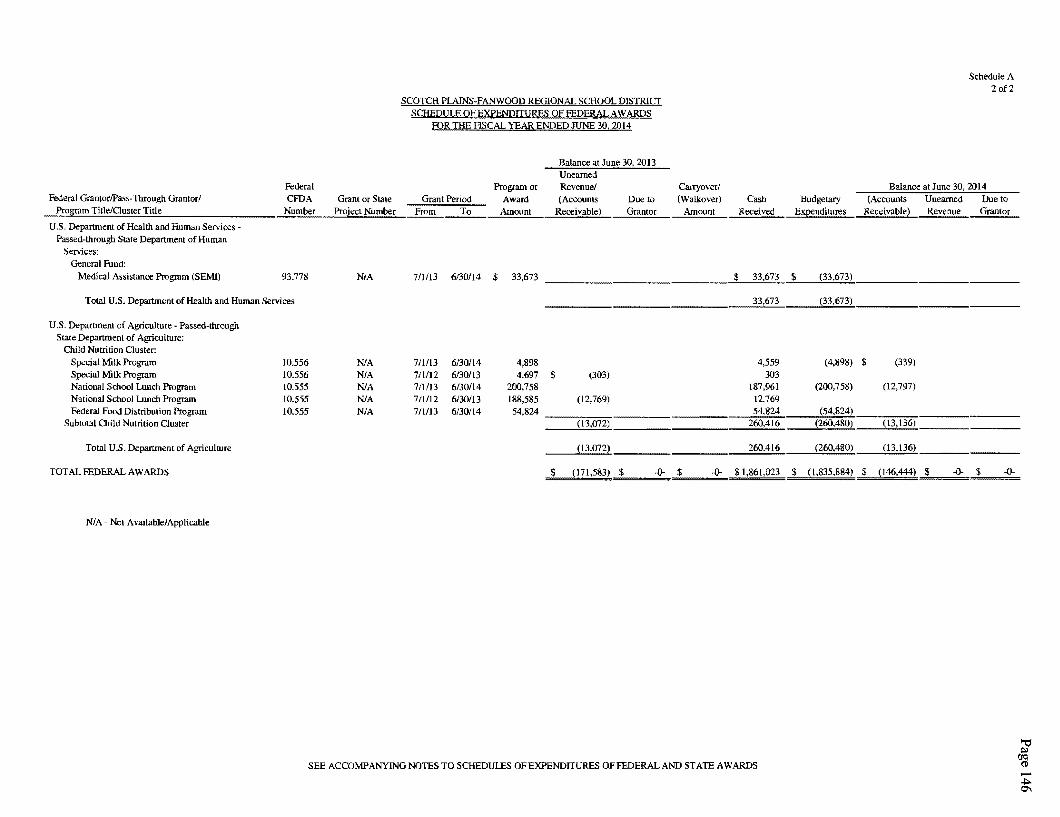
Federal Grantor/Pass-Tbrough Grantor/ Program Title/Clus1er Title
U.S. Department of Health and Human Services -Passed-through State Depattment of Human
Services: General Fund:
Medical Assistance Program (SEMI)
Federal CFDA Number
93.778
Total U.S. Department of Health and Human Services
U.S. Depanmenl of Agriculture - Passed-through State Depanmenl of Agriculture:
Child Nutrition Cluster: Special Milk Program Special Milk Program National School Lunch Program National School Lunch Program Federal Food Distribution Program
Subtotal Child Nutrition Cluster
Total U.S. Depanment of Agriculture
TOTAL FEDERAL AW ARDS
NIA - Not Available/Applicable
10.556 10.556 10.555 10.555 10.555
Grant or State Project Number
NIA
NIA NIA NIA NIA NIA
SCOTCH PLAINS-FANWOOD REGIONAL SCHOOL DISTRICT SCHEDULE OF EXPENDITURES OF FEDERAL AW ARDS
FOR THE FISCAL YEAR ENDED JUNE 30, 2014
Grant Period From To
711/13 6130/14 711/12 6130113 7/1/13 6/30114 7/1112 6/30/13 7/1/13 6130/14
Balance at June 30, 2013 Unearned
Program or Revenue/ Award (Accounts Due lo
Amount Receivable) Grantor
4,898 4,697 $
200,758 188,585
(303)
(12,769)
54,824 ---------(13,072)
(13,072)
$ (171.583) $ -0-
Carryover/ (Walkover) Cash
Amount Received
4,559 303
187,961 12,769 54,824
260,416
260,416
$ -0- $1,861,023
SEE ACCOMPANYING NOTES TO SCHEDULES OF EXPENDITURES OF FEDERAL AND STATE AWARDS
Budgetary Expenditures
(4,898)
(200,758)
(54,824) (260.480)
(260,480)
$ (1,835,884)
Schedule A 2 of2
Balance at June 30, 2014 (Accounts Unearned Due to
Receivable) Revenue Grantor
$ (339)
(12,797)
(13,136)
(13,136)
$ (146,444) $ -0- $ -0-
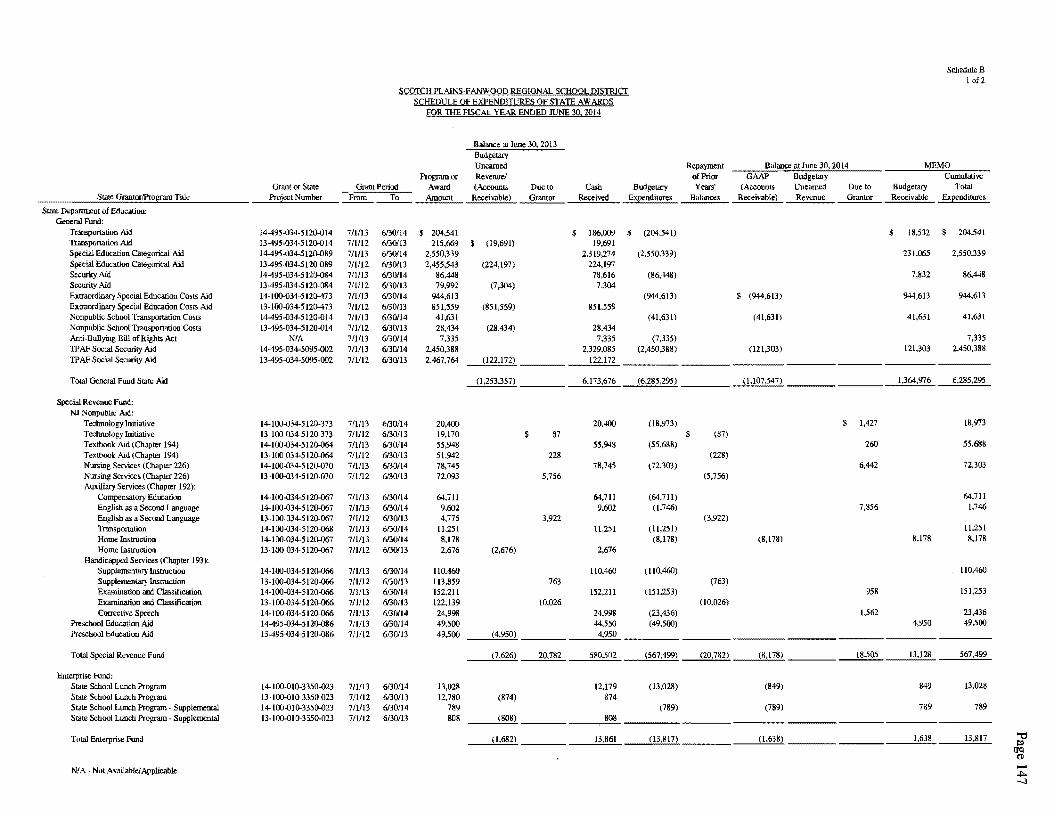
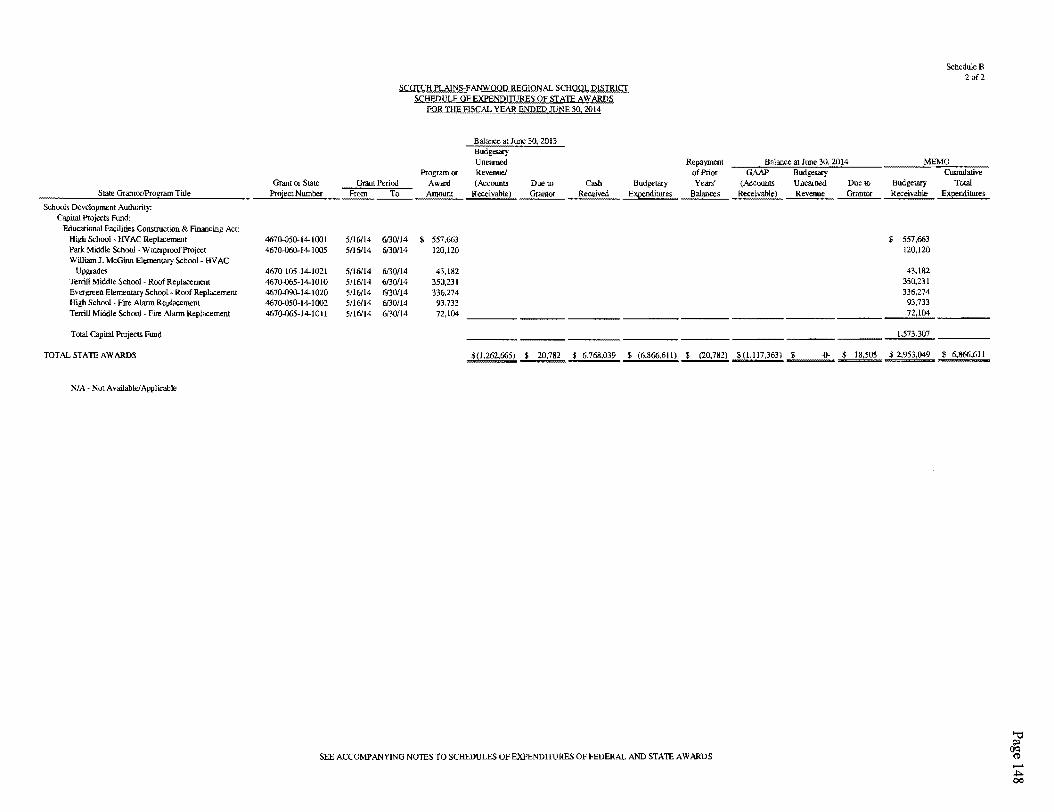
State Grantor/Program Title
Schools Development Authority: Capital Projects Fund:
Educational Facilities Construction & Financing Act: High School - HV AC Replacement Park Middle School - Waterproof Project William J. McGinn Elementary School - HV AC
Upgrades Terrill Middle School - Roof Replacement Evergreen Elementary School - Roof Replacement High School - Fire Alarm Replacement Terrill Middle School - Fire Alarm Replacement
Total Capital Projects Fund
mTALSTATEAWARDS
NI A - Not A vailablef Applicable
Grant or State Project Number
4670-050-14-1001 4670-060-14-1005
4670-105-14-1021 4670-065-14-1010 4670-090-14-1020 4670-050-14-1002 4670-065-14-10 II
SCOTCH PLAJNS-FANWOQD REGIONAL SCHOOL DISTRICT SCHEDULE OF EXPENDITIJRES OF STATE AW ARDS
FOR THE FISCAL YEAR ENDED JUNE 30, 2014
Program or
Balance at June 30, 2013 Budgetary Unearned Revenue!
Grant Period Award (Accounts Receivable)
Due to Cash Received From To Amount Grant or
5116114 6130/14 $ 557,663 5!16114 6130/14 120,120
5116114 6130114 43,182 5116114 6130114 350,231 5116114 6130/14 336,274 5116114 6130114 93,733 5116114 6130/14 72,104
Budgetary Expenditures
Repayment of Prior Years'
Balances
Balance at June 30, 2014 GAAP Budgetary
(Accounts Unearned Due to Receivable) Revenue Grant or
Budgetary Receivable
$ 557,663 120,120
43,182 350,231 336,274 93,733 72,104
1,573,307
ScheduleB 2of2
Total Expenditures
$ 18,505 $ 2,953,049 $(1,262,665) $ 20,782 $ 6,768,039 $ (6,866.611) $ (20,782) S(l.117,363) ---=----====.-.....;.,,=m.:.= ..... ..;:;...;;.:;;;=.;.;...
SEE ACCOMPANYING NOTES TO SCHEDULES OF EXPENDITURES OF FEDERAL AND STATE AW ARDS
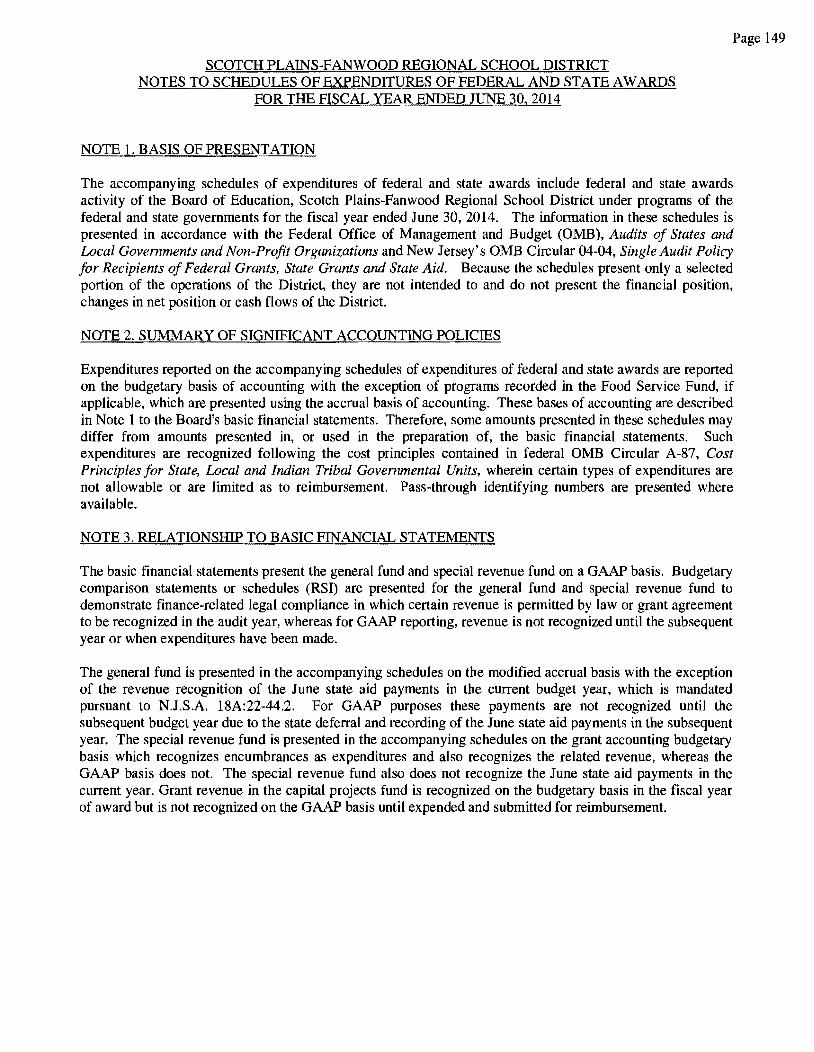
SCOTCH PLAINS-FANWOOD REGIONAL SCHOOL DISTRICT NOTES TO SCHEDULES OF EXPENDITURES OF FEDERAL AND STATE AW ARDS
FOR THE FISCAL YEAR ENDED JUNE 30, 2014
NOTE 1. BASIS OF PRESENTATION
Page 149
The accompanying schedules of expenditures of federal and state awards include federal and state awards activity of the Board of Education, Scotch Plains-Fanwood Regional School District under programs of the federal and state governments for the fiscal year ended June 30, 2014. The information in these schedules is presented in accordance with the Federal Office of Management and Budget (OMB), Audits of States and Local Governments and Non-Profit Organizations and New Jersey's OMB Circular 04-04, Single Audit Policy for Recipients of Federal Grants, State Grants and State Aid. Because the schedules present only a selected portion of the operations of the District, they are not intended to and do not present the financial position, changes in net position or cash flows of the District.
NOTE 2. SUMMARY OF SIGNIFICANT ACCOUNTING POLICIES
Expenditures reported on the accompanying schedules of expenditures of federal and state awards are reported on the budgetary basis of accounting with the exception of programs recorded in the Food Service Fund, if applicable, which are presented using the accrual basis of accounting. These bases of accounting are described in Note 1 to the Board's basic financial statements. Therefore, some amounts presented in these schedules may differ from amounts presented in, or used in the preparation of, the basic financial statements. Such expenditures are recognized following the cost principles contained in federal OMB Circular A-87, Cost Principles for State, Local and Indian Tribal Governmental Units, wherein certain types of expenditures are not allowable or are limited as to reimbursement. Pass-through identifying numbers are presented where available.
NOTE 3. RELATIONSHIP TO BASIC FINANCIAL STATEMENTS
The basic financial statements present the general fund and special revenue fund on a GAAP basis. Budgetary comparison statements or schedules (RSI) are presented for the general fund and special revenue fund to demonstrate finance-related legal compliance in which certain revenue is permitted by law or grant agreement to be recognized in the audit year, whereas for GAAP reporting, revenue is not recognized until the subsequent year or when expenditures have been made.
The general fund is presented in the accompanying schedules on the modified accrual basis with the exception of the revenue recognition of the June state aid payments in the current budget year, which is mandated pursuant to N.J.S.A. 18A:22-44.2. For GAAP purposes these payments are not recognized until the subsequent budget year due to the state deferral and recording of the June state aid payments in the subsequent year. The special revenue fund is presented in the accompanying schedules on the grant accounting budgetary basis which recognizes encumbrances as expenditures and also recognizes the related revenue, whereas the GAAP basis does not. The special revenue fund also does not recognize the June state aid payments in the current year. Grant revenue in the capital projects fund is recognized on the budgetary basis in the fiscal year of award but is not recognized on the GAAP basis until expended and submitted for reimbursement.
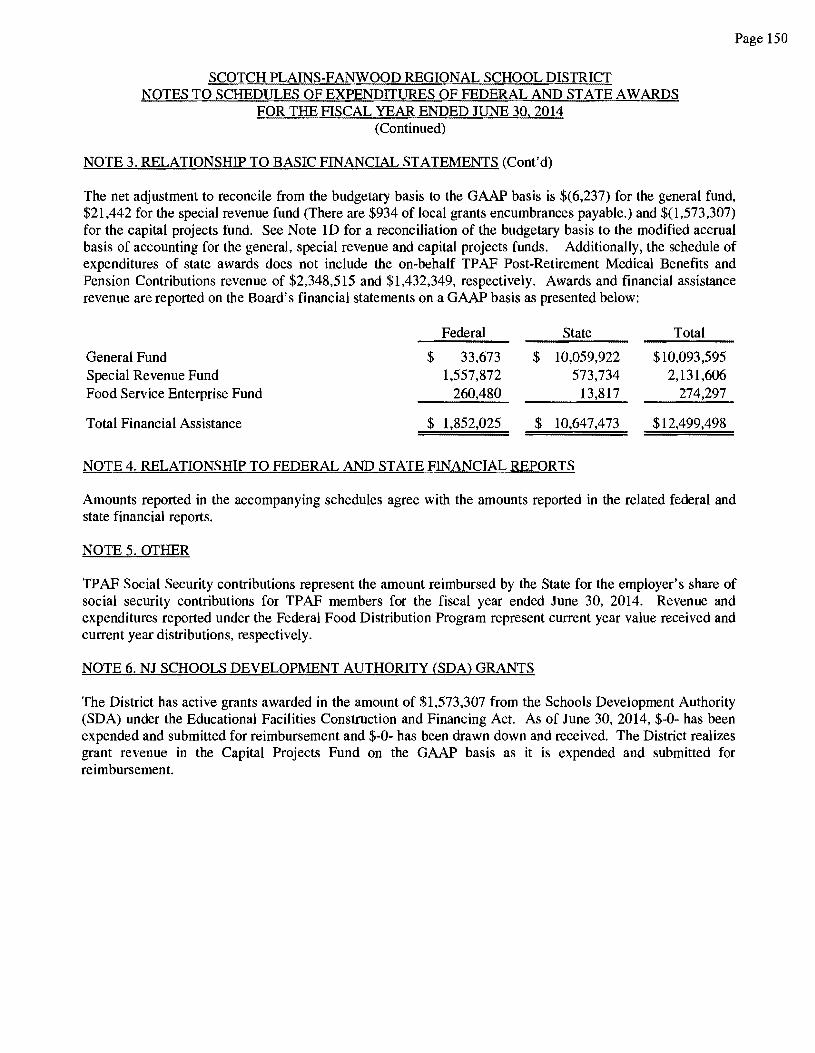
SCOTCH PLAINS-FANWOOD REGIONAL SCHOOL DISTRICT NOTES TO SCHEDULES OF EXPENDITURES OF FEDERAL AND STATE AW ARDS
FOR THE FISCAL YEAR ENDED JUNE 30, 2014 (Continued)
NOTE 3. RELATIONSHIP TO BASIC FINANCIAL STATEMENTS (Cont'd)
Page 150
The net adjustment to reconcile from the budgetary basis to the GAAP basis is $(6,237) for the general fund, $21,442 for the special revenue fund (There are $934 of local grants encumbrances payable.) and $(1,573,307) for the capital projects fund. See Note ID for a reconciliation of the budgetary basis to the modified accrual basis of accounting for the general, special revenue and capital projects funds. Additionally, the schedule of expenditures of state awards does not include the on-behalf TP AF Post-Retirement Medical Benefits and Pension Contributions revenue of $2,348,515 and $1,432,349, respectively. Awards and financial assistance revenue are reported on the Board's financial statements on a GAAP basis as presented below:
Federal State Total
General Fund $ 33,673 $ 10,059,922 $10,093 ,595 Special Revenue Fund 1,557,872 573,734 2,131,606 Food Service Enterprise Fund 260,480 13,817 274,297
Total Financial Assistance $ 1,852,025 $ 10,647,473 $12,499,498
NOTE 4. RELATIONSHIP TO FEDERAL AND STATE FINANCIAL REPORTS
Amounts reported in the accompanying schedules agree with the amounts reported in the related federal and state financial reports.
NOTE 5. OTHER
TP AF Social Security contributions represent the amount reimbursed by the State for the employer's share of social security contributions for TPAF members for the fiscal year ended June 30, 2014. Revenue and expenditures reported under the Federal Food Distribution Program represent current year value received and current year distributions, respectively.
NOTE 6. NJ SCHOOLS DEVELOPMENT AUTHORITY (SDA) GRANTS
The District has active grants awarded in the amount of $1,573,307 from the Schools Development Authority (SDA) under the Educational Facilities Construction and Financing Act. As of June 30, 2014, $-0- has been expended and submitted for reimbursement and $-0- has been drawn down and received. The District realizes grant revenue in the Capital Projects Fund on the GAAP basis as it is expended and submitted for reimbursement.
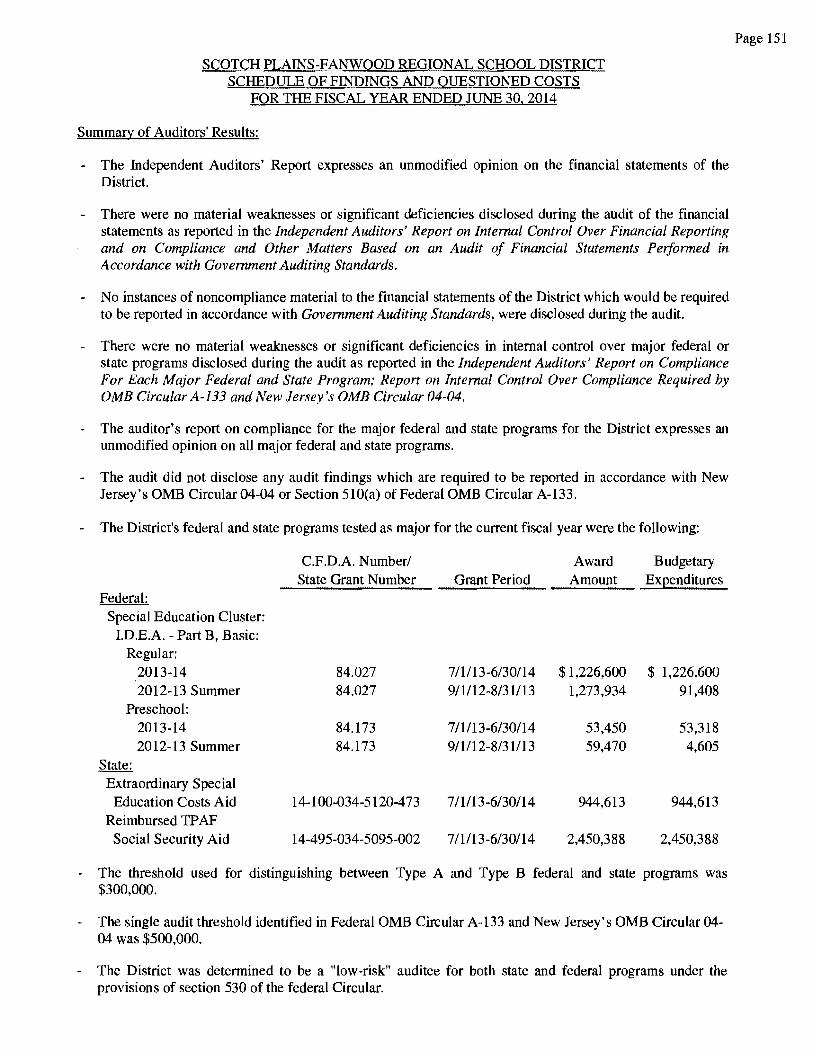
SCOTCH PLAINS-FANWOOD REGIONAL SCHOOL DISTRICT SCHEDULE OF FINDINGS AND QUESTIONED COSTS
FQR THE FISCAL YEAR ENDED JUNE 30, 2014
Summary of Auditors' Results:
- The Independent Auditors' Report expresses an unmodified opinion on the fjnancial statements of the District.
- There were no material weaknesses or significant deficiencies disclosed during the audit of the financial statements as reported in the Independent Auditors' Report on Internal Control Over Financial Reporting and on Compliance and Other Matters Based on an Audit of Financial Statements Performed in Accordance with Government Auditing Standards.
- No instances of noncompliance material to the financial statements of the District which would be required to be reported in accordance with Government Auditing Standards, were disclosed during the audit.
- There were no material weaknesses or significant deficiencies in internal control over major federal or state programs disclosed during the audit as reported in the Independent Auditors' Report on Compliance For Each Major Federal and State Program; Report on Internal Control Over Compliance Required by OMB Circular A-133 and New Jersey's OMB Circular04-04.
- The auditor's report on compliance for the major federal and state programs for the District expresses an unmodified opinion on all major federal and state programs.
- The audit did not disclose any audit findings which are required to be reported in accordance with New Jersey's OMB Circular 04-04 or Section 510(a) of Federal OMB Circular A-133.
- The District's federal and state programs tested as major for the current fiscal year were the following:
Federal: Special Education Cluster:
I.D.E.A. - Part B, Basic: Regular:
2013-14 2012-13 Summer
Preschool: 2013-14 2012-13 Summer
State: Extraordinary Special Education Costs Aid
Reimbursed TP AF Social Security Aid
C.F.D.A. Number/ State Grant Number
84.027 84.027
84.173 84.173
14-100-034-5120-473
14-495-034-5095-002
Grant Period
7/1/13-6/30/14 9/1112-8/31113
7/1113-6/30/14 9/1112-8/31113
7 /1113-6/30/14
7/1113-6/30/14
Award Amount
$1,226,600 1,273,934
53,450 59,470
944,613
2,450,388
Budgetary Expenditures
$ 1,226,600 91,408
53,318 4,605
944,613
2,450,388
- The threshold used for distinguishing between Type A and Type B federal and state programs was $300,000.
- The single audit threshold identified in Federal OMB Circular A-133 and New Jersey's OMB Circular 04-04 was $500,000.
- The District was determined to be a "low-risk" auditee for both state and federal programs under the provisions of section 530 of the federal Circular.
Page 151
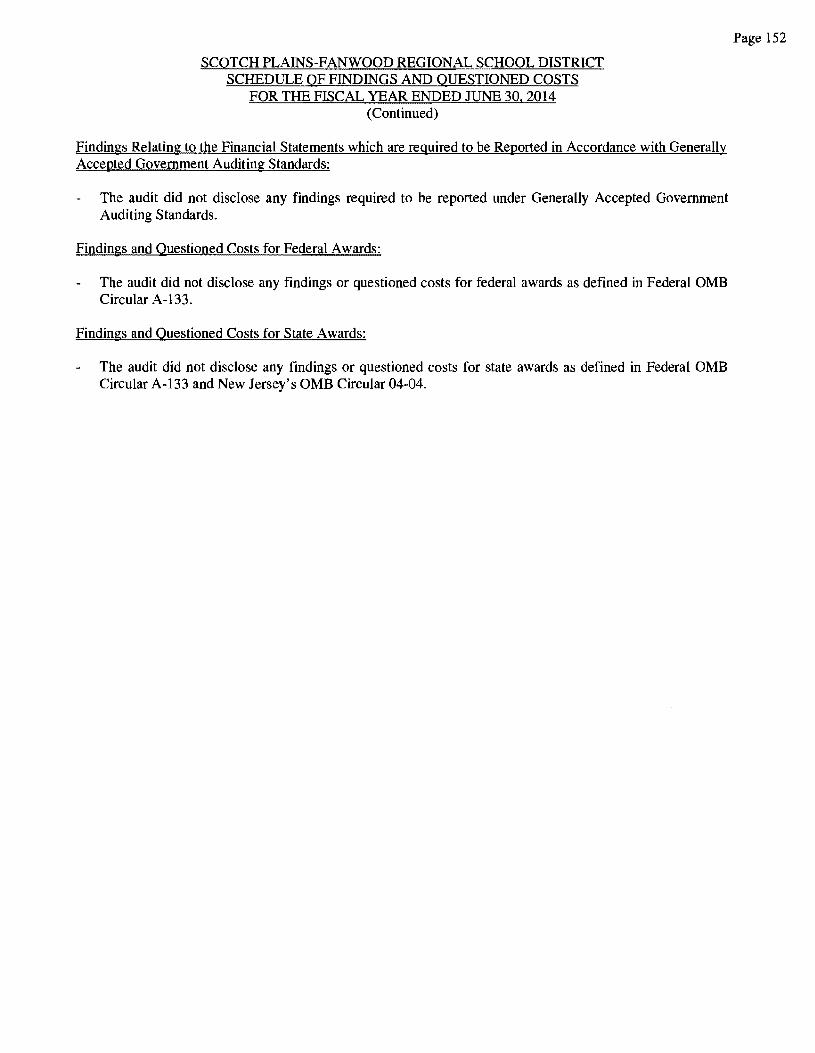
SCOTCH PLAINS-FANWOOD REGIONAL SCHOOL DISTRICT SCHEDULE OF FINDINGS AND QUESTIONED COSTS
FOR THE FISCAL YEAR ENDED JUNE 30, 2014 (Continued)
Findings Relating to the Financial Statements which are reguired to be Reported in Accordance with Generally Accepted Government Auditing Standards:
The audit did not disclose any findings required to be reported under Generally Accepted Government Auditing Standards.
Findings and Questioned Costs for Federal Awards:
The audit did not disclose any findings or questioned costs for federal awards as defined in Federal OMB Circular A-133.
Findings and Questioned Costs for State Awards:
The audit did not disclose any findings or questioned costs for state awards as defined in Federal QMB Circular A-133 and New Jersey's OMB Circular 04-04.
Page 152
SCOTCH PLAINS-FANWOOD REGIONAL SCHOOL DISTRICT SUMMARY SCHEDULE OF PRIOR AUDIT FINDINGS
FOR THE FISCAL YEAR ENDED JUNE 30, 2014
Status of Prior Year Findings:
The District had no prior year audit findings.
Page 153