scotia mutual funds
TRANSCRIPT

Cash Equivalent FundsScotia T-Bill Fund (Class A units only)Scotia Premium T-Bill Fund (Class A units only)Scotia Money Market Fund (Class A and Class I units only) Scotia CanAm® U.S. $ Money Market Fund (Class A units only)
Income FundsScotia Canadian Bond Index Fund (Class I units available) Scotia Mortgage Income Fund (Class I units available) Scotia Canadian Income Fund (Class I units available)Scotia CanAm U.S. $ Income Fund Scotia CanGlobal Income Fund (Class I units available)
Balanced FundsScotia Diversified Monthly Income Fund Scotia Canadian Balanced FundScotia Total Return Fund
Scotia Selected™ FundsScotia Selected Income & Modest Growth FundScotia Selected Balanced Income & Growth FundScotia Selected Conservative Growth FundScotia Selected Conservative Growth RSP FundScotia Selected Aggressive Growth FundScotia Selected Aggressive Growth RSP Fund
Scotia Partners Portfolios®
Scotia Partners™ Income & Modest Growth PortfolioScotia Partners Balanced Income & Growth PortfolioScotia Partners Conservative Growth PortfolioScotia Partners Aggressive Growth Portfolio
Scotia Vision™ FundsScotia Vision Conservative 2010 Fund (Class A units only)Scotia Vision Aggressive 2010 Fund (Class A units only)Scotia Vision Conservative 2015 Fund (Class A units only)Scotia Vision Aggressive 2015 Fund (Class A units only)Scotia Vision Conservative 2020 Fund (Class A units only)Scotia Vision Aggressive 2020 Fund (Class A units only)Scotia Vision Conservative 2030 Fund (Class A units only)Scotia Vision Aggressive 2030 Fund (Class A units only)
Equity Funds Canadian Equity FundsScotia Canadian Stock Index Fund (Class I units available)Scotia Canadian Dividend Fund (Class I units available)Scotia Canadian Blue Chip Fund (Class I units available)Scotia Canadian Growth Fund (Class I units available)Scotia Canadian Small Cap Fund (Class I units available)Scotia Resource Fund
Foreign Equity FundsScotia American Stock Index Fund (Class I units available)Scotia American Growth Fund (Class I units available)Scotia CanAm Stock Index FundScotia Nasdaq Index Fund Scotia Young Investors® Fund (Class A units only)Scotia International Stock Index Fund
(Class I units available) Scotia Global Growth Fund (Class I units available)Scotia European Growth FundScotia Pacific Rim Growth Fund (Class I units available)Scotia Latin American Growth Fund (Class I units available)
Capital International Series FundsCapital U.S. Large Companies FundCapital U.S. Large Companies RSP FundCapital U.S. Small Companies FundCapital U.S. Small Companies RSP FundCapital International Large Companies FundCapital International Large Companies RSP FundCapital Global Discovery FundCapital Global Discovery RSP FundCapital Global Small Companies FundCapital Global Small Companies RSP Fund
This is a simplified prospectus with respect to theoffering of Class A units of Scotia Vision Conservative2010 Fund, Scotia Vision Aggressive 2010 Fund,Scotia Vision Conservative 2015 Fund, Scotia VisionAggressive 2015 Fund, Scotia Vision Conservative2020 Fund, Scotia Vision Aggressive 2020 Fund, ScotiaVision Conservative 2030 Fund and Scotia VisionAggressive 2030 Fund and with respect to the offeringof Class A and Class F units of Scotia DiversifiedMonthly Income Fund. This is an amended andrestated simplified prospectus with respect to theoffering of Class I units of Scotia Money Market Fund,Scotia Canadian Bond Index Fund, Scotia CanadianStock Index Fund, Scotia Canadian Blue Chip Fund,Scotia American Stock Index Fund, Scotia GlobalGrowth Fund, Scotia Pacific Rim Growth Fund andScotia Latin American Growth Fund.
No changes are being made with respect to any of theother funds.
No securities regulatory authority has expressed anopinion about these units. It is an offence to claimotherwise.
The Scotia Mutual Funds and the units they offerunder this simplified prospectus are not registeredwith the U.S. Securities and Exchange Commission.Units of the funds may be offered and sold in theUnited States only in reliance on exemptions fromregistration.
Scotia® Mutual FundsSimplified Prospectus Dated June 10, 2005 and Amended and Restated Simplified Prospectus DatedJune 10, 2005 Amending and Restating the Simplified Prospectus Dated October 29, 2004, asAmended on December 17, 2004 and on May 27, 2005
Class A and Class F units (unless otherwise noted) and Class I units where noted

Table of contentsIntroduction .......................................................... i Fund-specific information ....................................... 1
Cash Equivalent FundsScotia T-Bill Fund ..................................................... 6 Scotia Money Market Fund ........................................ 10
Scotia Premium T-Bill Fund ......................................... 8 Scotia CanAm U.S. $ Money Market Fund..................... 12
Income FundsScotia Canadian Bond Index Fund................................ 16 Scotia CanAm U.S. $ Income Fund .............................. 26
Scotia Mortgage Income Fund .................................... 19 Scotia CanGlobal Income Fund.................................... 29
Scotia Canadian Income Fund ..................................... 23
Balanced FundsScotia Diversified Monthly Income Fund ........................ 34 Scotia Partners Balanced Income & Growth Portfolio ........ 63
Scotia Canadian Balanced Fund................................... 36 Scotia Partners Conservative Growth Portfolio ................ 66
Scotia Total Return Fund ............................................ 39 Scotia Partners Aggressive Growth Portfolio ................... 69
Scotia Selected Funds Scotia Vision Funds
Scotia Selected Income & Modest Growth Fund .............. 42 Scotia Vision Conservative 2010 Fund........................... 72
Scotia Selected Balanced Income & Growth Fund ............ 45 Scotia Vision Aggressive 2010 Fund ............................. 74
Scotia Selected Conservative Growth Fund..................... 48 Scotia Vision Conservative 2015 Fund........................... 76
Scotia Selected Conservative Growth RSP Fund ............... 51 Scotia Vision Aggressive 2015 Fund ............................. 78
Scotia Selected Aggressive Growth Fund ....................... 54 Scotia Vision Conservative 2020 Fund........................... 80
Scotia Selected Aggressive Growth RSP Fund.................. 57 Scotia Vision Aggressive 2020 Fund ............................. 82
Scotia Vision Conservative 2030 Fund........................... 84Scotia Partners Portfolios
Scotia Vision Aggressive 2030 Fund ............................. 86Scotia Partners Income & Modest Growth Portfolio.......... 60
Equity Funds
Canadian Equity Funds
Scotia Canadian Stock Index Fund ............................... 90 Scotia European Growth Fund..................................... 125
Scotia Canadian Dividend Fund ................................... 93 Scotia Pacific Rim Growth Fund................................... 128
Scotia Canadian Blue Chip Fund.................................. 96 Scotia Latin American Growth Fund ............................. 130
Scotia Canadian Growth Fund .................................... 99Capital International Series Funds
Scotia Canadian Small Cap Fund ................................. 102Capital U.S. Large Companies Fund.............................. 133
Scotia Resource Fund ................................................ 105Capital U.S. Large Companies RSP Fund ........................ 136
Foreign Equity Funds Capital U.S. Small Companies Fund.............................. 139
Scotia American Stock Index Fund ............................... 108 Capital U.S. Small Companies RSP Fund ........................ 142
Scotia American Growth Fund .................................... 110 Capital International Large Companies Fund .................. 145
Scotia CanAm Stock Index Fund .................................. 113 Capital International Large Companies RSP Fund............. 148
Scotia Nasdaq Index Fund .......................................... 115 Capital Global Discovery Fund..................................... 151
Scotia Young Investors Fund ....................................... 118 Capital Global Discovery RSP Fund ............................... 154
Scotia International Stock Index Fund ........................... 120 Capital Global Small Companies Fund........................... 157
Scotia Global Growth Fund ........................................ 123 Capital Global Small Companies RSP Fund ..................... 160
What is a mutual fund and what are the risks of Fees and expenses ................................................. 177
investing in a mutual fund? ................................. 163 Dealer compensation ............................................. 181
Organization and management of the Dealer compensation from management fees ........... 183
Scotia Mutual Funds ........................................... 168 Income tax considerations for investors ................... 183
Purchases, switches and redemptions....................... 170 What are your legal rights? .................................... 184
Optional services ................................................... 173 Additional information ........................................... 184

I n t r o d u c t i o n
In this document, we, us, and our refer to Scotia Securities Inc.
Scotiabank Group includes The Bank of Nova Scotia (Scotiabank),
Montreal Trust, National Trust, The Bank of Nova Scotia Trust
Company (Scotiatrust) and Scotia Capital Inc.
This simplified prospectus contains selected important information to
help you make an informed investment decision about the Scotia
Mutual Funds and to understand your rights as an investor.
It’s divided into two parts. The first part, from pages 1 to 162,
contains specific information about each of the Scotia Mutual Funds.
The second part, from pages 163 to 185, contains general
information that applies to all of the Scotia Mutual Funds.
Additional information about each fund is available in its annual
information form, its most recently filed annual and interim financial
statements and its most recently filed annual and interim manage-
rated by reference into this simplified prospectus. That means they
legally form part of this simplified prospectus just as if they were
printed in it.
You can get a copy of the funds’ annual information form, financial
statements, including a statement of portfolio transactions, and,
when available, management reports of fund performance at no
charge by calling 1-800-268-9269 (416-750-3863 in Toronto) for
English, or 1-800-387-5004 for French, or by asking your mutual
fund representative. You’ll also find this simplified prospectus, the
fund performance on the Internet at www.scotiabank.com.
These documents and other information about the funds are also
available at www.sedar.com.
i
ment reports of fund performance. These documents are incorpo-
financial statements and, when available, the management reports of

Specific information about each of the mutual funds described
in this document
Scotia Mutual Funds is a family of 63 no-load mutual funds in Under current law, if you hold more than the permittedfour categories: Cash Equivalent, Income, Balanced (including foreign content in your registered plan, a penalty tax maythe Scotia Partners Portfolios, Scotia Selected Funds and apply. The foreign content limit doesn’t apply to RESPs. OnScotia Vision Funds) and Equity (including the Capital February 23, 2005, the Minister of Finance (Canada) an-International Series Funds). All of the Scotia Mutual Funds nounced as part of the Federal Budget that the foreignoffered for sale under this simplified prospectus offer Class A property limit in the Tax Act will be repealed effective as ofunits. Some of the funds also offer Class F units, Scotia 2005. As of the date of this simplified prospectus, this measurePrivate Client units and Class I units. Only Class A, Class F has not been passed into law and there can be no assuranceand Class I units are offered for sale under this simplified that it will be passed into law.prospectus.
What does the fund invest in?The classes have different management fees and are intendedfor different investors. Class A units are available to all This section tells you the fund’s fundamental investmentinvestors. Class F units are generally available only to objectives and the strategies it uses in trying to achieve thoseinvestors who have fee-based accounts with ScotiaMcLeod, a objectives. Any change to the fundamental investment objec-division of Scotia Capital Inc. We may make Class F units tives must be approved by a majority of votes cast at aavailable to other investors from time to time. Scotia Private meeting of unitholders called for that purpose.Client units are for investors who have signed a discretionary
About derivativesinvestment management agreement with Scotia Cassels Invest-ment Counsel Limited or Scotiatrust. Class I units are not
Derivatives are investments that derive their value from theavailable to the general public. You’ll find more information
price of another investment or from anticipated movements inabout the different classes of units on page 170.
interest rates, currency exchange rates or market indexes.Derivatives are usually contracts with another party to buy or
About the fund descriptionssell an asset at a later time and at a set price. Examples ofderivatives are options and forward contracts.On the following pages, you’ll find detailed descriptions of
each of the Scotia Mutual Funds to help you make your ) Options give holders the right, but not the obligation, to buyinvestment decisions. Here’s what each section of the fund or sell an asset, such as a security or currency, at a setdescriptions tells you: price and a set time. Option holders normally pay the other
party a cash payment, called a premium, for agreeing toFund details give them the option.
) Forward contracts are agreements to buy or sell an asset,This section gives you some basic information about eachsuch as a security or currency, at a set price and a setfund, such as when it was established and its eligibility fortime. The parties have to complete the deal, or sometimesregistered plans, including Registered Retirement Savingsmake or receive a cash payment, even if the price hasPlans (RRSPs), Registered Retirement Income Funds (RRIFs),changed by the time the deal closes.and Registered Education Savings Plans (RESPs).
A fund can use derivatives as long as it uses them in a wayAll of the funds are, or are expected to be, eligiblethat’s consistent with the fund’s investment objectives andinvestments for registered plans. In certain cases, we maywith Canadian securities regulations. All of the funds may userestrict purchases of units of certain funds by certainderivatives to hedge their investments against losses fromregistered plans.changes in currency exchange rates, interest rates and stock
Some of the funds are considered foreign property for market prices. Some of the funds may also use derivatives toregistered plans other than RESPs. The Income Tax Act gain exposure to financial markets or to invest indirectly in(Canada) (the Tax Act) limits the amount of foreign property securities or other assets. This can be less expensive thanyou can hold in these registered plans. The limit is currently buying securities or assets directly.30% of the cost of the investments in your registered plan.
1

When a fund uses derivatives for purposes other than hedging, Funds, the mutual funds from the Scotia Mutual Funds familyit holds enough cash or money market instruments to fully make up a large portion of the Funds’ investments.cover its positions, as required by securities regulations.
The Scotia Partners Portfolios, Scotia Selected Funds andScotia Vision Funds give you:About the RSP Funds) strategic asset allocation
The RSP Funds are designed to provide exposure above the) geographic diversificationforeign content limit while remaining 100% eligible for) portfolio advisor style diversificationregistered plans. Each of the RSP Funds, other than the Scotia
Selected Conservative Growth RSP Fund and Scotia Selected ) ongoing oversight of the asset mix and fund selectionAggressive Growth RSP Fund, currently does this by investing
) foreign content monitoring and ongoing portfolio rebalancingin units of a mutual fund that’s considered foreign property
to ensure that the appropriate long-term asset mix is(called the underlying fund) up to the foreign content limit
maintained.and by using forward contracts and other derivatives that arelinked to the performance of the underlying fund. They may The selection of underlying funds for the Scotia Partnersplace the balance of their assets on deposit with one or more Portfolios, Scotia Selected Funds and Scotia Vision Funds isCanadian financial institutions or may invest in Canadian subject to a multi-step investment process.money market instruments to cover their positions in the
Prior to recommending a fund for the Scotia Partnersderivatives.Portfolios, a team of analysts at ScotiaMcLeod researches
Each of these RSP Funds enters into the forward contracts hundreds of mutual funds each year and in most cases meetswith a financial institution called a counterparty. The fund with their portfolio managers. When recommending a mutualand the counterparty make payments to each other under the fund, the team attempts to gain a thorough understanding offorward contracts. The payments are based on the price of the the portfolio management process, style and discipline, theunderlying fund and on the cost of the forward contracts. mandate of the fund and the risks inherent in that mandate
and style of management.These RSP Funds will enter into forward contracts with TheBank of Nova Scotia, the parent company of Scotia Securities The creation of the Scotia Selected Funds began with anInc. The Bank of Nova Scotia may act as a counterparty to the analysis of the Scotia Mutual Funds lineup, and the portfolioRSP Funds if the terms and conditions of the forward advisors responsible for the funds. Then, working fromcontracts are at least as favourable as the terms and predetermined asset mixes, each designed for different typesconditions of forward contracts that The Bank of Nova Scotia of investors with different risk/reward characteristics, efficiententers into with comparable unrelated mutual funds. The RSP combinations of various funds were created. The ScotiaFunds must engage an independent accounting firm to review Selected Funds hold a portfolio of other mutual funds selectedthe forward contracts and make this assessment before the largely from the Scotia Mutual Funds lineup, diversified onfirst forward contract is executed and on each simplified multiple levels by asset class, market capitalization, geographyprospectus renewal or pricing amendment to the forward and investment style and can include both passive and activecontracts. investment strategies.
Similar to the Scotia Selected Funds, the creation of theInvesting in other mutual fundsScotia Vision Funds began with an analysis of the available
The Scotia Partners Portfolios, Scotia Selected Funds and funds and their portfolio advisors. The asset allocation forScotia Vision Funds provide investors with professionally each fund was professionally designed to be diversified onmanaged solutions designed to suit their investment profile. multiple levels to emphasize a balanced total return whileUnlike most mutual funds, which invest in individual securi- minimizing risk. In addition, each Scotia Vision Fund isties, each of the Scotia Partners Portfolios, Scotia Selected monitored on an ongoing basis to ensure appropriate diversifi-Funds and Scotia Vision Funds invests in a mix of other cation. Its asset allocation strategy is professionally adjusted tomutual funds. The mutual funds included in the Scotia become more conservative as its target date approaches. ThePartners Portfolios are offered by some of the most prominent Scotia Vision funds are ideally suited to investors who have amutual fund families in Canada, including the Scotia Mutual defined financial goal and a defined time horizon in which toFunds. For the Scotia Selected Funds and the Scotia Vision realize their goal.
2

Scotia Capital Inc. reviews the Scotia Partners Portfolios, the funds may only rely on the exemption in accordance withScotia Selected Funds and the Scotia Vision Funds and plays a certain conditions imposed by the regulators.key role in monitoring the underlying funds and the asset
The funds may expand their participation in affiliated dealermixes on an ongoing basis.underwritings if permitted to do so by the regulators.
The Capital International Series Funds invest some or all oftheir assets in other mutual funds. Top 10 holdings
Some of the other funds may invest a portion of their assets This is a list of the fund’s 10 largest investments atin other mutual funds from time to time. When deciding to September 30, 2004. The list will change as the portfolioinvest in other mutual funds, the portfolio advisor may advisor buys and sells securities. You can get the most recentconsider a variety of criteria, including management style, list by calling 1-800-268-9269 (416-750-3863 in Toronto) forinvestment performance and consistency, risk attributes and English, 1-800-387-5004 for French, or from the Internet atthe quality of the fund’s manager or portfolio advisor. www.scotiabank.com. Top 10 holdings aren’t shown for cash
equivalent funds or if a fund is new.Funds that engage in repurchase and reverse repurchasetransactions What are the risks of investing in the fund?
Some of the funds may enter into repurchase or reverse This section tells you the risks of investing in the fund. You’llrepurchase agreements to generate additional income from find a description of each risk in Specific risks of mutualsecurities held in a fund’s portfolio. When a mutual fund funds on page 164.agrees to sell a security at one price and buy it back on aspecified later date at a lower price, it is entering into a Who should invest in this fund?repurchase transaction. When a mutual fund agrees to buy a
This section can help you decide if the fund might be suitablesecurity at one price and sell it back on a specified later datefor your portfolio. It’s meant as a general guide only. Forat a higher price, it is entering into a reverse repurchaseadvice about your portfolio, you should consult your mutualtransaction. For a description of the strategies the funds usefund representative. If you don’t have a mutual fundto minimize the risks associated with these transactions, seerepresentative, you can speak with one of our representativesthe discussion under Repurchase and reverse repurchaseat any Scotiabank branch or by calling a ScotiaMcLeod office.transaction risk on page 166.
Past performanceFunds that lend their securities
Past performance is no guarantee of how a fund will performSome of the funds may enter into securities lending transac-in the future, but it can give you an idea of how volatile thetions to generate additional income from securities held in afund has been in the past. Volatility is a measure of how oftenfund’s portfolio. A mutual fund may lend securities held in itsand by how much the price of a fund changes. It’s also aportfolio to qualified borrowers who provide adequate collat-measure of risk. The higher the volatility, the greater the risk.eral. For a description of the strategies the funds use toThe information in the charts and tables:minimize the risks associated with these transactions, see the
discussion under Securities lending risk on page 166. ) shows the performance of Class A units of all the funds andthe performance of Class F and Class I units if a fund offers
Funds that are advised by our affiliates Class F or Class I units and if they were sold to the publicbefore October 29, 2003Funds that are advised by our affiliates have received an
exemption from the Canadian securities regulators that allows ) assumes that all distributions are reinvested in additionalthem to invest in certain debt securities that they would have units of the fund. If you hold your units in a non-registeredbeen prohibited from investing in without this exemption. As a account, distributions you receive are taxable. For moreresult, these funds may acquire non-government debt securi- information, see Income tax considerations for investorsties underwritten by our affiliates during the offering of these ) doesn’t take into account any optional charges or incomesecurities or at anytime during the 60 day period following taxes, which would reduce your returns.completion of the offering. These funds may also purchase or
The year-by-year return bar chart shows in percentage termssell non-government and government debt securities in thehow much an investment held on January 1 in each yearsecondary market from, or to, one of our affiliates. These
3

would have increased or decreased by December 31 of that management fees and other expenses during the year. Theyear. MER is shown at an annualized rate if the financial year is
less than 12 months. The method of calculating the MER ofThe overall past performance line graph shows how a $10,000 mutual funds was changed by securities regulators oninvestment in the fund would have changed in value for the February 1, 2000. Some expenses, such as taxes and interest,indicated number of years, compared with one or more are now included in the calculation.indexes. Indexes include reinvested income but not fees.
The annual compound returns table shows the historical Portfolio turnover rateannual compound returns for the periods indicated, compared
Portfolio turnover rate indicates how often the portfoliowith the same indexes as the line graph.advisor bought and sold securities for the fund, excluding
If a fund is new, no past performance information is available. securities having maturity dates at acquisition of one year orless. A portfolio turnover rate of 100% is the same as the fund
Distribution policy buying and selling all of the securities in its portfolio onceduring the year. In general, the higher the portfolio turnover
This tells you when the fund usually distributes any income rate, the higher the fund’s trading costs in that year and theand capital gains to unitholders. The funds may make greater the chance that you’ll receive a distribution of capitaldistributions at other times. gains. Distributions of capital gains and income are taxable if
you hold the fund outside a registered plan. There is notDistributions on units held in Scotia registered plans andnecessarily a relationship between portfolio turnover rate andCopilot non-registered accounts are always reinvested infund performance. Portfolio turnover rate isn’t shown for cashadditional units of the fund. Distributions on units held inequivalent funds.other registered plans and non-registered accounts are rein-
vested in additional units of the fund, unless you tell us inFund expenses indirectly borne by investorswriting that you want to receive cash distributions by cheque
or by deposit to your bank account. For information about how This is an example of how much the fund might pay indistributions are taxed, see Income tax considerations for expenses. It is intended to help you compare the cost ofinvestors. investing in the fund with the cost of investing in other
mutual funds. Each fund pays its own expenses, but theyFinancial highlights affect you because they reduce the fund’s returns.The tables in this section show selected key financial The table shows how much the fund would pay in expenses oninformation about the fund for the past five years (or less if a $1,000 investment with a 5% annual return. The informationthe fund is less than five years old). If a fund does not offer in the tables assumes that the fund’s MER was the sameClass F or Class I units or did not distribute Class F or Class I throughout each period shown as it was during its lastunits prior to December 31, 2003, no financial information is completed financial year. If a fund does not offer Class F oravailable for that Class. If a fund is new, no financial Class I units or did not distribute Class F or Class I unitshighlights are available. The information in the tables: prior to December 31, 2003, no fund expenses information is) is based on the fund’s audited annual financial statements available for that Class. If a fund is new, no fund expense
information is available. You’ll find more information about) is at December 31 for each yearfees and expenses in Fees and expenses starting on page 177.
) assumes that all distributions are reinvested.
You can get a copy of the audited financial statements bycalling 1-800-268-9269 (416-750-3863 in Toronto) for English,1-800-387-5004 for French, or from the Internet atwww.scotiabank.com. You can also write to us at the addresson the back cover of this simplified prospectus.
Management expense ratio
The management expense ratio (MER) shows the percentageof the fund’s daily average net assets that was paid in
4

Cash Equivalent Funds
Scotia T-Bill Fund
Scotia Premium T-Bill Fund
Scotia Money Market Fund
Scotia CanAm U.S. $ Money Market Fund
The cash equivalent funds aim to provide safety plus interestincome. They have the lowest risk of the Scotia Mutual Fundsbecause they invest in very high quality short-term investments,such as treasury bills and other money market instruments.These funds are managed to attempt to maintain a constantunit value. Interest income will vary with short-term interestrates.
Cash equivalent funds can add stability and liquidity to yourportfolio. They’re also a good choice if you need quick accessto your money or are looking for an alternative to other short-term investments or a savings account.
5
Cas
h Eq
uiva
lent
Fun
ds

Scotia T-Bill FundFund details The fund aims to maintain a constant unit value of $10.00
by crediting income and capital gains daily and distribut-Fund type Canadian money market fund
ing them monthly.Date established October 3, 1991
Type of securities Class A units of a mutual fund trust The fund may participate in repurchase, reverse repur-Eligible for Yes. Units of the fund are not foreign chase and securities lending transactions to achieve theregistered plans? property.
fund’s overall investment objectives and to enhance thePortfolio advisor Scotia Cassels Investment CounselLimited fund’s returns. You’ll find more information about repur-
chase, reverse repurchase and securities lending transac-tions on page 3.
What does the fund invest in?
Investment objectives What are the risks of investing in the fund?
The fund’s objective is to provide income and liquidity, The main risk of investing in this fund is interest ratewhile maintaining a high level of safety. It invests risk.primarily in Government of Canada treasury bills and
The fund may have these additional risks:other short-term debt instruments guaranteed by theGovernment of Canada. ) derivative risk
) repurchase and reverse repurchase transaction riskAny change to the fundamental investment objectivesmust be approved by a majority of votes cast at a meeting ) securities lending risk.of unitholders called for that purpose.
You’ll find details about each of these risks starting onpage 164.Investment strategies
The fund aims to maintain a constant unit value ofThe fund invests in securities with a maturity of up to$10.00, but there’s a risk the price could change.one year. The average term to maturity of the fund’s
investments can vary between 30 and 90 days.Who should invest in this fund?
The portfolio advisor uses interest rate and yield curveThis fund may be suitable for you if:analysis to select individual investments and to manage) you want interest income and liquidity with a high levelthe fund’s average term to maturity. It may also use
of safetyderivatives such as options and futures to adjust thefund’s average term to maturity. It will only use ) you’re investing for the short termderivatives as permitted by securities regulations.
) you’re looking for low risk and safety of principal.
6
SC
OT
IA T
-B
ILL
FU
ND
CA
SH
EQ
UIV
AL
EN
T F
UN
DS

Past performance at December 31 Financial highlights at December 31
Distributions and net asset value per unitThis section shows how the fund has performed in thepast and gives you an idea of the risk involved. These 1999 2000 2001 2002 2003
Distributionsfigures don’t tell you how the fund will perform in thefrom net income $ 0.37 0.44 0.34 0.14 0.17future.from realized gain $ – – – – –
return of capital $ – – – – –Year-by-year returnsTotal annual distributions $ 0.37 0.44 0.34 0.14 0.17
This chart shows the fund’s annual performance, which Net asset value per unit $ 10.00 10.00 10.00 10.00 10.00
changes from year to year.% Ratios and supplemental data10
1999 2000 2001 2002 20038
Net assets (000’s) $ 326,375 276,467 438,706 392,375 329,5146.20%
6 Number of units4.50% outstanding (000’s) 32,638 27,647 43,871 39,238 32,9514.30%
3.80% 3.80% 3.80%4 3.50%MER1 % 1.07 1.07 1.07 1.11 1.13
2.20% 1 We may from time to time absorb some of the operating expenses that1.73%2 1.40%the fund would otherwise pay. In 2003, the management expense ratioof the fund would have been 1.20% had we not absorbed some of0
1994 1995 1996 1997 1998 1999 2000 2001 2002 2003 these expenses.
Distribution policy Fund expenses indirectly borne by investors
The fund distributes any income by the last business day This example shows the fund’s expenses on a $1,000of each month. It distributes any capital gains by the last investment with a 5% annual return.business day of each calendar year.
Fees and expensespayable over 1 year 3 years 5 years 10 yearsDistributions on units held in Scotia registered plans and
$ 11.58 36.51 64.00 145.68Copilot non-registered accounts are always reinvested inadditional units of the fund. Distributions on units held inother registered plans and non-registered accounts arereinvested in additional units of the fund, unless you tellus in writing that you want to receive cash distributionsby cheque or by deposit to your bank account.
7
SC
OT
IA T
-B
ILL
FU
ND
CA
SH
EQ
UIV
AL
EN
T F
UN
DS

Scotia Premium T-Bill FundFund details The fund aims to maintain a constant unit value of $10.00
by crediting income and capital gains daily and distribut-Fund type Canadian money market fund
ing them monthly.Date established July 10, 1992
Type of securities Class A units of a mutual fund trust The fund may participate in repurchase, reverse repur-Eligible for Yes. Units of the fund are not foreign chase and securities lending transactions to achieve theregistered plans? property.
fund’s overall investment objectives and to enhance thePortfolio advisor Scotia Cassels Investment CounselLimited fund’s returns. You’ll find more information about repur-
chase, reverse repurchase and securities lending transac-tions on page 3.
What does the fund invest in?
Investment objectives What are the risks of investing in the fund?
The fund’s objective is to provide income and liquidity, The main risk of investing in this fund is interest ratewhile maintaining a high level of safety. It invests risk. The fund may have these additional risks:primarily in Government of Canada treasury bills and
) derivative riskother short-term debt instruments guaranteed by the
) repurchase and reverse repurchase transaction riskGovernment of Canada.) securities lending risk.
The fund pays a rebate, called a management feedistribution, of 0.20% when the value of the fund within You’ll find details about each of these risks starting onan account is $250,000 to $1 million and 0.35% when the page 164.value of the fund within an account is more than $1
The fund aims to maintain a constant unit value ofmillion. If you are eligible for a management fee$10.00, but there’s a risk the price could change.distribution, you can expect to realize more income from
the fund than you would otherwise realize.Who should invest in this fund?
Any change to the fundamental investment objectivesThis fund may be suitable for you if:must be approved by a majority of votes cast at a meeting) you have at least $100,000 to invest in the fundof unitholders called for that purpose.) you want interest income with a high level of safety
Investment strategies and liquidity
) you’re investing for the short termThe fund invests in securities with a maturity of up toone year. The average term to maturity of the fund’s ) you’re looking for low risk and safety of principal.investments can vary between 30 and 90 days.
The portfolio advisor uses interest rate and yield curveanalysis to select individual investments and to managethe fund’s average term to maturity. It may also usederivatives such as options and futures to adjust thefund’s average term to maturity. It will only usederivatives as permitted by securities regulations.
8
SC
OT
IA P
RE
MIU
M T
-B
ILL
FU
ND
CA
SH
EQ
UIV
AL
EN
T F
UN
DS

Past performance at December 31 Financial highlights at December 31
Distributions and net asset value per unitThis section shows how the fund has performed in thepast and gives you an idea of the risk involved. These 1999 2000 2001 2002 2003
Distributionsfigures don’t tell you how the fund will perform in thefrom net income $ 0.42 0.49 0.39 0.20 0.23future.from realized gain $ – – – – –
return of capital $ – – – – –Year-by-year returnsTotal annual distributions $ 0.42 0.49 0.39 0.20 0.23
This chart shows the fund’s annual performance, which Net asset value per unit $ 10.00 10.00 10.00 10.00 10.00
changes from year to year.% Ratios and supplemental data10
1999 2000 2001 2002 20038
Net assets (000’s) $ 857,438 978,467 2,139,410 1,880,791 1,751,8916.60%
6 Number of units5.00%
4.50% outstanding (000’s) 85,744 97,847 213,941 188,079 175,1894.30% 4.30% 4.30% 4.00%4
MER % 0.56 0.56 0.55 0.55 0.552.70%2.32%2.00%
2
Fund expenses indirectly borne by investors01994 1995 1996 1997 1998 1999 2000 2001 2002 2003
This example shows the fund’s expenses on a $1,000Distribution policy investment with a 5% annual return.
The fund distributes any income by the last business day Fees and expensespayable over 1 year 3 years 5 years 10 yearsof each month. It distributes any capital gains by the last
$ 5.64 17.77 31.15 70.91business day of each calendar year.
Distributions on units held in Scotia registered plans andCopilot non-registered accounts are always reinvested inadditional units of the fund. Distributions on units held inother registered plans and non-registered accounts arereinvested in additional units of the fund, unless you tellus in writing that you want to receive cash distributionsby cheque or by deposit to your bank account.
9
SC
OT
IA P
RE
MIU
M T
-B
ILL
FU
ND
CA
SH
EQ
UIV
AL
EN
T F
UN
DS

Scotia Money Market FundFund details The fund aims to maintain a constant unit value of $10.00
by crediting income and capital gains daily and distribut-Fund type Canadian money market fund
ing them monthly.Date established August 30, 1990
Type of securities Class A and Class I units of a mutual The fund may participate in repurchase, reverse repur-fund trust
chase and securities lending transactions to achieve theEligible for Yes. Units of the fund are not foreign
fund’s overall investment objectives and to enhance theregistered plans? property.
Portfolio advisor Scotia Cassels Investment Counsel fund’s returns. You’ll find more information about repur-Limited chase, reverse repurchase and securities lending transac-
tions on page 3.What does the fund invest in?
What are the risks of investing in the fund?Investment objectives
The main risks of investing in this fund are:The fund’s objective is to provide income and liquidity,
) interest rate riskwhile maintaining a high level of safety. It investsprimarily in high quality, short-term fixed income securi- ) credit risk.ties issued by Canadian federal, provincial and municipal
The fund may have these additional risks:governments, Canadian chartered banks and trust compa-) derivative risknies, and corporations.) class riskAny change to the fundamental investment objectives) repurchase and reverse repurchase transaction riskmust be approved by a majority of votes cast at a meeting
of unitholders called for that purpose. ) underlying fund risk
) securities lending risk.Investment strategies
You’ll find details about each risk starting on page 164.The fund invests in securities with a maturity of up toone year and a credit rating of R1 or better by Dominion The fund aims to maintain a constant unit value ofBond Rating Service Limited (DBRS), or an equivalent $10.00, but there’s a risk the price could change.rating by another approved rating agency. The averageterm to maturity of the fund’s investments can vary Who should invest in this fund?between 30 and 90 days.
This fund may be suitable for you if:The portfolio advisor uses interest rate, yield curve and
) you want interest income and liquidity with a high levelcredit analysis to select individual investments and to of safetymanage the fund’s average term to maturity. It may also
) you’re investing for the short termuse derivatives such as options and futures to adjust the) you’re looking for low risk and safety of principal.fund’s average term to maturity. It will only use
derivatives as permitted by securities regulations.
10
SC
OT
IA M
ON
EY
MA
RK
ET
FU
ND
CA
SH
EQ
UIV
AL
EN
T F
UN
DS

Past performance at December 31 Financial highlights at December 31
Distributions and net asset value per unitThis section shows how the fund has performed in thepast and gives you an idea of the risk involved. These 1999 2000 2001 2002 2003
Distributionsfigures don’t tell you how the fund will perform in thefrom net income $ 0.39 0.46 0.35 0.16 0.20future.from realized gain $ – – – – –
return of capital $ – – – – –Year-by-year returnsTotal annual distributions $ 0.39 0.46 0.35 0.16 0.20
This chart shows the fund’s annual performance, which Net asset value per unit $ 10.00 10.00 10.00 10.00 10.00
changes from year to year.% Ratios and supplemental data10
1999 2000 2001 2002 20038
Net assets (000’s) $ 791,766 780,483 1,322,632 1,298,955 1,252,6906.20%
6 Number of units4.70% outstanding (000’s) 79,177 78,048 132,263 129,896 125,2694.20% 4.00% 4.00%3.80% 3.60%4
MER1 % 1.07 1.07 1.07 1.11 1.142.30% 2.04% 1 We may from time to time absorb some of the operating expenses that1.60%2
the fund would otherwise pay. In 2003, the management expense ratioof the fund would have been 1.16% had we not absorbed some of0
1994 1995 1996 1997 1998 1999 2000 2001 2002 2003 these expenses.
Distribution policy Fund expenses indirectly borne by investors
The fund distributes any income by the last business day This example shows the fund’s expenses on a $1,000of each month. It distributes any capital gains by the last investment with a 5% annual return.business day of each calendar year.
Fees and expensespayable over 1 year 3 years 5 years 10 yearsDistributions on units held in Scotia registered plans and
$ 11.69 36.84 64.57 146.97Copilot non-registered accounts are always reinvested inadditional units of the fund. Distributions on units held inother registered plans and non-registered accounts arereinvested in additional units of the fund, unless you tellus in writing that you want to receive cash distributionsby cheque or by deposit to your bank account.
11
SC
OT
IA M
ON
EY
MA
RK
ET
FU
ND
CA
SH
EQ
UIV
AL
EN
T F
UN
DS

Scotia CanAm U.S. $ Money Market FundFund details The fund aims to maintain a constant unit value of
US$10.00 by crediting income and capital gains daily andFund type U.S. money market fund
distributing them monthly.Date established September 3, 1996
Type of securities Class A units of a mutual fund trust The fund may participate in repurchase, reverse repur-Eligible for Yes. Units of the fund are not foreign chase and securities lending transactions to achieve theregistered plans? property.
fund’s overall investment objectives and to enhance thePortfolio advisor Scotia Cassels Investment CounselLimited fund’s returns. You’ll find more information about repur-
chase, reverse repurchase and securities lending transac-tions on page 3.
What does the fund invest in?
Investment objectives What are the risks of investing in the fund?
The fund’s objective is to provide income and liquidity, The main risks of investing in this fund are:while maintaining a high level of safety. It invests
) currency riskprimarily in treasury bills and other money market
) interest rate riskinstruments that are denominated in U.S. dollars and areissued by Canadian federal, provincial and municipal ) credit risk.governments and corporations, and by supranational
The fund may have these additional risks:entities, such as the World Bank. These securities aren’t) derivative riskconsidered foreign property under the Tax Act.) class riskAny change to the fundamental investment objectives) repurchase and reverse repurchase transaction riskmust be approved by a majority of votes cast at a meeting
of unitholders called for that purpose. ) securities lending risk.
You’ll find details about each risk starting on page 164.Investment strategies
The fund aims to maintain a constant unit value ofThe fund invests in securities with a maturity of up toUS$10.00, but there’s a risk the price could change.one year and a credit rating of R1 or better by DBRS, or
an equivalent rating by another approved rating agency.Who should invest in this fund?The average term to maturity of the fund’s investments
can vary between 30 and 90 days. This fund may be suitable for you if:The portfolio advisor uses interest rate, yield curve and ) you want interest income, exposure to the U.S. dollarcredit analysis to select individual investments and to and liquidity with a high level of safetymanage the fund’s average term to maturity. It may also
) you’re investing for the short termuse derivatives such as options and futures to adjust the
) you’re looking for low risk and safety of principal.fund’s average term to maturity. It will only usederivatives as permitted by securities regulations.
12
SC
OT
IA C
AN
AM
U.S
. $
MO
NE
Y M
AR
KE
T F
UN
DC
AS
H E
QU
IVA
LE
NT
FU
ND
S

Past performance at December 31 Financial highlights at December 31
Distributions and net asset value per unitThis section shows how the fund has performed in thepast and gives you an idea of the risk involved. These 1999 2000 2001 2002 2003
Distributionsfigures don’t tell you how the fund will perform in thefrom net income US$ 0.41 0.53 0.33 0.07 0.01future.from realized gain US$ – – – – –
return of capital US$ – – – – –Year-by-year returnsTotal annual distributions US$ 0.41 0.53 0.33 0.07 0.01
This chart shows the fund’s annual performance, which Net asset value per unit US$10.00 10.00 10.00 10.00 10.00
changes from year to year.% Ratios and supplemental data10
1999 2000 2001 2002 20038
Net assets (000’s) US$ 49,553 50,889 116,348 131,191 110,0186 5.40% Number of units
4.60% 4.60% outstanding (000’s) 4,955 5,089 11,635 13,119 11,0024.10%4 3.40% MER1 % 1.07 1.07 1.14 1.14 1.11
1 We may from time to time absorb some of the operating expenses that2 1.40%the fund would otherwise pay. In 2003, the management expense ratio0.75%
0.14% of the fund would have been 1.15% had we not absorbed some of01996 1997 1998 1999 2000 2001 2002 2003 these expenses.
All figures in US$
Fund expenses indirectly borne by investorsDistribution policy
This example shows the fund’s expenses on a $1,000The fund distributes any income by the last business day
investment with a 5% annual return.of each month. It distributes any capital gains by the lastbusiness day of each calendar year. Fees and expenses
payable over 1 year 3 years 5 years 10 years
Distributions on units held in Scotia registered plans and $ 11.38 35.87 62.87 143.11
Copilot non-registered accounts are always reinvested inadditional units of the fund. Distributions on units held inother registered plans and non-registered accounts arereinvested in additional units of the fund, unless you tellus in writing that you want to receive cash distributionsby cheque or by deposit to your bank account.
13
SC
OT
IA C
AN
AM
U.S
. $
MO
NE
Y M
AR
KE
T F
UN
DC
AS
H E
QU
IVA
LE
NT
FU
ND
S


Income Funds
Scotia Canadian Bond Index Fund
Scotia Mortgage Income Fund
Scotia Canadian Income Fund
Scotia CanAm U.S. $ Income Fund
Scotia CanGlobal Income Fund
The income funds aim to offer the potential for higher interestincome than the cash equivalent funds. They invest primarily inhigh quality fixed income securities such as bonds, mortgagesand dividend-paying shares. These funds are riskier than cashequivalent funds because they’re more sensitive to changes ininterest rates and the creditworthiness of issuers.
Income funds can add income potential to your portfolio.They’re also a good choice if you want higher income in themedium to long term and can accept possible declines in thevalue of your investment in the short term.
15
Inco
me
Fund
s

Scotia Canadian Bond Index FundFund details fund’s returns. You’ll find more information about repur-
chase, reverse repurchase and securities lending transac-Fund type Canadian bond fund
tions on page 3.Date established November 8, 1999
Type of securities Class A, Class F and Class I units of amutual fund trust Top 10 holdings at September 30, 2004
Eligible for Yes. Units of the fund are not foreignregistered plans? property. Government of Canada 6.00% 060108 3.61%
Portfolio advisor State Street Global Advisors, Ltd. Government of Canada 5.25% 060113 3.29%
Canada Housing Trust 4.40% 031508 2.96%
Government of Canada 6.00% 060111 2.31%What does the fund invest in?Government of Canada 5.75% 060133 2.08%
Investment objectivesGovernment of Canada 8.00% 060123 2.06%
The fund’s objective is to provide a high level of regular Government of Canada 8.00% 060127 2.05%
interest income and modest capital gains by tracking the Canada Housing Trust 4.65% 091509 1.70%performance of a generally recognized Canadian bond Government of Canada 5.75% 060129 1.68%index, currently the Scotia Capital (SC) Universe Bond Government of Canada 5.75% 090106 1.50%Index. It invests primarily in:
) bonds and treasury bills issued by Canadian federal, What are the risks of investing in the fund?provincial and municipal governments and Canadian
The main risks of investing in this fund are:corporations) interest rate risk) money market instruments issued by Canadian corpora-
tions, including commercial paper and bankers’ ) credit riskacceptances.
) index riskAny change to the fundamental investment objectives ) concentration riskmust be approved by a majority of votes cast at a meeting
) liquidity risk.of unitholders called for that purpose.
The fund may have these additional risks:Investment strategies ) derivative risk
The portfolio advisor aims to track the performance of the ) repurchase and reverse repurchase transaction riskSC Universe Bond Index as closely as possible by: ) securities lending risk) investing in fixed income securities that have similar ) underlying fund risk.
characteristics to the securities that are included inYou’ll find details about each risk starting on page 164.the SC Universe Bond Index
) keeping the portfolio as fully invested as possibleWho should invest in this fund?
) minimizing transaction costs.This fund may be suitable for you if:
The portfolio advisor may use derivatives such as options) you want a high level of regular interest income whileand futures to adjust the fund’s average term to maturity,
tracking the performance of a major Canadian bondto gain exposure to income-producing securities and toindexhedge against changes in interest rates. It will only use
) you’re investing for at least three yearsderivatives as permitted by securities regulations.) you can accept low-to-medium risk.The fund may participate in repurchase, reverse repur-
chase and securities lending transactions to achieve thefund’s overall investment objectives and to enhance the
16
SC
OT
IA C
AN
AD
IAN
BO
ND
IN
DE
X F
UN
DIN
CO
ME
FU
ND
S

mately 900 Canadian federal, provincial, municipal and corporate bondsPast performance at December 31rated BBB or higher. The average term to maturity is 9.51 years and theaverage duration is 6.03 years.This section shows how the fund has performed in the
past and gives you an idea of the risk involved. TheseAnnual compound returnsfigures don’t tell you how the fund will perform in the
future. This table shows the fund’s annual compound returns,compared with the SC Universe Bond Index.Year-by-year returns Since
1 year 3 years inceptionThese charts show the fund’s annual performance, whichScotia Canadian Bond Index Fundchanges from year to year.Class A units % 5.46 6.53 6.91
% Class A Units Class F units % – – 8.83110
9.06% SC Universe Bond Index % 6.69 7.83 2
8 1 September 18, 20037.32%6.83% 2 Class A units 8.14% and Class F units 12.95%
6 5.46%
4 Distribution policy
2 The fund distributes any income by the last business day0.20% of each month. It distributes any capital gains in01999 2000 2001 2002 2003
December of each calendar year.% Class F Units10 Distributions on units held in Scotia registered plans and8.83%
Copilot non-registered accounts are always reinvested in8
additional units of the fund. Distributions on units held in6
other registered plans and non-registered accounts are4 reinvested in additional units of the fund, unless you tell
us in writing that you want to receive cash distributions2
by cheque or by deposit to your bank account.0
2003** Sept. 18, 2003 to Dec. 31, 2003
Financial highlights, Class A unitsOverall past performance at December 31
Distributions and net asset value per unitThis chart shows how a $10,000 investment in the fundwould have changed in value, compared with the Scotia
19991 2000 2001 2002 2003Capital (SC) Universe Bond Index. Distributions
from net income $ 0.06 0.59 0.57 0.53 0.51
from realized gain $ – – – – –
return of capital $ – – – – –
Total annual distributions $ 0.06 0.59 0.57 0.53 0.51
Net asset value per unit $ 9.97 10.25 10.36 10.57 10.62
Ratios and supplemental data
19991 2000 2001 2002 2003
Net assets (000’s) $ 23,520 56,862 67,424 72,238 79,980
Number of unitsoutstanding (000’s) 2,359 5,547 6,508 6,837 7,531
MER1 % 0.86 0.93 1.02 1.22 1.15
Portfolio turnover rate % – 33.08 45.25 41.83 24.941 These figures are for the period from September 20, 1999 to
Scotia Canadian Bond Index Fund
SC Universe Bond Index
Class A Units
Class F Units(a) SC Universe Bond Index
(b) Scotia Canadian Bond Index Fund
$10,214(b)$10,309(a)
Dec.1999
Dec.2000
Dec.2001
Dec.2003
Dec.2002
$
$13,854
$13,208
Nov. 81999
0
10,000
20,000
December 31, 1999.The SC Universe Bond Index is a broad measure of the total return ofCanadian bonds that mature in more than one year. It includes approxi-
17
SC
OT
IA C
AN
AD
IAN
BO
ND
IN
DE
X F
UN
DIN
CO
ME
FU
ND
S

Financial highlights, Class F unitsat December 31
Distributions and net asset value per unit
1999 2000 2001 2002 20032
Distributions
from net income $ – – – – 0.17
from realized gain $ – – – – –
return of capital $ – – – – –
Total annual distributions $ – – – – 0.17
Net asset value per unit $ – – – – 10.62
Ratios and supplemental data
1999 2000 2001 2002 20032
Net assets (000’s) $ – – – – 26
Number of unitsoutstanding (000’s) – – – – 2
MER3 % – – – – 0.64
Portfolio turnover rate % – – – – 24.942 These figures are for the period from September 18, 2003 to
December 31, 2003.3 We may from time to time absorb some of the operating expenses that
the fund would otherwise pay. In 2003, the management expense ratioof the fund would have been 2.03% had we not absorbed some ofthese expenses.
Fund expenses indirectly borne by investors
This example shows the fund’s expenses on a $1,000investment with a 5% annual return.
Fees and expensespayable over 1 year 3 years 5 years 10 years
Class A units $ 11.79 37.16 65.13 148.26
Class F units $ 6.56 20.68 36.25 82.51
18
SC
OT
IA C
AN
AD
IAN
BO
ND
IN
DE
X F
UN
DIN
CO
ME
FU
ND
S

Scotia Mortgage Income FundFund details hedge against changes in interest rates. It will only useFund type Canadian mortgage fund derivatives as permitted by securities regulations.Date established November 30, 1992
) temporarily invest the fund’s assets in cash or cash-Type of securities Class A, Class F and Class I units of a
equivalent securities to try to protect the fund during amutual fund trust
market downturn or for other reasons.Eligible for Yes. Units of the fund are not foreignregistered plans? property.
The fund may participate in repurchase, reverse repur-Portfolio advisor Scotia Cassels Investment CounselLimited chase and securities lending transactions to achieve the
fund’s overall investment objectives and to enhance thefund’s returns. You’ll find more information about repur-What does the fund invest in?chase, reverse repurchase and securities lending transac-
Investment objectives tions on page 3.
The fund’s objective is to provide regular interest income.Top 10 holdings at September 30, 2004It invests primarily in high quality mortgages on residen-
tial properties in Canada. These mortgages are:Mortgages of 6-month remaining maturity 28.42%
) insured or guaranteed by Canadian federal or provincial Mortgages of 4-year remaining maturity 22.12%governments, or their agencies, or Mortgages of 2-year remaining maturity 13.63%
) conventional first mortgages with loan-to-value ratios of Mortgages of 5-year remaining maturity 10.36%
no more than 75%, unless the excess is insured by an Mortgages of 7-year remaining maturity 7.68%
insurance company registered or licensed under federal Mortgages of 3-year remaining maturity 4.31%or provincial legislation. Mortgages of 1-year remaining maturity 1.69%
Any change to the fundamental investment objectivesWhat are the risks of investing in the fund?must be approved by a majority of votes cast at a meeting
of unitholders called for that purpose. The main risk of investing in this fund is interest raterisk.
Investment strategies
The fund may have these additional risks:The portfolio advisor uses interest rate and yield curve) credit riskanalysis to select individual investments and manage the
fund’s average term to maturity. Scotiabank will buy any ) foreign investment riskmortgage that is in default if it was purchased from
) currency riskScotia Mortgage Corporation. It will buy the mortgage at a
) derivative riskprice equal to the principal value plus any unpaid) class riskinterest. That means the fund doesn’t assume the risk of
default on these mortgages. ) repurchase and reverse repurchase transaction risk
) securities lending riskThe fund may invest up to 25% of its assets in fixedincome securities issued by Canadian federal, provincial ) underlying fund risk.and municipal governments, and by corporations. The
You’ll find details about each risk starting on page 164.fund can invest up to 25% of its assets in foreignsecurities. It can invest anywhere in the world, but
Who should invest in this fund?generally won’t invest in emerging markets.
This fund may be suitable for you if:The portfolio advisor may:) you want regular interest income) use derivatives such as options, futures and forward
contracts to adjust the fund’s average term to maturity, ) you’re investing for at least three yearsto gain exposure to income-producing securities and to
) you can accept low-to-medium risk.
19
SC
OT
IA M
OR
TG
AG
E I
NC
OM
E F
UN
DIN
CO
ME
FU
ND
S

Overall past performancePast performance at December 31
This chart shows how a $10,000 investment in the fundThis section shows how the fund has performed in thewould have changed in value, compared with the Scotiapast and gives you an idea of the risk involved. TheseCapital (SC) Universe Bond Index and the SC Mortgagefigures don’t tell you how the fund will perform in theMarket Index.future.
Year-by-year returns
These charts show the fund’s annual performance, whichchanges from year to year.% Class A Units15
13.05%
9.51%108.24%
6.50%5.65%
5 3.53% 3.44%3.00%1.81%
0-0.34%
-51994 1995 1996 1997 1998 1999 2000 2001 2002 2003
% Class F Units15
10
4.40% 4.28%4.24%5
$
Dec.1993
Dec.1994
Dec.1995
Dec.2001
$16,873
Scotia Mortgage Income Fund
SC Universe Bond Index
SC Mortgage Market Index
Class A Units
Class F Units
Class I Units
Dec.1996
Dec.1997
Dec.1998
Dec.1999
Dec.2000
Dec.2003
Dec.2002
$20,622$21,200
$11,354(c)
$11,983(b)$12,176(a)
$10,375(f)$10,476(e)$10,570(d)
(a) SC Universe Bond Index
(b) SC Mortgage Market Index
(c) Scotia Mortgage Income Fund
(d) SC Universe Bond Index
(e) SC Mortgage Market Index
(f) Scotia Mortgage Income Fund
0
10,000
5,000
15,000
20,000
25,000
0 The SC Universe Bond Index is a broad measure of the total return ofCanadian bonds that mature in more than one year. It includes approxi-mately 900 Canadian federal, provincial, municipal and corporate bonds-5
2001* 2002 2003 rated BBB or higher. The average term to maturity is 9.51 years and the* Aug. 14, 2001 to Dec. 31, 2001 average duration is 6.03 years.
The SC Mortgage Market Index represents yields on a sample of mortgages% Class I Units from Canadian chartered banks. The index assumes a 5-year term before10December 1980 and a 3-year term from December 1980, and anamortization period of 25 years.8
5.67%6
4
2
02003*
* April 28, 2003 to Dec. 31, 2003
20
SC
OT
IA M
OR
TG
AG
E I
NC
OM
E F
UN
DIN
CO
ME
FU
ND
S

Annual compound returns Ratios and supplemental data
1999 2000 2001 2002 2003This table shows the fund’s annual compound returns,Net assets (000’s) $ 394,581 322,313 411,108 408,201 421,126compared with the SC Universe Bond Index and theNumber of unitsSC Mortgage Market Index.outstanding (000’s) 37,609 30,259 37,413 37,473 38,943Since
1 year 3 years 5 years 10 years inception MER1 % 1.67 1.69 1.72 1.57 1.71Scotia Mortgage PortfolioIncome Fund turnover rate % 35.04 36.91 35.79 82.42 130.23Class A units % 3.44 5.05 4.68 5.37 1 We may from time to time absorb some of the operating expenses that
the fund would otherwise pay. In 2003, the management expense ratioClass F units % 4.28 – – – 5.591
of the fund would have been 1.75% had we not absorbed some ofClass I units % – – – – 5.672
these expenses.
SC UniverseBond Index % 6.69 7.83 6.44 7.80 3
Financial highlights, Class F unitsSC Mortgage
at December 31Market Index % 6.19 8.16 7.21 7.51 4
Distributions and net asset value per unit1 August 14, 20012 April 28, 20033 Class F units 8.80% and Class I units 8.67% 1999 2000 20012 2002 20034 Class F units 8.06% and Class I units 7.22%
Distributions
from net income $ – – 0.22 0.55 0.54Distribution policy from realized gain $ – – – – –
return of capital $ – – – – –The fund distributes any income by the last business dayTotal annual distributions $ – – 0.22 0.55 0.54of each month. It distributes any capital gains inNet asset value per unit $ – – 10.99 10.89 10.80
December of each calendar year.
Distributions on units held in Scotia registered plans and Ratios and supplemental dataCopilot non-registered accounts are always reinvested in
1999 2000 20012 2002 2003additional units of the fund. Distributions on units held inNet assets (000’s) $ – – 14 33 133
other registered plans and non-registered accounts areNumber of units
reinvested in additional units of the fund, unless you tell outstanding (000’s) – – 1 3 12
us in writing that you want to receive cash distributions MER3 % – – 0.67 0.85 0.95
by cheque or by deposit to your bank account. Portfolioturnover rate % – – 35.79 82.42 130.232 These figures are for the period from August 14, 2001 to December 31,
Financial highlights, Class A units 2001.at December 31 3 We may from time to time absorb some of the operating expenses that
the fund would otherwise pay. In 2003, the management expense ratioDistributions and net asset value per unitof the fund would have been 1.48% had we not absorbed some ofthese expenses.
1999 2000 2001 2002 2003
DistributionsFinancial highlights, Class I unitsfrom net income $ 0.50 0.50 0.52 0.47 0.45at December 31from realized gain $ – – – – –Distributions and net asset value per unitreturn of capital $ – – – – –
Total annual distributions $ 0.50 0.50 0.52 0.47 0.451999 2000 2001 2002 20034
Net asset value per unit $ 10.49 10.65 10.99 10.89 10.81Distributions
from net income $ – – – – 0.41
from realized gain $ – – – – –
return of capital $ – – – – –
Total annual distributions $ – – – – 0.41
Net asset value per unit $ – – – – 10.81
21
SC
OT
IA M
OR
TG
AG
E I
NC
OM
E F
UN
DIN
CO
ME
FU
ND
S
Ratios and supplemental data
1999 2000 2001 2002 20034
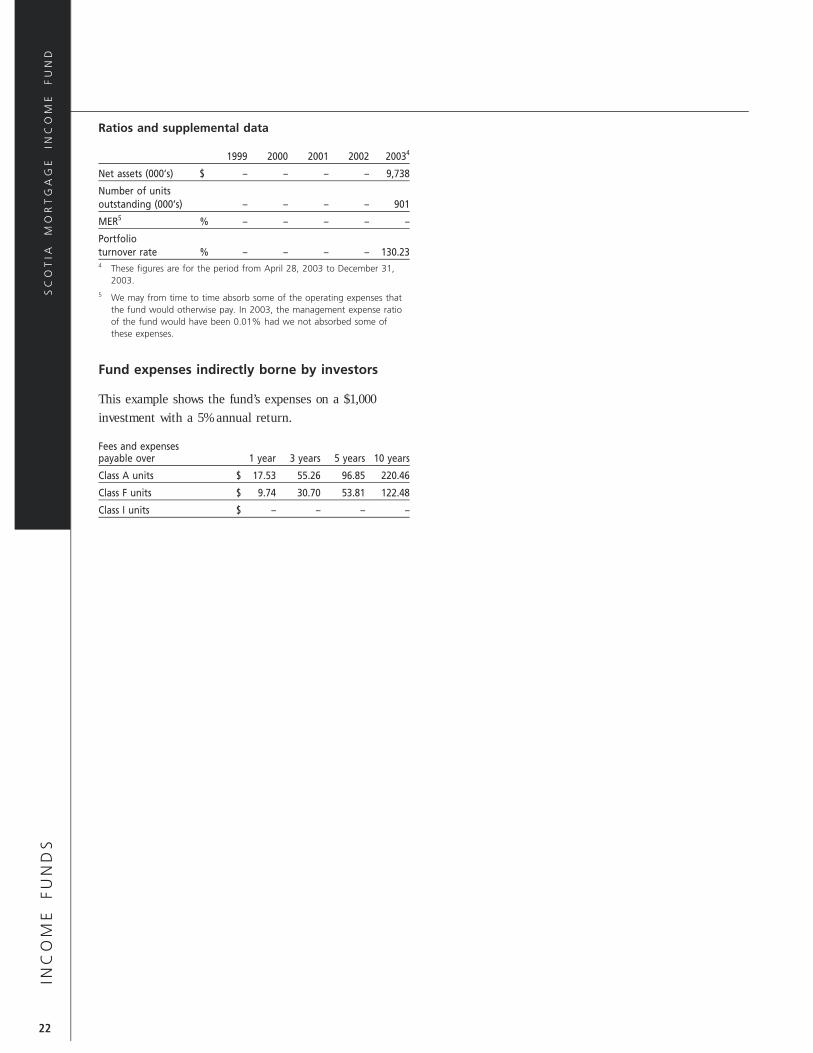
Net assets (000’s) $ – – – – 9,738
Number of unitsoutstanding (000’s) – – – – 901
MER5 % – – – – –
Portfolioturnover rate % – – – – 130.234 These figures are for the period from April 28, 2003 to December 31,
2003.5 We may from time to time absorb some of the operating expenses that
the fund would otherwise pay. In 2003, the management expense ratioof the fund would have been 0.01% had we not absorbed some ofthese expenses.
Fund expenses indirectly borne by investors
This example shows the fund’s expenses on a $1,000investment with a 5% annual return.
Fees and expensespayable over 1 year 3 years 5 years 10 years
Class A units $ 17.53 55.26 96.85 220.46
Class F units $ 9.74 30.70 53.81 122.48
Class I units $ – – – –
22
SC
OT
IA M
OR
TG
AG
E I
NC
OM
E F
UN
DIN
CO
ME
FU
ND
S

Scotia Canadian Income FundFund details The fund can invest in foreign securities up to the foreign
content limit. It can invest anywhere in the world, butFund type Canadian bond fund
generally won’t invest in emerging markets.Date established November 1957
Type of securities Class A, Class F and Class I units of a The portfolio advisor may:mutual fund trust
) use derivatives such as options, futures and forwardEligible for Yes. Units of the fund are not foreignregistered plans? property. contracts to adjust the fund’s average term to maturity,Portfolio advisor Scotia Cassels Investment Counsel to gain exposure to income-producing securities and to
Limitedhedge against changes in interest rates. It will only usederivatives as permitted by securities regulations.
What does the fund invest in?) temporarily invest the fund’s assets in cash or cash-
Investment objectives equivalent securities to try to protect the fund during amarket downturn or for other reasons.The fund’s objective is to provide a high level of regular
interest income and modest capital gains. It invests The portfolio advisor may actively trade the fund’sprimarily in: investments. This can increase trading costs, which may) bonds and treasury bills issued by Canadian federal, lower the fund’s returns. It also increases the chance that
provincial and municipal governments and Canadian you’ll receive taxable capital gains if you hold the fund incorporations a non-registered account.
) money market instruments issued by Canadian corpora- The fund may participate in repurchase, reverse repur-tions. These include commercial paper, bankers’ accept- chase and securities lending transactions to achieve theances, mortgage-backed securities and guaranteed fund’s overall investment objectives and to enhance theinvestment certificates fund’s returns. You’ll find more information about repur-
) high-quality dividend-paying shares of Canadian chase, reverse repurchase and securities lending transac-corporations. tions on page 3.
Any change to the fundamental investment objectivesTop 10 holdings at September 30, 2004
must be approved by a majority of votes cast at a meetingof unitholders called for that purpose. Government of Canada 8.00% 060123 18.15%
Government of Canada 5.00% 060114 14.79%Investment strategies
Government of Canada 3.00% 120105 13.98%
Securities with a maturity of one year or less will Province of Ontario 7.50% 011906 3.11%
generally have a credit rating of R1 or better by DBRS, or Royal Bank of Canada 5.00% 012014 2.48%an equivalent rating by another approved rating agency. Wells Fargo Finance Canada Corporation 6.05% 082712 2.43%Securities with a maturity of more than one year must Great-West Lifeco Inc. 6.67% 032133 2.35%have a credit rating of BBB or better by DBRS, or an
Merrill Lynch Financial Assets Inc. 5.25% 061213 2.30%equivalent rating by another approved rating agency.
Merrill Lynch Financial Assets Inc. 6.14% 041212 2.27%
Merrill Lynch Financial Assets Inc. 5.44% 031214 2.26%The average term to maturity of the fund’s investmentswill vary, depending on market conditions. The portfolioadvisor adjusts the average term to maturity to try to What are the risks of investing in the fund?maximize returns while minimizing interest rate risk.
The main risks of investing in this fund are:The portfolio advisor uses interest rate and yield curve
) interest rate riskanalysis to select individual investments and manage the
) credit risk.fund’s average term to maturity. It analyzes credit risk toidentify securities that offer the potential for higher yieldsat an acceptable level of risk.
23
SC
OT
IA C
AN
AD
IAN
IN
CO
ME
FU
ND
INC
OM
E F
UN
DS

% Class I UnitsThe fund may have these additional risks: 3025.95%
) foreign investment risk 25
20) currency risk15) derivative risk10
) class risk 5.81%5
) repurchase and reverse repurchase transaction risk0
2002* 2003) securities lending risk * Dec. 9, 2002 to Dec. 31, 2002
) underlying fund risk.Overall past performance
You’ll find details about each risk starting on page 164.This chart shows how a $10,000 investment in the fund
Who should invest in this fund? would have changed in value, compared with the ScotiaCapital (SC) Universe Bond Index.This fund may be suitable for you if:
) you want a high level of regular interest income
) you’re investing for at least three years
) you can accept low-to-medium risk.
Past performance at December 31
This section shows how the fund has performed in thepast and gives you an idea of the risk involved. Thesefigures don’t tell you how the fund will perform in thefuture.
Year-by-year returns
These charts show the fund’s annual performance, whichchanges from year to year.% Class A Units25
21.24%20
Dec.1994
Dec.1995
Dec.1997
Dec.1996
Dec.1999
Dec.1998
Dec.2001
Dec.2000
Dec.2003
Dec.2002
$
Scotia Canadian Income Fund
SC Universe Bond Index
Class A Units
$19,805
$21,200
Dec.1993
(a) SC Universe Bond Index
(b) Scotia Canadian Income Fund
Class F Units
(c) SC Universe Bond Index
(d) Scotia Canadian Income Fund
Class I Units
$10,722(d)$10,889(c)
$12,040(b)$12,176(a)
0
10,000
5,000
15,000
20,000
25,000
15 The SC Universe Bond Index is a broad measure of the total return of11.62%9.26% 9.18% Canadian bonds that mature in more than one year. It includes approxi-10 8.31% 8.11%7.17% 6.02% mately 900 Canadian federal, provincial, municipal and corporate bonds
5 rated BBB or higher. The average term to maturity is 9.51 years and theaverage duration is 6.03 years.0
-2.02%-5
-5.88%Annual compound returns-10
1994 1995 1996 1997 1998 1999 2000 2001 2002 2003
This table shows the fund’s annual compound returns,% Class F Units25 compared with the SC Universe Bond Index.20 Since
1 year 3 years 5 years 10 years Inception15
Scotia Canadian Income Fund8.70%10
6.64% Class A units % 6.02 7.10 5.61 7.07 –3.90%5
Class F units % 6.64 – – – 8.281
0Class I units % 5.81 – – – 7.042
-5SC Universe Bond Index % 6.69 7.83 6.44 7.80 3
-10 1 August 14, 20012001* 2002 2003* Aug. 14, 2001 to Dec. 31, 2001 2 December 9, 2002
3 Class F units 8.80% and Class I units 8.67%
24
SC
OT
IA C
AN
AD
IAN
IN
CO
ME
FU
ND
INC
OM
E F
UN
DS

Ratios and supplemental dataDistribution policy1999 2000 20012 2002 2003
The fund distributes any income by the last business day Net assets (000’s) $ – – 64 150 124
of each month. It distributes any capital gains in Number of units outstanding (000’s) – – 5 11 12December of each calendar year.MER3 % – – 0.54 0.66 0.61
Portfolio turnover rate % – – 272.00 214.77 203.21Distributions on units held in Scotia registered plans and2 These figures are for the period from August 14, 2001 to December 31,Copilot non-registered accounts are always reinvested in 2001.
additional units of the fund. Distributions on units held in 3 We may from time to time absorb some of the operating expenses that thefund would otherwise pay. In 2003, the management expense ratio of theother registered plans and non-registered accounts arefund would have been 0.86% had we not absorbed some of these expenses.
reinvested in additional units of the fund, unless you tellus in writing that you want to receive cash distributions
Financial highlights, Class I unitsby cheque or by deposit to your bank account. at December 31
Distributions and net asset value per unitFinancial highlights, Class A units
1999 2000 2001 20024 2003at December 31DistributionsDistributions and net asset value per unitfrom net income $ – – – 0.03 0.72
1999 2000 2001 2002 2003 from realized gain $ – – – 0.05 0.18Distributions return of capital $ – – – – –from net income $ 0.62 0.67 0.60 0.59 0.60 Total annual distributions $ – – – 0.08 0.90from realized gain $ – – – 0.05 0.18 Net asset value per unit $ – – – 13.05 13.03return of capital $ – – – – –
Total annual distributions $ 0.62 0.67 0.60 0.64 0.78Ratios and supplemental data
Net asset value per unit $ 12.02 12.42 12.69 13.04 13.03
1999 2000 2001 20024 2003
Net assets (000’s) $ – – – 991 63,740Ratios and supplemental dataNumber of unitsoutstanding (000’s) – – – 76 4,8911999 2000 2001 2002 2003MER % – – – – 0.01Net assets (000’s) $ 759,851 840,731 876,919 1,011,287 820,793Portfolio turnover rate % – – – 214.77 203.21Number of units4 These figures are for the period from December 9, 2002 tooutstanding (000’s) 63,210 67,690 69,121 77,529 81,821
December 31, 2002.MER1 % 1.22 1.21 1.24 1.23 1.18
Portfolio turnoverrate % 285.37 148.23 272.00 214.77 203.21 Fund expenses indirectly borne by investors1 We may from time to time absorb some of the operating expenses that
the fund would otherwise pay. In 2003, the management expense ratio This example shows the fund’s expenses on a $1,000of the fund would have been 1.75% had we not absorbed some of investment with a 5% annual return.these expenses.
Fees and expensespayable over 1 year 3 years 5 years 10 yearsFinancial highlights, Class F unitsClass A units $ 12.10 38.13 66.83 152.13at December 31Class F units $ 6.25 19.71 34.55 78.64
Distributions and net asset value per unitClass I units $ 0.10 0.32 0.57 1.29
1999 2000 20012 2002 2003
Distributions
from net income $ – – 0.25 0.71 0.67
from realized gain $ – – – 0.05 0.18
return of capital $ – – – – –
Total annual distributions $ – – 0.25 0.76 0.85
Net asset value per unit $ – – 12.68 13.04 13.03
25
SC
OT
IA C
AN
AD
IAN
IN
CO
ME
FU
ND
INC
OM
E F
UN
DS

Scotia CanAm U.S. $ Income FundFund details The portfolio advisor may:
) use derivatives such as options, futures and forwardFund type U.S. bond fund
contracts to adjust the fund’s average term to maturity,Date established November 27, 1991
Type of securities Class A and Class F units of a mutual to gain exposure to income-producing securities and tofund trust hedge against changes in interest rates. It will only use
Eligible for Yes. Units of the fund are not foreign derivatives as permitted by securities regulations.registered plans? property.
Portfolio advisor Scotia Cassels Investment Counsel ) temporarily invest the fund’s assets in cash or cash-Limited equivalent securities to try to protect the fund during a
market downturn or for other reasons.What does the fund invest in? The fund may participate in repurchase, reverse repur-Investment objectives chase and securities lending transactions to achieve the
fund’s overall investment objectives and to enhance theThe fund’s objective is to provide a high level of interest fund’s returns. You’ll find more information about repur-income. It invests primarily in bonds and treasury bills chase, reverse repurchase and securities lending transac-that are denominated in U.S. dollars and are issued by tions on page 3.Canadian federal, provincial and municipal governments,Canadian corporations and supranational entities, such as
Top 10 holdings at September 30, 2004the World Bank. These securities aren’t considered foreignproperty under the Tax Act. Province of British Columbia 4.30% 053013 10.35%
Province of New Brunswick 7.63% 021513 10.33%Any change to the fundamental investment objectivesProvince of Manitoba 7.50% 022210 7.42%must be approved by a majority of votes cast at a meetingProvince of Nova Scotia 5.75% 022712 6.78%of unitholders called for that purpose.Export Development Corporation 2.38% 042106 6.23%
Government of Canada 5.25% 110508 5.85%Investment strategies
Province of Ontario 5.13% 071712 4.44%Securities with a maturity of one year or less will
Province of Ontario 4.38% 021513 4.21%generally have a credit rating of R1 or better by DBRS, orCoca-Cola Enterprises Inc. 5.38% 081506 3.93%an equivalent rating by another approved rating agency.GE Capital Corporation 7.38% 011910 3.64%Securities with a maturity of more than one year must
have a credit rating of BBB or better by DBRS, or anWhat are the risks of investing in the fund?equivalent rating by another approved rating agency.The main risks of investing in this fund are:The average term to maturity of the fund’s investments) currency riskwill vary depending on market conditions, but it won’t be
more than eight years. The maturity of each security ) interest rate riskwon’t be more than 10 years. The portfolio advisor adjusts
) credit risk.the average term to maturity to try to maximize returns
The fund may have these additional risks:while minimizing interest rate risk.) foreign investment risk
The portfolio advisor uses interest rate and yield curve) derivative riskanalysis to select individual investments and manage the
fund’s average term to maturity. It analyzes credit risk to ) class riskidentify securities that offer the potential for higher yields ) repurchase and reverse repurchase transaction riskat an acceptable level of risk.
) securities lending riskThe fund can invest in foreign securities up to the foreign ) underlying fund risk.content limit.
You’ll find details about each risk starting on page 164.
26
SC
OT
IA C
AN
AM
U.S
. $
IN
CO
ME
FU
ND
INC
OM
E F
UN
DS

Overall past performanceWho should invest in this fund?
This chart shows how a $10,000 investment in the fundThis fund may be suitable for you if:would have changed in value, compared with the Salomon
) you want a high level of regular interest income andSmith Barney World Government Bond Index.U.S. dollar exposure
) you’re investing for at least three years
) you can accept medium risk.
Past performance at December 31
This section shows how the fund has performed in thepast and gives you an idea of the risk involved. Thesefigures don’t tell you how the fund will perform in thefuture.
Year-by-year returns
These charts show the fund’s annual performance, whichchanges from year to year.% Class A Units25
Dec.1994
Dec.1995
Dec.1996
Dec.1997
Dec.1998
Dec.1999
Dec.2000
Dec.2001
Dec.2002
Dec.2003
$
$14,245(a)
$12,002(b)
$19,291$16,663
Dec.1993
Scotia CanAm U.S. $ Income Fund
Salomon Smith Barney WorldGovernment Bond Index
0
10,000
20,000
30,000
Class A Units
(a) Salomon Smith Barney World Government Bond Index
(b) Scotia CanAm U.S. $ Income Fund
Class F Units
All figures in U.S. $
The Salomon Smith Barney World Government Bond Index is an index of20 17.23% approximately 750 government bonds from 14 countries. Its returns are in15 U.S. dollars.
10.66%9.54%10 7.55%7.38%6.34%5 Annual compound returns2.26%
0.58%0
This table shows the fund’s annual compound returns,-2.73%-5 -4.56%compared with the Salomon Smith Barney World-10
1994 1995 1996 1997 1998 1999 2000 2001 2002 2003 Government Bond Index.% SinceClass F Units15 1 year 3 years 5 years 10 years inception1
11.56% Scotia CanAm U.S. $10 Income Fund
Class A units % 2.26 6.77 5.34 5.24 –4.30%5 Class F units % 3.13 – – – 7.843.13%
Salomon Smith Barney0 World Government
Bond Index % 14.91 10.78 5.75 6.79 15.77-5 All figures in U.S. $2001* 2002 2003 1 Class F units only: July 11, 2001* Jul. 11, 2001 to Dec. 31, 2001
All figures in U.S. $
27
SC
OT
IA C
AN
AM
U.S
. $
IN
CO
ME
FU
ND
INC
OM
E F
UN
DS

Distribution policy Financial highlights, Class F units at December 31
The fund distributes any income by the last business day Distributions and net asset value per unitof each month. It distributes any capital gains in 1999 2000 20012 2002 2003December of each calendar year. Distributions
from net income US$ – – 0.23 0.50 0.48Distributions on units held in Scotia registered plans andfrom realized gain US$ – – – – –
Copilot non-registered accounts are always reinvested inreturn of capital US$ – – – – –
additional units of the fund. Distributions on units held inTotal annual distributions US$ – – 0.23 0.50 0.48
other registered plans and non-registered accounts are Net asset value per unit US$ – – 10.52 11.19 11.06reinvested in additional units of the fund, unless you tellus in writing that you want to receive cash distributions
Ratios and supplemental databy cheque or by deposit to your bank account.
1999 2000 20012 2002 2003
Financial highlights, Class A units Net assets (000’s) US$ – – 104 88 11at December 31 Number of units
outstanding (000’s) – – 10 8 1Distributions and net asset value per unitMER3 % – – 0.80 1.03 0.99
1999 2000 2001 2002 2003 Portfolio turnover rate % – – 29.55 32.43 34.26Distributions 2 These figures are for the period from July 11, 2001 to December 31,
2001.from net income US$ 0.46 0.51 0.42 0.42 0.383 We may from time to time absorb some of the operating expenses thatfrom realized gain US$ – – – – –
the fund would otherwise pay. In 2003, the management expense ratioreturn of capital US$ – – – – – of the fund would have been 1.39% had we not absorbed some of
these expenses.Total annual distributions US$ 0.46 0.51 0.42 0.42 0.38
Net asset value per unit US$ 9.79 10.18 10.52 11.19 11.06
Fund expenses indirectly borne by investors
Ratios and supplemental data This example shows the fund’s expenses on a $1,0001999 2000 2001 2002 2003 investment with a 5% annual return.
Net assets (000’s) US$ 17,507 14,576 19,502 24,808 2,983Fees and expensesNumber of unitspayable over 1 year 3 years 5 years 10 yearsoutstanding (000’s) 1,789 1,432 1,854 2,216 2,270Class A units $ 19.17 60.43 105.91 241.09MER1 % 1.71 1.71 1.92 1.85 1.87Class F units $ 10.15 31.99 56.07 127.64Portfolio turnover
rate % 14.96 17.04 29.55 32.43 34.261 We may from time to time absorb some of the operating expenses that
the fund would otherwise pay. In 2003, the management expense ratioof the fund would have been 1.88% had we not absorbed some ofthese expenses.
28
SC
OT
IA C
AN
AM
U.S
. $
IN
CO
ME
FU
ND
INC
OM
E F
UN
DS

Scotia CanGlobal Income FundFund details fund’s overall investment objectives and to enhance the
fund’s returns. You’ll find more information about repur-Fund type Global fixed income fund
chase, reverse repurchase and securities lending transac-Date established July 4, 1994
tions on page 3.Type of securities Class A, Class F and Class I units of amutual fund trust
Top 10 holdings at September 30, 2004Eligible for Yes. Units of the fund are not foreignregistered plans? property.
Province of Ontario 4.13% 051413 20.87%Portfolio advisor Scotia Cassels Investment CounselLimited Government of Canada 5.25% 060113 9.12%
Government of Canada 4.50% 042809 8.26%What does the fund invest in?
Inter-American Development Bank 5.50% 033010 6.50%Investment objectives
Asian Development Bank 4.00% 101204 6.13%
The fund’s objective is to provide a high level of regular Government of Canada 4.88% 070708 6.08%interest income. It invests primarily in foreign currency- Province of Ontario 5.13% 071712 5.76%denominated bonds and money market instruments issued Province of Quebec 7.50% 071523 5.19%by Canadian federal, provincial and municipal govern-
Government of Quebec 4.25% 022713 5.14%ments and Canadian corporations, and by foreign govern-
Province of New Brunswick 7.63% 021513 3.83%ments and corporations, and supranational entities, suchas the World Bank. What are the risks of investing in the fund?
Any change to the fundamental investment objectives The main risks of investing in this fund are:must be approved by a majority of votes cast at a meeting
) currency riskof unitholders called for that purpose.
) interest rate riskInvestment strategies
) credit riskThe average term to maturity of the fund’s investments
) emerging markets riskwill vary, depending on market conditions. The portfolio) foreign investment risk.advisor adjusts the average term to maturity to try to
maximize returns while minimizing interest rate risk.The fund may have these additional risks:
The portfolio advisor uses interest rate and yield curve) derivative risk
analysis to select individual investments and manage the) class riskfund’s average term to maturity. It analyzes credit risk to
identify securities that offer the potential for higher yields ) repurchase and reverse repurchase transaction riskat an acceptable level of risk. ) securities lending riskThe fund holds securities denominated in a variety of ) underlying fund risk (as at October 1, 2004, Scotiacurrencies for diversification. Selected Balanced Income & Growth Fund held approx-The portfolio advisor may: imately 11.4% of the outstanding units of the fund).
) use derivatives such as options, futures and forward You’ll find details about each risk starting on page 164.contracts to adjust the fund’s average term to maturity,to gain exposure to income-producing securities and to Who should invest in this fund?hedge against changes in interest rates. It will only use
This fund may be suitable for you if:derivatives as permitted by securities regulations.) you want a high level of interest income from fixed
) temporarily invest the fund’s assets in cash or cash-income securities denominated in a variety ofequivalent securities to try to protect the fund during acurrenciesmarket downturn or for other reasons.
) you’re investing for at least three yearsThe fund may participate in repurchase, reverse repur-) you can accept medium risk.chase and securities lending transactions to achieve the
29
SC
OT
IA C
AN
GL
OB
AL
IN
CO
ME
FU
ND
INC
OM
E F
UN
DS

Overall past performancePast performance at December 31
This chart shows how a $10,000 investment in the fundThis section shows how the fund has performed in thewould have changed in value, compared with the Salomonpast and gives you an idea of the risk involved. TheseSmith Barney World Government Bond Index.figures don’t tell you how the fund will perform in the
future.
Year-by-year returns
These charts show the fund’s annual performance, whichchanges from year to year.% Class A Units25
20 17.55%17.14% 16.59%15
11.36%10
5.20%5 2.49%1.97%1.00%0
-5 -5.25%-10
-13.50%-15
-201994 1995 1996 1997 1998 1999 2000 2001 2002 2003
% Class F Units15
10
5
Dec.1994
Dec.1995
Dec.1996
Dec.1997
$
Jul. 41994
Dec.1998
Dec.1999
Dec.2000
Dec.2001
Dec.2002
Dec.2003
0
10,000
20,000
30,000
Scotia CanGlobal Income Fund
Salomon Smith Barney WorldGovernment Bond Index
Class A Units
(a) Salomon Smith Barney World Government Bond Index
(b) Scotia CanGlobal Income Fund
Class F Units
(c) Salomon Smith Barney World Government Bond Index
(d) Scotia CanGlobal Income Fund
Class I Units
$16,267
$17,812
$9,879(a)
$9,869(b)
$10,029(d)
$10,000(c)
The Salomon Smith Barney World Government Bond Index is an index of0approximately 750 government bonds from 14 countries.-1.21%
-4.22%-5
Annual compound returns-10
2002* 2003* Nov. 19, 2002 to Dec. 31, 2002 This table shows the fund’s annual compound returns,
% compared with the Salomon Smith Barney World Govern-Class I Units20 ment Bond Index.
Since15 1 year 3 years 5 years inception
Scotia CanGlobal Income Fund10 Class A units % -5.25 5.42 0.76 5.30
Class F units % -4.22 – – -1.211
5 Class I units % – – – 0.432
Salomon Smith Barney0.43%0 World Government Bond Index % -6.01 5.36 2.15 3
2003** April 28, 2003 to Dec. 31, 2003 1 November 19, 2002
2 April 28, 20033 Class A units 6.32%, Class F units -1.12% and Class I units 0.00%
Distribution policy
The fund distributes any income by the last business dayof each month. It distributes any capital gains inDecember of each calendar year.
Distributions on units held in Scotia registered plans andCopilot non-registered accounts are always reinvested in
30
SC
OT
IA C
AN
GL
OB
AL
IN
CO
ME
FU
ND
INC
OM
E F
UN
DS

Ratios and supplemental dataadditional units of the fund. Distributions on units held inother registered plans and non-registered accounts are 1999 2000 2001 20022 2003
Net assets (000’s) $ – – – 5 7reinvested in additional units of the fund, unless you tellNumber of unitsus in writing that you want to receive cash distributionsoutstanding (000’s) – – – 0.4 0.8by cheque or by deposit to your bank account.MER3 % – – – 0.80 1.16
Portfolio turnover rate % – – 16.45 70.66Financial highlights, Class A units 2 These figures are for the period from November 19, 2002 toat December 31 December 31, 2002.
3 We may from time to time absorb some of the operating expenses thatDistributions and net asset value per unitthe fund would otherwise pay. In 2003, the management expense ratio
1999 2000 2001 2002 2003 of the fund would have been 6.81% had we not absorbed some ofthese expenses.Distributions
from net income $ 0.33 0.37 0.34 0.32 0.30Financial highlights, Class I unitsfrom realized gain $ – – – – –at December 31return of capital $ – – – – –
Distributions and net asset value per unitTotal annual distributions $ 0.33 0.37 0.34 0.32 0.30
Net asset value per unit $ 9.48 9.33 9.46 10.77 9.90 1999 2000 2001 2002 20034
Distributions
from net income $ – – – – 0.34Ratios and supplemental datafrom realized gain $ – – – – –
1999 2000 2001 2002 2003return of capital $ – – – – –
Net assets (000’s) $ 70,508 92,057 101,685 91,817 80,010Total annual distributions $ – – – – 0.34
Number of unitsNet asset value per unit $ – – – – 9.89outstanding (000’s) 7,439 9,868 10,744 8,528 8,083
MER1 % 1.93 1.93 2.12 2.24 2.19
Portfolio turnover Ratios and supplemental datarate % 25.93 4.17 44.39 16.45 70.66
1999 2000 2001 2002 200341 We may from time to time absorb some of the operating expenses that
the fund would otherwise pay. In 2003, the management expense ratio Net assets (000’s) $ – – – – 5,212of the fund would have been 2.22% had we not absorbed some of
Number of unitsthese expenses.outstanding (000’s) – – – – 527
MER5 % – – – – –Financial highlights, Class F units Portfolio turnover rate % – – – 70.66at December 31 4 These figures are for the period from April 28, 2003 to December 31,
2003.Distributions and net asset value per unit5 We may from time to time absorb some of the operating expenses that
1999 2000 2001 20022 2003 the fund would otherwise pay. In 2003, the management expense ratioof the fund would have been 0.02% had we not absorbed some ofDistributionsthese expenses.
from net income $ – – – 0.06 0.42
from realized gain $ – – – – –Fund expenses indirectly borne by investorsreturn of capital $ – – – – –
Total annual distributions $ – – – 0.06 0.42 This example shows the fund’s expenses on a $1,000Net asset value per unit $ – – – 10.76 9.89
investment with a 5% annual return.
Fees and expensespayable over 1 year 3 years 5 years 10 years
Class A units $ 22.45 70.77 124.04 282.34
Class F units $ 11.89 37.48 65.70 149.55
Class I units $ – – – –
31
SC
OT
IA C
AN
GL
OB
AL
IN
CO
ME
FU
ND
INC
OM
E F
UN
DS


Balanced Funds
Scotia Diversified Monthly Income Fund
Scotia Canadian Balanced Fund
Scotia Total Return Fund
The balanced funds offer a combination of equity, fixed incomeand cash equivalent securities in a single investment. Theportfolio advisors adjust the asset allocation as market condi-tions change to increase the potential for higher returns whilemanaging risk. Balanced funds generally have less volatility thanequity funds, but more volatility than income funds.For many investors, balanced funds offer a straightforwardinvestment choice for most or all of their portfolio.
Scotia Selected FundsScotia Selected Income & Modest Growth FundScotia Selected Balanced Income & Growth FundScotia Selected Conservative Growth FundScotia Selected Conservative Growth RSP FundScotia Selected Aggressive Growth FundScotia Selected Aggressive Growth RSP Fund
Scotia Partners PortfoliosScotia Partners Income & Modest Growth PortfolioScotia Partners Balanced Income & Growth PortfolioScotia Partners Conservative Growth PortfolioScotia Partners Aggressive Growth Portfolio
Scotia Vision FundsScotia Vision Conservative 2010 FundScotia Vision Aggressive 2010 FundScotia Vision Conservative 2015 FundScotia Vision Aggressive 2015 FundScotia Vision Conservative 2020 FundScotia Vision Aggressive 2020 FundScotia Vision Conservative 2030 FundScotia Vision Aggressive 2030 Fund
As part of our suite of industry leading asset allocationofferings, Scotia Partners Portfolios, Scotia Selected Funds andScotia Vision Funds are a convenient and effective way to investin other mutual funds and can help you reach the financialtargets you’ve set.
Each portfolio or fund invests its assets in up to four assetclasses: cash equivalents, fixed income, Canadian equities andforeign equities. The different allocations represent differentinvestment goals, returns and exposure to risk.
33
Bala
nced
Fun
ds

Scotia Diversified Monthly Income FundFund details market conditions. The credit quality of the fund’s
investments will vary depending on the economic cycle,Fund type Canadian balanced fund
industry factors, specific company situations and marketDate established June 10, 2005
pricing considerations to try to maximize returns whileType of securities Class A and Class F units of a mutualfund trust minimizing portfolio risk.
Eligible for Yes. Units of the fund are not foreignThe fund may invest in other mutual funds which areregistered plans? property.
Portfolio advisor Scotia Cassels Investment Counsel managed by us or by other mutual fund managers. You’llLimited find more information about investing in other funds on
page 2.What does the fund invest in?
The portfolio advisor may:Investment objectives
) use derivatives such as options, futures and forwardThe fund’s objective is to provide regular monthly income contracts to adjust the fund’s average term to maturity,and some capital appreciation. to gain exposure to income-producing securities and to
hedge against changes in interest rates, credit spreadsIt invests primarily in a diversified portfolio of income and stock market prices. It will only use derivatives asgenerating securities such as: permitted by securities regulations) dividend paying common shares
) temporarily invest the fund’s assets in cash or cash) preferred shares equivalent securities to try to protect the fund during a
market downturn or for other reasons.) investment grade bonds
) convertible debentures The fund may participate in repurchase, reverse repur-chase and securities lending transactions to achieve the) mortgagesfund’s overall investment objectives and to enhance the
) high yield bondsfund’s returns. You’ll find more information about repur-
) asset-backed and mortgage-backed securities chase, reverse repurchase and securities lending transac-) income trust units. tions on page 3.
Any change to the fundamental investment objectivesTop 10 holdings
must be approved by a majority of votes cast at a meetingof unitholders called for that purpose. Because the fund is new, top 10 holdings weren’t available
when this prospectus was printed.Investment strategies
What are the risks of investing in the fund?The portfolio advisor determines the asset mix based onits analysis of market conditions and performance expec- The main risks of investing in this fund are:tations for each asset class in a manner consistent with
) interest rate riskthe fund’s investment objectives. For the fund’s equity
) credit riskinvestments, the portfolio advisor uses fundamental analy-) equity risksis to identify appropriate long-term investments. This
involves evaluating the financial condition and manage- ) income trust unit risk.ment of each company, as well as its industry and the
The fund may also have these additional risks:economy. The fund’s assets are diversified by industry andcompany to help reduce risk. For fixed income securities, ) asset-backed and mortgage-backed securities riskthe portfolio advisor analyzes credit risk to identify
) class risksecurities that offer higher yields at an acceptable level of
) foreign investment riskrisk. Interest rate and yield curve analysis are used to) currency riskmanage the fund’s average term to maturity depending on
34
SC
OT
IA D
IVE
RS
IFIE
D M
ON
TH
LY
IN
CO
ME
FU
ND
BA
LA
NC
ED
FU
ND
S
Fund expenses indirectly borne by investors) derivative risk
) repurchase and reverse repurchase transaction risk Fund expense information is not available because thefund is new.) securities lending risk
) underlying fund risk
) liquidity risk.
You’ll find details about each of these risks starting onpage 164.
Who should invest in this fund?
This fund may be suitable for you if:
) you want regular monthly income
) you’re investing for at least three years
) you can accept medium risk.
Past performance
Past performance information is not available because thefund is new.
Distribution policy
The fund distributes an amount out of income, capitalgains and, if necessary, out of capital by the last businessday of each month. It is not expected that the fund willmake a distribution in the month in which it isestablished. The amount of the monthly distribution maybe adjusted throughout the year as market conditionschange. Any additional distributions of income and capitalgains will be made in December of each calendar year. Ifthe fund doesn’t earn enough income and capital gains tomeet the monthly distribution, it may return capital tomake up the difference. A return of capital will reducethe adjusted cost base of your units.
Distributions on units held in Scotia registered plans arealways reinvested in additional units of the fund. Distribu-tions on units held in other registered plans and non-registered accounts are reinvested in additional units ofthe fund, unless you tell us in writing that you want toreceive cash distributions by cheque or by deposit to yourbank account.
Financial highlights
Historical financial information is not available becausethe fund is new.
35
SC
OT
IA D
IVE
RS
IFIE
D M
ON
TH
LY
IN
CO
ME
FU
ND
BA
LA
NC
ED
FU
ND
S

Scotia Canadian Balanced FundFund details markets. It will only use derivatives as permitted by
securities regulations.Fund type Canadian balanced fund
) temporarily invest the fund’s assets in cash or cash-Date established May 7, 1990
Type of securities Class A and Class F units of a mutual equivalent securities to try to protect the fund during afund trust market downturn or for other reasons.
Eligible for Yes. Units of the fund are not foreignThe portfolio advisor may actively trade the fund’sregistered plans? property.
Portfolio advisor Scotia Cassels Investment Counsel investments. This can increase trading costs, which mayLimited lower the fund’s returns. It also increases the chance that
you’ll receive taxable capital gains if you hold the fund inWhat does the fund invest in? a non-registered account.Investment objectives The fund may participate in repurchase, reverse repur-The fund’s objective is to provide a balance between chase and securities lending transactions to achieve theearning income and obtaining capital growth over the long fund’s overall investment objectives and to enhance theterm. It invests primarily in a broad range of Canadian fund’s returns. You’ll find more information about repur-equity and fixed income securities. chase, reverse repurchase and securities lending transac-Any change to the fundamental investment objectives tions on page 3.must be approved by a majority of votes cast at a meeting
Top 10 holdings at September 30, 2004of unitholders called for that purpose.
Government of Canada 8.00% 060123 5.82%Investment strategiesGovernment of Canada 5.00% 060114 4.80%The fund’s asset mix will generally vary within theS&P 500 Depository Receipts 4.61%following ranges: 25-75% in equity securities and 25-75%Government of Canada 3.00% 120105 3.48%in fixed income securities. The fund may also invest aS&P/TSX 60 Index Participation Fund 2.65%portion of its assets in money market instruments. TheManulife Financial Corporation 2.33%portfolio advisor determines the asset mix based on itsToronto-Dominion Bank 2.01%analysis of market conditions and how it expects eachBank of Montreal 1.71%asset class to perform over the long term.Royal Bank of Canada 1.64%
The fund can invest in foreign securities up to the foreignProvince of Ontario 7.50% 011906 1.48%
content limit. It can invest anywhere in the world, butgenerally won’t invest in emerging markets. What are the risks of investing in the fund?
The main risks of investing in this fund are:The portfolio advisor uses fundamental analysis to identifylong-term investments. This involves evaluating the finan- ) equity riskcial condition and management of each company, as well ) interest rate riskas its industry and the economy. The fund’s assets are
) credit risk.diversified by industry and company to help reduce risk.The fund may have these additional risks:
The fund may invest in other mutual funds which are) foreign investment riskmanaged by us or by other mutual fund managers. You’ll) currency riskfind more information about investing in other mutual
funds on page 2. ) derivative risk
) class riskThe portfolio advisor may:) repurchase and reverse repurchase transaction risk) use derivatives such as options, futures and forward
contracts to hedge against losses from changes in stock ) securities lending riskprices, commodity prices, market indexes or currency
) underlying fund risk.exchange rates, and to gain exposure to financial
You’ll find details about each risk starting on page 164.
36
SC
OT
IA C
AN
AD
IAN
BA
LA
NC
ED
FU
ND
BA
LA
NC
ED
FU
ND
S

Who should invest in this fund? Overall past performanceThis fund may be suitable for you if:
This chart shows how a $10,000 investment in the fund) you want both interest income and growth through would have changed in value, compared with a blended
asset allocation among the three major asset classes index of 50% S&P/TSX Composite Index (Total Return)) you’re investing for at least three years and 50% Scotia Capital (SC) Universe Bond Index.
) you can accept medium risk.
Past performance at December 31
This section shows how the fund has performed in thepast and gives you an idea of the risk involved. Thesefigures don’t tell you how the fund will perform in thefuture.
Year-by-year returns
These charts show the fund’s annual performance, whichchanges from year to year.% Class A Units25
20 17.90%16.81% 15.64%15
10.90%10.30%
$
$19,069$21,994
Scotia Canadian Balanced Fund
Blend of S&P/TSX Composite Index (TotalReturn) and SC Universe Bond Index
0
10,000
20,000
30,000
40,000
Dec.1994
Dec.1995
Dec.1997
Dec.1996
Dec.1999
Dec.1998
Dec.2001
Dec.2000
Dec.2003
Dec.2002
Dec.1993
Class F Units
Class A Units
(a) Blend of S&P/TSX Composite Index (Total Return) and SC Universe Bond Index
$10,501(b)
$11,823(a)
(b) Scotia Canadian Balanced Fund8.49%106.14% The S&P/TSX Composite Index (Total Return) tracks the performance of some5
of the largest and most widely held stocks listed on the Toronto Stock0 Exchange. Prior to May 1, 2002, this index was called the TSE 300
-3.18% Composite Index and it tracked the 300 largest companies listed on the-5 -4.54%Toronto Stock Exchange.-8.04%-10The SC Universe Bond Index is a broad measure of the total return of-15
1994 1995 1996 1997 1998 1999 2000 2001 2002 2003 Canadian bonds that mature in more than one year. It includes approxi-mately 900 Canadian federal, provincial, municipal and corporate bonds
% Class F Units rated BBB or higher. The average term to maturity is 9.51 years and the25 average duration is 6.03 years.20
1510.69% Annual compound returns10
3.60%5 This table shows the fund’s annual compound returns,0
compared with a blended index of 50% S&P/TSX Compos--5-7.28% ite Index (Total Return) and 50% SC Universe Bond-10
-15 Index.2001* 2002 2003 Since
* Mar. 22, 2001 to Dec. 31, 20011 year 3 years 5 years 10 years inception1
Scotia Canadian Balanced Fund
Class A units % 10.90 -0.42 2.94 6.67 –
Class F units % 10.69 – – – 1.79
Blended Index % 16.21 2.88 6.49 8.20 6.281 Class F units only: March 22, 2001
Distribution policy
The fund distributes any income by the last business dayof each calendar quarter. It distributes any capital gainsin December of each calendar year.
37
SC
OT
IA C
AN
AD
IAN
BA
LA
NC
ED
FU
ND
BA
LA
NC
ED
FU
ND
S

Ratios and supplemental dataDistributions on units held in Scotia registered plans andCopilot non-registered accounts are always reinvested in 1999 2000 20011 2002 2003additional units of the fund. Distributions on units held in Net assets (000’s) $ – – 28 100 15other registered plans and non-registered accounts are Number of units
outstanding (000’s) – – 2 6 1reinvested in additional units of the fund, unless you tellMER2 % – – 0.80 0.96 0.88us in writing that you want to receive cash distributionsPortfolio turnoverby cheque or by deposit to your bank account.rate % – – 153.93 128.26 109.141 These figures are for the period from March 22, 2001 to December 31,
2001.Financial highlights, Class A unitsat December 31 2 We may from time to time absorb some of the operating expenses that
the fund would otherwise pay. In 2003, the management expense ratioDistributions and net asset value per unit of the fund would have been 1.83% had we not absorbed some of
these expenses.1999 2000 2001 2002 2003
DistributionsFund expenses indirectly borne by investors
from net income $ 0.33 0.39 0.35 0.29 0.29
from realized gain $ 0.04 0.78 – – – This example shows the fund’s expenses on a $1,000return of capital $ – – – – – investment with a 5% annual return.
Total annual distributions $ 0.37 1.17 0.35 0.29 0.29Fees and expensesNet asset value per unit $ 18.90 18.89 17.93 16.21 17.66payable over 1 year 3 years 5 years 10 years
Class A units $ 17.73 55.90 97.98 223.04Ratios and supplemental data Class F units $ 9.02 28.44 49.84 113.45
1999 2000 2001 2002 2003
Net assets (000’s) $ 1,074,787 1,207,960 1,181,053 1,056,194 1,141,768
Number of unitsoutstanding (000’s) 56,857 63,935 65,856 65,144 64,649
MER % 1.77 1.74 1.75 1.75 1.73
Portfolio turnoverrate % 160.91 105.19 153.93 128.26 109.14
Financial highlights, Class F unitsat December 31
Distributions and net asset value per unit
1999 2000 20011 2002 2003
Distributions
from net income $ – – 0.58 0.45 0.39
from realized gain $ – – – – –
return of capital $ – – – – –
Total annual distributions $ – – 0.58 0.45 0.39
Net asset value per unit $ – – 17.82 16.08 17.38
38
SC
OT
IA C
AN
AD
IAN
BA
LA
NC
ED
FU
ND
BA
LA
NC
ED
FU
ND
S

Scotia Total Return FundFund details The portfolio advisor may:Fund type Canadian tactical asset allocation fund ) use derivatives such as options, futures and forwardDate established April 18, 1989 contracts to hedge against losses from changes in stockType of securities Class A and Class F units of a mutual prices, commodity prices, market indexes or currency
fund trustexchange rates, and to gain exposure to financial
Eligible for Yes. Units of the fund are not foreignmarkets. It will only use derivatives as permitted byregistered plans? property.
Portfolio advisor Connor, Clark & Lunn Investment securities regulations.Management Ltd.
) temporarily invest the fund’s assets in cash or cash-equivalent securities to try to protect the fund during aWhat does the fund invest in?market downturn or for other reasons.
Investment objectivesThe portfolio advisor may actively trade the fund’s
The fund’s objective is to obtain capital growth over the investments. This can increase trading costs, which maylong term, while providing modest income. It invests lower the fund’s returns. It also increases the chance thatprimarily in a broad range of Canadian equity and fixed you’ll receive taxable capital gains if you hold the fund inincome securities. It may also invest in equity and fixed a non-registered account.income securities from around the world.
The fund may participate in repurchase, reverse repur-Any change to the fundamental investment objectives chase and securities lending transactions to achieve themust be approved by a majority of votes cast at a meeting fund’s overall investment objectives and to enhance theof unitholders called for that purpose. fund’s returns. You’ll find more information about repur-
chase, reverse repurchase and securities lending transac-Investment strategies
tions on page 3.The fund’s asset mix will generally vary within thefollowing ranges: 20-80% in equity securities and 20-80% Top 10 holdings at September 30, 2004in fixed income securities. The fund may also invest a
Toronto-Dominion Bank 3.13%portion of its assets in money market instruments. The
Bank of Montreal 2.90%portfolio advisor determines the mix based on its analysisGovernment of Canada 6.00% 060108 2.84%of market conditions and how it expects each asset classGovernment of Canada 5.50% 060109 2.57%to perform.Government of Canada 6.00% 060111 2.51%
The portfolio advisor actively manages the allocationPetro-Canada 2.09%between equity and fixed income securities to try toCanadian Imperial Bank of Commerce 1.86%maximize returns. It will aggressively pursue opportunitiesManulife Financial Corporation 1.83%for capital gains or investment income, but will takeGovernment of Canada 5.50% 060110 1.69%measures to avoid undue risk or low returns from aRoyal Bank of Canada 1.45%particular security.
The fund can invest in foreign securities up to the foreign What are the risks of investing in the fund?content limit. It can invest anywhere in the world, but The main risks of investing in this fund are:generally won’t invest in emerging markets.
) equity riskThe fund may invest in other mutual funds which are
) interest rate riskmanaged by us or by other mutual fund managers. You’llfind more information about investing in other mutual ) credit risk.funds on page 2. The fund may have these additional risks:
The portfolio advisor uses fundamental analysis to identify ) foreign investment risklong-term investments. This involves evaluating the finan- ) currency riskcial condition and management of each company, as well
) derivative riskas its industry and the economy.
39
SC
OT
IA T
OT
AL
RE
TU
RN
FU
ND
BA
LA
NC
ED
FU
ND
S

Overall past performance) class risk
) repurchase and reverse repurchase transaction risk This chart shows how a $10,000 investment in the fundwould have changed in value, compared with a blended) securities lending riskindex of 45% S&P/TSX Composite Index (Total Return),
) underlying fund risk.40% Scotia Capital (SC) Universe Bond Index and 15%Morgan Stanley Capital International (MSCI) World Index.You’ll find details about each risk starting on page 164.
Who should invest in this fund?
This fund may be suitable for you if:
) you want growth through asset allocation among thethree major asset classes
) you’re investing for at least three years
) you can accept medium risk.
Past performance at December 31
This section shows how the fund has performed in thepast and gives you an idea of the risk involved. Thesefigures don’t tell you how the fund will perform in thefuture.
$
$11,309(a)
$16,324
Scotia Total Return Fund
Blend of S&P/TSX Composite Index (Total Return),SC Universe Bond Index and MSCI World Index
0
5,000
10,000
15,000
20,000
25,000
30,000
35,000
Dec.1994
Dec.1995
Dec.1997
Dec.1996
Dec.1999
Dec.1998
Dec.2001
Dec.2000
Dec.2003
Dec.2002
Dec.1993
Class F Units(a) Blend of S&P/TSX Composite Index (Total Return),
SC Universe Bond Index and MSCI World Index
(b) Scotia Total Return Fund
Class A Units
$21,653
$8,912(b)
The S&P/TSX Composite Index (Total Return) tracks the performance of someYear-by-year returns of the largest and most widely held stocks listed on the Toronto Stock
Exchange. Prior to May 1, 2002, this index was called the TSE 300Composite Index and it tracked the 300 largest companies listed on theThese charts show the fund’s annual performance, whichToronto Stock Exchange.changes from year to year.The SC Universe Bond Index is a broad measure of the total return of
% Canadian bonds that mature in more than one year. It includes approxi-Class A Units30 mately 900 Canadian federal, provincial, municipal and corporate bonds
rated BBB or higher. The average term to maturity is 9.51 years and theaverage duration is 6.03 years.20 17.52%
13.24% 11.99% 11.73% The MSCI World Index is an index of approximately 1,600 companies listed10.73%10 on stock exchanges in the 22 countries that make up the MSCI national6.08%
4.21%indexes.
0
-4.77%-6.99%-10 Annual compound returns-9.59%
-20 This table shows the fund’s annual compound returns,1994 1995 1996 1997 1998 1999 2000 2001 2002 2003
compared with a blended index of 45% S&P/TSX Compos-% Class F Units20 ite Index (Total Return), 40% SC Universe Bond Index15 and 15% MSCI World Index.12.84%
Since10 1 year 3 years 5 years 10 years inception1
Scotia Total Return Fund5
Class A units % 11.73 -2.06 1.63 5.02 –0 -0.18%Class F units % 12.84 – – – 2.16
-5-5.86% Blended index % 15.66 0.77 4.61 8.03 4.57
-10 1 Class F units only: March 22, 20012001* 2002 2003* Mar. 22, 2001 to Dec. 31, 2001
40
SC
OT
IA T
OT
AL
RE
TU
RN
FU
ND
BA
LA
NC
ED
FU
ND
S

Ratios and supplemental dataDistribution policy
1999 2000 20011 2002 2003The fund distributes any income by the last business dayNet assets (000’s) $ – – 7 12 6of each calendar quarter. It distributes any capital gainsNumber of unitsin December of each calendar year.outstanding (000’s) – – 0.5 1 0.5
MER2 % – – 1.21 1.31 1.34Distributions on units held in Scotia registered plans andPortfolio turnover rate % – – 268.89 168.29 31.19Copilot non-registered accounts are always reinvested in1 These figures are for the period from March 22, 2001 to December 31,additional units of the fund. Distributions on units held in 2001.
other registered plans and non-registered accounts are 2 We may from time to time absorb some of the operating expenses thatthe fund would otherwise pay. In 2003, the management expense ratioreinvested in additional units of the fund, unless you tellof the fund would have been 8.01% had we not absorbed some of
us in writing that you want to receive cash distributions these expenses.
by cheque or by deposit to your bank account.Fund expenses indirectly borne by investors
Financial highlights, Class A unitsThis example shows the fund’s expenses on a $1,000at December 31investment with a 5% annual return.Distributions and net asset value per unit
Fees and expenses1999 2000 2001 2002 2003payable over 1 year 3 years 5 years 10 years
DistributionsClass A units $ 26.24 82.72 144.99 330.05
from net income $ 0.09 0.07 0.06 0.03 –Class F units $ 13.74 43.30 75.89 172.76
from realized gain $ 0.29 1.91 – – –
return of capital $ – – – – –
Total annual distributions $ 0.38 1.98 0.06 0.03 –
Net asset value per unit $ 16.55 15.24 13.71 12.73 14.22
Ratios and supplemental data
1999 2000 2001 2002 2003
Net assets (000’s) $ 753,792 704,954 581,558 471,617 469,176
Number of unitsoutstanding (000’s) 45,554 46,262 42,409 37,047 32,996
MER % 2.43 2.43 2.45 2.51 2.56
Portfolio turnoverrate % 176.58 131.66 268.89 168.29 31.19
Financial highlights, Class F unitsat December 31
Distributions and net asset value per unit
1999 2000 20011 2002 2003
Distributions
from net income $ – – 0.19 0.07 0.05
from realized gain $ – – – – –
return of capital $ – – – – –
Total annual distributions $ – – 0.19 0.07 0.05
Net asset value per unit $ – – 13.72 12.86 14.26
41
SC
OT
IA T
OT
AL
RE
TU
RN
FU
ND
BA
LA
NC
ED
FU
ND
S

Scotia Selected Income & Modest Growth FundFund details Top 10 holdings at September 30, 2004
Fund type Strategic asset allocation fund The information contained in this list may change due toDate established April 28, 2003 ongoing portfolio transactions of the fund. Current hold-Type of securities Class A and Class F units of a mutual ings may be found at www.scotiabank.com/mutualfunds.
fund trust
Eligible for Yes. Units of the fund are not Scotia Canadian Income Fund Class I 29.75%registered plans? foreign property.
Scotia Mortgage Income Fund Class I 29.59%Portfolio advisor Scotia Capital Inc.
Scotia Canadian Growth Fund Class I 10.12%
Scotia CanGlobal Income Fund Class I 9.47%What does the fund invest in? Capital International – International Equity Class I 8.53%
Investment objectives Capital International – U.S. Equity Class I 5.56%
Scotia Canadian Dividend Fund Class I 5.21%The fund’s objective is to achieve a balance of currentincome and long term capital appreciation, with a bias You can get a copy of the simplified prospectus of thetowards income. It invests primarily in a diversified mix of underlying funds by calling us at 1-800-268-9269equity and income mutual funds managed by us and by (416-750-3863 in Toronto) for English, or 1-800-387-5004other mutual fund managers. for French, by asking your mutual fund representative, or
at www.sedar.com.Any change to the fundamental investment objectivesmust be approved by a majority of votes cast at a meeting
What are the risks of investing in the fund?of unitholders called for that purpose.
The fund indirectly has the same risks as the underlyingInvestment strategies funds it holds. The fund takes on the risks of an
underlying fund in proportion to its investment in thatThe fund is an asset allocation fund that allocates yourfund. The risks of the underlying funds include:investment between three asset classes: fixed income,
Canadian equities and foreign equities. ) interest rate risk
) equity riskThe table below outlines the target weighting for eachasset class in which the fund invests. ) credit risk
Target ) foreign investment riskAsset Class Weighting
) emerging markets riskFixed Income 70%
) currency riskCanadian Equities 15%
Foreign Equities 15% ) derivative risk
) repurchase and reverse repurchase transaction riskThe underlying funds in which the fund invests may) securities lending riskchange from time to time, but the weighting for each
asset class will not be more than 10% above or below the ) liquidity riskamounts set out above. You’ll find more information about
) underlying fund risk.investing in other mutual funds on page 2.The fund also has class risk.Although up to 100% of the fund’s assets may be invested
in other mutual funds, the fund may hold a portion of its During the 12 months preceding October 29, 2004, up toassets in cash or money market instruments while seeking 29.9% of the net assets of the fund were invested ininvestment opportunities or for defensive purposes. Scotia Canadian Income Fund, up to 29.6% of the net
assets of the fund were invested in Scotia MortgageIncome Fund, up to 10.4% of the net assets of the fundwere invested in Scotia Canadian Growth Fund and up to
42
SC
OT
IA S
EL
EC
TE
D I
NC
OM
E &
MO
DE
ST
GR
OW
TH
FU
ND
BA
LA
NC
ED
FU
ND
S
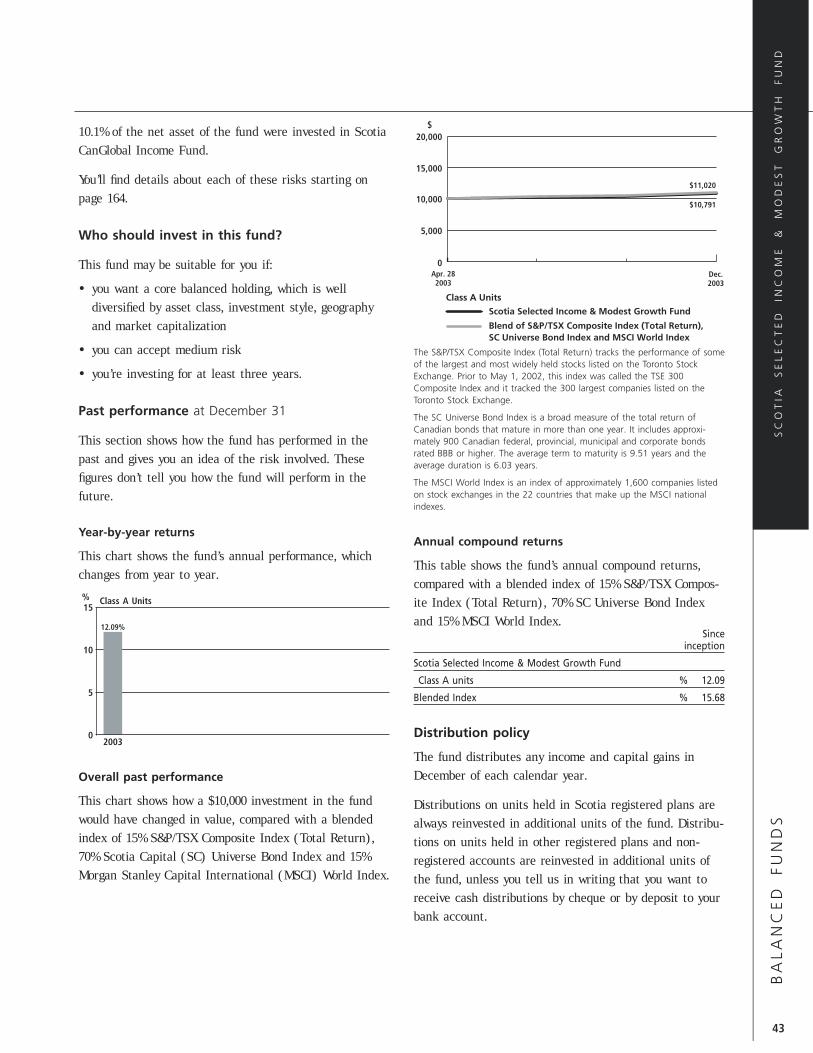
10.1% of the net asset of the fund were invested in ScotiaCanGlobal Income Fund.
You’ll find details about each of these risks starting onpage 164.
Who should invest in this fund?
This fund may be suitable for you if:
) you want a core balanced holding, which is welldiversified by asset class, investment style, geographyand market capitalization
$
Apr. 282003
Dec.2003
0
10,000
5,000
15,000
20,000
$10,791
$11,020
Scotia Selected Income & Modest Growth Fund
Blend of S&P/TSX Composite Index (Total Return), SC Universe Bond Index and MSCI World Index
Class A Units
) you can accept medium risk The S&P/TSX Composite Index (Total Return) tracks the performance of someof the largest and most widely held stocks listed on the Toronto Stock
) you’re investing for at least three years. Exchange. Prior to May 1, 2002, this index was called the TSE 300Composite Index and it tracked the 300 largest companies listed on theToronto Stock Exchange.
Past performance at December 31 The SC Universe Bond Index is a broad measure of the total return ofCanadian bonds that mature in more than one year. It includes approxi-
This section shows how the fund has performed in the mately 900 Canadian federal, provincial, municipal and corporate bondsrated BBB or higher. The average term to maturity is 9.51 years and thepast and gives you an idea of the risk involved. These average duration is 6.03 years.
figures don’t tell you how the fund will perform in the The MSCI World Index is an index of approximately 1,600 companies listedon stock exchanges in the 22 countries that make up the MSCI nationalfuture.indexes.
Year-by-year returnsAnnual compound returns
This chart shows the fund’s annual performance, whichThis table shows the fund’s annual compound returns,
changes from year to year.compared with a blended index of 15% S&P/TSX Compos-
% Class A Units ite Index (Total Return), 70% SC Universe Bond Index15
and 15% MSCI World Index.12.09%Since
inception10Scotia Selected Income & Modest Growth Fund
Class A units % 12.095 Blended Index % 15.68
Distribution policy02003
The fund distributes any income and capital gains inDecember of each calendar year.Overall past performance
This chart shows how a $10,000 investment in the fund Distributions on units held in Scotia registered plans arewould have changed in value, compared with a blended always reinvested in additional units of the fund. Distribu-index of 15% S&P/TSX Composite Index (Total Return), tions on units held in other registered plans and non-70% Scotia Capital (SC) Universe Bond Index and 15% registered accounts are reinvested in additional units ofMorgan Stanley Capital International (MSCI) World Index. the fund, unless you tell us in writing that you want to
receive cash distributions by cheque or by deposit to yourbank account.
43
SC
OT
IA S
EL
EC
TE
D I
NC
OM
E &
MO
DE
ST
GR
OW
TH
FU
ND
BA
LA
NC
ED
FU
ND
S
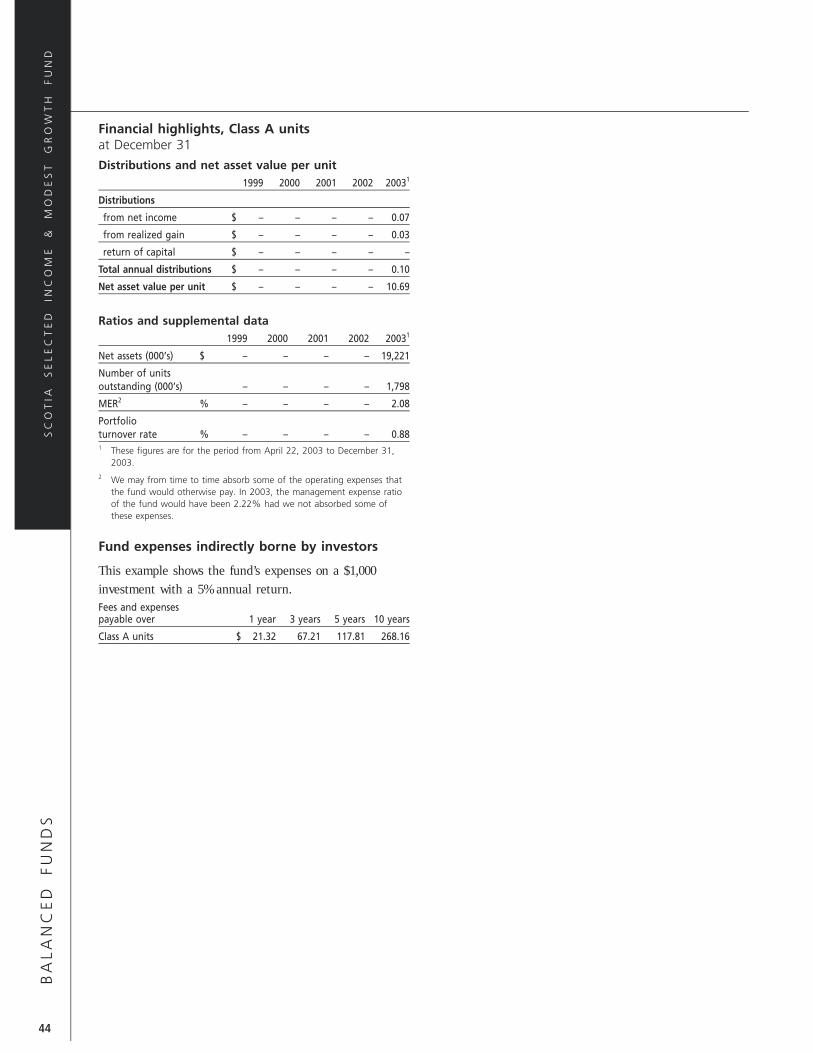
Financial highlights, Class A unitsat December 31
Distributions and net asset value per unit1999 2000 2001 2002 20031
Distributions
from net income $ – – – – 0.07
from realized gain $ – – – – 0.03
return of capital $ – – – – –
Total annual distributions $ – – – – 0.10
Net asset value per unit $ – – – – 10.69
Ratios and supplemental data1999 2000 2001 2002 20031
Net assets (000’s) $ – – – – 19,221
Number of unitsoutstanding (000’s) – – – – 1,798
MER2 % – – – – 2.08
Portfolioturnover rate % – – – – 0.881 These figures are for the period from April 22, 2003 to December 31,
2003.2 We may from time to time absorb some of the operating expenses that
the fund would otherwise pay. In 2003, the management expense ratioof the fund would have been 2.22% had we not absorbed some ofthese expenses.
Fund expenses indirectly borne by investors
This example shows the fund’s expenses on a $1,000investment with a 5% annual return.Fees and expensespayable over 1 year 3 years 5 years 10 years
Class A units $ 21.32 67.21 117.81 268.16
44
SC
OT
IA S
EL
EC
TE
D I
NC
OM
E &
MO
DE
ST
GR
OW
TH
FU
ND
BA
LA
NC
ED
FU
ND
S

Scotia Selected Balanced Income & Growth FundFund details Top 10 holdings at September 30, 2004
Fund type Strategic asset allocation fund The information contained in this list may change due toDate established April 28, 2003 ongoing portfolio transactions of the fund. Current hold-Type of securities Class A and Class F units of a mutual ings may be found at www.scotiabank.com/mutualfunds.
fund trust
Eligible for Yes. Units of the fund are not foreign Scotia Canadian Income Fund Class I 24.86%registered plans? property.
Scotia Canadian Growth Fund Class I 15.18%Portfolio advisor Scotia Capital Inc.
Scotia Canadian Dividend Fund Class I 14.58%
Capital International – International Equity Class I 12.31%What does the fund invest in? Scotia Mortgage Income Fund Class I 9.90%
Investment objectives Scotia CanGlobal Income Fund Class I 9.49%
Scotia American Growth Fund Class I 4.64%The fund’s objective is to achieve a balance of currentCapital International – U.S. Equity Class I 4.63%income and long term capital appreciation, with a smallCapital International – Global Small Cap Class I 2.82%bias towards capital appreciation. It invests primarily in a
diversified mix of equity and income mutual funds You can get a copy of the simplified prospectus of themanaged by us and by other mutual fund managers. underlying funds by calling us at 1-800-268-9269
(416-750-3863 in Toronto) for English, or 1-800-387-5004Any change to the fundamental investment objectivesfor French, by asking your mutual fund representative, ormust be approved by a majority of votes cast at a meetingat www.sedar.com.of unitholders called for that purpose.
What are the risks of investing in the fund?Investment strategies
The fund indirectly has the same risks as the underlyingThe fund is an asset allocation fund that allocates yourfunds it holds. The fund takes on the risks of aninvestment between three asset classes: fixed income,underlying fund in proportion to its investment in thatCanadian equities and foreign equities.fund. The risks of the underlying funds include:
The table below outlines the target weighting for each) interest rate riskasset class in which the fund invests.) credit riskTarget
Asset Class Weighting ) foreign investment riskFixed Income 45%
) currency riskCanadian Equities 29%
) derivative riskForeign Equities 26%
) repurchase and reverse repurchase transaction riskThe underlying funds in which the fund invests may
) securities lending riskchange from time to time, but the target weighting for
) emerging markets riskeach asset class will not be more than 10% above orbelow the amounts set out above. You’ll find more ) equity riskinformation about investing in other mutual funds on ) liquidity riskpage 2.
) underlying fund risk.Although up to 100% of the fund’s assets may be invested
The fund also has class risk.in other mutual funds, the fund may hold a portion of itsassets in cash or money market instruments while seeking During the 12 months preceding October 29, 2004, up toinvestment opportunities or for defensive purposes. 24.9% of the net assets of the fund were invested in
Scotia Canadian Income Fund, up to 15.3% of the netassets of the fund were invested in Scotia Canadian
45
SC
OT
IA S
EL
EC
TE
D B
AL
AN
CE
D I
NC
OM
E &
GR
OW
TH
FU
ND
BA
LA
NC
ED
FU
ND
S

Overall past performanceGrowth Fund, up to 14.6% of the net assets of the fundwere invested in Scotia Canadian Dividend Fund, up to This chart shows how a $10,000 investment in the fund13.6% of the net assets of the fund were invested in would have changed in value, compared with a blendedCapital International – International Equity and up to index of 29% S&P/TSX Composite Index (Total Return),10.1% of the net asset of the fund were invested in Scotia 45% Scotia Capital (SC) Universe Bond Index and 26%CanGlobal Income Fund. Morgan Stanley Capital International (MSCI) World Index.
You’ll find details about each of these risks starting onpage 164.
Who should invest in this fund?
This fund may be suitable for you if:
) you want a core balanced holding, which is welldiversified by asset class, investment style, geographyand market capitalization
) you can accept medium risk
) you’re investing for at least three years.
$
Apr. 282003
Dec.2003
0
10,000
5,000
15,000
20,000
$11,410
$11,173
Scotia Selected Balanced Income & Growth Fund
Blend of S&P/TSX Composite Index (Total Return), SC Universe Bond Index and MSCI World Index
Class A Units
The S&P/TSX Composite Index (Total Return) tracks the performance of somePast performance at December 31 of the largest and most widely held stocks listed on the Toronto Stock
Exchange. Prior to May 1, 2002, this index was called the TSE 300Composite Index and it tracked the 300 largest companies listed on theThis section shows how the fund has performed in theToronto Stock Exchange.
past and gives you an idea of the risk involved. TheseThe SC Universe Bond Index is a broad measure of the total return of
figures don’t tell you how the fund will perform in the Canadian bonds that mature in more than one year. It includes approxi-mately 900 Canadian federal, provincial, municipal and corporate bondsfuture.rated BBB or higher. The average term to maturity is 9.51 years and theaverage duration is 6.03 years.
Year-by-year returns The MSCI World Index is an index of approximately 1,600 companies listedon stock exchanges in the 22 countries that make up the MSCI nationalindexes.This chart shows the fund’s annual performance, which
changes from year to year.Annual compound returns
% Class A Units25 This table shows the fund’s annual compound returns,
compared with a blended index of 29% S&P/TSX Compos-20 18.10%ite Index (Total Return), 45% SC Universe Bond Index
15 and 26% MSCI World Index.Since10
inception
Scotia Selected Balanced Income & Growth Fund5
Class A units % 18.100
2003 Blended Index % 21.88
46
SC
OT
IA S
EL
EC
TE
D B
AL
AN
CE
D I
NC
OM
E &
GR
OW
TH
FU
ND
BA
LA
NC
ED
FU
ND
S

Distribution policy
The fund distributes any income and capital gains inDecember of each calendar year.
Distributions on units held in Scotia registered plans arealways reinvested in additional units of the fund. Distribu-tions on units held in other registered plans and non-registered accounts are reinvested in additional units ofthe fund, unless you tell us in writing that you want toreceive cash distributions by cheque or by deposit to yourbank account.
Financial highlights, Class A unitsat December 31
Distributions and net asset value per unit1999 2000 2001 2002 20031
Distributions
from net income $ – – – – 0.04
from realized gain $ – – – – 0.02
return of capital $ – – – – –
Total annual distributions $ – – – – 0.06
Net asset value per unit $ – – – – 11.11
Ratios and supplemental data1999 2000 2001 2002 20031
Net assets (000’s) $ – – – – 29,145
Number of unitsoutstanding (000’s) – – – – 2,623
MER2 % – – – – 2.20
Portfolio turnoverrate % – – – – 0.511 These figures are for the period from April 22, 2003 to December 31,
2003.2 We may from time to time absorb some of the operating expenses that
the fund would otherwise pay. In 2003, the management expense ratioof the fund would have been 2.21% had we not absorbed some ofthese expenses.
Fund expenses indirectly borne by investors
This example shows the fund’s expenses on a $1,000investment with a 5% annual return.
Fees and expensespayable over 1 year 3 years 5 years 10 years
Class A units $ 22.55 71.09 124.60 283.63
47
SC
OT
IA S
EL
EC
TE
D B
AL
AN
CE
D I
NC
OM
E &
GR
OW
TH
FU
ND
BA
LA
NC
ED
FU
ND
S

Scotia Selected Conservative Growth FundFund details Top 10 holdings at September 30, 2004
Fund type Strategic asset allocation fund The information contained in this list may change due toDate established April 28, 2003 ongoing portfolio transactions of the fund. Current hold-Type of securities Class A and Class F units of a mutual ings may be found at www.scotiabank.com/mutualfunds.
fund trust
Eligible for Yes. Units of the fund are foreign Scotia Canadian Dividend Fund Class I 15.15%registered plans? property.
Scotia Canadian Growth Fund Class I 14.83%Portfolio advisor Scotia Capital Inc.
Capital International – International Equity Class I 13.15%
Capital International – U.S. Equity Class I 12.91%What does the fund invest in? Scotia Canadian Income Fund Class I 10.86%
Investment objectives Scotia Mortgage Income Fund Class I 9.74%
Scotia Canadian Small Cap Fund Class I 7.87%The fund’s objective is to achieve a balance of currentScotia American Growth Fund Class I 4.58%income and long term capital appreciation, with a biasScotia CanGlobal Income Fund Class I 3.76%towards capital appreciation. It invests primarily in aCapital International – Global Small Cap Class I 3.68%diversified mix of equity and income mutual funds
managed by us and by other mutual fund managers.You can get a copy of the simplified prospectus of theunderlying funds by calling us at 1-800-268-9269Any change to the fundamental investment objectives(416-750-3863 in Toronto) for English, or 1-800-387-5004must be approved by a majority of votes cast at a meetingfor French, by asking your mutual fund representative, orof unitholders called for that purpose.at www.sedar.com.
Investment strategies
What are the risks of investing in the fund?The fund is an asset allocation fund that allocates yourinvestment between three asset classes: fixed income, The fund indirectly has the same risks as the underlyingCanadian equities and foreign equities. funds it holds. The fund takes on the risks of an
underlying fund in proportion to its investment in thatThe table below outlines the target weighting for each fund. The risks of the underlying funds include:asset class in which the fund invests.
) interest rate riskTarget
) credit riskAsset Class Weighting
Fixed Income 25% ) foreign investment riskCanadian Equities 38% ) currency riskForeign Equities 33%
) derivative risk
The underlying funds in which the fund invests may ) repurchase and reverse repurchase transaction riskchange from time to time, but the target weighting for ) securities lending riskeach asset class will not be more than 10% above or
) emerging markets riskbelow the amounts set out above. You’ll find more) liquidity riskinformation about investing in other mutual funds on
page 2. ) equity risk
) small company riskAlthough up to 100% of the fund’s assets may be investedin other mutual funds, the fund may hold a portion of its ) concentration riskassets in cash or money market instruments while seeking
) underlying fund risk.investment opportunities or for defensive purposes.
The fund also has class risk.
48
SC
OT
IA S
EL
EC
TE
D C
ON
SE
RV
AT
IVE
GR
OW
TH
FU
ND
BA
LA
NC
ED
FU
ND
S

Overall past performanceDuring the 12 months preceding October 29, 2004, up to15.2% of the net assets of the fund were invested in This chart shows how a $10,000 investment in the fundScotia Canadian Dividend Fund, up to 15.1% of the net would have changed in value, compared with a blendedassets of the fund were invested in Scotia Canadian index of 38% S&P/TSX Composite Index (Total Return),Growth Fund, up to 14.6% of the net assets of the fund 25% Scotia Capital (SC) Universe Bond Index and 37%were invested in Capital International – International Morgan Stanley Capital International (MSCI) World Index.Equity, up to 14.2% of the net assets of the fund wereinvested in Capital International – U.S. Equity and up to11.0% of the net asset of the fund were invested in ScotiaCanadian Income Fund.
You’ll find details about each of these risks starting onpage 164.
Who should invest in this fund?
This fund may be suitable for you if:
) you want a core balanced holding, which is welldiversified by asset class, investment style, geography
$
Apr. 282003
Dec.2003
0
10,000
5,000
15,000
20,000
$11,700
$11,743
Scotia Selected Conservative Growth Fund
Blend of S&P/TSX Composite Index (Total Return), SC Universe Bond Index and MSCI World Index
Class A Units
and market capitalization The S&P/TSX Composite Index (Total Return) tracks the performance of someof the largest and most widely held stocks listed on the Toronto Stock
) you can accept medium risk Exchange. Prior to May 1, 2002, this index was called the TSE 300Composite Index and it tracked the 300 largest companies listed on the
) you’re investing for at least three years. Toronto Stock Exchange.
The SC Universe Bond Index is a broad measure of the total return ofCanadian bonds that mature in more than one year. It includes approxi-Past performance at December 31mately 900 Canadian federal, provincial, municipal and corporate bondsrated BBB or higher. The average term to maturity is 9.51 years and theThis section shows how the fund has performed in the average duration is 6.03 years.
past and gives you an idea of the risk involved. These The MSCI World Index is an index of approximately 1,600 companies listedon stock exchanges in the 22 countries that make up the MSCI nationalfigures don’t tell you how the fund will perform in theindexes.
future.
Annual compound returnsYear-by-year returns
This table shows the fund’s annual compound returns,This chart shows the fund’s annual performance, which compared with a blended index of 38% S&P/TSX Compos-changes from year to year. ite Index (Total Return), 25% SC Universe Bond Index% Class A Units and 37% MSCI World Index.35
Since30 inception27.25%
Scotia Selected Conservative Growth Fund25
Class A Units % 27.2520
Blended Index % 26.5615
10
5
02003
49
SC
OT
IA S
EL
EC
TE
D C
ON
SE
RV
AT
IVE
GR
OW
TH
FU
ND
BA
LA
NC
ED
FU
ND
S

Distribution policy
The fund distributes any income and capital gains inDecember of each calendar year.
Distributions on units held in Scotia registered plans arealways reinvested in additional units of the fund. Distribu-tions on units held in other registered plans and non-registered accounts are reinvested in additional units ofthe fund, unless you tell us in writing that you want toreceive cash distributions by cheque or by deposit to yourbank account.
Financial highlights, Class A unitsat December 31
Distributions and net asset value per unit
1999 2000 2001 2002 20031
Distributions
from net income $ – – – – 0.01
from realized gain $ – – – – –
return of capital $ – – – – –
Total annual distributions $ – – – – 0.01
Net asset value per unit $ – – – – 11.73
Ratios and supplemental data
1999 2000 2001 2002 20031
Net assets (000’s) $ – – – – 2,474
Number of unitsoutstanding (000’s) – – – – 211
MER2 % – – – – 2.40
Portfolio turnoverrate % – – – – 59.701 These figures are for the period from April 22, 2003 to December 31,
2003.2 We may from time to time absorb some of the operating expenses that
the fund would otherwise pay. In 2003, the management expense ratioof the fund would have been 5.47% had we not absorbed some ofthese expenses.
Fund expenses indirectly borne by investors
This example shows the fund’s expenses on a $1,000investment with a 5% annual return.
Fees and expensespayable over 1 year 3 years 5 years 10 years
Class A units $ 24.60 77.55 135.93 309.42
50
SC
OT
IA S
EL
EC
TE
D C
ON
SE
RV
AT
IVE
GR
OW
TH
FU
ND
BA
LA
NC
ED
FU
ND
S

Scotia Selected Conservative Growth RSP FundFund details Top 10 holdings at September 30, 2004
Fund type Strategic asset allocation fund The information contained in this list may change due toDate established April 28, 2003 ongoing portfolio transactions of the fund. Current hold-Type of securities Class A and Class F units of a mutual ings may be found at www.scotiabank.com/mutualfunds.
fund trust
Eligible for Yes. Units of the fund are not foreign Scotia Canadian Dividend Fund Class I 15.60%registered plans? property.
Scotia Canadian Growth Fund Class I 15.14%Portfolio advisor Scotia Capital Inc.
Capital International – U.S. Equity Class I 12.93%
Scotia Canadian Income Fund Class I 10.96%
Scotia Mortgage Income Fund Class I 9.93%What does the fund invest in?Scotia International Stock Index Fund Class I 8.68%
Investment objectivesScotia Canadian Small Cap Fund Class I 8.08%
The fund’s objective is to achieve a balance of current Capital International – International Equity Class I 4.72%
income and long term capital appreciation, with a bias Scotia American Growth Fund Class I 4.64%
towards capital appreciation, while maintaining 100% Scotia CanGlobal Income Fund Class I 3.80%
eligibility for registered plans. It invests primarily in aYou can get a copy of the simplified prospectus of thediversified mix of equity and income mutual fundsunderlying funds by calling us at 1-800-268-9269managed by us and by other mutual fund managers.(416-750-3863 in Toronto) for English, or 1-800-387-5004
Any change to the fundamental investment objectives for French, by asking your mutual fund representative, ormust be approved by a majority of votes cast at a meeting at www.sedar.com.of unitholders called for that purpose.
What are the risks of investing in the fund?Investment strategies
The fund indirectly has the same risks as the underlyingThe fund is an asset allocation fund that allocates your funds it holds. The fund takes on the risks of aninvestment between three asset classes: fixed income, underlying fund in proportion to its investment in thatCanadian equities and foreign equities. fund. The risks of the underlying funds include:
The table below outlines the target weighting for each ) interest rate riskasset class in which the fund invests. ) credit risk
Target ) foreign investment riskAsset Class Weighting
) currency riskFixed Income 25%
) derivative riskCanadian Equities 38%
Foreign Equities 33% ) repurchase and reverse repurchase transaction risk
) securities lending riskThe underlying funds in which the fund invests may) emerging markets riskchange from time to time, but the target weighting for
each asset class will not be more than 10% above or ) liquidity riskbelow the amounts set out above. You’ll find more
) equity riskinformation about investing in other mutual funds on
) small company riskpage 2.) concentration risk
Although up to 100% of the fund’s assets may be invested) underlying fund risk.in other mutual funds, the fund may hold a portion of its
assets in cash or money market instruments while seeking The fund also has class risk.investment opportunities or for defensive purposes.
51
SC
OT
IA S
EL
EC
TE
D C
ON
SE
RV
AT
IVE
GR
OW
TH
RS
P F
UN
DB
AL
AN
CE
D F
UN
DS

Year-by-year returnsDuring the 12 months preceding October 29, 2004, up to15.6% of the net assets of the fund were invested in This chart shows the fund’s annual performance, whichScotia Canadian Dividend Fund, up to 15.1% of the net changes from year to year.assets of the fund were invested in Scotia Canadian
% Class A UnitsGrowth Fund, up to 14.1% of the net assets of the fund 3026.37%were invested in Capital International – U.S. Equity and 25
up to 11.0% of the net asset of the fund were invested in20
Scotia Canadian Income Fund.15
You’ll find details about each of these risks starting on 10
page 164. 5
02003Who should invest in this fund?
This fund may be suitable for you if: Overall past performance
) you want a core balanced holding, which is well This chart shows how a $10,000 investment in the funddiversified by asset class, investment style, geography would have changed in value, compared with a blendedand market capitalization index of 38% S&P/TSX Composite Index (Total Return),
) you can accept medium risk 25% Scotia Capital (SC) Universe Bond Index and 37%Morgan Stanley Capital International (MSCI) World Index.) you’re investing for at least three years
) you hold your units in a registered plan other than anRESP and your plan holds the maximum allowableamount of foreign property.
If you’re investing through a non-registered account orRESP or your registered plan holds less than themaximum allowable amount of foreign property, youshould invest in the Scotia Selected Conservative GrowthFund because you’ll usually get a better return. A portionof the fund’s distributions are primarily consideredincome, which is taxed at a higher rate than capital gainswhen received outside of a registered plan. This income is
$
Apr. 282003
Dec.2003
0
10,000
5,000
15,000
20,000
$11,689
$11,700
Scotia Selected Conservative Growth RSP Fund
Blend of S&P/TSX Composite Index (Total Return), SC Universe Bond Index and MSCI World Index
Class A Units
generally realized more frequently than capital gains The S&P/TSX Composite Index (Total Return) tracks the performance of someof the largest and most widely held stocks listed on the Toronto Stockrealized by the Scotia Selected Conservative Growth Fund.Exchange. Prior to May 1, 2002, this index was called the TSE 300Composite Index and it tracked the 300 largest companies listed on theToronto Stock Exchange.Past performance at December 31The SC Universe Bond Index is a broad measure of the total return ofCanadian bonds that mature in more than one year. It includes approxi-This section shows how the fund has performed in themately 900 Canadian federal, provincial, municipal and corporate bonds
past and gives you an idea of the risk involved. These rated BBB or higher. The average term to maturity is 9.51 years and theaverage duration is 6.03 years.figures don’t tell you how the fund will perform in theThe MSCI World Index is an index of approximately 1,600 companies listedfuture.on stock exchanges in the 22 countries that make up the MSCI nationalindexes.
52
SC
OT
IA S
EL
EC
TE
D C
ON
SE
RV
AT
IVE
GR
OW
TH
RS
P F
UN
DB
AL
AN
CE
D F
UN
DS

Annual compound returns Fund expenses indirectly borne by investors
This table shows the fund’s annual compound returns, This example shows the fund’s expenses on a $1,000compared with a blended index of 38% S&P/TSX Compos- investment with a 5% annual return.ite Index (Total Return), 25% SC Universe Bond Index
Fees and expensesand 37% MSCI World Index. payable over 1 year 3 years 5 years 10 yearsSince
Class A units $ 24.60 77.55 135.93 309.42inception
Scotia Selected Conservative Growth RSP Fund
Class A units % 26.37
Blended Index % 26.56
Distribution policy
The fund distributes any income and capital gains inDecember of each calendar year.
Distributions on units held in Scotia registered plans arealways reinvested in additional units of the fund. Distribu-tions on units held in other registered plans and non-registered accounts are reinvested in additional units ofthe fund, unless you tell us in writing that you want toreceive cash distributions by cheque or by deposit to yourbank account.
Financial highlights, Class A unitsat December 31
Distributions and net asset value per unit
1999 2000 2001 2002 20031
Distributions
from net income $ – – – – –
from realized gain $ – – – – –
return of capital $ – – – – –
Total annual distributions $ – – – – –
Net asset value per unit $ – – – – 11.69
Ratios and supplemental data
1999 2000 2001 2002 20031
Net assets (000’s) $ – – – – 12,581
Number of unitsoutstanding (000’s) – – – – 1,076
MER2 % – – – – 2.40
Portfolio turnover rate % – – – – 2.591 These figures are for the period from April 22, 2003 to December 31,
2003.2 We may from time to time absorb some of the operating expenses that
the fund would otherwise pay. In 2003, the management expense ratioof the fund would have been 2.76% had we not absorbed some ofthese expenses.
53
SC
OT
IA S
EL
EC
TE
D C
ON
SE
RV
AT
IVE
GR
OW
TH
RS
P F
UN
DB
AL
AN
CE
D F
UN
DS

Scotia Selected Aggressive Growth FundFund details you’ll receive taxable capital gains if you hold the fund in
a non-registered account.Fund type Strategic asset allocation fund
Date established April 28, 2003Top 10 holdings at September 30, 2004Type of securities Class A and Class F units of a mutual
fund trust
Eligible for Yes. Units of the fund are foreign The information contained in this list may change due toregistered plans? property. ongoing portfolio transactions of the fund. Current hold-Portfolio advisor Scotia Capital Inc.
ings may be found at www.scotiabank.com/mutualfunds.
Scotia Canadian Growth Fund Class I 25.15%What does the fund invest in?Capital International – U.S. Equity Class I 16.75%
Investment objectivesCapital International – International Equity Class I 15.97%
The fund’s objective is long term capital appreciation. ItScotia Canadian Dividend Fund Class I 13.72%
invests primarily in a diversified mix of equity mutualScotia Canadian Income Fund Class I 10.67%
funds, with additional stability derived from investmentsScotia Canadian Small Cap Fund Class I 6.51%in income mutual funds, managed by us and by otherCapital International – Global Small Cap Class I 4.51%mutual fund managers.Capital International – U.S. Small Cap Class I 4.13%
Any change to the fundamental investment objectivesmust be approved by a majority of votes cast at a meeting You can get a copy of the simplified prospectus of theof unitholders called for that purpose. underlying funds by calling us at 1-800-268-9269
(416-750-3863 in Toronto) for English, or 1-800-387-5004Investment strategies for French, by asking your mutual fund representative, or
at www.sedar.com.The fund is an asset allocation fund that allocates yourinvestment between three asset classes: fixed income,
What are the risks of investing in the fund?Canadian equities and foreign equities.
The fund indirectly has the same risks as the underlyingThe table below outlines the target weighting for eachfunds it holds. The fund takes on the risks of anasset class in which the fund invests.underlying fund in proportion to its investment in thatTarget
Asset Class Weighting fund. The risks of the underlying funds include:Fixed Income 10%
) interest rate riskCanadian Equities 45%
) credit riskForeign Equities 45%
) foreign investment riskThe underlying funds in which the fund invests may
) currency riskchange from time to time, but the target weighting for
) derivative riskeach asset class will not be more than 10% above orbelow the amounts set out above. You’ll find more ) repurchase and reverse repurchase transaction riskinformation about investing in other mutual funds on ) securities lending riskpage 2.
) liquidity riskAlthough up to 100% of the fund’s assets may be invested ) equity riskin other mutual funds, the fund may hold a portion of its
) small company riskassets in cash or money market instruments while seeking) underlying fund risk (as at October 1, 2004, an investorinvestment opportunities or for defensive purposes.
held approximately 20.1% of the outstanding units ofThe portfolio advisor may actively trade the fund’s the fund.)investments. This can increase trading costs, which may
The fund also has class risk.lower the fund’s returns. It also increases the chance that
54
SC
OT
IA S
EL
EC
TE
D A
GG
RE
SS
IVE
GR
OW
TH
FU
ND
BA
LA
NC
ED
FU
ND
S

Overall past performanceDuring the 12 months preceding October 29, 2004, up to25.2% of the net assets of the fund were invested in This chart shows how a $10,000 investment in the fundScotia Canadian Growth Fund, up to 17.9% of the net would have changed in value, compared with a blendedassets of the fund were invested in Capital International – index of 45% S&P/TSX Composite Index (Total Return),U.S. Equity, up to 17.3% of the net assets of the fund 10% Scotia Capital (SC) Universe Bond Index and 45%were invested in Capital International – International Morgan Stanley Capital International (MSCI) World Index.Equity, up to 13.7% of the net assets of the fund wereinvested in Scotia Canadian Dividend Fund and up to10.7% of the net asset of the fund were invested in ScotiaCanadian Income Fund.
You’ll find details about each of these risks starting onpage 164.
Who should invest in this fund?
This fund may be suitable for you if:
) you want a core balanced holding, which is welldiversified by asset class, investment style, geography
$
Apr. 282003
Dec.2003
0
10,000
5,000
15,000
20,000
$11,920
$11,978
Scotia Selected Aggressive Growth Fund
Blend of S&P/TSX Composite Index (Total Return), SC Universe Bond Index and MSCI World Index
Class A Units
and market capitalization The S&P/TSX Composite Index (Total Return) tracks the performance of someof the largest and most widely held stocks listed on the Toronto Stock
) you can accept medium to higher risk Exchange. Prior to May 1, 2002, this index was called the TSE 300Composite Index and it tracked the 300 largest companies listed on the
) you’re investing for at least three years. Toronto Stock Exchange.
The SC Universe Bond Index is a broad measure of the total return ofCanadian bonds that mature in more than one year. It includes approxi-Past performance at December 31mately 900 Canadian federal, provincial, municipal and corporate bondsrated BBB or higher. The average term to maturity is 9.51 years and theThis section shows how the fund has performed in the average duration is 6.03 years.
past and gives you an idea of the risk involved. These The MSCI World Index is an index of approximately 1,600 companies listedon stock exchanges in the 22 countries that make up the MSCI nationalfigures don’t tell you how the fund will perform in theindexes.
future.
Annual compound returnsYear-by-year returns
This table shows the fund’s annual compound returns,This chart shows the fund’s annual performance, which compared with a blended index of 45% S&P/TSX Compos-changes from year to year. ite Index (Total Return), 10% SC Universe Bond Index% Class A Units and 45% MSCI World Index.35
Since31.10%30 inception
Scotia Selected Aggressive Growth Fund25
Class A units % 31.1020
Blended Index % 30.1415
10
5
02003
55
SC
OT
IA S
EL
EC
TE
D A
GG
RE
SS
IVE
GR
OW
TH
FU
ND
BA
LA
NC
ED
FU
ND
S

Distribution policy
The fund distributes any income and capital gains inDecember of each calendar year.
Distributions on units held in Scotia registered plans arealways reinvested in additional units of the fund. Distribu-tions on units held in other registered plans and non-registered accounts are reinvested in additional units ofthe fund, unless you tell us in writing that you want toreceive cash distributions by cheque or by deposit to yourbank account.
Financial highlights, Class A unitsat December 31
Distributions and net asset value per unit
1999 2000 2001 2002 20031
Distributions
from net income $ – – – – –
from realized gain $ – – – – 0.07
return of capital $ – – – – –
Total annual distributions $ – – – – 0.07
Net asset value per unit $ – – – – 11.97
Ratios and supplemental data
1999 2000 2001 2002 20031
Net assets (000’s) $ – – – – 841
Number of unitsoutstanding (000’s) – – – – 70
MER2 % – – – – 2.62
Portfolioturnover rate % – – – – 72.921 These figures are for the period from April 22, 2003 to December 31,
2003.2 We may from time to time absorb some of the operating expenses that
the fund would otherwise pay. In 2003, the management expense ratioof the fund would have been 12.85% had we not absorbed some ofthese expenses.
Fund expenses indirectly borne by investors
This example shows the fund’s expenses on a $1,000investment with a 5% annual return.
Fees and expensespayable over 1 year 3 years 5 years 10 years
Class A units $ 26.86 84.66 148.39 337.78
56
SC
OT
IA S
EL
EC
TE
D A
GG
RE
SS
IVE
GR
OW
TH
FU
ND
BA
LA
NC
ED
FU
ND
S

Scotia Selected Aggressive Growth RSP FundFund details Top 10 holdings at September 30, 2004
Fund type Strategic asset allocation fund The information contained in this list may change due toDate established April 28, 2003 ongoing portfolio transactions of the fund. Current hold-Type of securities Class A and Class F units of a mutual ings may be found at www.scotiabank.com/mutualfunds.
fund trust
Eligible for Yes. Units of the fund are not foreign Scotia Canadian Growth Fund Class I 25.47%registered plans? property.
Capital International – U.S. Equity Class I 16.96%Portfolio advisor Scotia Capital Inc.
Scotia International Stock Index Fund Class I 16.47%
Scotia Canadian Dividend Fund Class I 13.60%What does the fund invest in? Scotia Canadian Income Fund Class I 10.18%
Investment objectives Scotia Canadian Small Cap Fund Class I 7.13%
Capital International – Global Small Cap Class I 4.70%The fund’s objective is long term capital appreciation,Capital International – U.S. Small Cap Class I 4.42%while maintaining 100% eligibility for registered plans. It
invests primarily in a diversified mix of equity mutual You can get a copy of the simplified prospectus of thefunds, with additional stability derived from investments underlying funds by calling us at 1-800-268-9269in income mutual funds, managed by us and by other (416-750-3863 in Toronto) for English, or 1-800-387-5004mutual fund managers. for French, by asking your mutual fund representative, or
at www.sedar.com.Any change to the fundamental investment objectivesmust be approved by a majority of votes cast at a meeting
What are the risks of investing in the fund?of unitholders called for that purpose.
The fund indirectly has the same risks as the underlyingInvestment strategies funds it holds. The fund takes on the risks of an
underlying fund in proportion to its investment in thatThe fund is an asset allocation fund that allocates yourfund. The risks of the underlying funds include:investment between three asset classes: fixed income,
Canadian equities and foreign equities. ) interest rate risk
) credit riskThe table below outlines the target weighting for eachasset class in which the fund invests. ) foreign investment risk
Target ) currency riskAsset Class Weighting
) derivative riskFixed Income 10%
Canadian Equities 45% ) repurchase and reverse repurchase transaction riskForeign Equities 45% ) securities lending risk
) liquidity riskThe underlying funds in which the fund invests maychange from time to time, but the target weighting for ) equity riskeach asset class will not be more than 10% above or ) small company riskbelow the amounts set out above. You’ll find more
) concentration riskinformation about investing in other mutual funds on) emerging markets riskpage 2.) underlying fund risk.Although up to 100% of the fund’s assets may be invested
in other mutual funds, the fund may hold a portion of its The fund also has class risk.assets in cash or money market instruments while seekinginvestment opportunities or for defensive purposes.
57
SC
OT
IA S
EL
EC
TE
D A
GG
RE
SS
IVE
GR
OW
TH
RS
P F
UN
DB
AL
AN
CE
D F
UN
DS

Year-by-year returnsDuring the 12 months preceding October 29, 2004, up to25.5% of the net assets of the fund were invested in This chart shows the fund’s annual performance, whichScotia Canadian Growth Fund, up to 18.0% of the net changes from year to year.assets of the fund were invested in Capital International –
% Class A UnitsU.S. Equity, up to 17.7% of the net assets of the fund 3532.09%
were invested in Scotia International Stock Index Fund, 30
up to 13.6% of the net assets of the fund were invested in 25
Scotia Canadian Dividend Fund and up to 10.2% of the 20
15net asset of the fund were invested in Scotia Canadian10Income Fund.5
You’ll find details about each of these risks starting on0
2003page 164.
Overall past performanceWho should invest in this fund?
This chart shows how a $10,000 investment in the fundThis fund may be suitable for you if:would have changed in value, compared with a blended
) you want a core balanced holding, which is well index of 45% S&P/TSX Composite Index (Total Return),diversified by asset class, investment style, geography 10% Scotia Capital (SC) Universe Bond Index and 45%and market capitalization Morgan Stanley Capital International (MSCI) World Index.
) you can accept medium to higher risk
) you’re investing for at least three years
) you hold your units in a registered plan other than anRESP and your plan holds the maximum allowableamount of foreign property.
If you’re investing through a non-registered account orRESP or your registered plan holds less than themaximum allowable amount of foreign property, youshould invest in the Scotia Selected Aggressive GrowthFund because you’ll usually get a better return. A portionof the fund’s distributions are primarily considered
$
Apr. 282003
Dec.2003
0
10,000
5,000
15,000
20,000
$11,920
$12,039
Scotia Selected Aggressive Growth RSP Fund
Blend of S&P/TSX Composite Index (Total Return), SC Universe Bond Index and MSCI World Index
Class A Units
income, which is taxed at a higher rate than capital gains The S&P/TSX Composite Index (Total Return) tracks the performance of someof the largest and most widely held stocks listed on the Toronto Stockwhen received outside of a registered plan. This income isExchange. Prior to May 1, 2002, this index was called the TSE 300generally realized more frequently than capital gains Composite Index and it tracked the 300 largest companies listed on theToronto Stock Exchange.realized by the Scotia Selected Aggressive Growth Fund.The SC Universe Bond Index is a broad measure of the total return ofCanadian bonds that mature in more than one year. It includes approxi-
Past performance at December 31 mately 900 Canadian federal, provincial, municipal and corporate bondsrated BBB or higher. The average term to maturity is 9.51 years and theaverage duration is 6.03 years.This section shows how the fund has performed in theThe MSCI World Index is an index of approximately 1,600 companies listedpast and gives you an idea of the risk involved. Theseon stock exchanges in the 22 countries that make up the MSCI nationalindexes.figures don’t tell you how the fund will perform in the
future.
58
SC
OT
IA S
EL
EC
TE
D A
GG
RE
SS
IVE
GR
OW
TH
RS
P F
UN
DB
AL
AN
CE
D F
UN
DS

Annual compound returns Fund expenses indirectly borne by investors
This table shows the fund’s annual compound returns, This example shows the fund’s expenses on a $1,000compared with a blended index of 45% S&P/TSX Compos- investment with a 5% annual return.ite Index (Total Return), 10% SC Universe Bond Index
Fees and expensesand 45% MSCI World Index. payable over 1 year 3 years 5 years 10 yearsSince
Class A units $ 26.86 84.66 148.39 337.78inception
Scotia Selected Aggressive Growth RSP Fund
Class A units % 32.09
Blended Index % 30.14
Distribution policy
The fund distributes any income and capital gains inDecember of each calendar year.
Distributions on units held in Scotia registered plans arealways reinvested in additional units of the fund. Distribu-tions on units held in other registered plans and non-registered accounts are reinvested in additional units ofthe fund, unless you tell us in writing that you want toreceive cash distributions by cheque or by deposit to yourbank account.
Financial highlights, Class A unitsat December 31
Distributions and net asset value per unit
1999 2000 2001 2002 20031
Distributions
from net income $ – – – – –
from realized gain $ – – – – –
return of capital $ – – – – –
Total annual distributions $ – – – – –
Net asset value per unit $ – – – – 12.04
Ratios and supplemental data
1999 2000 2001 2002 20031
Net assets (000’s) $ – – – – 2,974
Number of unitsoutstanding (000’s) – – – – 247
MER2 % – – – – 2.62
Portfolio turnoverrate % – – – – 45.761 These figures are for the period from April 22, 2003 to December 31,
2003.2 We may from time to time absorb some of the operating expenses that
the fund would otherwise pay. In 2003, the management expense ratioof the fund would have been 4.80% had we not absorbed some ofthese expenses.
59
SC
OT
IA S
EL
EC
TE
D A
GG
RE
SS
IVE
GR
OW
TH
RS
P F
UN
DB
AL
AN
CE
D F
UN
DS

Scotia Partners Income & Modest Growth PortfolioFund details Top 10 holdings at September 30, 2004
Fund type Strategic asset allocation fund The information contained in this list may change due toDate established December 9, 2002 ongoing portfolio transactions of the fund. Current hold-Type of securities Class A and Class F units of a mutual ings may be found at www.scotiabank.com/mutualfunds.
fund trust
Eligible for Yes. Units of the fund are not foreign Scotia Canadian Income Fund Class I 29.43%registered plans? property.
Trimark Canadian Bond Fund Series I 19.80%Portfolio advisor Scotia Capital Inc.
Fidelity Canadian Bond Fund Series O 19.65%
Mackenzie Ivy Canadian Fund Series O 9.01%What does the fund invest in? Templeton Growth Fund Class O 8.87%
Investment objectives Mackenzie Universal Canadian Growth Fund Series O 6.16%
Fidelity International Portfolio Fund Series O 5.82%The portfolio’s objective is to achieve a balance of currentincome and long term capital appreciation, with a bias You can get a copy of the simplified prospectus of thetowards income. It invests primarily in a diversified mix of underlying funds by calling us at 1-800-268-9269equity and income mutual funds managed by other mutual (416-750-3863 in Toronto) for English, or 1-800-387-5004fund managers and by us. for French, by asking your mutual fund representative, or
at www.sedar.com.Any change to the fundamental investment objectivesmust be approved by a majority of votes cast at a meeting
What are the risks of investing in the fund?of unitholders called for that purpose.
The portfolio indirectly has the same risks as theInvestment strategies underlying funds it holds. The fund takes on the risks of
an underlying fund in proportion to its investment in thatThe portfolio is an asset allocation fund that allocatesfund. The risks of the underlying funds include:your investment between three asset classes: fixed income,
Canadian equities and foreign equities. ) interest rate risk
) credit riskThe table below outlines the target weighting for eachasset class in which the fund invests. ) foreign investment risk
Target ) currency riskAsset Class Weighting
) derivative riskFixed Income 70%
) repurchase and reverse repurchase transaction riskCanadian Equities 15%
Foreign Equities 15% ) securities lending risk
) liquidity riskThe underlying funds in which the fund invests may) equity riskchange from time to time, but the target weighting for
each asset class will not be more than 10% above or ) small company riskbelow the amounts set out above. You’ll find more
) concentration riskinformation about investing in other mutual funds on) emerging markets riskpage 2.) asset-backed and mortgage-backed securities riskAlthough up to 100% of the fund’s assets may be invested) underlying fund risk.in other mutual funds, the portfolio may hold a portion of
its assets in cash or money market instruments while The portfolio also has class risk.seeking investment opportunities or for defensivepurposes.
60
SC
OT
IA P
AR
TN
ER
S I
NC
OM
E &
MO
DE
ST
GR
OW
TH
PO
RT
FO
LIO
BA
LA
NC
ED
FU
ND
S

% Class F UnitsDuring the 12 months preceding October 29, 2004, up to 20
29.7% of the net assets of the fund were invested in15Scotia Canadian Income Fund, up to 19.9% of the net 13.31%
assets of the fund were invested in Fidelity Canadian10Bond Fund Series O, up to 19.8% of the net assets of the
fund were invested in Trimark Canadian Bond Fund 5Series I and up to 10.2% of the net asset of the fund wereinvested in Templeton Growth Fund Class O. 0
2003** Feb. 10, 2003 to Dec. 31, 2003
You’ll find details about each of these risks starting onpage 164. Overall past performance
This chart shows how a $10,000 investment in the fundWho should invest in this fund? would have changed in value, compared with a blended
index of 15% S&P/TSX Composite Index (Total Return),This portfolio may be suitable for you if:70% Scotia Capital (SC) Universe Bond Index and 15%
) you want a core balanced holding, which is well Morgan Stanley Capital International (MSCI) World Index.diversified by asset class, investment style, geographyand market capitalization
) you can accept medium risk
) you’re investing for at least three years.
Past performance at December 31
This section shows how the fund has performed in thepast and gives you an idea of the risk involved. Thesefigures don’t tell you how the fund will perform in thefuture.
Year-by-year returns
These charts show the fund’s annual performance, whichchanges from year to year.
$
$11,244(a)
$10,800
Scotia Partners Income & Modest Growth Portfolio
Blend of S&P/TSX Composite Index (Total Return),
SC Universe Bond Index and MSCI World Index
0
5,000
10,000
15,000
Dec.2002
Dec.2003
Class F Units
(a) Blend of S&P/TSX Composite Index (Total Return),
SC Universe Bond Index and MSCI World Index
(b) Scotia Partners Income & Modest Growth Portfolio
Class A Units
$11,163
$11,097(b)
% Class A Units The S&P/TSX Composite Index (Total Return) tracks the performance of some15of the largest and most widely held stocks listed on the Toronto StockExchange. Prior to May 1, 2002, this index was called the TSE 300
11.04%Composite Index and it tracked the 300 largest companies listed on the
10 Toronto Stock Exchange.7.32% The SC Universe Bond Index is a broad measure of the total return of
Canadian bonds that mature in more than one year. It includes approxi-5 mately 900 Canadian federal, provincial, municipal and corporate bonds
rated BBB or higher. The average term to maturity is 9.51 years and theaverage duration is 6.03 years.
0 The MSCI World Index is an index of approximately 1,600 companies listed2002 2003on stock exchanges in the 22 countries that make up the MSCI nationalindexes.
61
SC
OT
IA P
AR
TN
ER
S I
NC
OM
E &
MO
DE
ST
GR
OW
TH
PO
RT
FO
LIO
BA
LA
NC
ED
FU
ND
S

Annual compound returns Financial highlights, Class F unitsat December 31
This table shows the fund’s annual compound returns,Distributions and net asset value per unit
compared with a blended index of 15% S&P/TSX Compos-1999 2000 2001 2002 20032ite Index (Total Return), 70% SC Universe Bond Index
Distributionsand 15% MSCI World Index.Since from net income $ – – – – 0.09
1 year inceptionfrom realized gain $ – – – – 0.02
Scotia Partners Income &return of capital $ – – – – –Modest Growth Portfolio
Total annual distributions $ – – – – 0.11Class A units % 7.32 7.53Net asset value per unit $ – – – – 10.78Class F units % – 13.311
Blended Index % 9.96 2
1 February 10, 2003 Ratios and supplemental data2 Class A units 10.94% and Class F units 15.10%
1999 2000 2001 2002 20032
Net assets (000’s) $ – – – – 24Distribution policyNumber of units
The portfolio distributes any income and capital gains in outstanding (000’s) – – – – 2
MER3 % – – – – 1.32December of each calendar year.Portfolio turnover
Distributions on units held in Scotia registered plans are rate % – – – – 0.292 These figures are for the period from February 10, 2003 to Decem-always reinvested in additional units of the portfolio.
ber 31, 2003.Distributions on units held in other registered plans and
3 We may from time to time absorb some of the operating expenses thatnon-registered accounts are reinvested in additional units the fund would otherwise pay. In 2003, the management expense ratio
of the fund would have been 3.57% had we not absorbed some ofof the portfolio, unless you tell us in writing that youthese expenses.
want to receive cash distributions by cheque or by depositto your bank account. Fund expenses indirectly borne by investors
This example shows the fund’s expenses on a $1,000Financial highlights, Class A unitsat December 31 investment with a 5% annual return.Distributions and net asset value per unit
Fees and expensespayable over 1 year 3 years 5 years 10 years
1999 2000 2001 20021 2003Class A units $ 24.09 75.94 133.10 302.97
DistributionsClass F units $ 13.53 42.65 74.76 170.18
from net income $ – – – 0.01 0.09
from realized gain $ – – – – 0.02
return of capital $ – – – – –
Total annual distributions $ – – – 0.01 0.11
Net asset value per unit $ – – – 10.04 10.68
Ratios and supplemental data
1999 2000 2001 20021 2003
Net assets (000’s) $ – – – 1,176 38,489
Number of unitsoutstanding (000’s) – – – 117 3,603
MER % – – – 2.46 2.35
Portfolio turnoverrate % – – – – 0.291 These figures are for the period from November 29, 2002 to Decem-
ber 31, 2002.
62
SC
OT
IA P
AR
TN
ER
S I
NC
OM
E &
MO
DE
ST
GR
OW
TH
PO
RT
FO
LIO
BA
LA
NC
ED
FU
ND
S

Scotia Partners Balanced Income & Growth PortfolioFund details Top 10 holdings at September 30, 2004
Fund type Strategic asset allocation fund The information contained in this list may change due toDate established December 9, 2002 ongoing portfolio transactions of the fund. Current hold-Type of securities Class A and Class F units of a mutual ings may be found at www.scotiabank.com/mutualfunds.
fund trust
Eligible for Yes. Units of the fund are not foreign Scotia Canadian Income Fund Class I 29.45%registered plans? property.
Mackenzie Ivy Canadian Fund Series O 15.00%Portfolio advisor Scotia Capital Inc.
Bissett Bond Fund Class O 14.70%
AGF Canadian Stock Fund Series I 11.48%What does the fund invest in? Trimark Fund Series I 9.49%
Investment objectives CI Global Fund Class I 7.83%
Fidelity International Portfolio Fund Series O 5.80%The portfolio’s objective is to achieve a balance of currentTempleton Global Smaller Companies Fund Class O 5.16%income and long term capital appreciation, with a small
bias towards capital appreciation. It invests primarily in a You can get a copy of the simplified prospectus of thediversified mix of equity and income mutual funds underlying funds by calling us at 1-800-268-9269managed by other mutual fund managers and by us. (416-750-3863 in Toronto) for English, or 1-800-387-5004
for French, by asking your mutual fund representative, orAny change to the fundamental investment objectivesat www.sedar.com.must be approved by a majority of votes cast at a meeting
of unitholders called for that purpose.What are the risks of investing in the fund?
Investment strategies The portfolio indirectly has the same risks as theunderlying funds it holds. The fund takes on the risks ofThe portfolio is an asset allocation fund that allocatesan underlying fund in proportion to its investment in thatyour investment between three asset classes: fixed income,fund. The risks of the underlying funds include:Canadian equities and foreign equities.) interest rate riskThe table below outlines the target weighting for each) credit riskasset class in which the fund invests.) foreign investment riskTarget
Asset Class Weighting) currency risk
Fixed Income 45%) derivative riskCanadian Equities 26%
) repurchase and reverse repurchase transaction riskForeign Equities 29%
) securities lending riskThe underlying funds in which the fund invests may
) liquidity riskchange from time to time but the target weighting foreach asset class will not be more than 10% above or ) equity riskbelow the amounts set out above. You’ll find more ) small company riskinformation about investing in other mutual funds on
) concentration riskpage 2.) emerging markets risk
Although up to 100% of the fund’s assets may be invested) asset-backed and mortgage-backed securities riskin other mutual funds, the portfolio may hold a portion of) underlying fund risk.its assets in cash or money market instruments while
seeking investment opportunities or for defensive The portfolio also has class risk.purposes.
63
SC
OT
IA P
AR
TN
ER
S B
AL
AN
CE
D I
NC
OM
E &
GR
OW
TH
PO
RT
FO
LIO
BA
LA
NC
ED
FU
ND
S

% Class F UnitsDuring the 12 months preceding October 29, 2004, up to 25
29.5% of the net assets of the fund were invested in19.03%20
Scotia Canadian Income Fund, up to 15.1% of the net15assets of the fund were invested in Mackenzie Ivy
Canadian Fund Series O, up to 14.7% of the net assets of 10the fund were invested in Bissett Bond Fund Class O, up
5to 11.7% of the net assets of the fund were invested inAGF Canadian Stock Fund Series I and up to 10.5% of the 0
2003** Feb. 7, 2003 to Dec. 31, 2003net asset of the fund were invested in Trimark Fund
Series I.Overall past performance
You’ll find details about each of these risks starting onThis chart shows how a $10,000 investment in the fundpage 164.would have changed in value, compared with a blendedindex of 26% S&P/TSX Composite Index (Total Return),Who should invest in this fund?45% Scotia Capital (SC) Universe Bond Index and 29%
This portfolio may be suitable for you if: Morgan Stanley Capital International (MSCI) World Index.) you want a core balanced holding, which is well
diversified by asset class, investment style, geographyand market capitalization
) you can accept medium risk
) you’re investing for at least three years.
Past performanceat December 31
This section shows how the fund has performed in thepast and gives you an idea of the risk involved. Thesefigures don’t tell you how the fund will perform in thefuture.
Year-by-year returns
These charts show the fund’s annual performance, which
$
Dec.2003
Dec.2002
0
10,000
5,000
15,000
20,000
$11,367$11,096
$11,563(a)$11,635(b)
Scotia Partners Balanced Income & Growth Portfolio
Blend of S&P/TSX Composite Index (Total Return), SC Universe Bond Index and MSCI World Index
Class F Units(a) Blend of S&P/TSX Composite Index (Total Return),
SC Universe Bond Index and MSCI World Index
(b) Scotia Partners Balanced Income & Growth Portfolio
Class A Units
The S&P/TSX Composite Index (Total Return) tracks the performance of somechanges from year to year.of the largest and most widely held stocks listed on the Toronto Stock
% Exchange. Prior to May 1, 2002, this index was called the TSE 300Class A Units20 Composite Index and it tracked the 300 largest companies listed on the
Toronto Stock Exchange.
15 The SC Universe Bond Index is a broad measure of the total return ofCanadian bonds that mature in more than one year. It includes approxi-
10.48% mately 900 Canadian federal, provincial, municipal and corporate bonds10 rated BBB or higher. The average term to maturity is 9.51 years and the
7.47%average duration is 6.03 years.
5 The MSCI World Index is an index of approximately 1,600 companies listedon stock exchanges in the 22 countries that make up the MSCI nationalindexes.
02002 2003
64
SC
OT
IA P
AR
TN
ER
S B
AL
AN
CE
D I
NC
OM
E &
GR
OW
TH
PO
RT
FO
LIO
BA
LA
NC
ED
FU
ND
S

of the fund would have been 2.38% had we not absorbed some ofAnnual compound returnsthese expenses.
This table shows the fund’s annual compound returns,Financial highlights, Class F unitscompared with a blended index of 26% S&P/TSX Compos-at December 31ite Index (Total Return), 45% SC Universe Bond IndexDistributions and net asset value per unitand 29% MSCI World Index.
Since1 year inception 1999 2000 2001 2002 20033
Scotia Partners Balanced DistributionsIncome & Growth Portfolio from net income $ – – – – 0.01Class A units % 10.48 10.32 from realized gain $ – – – – –Class F units % – 19.031
return of capital $ – – – – –Blended Index % 12.44 2
Total annual distributions $ – – – – 0.011 February 7, 2003
Net asset value per unit $ – – – – 11.192 Class A units 12.86% and Class F units 19.92%
Ratios and supplemental dataDistribution policy
1999 2000 2001 2002 20033The portfolio distributes any income and capital gains inNet assets (000’s) $ – – – – 310December of each calendar year.Number of unitsoutstanding (000’s) – – – – 28Distributions on units held in Scotia registered plans areMER4 % – – – – 1.28always reinvested in additional units of the portfolio.Portfolio turnoverDistributions on units held in other registered plans andrate % – – – – –
non-registered accounts are reinvested in additional units 3 These figures are for the period from February 7, 2003 to December 31,2003.of the portfolio, unless you tell us in writing that you
4 We may from time to time absorb some of the operating expenses thatwant to receive cash distributions by cheque or by depositthe fund would otherwise pay. In 2003, the management expense ratio
to your bank account. of the fund would have been 1.65% had we not absorbed some ofthese expenses.
Financial highlights, Class A unitsFund expenses indirectly borne by investorsat December 31
Distributions and net asset value per unit This example shows the fund’s expenses on a $1,0001999 2000 2001 20021 2003 investment with a 5% annual return.
Distributions
from net income $ – – – – 0.01 Fees and expensespayable over 1 year 3 years 5 years 10 yearsfrom realized gain $ – – – 0.01 –Class A units $ 24.29 76.58 134.23 305.55return of capital $ – – – – –Class F units $ 13.12 41.36 72.50 165.02Total annual distributions $ – – – 0.01 0.01
Net asset value per unit $ – – – 10.03 11.09
Ratios and supplemental data1999 2000 2001 20021 2003
Net assets (000’s) $ – – – 1,455 90,738
Number of unitsoutstanding (000’s) – – – 145 8,180
MER2 % – – – 2.62 2.37
Portfolio turnoverrate % – – – – –1 These figures are for the period from November 29, 2002 to
December 31, 2002.2 We may from time to time absorb some of the operating expenses that
the fund would otherwise pay. In 2003, the management expense ratio
65
SC
OT
IA P
AR
TN
ER
S B
AL
AN
CE
D I
NC
OM
E &
GR
OW
TH
PO
RT
FO
LIO
BA
LA
NC
ED
FU
ND
S
Scotia Partners Conservative Growth PortfolioFund details Top 10 holdings at September 30, 2004
Fund type Strategic asset allocation fund The information contained in this list may change due toDate established December 9, 2002 ongoing portfolio transactions of the fund. Current hold-Type of securities Class A and Class F units of a mutual ings may be found at www.scotiabank.com/mutualfunds.
fund trust
Eligible for Yes. Units of the fund are not foreign Scotia Canadian Income Fund Class I 14.51%registered plans? property.
AGF RSP International Value Fund Series I 13.18%Portfolio advisor Scotia Capital Inc.
AIM Canadian First Class of AIM Canada Fund Inc.
Series I 10.68%
What does the fund invest in? CI Global Fund Class I 10.63%
Trimark Canadian Bond Fund Series I 9.76%Investment objectivesFidelity International Portfolio Fund Series O 9.53%
The portfolio’s objective is to achieve a balance of currentFidelity True North Fund Series O 9.33%
income and long term capital appreciation, with a biasAGF Canadian Stock Fund Series I 7.72%
towards capital appreciation. It invests primarily in aTempleton Global Smaller Companies Fund Class O 7.14%diversified mix of equity and income mutual fundsCI Harbour Fund Class I 6.74%managed by other mutual fund managers and by us.
You can get a copy of the simplified prospectus of theAny change to the fundamental investment objectivesunderlying funds by calling us at 1-800-268-9269must be approved by a majority of votes cast at a meeting(416-750-3863 in Toronto) for English, or 1-800-387-5004of unitholders called for that purpose.for French, by asking your mutual fund representative, orat www.sedar.com.Investment strategies
The portfolio is an asset allocation fund that allocates What are the risks of investing in the fund?your investment between three asset classes: fixed income,
The portfolio indirectly has the same risks as theCanadian equities and foreign equities.underlying funds it holds. The fund takes on the risks of
The table below outlines the target weighting for each an underlying fund in proportion to its investment in thatasset class in which the fund invests. fund. The risks of the underlying funds include:
Target ) interest rate riskAsset Class Weighting
) credit riskFixed Income 25%
) foreign investment riskCanadian Equities 33%
Foreign Equities 42% ) currency risk
) derivative riskThe underlying funds in which the fund invests may) repurchase and reverse repurchase transaction riskchange from time to time but the target weighting for
each asset class will not be more than 10% above or ) securities lending riskbelow the amounts set out above. You’ll find more
) liquidity riskinformation about investing in other mutual funds on
) equity riskpage 2.) small company risk
Although up to 100% of the fund’s assets may be invested) concentration riskin other mutual funds, the portfolio may hold a portion of
its assets in cash or money market instruments while ) emerging markets riskseeking investment opportunities or for defensive ) asset-backed and mortgage-backed securities riskpurposes.
) share class risk
66
SC
OT
IA P
AR
TN
ER
S C
ON
SE
RV
AT
IVE
GR
OW
TH
PO
RT
FO
LIO
BA
LA
NC
ED
FU
ND
S

% Class F Units) RSP Fund risk 35
28.60%30) counterparty risk25
) underlying fund risk.20
15The portfolio also has class risk.10
During the 12 months preceding October 29, 2004, up to5
14.5% of the net assets of the fund were invested in 02003*Scotia Canadian Income Fund, up to 14.4% of the net * Sept. 16, 2003 to Dec. 31, 2003
assets of the fund were invested in AGF RSP InternationalOverall past performanceValue Fund Series I, up to 10.7% of the net assets of theThis chart shows how a $10,000 investment in the fundfund were invested in AIM Canadian First Class of AIMwould have changed in value, compared with a blendedCanada Fund Inc. Series I, up to 11.8% of the net assetsindex of 33% S&P/TSX Composite Index (Total Return),of the fund were invested in CI Global Fund Class I and25% Scotia Capital (SC) Universe Bond Index and 42%up to 10.3% of the net asset of the fund were invested inMorgan Stanley Capital International (MSCI) World Index.Fidelity International Portfolio Fund Series O.
You’ll find details about each of these risks starting onpage 164.
Who should invest in this fund?
This portfolio may be suitable for you if:
) you want a core balanced holding, which is welldiversified by asset class, investment style, geographyand market capitalization
) you can accept medium risk
) you’re investing for at least three years.
Past performanceat December 31
This section shows how the fund has performed in thepast and gives you an idea of the risk involved. These
$
Dec.2003
Dec.2002
0
10,000
5,000
15,000
20,000
$11,516$11,502
$10,605(a)$10,649(b)
Scotia Partners Conservative Growth Portfolio
Blend of S&P/TSX Composite Index (Total Return), SC Universe Bond Index and MSCI World Index
Class F Units(a) Blend of S&P/TSX Composite Index (Total Return),
SC Universe Bond Index and MSCI World Index
(b) Scotia Partners Conservative Growth Portfolio
Class A Units
The S&P/TSX Composite Index (Total Return) tracks the performance of somefigures don’t tell you how the fund will perform in theof the largest and most widely held stocks listed on the Toronto Stockfuture. Exchange. Prior to May 1, 2002, this index was called the TSE 300Composite Index and it tracked the 300 largest companies listed on the
Year-by-year returns Toronto Stock Exchange.
The SC Universe Bond Index is a broad measure of the total return ofThese charts show the fund’s annual performance, whichCanadian bonds that mature in more than one year. It includes approxi-
changes from year to year. mately 900 Canadian federal, provincial, municipal and corporate bondsrated BBB or higher. The average term to maturity is 9.51 years and the
% Class A Units average duration is 6.03 years.20The MSCI World Index is an index of approximately 1,600 companies listedon stock exchanges in the 22 countries that make up the MSCI national15.08%
15 indexes.
10
5
1.05%
02002 2003
67
SC
OT
IA P
AR
TN
ER
S C
ON
SE
RV
AT
IVE
GR
OW
TH
PO
RT
FO
LIO
BA
LA
NC
ED
FU
ND
S

Annual compound returns Ratios and supplemental data
1999 2000 2001 20021 2003This table shows the fund’s annual compound returns,Net assets (000’s) $ – – – 2,066 75,479compared with a blended index of 33% S&P/TSX Compos-Number of unitsite Index (Total Return), 25% SC Universe Bond Indexoutstanding (000’s) – – – 206 6,555
and 42% MSCI World Index.MER2 % – – – 2.78 2.53Since
1 year inception Portfolio turnover rate % – – – – 0.89
Scotia Partners Conservative Growth Portfolio 1 These figures are for the period from November 29, 2002 to Decem-ber 31, 2002.
Class A units % 15.08 14.252 We may from time to time absorb some of the operating expenses that
Class F units % – 28.601the fund would otherwise pay. In 2003, the management expense ratioof the fund would have been 2.55% had we not absorbed some ofBlended Index % 14.13 2
these expenses.1 September 16, 20032 Class A units 14.12% and Class F units 26.50%
Financial highlights, Class F unitsat December 31Distribution policyDistributions and net asset value per unit
The portfolio distributes any income and capital gains in1999 2000 2001 2002 20033December of each calendar year.
Distributions
Distributions on units held in Scotia registered plans are from net income $ – – – – –
always reinvested in additional units of the portfolio. from realized gain $ – – – – –
return of capital $ – – – – –Distributions on units held in other registered plans andTotal annual distributions $ – – – – –non-registered accounts are reinvested in additional unitsNet asset value per unit $ – – – – 11.55of the portfolio, unless you tell us in writing that you
want to receive cash distributions by cheque or by depositRatios and supplemental datato your bank account.
1999 2000 2001 2002 20033
Financial highlights, Class A unitsNet assets (000’s) $ – – – – 72
at December 31Number of units
Distributions and net asset value per unit outstanding (000’s) – – – – 6
MER4 % – – – – 1.341999 2000 2001 20021 2003
Portfolio turnover rate % – – – – 0.89Distributions 3 These figures are for the period from September 16, 2003 tofrom net income $ – – – – – December 31, 2003.
from realized gain $ – – – – – 4 We may from time to time absorb some of the operating expenses thatthe fund would otherwise pay. In 2003, the management expense ratioreturn of capital $ – – – – –of the fund would have been 2.27% had we not absorbed some of
Total annual distributions $ – – – – – these expenses.
Net asset value per unit $ – – – 10.03 11.52
Fund expenses indirectly borne by investors
This example shows the fund’s expenses on a $1,000investment with a 5% annual return.
Fees and expensespayable over 1 year 3 years 5 years 10 years
Class A units $ 25.93 81.75 143.29 326.18
Class F units $ 13.74 43.30 75.89 172.76
68
SC
OT
IA P
AR
TN
ER
S C
ON
SE
RV
AT
IVE
GR
OW
TH
PO
RT
FO
LIO
BA
LA
NC
ED
FU
ND
S

Scotia Partners Aggressive Growth PortfolioFund details Top 10 holdings at September 30, 2004
Fund type Strategic asset allocation fund The information contained in this list may change due toDate established December 9, 2002 ongoing portfolio transactions of the fund. Current hold-Type of securities Class A and Class F units of a mutual ings may be found at www.scotiabank.com/mutualfunds.
fund trust
Eligible for Yes. Units of the fund are not foreign AGF RSP International Value Fund Series I 18.77%registered plans? property.
AIM Canadian First Class of AIM Canada Fund Inc.Portfolio advisor Scotia Capital Inc.
Series I 12.86%
CI Global Fund Class I 12.54%
What does the fund invest in? Fidelity True North Fund Series O 12.42%
Scotia Canadian Income Fund Class I 9.70%Investment objectivesFidelity International Portfolio Fund Series O 9.52%
The portfolio’s objective is long term capital appreciation.AIM Canadian Premier Fund Series I 8.38%
It invests primarily in a diversified mix of equity mutualCI Harbour Fund Class I 5.17%
funds, with additional stability derived from investmentsTempleton Global Smaller Companies Fund Class O 5.12%in income mutual funds, managed by other mutual fundMackenzie Ivy Enterprises Fund Series O 5.08%managers and by us.
You can get a copy of the simplified prospectus of theAny change to the fundamental investment objectivesunderlying funds by calling us at 1-800-268-9269must be approved by a majority of votes cast at a meeting(416-750-3863 in Toronto) for English, or 1-800-387-5004of unitholders called for that purpose.for French, by asking your mutual fund representative, orat www.sedar.com.Investment strategies
The portfolio is an asset allocation fund that allocates What are the risks of investing in the fund?your investment between three asset classes: fixed income,
The portfolio indirectly has the same risks as theCanadian equities and foreign equities.underlying funds it holds. The fund takes on the risks of
The table below outlines the target weighting for each an underlying fund in proportion to its investment in thatasset class in which the fund invests. fund. The risks of the underlying funds include:
Target) interest rate riskAsset Class Weighting
) credit riskFixed Income 10%
Canadian Equities 42% ) foreign investment riskForeign Equities 48%
) currency risk
) derivative riskThe underlying funds in which the fund invests maychange from time to time, but the target weighting for ) repurchase and reverse repurchase transaction riskeach asset class will not be more than 10% above or
) securities lending riskbelow the amounts set out above. You’ll find more
) liquidity riskinformation about investing in other mutual funds onpage 2. ) equity risk
) small company riskAlthough up to 100% of the fund’s assets may be investedin other mutual funds, the portfolio may hold a portion of ) concentration riskits assets in cash or money market instruments while ) emerging markets riskseeking investment opportunities or for defensive
) asset-backed and mortgage-backed securities riskpurposes.
69
SC
OT
IA P
AR
TN
ER
S A
GG
RE
SS
IVE
GR
OW
TH
PO
RT
FO
LIO
BA
LA
NC
ED
FU
ND
S

Overall past performance) share class risk
) RSP Fund risk This chart shows how a $10,000 investment in the fundwould have changed in value, compared with a blended) underlying fund risk.index of 42% S&P/TSX Composite Index (Total Return),
The portfolio also has class risk. 10% Scotia Capital (SC) Universe Bond Index and 48%Morgan Stanley Capital International (MSCI) World Index.During the 12 months preceding October 29, 2004, up to
20.3% of the net assets of the fund were invested in AGFRSP International Value Fund Series I, up to 12.9% of thenet assets of the fund were invested in AIM CanadianFirst Class of AIM Canada Fund Inc. Series I, up to 13.7%of the net assets of the fund were invested in CI GlobalFund Class I, up to 12.4% of the net assets of the fundwere invested in Fidelity True North Fund Series O andup to 10.2% of the net asset of the fund were invested inFidelity International Portfolio Fund Series O.
You’ll find details about each of these risks starting onpage 164.
$
$11,559
Scotia Partners Aggressive Growth Portfolio
Blend of S&P/TSX Composite Index (Total Return), SC Universe Bond Index and MSCI World Index
0
5,000
10,000
15,000
Dec.2002
Dec.2003
$11,662
Class A Units
The S&P/TSX Composite Index (Total Return) tracks the performance of someWho should invest in this fund?of the largest and most widely held stocks listed on the Toronto StockExchange. Prior to May 1, 2002, this index was called the TSE 300This portfolio may be suitable for you if: Composite Index and it tracked the 300 largest companies listed on theToronto Stock Exchange.
) you want a core balanced holding, which is wellThe SC Universe Bond Index is a broad measure of the total return of
diversified by asset class, investment style, geography Canadian bonds that mature in more than one year. It includes approxi-mately 900 Canadian federal, provincial, municipal and corporate bondsand market capitalizationrated BBB or higher. The average term to maturity is 9.51 years and theaverage duration is 6.03 years.) you can accept medium to higher riskThe MSCI World Index is an index of approximately 1,600 companies listed
) you’re investing for at least three years. on stock exchanges in the 22 countries that make up the MSCI nationalindexes.
Past performance at December 31
Annual compound returnsThis section shows how the fund has performed in thepast and gives you an idea of the risk involved. These This table shows the fund’s annual compound returns,’figures don’t tell you how the fund will perform in the compared with a blended index of 42% S&P/TSX Compos-future. ite Index (Total Return), 10% SC Universe Bond Index
and 48% MSCI World Index.Year-by-year returnsSince
1 year inceptionThis chart shows the fund’s annual performance, whichScotia Partners Aggressive Growth Portfolio
changes from year to year.Class A units % 15.56 14.66
% Class A Units Blended Index % 16.07 15.6320
15.56%15
10
5
0.37%0
2002 2003
70
SC
OT
IA P
AR
TN
ER
S A
GG
RE
SS
IVE
GR
OW
TH
PO
RT
FO
LIO
BA
LA
NC
ED
FU
ND
S

Distribution policy
The portfolio distributes any income and capital gains inDecember of each calendar year.
Distributions on units held in Scotia registered plans arealways reinvested in additional units of the portfolio.Distributions on units held in other registered plans andnon-registered accounts are reinvested in additional unitsof the portfolio, unless you tell us in writing that youwant to receive cash distributions by cheque or by depositto your bank account.
Financial highlights, Class A unitsat December 31
Distributions and net asset value per unit1999 2000 2001 20021 2003
Distributions
from net income $ – – – – –
from realized gain $ – – – – –
return of capital $ – – – – –
Total annual distributions $ – – – – –
Net asset value per unit $ – – – 10.03 11.56
Ratios and supplemental data1999 2000 2001 20021 2003
Net assets (000’s) $ – – – 549 20,662
Number of unitsoutstanding (000’s) – – – 55 1,788
MER2 % – – – 2.94 2.93
Portfolio turnover rate % – – – – 3.161 These figures are for the period from November 29, 2002 to
December 31, 2002.2 We may from time to time absorb some of the operating expenses that
the fund would otherwise pay. In 2003, the management expense ratioof the fund would have been 3.03% had we not absorbed some ofthese expenses.
Fund expenses indirectly borne by investors
This example shows the fund’s expenses on a $1,000investment with a 5% annual return.Fees and expensespayable over 1 year 3 years 5 years 10 years
Class A units $ 30.03 94.68 165.95 377.75
71
SC
OT
IA P
AR
TN
ER
S A
GG
RE
SS
IVE
GR
OW
TH
PO
RT
FO
LIO
BA
LA
NC
ED
FU
ND
S

Scotia Vision Conservative 2010 FundFund details Top 10 holdings
Fund type Strategic asset allocation fund Because the fund is new, top 10 holdings weren’t availableDate established June 10, 2005 when this prospectus was printed.Type of securities Class A units of a mutual fund trust
You can get a copy of the simplified prospectus of theEligible for Yes. Units of the fund are not foreignregistered plans? property. underlying funds by calling us at 1-800-268-9269Portfolio advisor Scotia Capital Inc. (416-750-3863 in Toronto) for English, or 1-800-387-5004
for French, by asking your mutual fund representative, orat www.sedar.com.What does the fund invest in?
Investment objectives What are the risks of investing in the fund?
The fund’s objective is to follow an asset allocation The fund indirectly has the same risks as the underlyingstrategy that emphasizes a balanced total return. The funds it holds. The fund takes on the risks of anfund will gradually shift its asset mix from an emphasis underlying fund in proportion to its investment in thaton equity funds to an emphasis on income and cash fund. The risks of the underlying funds include:equivalent funds as its target date (2010) approaches.
) class riskThe fund invests primarily in a diversified mix of mutual ) concentration riskfunds managed by us and by other mutual fund managers.
) credit riskAny change to the fundamental investment objectives ) currency riskmust be approved by a majority of votes cast at a meeting
) derivative riskof unitholders called for that purpose.) equity risk
Investment strategies ) emerging markets risk
) foreign investment riskThe fund is an asset allocation fund that allocates yourinvestment between four asset classes: cash equivalents, ) index riskfixed income, Canadian equities and foreign equities. The
) interest rate riskunderlying funds in which the fund invests may change) liquidity riskfrom time to time, based on the portfolio advisor’s
assessment of the markets and the underlying funds’ ) real estate sector riskability to help the fund achieve its investment objectives.
) repurchase and reverse repurchase transaction riskYou’ll find more information about investing in other
) securities lending riskmutual funds on page 2. The fund’s asset allocation) share class riskstrategy becomes increasingly conservative as its target
date approaches. ) small company risk
) underlying fund risk.Although up to 100% of the fund’s assets may be investedin other mutual funds, the fund may hold a portion of its
You’ll find details about each of these risks starting onassets in cash or money market instruments while seekingpage 164.investment opportunities or for defensive purposes.
In the year after the target date of the fund is reached, itis expected that the fund will merge into the ScotiaMoney Market Fund (or its successor), subject to thefund obtaining any required regulatory and unitholderapproval. Alternatively, the fund may be wound up.
72
SC
OT
IA V
ISIO
N C
ON
SE
RV
AT
IVE
20
10
FU
ND
BA
LA
NC
ED
FU
ND
S

Who should invest in this fund?
This fund may be suitable for you if:
) you’re planning to invest for a period of time consistentwith the fund’s target date
) you want a core balanced holding that becomes moreconservative as its target date approaches and is welldiversified by asset class, investment style, geographyand market capitalization
) you can accept medium risk.
Past performance
Past performance information is not available because thefund is new.
Distribution policy
The fund distributes any income and capital gains inDecember of each calendar year.
Distributions on units held in Scotia registered plans arealways reinvested in additional units of the fund. Distribu-tions on units held in other registered plans and non-registered accounts are reinvested in additional units ofthe fund, unless you tell us in writing that you want toreceive cash distributions by cheque or by deposit to yourbank account.
Financial highlights
Historical financial information is not available becausethe fund is new.
Fund expenses indirectly borne by investors
Fund expense information is not available because thefund is new.
73
SC
OT
IA V
ISIO
N C
ON
SE
RV
AT
IVE
20
10
FU
ND
BA
LA
NC
ED
FU
ND
S

Scotia Vision Aggressive 2010 FundFund details In the year after the target date of the fund is reached, it
is expected that the fund will merge into the ScotiaFund type Strategic asset allocation fund
Money Market Fund (or its successor), subject to theDate established June 10, 2005
fund obtaining any required regulatory and unitholderType of securities Class A units of a mutual fund trustapproval. Alternatively, the fund may be wound up.Eligible for Yes. Units of the fund are not foreign
registered plans? property.
Portfolio advisor Scotia Capital Inc. Top 10 holdings
Because the fund is new, top 10 holdings weren’t availableWhat does the fund invest in? when this prospectus was printed.Investment objectives You can get a copy of the simplified prospectus of the
underlying funds by calling us at 1-800-268-9269The fund’s objective is to follow an asset allocation(416-750-3863 in Toronto) for English, or 1-800-387-5004strategy that emphasizes a balanced total return. Thefor French, by asking your mutual fund representative, orfund will gradually shift its asset mix from an emphasisat www.sedar.com.on equity funds to an emphasis on income and cash
equivalent funds as its target date (2010) approaches.What are the risks of investing in the fund?
The fund invests primarily in a diversified mix of mutualThe fund indirectly has the same risks as the underlyingfunds managed by us and by other mutual fund managers.funds it holds. The fund takes on the risks of an
Any change to the fundamental investment objectives underlying fund in proportion to its investment in thatmust be approved by a majority of votes cast at a meeting fund. The risks of the underlying funds include:of unitholders called for that purpose.
) class risk
) concentration riskInvestment strategies
) credit riskThe fund is an asset allocation fund that allocates your) currency riskinvestment between four asset classes: cash equivalents,
fixed income, Canadian equities and foreign equities. ) derivative riskCompared to the Scotia Vision Conservative 2010 Fund,
) equity riskthe fund will have greater exposure to equity investments) emerging markets riskin the initial period after it’s established. The underlying
funds in which the fund invests may change from time to ) foreign investment risktime, based on the portfolio advisor’s assessment of the
) index riskmarkets and the underlying funds’ ability to help the fund
) interest rate riskachieve its investment objectives. You’ll find more informa-) liquidity risktion about investing in other mutual funds on page 2. The
fund’s asset allocation strategy becomes increasingly ) real estate sector riskconservative as its target date approaches.
) repurchase and reverse repurchase transaction riskAlthough up to 100% of the fund’s assets may be invested ) securities lending riskin other mutual funds, the fund may hold a portion of its
) share class riskassets in cash or money market instruments while seeking) small company riskinvestment opportunities or for defensive purposes.) underlying fund risk.
You’ll find details about each of these risks starting onpage 164.
74
SC
OT
IA V
ISIO
N A
GG
RE
SS
IVE
20
10
FU
ND
BA
LA
NC
ED
FU
ND
S

Who should invest in this fund?
This fund may be suitable for you if:
) you’re planning to invest for a period of time consistentwith the fund’s target date
) you want a core balanced holding that becomes moreconservative as its target date approaches and is welldiversified by asset class, investment style, geographyand market capitalization
) you can accept medium risk.
Past performance
Past performance information is not available because thefund is new.
Distribution policy
The fund distributes any income and capital gains inDecember of each calendar year.
Distributions on units held in Scotia registered plans arealways reinvested in additional units of the fund. Distribu-tions on units held in other registered plans and non-registered accounts are reinvested in additional units ofthe fund, unless you tell us in writing that you want toreceive cash distributions by cheque or by deposit to yourbank account.
Financial highlights
Historical financial information is not available becausethe fund is new.
Fund expenses indirectly borne by investors
Fund expense information is not available because thefund is new.
75
SC
OT
IA V
ISIO
N A
GG
RE
SS
IVE
20
10
FU
ND
BA
LA
NC
ED
FU
ND
S

Scotia Vision Conservative 2015 FundFund details Top 10 holdings
Fund type Strategic asset allocation fund Because the fund is new, top 10 holdings weren’t availableDate established June 10, 2005 when this prospectus was printed.Type of securities Class A units of a mutual fund trust
You can get a copy of the simplified prospectus of theEligible for Yes. Units of the fund are not foreignregistered plans? property. underlying funds by calling us at 1-800-268-9269Portfolio advisor Scotia Capital Inc. (416-750-3863 in Toronto) for English, or 1-800-387-5004
for French, by asking your mutual fund representative, orat www.sedar.com.What does the fund invest in?
Investment objectives What are the risks of investing in the fund?
The fund’s objective is to follow an asset allocation The fund indirectly has the same risks as the underlyingstrategy that emphasizes a balanced total return. The funds it holds. The fund takes on the risks of anfund will gradually shift its asset mix from an emphasis underlying fund in proportion to its investment in thaton equity funds to an emphasis on income and cash fund. The risks of the underlying funds include:equivalent funds as its target date (2015) approaches.
) class riskThe fund invests primarily in a diversified mix of mutual ) concentration riskfunds managed by us and by other mutual fund managers.
) credit riskAny change to the fundamental investment objectives ) currency riskmust be approved by a majority of votes cast at a meeting
) derivative riskof unitholders called for that purpose.) equity risk
Investment strategies ) emerging markets risk
) foreign investment riskThe fund is an asset allocation fund that allocates yourinvestment between four asset classes: cash equivalents, ) index riskfixed income, Canadian equities and foreign equities. The
) interest rate riskunderlying funds in which the fund invests may change) liquidity riskfrom time to time, based on the portfolio advisor’s
assessment of the markets and the underlying funds’ ) real estate sector riskability to help the fund achieve its investment objectives.
) repurchase and reverse repurchase transaction riskYou’ll find more information about investing in other
) securities lending riskmutual funds on page 2. The fund’s asset allocation) share class riskstrategy becomes increasingly conservative as its target
date approaches. ) small company risk
) underlying fund risk.Although up to 100% of the fund’s assets may be investedin other mutual funds, the fund may hold a portion of its
You’ll find details about each of these risks starting onassets in cash or money market instruments while seekingpage 164.investment opportunities or for defensive purposes.
In the year after the target date of the fund is reached, itis expected that the fund will merge into the ScotiaMoney Market Fund (or its successor), subject to thefund obtaining any required regulatory and unitholderapproval. Alternatively, the fund may be wound up.
76
SC
OT
IA V
ISIO
N C
ON
SE
RV
AT
IVE
20
15
FU
ND
BA
LA
NC
ED
FU
ND
S

Who should invest in this fund?
This fund may be suitable for you if:
) you’re planning to invest for a period of time consistentwith the fund’s target date
) you want a core balanced holding that becomes moreconservative as its target date approaches and is welldiversified by asset class, investment style, geographyand market capitalization
) you can accept medium risk.
Past performance
Past performance information is not available because thefund is new.
Distribution policy
The fund distributes any income and capital gains inDecember of each calendar year.
Distributions on units held in Scotia registered plans arealways reinvested in additional units of the fund. Distribu-tions on units held in other registered plans and non-registered accounts are reinvested in additional units ofthe fund, unless you tell us in writing that you want toreceive cash distributions by cheque or by deposit to yourbank account.
Financial highlights
Historical financial information is not available becausethe fund is new.
Fund expenses indirectly borne by investors
Fund expense information is not available because thefund is new.
77
SC
OT
IA V
ISIO
N C
ON
SE
RV
AT
IVE
20
15
FU
ND
BA
LA
NC
ED
FU
ND
S

Scotia Vision Aggressive 2015 FundFund details In the year after the target date of the fund is reached, it
is expected that the fund will merge into the ScotiaFund type Strategic asset allocation fund
Money Market Fund (or its successor), subject to theDate established June 10, 2005
fund obtaining any required regulatory and unitholderType of securities Class A units of a mutual fund trustapproval. Alternatively, the fund may be wound up.Eligible for Yes. Units of the fund are not foreign
registered plans? property.
Portfolio advisor Scotia Capital Inc. Top 10 holdings
Because the fund is new, top 10 holdings weren’t availableWhat does the fund invest in? when this prospectus was printed.
Investment objectivesYou can get a copy of the simplified prospectus of theunderlying funds by calling us at 1-800-268-9269The fund’s objective is to follow an asset allocation(416-750-3863 in Toronto) for English, or 1-800-387-5004strategy that emphasizes a balanced total return. Thefor French, by asking your mutual fund representative, orfund will gradually shift its asset mix from an emphasisat www.sedar.com.on equity funds to an emphasis on income and cash
equivalent funds as its target date (2015) approaches.What are the risks of investing in the fund?
The fund invests primarily in a diversified mix of mutualThe fund indirectly has the same risks as the underlyingfunds managed by us and by other mutual fund managers.funds it holds. The fund takes on the risks of an
Any change to the fundamental investment objectives underlying fund in proportion to its investment in thatmust be approved by a majority of votes cast at a meeting fund. The risks of the underlying funds include:of unitholders called for that purpose.
) class risk
) concentration riskInvestment strategies
) credit riskThe fund is an asset allocation fund that allocates your) currency riskinvestment between four asset classes: cash equivalents,
fixed income, Canadian equities and foreign equities. ) derivative riskCompared to the Scotia Vision Conservative 2015 Fund,
) equity riskthe fund will have greater exposure to equity investments
) emerging markets riskin the initial period after it’s established. The underlyingfunds in which the fund invests may change from time to ) foreign investment risktime, based on the portfolio advisor’s assessment of the
) index riskmarkets and the underlying funds’ ability to help the fund
) interest rate riskachieve its investment objectives. You’ll find more informa-) liquidity risktion about investing in other mutual funds on page 2. The
fund’s asset allocation strategy becomes increasingly ) real estate sector riskconservative as its target date approaches.
) repurchase and reverse repurchase transaction risk
Although up to 100% of the fund’s assets may be invested ) securities lending riskin other mutual funds, the fund may hold a portion of its
) share class riskassets in cash or money market instruments while seeking
) small company riskinvestment opportunities or for defensive purposes.
) underlying fund risk.
You’ll find details about each of these risks starting onpage 164.
78
SC
OT
IA V
ISIO
N A
GG
RE
SS
IVE
20
15
FU
ND
BA
LA
NC
ED
FU
ND
S

Who should invest in this fund?
This fund may be suitable for you if:
) you’re planning to invest for a period of time consistentwith the fund’s target date
) you want a core balanced holding that becomes moreconservative as its target date approaches and is welldiversified by asset class, investment style, geographyand market capitalization
) you can accept medium risk.
Past performance
Past performance information is not available because thefund is new.
Distribution policy
The fund distributes any income and capital gains inDecember of each calendar year.
Distributions on units held in Scotia registered plans arealways reinvested in additional units of the fund. Distribu-tions on units held in other registered plans and non-registered accounts are reinvested in additional units ofthe fund, unless you tell us in writing that you want toreceive cash distributions by cheque or by deposit to yourbank account.
Financial highlights
Historical financial information is not available becausethe fund is new.
Fund expenses indirectly borne by investors
Fund expense information is not available because thefund is new.
79
SC
OT
IA V
ISIO
N A
GG
RE
SS
IVE
20
15
FU
ND
BA
LA
NC
ED
FU
ND
S

Scotia Vision Conservative 2020 FundFund details Top 10 holdings
Fund type Strategic asset allocation fund Because the fund is new, top 10 holdings weren’t availableDate established June 10, 2005 when this prospectus was printed.Type of securities Class A units of a mutual fund trust
You can get a copy of the simplified prospectus of theEligible for Yes. Units of the fund are not foreignregistered plans? property. underlying funds by calling us at 1-800-268-9269Portfolio advisor Scotia Capital Inc. (416-750-3863 in Toronto) for English, or 1-800-387-5004
for French, by asking your mutual fund representative, orat www.sedar.com.What does the fund invest in?
Investment objectives What are the risks of investing in the fund?
The fund’s objective is to follow an asset allocation The fund indirectly has the same risks as the underlyingstrategy that emphasizes a balanced total return. The funds it holds. The fund takes on the risks of anfund will gradually shift its asset mix from an emphasis underlying fund in proportion to its investment in thaton equity funds to an emphasis on income and cash fund. The risks of the underlying funds include:equivalent funds as its target date (2020) approaches.
) class riskThe fund invests primarily in a diversified mix of mutual ) concentration riskfunds managed by us and by other mutual fund managers.
) credit riskAny change to the fundamental investment objectives ) currency riskmust be approved by a majority of votes cast at a meeting
) derivative riskof unitholders called for that purpose.) equity risk
Investment strategies ) emerging markets risk
) foreign investment riskThe fund is an asset allocation fund that allocates yourinvestment between four asset classes: cash equivalents, ) index riskfixed income, Canadian equities and foreign equities. The
) interest rate riskunderlying funds in which the fund invests may change
) liquidity riskfrom time to time, based on the portfolio advisor’sassessment of the markets and the underlying funds’ ) real estate sector riskability to help the fund achieve its investment objectives.
) repurchase and reverse repurchase transaction riskYou’ll find more information about investing in other
) securities lending riskmutual funds on page 2. The fund’s asset allocation) share class riskstrategy becomes increasingly conservative as its target
date approaches. ) small company risk
) underlying fund risk.Although up to 100% of the fund’s assets may be investedin other mutual funds, the fund may hold a portion of its
You’ll find details about each of these risks starting onassets in cash or money market instruments while seeking
page 164.investment opportunities or for defensive purposes.
In the year after the target date of the fund is reached, itis expected that the fund will merge into the ScotiaMoney Market Fund (or its successor), subject to thefund obtaining any required regulatory and unitholderapproval. Alternatively, the fund may be wound up.
80
SC
OT
IA V
ISIO
N C
ON
SE
RV
AT
IVE
20
20
FU
ND
BA
LA
NC
ED
FU
ND
S

Who should invest in this fund?
This fund may be suitable for you if:
) you’re planning to invest for a period of time consistentwith the fund’s target date
) you want a core balanced holding that becomes moreconservative as its target date approaches and is welldiversified by asset class, investment style, geographyand market capitalization
) you can accept medium to higher risk.
Past performance
Past performance information is not available because thefund is new.
Distribution policy
The fund distributes any income and capital gains inDecember of each calendar year.
Distributions on units held in Scotia registered plans arealways reinvested in additional units of the fund. Distribu-tions on units held in other registered plans and non-registered accounts are reinvested in additional units ofthe fund, unless you tell us in writing that you want toreceive cash distributions by cheque or by deposit to yourbank account.
Financial highlights
Historical financial information is not available becausethe fund is new.
Fund expenses indirectly borne by investors
Fund expense information is not available because thefund is new.
81
SC
OT
IA V
ISIO
N C
ON
SE
RV
AT
IVE
20
20
FU
ND
BA
LA
NC
ED
FU
ND
S

Scotia Vision Aggressive 2020 FundFund details In the year after the target date of the fund is reached, it
is expected that the fund will merge into the ScotiaFund type Strategic asset allocation fund
Money Market Fund (or its successor), subject to theDate established June 10, 2005
fund obtaining any required regulatory and unitholderType of securities Class A units of a mutual fund trustapproval. Alternatively, the fund may be wound up.Eligible for Yes. Units of the fund are not foreign
registered plans? property.
Portfolio advisor Scotia Capital Inc. Top 10 holdings
Because the fund is new, top 10 holdings weren’t availableWhat does the fund invest in? when this prospectus was printed.
Investment objectivesYou can get a copy of the simplified prospectus of theunderlying funds by calling us at 1-800-268-9269The fund’s objective is to follow an asset allocation(416-750-3863 in Toronto) for English, or 1-800-387-5004strategy that emphasizes a balanced total return. Thefor French, by asking your mutual fund representative, orfund will gradually shift its asset mix from an emphasisat www.sedar.com.on equity funds to an emphasis on income and cash
equivalent funds as its target date (2020) approaches.What are the risks of investing in the fund?
The fund invests primarily in a diversified mix of mutualThe fund indirectly has the same risks as the underlyingfunds managed by us and by other mutual fund managers.funds it holds. The fund takes on the risks of an
Any change to the fundamental investment objectives underlying fund in proportion to its investment in thatmust be approved by a majority of votes cast at a meeting fund. The risks of the underlying funds include:of unitholders called for that purpose.
) class risk
) concentration riskInvestment strategies
) credit riskThe fund is an asset allocation fund that allocates your) currency riskinvestment between four asset classes: cash equivalents,
fixed income, Canadian equities and foreign equities. ) derivative riskCompared to the Scotia Vision Conservative 2020 Fund,
) equity riskthe fund will have greater exposure to equity investments
) emerging markets riskin the initial period after it’s established. The underlyingfunds in which the fund invests may change from time to ) foreign investment risktime, based on the portfolio advisor’s assessment of the
) index riskmarkets and the underlying funds’ ability to help the fund
) interest rate riskachieve its investment objectives. You’ll find more informa-) liquidity risktion about investing in other mutual funds on page 2. The
fund’s asset allocation strategy becomes increasingly ) real estate sector riskconservative as its target date approaches.
) repurchase and reverse repurchase transaction risk
Although up to 100% of the fund’s assets may be invested ) securities lending riskin other mutual funds, the fund may hold a portion of its
) share class riskassets in cash or money market instruments while seeking
) small company riskinvestment opportunities or for defensive purposes.
) underlying fund risk.
You’ll find details about each of these risks starting onpage 164.
82
SC
OT
IA V
ISIO
N A
GG
RE
SS
IVE
20
20
FU
ND
BA
LA
NC
ED
FU
ND
S

Who should invest in this fund?
This fund may be suitable for you if:
) you’re planning to invest for a period of time consistentwith the fund’s target date
) you want a core balanced holding that becomes moreconservative as its target date approaches and is welldiversified by asset class, investment style, geographyand market capitalization
) you can accept medium to higher risk.
Past performance
Past performance information is not available because thefund is new.
Distribution policy
The fund distributes any income and capital gains inDecember of each calendar year.
Distributions on units held in Scotia registered plans arealways reinvested in additional units of the fund. Distribu-tions on units held in other registered plans and non-registered accounts are reinvested in additional units ofthe fund, unless you tell us in writing that you want toreceive cash distributions by cheque or by deposit to yourbank account.
Financial highlights
Historical financial information is not available becausethe fund is new.
Fund expenses indirectly borne by investors
Fund expense information is not available because thefund is new.
83
SC
OT
IA V
ISIO
N A
GG
RE
SS
IVE
20
20
FU
ND
BA
LA
NC
ED
FU
ND
S

Scotia Vision Conservative 2030 FundFund details Top 10 holdings
Fund type Strategic asset allocation fund Because the fund is new, top 10 holdings weren’t availableDate established June 10, 2005 when this prospectus was printed.Type of securities Class A units of a mutual fund trust
You can get a copy of the simplified prospectus of theEligible for Yes. Units of the fund are not foreignregistered plans? property. underlying funds by calling us at 1-800-268-9269Portfolio advisor Scotia Capital Inc. (416-750-3863 in Toronto) for English, or 1-800-387-5004
for French, by asking your mutual fund representative, orat www.sedar.com.What does the fund invest in?
Investment objectives What are the risks of investing in the fund?
The fund’s objective is to follow an asset allocation The fund indirectly has the same risks as the underlyingstrategy that emphasizes a balanced total return. The funds it holds. The fund takes on the risks of anfund will gradually shift its asset mix from an emphasis underlying fund in proportion to its investment in thaton equity funds to an emphasis on income and cash fund. The risks of the underlying funds include:equivalent funds as its target date (2030) approaches.
) class riskThe fund invests primarily in a diversified mix of mutual ) concentration riskfunds managed by us and by other mutual fund managers.
) credit riskAny change to the fundamental investment objectives ) currency riskmust be approved by a majority of votes cast at a meeting
) derivative riskof unitholders called for that purpose.) equity risk
Investment strategies ) emerging markets risk
) foreign investment riskThe fund is an asset allocation fund that allocates yourinvestment between four asset classes: cash equivalents, ) index riskfixed income, Canadian equities and foreign equities. The
) interest rate riskunderlying funds in which the fund invests may change
) liquidity riskfrom time to time, based on the portfolio advisor’sassessment of the markets and the underlying funds’ ) real estate sector riskability to help the fund achieve its investment objectives.
) repurchase and reverse repurchase transaction riskYou’ll find more information about investing in other
) securities lending riskmutual funds on page 2. The fund’s asset allocation) share class riskstrategy becomes increasingly conservative as its target
date approaches. ) small company risk
) underlying fund risk.Although up to 100% of the fund’s assets may be investedin other mutual funds, the fund may hold a portion of its
You’ll find details about each of these risks starting onassets in cash or money market instruments while seeking
page 164.investment opportunities or for defensive purposes.
In the year after the target date of the fund is reached, itis expected that the fund will merge into the ScotiaMoney Market Fund (or its successor), subject to thefund obtaining any required regulatory and unitholderapproval. Alternatively, the fund may be wound up.
84
SC
OT
IA V
ISIO
N C
ON
SE
RV
AT
IVE
20
30
FU
ND
BA
LA
NC
ED
FU
ND
S

Who should invest in this fund?
This fund may be suitable for you if:
) you’re planning to invest for a period of time consistentwith the fund’s target date
) you want a core balanced holding that becomes moreconservative as its target date approaches and is welldiversified by asset class, investment style, geographyand market capitalization
) you can accept medium to higher risk.
Past performance
Past performance information is not available because thefund is new.
Distribution policy
The fund distributes any income and capital gains inDecember of each calendar year.
Distributions on units held in Scotia registered plans arealways reinvested in additional units of the fund. Distribu-tions on units held in other registered plans and non-registered accounts are reinvested in additional units ofthe fund, unless you tell us in writing that you want toreceive cash distributions by cheque or by deposit to yourbank account.
Financial highlights
Historical financial information is not available becausethe fund is new.
Fund expenses indirectly borne by investors
Fund expense information is not available because thefund is new.
85
SC
OT
IA V
ISIO
N C
ON
SE
RV
AT
IVE
20
30
FU
ND
BA
LA
NC
ED
FU
ND
S

Scotia Vision Aggressive 2030 FundFund details In the year after the target date of the fund is reached, it
is expected that the fund will merge into the ScotiaFund type Strategic asset allocation fund
Money Market Fund (or its successor), subject to theDate established June 10, 2005
fund obtaining any required regulatory and unitholderType of securities Class A units of a mutual fund trustapproval. Alternatively, the fund may be wound up.Eligible for Yes. Units of the fund are not foreign
registered plans? property.
Portfolio advisor Scotia Capital Inc. Top 10 holdings
Because the fund is new, top 10 holdings weren’t availableWhat does the fund invest in? when this prospectus was printed.
Investment objectivesYou can get a copy of the simplified prospectus of theunderlying funds by calling us at 1-800-268-9269The fund’s objective is to follow an asset allocation(416-750-3863 in Toronto) for English, or 1-800-387-5004strategy that emphasizes a balanced total return. Thefor French, by asking your mutual fund representative, orfund will gradually shift its asset mix from an emphasisat www.sedar.com.on equity funds to an emphasis on income and cash
equivalent funds as its target date (2030) approaches.What are the risks of investing in the fund?
The fund invests primarily in a diversified mix of mutualThe fund indirectly has the same risks as the underlyingfunds managed by us and by other mutual fund managers.funds it holds. The fund takes on the risks of an
Any change to the fundamental investment objectives underlying fund in proportion to its investment in thatmust be approved by a majority of votes cast at a meeting fund. The risks of the underlying funds include:of unitholders called for that purpose.
) class risk
) concentration riskInvestment strategies
) credit riskThe fund is an asset allocation fund that allocates your) currency riskinvestment between four asset classes: cash equivalents,
fixed income, Canadian equities and foreign equities. ) derivative riskCompared to the Scotia Vision Conservative 2030 Fund,
) equity riskthe fund will have greater exposure to equity investments
) emerging markets riskin the initial period after it’s established. The underlyingfunds in which the fund invests may change from time to ) foreign investment risktime, based on the portfolio advisor’s assessment of the
) index riskmarkets and the underlying funds’ ability to help the fund
) interest rate riskachieve its investment objectives. You’ll find more informa-) liquidity risktion about investing in other mutual funds on page 2. The
fund’s asset allocation strategy becomes increasingly ) real estate sector riskconservative as its target date approaches.
) repurchase and reverse repurchase transaction risk
Although up to 100% of the fund’s assets may be invested ) securities lending riskin other mutual funds, the fund may hold a portion of its
) share class riskassets in cash or money market instruments while seeking
) small company riskinvestment opportunities or for defensive purposes.
) underlying fund risk.
You’ll find details about each of these risks starting onpage 164.
86
SC
OT
IA V
ISIO
N A
GG
RE
SS
IVE
20
30
FU
ND
BA
LA
NC
ED
FU
ND
S

Who should invest in this fund?
This fund may be suitable for you if:
) you’re planning to invest for a period of time consistentwith the fund’s target date
) you want a core balanced holding that becomes moreconservative as its target date approaches and is welldiversified by asset class, investment style, geographyand market capitalization
) you can accept medium to higher risk.
Past performance
Past performance information is not available because thefund is new.
Distribution policy
The fund distributes any income and capital gains inDecember of each calendar year.
Distributions on units held in Scotia registered plans arealways reinvested in additional units of the fund. Distribu-tions on units held in other registered plans and non-registered accounts are reinvested in additional units ofthe fund, unless you tell us in writing that you want toreceive cash distributions by cheque or by deposit to yourbank account.
Financial highlights
Historical financial information is not available becausethe fund is new.
Fund expenses indirectly borne by investors
Fund expense information is not available because thefund is new.
87
SC
OT
IA V
ISIO
N A
GG
RE
SS
IVE
20
30
FU
ND
BA
LA
NC
ED
FU
ND
S


Equity Funds
Canadian Equity Funds
Scotia Canadian Stock Index Fund
Scotia Canadian Dividend Fund
Scotia Canadian Blue Chip Fund
Scotia Canadian Growth Fund
Scotia Canadian Small Cap Fund
Scotia Resource Fund
Foreign Equity Funds
Scotia American Stock Index Fund
Scotia American Growth Fund
Scotia CanAm Stock Index Fund
Scotia Nasdaq Index Fund
Scotia Young Investors Fund
Scotia International Stock Index Fund
Scotia Global Growth Fund
Scotia European Growth Fund
Scotia Pacific Rim Growth Fund
Scotia Latin American Growth Fund
Capital International Series Funds
Capital U.S. Large Companies Fund
Capital U.S. Large Companies RSP Fund
Capital U.S. Small Companies Fund
Capital U.S. Small Companies RSP Fund
Capital International Large Companies Fund
Capital International Large Companies RSP Fund
Capital Global Discovery Fund
Capital Global Discovery RSP Fund
Capital Global Small Companies Fund
Capital Global Small Companies RSP Fund
The equity funds offer the greatest potential for long-termgrowth. They invest mainly in common shares and other equitysecurities of companies in Canada and around the world. Thesefunds also have higher risk because the prices of equitysecurities can change significantly in a short period of time. Theamount of risk depends on the securities in which a fundinvests. Funds that concentrate on a particular industry orgeographic area usually have more risk than funds that aremore broadly diversified.
Equity funds can add growth potential to your portfolio. They’rea good choice if you don’t need income and can acceptpossible declines in the value of your investment in the shortterm.
89
Equi
ty F
unds
Scotia Canadian Stock Index FundFund details Top 10 holdings at September 30, 2004
Fund type Canadian equity fund Manulife Financial Corporation 5.20%
Date established December 31, 1996 Royal Bank of Canada 4.49%Type of securities Class A, Class F and Class I units of a
Bank of Nova Scotia 4.32%mutual fund trust
Toronto-Dominion Bank 3.46%Eligible for Yes. Units of the fund are not foreignregistered plans? property. Bank of Montreal 3.22%Portfolio advisor State Street Global Advisors, Ltd. EnCana Corporation 3.08%
BCE Inc. 2.92%
Canadian Imperial Bank of Commerce 2.73%What does the fund invest in?Sun Life Financial Services of Canada Inc. 2.63%Investment objectivesAlcan Inc. 2.56%
The fund’s objective is long-term capital growth bytracking the performance of a generally recognized What are the risks of investing in the fund?Canadian equity index, currently the S&P/TSX Composite
The main risks of investing in this fund are:Index1. It invests primarily in the stocks that are includedin the index. ) equity risk
) index riskAny change to the fundamental investment objectivesmust be approved by a majority of votes cast at a meeting ) concentration riskof unitholders called for that purpose.
) liquidity risk.
Investment strategies The fund may also have these additional risks:
) derivative riskThe portfolio advisor aims to track the performance of theS&P/TSX Composite Index as closely as possible by: ) repurchase and reverse repurchase transaction risk) investing in the stocks that are included in the S&P/ ) securities lending risk
TSX Composite Index in substantially the same propor-) underlying fund risk.
tion as they’re weighted in the IndexYou’ll find details about each risk starting on page 164.) keeping the portfolio as fully invested as possible
) minimizing transaction costs.Who should invest in this fund?
The portfolio advisor may use derivatives such as options, This fund may be suitable for you if:futures and forward contracts to gain exposure to the
) you want the growth potential of Canadian equityS&P/TSX Composite Index. It will only use derivatives assecurities while tracking the performance of a majorpermitted by securities regulations.market index
The fund may participate in repurchase, reverse repur-) you’re investing for at least three years
chase and securities lending transactions to achieve the) you can accept medium risk.fund’s overall investment objectives and to enhance the
fund’s returns. You’ll find more information about repur-chase, reverse repurchase and securities lending transac-tions on page 3.
1 The S&P/TSX Composite Index is published by the Toronto Stock Exchangeand Standard & Poor’s. Standard & Poor’s, a division of the McGraw-HillCompanies Inc., and the Toronto Stock Exchange have no connection withScotia Securities Inc. and have not passed upon the merits of investing inthe fund.
90
SC
OT
IA C
AN
AD
IAN
ST
OC
K I
ND
EX
FU
ND
EQ
UIT
Y F
UN
DS

The S&P/TSX Composite Index (Total Return) tracks the performance of somePast performance at December 31of the largest and most widely held stocks listed on the Toronto StockExchange. Prior to May 1, 2002, this index was called the TSE 300This section shows how the fund has performed in theComposite Index and it tracked the 300 largest companies listed on the
past and gives you an idea of the risk involved. These Toronto Stock Exchange.
figures don’t tell you how the fund will perform in theAnnual compound returnsfuture.This table shows the fund’s annual compound returns,
Year-by-year returns compared with the S&P/TSX Composite Index (TotalThese charts show the fund’s annual performance, which Return).
Sincechanges from year to year.1 year 3 years 5 years inception
% Scotia Canadian Stock Index FundClass A Units40
Class A units % 25.39 -2.02 6.44 6.1330.94%30 25.39% Class F units % – – – 58.151
20 S&P/TSX Composite Index13.62%
10.93% (Total Return) % 26.72 -1.01 6.54 2
101 October 10, 2003
0 2 Class A units 6.49% and Class F units 59.93%-2.28%
-10-13.26% Distribution policy-13.53%
-201997 1998 1999 2000 2001 2002 2003 The fund distributes any income and capital gains in
% Class F Units December of each calendar year.70
58.15%60 Distributions on units held in Scotia registered plans and50 Copilot non-registered accounts are always reinvested in40 additional units of the fund. Distributions on units held in30 other registered plans and non-registered accounts are20 reinvested in additional units of the fund, unless you tell10 us in writing that you want to receive cash distributions0
2003* by cheque or by deposit to your bank account.* Oct. 10, 2003 to Dec. 31, 2003
Financial highlights, Class A unitsOverall past performance at December 31This chart shows how a $10,000 investment in the fund Distributions and net asset value per unitwould have changed in value, compared with the S&P/TSX 1999 2000 2001 2002 2003
Composite Index (Total Return). Distributions
from net income $ 0.11 0.15 – 0.11 0.09
from realized gain $ – 0.88 – – –
return of capital $ – – – – –
Total annual distributions $ 0.11 1.03 – 0.11 0.09
Net asset value per unit $ 14.24 14.75 12.75 10.94 13.64
Ratios and supplemental data1999 2000 2001 2002 2003
Net assets (000’s) $ 153,606 312,880 292,607 227,186 280,941
Number of unitsoutstanding (000’s) 10,784 21,219 22,948 20,758 20,603
MER1 % 0.93 0.95 1.00 1.01 1.01
Portfolio turnover rate % 9.48 31.79 11.45 14.47 9.391 We may from time to time absorb some of the operating expenses that
the fund would otherwise pay. In 2003, the management expense ratioof the fund would have been 1.14% had we not absorbed some ofthese expenses.
$
Dec.2002
Dec.2001
Dec.2000
Dec.1999
Dec.1998
Dec.1997
Dec.2003
Dec. 311996
0
10,000
5,000
15,000
20,000$15,530$15,169
$10,814(a)
$10,794(b)
Scotia Canadian Stock Index Fund
S&P/TSX Composite Index (Total Return)
Class F Units(a) S&P/TSX Composite Index (Total Return)
(b) Scotia Canadian Stock Index Fund
Class A Units
91
SC
OT
IA C
AN
AD
IAN
ST
OC
K I
ND
EX
FU
ND
EQ
UIT
Y F
UN
DS

Financial highlights, Class F units Fund expenses indirectly borne by investorsat December 31
This example shows the fund’s expenses on a $1,000Distributions and net asset value per unitinvestment with a 5% annual return.
1999 2000 2001 2002 20032
Fees and expensesDistributionspayable over 1 year 3 years 5 years 10 years
from net income $ – – – – 0.19Class A units $ 10.35 32.64 57.20 130.21
from realized gain $ – – – – –Class F units $ 6.25 19.71 34.55 78.64
return of capital $ – – – – –
Total annual distributions $ – – – – 0.19
Net asset value per unit $ – – – – 13.54
Ratios and supplemental data
1999 2000 2001 2002 20032
Net assets (000’s) $ – – – – 2
Number of unitsoutstanding (000’s) – – – – 0.16
MER3 % – – – – 0.61
Portfolio turnover rate % – – – – 9.392 These figures are for the period from October 10, 2003 to December 31,
2003.3 We may from time to time absorb some of the operating expenses that
the fund would otherwise pay. In 2003, the management expense ratioof the fund would have been 18.19% had we not absorbed some ofthese expenses.
92
SC
OT
IA C
AN
AD
IAN
ST
OC
K I
ND
EX
FU
ND
EQ
UIT
Y F
UN
DS

Scotia Canadian Dividend FundFund details ) temporarily invest the fund’s assets in cash or cash-
equivalent securities to try to protect the fund during aFund type Canadian dividend fund
market downturn or for other reasons.Date established October 28, 1992
Type of securities Class A, Class F and Class I units of a The fund may participate in repurchase, reverse repur-mutual fund trust
chase and securities lending transactions to achieve theEligible for Yes. Units of the fund are not foreign
fund’s overall investment objectives and to enhance theregistered plans? property.
Portfolio advisor Scotia Cassels Investment Counsel fund’s returns. You’ll find more information about repur-Limited chase, reverse repurchase and securities lending transac-
tions on page 3.What does the fund invest in?
Top 10 holdings at September 30, 2004Investment objectives
Toronto-Dominion Bank 5.43%The fund’s objective is to earn a high level of dividendRoyal Bank of Canada 5.15%income with some potential for long-term capital growth.Bank of Montreal 4.85%It invests primarily in dividend-paying common shares and
in a broad range of preferred shares, such as floating rate, Manulife Financial Corporation 4.76%
convertible and retractable preferred shares of Canadian Canadian Imperial Bank of Commerce 4.07%
companies. Power Corporation of Canada 2.98%
Sun Life Financial Services of Canada Inc. 2.92%Any change to the fundamental investment objectivesBCE Inc. 2.31%must be approved by a majority of votes cast at a meetingTransCanada Corporation 2.14%of unitholders called for that purpose.Barrick Gold Corporation 2.06%
Investment strategiesWhat are the risks of investing in the fund?
The portfolio advisor uses fundamental analysis to identifyThe main risks of investing in this fund are:investments that pay dividends and have the potential for) equity riskcapital growth over the long term. This involves evaluat-
ing the financial condition and management of each ) interest rate risk.company, as well as its industry and the economy. The
The fund may have these additional risks:fund’s assets are diversified by industry and company tohelp reduce risk. ) foreign investment risk
) currency riskThe fund can invest in foreign securities up to the foreigncontent limit. It will generally invest in U.S. securities for ) derivative riskthe foreign portion of its portfolio. ) class risk
The fund may invest in other mutual funds which are ) income trust unit riskmanaged by us or by other mutual fund managers. You’ll ) repurchase and reverse repurchase transaction riskfind more information about investing in other mutual
) securities lending riskfunds on page 2.) underlying fund risk.
The portfolio advisor may:You’ll find details about each risk starting on page 164.
) use derivatives such as options and forward contractsto hedge against losses from changes in stock prices,
Who should invest in this fund?commodity prices, market indexes or currency exchangerates, and to gain exposure to financial markets. It will This fund may be suitable for you if:only use derivatives as permitted by securities
) you want to maximize after-tax income by takingregulations. advantage of the dividend tax credit. This only applies
93
SC
OT
IA C
AN
AD
IAN
DIV
IDE
ND
FU
ND
EQ
UIT
Y F
UN
DS

Overall past performanceto non-registered accounts because you generally don’tpay tax on distributions received from funds you hold This chart shows how a $10,000 Investment in the fundin registered plans. would have changed in value, compared with the S&P/TSX
) you’re investing for at least three years Composite Index (Total Return).
) you can accept medium risk.
Past performance at December 31
This section shows how the fund has performed in thepast and gives you an idea of the risk involved. Thesefigures don’t tell you how the fund will perform in thefuture.
Year-by-year returns
These charts show the fund’s annual performance, whichchanges from year to year.% Class A Units50
37.56%40
30.40%30 26.82%
22.56%
Dec.1994
Dec.1995
Dec.1996
Dec.1997
$
$22,788
$12,580(c)
$12,290(d)
$12,164(b)
$30,167
$11,133(a)
Dec.1993
Dec.1998
Dec.1999
Dec.2000
Dec.2001
Dec.2002
Dec.2003
(a) S&P/TSX Composite Index (Total Return)
(b) Scotia Canadian Dividend Fund
(c) S&P/TSX Composite Index (Total Return)
(d) Scotia Canadian Dividend Fund
Scotia Canadian Dividend Fund
S&P/TSX Composite Index (Total Return)
0
10,000
5,000
25,000
30,000
15,000
20,000
35,000
Class F Units
Class I Units
Class A Units
20
The S&P/TSX Composite Index (Total Return) tracks the performance of some9.91%10 of the largest and most widely held stocks listed on the Toronto Stock3.00%2.67%Exchange. Prior to May 1, 2002, this index was called the TSE 3000 -0.08% Composite Index and it tracked the 300 largest companies listed on the-2.51%-4.43%Toronto Stock Exchange.-10
1994 1995 1996 1997 1998 1999 2000 2001 2002 2003
% Class F Units Annual compound returns30
25 23.26% This table shows the fund’s annual compound returns,20 compared with the S&P/TSX Composite Index (Total15 Return).10 Since
1 year 3 years 5 years 10 years inception5Scotia Canadian
0Dividend Fund-1.40%
-52002* 2003 Class A units % 22.56 6.08 9.90 11.67 –
* Jan. 21, 2002 to Dec. 31, 2002Class F units % 23.26 – – – 10.991
% Class I units % – – – – 36.252Class I Units
4036.25% S&P/TSX Composite
Index (Total30 Return) % 26.72 -1.01 6.54 8.59 3
1 January 21, 200220 2 April 28, 2003
3 Class F units 10.76% and Class I Units 41.10%
10
Distribution policy0
2003* The fund distributes any income by the last business day* April 28, 2003 to Dec. 31, 2003
of each calendar quarter. It distributes any capital gainsin December of each calendar year.
94
SC
OT
IA C
AN
AD
IAN
DIV
IDE
ND
FU
ND
EQ
UIT
Y F
UN
DS

Ratios and supplemental dataDistributions on units held in Scotia registered plans andCopilot non-registered accounts are always reinvested in 1999 2000 2001 20022 2003additional units of the fund. Distributions on units held in Net assets (000’s) $ – – – 163 192other registered plans and non-registered accounts are Number of units
outstanding (000’s) – – – 7 7reinvested in additional units of the fund, unless you tellMER3 % – – – 0.67 0.61us in writing that you want to receive cash distributionsPortfolio turnover rate % – – – 31.06 27.06by cheque or by deposit to your bank account.2 These figures are for the period from January 21, 2002 to December 31,
2002.
Financial highlights, Class A units 3 We may from time to time absorb some of the operating expenses thatthe fund would otherwise pay. In 2003, the management expense ratioat December 31of the fund would have been 0.82% had we not absorbed some of
Distributions and net asset value per unit these expenses.
1999 2000 2001 2002 2003Financial highlights, Class I unitsDistributionsat December 31
from net income $ 0.48 0.45 0.47 0.37 0.32Distributions and net asset value per unitfrom realized gain $ – 0.21 – – –
return of capital $ – – – – –1999 2000 2001 2002 20034
Total annual distributions $ 0.48 0.66 0.47 0.37 0.32Distributions
Net asset value per unit $ 18.54 23.45 22.95 22.01 26.60from net income $ – – – – 0.34
from realized gain $ – – – – –
Ratios and supplemental data return of capital $ – – – – –
Total annual distributions $ – – – – 0.341999 2000 2001 2002 2003
Net asset value per unit $ – – – – 26.66Net assets (000’s) $ 829,964 926,130 905,020 869,680 38,685
Number of unitsoutstanding (000’s) 44,775 39,493 39,430 39,509 38,711 Ratios and supplemental dataMER1 % 1.19 1.21 1.21 1.21 1.18
1999 2000 2001 2002 20034
Portfolio turnoverNet assets (000’s) $ – – – – 7,949rate % 19.77 21.92 28.69 31.06 27.06Number of units1 We may from time to time absorb some of the operating expenses that
the fund would otherwise pay. In 2003, the management expense ratio outstanding (000’s) – – – – 298of the fund would have been 1.19% had we not absorbed some of MER5 % – – – – –these expenses.
Portfolio turnover rate % – – – – 27.064 These figures are for the period from April 28, 2003 to December 31,
Financial highlights, Class F units 2003.
at December 31 5 We may from time to time absorb some of the operating expenses thatthe fund would otherwise pay. In 2003, the management expense ratioDistributions and net asset value per unitof the fund would have been 0.01% had we not absorbed some ofthese expenses.
1999 2000 2001 20022 2003
DistributionsFund expenses indirectly borne by investors
from net income $ – – – 0.53 0.42
from realized gain $ – – – – – This example shows the fund’s expenses on a $1,000return of capital $ – – – – – investment with a 5% annual return.
Total annual distributions $ – – – 0.53 0.42
Net asset value per unit $ – – – 21.97 26.59 Fees and expensespayable over 1 year 3 years 5 years 10 years
Class A units $ 12.10 38.13 66.83 152.13
Class F units $ 6.25 19.71 34.55 78.64
Class I units $ – – – –
95
SC
OT
IA C
AN
AD
IAN
DIV
IDE
ND
FU
ND
EQ
UIT
Y F
UN
DS

Scotia Canadian Blue Chip FundFund details ) temporarily invest the fund’s assets in cash or cash-
equivalent securities to try to protect the fund during aFund type Canadian large-capitalization equity
market downturn or for other reasons.fund
Date established December 31, 1986The fund may participate in repurchase, reverse repur-
Type of securities Class A, Class F and Class I units of achase and securities lending transactions to achieve themutual fund trust
fund’s overall investment objectives and to enhance theEligible for Yes. Units of the fund are not foreignregistered plans? property. fund’s returns. You’ll find more information about repur-Portfolio advisor Scotia Cassels Investment Counsel chase, reverse repurchase and securities lending transac-
Limitedtions on page 3.
What does the fund invest in? Top 10 holdings at September 30, 2004
Investment objectivesManulife Financial Corporation 4.72%
Toronto-Dominion Bank 4.20%The fund’s objective is long-term capital growth. It investsBank of Montreal 3.53%primarily in a broad range of high quality equity securities
of large Canadian companies. Royal Bank of Canada 3.45%
Canadian Imperial Bank of Commerce 2.79%Any change to the fundamental investment objectivesEnCana Corporation 2.75%must be approved by a majority of votes cast at a meetingCanadian National Railway Company 2.68%of unitholders called for that purpose.Power Corporation of Canada 2.39%
Sun Life Financial Services of Canada Inc. 2.26%Investment strategies
Barrick Gold Corporation 2.16%The fund emphasizes large, well-established companiesthat are leaders in their industry.
What are the risks of investing in the fund?The portfolio advisor uses fundamental analysis to identify
The main risk of investing in this fund is equity risk.investments that have the potential for above-averagegrowth over the long term. This involves evaluating the The fund may have these additional risks:financial condition and management of each company, as
) concentration riskwell as its industry and the economy. The fund’s assets are
) foreign investment riskdiversified by industry and company to help reduce risk.) currency risk
The fund may invest in other mutual funds which are) derivative riskmanaged by us or by other mutual fund managers. You’ll
find more information about investing in other mutual ) liquidity riskfunds on page 2. ) class risk
The fund can invest in foreign securities up to the foreign ) repurchase and reverse repurchase transaction riskcontent limit. It can invest anywhere in the world, but ) securities lending riskgenerally won’t invest in emerging markets.
) underlying fund risk.The portfolio advisor may:
You’ll find details about each risk starting on page 164.) use derivatives such as options, futures and forward
contracts to hedge against losses from changes in stock Who should invest in this fund?prices, commodity prices, market indexes or currency
This fund may be suitable for you if:exchange rates and to gain exposure to financialmarkets. It will only use derivatives as permitted by ) you want the growth potential of investing in highsecurities regulations. quality equity securities of large Canadian companies
96
SC
OT
IA C
AN
AD
IAN
BL
UE
CH
IP F
UN
DE
QU
ITY
FU
ND
S

Overall past performance) you’re investing for at least three years
) you can accept medium risk. This chart shows how a $10,000 investment in the fundwould have changed in value, compared with the S&P/TSX
Past performance at December 31 Composite Index (Total Return).
This section shows how the fund has performed in thepast and gives you an idea of the risk involved. Thesefigures don’t tell you how the fund will perform in thefuture.
Year-by-year returns
These charts show the fund’s annual performance, whichchanges from year to year.% Class A Units40
27.14%3023.26%
18.06%20 16.19%
8.03%10 6.33%
0
Dec.1994
Dec.1995
Dec.1996
Dec.1997
Dec.1998
Dec.1999
Dec.2000
Dec.2001
Dec.2002
Dec.2003
$
$16,701
$10,170(b)$11,132(a)
$22,788
Dec.1993
0
10,000
20,000
30,000
40,000
Scotia Canadian Blue Chip Fund
S&P/TSX Composite Index (Total Return)
Class F Units
Class A Units
(a) S&P/TSX Composite Index (Total Return)
(b) Scotia Canadian Blue Chip Fund
The S&P/TSX Composite Index (Total Return) tracks the performance of some-5.09%-7.07% -7.59%-10of the largest and most widely held stocks listed on the Toronto Stock
-17.02% Exchange. Prior to May 1, 2002, this index was called the TSE 300-20Composite Index and it tracked the 300 largest companies listed on the
-30Toronto Stock Exchange.1994 1995 1996 1997 1998 1999 2000 2001 2002 2003
% Class F Units30 Annual compound returns
18.87%20This table shows the fund’s annual compound returns,
10 compared with the S&P/TSX Composite Index (Total0 Return).
-10 Since1 year 3 years 5 years 10 years inception1
-20-20.90% Scotia Canadian
-30 Blue Chip Fund2002* 2003* Apr. 25, 2002 to Dec. 31, 2002 Class A units % 18.06 -2.40 6.55 5.26 –
Class F units % 18.87 – – – 1.01
S&P/TSX CompositeIndex (Total Return) % 26.72 -1.01 6.54 8.59 6.651 Class F units only: April 25, 2002
Distribution policy
The fund distributes any income and capital gains inDecember of each calendar year.
Distributions on units held in Scotia registered plans andCopilot non-registered accounts are always reinvested inadditional units of the fund. Distributions on units held inother registered plans and non-registered accounts arereinvested in additional units of the fund, unless you tellus in writing that you want to receive cash distributionsby cheque or by deposit to your bank account.
97
SC
OT
IA C
AN
AD
IAN
BL
UE
CH
IP F
UN
DE
QU
ITY
FU
ND
S

Financial highlights, Class A units Fund expenses indirectly borne by investorsat December 31
This example shows the fund’s expenses on a $1,000Distributions and net asset value per unitinvestment with a 5% annual return.
1999 2000 2001 2002 2003Fees and expensesDistributionspayable over 1 year 3 years 5 years 10 years
from net income $ – – 0.06 – 0.05Class A units $ 21.12 66.57 116.67 265.58
from realized gain $ – 1.33 – – –Class F units $ 11.58 36.51 64.00 145.68
return of capital $ – – – – –
Total annual distributions $ – 1.33 0.06 – 0.05
Net asset value per unit $ 18.27 19.88 18.80 15.60 18.37
Ratios and supplemental data
1999 2000 2001 2002 2003
Net assets (000’s) $ 323,844 349,603 671,576 486,653 533,296
Number of unitsoutstanding (000’s) 17,725 17,585 35,727 31,200 29,036
MER1 % 2.04 2.05 2.06 2.11 2.06
Portfolio turnoverrate % 40.22 37.64 30.32 43.02 128.081 We may from time to time absorb some of the operating expenses that
the fund would otherwise pay. In 2003, the management expense ratioof the fund would have been 2.07% had we not absorbed some ofthese expenses.
Financial highlights, Class F unitsat December 31
Distributions and net asset value per unit
1999 2000 2001 20022 2003
Distributions
from net income $ – – – – 0.05
from realized gain $ – – – – –
return of capital $ – – – – –
Total annual distributions $ – – – – 0.05
Net asset value per unit $ – – – 15.72 18.63
Ratios and supplemental data
1999 2000 2001 20022 2003
Net assets (000’s) $ – – – 6 20
Number of unitsoutstanding (000’s) – – – 0.4 1.1
MER3 % – – – 1.21 1.13
Portfolio turnover rate % – – – 43.02 128.082 These figures are for the period from April 25, 2002 to December 31,
2002.3 We may from time to time absorb some of the operating expenses that
the fund would otherwise pay. In 2003, the management expense ratioof the fund would have been 3.04% had we not absorbed some ofthese expenses.
98
SC
OT
IA C
AN
AD
IAN
BL
UE
CH
IP F
UN
DE
QU
ITY
FU
ND
S

Scotia Canadian Growth FundFund details The fund may participate in repurchase, reverse repur-
chase and securities lending transactions to achieve theFund type Canadian equity fund
fund’s overall investment objectives and to enhance theDate established February 20, 1961
fund’s returns. You’ll find more information about repur-Type of securities Class A, Class F and Class I units of amutual fund trust chase, reverse repurchase and securities lending transac-
Eligible for Yes. Units of the fund are not foreign tions on page 3.registered plans? property.
Portfolio advisor Scotia Cassels Investment CounselTop 10 holdings at September 30, 2004Limited
Manulife Financial Corporation 6.50%
Toronto-Dominion Bank 4.78%What does the fund invest in?Bank of Montreal 4.27%Investment objectivesRoyal Bank of Canada 4.10%
The fund’s objective is long-term capital growth. It invests Canadian Imperial Bank of Commerce 3.28%primarily in a broad range of Canadian equity securities. Canadian National Railway Company 3.03%
EnCana Corporation 2.91%Any change to the fundamental investment objectivesBCE Inc. 2.46%must be approved by a majority of votes cast at a meetingAlcan Inc. 2.43%of unitholders called for that purpose.Sun Life Financial Services of Canada Inc. 2.40%
Investment strategies
What are the risks of investing in the fund?The portfolio advisor uses fundamental analysis to identifyinvestments that have the potential for above-average The main risk of investing in this fund is equity risk. Thegrowth over the long term. This involves evaluating the fund may have these additional risks:financial condition and management of each company, as
) foreign investment riskwell as its industry and the economy. The fund’s assets) currency riskare diversified by industry and company to help reduce
risk. ) derivative risk
) liquidity riskThe fund may invest in other mutual funds which aremanaged by us or by other mutual fund managers. You’ll ) class riskfind more information about investing in other mutual
) repurchase and reverse repurchase transaction riskfunds on page 2.
) securities lending riskThe fund can invest in foreign securities up to the foreign
) underlying fund risk.content limit. It can invest anywhere in the world, butgenerally won’t invest in emerging markets. You’ll find details about each risk starting on page 164.
The portfolio advisor may:Who should invest in this fund?
) use derivatives such as options, futures and forwardThis fund may be suitable for you if:contracts to hedge against losses from changes in stock
prices, commodity prices, market indexes or currency ) you want the growth potential of investing in a broadexchange rates and to gain exposure to financial range of Canadian equity securitiesmarkets. It will only use derivatives as permitted by ) you’re investing for at least three yearssecurities regulations.
) you can accept medium risk.) temporarily invest the fund’s assets in cash or cash-
equivalent securities to try to protect the fund during amarket downturn or for other reasons.
99
SC
OT
IA C
AN
AD
IAN
GR
OW
TH
FU
ND
EQ
UIT
Y F
UN
DS

Overall past performancePast performance at December 31
This section shows how the fund has performed in the This chart shows how a $10,000 investment in the fundpast and gives you an idea of the risk involved. These would have changed in value, compared with the S&P/TSXfigures don’t tell you how the fund will perform in the Composite Index (Total Return).future.Year-by-year returns
These charts show the fund’s annual performance, whichchanges from year to year.% Class A Units40 34.59%
30 26.77%21.86%19.76%20
9.67%10 6.79%
0-1.17%
-6.47%-8.01%-10
-20 -18.37%
-301994 1995 1996 1997 1998 1999 2000 2001 2002 2003
% Class F Units30
23.09%
20
10
Dec.1996
Dec.1995
Dec.1997
Dec.1999
Dec.2000
Dec.2001
Dec.1998
Dec.2002
Dec.2003
$
$22,788$20,240
Dec.1993
Dec.1994
Scotia Canadian Growth Fund
S&P/TSX Composite Index (Total Return)
$11,863(a)
$12,636(d)
$12,580(c)
$11,235(b)
Class F Units
Class A Units
(a) S&P/TSX Composite Index (Total Return)
(b) Scotia Canadian Growth Fund
Class I Units(c) S&P/TSX Composite Index (Total Return)
(d) Scotia Canadian Growth Fund
0
10,000
20,000
30,000
The S&P/TSX Composite Index (Total Return) tracks the performance of some0
of the largest and most widely held stocks listed on the Toronto StockExchange. Prior to May 1, 2002, this index was called the TSE 300-10Composite Index and it tracked the 300 largest companies listed on the
-16.70% Toronto Stock Exchange.-20
-302002* 2003 Annual compound returns* Jun. 14, 2002 to Dec. 31, 2002
% Class I Units This table shows the fund’s annual compound returns,50
compared with the S&P/TSX Composite Index (Total42.04%40 Return).
Since30 1 year 3 years 5 years 10 years inception
Scotia Canadian Growth Fund20Class A units % 21.86 -2.38 5.28 7.31 –
10 Class F units % 23.09 – – – 8.081
Class I units % – – – – 42.0420
2003*S&P/TSX Composite* April 28, 2003 to Dec. 31, 2003Index (Total Return) % 26.72 -1.01 6.54 8.59 3
1 June 14, 20022 April 28, 20033 Class F units 8.08% and Class I units 41.10%
Distribution policy
The fund distributes any income and capital gains inDecember of each calendar year.
Distributions on units held in Scotia registered plans andCopilot non-registered accounts are always reinvested inadditional units of the fund. Distributions on units held in
100
SC
OT
IA C
AN
AD
IAN
GR
OW
TH
FU
ND
EQ
UIT
Y F
UN
DS

Financial highlights, Class I unitsother registered plans and non-registered accounts areat December 31reinvested in additional units of the fund, unless you tellDistributions and net asset value per unitus in writing that you want to receive cash distributions
by cheque or by deposit to your bank account. 1999 2000 2001 2001 20033
DistributionsFinancial highlights, Class A units from net income $ – – – – –at December 31 from realized gain $ – – – – –
Distributions and net asset value per unit return of capital $ – – – – –
Total annual distributions $ – – – – –1999 2000 2001 2002 2003
Net asset value per unit $ – – – – 47.01Distributions
from net income $ – – – – –Ratios and supplemental datafrom realized gain $ – – – – –
return of capital $ – – – – –1999 2000 2001 2002 20033
Total annual distributions $ – – – – –Net assets (000’s) $ – – – – 9,789
Net asset value per unit $ 45.52 49.93 46.69 38.16 46.45Number of unitsoutstanding (000’s) – – – – 208
MER4 % – – – – –Ratios and supplemental dataPortfolio turnover rate % – – – – 97.30
1999 2000 2001 2002 2003 3 These figures are for the period from April 28, 2003 to December 31,2003.Net assets (000’s) $782,761 789,552 721,648 589,100 683,131
4 We may from time to time absorb some of the operating expenses thatNumber of unitsthe fund would otherwise pay. In 2003, the management expense ratiooutstanding (000’s) 17,195 15,815 15,455 15,437 14,707of the fund would have been 0.01% had we not absorbed some of
MER % 2.24 2.27 2.29 2.32 2.29 these expenses.
Portfolio turnover rate % 34.48 25.03 61.51 53.81 97.30
Fund expenses indirectly borne by investorsFinancial highlights, Class F units
This example shows the fund’s expenses on a $1,000at December 31investment with a 5% annual return.Distributions and net asset value per unit
Fees and expenses1999 2000 2001 20021 2003 payable over 1 year 3 years 5 years 10 years
Distributions Class A units $ 23.47 74.00 129.70 295.24from net income $ – – – – – Class F units $ 11.89 37.48 65.70 149.55from realized gain $ – – – – – Class I units $ – – – –return of capital $ – – – – –
Total annual distributions $ – – – – –
Net asset value per unit $ – – – 38.42 47.21
Ratios and supplemental data
1999 2000 2001 20021 2003
Net assets (000’s) $ – – – 18 22
Number of unitsoutstanding (000’s) – – – 0.5 0.5
MER2 % – – – 1.07 1.16
Portfolio turnover rate % – – – 53.81 97.301 These figures are for the period from June 14, 2002 to December 31,
2002.2 We may from time to time absorb some of the operating expenses that
the fund would otherwise pay. In 2003, the management expense ratioof the fund would have been 3.08% had we not absorbed some ofthese expenses.
101
SC
OT
IA C
AN
AD
IAN
GR
OW
TH
FU
ND
EQ
UIT
Y F
UN
DS
Scotia Canadian Small Cap FundFund details ) temporarily invest the fund’s assets in cash or cash-
equivalent securities to try to protect the fund during aFund type Canadian small and mid-capitalization
market downturn or for other reasons.equity fund
Date established October 28, 1992The fund may participate in repurchase, reverse repur-
Type of securities Class A, Class F and Class I units of achase and securities lending transactions to achieve themutual fund trust
fund’s overall investment objectives and to enhance theEligible for Yes. Units of the fund are not foreignregistered plans? property. fund’s returns. You’ll find more information about repur-Portfolio advisor Scotia Cassels Investment Counsel chase, reverse repurchase and securities lending transac-
Limitedtions on page 3.
What does the fund invest in? Top 10 holdings at September 30, 2004
Investment objectivesPetroKazakhstan Inc. Class A 2.69%
AltaGas Income Trust – Units 2.36%The fund’s objective is aggressive long-term capitalStratos Global Corporation 2.21%growth. It invests primarily in equity securities of small
and medium Canadian companies listed on major Cana- Stantec Inc. 2.08%
dian stock exchanges. Canfor Corporation 2.02%
Home Capital Group Inc. 1.99%Any change to the fundamental investment objectivesNewalta Income Fund – Units 1.95%must be approved by a majority of votes cast at a meetingFirst Quantum Minerals Ltd. 1.90%of unitholders called for that purpose.Inmet Mining Corporation 1.81%
Crystallex International Corporation 1.76%Investment strategies
The portfolio advisor uses fundamental analysis to identifyWhat are the risks of investing in the fund?investments that have the potential for above-average
growth over the long term. This involves evaluating the The main risks of investing in this fund are:financial condition and management of each company, as
) equity riskwell as its industry and the economy. The fund’s assets
) small company riskare diversified by industry and company to help reducerisk. ) liquidity risk.
The fund may invest in other mutual funds which are The fund may have these additional risks:managed by us or by other mutual fund managers. You’ll ) foreign investment riskfind more information about investing in other mutual
) currency riskfunds on page 2.) derivative risk
The fund can invest in foreign securities up to the foreign) class riskcontent limit. It can invest anywhere in the world, but) repurchase and reverse repurchase transaction riskgenerally won’t invest in emerging markets.) securities lending riskThe portfolio advisor may:) underlying fund risk.
) use derivatives such as options, futures and forwardcontracts to hedge against losses from changes in stock You’ll find details about each risk starting on page 164.prices, commodity prices, market indexes or currencyexchange rates and to gain exposure to financialmarkets. It will only use derivatives as permitted bysecurities regulations.
102
SC
OT
IA C
AN
AD
IAN
SM
AL
L C
AP
FU
ND
EQ
UIT
Y F
UN
DS

Overall past performanceWho should invest in this fund?
This chart shows how a $10,000 investment in the fundThis fund may be suitable for you if:would have changed in value, compared with the S&P/TSX
) you want the growth potential of investing in equityComposite Index (Total Return) and the BMO Nesbittsecurities of smaller Canadian companiesBurns Small Cap Weighted Index.
) you’re investing for at least five years
) you can accept higher risk.
Past performance at December 31
This section shows how the fund has performed in thepast and gives you an idea of the risk involved. Thesefigures don’t tell you how the fund will perform in thefuture.
Year-by-year returns
These charts show the fund’s annual performance, whichchanges from year to year.% Class A Units50 43.99%
4028.35%
Scotia Canadian Small Cap Fund
S&P/TSX Composite Index (Total Return)
BMO Nesbitt Burns Small Cap Weighted Index
Class A Units
Class I Units(a) Scotia Canadian Small Cap Fund
(b) S&P/TSX Composite Index (Total Return)
(c) BMO Nesbitt Burns Small Cap Weighted Index
Dec.2000
Dec.2001
Dec.2002
Dec.2003
Dec.1995
Dec.1997
Dec.1994
Dec.1996
Dec.1998
Dec.1999
$
Dec.1993
$17,977$22,788
$17,373
$14,849(a)$15,227(c)
$12,580(b)
0
10,000
5,000
30,000
25,000
20,000
15,000
27.12%30The S&P/TSX Composite Index (Total Return) tracks the performance of some
20 of the largest and most widely held stocks listed on the Toronto Stock12.05%10.07% 7.86%10 Exchange. Prior to May 1, 2002, this index was called the TSE 300Composite Index and it tracked the 300 largest companies listed on the0 -0.05%Toronto Stock Exchange.
-10-14.86% -16.10%-20 The BMO Nesbitt Burns Small Cap Weighted Index measures the perform--19.43%
ance of small to mid-sized Canadian companies.-301994 1995 1996 1997 1998 1999 2000 2001 2002 2003
% Class I Units Annual compound returns90
80.95%80 This table shows the fund’s annual compound returns,70
compared with the S&P/TSX Composite Index (Total Return)60
50 and the BMO Nesbitt Burns Small Cap Weighted Index.40 Since
1 year 3 years 5 years 10 years inception130
20 Scotia CanadianSmall Cap Fund10
0 Class A units % 43.99 6.49 10.82 6.04 –2003*
Class I units % – – – – 80.95* April 28, 2003 to Dec. 31, 2003
S&P/TSX CompositeIndex (Total Return) % 26.72 -1.01 6.54 8.59 41.10BMO Nesbitt BurnsSmall Cap WeightedIndex % 46.30 14.10 10.60 5.68 87.901 Class I units only: April 28, 2003
Distribution policy
The fund distributes any income and capital gains inDecember of each calendar year.
103
SC
OT
IA C
AN
AD
IAN
SM
AL
L C
AP
FU
ND
EQ
UIT
Y F
UN
DS

Ratios and supplemental dataDistributions on units held in Scotia registered plans andCopilot non-registered accounts are always reinvested in 1999 2000 2001 2002 20032
Net assets (000’s) $ – – – – 1,550additional units of the fund. Distributions on units held inNumber of unitsother registered plans and non-registered accounts areoutstanding (000’s) – – – – 76
reinvested in additional units of the fund, unless you tell MER3 % – – – – –us in writing that you want to receive cash distributions Portfolio turnover rate % – – – – 55.67
by cheque or by deposit to your bank account. 2 These figures are for the period from April 28, 2003 to December 31,2003.
3 We may from time to time absorb some of the operating expenses thatFinancial highlights, Class A units the fund would otherwise pay. In 2003, the management expense ratioat December 31 of the fund would have been 0.03% had we not absorbed some of
these expenses.Distributions and net asset value per unit
1999 2000 2001 2002 2003 Fund expenses indirectly borne by investorsDistributions
This example shows the fund’s expenses on a $1,000from net income $ – – – – –
from realized gain $ – 5.06 – – – investment with a 5% annual return.return of capital $ – – – – –
Fees and expensesTotal annual distributions $ – 5.06 – – – payable over 1 year 3 years 5 years 10 yearsNet asset value per unit $ 20.42 16.75 16.75 14.05 20.23 Class A units $ 25.93 81.75 143.29 326.18
Class I units $ – – – –
Ratios and supplemental data
1999 2000 2001 2002 2003
Net assets (000’s) 92,260 137,070 145,336 119,835 166,465
Number of unitsoutstanding (000’s) 4,518 8,182 8,678 8,530 8,229
MER1 % 2.54 2.53 2.55 2.65 2.53
Portfolio turnover rate % 48.81 77.06 58.64 39.32 55.671 We may from time to time absorb some of the operating expenses that
the fund would otherwise pay. In 2003, the management expense ratioof the fund would have been 2.56% had we not absorbed some ofthese expenses.
Financial highlights, Class I unitsat December 31
Distributions and net asset value per unit
1999 2000 2001 2002 20032
Distributions
from net income $ – – – – –
from realized gain $ – – – – –
return of capital $ – – – – –
Total annual distributions $ – – – – –
Net asset value per unit $ – – – – 20.50
104
SC
OT
IA C
AN
AD
IAN
SM
AL
L C
AP
FU
ND
EQ
UIT
Y F
UN
DS

Scotia Resource FundFund details ) temporarily invest the fund’s assets in cash or cash-
equivalent securities to try to protect the fund during aFund type Canadian equity fund
market downturn or for other reasons.Date established July 6, 1993
Type of securities Class A and Class F units of a mutualThe fund may participate in repurchase, reverse repur-fund trust
chase and securities lending transactions to achieve theEligible for Yes. Units of the fund are not foreignregistered plans? property. fund’s overall investment objectives and to enhance thePortfolio advisor Scotia Cassels Investment Counsel fund’s returns. You’ll find more information about repur-
Limitedchase, reverse repurchase and securities lending transac-tions on page 3.What does the fund invest in?
Investment objectives Top 10 holdings at September 30, 2004
The fund’s objective is aggressive long-term capitalInco Ltd. 3.24%
growth. It invests primarily in equity securities ofAlcan Inc. 2.98%
Canadian resource based companies, including companiesCameco Corporation 2.73%that operate in the oil and gas, gold and precious metals,EnCana Corporation 2.65%metals and minerals, and forest products industries.Western Oil Sands Inc. Class A 2.63%
Any change to the fundamental investment objectives Petro-Canada 2.61%must be approved by a majority of votes cast at a meeting Penn West Petroleum Ltd. 2.61%of unitholders called for that purpose. Placer Dome Inc. 2.44%
Talisman Energy Inc. 2.36%Investment strategies
Canadian Natural Resources Ltd. 2.22%
The portfolio advisor uses fundamental analysis to identifyinvestments that have the potential for above-average What are the risks of investing in the fund?growth over the long term. This involves evaluating the
The main risks of investing in this fund are:financial condition and management of each company, aswell as its industry and the economy. The fund’s assets are ) equity riskdiversified by industry and company to help reduce risk. ) concentration risk
The fund may invest in other mutual funds which are ) currency riskmanaged by us or by other mutual fund managers. You’ll ) liquidity risk.find more information about investing in other mutual
The fund may have these additional risks:funds on page 2.) foreign investment riskThe fund can invest in foreign securities up to the foreign) derivative riskcontent limit. It can invest anywhere in the world, but
generally won’t invest in emerging markets. ) class risk
) repurchase and reverse repurchase transaction riskThe portfolio advisor may:) securities lending risk) use derivatives such as options, futures and forward
contracts to hedge against losses from changes in stock ) underlying fund risk.prices, commodity prices, market indexes or currency
You’ll find details about each risk starting on page 164.exchange rates and to gain exposure to financialmarkets. It will only use derivatives as permitted bysecurities regulations.
105
SC
OT
IA R
ES
OU
RC
E F
UN
DE
QU
ITY
FU
ND
S

Overall past performanceWho should invest in this fund?
This chart shows how a $10,000 investment in the fundThis fund may be suitable for you if:would have changed in value, compared with the S&P/TSX
) you want the growth potential of investing in theComposite Index (Total Return).resource sector
) you’re investing for at least five years
) You can accept higher risk.
Past performance at December 31
This section shows how the fund has performed in thepast and gives you an idea of the risk involved. Thesefigures don’t tell you how the fund will perform in thefuture.
On October 1, 2001, unitholders of the fund approved
Dec.1993
Dec.1994
Dec.1995
Dec.1996
Dec.1997
Dec.1998
Dec.1999
Dec.2000
Dec.2001
Dec.2003
Dec.2002
$
Scotia Resource Fund
S&P/TSX Composite Index (Total Return)
0
10,000
20,000
30,000
40,000
$10,989
$22,788
Class A Units
changes in the investment objectives of the fund. TheThe S&P/TSX Composite Index (Total Return) tracks the performance of some
fund’s investment objectives were restricted to invest- of the largest and most widely held stocks listed on the Toronto StockExchange. Prior to May 1, 2002, this index was called the TSE 300ments in precious metals and equity securities ofComposite Index and it tracked the 300 largest companies listed on the
companies directly or indirectly involved in the develop- Toronto Stock Exchange.
ment or distribution of precious metals. Effective Novem-ber 30, 2001, the fund’s investment objectives were Annual compound returns
expanded to include all resource based companies. HadThis table shows the fund’s annual compound returns,this change been in effect throughout the periodscompared with the S&P/TSX Composite Index (Totalreported below, the number of investment opportunitiesReturn).for the fund may have increased, which may have reduced
1 year 3 years 5 years 10 yearsthe fund’s portfolio volatility.Scotia Resource Fund
Class A units % 42.26 28.07 10.85 0.95Year-by-year returnsS&P/TSX Composite Index(Total Return) % 26.72 -1.01 6.54 8.59This chart shows the fund’s annual performance, which
changes from year to year.Distribution policy% Class A Units
6045.80%50 42.26% The fund distributes any income and capital gains in
40December of each calendar year. Gains realized from30 24.80%
18.33%20 trading in precious metals will result in distributions of10 4.45%0 income rather than capital gains.
-4.29%-10-11.70%
-20 -16.76%-19.38% Distributions on units held in Scotia registered plans and-30-40 -39.43% Copilot non-registered accounts are always reinvested in-50
1994 1995 1996 1997 1998 1999 2000 2001 2002 2003 additional units of the fund. Distributions on units held inother registered plans and non-registered accounts arereinvested in additional units of the fund, unless you tellus in writing that you want to receive cash distributionsby cheque or by deposit to your bank account.
106
SC
OT
IA R
ES
OU
RC
E F
UN
DE
QU
ITY
FU
ND
S

Financial highlights, Class A unitsat December 31
Distributions and net asset value per unit
1999 2000 2001 2002 2003
Distributions
from net income $ – – – – –
from realized gain $ – – – – –
return of capital $ – – – – –
Total annual distributions $ – – – – –
Net asset value per unit $ 5.12 4.90 6.12 7.24 10.29
Ratios and supplemental data
1999 2000 2001 2002 2003
Net assets (000’s) $ 36,407 30,633 32,888 36,813 51,962
Number of unitsoutstanding (000’s) 7,111 6,251 5,378 5,087 5,048
MER % 2.34 2.34 2.38 2.27 2.24
Portfolioturnover rate % 32.22 13.45 79.42 46.59 44.55
Fund expenses indirectly borne by investors
This example shows the fund’s expenses on a $1,000investment with a 5% annual return.
Fees and expensespayable over 1 year 3 years 5 years 10 years
Class A units $ 22.96 72.38 126.87 288.79
107
SC
OT
IA R
ES
OU
RC
E F
UN
DE
QU
ITY
FU
ND
S

Scotia American Stock Index FundFund details Top 10 holdings at September 30, 2004
Fund type U.S. equity fund General Electric Company 3.36%
Date established December 31, 1996 Exxon Mobil Corporation 2.97%Type of securities Class A, Class F and Class I units of a
Microsoft Corporation 2.86%mutual fund trust
Citigroup Inc. 2.19%Eligible for Yes. Units of the fund are foreignregistered plans? property. Pfizer Inc. 2.18%Portfolio advisor State Street Global Advisors, Ltd. Wal-Mart Stores Inc. 2.13%
Bank of America Corporation 1.69%
American International Group Inc. 1.67%What does the fund invest in?Johnson & Johnson 1.60%Investment objectivesJPMorgan Chase & Company 1.36%
The fund’s objective is long-term capital growth bytracking the performance of a generally recognized U.S. What are the risks of investing in the fund?equity index, currently the Standard & Poor’s 500
The main risks of investing in this fund are:(S&P 500) Index1. It invests primarily in the stocks thatare included in the index. ) equity risk
) currency riskAny change to the fundamental investment objectivesmust be approved by a majority of votes cast at a meeting ) index riskof unitholders called for that purpose.
) concentration risk
) liquidity risk.Investment strategies
The portfolio advisor aims to track the performance of the The fund may have these additional risks:S&P 500 Index (Total Return) as closely as possible by:
) derivative risk) investing in the stocks that are included in the
) repurchase and reverse repurchase transaction riskS&P 500 Index (Total Return) in substantially the same
) securities lending riskproportion as they’re weighted in the Index) underlying fund risk.) keeping the portfolio as fully invested as possible
) minimizing transaction costs. You’ll find details about each risk starting on page 164.
The portfolio advisor may use derivatives such as options,Who should invest in this fund?
futures and forward contracts to gain exposure to theS&P 500 Index. It will only use derivatives as permitted This fund may be suitable for you if:by securities regulations. ) you want the growth potential of U.S. equity securities
while tracking the performance of a major marketThe fund may participate in repurchase, reverse repur-indexchase and securities lending transactions to achieve the
fund’s overall investment objectives and to enhance the ) you’re investing for at least three yearsfund’s returns. You’ll find more information about repur- ) you can accept higher risk.chase, reverse repurchase and securities lending transac-tions on page 3.
1 The Standard & Poor’s 500 Index is published by Standard & Poor’s, adivision of the McGraw-Hill Companies Inc. Standard & Poor’s has noconnection with Scotia Securities Inc. and has not passed upon the meritsof investing in the fund.
108
SC
OT
IA A
ME
RIC
AN
ST
OC
K I
ND
EX
FU
ND
EQ
UIT
Y F
UN
DS

Past performance at December 31 Distribution policy
This section shows how the fund has performed in the The fund distributes any income and capital gains inpast and gives you an idea of the risk involved. These December of each calendar year.figures don’t tell you how the fund will perform in the
Distributions on units held in Scotia registered plans andfuture.Copilot non-registered accounts are always reinvested in
Year-by-year returnsadditional units of the fund. Distributions on units held in
This chart shows the fund’s annual performance, which other registered plans and non-registered accounts arechanges from year to year. reinvested in additional units of the fund, unless you tell% Class A Units us in writing that you want to receive cash distributions40 34.62%33.72% by cheque or by deposit to your bank account.30
2013.10%
Financial highlights, Class A units103.91% at December 310
Distributions and net asset value per unit-6.87% -7.45%-10
-20 1999 2000 2001 2002 2003-23.65%
-30 Distributions1997 1998 1999 2000 2001 2002 2003
from net income $ 0.36 0.08 0.05 0.15 0.09Overall past performance from realized gain $ – – – – –
return of capital $ – – – – –This chart shows how a $10,000 investment in the fundTotal annual distributions $ 0.36 0.08 0.05 0.15 0.09would have changed in value, compared with the S&P 500Net asset value per unit $ 19.85 18.41 16.98 12.82 13.23Index (Total Return).
Ratios and supplemental data
1999 2000 2001 2002 2003
Net assets (000’s) $ 108,937 156,093 155,996 103,603 99,442
Number of unitsoutstanding (000’s) 5,489 8,480 9,187 8,084 7,515
MER1 % 0.95 0.95 0.99 0.99 1.00
Portfolio turnover rate % 3.41 7.16 5.63 12.04 1.451 We may from time to time absorb some of the operating expenses that
the fund would otherwise pay. In 2003, the management expense ratioof the fund would have been 1.43% had we not absorbed some ofthese expenses.
Dec.1997
Dec.1998
Dec.1999
Dec.2000
Dec.2001
Dec.2003
Dec.2002
$
Dec.1996
Scotia American Stock Index Fund
S&P 500 Index (Total Return)
0
5,000
10,000
15,000
20,000
25,000
30,000
$13,922
$15,711
Class A Units
Fund expenses indirectly borne by investorsThe S&P 500 Index (Total Return) is an index of 500 stocks weighted bycapitalization and representing all major U.S. industries. It’s a broad measure
This example shows the fund’s expenses on a $1,000of the U.S. economy.
investment with a 5% annual return.Annual compound returns
Fees and expensesThis table shows the fund’s annual compound returns, payable over 1 year 3 years 5 years 10 years
compared with the S&P 500 Index (Total Return) Class A units $ 10.25 32.31 56.64 128.92
Since1 year 3 years 5 years inception
Scotia American Stock Index Fund
Class A units % 3.91 -9.78 -5.01 4.84
S&P 500 Index (Total Return) % 5.24 -8.74 -3.94 6.67
109
SC
OT
IA A
ME
RIC
AN
ST
OC
K I
ND
EX
FU
ND
EQ
UIT
Y F
UN
DS

Scotia American Growth FundFund details The portfolio advisor may actively trade the fund’s
investments. This can increase trading costs, which mayFund type U.S. equity fund
lower the fund’s returns. It also increases the chance thatDate established December 31, 1986
you’ll receive taxable capital gains if you hold the fund inType of securities Class A, Class F and Class I units of amutual fund trust a non-registered account.
Eligible for Yes. Units of the fund are foreignThe fund may participate in repurchase, reverse repur-registered plans? property.
Portfolio advisor Scotia Cassels Investment Counsel chase and securities lending transactions to achieve theLimited fund’s overall investment objectives and to enhance the
fund’s returns. You’ll find more information about repur-What does the fund invest in? chase, reverse repurchase and securities lending transac-
tions on page 3.Investment objectives
The fund’s objective is long-term capital growth. It invests Top 10 holdings at September 30, 2004primarily in a broad range of U.S. equity securities.
General Electric Company 3.54%Any change to the fundamental investment objectivesPfizer Inc. 3.09%must be approved by a majority of votes cast at a meetingMicrosoft Corporation 2.23%of unitholders called for that purpose.Citigroup Inc. 2.21%
Investment strategiesExxon Mobil Corporation 2.19%
Johnson & Johnson 2.14%The portfolio advisor uses fundamental analysis to identifyinvestments that have the potential for above-average ConocoPhillips 2.06%
growth over the long term. This involves evaluating the JPMorgan Chase & Company 1.97%
financial condition and management of each company, as Procter & Gamble Company 1.94%well as its industry and the economy. The fund’s assets Bank of America Corporation 1.91%are diversified by industry and company to help reducerisk.
What are the risks of investing in the fund?The fund may invest a portion of its assets in securities of
The main risks of investing in this fund are:companies located outside the U.S. and Canada. Itgenerally won’t invest in emerging markets. ) equity risk
The fund may invest in other mutual funds which are ) currency risk.managed by us or by other mutual fund managers. You’ll
The fund may have these additional risks:find more information about investing in other mutual) foreign investment riskfunds on page 2.) derivative riskThe portfolio advisor may:) class risk
) use derivatives such as options, futures and forward) repurchase and reverse repurchase transaction riskcontracts to hedge against losses from changes in stock) securities lending riskprices, commodity prices, market indexes or currency
exchange rates and to gain exposure to financial ) underlying fund risk.markets. It will only use derivatives as permitted by
You’ll find details about each risk starting on page 164.securities regulations.
) temporarily invest the fund’s assets in cash or cash-equivalent securities to try to protect the fund during amarket downturn or for other reasons.
110
SC
OT
IA A
ME
RIC
AN
GR
OW
TH
FU
ND
EQ
UIT
Y F
UN
DS

Overall past performanceWho should invest in this fund?
This chart shows how a $10,000 investment in the fundThis fund may be suitable for you if:would have changed in value, compared with the Standard
) you want the growth potential of investing in equityand Poor’s 500 (S&P 500) Index (Total Return).securities of U.S. companies
) you’re investing for at least three years
) you can accept higher risk.
Past performance at December 31
This section shows how the fund has performed in thepast and gives you an idea of the risk involved. Thesefigures don’t tell you how the fund will perform in thefuture.
Year-by-year returns
These charts show the fund’s annual performance, whichchanges from year to year.% Class A Units40
28.27%28.07%3021.37%
2011.40% 10.79%
Dec.1994
Dec.1995
Dec.1996
Dec.1997
Dec.1998
Dec.1999
Dec.2000
Dec.2001
Dec.2003
Dec.2002
$
$14,451
$9,791(a)
$8,324(b)
$10,342(d)
Dec.1993
Scotia American Growth Fund
S&P 500 Index (Total Return)
Class F Units
Class A Units
(a) S&P 500 Index (Total Return)
(b) Scotia American Growth Fund
Class I Units(c) S&P 500 Index (Total Return)
(d) Scotia American Growth Fund
0
10,000
20,000
30,000
40,000
50,000
$27,865
$10,988(c)
10 4.56% The S&P 500 Index (Total Return) is an index of 500 stocks weighted by0 capitalization and representing all major U.S. industries. It’s a broad measure
-4.27% of the U.S. economy.-10
-11.88% -12.69%-20
-23.75% Annual compound returns-30
1994 1995 1996 1997 1998 1999 2000 2001 2002 2003
This table shows the fund’s annual compound returns,% Class F Units5 compared with the S&P 500 Index (Total Return).
Since01 year 3 years 5 years 10 years inception-3.36%-5
Scotia American-10Growth Fund
-15Class A units % -4.27 -13.94 -9.05 3.75 –-20Class F units % -3.36 – – – -11.511
-25-25.80%
Class I units % – – – – 5.172-30
S&P 500 Index-352002* 2003 (Total Return) % 5.24 -8.74 -3.94 10.79 3
* June 14, 2002 to Dec. 31, 20021 June 14, 2002
% 2 April 28, 2003Class I Units10 3 Class F units -1.40% and Class I units 15.17%
8
Distribution policy6
5.17%
The fund distributes any income and capital gains in4
December of each calendar year.2
Distributions on units held in Scotia registered plans and0
2003* Copilot non-registered accounts are always reinvested in* April 28, 2003 to Dec. 31, 2003
additional units of the fund. Distributions on units held inother registered plans and non-registered accounts arereinvested in additional units of the fund, unless you tell
111
SC
OT
IA A
ME
RIC
AN
GR
OW
TH
FU
ND
EQ
UIT
Y F
UN
DS

Financial highlights, Class I unitsus in writing that you want to receive cash distributionsat December 31by cheque or by deposit to your bank account.Distributions and net asset value per unit
Financial highlights, Class A units 1999 2000 2001 2002 20034
at December 31Distributions
from net income $ – – – – –Distributions and net asset value per unitfrom realized gain $ – – – – –
1999 2000 2001 2002 2003 return of capital $ – – – – –Distributions Total annual distributions $ – – – – –from net income $ – – – – – Net asset value per unit $ – – – – 9.22from realized gain $ – – – – –
return of capital $ – – – – –Ratios and supplemental data
Total annual distributions $ – – – – –
Net asset value per unit $ 16.19 14.26 12.45 9.50 9.09 1999 2000 2001 2002 20034
Net assets (000’s) $ – – – – 2,111
Number of unitsRatios and supplemental dataoutstanding (000’s) – – – – 229
1999 2000 2001 2002 2003MER5 % – – – – –
Net assets (000’s) $286,864 301,178 297,587 206,582 172,328Portfolio turnover rate % – – – – 110.99
Number of units 4 These figures are for the period from April 28, 2003 to December 31,outstanding (000’s) 17,724 21,116 23,895 21,756 18,958 2003.MER1 % 2.21 2.23 2.30 2.34 2.35 5 We may from time to time absorb some of the operating expenses that
the fund would otherwise pay. In 2003, the management expense ratioPortfolio turnover rate % 60.44 54.03 62.12 65.57 110.99of the fund would have been 0.02% had we not absorbed some of1 We may from time to time absorb some of the operating expenses thatthese expenses.the fund would otherwise pay. In 2003, the management expense ratio
of the fund would have been 2.37% had we not absorbed some ofthese expenses.
Fund expenses indirectly borne by investors
Financial highlights, Class F units This example shows the fund’s expenses on a $1,000at December 31 investment with a 5% annual return.Distributions and net asset value per unit
Fees and expensespayable over 1 year 3 years 5 years 10 years1999 2000 2001 20022 2003Class A units $ 24.09 75.94 133.10 302.97DistributionsClass F units $ 14.35 45.24 79.29 180.49from net income $ – – – – –Class I units $ – – – –from realized gain $ – – – – –
return of capital $ – – – – –
Total annual distributions $ – – – – –
Net asset value per unit $ – – – 9.56 9.24
Ratios and supplemental data
1999 2000 2001 20022 2003
Net assets (000’s) $ – – – 4 4
Number of unitsoutstanding (000’s) – – – 0.4 0.4
MER3 % – – – 1.43 1.40
Portfolio turnover rate % – – – 65.57 110.992 These figures are for the period from June 14, 2002 to December 31,
2002.3 We may from time to time absorb some of the operating expenses that
the fund would otherwise pay. In 2003, the management expense ratioof the fund would have been 12.08% had we not absorbed some ofthese expenses.
112
SC
OT
IA A
ME
RIC
AN
GR
OW
TH
FU
ND
EQ
UIT
Y F
UN
DS

Scotia CanAm Stock Index FundFund details chase, reverse repurchase and securities lending transac-
tions on page 3.Fund type U.S. equity fund
Date established July 9, 1993
Type of securities Class A and Class F units of a mutual Top 10 holdings at September 30, 2004fund trust
General Electric Company 3.41%Eligible for Yes. Units of the fund are not foreignregistered plans? property. Exxon Mobil Corporation 3.02%Portfolio advisor Scotia Cassels Investment Counsel Microsoft Corporation 2.89%
LimitedPfizer Inc. 2.22%
Citigroup Inc. 2.20%
What does the fund invest in? Wal-Mart Stores Inc. 2.17%
American International Group Inc. 1.70%Investment objectivesBank of America Corporation 1.70%
The fund’s objective is long-term capital growth by Johnson & Johnson 1.61%tracking the performance of a generally recognized International Business Machines Corporation 1.38%U.S. equity index, while maintaining 100% eligibility for The fund has indirect exposure to these securities through its investments in
derivatives and money market instruments.registered plans. The fund currently tracks the Standard &Poor’s 500 (S&P 500) Index1. It invests primarily in What are the risks of investing in the fund?futures contracts that are linked to the performance of
The main risks of investing in this fund are:the index and in cash, Government of Canada treasury) derivative riskbills and other short-term debt instruments guaranteed by
the Government of Canada. ) equity risk
) currency riskAny change to the fundamental investment objectivesmust be approved by a majority of votes cast at a meeting ) index riskof unitholders called for that purpose.
) concentration risk
) liquidity risk.Investment strategies
The fund may have these additional risks:The portfolio advisor aims to track the performance of theS&P 500 Index as closely as possible by using futures ) repurchase and reverse repurchase transaction riskcontracts that are linked to the performance of the
) securities lending riskS&P 500 Index. It invests the balance of its assets in cash
) underlying fund risk.and Canadian treasury bills and other short-term debtinstruments guaranteed by the Government of Canada. You’ll find details about each risk starting on page 164.This allows the fund to maintain 100% registered plan
Who should invest in this fund?eligibility and to cover its positions in the futurescontracts. The fund will only use derivatives as permitted This fund may be suitable for you if:by securities regulations. ) you hold your units in a registered plan other than an
RESPThe fund may participate in repurchase, reverse repur-) you want the growth potential of U.S. equity securitieschase and securities lending transactions to achieve the
while tracking the performance of a major market indexfund’s overall investment objectives and to enhance thefund’s returns. You’ll find more information about repur- ) you’re investing for at least three years
) you can accept higher risk.
1 The Standard & Poor’s 500 Index is published by Standard & Poor’s, adivision of the McGraw-Hill Companies Inc. Standard & Poor’s has noconnection with Scotia Securities Inc. and has not passed upon the meritsof investing in the fund.
113
SC
OT
IA C
AN
AM
ST
OC
K I
ND
EX
FU
ND
EQ
UIT
Y F
UN
DS

Annual compound returnsThis fund isn’t suitable for non-registered accounts orRESPs because the foreign content limit doesn’t apply to This table shows the fund’s annual compound returns,these accounts. The fund’s distributions are primarily compared with the S&P 500 Index (Total Return).considered income, which is taxed at a higher rate than 1 year 3 years 5 years 10 years
Scotia CanAm Stock Index Fundcapital gains when received outside of a registered plan.Class A units % 3.55 -10.28 -5.92 6.77
Past performance at December 31S&P 500 Index (Total Return) % 5.24 -8.74 -3.94 10.79
This section shows how the fund has performed in theDistribution policypast and gives you an idea of the risk involved. These
figures don’t tell you how the fund will perform in the The fund distributes any income and capital gains infuture. December of each calendar year.
Year-by-year returns Distributions on units held in Scotia registered plans andCopilot non-registered accounts are always reinvested inThis chart shows the fund’s annual performance, whichadditional units of the fund. Distributions on units held inchanges from year to year.other registered plans and non-registered accounts are% Class A Units
50 reinvested in additional units of the fund, unless you tell40 35.77% us in writing that you want to receive cash distributions27.95%30 25.25%
19.49% 17.51% by cheque or by deposit to your bank account.20
10 3.55%0.51% Financial highlights, Class A units0at December 31-10 -8.02%
-13.17%-20 Distributions and net asset value per unit
-24.16%-301999 2000 2001 2002 2003
-401994 1995 1996 1997 1998 1999 2000 2001 2002 2003 Distributions
from net income $ 1.28 – – – –Overall past performancefrom realized gain $ – – – – –
This chart shows how a $10,000 investment in the fundreturn of capital $ – – – – –
would have changed in value, compared with the S&P 500 Total annual distributions $ 1.28 – – – –Index (Total Return). Net asset value per unit $ 13.36 11.60 10.67 8.10 8.38
Ratios and supplemental data1999 2000 2001 2002 2003
Net assets (000’s) $ 598,266 593,377 508,419 355,581 316,650
Number of unitsoutstanding (000’s) 44,764 51,133 47,633 43,925 37,776
MER1 % 1.43 1.43 1.43 1.43 1.43
Portfolioturnover rate % – – – – –1 We may from time to time absorb some of the operating expenses that
the fund would otherwise pay. In 2003, the management expense ratioof the fund would have been 1.63% had we not absorbed some ofthese expenses.
Dec.2003
Dec.2002
$
$19,258
$27,865
Scotia CanAm Stock Index Fund
S&P 500 Index (Total Return)
0
10,000
20,000
30,000
40,000
50,000
Dec.2001
Dec.2000
Dec.1999
Dec.1998
Dec.1997
Dec.1996
Dec.1995
Dec.1994
Dec.1993
Class A Units
The S&P 500 Index (Total Return) is an index of 500 stocks weighted by Fund expenses indirectly borne by investorscapitalization and representing all major U.S. industries. It’s a broad measureof the U.S. economy. This example shows the fund’s expenses on a $1,000
investment with a 5% annual return.Fees and expensespayable over 1 year 3 years 5 years 10 years
Class A units $ 14.66 46.21 80.99 184.36
114
SC
OT
IA C
AN
AM
ST
OC
K I
ND
EX
FU
ND
EQ
UIT
Y F
UN
DS

Scotia Nasdaq Index FundFund details Top 10 holdings at September 30, 2004
Fund type U.S. equity fundMicrosoft Corporation 10.41%
Date established December 15, 2000Intel Corporation 4.46%
Type of securities Class A and Class F units of a mutualCisco Systems Inc. 4.24%fund trust
Eligible for Yes. Units of the fund are not foreign Dell Inc. 3.08%registered plans? property.
Amgen Inc. 2.48%Portfolio advisor Scotia Cassels Investment Counsel
Qualcomm Inc. 2.20%Limited
eBay Inc. 2.10%
What does the fund invest in? Oracle Corporation 2.02%
Yahoo Inc. 1.60%Investment objectivesComcast Corporation 1.33%The fund’s objective is aggressive long-term capital growthThe fund has indirect exposure to these securities through its investments inby tracking the performance of the Nasdaq 100 Index1, derivatives and money market instruments.
while maintaining 100% eligibility for registered plans. Itinvests primarily in derivatives that are linked to the What are the risks of investing in the fund?performance of the Nasdaq 100 Index, and in cash andmoney market instruments. The main risks of investing in this fund are:Any change to the fundamental investment objectives ) derivative riskmust be approved by a majority of votes cast at a meeting
) equity riskof unitholders called for that purpose.) currency risk
Investment strategies) index riskThe fund aims to track the performance of the Nasdaq) concentration risk100 Index as closely as possible by using derivatives such
as options, futures and forward contracts that are linked ) liquidity risk.to the performance of the Nasdaq 100 Index. The portfolioadvisor may choose to invest directly in stocks that are The fund may have these additional risks:included in the Nasdaq 100 Index, up to the foreign
) repurchase and reverse repurchase transaction riskcontent limit.
) securities lending riskThe fund invests the balance of its assets in cash and) underlying fund risk.money market instruments. This allows the fund to
maintain 100% registered plan eligibility and to cover itsYou’ll find details about each risk starting on page 164.positions in the derivatives. The fund will only use
derivatives as permitted by securities regulations.Who should invest in this fund?
The fund may participate in repurchase, reverse repur-chase and securities lending transactions to achieve the This fund may be suitable for you if:fund’s overall investment objectives and to enhance the
) you hold your units in a registered plan other than anfund’s returns. You’ll find more information about repur-RESPchase, reverse repurchase and securities lending transac-
) you want the growth potential of investing in U.S.tions on page 3.equity securities while tracking the performance of aDuring the 12 month period immediately precedingmajor market indexOctober 29, 2004, Microsoft Corporation represented a
maximum of approximately 11.1% of the Nasdaq 100 ) you’re investing for at least five yearsIndex.
) you can accept higher risk.
1 The Nasdaq 100 Index is published by The Nasdaq Stock Market, Inc. TheNasdaq Stock Market, Inc. has no connection with Scotia Securities Inc.and has not passed upon the merits of investing in the fund.
115
SC
OT
IA N
AS
DA
Q I
ND
EX
FU
ND
EQ
UIT
Y F
UN
DS

Overall past performanceThis fund isn’t suitable for non-registered accounts orRESPs because the foreign content limit doesn’t apply to This chart shows how a $10,000 investment in the fundthese accounts. The fund’s distributions are primarily would have changed in value, compared with the Nasdaqconsidered income, which is taxed at a higher rate than 100 Index.capital gains when received outside of a registered plan.
Past performance at December 31
This section shows how the fund has performed in thepast and gives you an idea of the risk involved. Thesefigures don’t tell you how the fund will perform in thefuture.
Year-by-year returns
These charts show the fund’s annual performance, whichchanges from year to year.% Class A Units3025 21.21%2015
Dec.2003
Dec.2002
Dec.2000
$
$8,002(b)
$8,354(a)
$4,805
$4,902
Dec. 152000
0
2,000
4,000
6,000
8,000
10,000
12,000
14,000
Dec.2001
Scotia Nasdaq Index Fund
Nasdaq 100 Index
(a) Nasdaq 100 Index
(b) Scotia Nasdaq Index Fund
Class A Units
Class F Units
10The Nasdaq 100 Index is an index of the 100 largest non-financial5
0 companies listed on Nasdaq.-5
-10 -9.50%-15-20 Annual compound returns-25-30 -28.71%-35 This table shows the fund’s annual compound returns,-40 -38.54%-45
2000 2001 2002 2003 compared with the Nasdaq 100 Index.
Since% Class F Units30 1 year 3 years inception
22.67%20 Scotia Nasdaq Index Fund10 5.56% Class A units % 21.21 -19.02 -21.410 Class F units % 22.67 – -8.021
-10 Nasdaq 100 Index % 21.97 -18.60 2
-20 1 April 2, 2001-30 2 Class A units -20.89% and Class F units -6.52%
-40 -38.20%
-502001* 2002 2003 Distribution policy
* Apr. 2, 2001 to Dec. 31, 2001
The fund distributes any income and capital gains inDecember of each calendar year.
Distributions on units held in Scotia registered plans andCopilot non-registered accounts are always reinvested inadditional units of the fund. Distributions on units held inother registered plans and non-registered accounts arereinvested in additional units of the fund, unless you tellus in writing that you want to receive cash distributionsby cheque or by deposit to your bank account.
116
SC
OT
IA N
AS
DA
Q I
ND
EX
FU
ND
EQ
UIT
Y F
UN
DS

Financial highlights, Class A units Fund expenses indirectly borne by investorsat December 31
This example shows the fund’s expenses on a $1,000Distributions and net asset value per unit investment with a 5% annual return.
1999 20001 2001 2002 2003Fees and expenses
Distributions payable over 1 year 3 years 5 years 10 years
from net income $ – – – – – Class A units $ 10.46 32.96 57.77 131.50
from realized gain $ – – – – – Class F units $ 5.95 18.74 32.85 74.78
return of capital $ – – – – –
Total annual distributions $ – – – – –
Net asset value per unit $ – 8.41 6.00 3.68 4.47
Ratios and supplemental data
1999 20001 2001 2002 2003
Net assets (000’s) $ – 6,682 17,814 16,249 20,732
Number of unitsoutstanding (000’s) – 795 2,971 4,410 4,642
MER2 % – 0.86 0.95 0.98 1.021 These figures are for the period from November 30, 2000 to Decem-
ber 31, 2000.2 We may from time to time absorb some of the operating expenses that
the fund would otherwise pay. In 2003, the management expense ratioof the fund would have been 1.39% had we not absorbed some ofthese expenses.
Financial highlights, Class F unitsat December 31
Distributions and net asset value per unit
1999 2000 20012 2002 2003
Distributions
from net income $ – – – – –
from realized gain $ – – – – –
return of capital $ – – – – –
Total annual distributions $ – – – – –
Net asset value per unit $ – – 6.03 3.73 4.57
Ratios and supplemental data
1999 2000 20012 2002 2003
Net assets (000’s) $ – – 12 10 14
Number of unitsoutstanding (000’s) – – 2 3 3
MER3 % – – 0.43 0.55 0.58
Portfolio turnover rate % – – – – –2 These figures are for the period from April 2, 2001 to December 31,
2001.3 We may from time to time absorb some of the operating expenses that
the fund would otherwise pay. In 2003, the management expense ratioof the fund would have been 6.24% had we not absorbed some ofthese expenses.
117
SC
OT
IA N
AS
DA
Q I
ND
EX
FU
ND
EQ
UIT
Y F
UN
DS

Scotia Young Investors FundFund details fund’s overall investment objectives and to enhance the
fund’s returns. You’ll find more information about repur-Fund type Global equity fund
chase, reverse repurchase and securities lending transac-Date established December 15, 2000
tions on page 3.Type of securities Class A units of a mutual fund trust
Eligible for Yes. Units of the fund are foreign The fund educates children and young adults aboutregistered plans? property. investing and personal finance through a variety ofPortfolio advisor Scotia Cassels Investment Counsel educational materials paid for by the fund.Limited
Top 10 holdings at September 30, 2004
What does the fund invest in? Procter & Gamble Company 2.59%
Investment objectives Deutsche Boerse AG 2.48%
Bayerische Motoren Werke AG 2.24%The fund’s objective is long-term capital growth. It investsGroupe Danone 2.23%primarily in equity securities of medium and largeNike Inc. Class B 2.15%companies around the world that produce goods and
services that are directly or indirectly related to, and are PepsiCo Inc. 2.12%
recognized by, children or teenagers. Microsoft Corporation 2.11%
Siemens AG 2.08%Any change to the fundamental investment objectivesBest Buy Company Inc. 2.07%must be approved by a majority of votes cast at a meeting
of unitholders called for that purpose. Canon Inc. 2.05%
Investment strategies What are the risks of investing in the fund?The portfolio advisor uses fundamental analysis to identify The main risks of investing in this fund are:investments that have the potential for above-average
) equity riskgrowth over the long term. This involves evaluating the) foreign investment riskfinancial condition and management of each company, as
well as its industry and the economy. The fund’s assets are ) currency risk.diversified by industry and company to help reduce risk.
The fund may also have these additional risks:The fund can invest anywhere in the world, but generally
) derivative riskwon’t invest in emerging markets.) repurchase and reverse repurchase transaction riskThe fund may invest in other mutual funds which are
managed by us or by other mutual fund managers. You’ll ) securities lending riskfind more information about investing in other mutual ) underlying fund risk (as at October 1, 2004, Scotiafunds on page 2. Securities Inc., Toronto, Ontario held approximately
49.6% of the outstanding units of the fund.)The portfolio advisor may:
) use derivatives such as options, futures and forward You’ll find details about each risk starting on page 164.contracts to hedge against losses from changes in stock
Who should invest in this fund?prices, commodity prices, market indexes or currencyThis fund may be suitable for you if:exchange rates and to gain exposure to financial
markets. It will only use derivatives as permitted by ) you want the growth potential of investing in equitysecurities regulations. securities of foreign companies
) temporarily invest the fund’s assets in cash or cash- ) you’re investing for at least three yearsequivalent securities to try to protect the fund during a
) you can accept medium-to-higher riskmarket downturn or for other reasons.
) you want to help educate children and young adultsThe fund may participate in repurchase, reverse repur- about investing and personal finance.chase and securities lending transactions to achieve the
118
SC
OT
IA Y
OU
NG
IN
VE
ST
OR
S F
UN
DE
QU
ITY
FU
ND
S

Past performance at December 31 Distribution policy
This section shows how the fund has performed in the The fund distributes any income and capital gains inpast and gives you an idea of the risk involved. These December of each calendar year.figures don’t tell you how the fund will perform in the
Distributions on units held in Scotia registered plans andfuture.Copilot non-registered accounts are always reinvested in
Year-by-year returnsadditional units of the fund. Distributions on units held in
This chart shows the fund’s annual performance, which other registered plans and non-registered accounts arechanges from year to year. reinvested in additional units of the fund, unless you tell
us in writing that you want to receive cash distributions%5 by cheque or by deposit to your bank account.
1.20% 0.72%0
Financial highlights-5 at December 31
-6.77%
-10 Distributions and net asset value per unit
-15 1999 20001 2001 2002 2003-16.91%
Distributions-202000 2001 2002 2003 from net income $ – 0.01 – – –
from realized gain $ – – – – –Overall past performancereturn of capital $ – – – – –
This chart shows how a $10,000 investment in the fundTotal annual distributions $ – 0.01 – – –
would have changed in value, compared with the MorganNet asset value per unit $ – 9.90 9.23 7.67 7.73
Stanley Capital International (MSCI) World Index.
Ratios and supplemental data
1999 20001 2001 2002 2003
Net assets (000’s) $ – 7,730 9,760 10,337 11,355
Number of unitsoutstanding (000’s) – 781 1,057 1,347 1,470
MER2 % – 2.14 2.56 2.69 2.61
Portfolio turnoverrate % – – 14.31 6.19 9.881 These figures are for the period from November 30, 2000 to
December 31, 2000.2 We may from time to time absorb some of the operating expenses that
the fund would otherwise pay. In 2003, the management expense ratio
Dec.2000
Dec.2003
Dec.2002
$
Dec. 152000
Scotia Young Investors Fund
MSCI World Index
0
5,000
10,000
15,000
$7,673
$7,896
Dec.2001
of the fund would have been 2.95% had we not absorbed some ofThe MSCI World Index is an index of approximately 1,600 companies listedthese expenses.on stock exchanges in the 22 countries that make up the MSCI national
indexes.
Fund expenses indirectly borne by investorsAnnual compound returns
This table shows the fund’s annual compound returns, This example shows the fund’s expenses on a $1,000compared with the MSCI World Index. investment with a 5% annual return.
Since1 year 3 years inception
Fees and expensesScotia Young Investors Fund % 0.72 -7.94 -7.53 payable over 1 year 3 years 5 years 10 years
MSCI World Index % 8.87 -8.62 -8.34 $ 26.75 84.34 147.82 336.49
119
SC
OT
IA Y
OU
NG
IN
VE
ST
OR
S F
UN
DE
QU
ITY
FU
ND
S
Scotia International Stock Index FundFund details Top 10 holdings at September 30, 2004
Government of Canada Treasury Bills 16.64%Fund type International equity fund
Province of Ontario Residual Bond 2.05% 030805 8.90%Date established November 8, 1999
Type of securities Class A, Class F and Class I units of a Toronto-Dominion Bank Bankers’ Acceptances 8.76%mutual fund trust
Royal Bank of Canada 2.11% 070605 7.83%Eligible for Yes. Units of the fund are not foreign
Bank of Montreal Bankers’ Acceptances 7.59%registered plans? property.
Portfolio advisor State Street Global Advisors, Ltd. Province of Quebec Promissory Notes 6.38%
Canadian Imperial Bank of Commerce 2.45% 061305 5.87%What does the fund invest in? HSBC Bank of Canada Bearers’ Deposit Notes 4.67%
Government of Canada Residual Bond 2.75% 100104 4.50%Investment objectives
GE Capital Canada Funding Company 2.33% 042805 4.50%The fund’s objective is long-term capital growth bytracking the performance of generally recognized indexes What are the risks of investing in the fund?of established international stock markets, while maintain-
The main risks of investing in this fund are:ing 100% eligibility for registered plans. It invests) derivative riskprimarily in futures contracts that are linked to the
performance of the indexes, and in cash and money ) equity riskmarket instruments.
) foreign investment riskAny change to the fundamental investment objectives ) concentration risk.must be approved by a majority of votes cast at a meeting
The fund may have these additional risks:of unitholders called for that purpose.) currency riskInvestment strategies
) emerging markets riskThe fund currently tracks the performance of indexes ofestablished stock markets in Europe, Australasia and the ) repurchase and reverse repurchase transaction riskFar East. The portfolio advisor aims to track the ) securities lending riskperformance of the indexes as closely as possible by using
) underlying fund risk.futures contracts that are linked to the performance ofthese indexes. It invests the balance of its assets in cash You’ll find details about each risk starting on page 164.and money market instruments. This allows the fund to
Who should invest in this fund?maintain 100% registered plan eligibility and to cover itsThis fund may be suitable for you if:positions in the futures contracts. The fund will only use
derivatives as permitted by securities regulations. ) you hold your units in a registered plan other than anRESPThe fund may participate in repurchase, reverse repur-
) you want the growth potential of foreign equitychase and securities lending transactions to achieve thesecurities while tracking the performance of majorfund’s overall investment objectives and to enhance themarket indexesfund’s returns. You’ll find more information about repur-
chase, reverse repurchase and securities lending transac- ) you’re investing for at least three yearstions on page 3.
) you can accept higher risk.
This fund isn’t suitable for non-registered accounts orRESPs because the foreign content limit doesn’t apply tothese accounts. The fund’s distributions are primarilyconsidered income, which is taxed at a higher rate thancapital gains when received outside of a registered plan.
120
SC
OT
IA I
NT
ER
NA
TIO
NA
L S
TO
CK
IN
DE
X F
UN
DE
QU
ITY
FU
ND
S
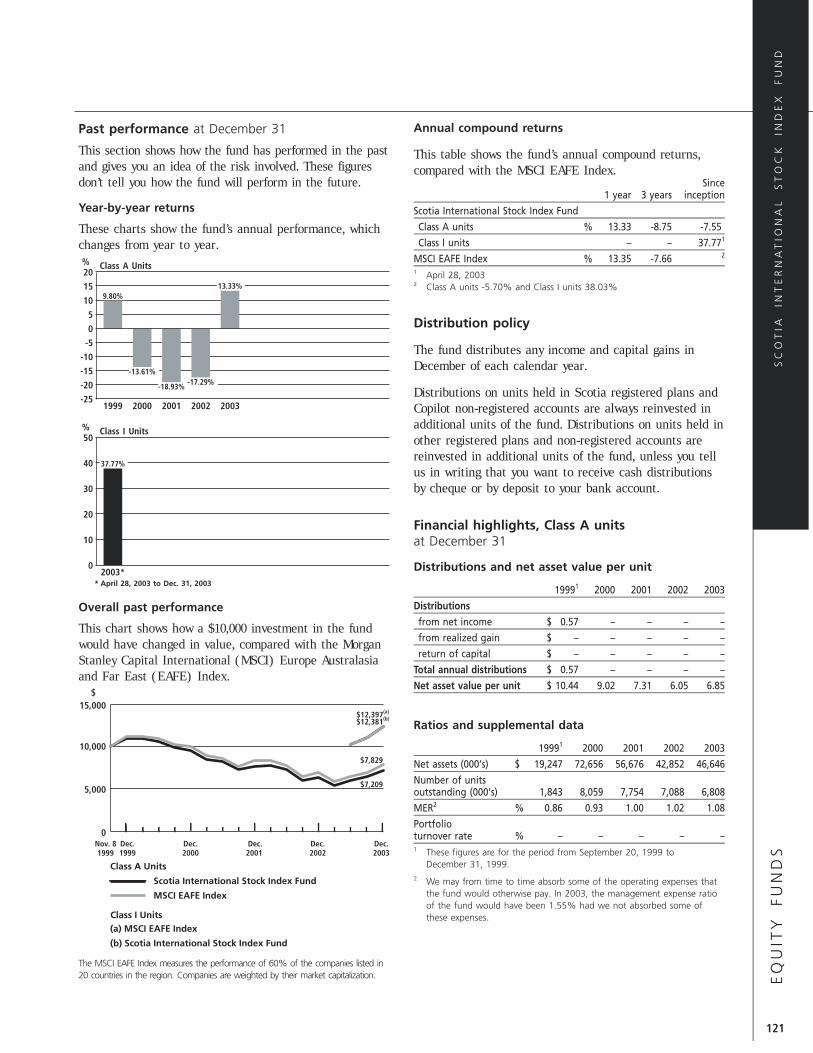
Annual compound returnsPast performance at December 31
This section shows how the fund has performed in the past This table shows the fund’s annual compound returns,and gives you an idea of the risk involved. These figures compared with the MSCI EAFE Index.don’t tell you how the fund will perform in the future. Since
1 year 3 years inceptionYear-by-year returns Scotia International Stock Index Fund
Class A units % 13.33 -8.75 -7.55These charts show the fund’s annual performance, whichClass I units – – 37.771changes from year to year.
MSCI EAFE Index % 13.35 -7.66 2% Class A Units20 1 April 28, 2003
13.33%15 2 Class A units -5.70% and Class I units 38.03%9.80%10
5Distribution policy0
-5 The fund distributes any income and capital gains in-10
December of each calendar year.-15 -13.61%-17.29%-20 -18.93% Distributions on units held in Scotia registered plans and
-251999 2000 2001 2002 2003 Copilot non-registered accounts are always reinvested in
additional units of the fund. Distributions on units held in% Class I Units50 other registered plans and non-registered accounts are
reinvested in additional units of the fund, unless you tell40 37.77%
us in writing that you want to receive cash distributions30 by cheque or by deposit to your bank account.
20Financial highlights, Class A units
10 at December 31
0 Distributions and net asset value per unit2003** April 28, 2003 to Dec. 31, 2003
19991 2000 2001 2002 2003
DistributionsOverall past performancefrom net income $ 0.57 – – – –This chart shows how a $10,000 investment in the fundfrom realized gain $ – – – – –would have changed in value, compared with the Morganreturn of capital $ – – – – –Stanley Capital International (MSCI) Europe Australasia
Total annual distributions $ 0.57 – – – –and Far East (EAFE) Index.Net asset value per unit $ 10.44 9.02 7.31 6.05 6.85
Ratios and supplemental data
19991 2000 2001 2002 2003
Net assets (000’s) $ 19,247 72,656 56,676 42,852 46,646
Number of unitsoutstanding (000’s) 1,843 8,059 7,754 7,088 6,808
MER2 % 0.86 0.93 1.00 1.02 1.08
Portfolioturnover rate % – – – – –1 These figures are for the period from September 20, 1999 to
December 31, 1999.2 We may from time to time absorb some of the operating expenses that
the fund would otherwise pay. In 2003, the management expense ratioof the fund would have been 1.55% had we not absorbed some ofthese expenses.
Dec.1999
Dec.2000
Dec.2001
Dec.2003
Dec.2002
$
$7,209
$7,829
$12,397(a)
$12,381(b)
Nov. 81999
Scotia International Stock Index Fund
MSCI EAFE Index
Class A Units
0
5,000
10,000
15,000
Class I Units(a) MSCI EAFE Index
(b) Scotia International Stock Index Fund
The MSCI EAFE Index measures the performance of 60% of the companies listed in20 countries in the region. Companies are weighted by their market capitalization.
121
SC
OT
IA I
NT
ER
NA
TIO
NA
L S
TO
CK
IN
DE
X F
UN
DE
QU
ITY
FU
ND
S

Financial highlights, Class I unitsat December 31
Distributions and net asset value per unit
1999 2000 2001 2002 20033
Distributions
from net income $ – – – – –
from realized gain $ – – – – –
return of capital $ – – – – –
Total annual distributions $ – – – – –
Net asset value per unit $ – – – – 6.89
Ratios and supplemental data
1999 2000 2001 2002 20033
Net assets (000’s) $ – – – – 1,662
Number of unitsoutstanding (000’s) – – – – 241
MER4 % – – – – –
Portfolio turnoverrate % – – – – –3 These figures are for the period from April 28, 2003 to December 31,
2003.4 We may from time to time absorb some of the operating expenses that
the fund would otherwise pay. In 2003, the management expense ratioof the fund would have been 0.03% had we not absorbed some ofthese expenses.
Fund expenses indirectly borne by investors
This example shows the fund’s expenses on a $1,000investment with a 5% annual return.
Fees and expensespayable over 1 year 3 years 5 years 10 years
Class A units $ 11.07 34.90 61.17 139.24
Class I units $ – – – –
122
SC
OT
IA I
NT
ER
NA
TIO
NA
L S
TO
CK
IN
DE
X F
UN
DE
QU
ITY
FU
ND
S

Scotia Global Growth FundFund details The fund may participate in repurchase, reverse repur-
chase and securities lending transactions to achieve theFund type Global equity fund
fund’s overall investment objectives and to enhance theDate established February 20, 1961
Type of securities Class A, Class F and Class I units of a fund’s returns. You’ll find more information about repur-mutual fund trust chase, reverse repurchase and securities lending transac-
Eligible for Yes. Units of the fund are foreign tions on page 3.registered plans? property.
Portfolio advisor Capital International Asset Top 10 holdings at September 30, 2004Management (Canada), Inc.
AstraZeneca PLC 3.55%
Royal Dutch Petroleum Company 2.66%What does the fund invest in?Sanofi-Aventis SA 2.52%
Investment objectivesVodafone Group PLC 2.50%
The fund’s objective is long-term capital growth. It investsSprint Corp (FON Group) 2.18%
primarily in a broad range of equity securities ofNovartis AG 1.53%
companies around the world.Exxon Mobil Corporation 1.31%
Any change to the fundamental investment objectives Fannie Mae 1.31%must be approved by a majority of votes cast at a meeting Forest Laboratories Inc. 1.31%of unitholders called for that purpose. Applied Materials Inc. 1.21%
Investment strategiesWhat are the risks of investing in the fund?
The portfolio advisor uses fundamental analysis to identifyThe main risks of investing in this fund are:investments that have the potential for above-average) equity riskgrowth over the long term. This involves evaluating the
financial condition and management of each company, as ) foreign investment riskwell as its industry and the economy. The fund’s assets
) currency risk.are diversified by industry and company to help reduce
The fund may have these additional risks:risk.
) liquidity riskThe fund can invest up to 70% of its assets in a singlecountry. It generally won’t invest more than 10% of its ) derivative riskassets in emerging markets.
) emerging markets riskThe fund may invest in other mutual funds which are
) class riskmanaged by us or by other mutual fund managers. You’ll) repurchase and reverse repurchase transaction riskfind more information about investing in other mutual
funds on page 2. ) securities lending riskThe portfolio advisor may: ) underlying fund risk.) use derivatives such as options, futures and forward You’ll find details about each risk starting on page 164.
contracts to hedge against losses from changes in stockWho should invest in this fund?prices, commodity prices, market indexes or currency
exchange rates and to gain exposure to financial This fund may be suitable for you if:markets. It will only use derivatives as permitted by
) you want the growth potential of investing in equitysecurities regulations. securities of companies around the world
) temporarily invest the fund’s assets in cash or cash-) you’re investing for at least three years
equivalent securities to try to protect the fund during a) you can accept higher risk.market downturn or for other reasons.
123
SC
OT
IA G
LO
BA
L G
RO
WT
H F
UN
DE
QU
ITY
FU
ND
S

Past performance at December 31 Distribution policy
This section shows how the fund has performed in the The fund distributes any income and capital gains inpast and gives you an idea of the risk involved. These December of each calendar year.figures don’t tell you how the fund will perform in the
Distributions on units held in Scotia registered plans andfuture.Copilot non-registered accounts are always reinvested inadditional units of the fund. Distributions on units held inYear-by-year returnsother registered plans and non-registered accounts are
This chart shows the fund’s annual performance, which reinvested in additional units of the fund, unless you tellchanges from year to year. us in writing that you want to receive cash distributions% Class A Units by cheque or by deposit to your bank account.30
21.32% 19.57%2013.92% Financial highlights, Class A units
8.87%7.81%10 6.01% at December 311.96%
0 Distributions and net asset value per unit
-10 -10.24% 1999 2000 2001 2002 2003
-20 Distributions-19.91% -21.58%from net income $ – – – – –-30
1994 1995 1996 1997 1998 1999 2000 2001 2002 2003from realized gain $ 0.88 3.05 – – –
return of capital $ – – – – –Overall past performance Total annual distributions $ 0.88 3.05 – – –
Net asset value per unit $ 54.08 45.46 36.41 28.55 30.27This chart shows how a $10,000 investment in the fundwould have changed in value, compared with the MorganStanley Capital International (MSCI) World Index. Ratios and supplemental data
1999 2000 2001 2002 2003
Net assets (000’s) $ 284,678 290,066 237,593 153,917 151,493
Number of unitsoutstanding (000’s) 5,264 6,381 6,526 5,391 5,005
MER % 2.39 2.41 2.55 2.57 2.54
Portfolio turnover rate % 79.94 63.08 112.01 56.07 35.86
Fund expenses indirectly borne by investors
This example shows the fund’s expenses on a $1,000investment with a 5% annual return.
Fees and expenses
Dec.1995
Dec.1996
Dec.1997
Dec.1998
Dec.1999
Dec.2000
Dec.2001
Dec.2003
Dec.2002
$
$11,821
$19,456
Dec.1993
Dec.1994
Scotia Global Growth Fund
MSCI World Index
0
10,000
20,000
30,000
40,000
Class A Units
payable over 1 year 3 years 5 years 10 yearsThe MSCI World Index is an index of approximately 1,600 companies listed
Class A units $ 26.04 82.08 143.86 327.47on stock exchanges in the 22 countries that make up the MSCI nationalindexes.
Annual compound returns
This table shows the fund’s annual compound returns,compared with the MSCI World Index.
1 year 3 years 5 years 10 years
Scotia Global Growth Fund
Class A units % 6.01 -12.68 -6.50 1.69
MSCI World Index % 8.87 -8.62 -4.14 6.88
124
SC
OT
IA G
LO
BA
L G
RO
WT
H F
UN
DE
QU
ITY
FU
ND
S

Scotia European Growth FundFund details markets. It will only use derivatives as permitted by
securities regulations.Fund type European equity fund
) temporarily invest the fund’s assets in cash or cash-Date established September 30, 1996
Type of securities Class A and Class F units of a mutual equivalent securities to try to protect the fund during afund trust market downturn or for other reasons.
Eligible for Yes. Units of the fund are foreignregistered plans? property. The portfolio advisor may actively trade the fund’sPortfolio advisor Bank of Ireland Asset Management investments. This can increase trading costs, which may
(U.S.) Limitedlower the fund’s returns. It also increases the chance thatEffective June 27, 2005, the portfolio
advisor will be Alliance Capital you’ll receive taxable capital gains if you hold the fund inManagement Canada, Inc.
a non-registered account.
The fund may participate in repurchase, reverse repur-What does the fund invest in? chase and securities lending transactions to achieve the
fund’s overall investment objectives and to enhance theInvestment objectivesfund’s returns. You’ll find more information about repur-
The fund’s objective is long-term capital growth. It invests chase, reverse repurchase and securities lending transac-primarily in a broad range of high quality equity securities tions on page 3.of companies in Europe.
Top 10 holdings at September 30, 2004Any change to the fundamental investment objectives
Total SA 4.64%must be approved by a majority of votes cast at a meetingNestle SA 3.68%of unitholders called for that purpose.UBS AG 3.59%
Investment strategies Novartis AG 3.47%
ING Groep NV 3.37%The portfolio advisor uses fundamental analysis to identifyVodafone Group PLC 3.36%investments that have the potential for above-averageE.ON AG 3.19%growth over the long term. This involves evaluating theTesco PLC 3.11%financial condition and management of each company, asBarclays PLC 3.10%well as its industry and the economy. The fund’s assetsEni SpA 3.09%are diversified by industry and company to help reduce
risk.What are the risks of investing in the fund?
The fund can invest up to 60% of its assets in a singleThe main risks of investing in this fund are:country. It generally won’t invest more than 15% of its) equity riskassets in emerging European markets. It holds securities
denominated in a variety of currencies to hedge against ) foreign investment riskvolatility in foreign exchange markets.
) currency risk.
The fund may invest in other mutual funds which areThe fund may have these additional risks:
managed by us or by other mutual fund managers. You’ll) derivative riskfind more information about investing in other mutual
funds on page 2. ) liquidity risk
) emerging markets riskThe portfolio advisor may:
) class risk) use derivatives such as options, futures and forwardcontracts to hedge against losses from changes in stock ) repurchase and reverse repurchase transaction riskprices, commodity prices, market indexes or currency ) securities lending riskexchange rates and to gain exposure to financial
) underlying fund risk.
125
SC
OT
IA E
UR
OP
EA
N G
RO
WT
H F
UN
DE
QU
ITY
FU
ND
S

Overall past performanceYou’ll find details about each risk starting on page 164.This chart shows how a $10,000 investment in the fund
Who should invest in this fund? would have changed in value, compared with the MorganStanley Capital International (MSCI) Europe Australasia
This fund may be suitable for you if:and Far East (EAFE) Index.
) you want the growth potential of investing in equitysecurities of European companies
) you’re investing for at least three years
) you can accept higher risk.
Past performance at December 31
This section shows how the fund has performed in thepast and gives you an idea of the risk involved. Thesefigures don’t tell you how the fund will perform in thefuture.
Dec.1996
Dec.1997
Dec.1998
Dec.1999
$
Sep. 301996
Scotia European Growth Fund
MSCI EAFE Index
$9,675
$11,958
Dec.2000
Dec.2001
Dec.2003
Dec.2002
Class A Units
0
5,000
10,000
15,000
20,000
Year-by-year returns The MSCI EAFE Index measures the performance of 60% of the companieslisted in 20 countries in the region. Companies are weighted by their marketThis chart shows the fund’s annual performance, which capitalization.
changes from year to year.% Annual compound returnsClass A Units30
24.05% This table shows the fund’s annual compound returns,20
14.42% compared with the MSCI EAFE Index.10.06%
10 5.79% Since3.30%1 year 3 years 5 years inception0
Scotia European Growth Fund-6.03%-10Class A units % 10.06 -12.77 -7.98 -0.45
-20-21.20% MSCI EAFE Index % 13.35 -7.66 -3.45 2.47-23.48%
-301996 1997 1998 1999 2000 2001 2002 2003
126
SC
OT
IA E
UR
OP
EA
N G
RO
WT
H F
UN
DE
QU
ITY
FU
ND
S

Distribution policy
The fund distributes any income and capital gains inDecember of each calendar year.
Distributions on units held in Scotia registered plans andCopilot non-registered accounts are always reinvested inadditional units of the fund. Distributions on units held inother registered plans and non-registered accounts arereinvested in additional units of the fund, unless you tellus in writing that you want to receive cash distributionsby cheque or by deposit to your bank account.
Financial highlights, Class A unitsat December 31
Distributions and net asset value per unit1999 2000 2001 2002 2003
Distributions
from net income $ – – 0.05 0.06 0.03
from realized gain $ 0.25 0.15 – – –
return of capital $ – – – – –
Total annual distributions $ 0.25 0.15 0.05 0.06 0.03
Net asset value per unit $ 15.20 14.13 11.08 8.42 9.24
Ratios and supplemental data1999 2000 2001 2002 2003
Net assets (000’s) $101,314 95,295 70,698 40,486 40,328
Number of unitsoutstanding (000’s) 6,665 6,745 6,380 4,808 4,365
MER1 % 2.42 2.43 2.67 2.84 2.90
Portfolio turnover rate % 131.55 217.23 208.21 127.31 77.071 We may from time to time absorb some of the operating expenses that
the fund would otherwise pay. In 2003, the management expense ratioof the fund would have been 2.98% had we not absorbed some ofthese expenses.
Fund expenses indirectly borne by investors
This example shows the fund’s expenses on a $1,000investment with a 5% annual return.Fees and expensespayable over 1 year 3 years 5 years 10 years
Class A units $ 29.73 93.71 164.25 373.88
127
SC
OT
IA E
UR
OP
EA
N G
RO
WT
H F
UN
DE
QU
ITY
FU
ND
S

Scotia Pacific Rim Growth FundFund details ) temporarily invest the fund’s assets in cash or cash-
equivalent securities to try to protect the fund during aFund type Asia/Pacific Rim equity fund
Date established August 18, 1994 market downturn or for other reasons.Type of securities Class A, Class F and Class I units of a The portfolio advisor may actively trade the fund’smutual fund trust
investments. This can increase trading costs, which mayEligible for Yes. Units of the fund are foreignregistered plans? property. lower the fund’s returns. It also increases the chance thatPortfolio advisor TCW Investment Management you’ll receive taxable capital gains if you hold the fund in
Companya non-registered account.
The fund may participate in repurchase, reverse repur-What does the fund invest in?chase and securities lending transactions to achieve the
Investment objectives fund’s overall investment objectives and to enhance theThe fund’s objective is long-term capital growth. It invests fund’s returns. You’ll find more information about repur-primarily in a broad range of equity securities of chase, reverse repurchase and securities lending transac-companies in the western portion of the Pacific Rim. tions on page 3.
Any change to the fundamental investment objectives Top 10 holdings at September 30, 2004must be approved by a majority of votes cast at a meeting
Toyota Motor Corporation 4.79%of unitholders called for that purpose.Australia & New Zealand Banking Group Ltd. 3.48%
Investment strategies Mitsubishi Tokyo Financial Group Inc. 2.87%
Samsung Electronics Company GDR 2.48%The fund generally invests in the more developed marketsSumitomo Mitsui Financial Group Inc. 2.36%of Australia, Hong Kong, Japan, New Zealand, SingaporeFujitsu Ltd. 2.35%and Taiwan. It may invest up to 35% of its assets in
emerging market countries, such as China, Korea, Malay- Yokogawa Electric Corporation 2.23%
sia and Thailand. Nidec Corporation 2.20%
Rio Tinto Ltd. 2.18%The portfolio advisor uses fundamental analysis to identifyPioneer Corporation 2.15%investments that have the potential for above-average
growth over the long term. This involves evaluating theWhat are the risks of investing in the fund?financial condition and management of each company, asThe main risks of investing in this fund are:well as its industry and the economy. The fund’s assets are
diversified by industry and company to help reduce risk. ) equity riskThe fund can invest up to 75% of its assets in a single ) concentration riskcountry. It holds securities denominated in a variety of
) foreign investment riskcurrencies to hedge against volatility in foreign exchange
) emerging markets riskmarkets.) currency riskThe fund may invest in other mutual funds which are
managed by us or by other mutual fund managers. You’ll ) liquidity risk.find more information about investing in other mutual
The fund may have these additional risks:funds on page 2.) derivative risk
The portfolio advisor may:) class risk
) use derivatives such as options, futures and forward) repurchase and reverse repurchase transaction riskcontracts to hedge against losses from changes in stock) securities lending riskprices, commodity prices, market indexes or currency
exchange rates and to gain exposure to financial ) underlying fund risk.markets. It will only use derivatives as permitted by You’ll find details about each risk starting on page 164.securities regulations.
128
SC
OT
IA P
AC
IFIC
RIM
GR
OW
TH
FU
ND
EQ
UIT
Y F
UN
DS

Annual compound returnsWho should invest in this fund?
This table shows the fund’s annual compound returns,This fund may be suitable for you if:compared with the MSCI EAFE Index and the MSCI
) you want the growth potential of investing in equityPacific Index.securities of companies in the region of Australasia Since
1 year 3 years 5 years inception) you’re investing for at least five years
Scotia Pacific Rim Growth Fund) you can accept higher risk. Class A units % 17.33 -5.04 2.17 0.67
MSCI EAFE Index % 13.35 -7.66 -3.45 3.39Past performance at December 31 MSCI Pacific Index % 13.27 -6.93 -1.60 -3.59
This section shows how the fund has performed in theDistribution policypast and gives you an idea of the risk involved. TheseThe fund distributes any income and capital gains infigures don’t tell you how the fund will perform in theDecember of each calendar year.future.Distributions on units held in Scotia registered plans and
Year-by-year returnsCopilot non-registered accounts are always reinvested in
This chart shows the fund’s annual performance, whichadditional units of the fund. Distributions on units held in
changes from year to year.other registered plans and non-registered accounts are
% Class A Units100 reinvested in additional units of the fund, unless you tell
80.06%80 us in writing that you want to receive cash distributions60 by cheque or by deposit to your bank account.40
Financial highlights, Class A units17.33%20 10.02% 5.53% at December 313.60%0
-5.52% Distributions and net asset value per unit-13.82% -15.31%-15.97%-20
1999 2000 2001 2002 2003-27.79%-40
1994 1995 1996 1997 1998 1999 2000 2001 2002 2003 Distributions
from net income $ – – – – –Overall past performance from realized gain $ – – – – –This chart shows how a $10,000 investment in the fund return of capital $ – – – – –would have changed in value, compared with the Morgan Total annual distributions $ – – – – –
Stanley Capital International (MSCI) Europe Australasia Net asset value per unit $ 15.82 11.42 9.85 8.34 9.78
and Far East (EAFE) Index and the MSCI Pacific Index.Ratios and supplemental data
1999 2000 2001 2002 2003
Net assets (000’s) $ 53,320 38,750 28,793 21,042 23,563
Number of unitsoutstanding (000’s) 3,371 3,392 2,925 2,524 2,409
MER1 % 2.60 2.60 2.77 2.83 2.88
Portfolioturnover rate % 452.64 331.80 316.59 207.85 166.741 We may from time to time absorb some of the operating expenses that
the fund would otherwise pay. In 2003, the management expense ratioof the fund would have been 3.13% had we not absorbed some ofthese expenses.
Fund expenses indirectly borne by investors
This example shows the fund’s expenses on a $1,000
Dec.1995
Dec.1996
Dec.1994
Dec.2000
Dec.1997
Dec.1998
Dec.1999
Dec.2001
Dec.2003
Dec.2002
$
$7,141
$13,584
Oct. 131994
Scotia Pacific Rim Growth Fund
MSCI EAFE Index
MSCI Pacific Index
0
5,000
10,000
15,000
20,000
Class A Units
$10,634
investment with a 5% annual return.The MSCI EAFE Index measures the performance of 60% of the companieslisted in 20 countries in the region. Companies are weighted by their market Fees and expensescapitalization. payable over 1 year 3 years 5 years 10 years
The MSCI Pacific Index measures the total return of equity securities in Class A units $ 29.52 93.06 163.12 371.30Australia, Japan, Singapore, Hong Kong and New Zealand.
129
SC
OT
IA P
AC
IFIC
RIM
GR
OW
TH
FU
ND
EQ
UIT
Y F
UN
DS

Scotia Latin American Growth FundFund details ) temporarily invest the fund’s assets in cash or cash-
equivalent securities to try to protect the fund during aFund type Latin American equity fund
Date established August 18, 1994 market downturn or for other reasons.Type of securities Class A, Class F and Class I units of a
mutual fund trust The fund may participate in repurchase, reverse repur-Eligible for Yes. Units of the fund are foreign chase and securities lending transactions to achieve theregistered plans? property.
fund’s overall investment objectives and to enhance thePortfolio advisor TCW Investment ManagementCompany fund’s returns. You’ll find more information about repur-
chase, reverse repurchase and securities lending transac-tions on page 3.What does the fund invest in?
Investment objectives Top 10 holdings at September 30, 2004
The fund’s objective is long-term capital growth. It invests America Movil SA de CV Series L ADR 7.34%
primarily in a broad range of high quality equity securities Compania Vale do Rio Doce ADR 7.14%of companies in Latin America. Telefonos de Mexico SA ADR 7.00%
Petroleo Brasileiro SA ADR 5.88%Any change to the fundamental investment objectivesCompanhia Siderurgica Nacional SA ADR 5.60%must be approved by a majority of votes cast at a meetingUsinas Sider de Minas Gerais SA 4.85%of unitholders called for that purpose.Companhia de Bebidas das Americas Pref. ADR 4.76%
Investment strategies Banco Bradesco SA ADR 4.41%
Companhia Vale do Rio Doce SA ADR 4.11%The portfolio advisor uses fundamental analysis to identifyCemex SA de CV ADR 3.78%investments that have the potential for above-average
growth over the long term. This involves evaluating theWhat are the risks of investing in the fund?financial condition and management of each company, as
well as its industry and the economy. The fund’s assets The main risks of investing in this fund are:are diversified by industry and company to help reduce
) equity riskrisk.
) concentration riskThe fund can invest up to 65% of its assets in a single
) foreign investment riskcountry. It holds securities denominated in a variety of
) emerging markets riskcurrencies to hedge against volatility in foreign exchangemarkets. ) currency risk
) liquidity risk.The fund can invest up to 25% of its assets in any marketoutside Latin America. During the 12 months preceding October 29, 2004, up to
10.1% of the net assets of the fund were invested inThe fund may invest in other mutual funds which areTelefonos de Mexico SA ADR and up to 10.6% of the netmanaged by us or by other mutual fund managers. You’llassets of the fund were invested in America Movil SA defind more information about investing in other mutualCV Series L ADR.funds on page 2.
The fund may have these additional risks:The portfolio advisor may:) derivative risk) use derivatives such as options, futures and forward
contracts to hedge against losses from changes in stock ) class riskprices, commodity prices, market indexes or currency ) repurchase and reverse repurchase transaction riskexchange rates and to gain exposure to financialmarkets. It will only use derivatives as permitted bysecurities regulations.
130
SC
OT
IA L
AT
IN A
ME
RIC
AN
GR
OW
TH
FU
ND
EQ
UIT
Y F
UN
DS

Overall past performance) securities lending risk
) underlying fund risk. This chart shows how a $10,000 investment in the fundwould have changed in value, compared with the Morgan
You’ll find details about each risk starting on page 164.Stanley Capital International (MSCI) World Index and theMSCI Emerging Markets (EM) Latin America Index.
Who should invest in this fund?
This fund may be suitable for you if:
) you want the growth potential of investing in equitysecurities of Latin American companies
) you’re investing for at least five years
) you can accept higher risk.
Past performance at December 31
This section shows how the fund has performed in the pastand gives you an idea of the risk involved. These figuresdon’t tell you how the fund will perform in the future.
$
Scotia Latin American Growth Fund
MSCI World Index
MSCI EM Latin America Index
Dec.1995
Dec.1994
Dec.1996
Dec.1997
Dec.1998
Dec.1999
Dec.2000
Dec.2001
Dec.2003
Dec.2002
Aug. 181994
$17,499
$16,222
$20,506
Class A Units
0
10,000
20,000
30,000
40,000
The MSCI World Index is an index of approximately 1,600 companies listedon stock exchanges in the 22 countries that make up the MSCI nationalYear-by-year returnsindexes.
The MSCI EM Latin America Index measures the total return of equityThis chart shows the fund’s annual performance, whichsecurities in the Latin American region. On November 1, 2002, the index
changes from year to year. included Argentina, Brazil, Chile, Colombia, Mexico, Peru and Venezuela.
% Class A Units70 Annual compound returns
56.25%605040 This table shows the fund’s annual compound returns,31.34%29.27% 26.24%30
compared with the MSCI World Index and the MSCI EM2010 3.71%0.90% 0.10% Latin America Index.0
-10-13.00% Since-20 -20.54% 1 year 3 years 5 years inception-30
-33.14%-40 Scotia Latin American Growth Fund-50
1994 1995 1996 1997 1998 1999 2000 2001 2002 2003 Class A units % 31.34 1.46 7.27 5.40
MSCI World Index % 8.87 -8.62 -4.14 6.27
MSCI EM LatinAmerica Index % 17.09 -9.35 -4.61 8.12
Distribution policy
The fund distributes any income and capital gains inDecember of each calendar year.
Distributions on units held in Scotia registered plans andCopilot non-registered accounts are always reinvested inadditional units of the fund. Distributions on units held inother registered plans and non-registered accounts arereinvested in additional units of the fund, unless you tellus in writing that you want to receive cash distributionsby cheque or by deposit to your bank account.
131
SC
OT
IA L
AT
IN A
ME
RIC
AN
GR
OW
TH
FU
ND
EQ
UIT
Y F
UN
DS

Financial highlights, Class A unitsat December 31
Distributions and net asset value per unit
1999 2000 2001 2002 2003
Distributions
from net income $ – – 0.91 – –
from realized gain $ – – – – –
return of capital $ – – – – –
Total annual distributions $ – – 0.91 – –
Net asset value per unit $ 15.77 13.72 12.77 10.15 13.33
Ratios and supplemental data
1999 2000 2001 2002 2003
Net assets (000’s) $ 39,526 32,284 43,063 26,835 30,935
Number of unitsoutstanding (000’s) 2,506 2,353 3,372 2,644 2,321
MER1 % 2.56 2.57 2.83 2.96 2.93
Portfolio turnover rate % 114.82 61.38 92.13 48.62 34.06
1 We may from time to time absorb some of the operating expenses thatthe fund would otherwise pay. In 2003, the management expense ratioof the fund would have been 2.95% had we not absorbed some ofthese expenses.
Fund expenses indirectly borne by investors
This example shows the fund’s expenses on a $1,000investment with a 5% annual return.
Fees and expensespayable over 1 year 3 years 5 years 10 years
Class A units $ 30.03 94.68 165.95 377.75
132
SC
OT
IA L
AT
IN A
ME
RIC
AN
GR
OW
TH
FU
ND
EQ
UIT
Y F
UN
DS
Capital U.S. Large Companies FundFund details Top 10 holdings at September 30, 2004
Fund type U.S. equity fund The following are the top 10 holdings of CapitalDate established December 15, 2000 International-U.S. Equity, the underlying fund:Type of securities Class A and Class F units of a mutual
fund trust AstraZeneca PLC 4.0%Eligible for Yes. Units of the fund are foreign Sprint Corp. 3.1%registered plans? property.
J.P. Morgan Chase & Co. 2.7%Portfolio advisor Capital International Asset
Forest Laboratories, Inc. 2.6%Management (Canada), Inc.SLM Corp. 2.6%
Washington Mutual, Inc. 2.3%What does the fund invest in? General Electric Co. 2.1%
Allergan, Inc. 2.1%Investment objectivesApplied Materials, Inc. 1.8%
The fund’s objective is to achieve long-term growth of Exxon Mobil Corp. 1.8%capital through exposure primarily to equity securities oflarge U.S. issuers and securities whose principal markets The information contained in this list may change due toare in the U.S. (including ADRs and other U.S. registered ongoing portfolio transactions of the underlying fund. Currentforeign securities) by investing its assets in Class I units of holdings may be found at www.capitalinternationalfunds.ca.Capital International-U.S. Equity.
You can get a copy of the simplified prospectus of theAny change to the fundamental investment objectives underlying fund by calling us at 1-800-268-9269must be approved by a majority of votes cast at a meeting (416-750-3863 in Toronto) for English, or 1-800-387-5004of unitholders called for that purpose. for French, by asking your mutual fund representative, or
at www.sedar.com.Investment strategies
What are the risks of investing in the fund?The fund has exposure to common stocks and preferredstocks (or securities convertible or exchangeable into This fund indirectly has the same risks as Capitalsuch securities) of companies with market capitalization International-U.S. Equity:greater than Cdn. $2.25 billion at the time of purchase.
) equity riskThe fund will have exposure to cash, cash equivalents and ) foreign investment riskdebt securities when prevailing market and economic
) currency riskconditions indicate that it is desirable to do so.) derivative risk
The fund may from time to time be exposed to) repurchase and reverse repurchase transaction riskinvestments in forward currency contracts in order to) securities lending riskmanage risk and implement investment strategies in a
more efficient manner. ) class risk
) underlying fund risk.The fund may enter into repurchase transactions, reverserepurchase transactions and securities lending agreements You’ll find details about each risk starting on page 164.to seek enhanced returns, but will only do so if there aresuitable counterparties available, if the transactions are
Who should invest in this fund?considered appropriate and after first giving itsunitholders 60 days’ prior written notice. You’ll find more This fund may be suitable for you if:information about repurchase, reverse repurchase and ) you want the growth potential of having exposure tosecurities lending transactions on page 3. equity securities of large U.S. companies
133
CA
PIT
AL
U.S
. L
AR
GE
CO
MP
AN
IES
FU
ND
EQ
UIT
Y F
UN
DS

Overall past performance) you’re investing for at least three yearsThis chart shows how a $10,000 investment in the fund) you can accept higher risk.would have changed in value, compared with the Standard
Past performance at December 31 & Poor’s 500 (S&P 500) Index (Total Return).
This section shows how the fund performed in the pastand gives you an idea of the risk involved. These figuresdon’t tell you how the fund will perform in the future.
Year-by-year returns
These charts show the fund’s annual performance, whichchanges from year to year.% Class A Units15
9.82%105 2.15%
0.20%0
-5-10-15-20-25
-26.98%-30
$
Dec. 152000
Capital U.S. Large Companies Fund
S&P 500 Index (Total Return)
Class A Units
Class F Units
Dec.2001
Dec.2000
Dec.2003
Dec.2002
$7,574
$8,209
$8,172(b)
$7,823(a)
0
5,000
10,000
15,000
(a) S&P 500 Index (Total Return)
(b) Capital U.S. Large Companies Fund
-352000 2001 2002 2003 The S&P 500 Index (Total Return) is an index of 500 stocks weighted by
capitalization and representing all major U.S. industries. It’s a broad measure% Class F Units of the U.S. economy.2015 11.05%10
Annual compound returns50
-0.50%-5 This table shows the fund’s annual compound returns,
-10-15 compared with the S&P 500 Index (Total Return).-20 Since-25 1 year 3 years inception-26.05%-30
Capital U.S. Large Companies Fund-352001* 2002 2003
Class A units % 9.82 -6.43 -6.28* Apr. 18, 2001 to Dec. 31, 2001
Class F units % 11.05 – -7.191
S&P 500 Index (Total Return) % 5.24 -8.74 2
1 April 18, 20012 Class A units -8.73% and Class F units -8.68%
Distribution policy
The fund distributes any income and capital gains inDecember of each calendar year.
Distributions on units held in Scotia registered plans andCopilot non-registered accounts are always reinvested inadditional units of the fund. Distributions on units held inother registered plans and non-registered accounts arereinvested in additional units of the fund, unless you tellus in writing that you want to receive cash distributionsby cheque or by deposit to your bank account.
134
CA
PIT
AL
U.S
. L
AR
GE
CO
MP
AN
IES
FU
ND
EQ
UIT
Y F
UN
DS

Financial highlights, Class A units Fund expenses indirectly borne by investorsat December 31
This example shows the fund’s expenses on a $1,000Distributions and net asset value per unitinvestment with a 5% annual return.
1999 20001 2001 2002 2003Fees and expensesDistributionspayable over 1 year 3 years 5 years 10 years
from net income $ – – – – –Class A units $ 25.32 79.81 139.90 318.44
from realized gain $ – – – – –Class F units $ 13.53 42.65 74.76 170.18
return of capital $ – – – – –
Total annual distributions $ – – – – –
Net asset value per unit $ – 9.85 10.06 7.35 8.07
Ratios and supplemental data
1999 20001 2001 2002 2003
Net assets (000’s) $ – 4,752 94,389 148,823 158,374
Number of unitsoutstanding (000’s) – 483 9,383 20,261 19,634
MER2 % – 2.15 2.46 2.47 2.47
Portfolio turnoverrate % – – 6.01 4.04 4.851 These figures are for the period from November 30, 2000 to Decem-
ber 31, 2000.2 We may from time to time absorb some of the operating expenses that
the fund would otherwise pay. In 2003, the management expense ratioof the fund would have been 2.52% had we not absorbed some ofthese expenses.
Financial highlights, Class F unitsat December 31
Distributions and net asset value per unit
1999 2000 20013 2002 2003
Distributions
from net income $ – – – – –
from realized gain $ – – – – –
return of capital $ – – – – –
Total annual distributions $ – – – – –
Net asset value per unit $ – – 10.14 7.50 8.33
Ratios and supplemental data
1999 2000 20013 2002 2003
Net assets (000’s) % – – 53 36 20
Number of unitsoutstanding (000’s) – – 5 5 2
MER4 % – – 1.07 1.39 1.32
Portfolio turnoverrate % – – 6.01 4.04 4.853 These figures are for the period from April 18, 2001 to December 31, 2001.4 We may from time to time absorb some of the operating expenses that
the fund would otherwise pay. In 2003, the management expense ratioof the fund would have been 2.67% had we not absorbed some ofthese expenses.
135
CA
PIT
AL
U.S
. L
AR
GE
CO
MP
AN
IES
FU
ND
EQ
UIT
Y F
UN
DS

Capital U.S. Large Companies RSP FundFund details to seek enhanced returns, but will only do so if there are
suitable counterparties available, if the transactions areFund type U.S. equity fund
considered appropriate and after first giving itsDate established December 15, 2000
unitholders 60 days’ prior written notice. You’ll find moreType of securities Class A and Class F units of a mutualfund trust information about repurchase, reverse repurchase and
Eligible for Yes. Units of the fund are not foreign securities lending transactions on page 3.registered plans? property.
Portfolio advisor Capital International AssetTop 10 holdings at September 30, 2004Management (Canada), Inc.
The following are the top 10 holdings of CapitalInternational-U.S. Equity, the underlying fund:What does the fund invest in?
Investment objectivesAstraZeneca PLC 4.0%
The fund’s objective is long-term growth of capital Sprint Corp. 3.1%through exposure primarily to equity securities of large J.P. Morgan Chase & Co. 2.7%U.S. issuers and securities whose principal markets are in Forest Laboratories, Inc. 2.6%the U.S. (including ADRs and other U.S. registered foreign
SLM Corp. 2.6%securities), while maintaining 100% eligibility for regis-
Washington Mutual, Inc. 2.3%tered plans. The fund currently uses derivatives that are
General Electric Co. 2.1%linked to the performance of Capital International-Allergan, Inc. 2.1%U.S. Equity. It also invests directly in Class I units ofApplied Materials, Inc. 1.8%Capital International-U.S. Equity.Exxon Mobil Corp. 1.8%
Any change to the fundamental investment objectivesmust be approved by a majority of votes cast at a meeting The information contained in this list may change due toof unitholders called for that purpose. ongoing portfolio transactions of the underlying fund. Current
holdings may be found at www.capitalinternationalfunds.ca.Investment strategies
You can get a copy of the simplified prospectus of theThis is an RSP Fund. It aims to track the performance of underlying fund by calling us at 1-800-268-9269Capital International-U.S. Equity as closely as possible by: (416-750-3863 in Toronto) for English, or 1-800-387-5004) investing in Class I units of Capital International- for French, by asking your mutual fund representative, or
U.S. Equity up to the foreign content limit at www.sedar.com.
) using forward contracts that are linked to the perform-What are the risks of investing in the fund?ance of Capital International-U.S. Equity. The fund
enters into the forward contracts with a counterparty, This fund indirectly has the same risks as Capitalwhich is usually a large financial institution. International-U.S. Equity:
The fund may place the balance of its assets on deposit ) equity riskwith a Canadian financial institution or may invest in ) foreign investment riskCanadian money market instruments. This allows the fund
) currency riskto maintain 100% registered plan eligibility and to cover) derivative riskits positions in the forward contracts. The fund will only
use derivatives as permitted by securities regulations. ) repurchase and reverse repurchase transaction riskYou’ll find more information in About the RSP Funds on
) securities lending riskpage 2.
) class riskThe fund may enter into repurchase transactions, reverse
) underlying fund risk.repurchase transactions and securities lending agreements
136
CA
PIT
AL
U.S
. L
AR
GE
CO
MP
AN
IES
RS
P F
UN
DE
QU
ITY
FU
ND
S

% Class F UnitsThe fund also has RSP Fund risk. 1510.28%
105You’ll find details about each risk starting on page 164.0
-5 -4.40%Who should invest in this fund? -10
-15-20This fund may be suitable for you if:-25
-26.08%-30) you hold your units in a registered plan other than an-35
2001* 2002 2003RESP and your plan holds the maximum allowable* May 17, 2001 to Dec. 31, 2001
amount of foreign property
) you want the growth potential of having exposure to Overall past performanceequity securities of large U.S. companies This chart shows how a $10,000 investment in the fund
) you’re investing for at least three years would have changed in value, compared with the Standard& Poor’s 500 (S&P 500) Index (Total Return).) you can accept higher risk.
If you’re investing through a non-registered account orRESP or your registered plan holds less than themaximum allowable amount of foreign property, youshould invest in the Capital U.S. Large Companies Funddirectly because you’ll usually get a better return. Thefund’s distributions are primarily considered income,which is taxed at a higher rate than capital gains whenreceived outside of a registered plan. This income isgenerally realized more frequently than capital gainsrealized by the Capital U.S. Large Companies Fund.
Past performance at December 31
This section shows how the fund has performed in the
$
$7,574
$7,954
$7,795(b)
$7,576(a)
Capital U.S. Large Companies RSP Fund
S&P 500 Index (Total Return)
(a) S&P 500 Index (Total Return)
(b) Capital U.S. Large Companies RSP Fund
0
10,000
20,000
Dec.2000
Dec.2003
Dec.2002
Dec.2001
Dec. 152000
Class A Units
Class F Units
The S&P 500 Index (Total Return) is an index of 500 stocks weighted bypast and gives you an idea of the risk involved. Thesecapitalization and representing all major U.S. industries. It’s a broad measure
figures don’t tell you how the fund will perform in the of the U.S. economy.
future.Annual compound returns
Year-by-year returns This table shows the fund’s annual compound returns,compared with the S&P 500 Index (Total Return).These charts show the fund’s annual performance, which
changes from year to year. Since1 year 3 years inception
% Class A Units Capital U.S. Large Companies RSP Fund159.19%10 Class A units % 9.19 -6.42 -7.25
2.93%5Class F units % 10.28 – -9.051
0-2.95% S&P 500 Index (Total Return) % 5.24 -8.74 2-5
-10 1 May 17, 2001-15 2 Class A units -8.73% and Class F units -10.04%-20-25
-27.08%-30-35
2000 2001 2002 2003
137
CA
PIT
AL
U.S
. L
AR
GE
CO
MP
AN
IES
RS
P F
UN
DE
QU
ITY
FU
ND
S

Ratios and supplemental dataDistribution policy
1999 2000 20013 2002 2003The fund distributes any income and capital gains inNet assets (000’s) $ – – 5 65 68December of each calendar year.Number of unitsoutstanding (000’s) – – 0.5 9 8Distributions on units held in Scotia registered plans andMER4 % – – 1.07 1.72 1.69
Copilot non-registered accounts are always reinvested inPortfolio turnover rate % – – 11.46 32.78 15.06
additional units of the fund. Distributions on units held in 3 These figures are for the period from May 17, 2001 to December 31,2001.other registered plans and non-registered accounts are
4 We may from time to time absorb some of the operating expenses thatreinvested in additional units of the fund, unless you tellthe fund would otherwise pay. In 2003, the management expense ratio
us in writing that you want to receive cash distributions of the fund would have been 2.19% had we not absorbed some ofthese expenses.by cheque or by deposit to your bank account.
Fund expenses indirectly borne by investorsFinancial highlights, Class A units at December 31 This example shows the fund’s expenses on a $1,000Distributions and net asset value per unit investment with a 5% annual return.
1999 20001 2001 2002 2003 Fees and expensespayable over 1 year 3 years 5 years 10 yearsDistributionsClass A units $ 28.70 90.48 158.59 360.99from net income $ – – – – –Class F units 17.32 54.61 95.72 217.88from realized gain $ – – – – –
return of capital $ – – – – –
Total annual distributions $ – – – – –
Net asset value per unit $ – 9.68 9.96 7.27 7.93
Ratios and supplemental data
1999 20001 2001 2002 2003
Net assets (000’s) $ – 163 2,154 3,989 4,800
Number of unitsoutstanding (000’s) – 17 216 549 605
MER2 % – 2.46 2.76 2.79 2.80
Portfolio turnover rate % – – 11.46 32.78 15.061 These figures are for the period from November 30, 2000 to
December 31, 2000.2 We may from time to time absorb some of the operating expenses that
the fund would otherwise pay. In 2003, the management expense ratioof the fund would have been 3.75% had we not absorbed some ofthese expenses.
Financial highlights, Class F unitsat December 31
Distributions and net asset value per unit
1999 2000 20013 2002 2003
Distributions
from net income $ – – – – –
from realized gain $ – – – – –
return of capital $ – – – – –
Total annual distributions $ – – – – –
Net asset value per unit $ – – 10.04 7.42 8.18
138
CA
PIT
AL
U.S
. L
AR
GE
CO
MP
AN
IES
RS
P F
UN
DE
QU
ITY
FU
ND
S

Capital U.S. Small Companies FundFund details unitholders 60 days’ prior written notice. You’ll find more
information about repurchase, reverse repurchase andFund type U.S. small and mid-capitalization equity
securities lending transactions on page 3.fund
Date established December 15, 2000Top 10 holdings at September 30, 2004Type of securities Class A and Class F units of a mutual
fund trust The following are the top 10 holdings of CapitalEligible for Yes. Units of the fund are foreign International-U.S. Small Cap, the underlying fund:registered plans? property.
Portfolio advisor Capital International AssetMethanex Corp. 2.3%Management (Canada), Inc.
Cymer, Inc. 1.7%
Beazer Homes USA, Inc. 1.6%What does the fund invest in?W.R. Berkley Corp. 1.6%
Investment objectivesSL Green Realty Corp. 1.4%
CMS Energy Corp. 1.3%The fund’s objective is to achieve long-term growth ofAptarGroup, Inc. 1.3%capital through exposure to equity securities of smaller
and medium-sized U.S. issuers and securities whose Furniture Brands International, Inc. 1.3%
principal markets are in the U.S. (including ADRs and AmeriCredit Corp. 1.3%
other U.S. registered foreign securities) by investing its BOK Financial Corp. 1.3%assets in Class I units of Capital International-U.S. Small
The information contained in this list may change due toCap.ongoing portfolio transactions of the underlying fund. Current
Any change to the fundamental investment objectives holdings may be found at www.capitalinternationalfunds.ca.must be approved by a majority of votes cast at a meeting
You can get a copy of the simplified prospectus of theof unitholders called for that purpose.underlying fund by calling us at 1-800-268-9269(416-750-3863 in Toronto) for English, or 1-800-387-5004Investment strategiesfor French, by asking your mutual fund representative, or
The fund has exposure to common stocks and preferred at www.sedar.com.stocks (or securities convertible or exchangeable intosuch securities) of companies with market capitalization What are the risks of investing in the fund?of between Cdn $75 million and Cdn $2.25 billion at the
This fund indirectly has the same risks as Capitaltime of purchase. In determining market capitalization,International-U.S. Small Cap:the fund may consider the value of shares which are
publicly traded. ) equity risk
) small company riskThe fund will have exposure to cash, cash equivalents anddebt securities when prevailing market and economic ) foreign investment riskconditions indicate that it is desirable to do so. ) currency risk
The fund may from time to time be exposed to ) liquidity riskinvestments in forward currency contracts in order to ) derivative riskmanage risk and implement investment strategies in a
) repurchase and reverse repurchase transaction riskmore efficient manner.) securities lending risk
The fund may enter into repurchase transactions, reverse) underlying fund risk (as at October 1, 2004, Scotiarepurchase transactions and securities lending agreements
Securities Inc., Toronto, Ontario held approximatelyto seek enhanced returns, but will only do so if there are77.3% of the outstanding units of the fund.)suitable counterparties available, if the transactions are
considered appropriate and after first giving its The fund also has class risk.
139
CA
PIT
AL
U.S
. S
MA
LL
CO
MP
AN
IES
FU
ND
EQ
UIT
Y F
UN
DS

Overall past performanceYou’ll find details about each risk starting on page 164.
This chart shows how a $10,000 investment in the fundWho should invest in this fund? would have changed in value, compared with the Russell
2000 Index.This fund may be suitable for you if:
) you want the growth potential of having exposure toequity securities of smaller and medium-sized U.S.companies
) you’re investing for at least five years
) you can accept higher risk.
Past performance at December 31
This section shows how the fund and the underlying fundhave performed in the past and gives you an idea of therisk involved. These figures don’t tell you how the fundand the underlying fund will perform in the future.
Year-by-year returns
Dec.2000
Dec.2001
Dec.2003
Dec.2002
$
Dec. 152000
Capital U.S. Small Companies Fund
Russell 2000 Index
0
5,000
10,000
15,000
20,000
$8,263(b)$8,389
$9,448(a)$10,795
Class F Units
Class A Units
(a) Russell 2000 Index
(b) Capital U.S. Small Companies Fund
These charts show the fund’s annual performance, which The Russell 2000 Index measures the performance of the 2,000 smallestcompanies in the Russell 3000 Index, which represents approximately 8% ofchanges from year to year. the total market capitalization of the Russell 3000 Index. The Russell 3000Index measures the performance of the 3,000 largest U.S. companies based% Class A Units on total market capitalization, which represents approximately 98% of the20
14.64% investable U.S. equity market.15105 2.39%
Annual compound returns0 -0.30%-5
-10 This table shows the fund’s annual compound returns,-15-20 compared with the Russell 2000 Index.-25 Since
-28.30%-301 year 3 years inception-35
2000 2001 2002 2003 Capital U.S. Small Companies Fund% Class A units % 14.64 -5.59 -5.61Class F Units25
Class F units % 15.70 – -9.27120 15.70%15 Russell 2000 Index % 20.44 1.07 2
101 January 8, 20025
0 2 Class A units 2.55% and Class F units -2.83%-5
-10-15 Distribution policy-20-25-30 -28.58% The fund distributes any income and capital gains in-35
2002* 2003 December of each calendar year.* Jan. 8, 2002 to Dec. 31, 2002
Distributions on units held in Scotia registered plans andCopilot non-registered accounts are always reinvested inadditional units of the fund. Distributions on units held inother registered plans and non-registered accounts arereinvested in additional units of the fund, unless you tellus in writing that you want to receive cash distributionsby cheque or by deposit to your bank account.
140
CA
PIT
AL
U.S
. S
MA
LL
CO
MP
AN
IES
FU
ND
EQ
UIT
Y F
UN
DS

Financial highlights, Class A units Fund expenses indirectly borne by investorsat December 31
This example shows the fund’s expenses on a $1,000Distributions and net asset value per unitinvestment with a 5% annual return.
1999 20001 2001 2002 2003Fees and expensesDistributionspayable over 1 year 3 years 5 years 10 years
from net income $ – – – – –Class A units $ 27.16 85.63 150.09 341.65
from realized gain $ – – – – –Class F units $ 16.30 51.38 90.05 204.99
return of capital $ – – – – –
Total annual distributions $ – – – – –
Net asset value per unit $ – 9.57 9.80 7.03 8.05
Ratios and supplemental data
1999 20001 2001 2002 2003
Net assets (000’s) $ – 4,577 5,393 4,281 5,010
Number of unitsoutstanding (000’s) – 478 550 609 622
MER2 % – 2.31 2.60 2.65 2.65
Portfolio turnoverrate % – – 12.23 7.89 4.791 These figures are for the period from November 30, 2000 to Decem-
ber 31, 2000.2 We may from time to time absorb some of the operating expenses that
the fund would otherwise pay. In 2003, the management expense ratioof the fund would have been 3.35% had we not absorbed some ofthese expenses.
Financial highlights, Class F unitsat December 31
Distributions and net asset value per unit
1999 2000 2001 20023 2003
Distributions
from net income $ – – – – –
from realized gain $ – – – – –
return of capital $ – – – – –
Total annual distributions $ – – – – –
Net asset value per unit $ – – – 7.12 8.24
Ratios and supplemental data
1999 2000 2001 20023 2003
Net assets (000’s) $ – – – 15 4
Number of unitsoutstanding (000’s) – – – 2 1
MER4 % – – – 1.43 1.59
Portfolio turnoverrate % – – – 7.89 4.793 These figures are for the period from January 8, 2002 to December 31,
2002.4 We may from time to time absorb some of the operating expenses that
the fund would otherwise pay. In 2003, the management expense ratioof the fund would have been 5.61% had we not absorbed some ofthese expenses.
141
CA
PIT
AL
U.S
. S
MA
LL
CO
MP
AN
IES
FU
ND
EQ
UIT
Y F
UN
DS

Capital U.S. Small Companies RSP FundFund details its positions in the forward contracts. The fund will only
use derivatives as permitted by securities regulations.Fund type U.S. small and mid-capitalizationequity fund You’ll find more information in About the RSP Funds on
Date established December 15, 2000 page 2.Type of securities Class A and Class F units of a mutual
fund trust The fund may enter into repurchase transactions, reverseEligible for Yes. Units of the fund are not foreign repurchase transactions and securities lending agreementsregistered plans? property.
to seek enhanced returns, but will only do so if there arePortfolio advisor Capital International Asset
suitable counterparties available, if the transactions areManagement (Canada), Inc.
considered appropriate and after first giving itsunitholders 60 days’ prior written notice. You’ll find moreWhat does the fund invest in?information about repurchase, reverse repurchase and
Investment objectivessecurities lending transactions on page 3.
The fund’s objective is long-term growth of capitalthrough exposure to equity securities of smaller and Top 10 holdings at September 30, 2004medium-sized U.S. issuers and securities whose principal
The following are the top 10 holdings of Capitalmarkets are in the U.S. (including ADRs and otherInternational-U.S. Small Cap, the underlying fund:U.S. registered foreign securities), while maintaining 100%
eligibility for registered plans. The fund currently usesMethanex Corp. 2.3%derivatives that are linked to the performance of CapitalCymer, Inc. 1.7%International-U.S. Small Cap. It also invests directly inBeazer Homes USA, Inc. 1.6%Class I units of Capital International-U.S. Small Cap.W.R. Berkley Corp. 1.6%
Any change to the fundamental investment objectives SL Green Realty Corp. 1.4%must be approved by a majority of votes cast at a meeting CMS Energy Corp. 1.3%of unitholders called for that purpose. You generally won’t
AptarGroup, Inc. 1.3%have ownership or other rights on units of the underlying
Furniture Brands International, Inc. 1.3%fund. However, if unitholders of the underlying fund are
AmeriCredit Corp. 1.3%asked to vote on an issue, you can direct how you wouldBOK Financial Corp. 1.3%like your proportionate share of the units of the
underlying fund held directly by the fund to be voted.The information contained in this list may change due toongoing portfolio transactions of the underlying fund. CurrentInvestment strategiesholdings may be found at www.capitalinternationalfunds.ca.
This is an RSP Fund. It aims to track the performance ofYou can get a copy of the simplified prospectus of theCapital International-U.S. Small Cap as closely as possibleunderlying fund by calling us at 1-800-268-9269by:(416-750-3863 in Toronto) for English, or 1-800-387-5004
) investing in Class I units of Capital International- for French, by asking your mutual fund representative, orU.S. Small Cap up to the foreign content limit at www.sedar.com.
) using forward contracts that are linked to the perform-ance of Capital International-U.S. Small Cap. The fund What are the risks of investing in the fund?enters into the forward contracts with a counterparty,
This fund indirectly has the same risks as Capitalwhich is usually a large financial institution.International-U.S. Small Cap:
The fund may place the balance of its assets on deposit) equity risk
with a Canadian financial institution or may invest in) foreign investment riskCanadian money market instruments. This allows the fund
to maintain 100% registered plan eligibility and to cover ) small company risk
142
CA
PIT
AL
U.S
. S
MA
LL
CO
MP
AN
IES
RS
P F
UN
DE
QU
ITY
FU
ND
S

Year-by-year returns) currency risk
) liquidity risk This chart shows the fund’s annual performance, whichchanges from year to year.) derivative risk% Class A Units) repurchase and reverse repurchase transaction risk 20
13.15%15) securities lending risk 10
3.86%5) underlying fund risk. 0
-5 -3.60%-10The fund also has RSP Fund risk and class risk.-15-20
You’ll find details about each risk starting on page 164. -25-28.02%-30
-352000 2001 2002 2003Who should invest in this fund?
This fund may be suitable for you if: Overall past performance
) you hold your units in a registered plan other than an This chart shows how a $10,000 investment in the fundRESP and your plan holds the maximum allowable would have changed in value, compared with the Russellamount of foreign property 2000 Index.
) you want the growth potential of having exposure toequity securities of smaller and medium-sized U.S.companies
) you’re investing for at least five years
) you can accept higher risk.
If you’re investing through a non-registered account orRESP or your registered plan holds less than themaximum allowable amount of foreign property, youshould invest in the Capital U.S. Small Companies Funddirectly because you’ll usually get a better return. The
Dec.2000
Dec.2001
Dec.2002
Dec.2003
$
Dec. 152000
Capital U.S. Small Companies RSP Fund
Russell 2000 Index
0
5,000
10,000
15,000
20,000
$8,151
$10,795
Class A Units
fund’s distributions are primarily considered income,The Russell 2000 Index measures the performance of the 2,000 smallest
which is taxed at a higher rate than capital gains when companies in the Russell 3000 Index, which represents approximately 8% ofthe total market capitalization of the Russell 3000 Index. The Russell 3000received outside of a registered plan. This income isIndex measures the performance of the 3,000 largest U.S. companies based
generally realized more frequently than capital gains on total market capitalization, which represents approximately 98% of theinvestable U.S. equity market.realized by the Capital U.S. Small Companies Fund.
Annual compound returnsPast performance at December 31
This table shows the fund’s annual compound returns,This section shows how the fund has performed in thecompared with the Russell 2000 Index.past and gives you an idea of the risk involved. These
Sincefigures don’t tell you how the fund will perform in the1 year 3 years Inception
future.Capital U.S. Small Companies RSP Fund
Class A units % 13.15 -5.43 -6.50
Russell 2000 Index % 20.44 1.07 2.55
143
CA
PIT
AL
U.S
. S
MA
LL
CO
MP
AN
IES
RS
P F
UN
DE
QU
ITY
FU
ND
S

Distribution policy
The fund distributes any income and capital gains inDecember of each calendar year.
Distributions on units held in Scotia registered plans andCopilot non-registered accounts are always reinvested inadditional units of the fund. Distributions on units held inother registered plans and non-registered accounts arereinvested in additional units of the fund, unless you tellus in writing that you want to receive cash distributionsby cheque or by deposit to your bank account.
Financial highlights, Class A unitsat December 31
Distributions and net asset value per unit
1999 20001 2001 2002 2003
Distributions
from net income $ – – – – –
from realized gain $ – – – – –
return of capital $ – – – – –
Total annual distributions $ – – – – –
Net asset value per unit $ – 9.61 9.98 7.19 8.13
Ratios and supplemental data
1999 20001 2001 2002 2003
Net assets (000’s) $ – 148 708 1,063 1,271
Number of unitsoutstanding (000’s) – 15 71 148 156
MER2 % – 2.46 2.95 2.97 2.94
Portfolio turnoverrate % – – 43.02 41.85 27.661 These figures are for the period from November 30, 2000 to
December 31, 2000.2 We may from time to time absorb some of the operating expenses that
the fund would otherwise pay. In 2003, the management expense ratioof the fund would have been 6.82% had we not absorbed some ofthese expenses.
Fund expenses indirectly borne by investors
This example shows the fund’s expenses on a $1,000investment with a 5% annual return.
Fees and expensespayable over 1 year 3 years 5 years 10 years
Class A units $ 30.14 95.00 166.52 379.04
144
CA
PIT
AL
U.S
. S
MA
LL
CO
MP
AN
IES
RS
P F
UN
DE
QU
ITY
FU
ND
S

Capital International Large Companies FundFund details suitable counterparties available, if the transactions are
considered appropriate and after first giving itsFund type International equity fund
unitholders 60 days’ prior written notice. You’ll find moreDate established December 15, 2000
information about repurchase, reverse repurchase andType of securities Class A and Class F units of a mutualfund trust securities lending transactions on page 3.
Eligible for Yes. Units of the fund are foreignregistered plans? property. Top 10 holdings at September 30, 2004Portfolio advisor Capital International Asset
Management (Canada), Inc. The following are the top 10 holdings of CapitalInternational-International Equity, the underlying fund:
What does the fund invest in?Vodafone Group PLC 3.8%
Investment objectivesSanofi-Aventis 2.8%
AstraZeneca PLC 2.7%The fund’s objective is to achieve long-term growth ofcapital through exposure to securities of large capitaliza- Royal Dutch Petroleum Co. 2.5%
tion issuers located outside North America by investing its Novartis AG 2.1%
assets in Class I units of Capital International-Interna- BNP Paribas 1.7%tional Equity. Sumitomo Mitsui Financial Group, Inc. 1.6%
Royal Bank of Scotland Group PLC 1.4%Any change to the fundamental investment objectivesBanco Bilbao Vizcaya Argentaria, SA 1.4%must be approved by a majority of votes cast at a meetingSamsung Electronics Co., Ltd. 1.4%of unitholders called for that purpose.
Investment strategies The information contained in this list may change due toongoing portfolio transactions of the underlying fund. Current
The fund has exposure to common stocks and ordinary holdings may be found at www.capitalinternationalfunds.ca.and preference shares (or securities convertible orexchangeable into such securities) of companies with You can get a copy of the simplified prospectus of themarket capitalization greater than Cdn $2.25 billion at the underlying fund by calling us at 1-800-268-9269time of purchase. (416-750-3863 in Toronto) for English, or 1-800-387-5004
for French, by asking your mutual fund representative, orThe fund will have exposure to cash, cash equivalents and at www.sedar.com.debt securities when prevailing market and economicconditions indicate that it is desirable to do so.
What are the risks of investing in the fund?
While the assets of the fund can be exposed to This fund indirectly has the same risks as Capitalinvestments around the world, the emphasis will be on International-International Equity:securities of companies located in Europe, Australia and
) equity riskthe Far East, giving due consideration to economic, socialand political developments, currency risks and the liquid- ) foreign investment riskity of various national markets. ) emerging markets risk
The fund may from time to time be exposed to ) currency riskinvestments in forward currency contracts to manage risk ) derivative riskand implement investment strategies in a more efficient
) repurchase and reverse repurchase transaction riskmanner.) securities lending risk
The fund may enter into repurchase transactions, reverse) class riskrepurchase transactions and securities lending agreements) underlying fund risk.to seek enhanced returns, but will only do so if there are
145
CA
PIT
AL
IN
TE
RN
AT
ION
AL
LA
RG
E C
OM
PA
NIE
S F
UN
DE
QU
ITY
FU
ND
S

Overall past performanceYou’ll find details about each risk starting on page 164.
This chart shows how a $10,000 investment in the fundWho should invest in this fund? would have changed in value, compared with the Morgan
Stanley Capital International (MSCI) Europe AustralasiaThis fund may be suitable for you if:and Far East (EAFE) Index.
) you want the growth potential of having exposure toequity securities of large foreign companies
) you’re investing for at least three years
) you can accept higher risk.
Past performance at December 31
This section shows how the fund performed in the pastand gives you an idea of the risk involved. These figuresdon’t tell you how the fund will perform in the future.
Year-by-year returns
These charts show the fund’s annual performance, whichchanges from year to year.
Dec.2000
Dec.2001
Dec.2002
Dec.2003
$
Dec. 152000
Capital International Large Companies Fund
MSCI EAFE Index
(a) MSCI EAFE Index
(b) Capital International Large Companies Fund
0
5,000
10,000
15,000
$8,068
$9,499(a)
$9,092(b)
$7,128
Class A Units
Class F Units
% The MSCI EAFE Index measures the performance of 60% of the companiesClass A Units15 listed in 20 countries in the region. Companies are weighted by their market
9.57% capitalization.10
5 Annual compound returns0
-1.90%-5 This table shows the fund’s annual compound returns,
-10 compared with the MSCI EAFE Index.-15 Since
-18.14% 1 year 3 years inception-20 -19.01%
-25 Capital International Large2000 2001 2002 2003
Companies Fund% Class A units % 9.57 -10.11 -10.54Class F Units15
10.82% Class F units % 10.82 – -3.051
10MSCI EAFE Index % 13.35 -7.66 2
50.10% 1 November 13, 20010 2 Class A units -6.81% and Class F units -2.36%
-5
-10Distribution policy-15
-18.04%-20The fund distributes any income and capital gains in
-252001* 2002 2003 December of each calendar year.
* Nov. 13, 2001 to Dec. 31, 2001
Distributions on units held in Scotia registered plans andCopilot non-registered accounts are always reinvested inadditional units of the fund. Distributions on units held inother registered plans and non-registered accounts arereinvested in additional units of the fund, unless you tellus in writing that you want to receive cash distributionsby cheque or by deposit to your bank account.
146
CA
PIT
AL
IN
TE
RN
AT
ION
AL
LA
RG
E C
OM
PA
NIE
S F
UN
DE
QU
ITY
FU
ND
S

Financial highlights, Class A units Fund expenses indirectly borne by investorsat December 31
This example shows the fund’s expenses on a $1,000Distributions and net asset value per unitinvestment with a 5% annual return.
1999 20001 2001 2002 2003Fees and expensesDistributionspayable over 1 year 3 years 5 years 10 years
from net income $ – – – – –Class A units $ 27.27 85.95 150.66 342.94
from realized gain $ – – – – –Class F units $ 15.17 47.82 83.82 190.81
return of capital $ – – – – –
Total annual distributions $ – – – – –
Net asset value per unit $ – 9.48 7.76 6.29 6.89
Ratios and supplemental data
1999 20001 2001 2002 2003
Net assets (000’s) $ – 7,600 35,047 52,265 58,341
Number of unitsoutstanding (000’s) – 801 4,515 8,313 8,469
MER2 % – 2.15 2.64 2.66 2.66
Portfolio turnover rate % – – 2.47 11.36 9.891 These figures are for the period from November 30, 2000 to Decem-
ber 31, 2000.2 We may from time to time absorb some of the operating expenses that
the fund would otherwise pay. In 2003, the management expense ratioof the fund would have been 2.97% had we not absorbed some ofthese expenses.
Financial highlights, Class F units at December 31
Distributions and net asset value per unit
1999 2000 20013 2002 2003
Distributions
from net income $ – – – – –
from realized gain $ – – – – –
return of capital $ – – – – –
Total annual distributions $ – – – – –
Net asset value per unit $ – – 7.77 6.37 7.06
Ratios and supplemental data
1999 2000 20013 2002 2003
Net assets (000’s) $ – – 42 88 19
Number of unitsoutstanding (000’s) – – 5 14 3
MER4 % – – 1.23 1.59 1.48
Portfolio turnover rate % – – 2.47 11.36 9.893 These figures are for the period from November 13, 2001 to
December 31, 2001.4 We may from time to time absorb some of the operating expenses that
the fund would otherwise pay. In 2003, the management expense ratioof the fund would have been 2.27% had we not absorbed some ofthese expenses.
147
CA
PIT
AL
IN
TE
RN
AT
ION
AL
LA
RG
E C
OM
PA
NIE
S F
UN
DE
QU
ITY
FU
ND
S

Capital International Large Companies RSP FundFund details The fund may enter into repurchase transactions, reverse
repurchase transactions and securities lending agreementsFund type International equity fund
to seek enhanced returns, but will only do so if there areDate established December 15, 2000
suitable counterparties available, if the transactions areType of securities Class A and Class F units of a mutualfund trust considered appropriate and after first giving its
Eligible for Yes. Units of the fund are not foreign unitholders 60 days’ prior written notice. You’ll find moreregistered plans? property. information about repurchase, reverse repurchase andPortfolio advisor Capital International Asset securities lending transactions on page 3.Management (Canada), Inc.
Top 10 holdings at September 30, 2004What does the fund invest in?
The following are the top 10 holdings of CapitalInvestment objectives International-International Equity, the underlying fund:The fund’s objective is long-term growth of capital
Vodafone Group PLC 3.8%through exposure to securities of large capitalizationSanofi-Aventis 2.8%issuers located outside North America, while maintainingAstraZeneca PLC 2.7%100% eligibility for registered plans. The fund currently
uses derivatives that are linked to the performance of Royal Dutch Petroleum Co. 2.5%
Capital International-International Equity. It also invests Novartis AG 2.1%
directly in Class I units of Capital International-Interna- BNP Paribas 1.7%tional Equity. Sumitomo Mitsui Financial Group, Inc. 1.6%
Royal Bank of Scotland Group PLC 1.4%Any change to the fundamental investment objectivesBanco Bilbao Vizcaya Argentaria, SA 1.4%must be approved by a majority of votes cast at a meetingSamsung Electronics Co., Ltd. 1.4%of unitholders called for that purpose.
Investment strategies The information contained in this list may change due toongoing portfolio transactions of the underlying fund. Current
This is an RSP Fund. It aims to track the performance of holdings may be found at www.capitalinternationalfunds.ca.Capital International-International Equity as closely aspossible by: You can get a copy of the simplified prospectus of the
underlying fund by calling us at 1-800-268-9269) investing in Class I units of Capital International-(416-750-3863 in Toronto) for English, or 1-800-387-5004International Equity up to the foreign content limitfor French, by asking your mutual fund representative, or
) using forward contracts that are linked to the perform- at www.sedar.com.ance of Capital International-International Equity. Thefund enters into the forward contracts with a
What are the risks of investing in the fund?counterparty, which is usually a large financialinstitution. This fund indirectly has the same risks as Capital
International-International Equity:The fund may place the balance of its assets on depositwith a Canadian financial institution or may invest in ) equity riskCanadian money market instruments. This allows the fund ) foreign investment riskto maintain 100% registered plan eligibility and to cover
) emerging markets riskits positions in the forward contracts. The fund will only) currency riskuse derivatives as permitted by securities regulations.
You’ll find more information in About the RSP Funds on ) derivative riskpage 2.
) repurchase and reverse repurchase transaction risk
148
CA
PIT
AL
IN
TE
RN
AT
ION
AL
LA
RG
E C
OM
PA
NIE
S R
SP
FU
ND
EQ
UIT
Y F
UN
DS

Year-by-year returns) securities lending risk
) class risk These charts show the fund’s annual performance, whichchanges from year to year.) underlying fund risk.% Class A Units15The fund also has RSP Fund risk.
9.08%10
You’ll find details about each risk starting on page 164. 5
0
-5 -5.00%Who should invest in this fund?-10
-15This fund may be suitable for you if:-17.51%-20 -19.19%
) you hold your units in a registered plan other than an-25
2000 2001 2002 2003RESP and your plan holds the maximum allowable%amount of foreign property Class F Units15
10.24%) you want the growth potential of having exposure to 10
5equity securities of large foreign companies0
) you’re investing for at least three years -5
-10) you can accept higher risk.-12.80%-15
-17.30%If you’re investing through a non-registered account or -20
-25RESP or your registered plan holds less than the 2001* 2002 2003* May 16, 2001 to Dec. 31, 2001maximum allowable amount of foreign property, you
should invest in the Capital International Large Compa-Overall past performancenies Fund directly because you’ll usually get a better
return. The fund’s distributions are primarily considered This chart shows how a $10,000 investment in the fundincome, which is taxed at a higher rate than capital gains would have changed in value, compared with the Morganwhen received outside of a registered plan. This income is Stanley Capital International (MSCI) Europe Australasiagenerally realized more frequently than capital gains and Far East (EAFE) Index.realized by the Capital International Large CompaniesFund.
Past performance at December 31
This section shows how the fund has performed in thepast and gives you an idea of the risk involved. Thesefigures don’t tell you how the fund will perform in thefuture.
Dec.2000
$
Dec. 152000
Capital International Large Companies RSP Fund
MSCI EAFE Index
Dec.2001
Dec.2002
Dec.2003
0
10,000
20,000
30,000
$8,068
$7,953(b)
$6,906
$8,376(a)
Class F Units
Class A Units
(b) Capital International Large Companies RSP Fund
(a) MSCI EAFE Index
The MSCI EAFE Index measures the performance of 60% of the companieslisted in 20 countries in the region. Companies are weighted by their marketcapitalization.
149
CA
PIT
AL
IN
TE
RN
AT
ION
AL
LA
RG
E C
OM
PA
NIE
S R
SP
FU
ND
EQ
UIT
Y F
UN
DS

Annual compound returns Financial highlights, Class F unitsat December 31
This table shows the fund’s annual compound returns,Distributions and net asset value per unit
compared with the MSCI EAFE Index.1999 2000 20013 2002 2003
Since Distributions1 year 3 years inception
from net income $ – – – – –Capital International Large
from realized gain $ – – – – –Companies RSP Fundreturn of capital $ – – – – –
Class A units % 9.08 -10.08 -11.46Total annual distributions $ – – – – –
Class F units % 10.24 – -8.361
Net asset value per unit $ – – 7.87 6.46 7.09MSCI EAFE Index % 13.35 -7.66 2
1 May 16, 20012 Class A units -6.81% and Class F units -6.53% Ratios and supplemental data
1999 2000 20013 2002 2003Distribution policy Net assets (000’s) $ – – 33 54 55
Number of unitsThe fund distributes any income and capital gains in outstanding (000’s) – – 4 8 8
December of each calendar year. MER4 % – – 1.23 1.92 1.91
Portfolio turnoverDistributions on units held in Scotia registered plans and rate % – – 59.69 22.79 10.60Copilot non-registered accounts are always reinvested in 3 These figures are for the period from May 16, 2001 to December 31,
2001.additional units of the fund. Distributions on units held in4 We may from time to time absorb some of the operating expenses thatother registered plans and non-registered accounts are the fund would otherwise pay. In 2003, the management expense ratio
of the fund would have been 3.25% had we not absorbed some ofreinvested in additional units of the fund, unless you tellthese expenses.us in writing that you want to receive cash distributions
by cheque or by deposit to your bank account.Fund expenses indirectly borne by investors
Financial highlights, Class A units This example shows the fund’s expenses on a $1,000at December 31 investment with a 5% annual return.Distributions and net asset value per unit
Fees and expensespayable over 1 year 3 years 5 years 10 years1999 20001 2001 2002 2003Class A units $ 30.55 96.29 168.78 384.19DistributionsClass F units $ 19.58 61.72 108.18 246.25from net income $ – – – – –
from realized gain $ – – – – –
return of capital $ – – – – –
Total annual distributions $ – – – – –
Net asset value per unit $ – 9.47 7.82 6.32 6.89
Ratios and supplemental data
1999 20001 2001 2002 2003
Net assets (000’s) $ – 154 2,055 27,980 28,111
Number of unitsoutstanding (000’s) – 16 263 4,431 4,081
MER2 % – 2.46 2.96 2.99 2.98
Portfolio turnoverrate % – – 59.69 22.79 10.601 These figures are for the period from November 30, 2000 to
December 31, 2000.2 We may from time to time absorb some of the operating expenses that
the fund would otherwise pay. In 2003, the management expense ratioof the fund would have been 3.27% had we not absorbed some ofthese expenses.
150
CA
PIT
AL
IN
TE
RN
AT
ION
AL
LA
RG
E C
OM
PA
NIE
S R
SP
FU
ND
EQ
UIT
Y F
UN
DS

Capital Global Discovery FundFund details Top 10 holdings at September 30, 2004
Fund type Global equity fund The following are the top 10 holdings of CapitalDate established December 15, 2000 International-Global Discovery, the underlying fund:Type of securities Class A and Class F units of a mutual
fund trustAmerican International Group, Inc. 3.4%
Eligible for Yes. Units of the fund are foreignTime Warner Inc. 2.6%registered plans? property.
Lowe’s Companies, Inc. 2.5%Portfolio advisor Capital International AssetManagement (Canada), Inc. NHN Corp. 2.1%
Perusahaan Perseroan (Persero)
PT Telekomunikasi Indonesia Tbk 2.0%What does the fund invest in?First Data Corp. 2.0%
Investment objectivesIAC/InterActiveCorp. 1.8%
The fund’s objective is to achieve long-term growth of eBay Inc. 1.6%
capital through exposure to stocks of companies in the Wells Fargo & Co. 1.6%
services and information area of the global economy by Applied Materials, Inc. 1.6%investing its assets in Class I units of Capital Interna-
The information contained in this list may change due totional-Global Discovery.ongoing portfolio transactions of the underlying fund. Current
Any change to the fundamental investment objectives holdings may be found at www.capitalinternationalfunds.ca.must be approved by a majority of votes cast at a meeting
You can get a copy of the simplified prospectus of theof unitholders called for that purpose.underlying fund by calling us at 1-800-268-9269(416-750-3863 in Toronto) for English, or 1-800-387-5004Investment strategiesfor French, by asking your mutual fund representative, or
The fund may have exposure to companies outside the at www.sedar.com.services and information area at the time of purchase. Itmay have exposure to securities on a global basis. What are the risks of investing in the fund?Currently, the portfolio advisor expects the majority of the
This fund indirectly has the same risks as Capitalfund’s assets to have U.S. exposure.International-Global Discovery:
The fund will have exposure to cash, cash equivalents and) equity risk
debt securities when prevailing market and economic) foreign investment riskconditions indicate that it is desirable to do so.) emerging markets risk
The fund may from time to time be exposed to) currency riskinvestments in forward currency contracts to manage risk
and implement investment strategies in a more efficient ) liquidity riskmanner. ) derivative risk
The fund may enter into repurchase transactions, reverse ) repurchase and reverse repurchase transaction riskrepurchase transactions and securities lending agreements ) securities lending riskto seek enhanced returns, but will only do so if there are
) class risksuitable counterparties available, if the transactions are) underlying fund risk (as at October 1, 2004, Scotiaconsidered appropriate and after first giving its
Securities Inc., Toronto, Ontario held approximatelyunitholders 60 days’ prior written notice. You’ll find more64.5% of the outstanding units of the fund.)information about repurchase, reverse repurchase and
securities lending transactions on page 3. You’ll find details about each risk starting on page 164.
151
CA
PIT
AL
GL
OB
AL
DIS
CO
VE
RY
FU
ND
EQ
UIT
Y F
UN
DS

Overall past performanceWho should invest in this fund?
This chart shows how a $10,000 investment in the fundThis fund may be suitable for you if:would have changed in value, compared with the Morgan
) you want the growth potential of having exposure toStanley Capital International (MSCI) World Index andequity securities of global information and servicescompared with a blended index of 50% Lipper Multi-CapcompaniesGrowth Funds Index, 25% Russell 2500 Index and 25%
) you’re investing for at least three years MSCI Europe Australasia and Far East (EAFE) Index.) you can accept higher risk.
Past performance at December 31
This section shows how the fund performed in the pastand gives you an idea of the risk involved. These figuresdon’t tell you how the fund will perform in the future.
Year-by-year returns
These charts show the fund’s annual performance, whichchanges from year to year.% Class A Units25
17.70%20151050
-0.60%
Dec.2000
Dec.2001
Dec.2002
Dec.2003
$
Dec. 152000
0
10,000
20,000
$7,851(b)
$7,916(a)
$7,858(c)
$7,673
$7,956
$7,514
Capital Global Discovery Fund
MSCI World Index
Blended Index
(a) Blended Index
(b) MSCI World Index
(c) Capital Global Discovery Fund
Class A Units
Class F Units
-5 -5.12%-10-15 The MSCI World Index is an index of approximately 1,600 companies listed-20 on stock exchanges in the 22 countries that make up the MSCI national-25 indexes.-30 -28.34%
Russell 2500 Index measures the performance of the 2,500 smallest-352000 2001 2002 2003 companies in the Russell 3000 Index, which represents approximately 17%
of the total market capitalization of the Russell 3000 Index. The Russell% Class F Units 3000 Index measures the performance of the 3,000 largest U.S. companies2518.63% based on total market capitalization, which represents approximately 98%20
of the investable U.S. equity market.1510 MSCI EAFE Index measures the performance of 60% of the companies listed5
in 20 countries in the region. Companies are weighted by their market0capitalization.-5
-10 -9.20% The Lipper Multi-Cap Growth Funds Index measures the performance of-15 funds that, by portfolio practice, invest in a variety of market capitalization-20
ranges without concentrating 75% of their equity assets in any one market-25-27.07% capitalization range over an extended period of time. Multi-cap funds-30
typically have between 25% to 75% of their assets invested in companies-352001* 2002 2003 with market capitalizations (on a three-year weighted basis) above 300% of
* May 16, 2001 to Dec. 31, 2001 the dollar-weighted median market capitalization of the middle 1,000securities of the S&P SuperComposite 1500 Index. Multi-cap growth fundstypically have an above-average price-to-earnings ratio, price-to-book ratio,and three-year sales-per-share growth value, compared to the S&PSuperComposite 1500 Index.
152
CA
PIT
AL
GL
OB
AL
DIS
CO
VE
RY
FU
ND
EQ
UIT
Y F
UN
DS

of the fund would have been 3.34% had we not absorbed some ofAnnual compound returnsthese expenses.
This table shows the fund’s annual compound returns,compared with the MSCI World Index and compared with Financial highlights, Class F unitsa blended index of 50% Lipper Multi-Cap Growth Funds at December 31Index, 25% Russell 2500 Index and 25% MSCI EAFE Distributions and net asset value per unitIndex.
1999 2000 20013 2002 2003Since1 year 3 years inception Distributions
Capital Global Discovery Fund from net income $ – – – – –
Class A units % 17.70 -7.16 -7.24 from realized gain $ – – – – –
Class F units % 18.63 – -8.771 return of capital $ – – – – –
MSCI World Index % 8.87 -8.62 2 Total annual distributions $ – – – – –
Blended Index % 13.65 -9.09 3 Net asset value per unit $ – – 9.20 6.71 7.961 May 16, 20012 Class A units -8.34% and Class F units -8.80%3 Class A units -8.97% and Class F units -25.98% Ratios and supplemental data
1999 2000 20013 2002 2003Distribution policy
Net assets (000’s) $ – – 17 12 10
The fund distributes any income and capital gains in Number of unitsoutstanding (000’s) – – 2 2 1December of each calendar year.MER4 % – – 1.28 1.61 1.62
Distributions on units held in Scotia registered plans and Portfolio turnoverrate % – – 2.38 5.86 5.28Copilot non-registered accounts are always reinvested in3 These figures are for the period from May 16, 2001 to December 31,additional units of the fund. Distributions on units held in 2001.
other registered plans and non-registered accounts are 4 We may from time to time absorb some of the operating expenses thatthe fund would otherwise pay. In 2003, the management expense ratioreinvested in additional units of the fund, unless you tellof the fund would have been 6.87% had we not absorbed some of
us in writing that you want to receive cash distributions these expenses.
by cheque or by deposit to your bank account.Fund expenses indirectly borne by investors
Financial highlights, Class A unitsat December 31 This example shows the fund’s expenses on a $1,000Distributions and net asset value per unit investment with a 5% annual return.
1999 20001 2001 2002 2003Fees and expensesDistributionspayable over 1 year 3 years 5 years 10 years
from net income $ – – – – –Class A units $ 27.47 86.60 151.79 345.52
from realized gain $ – – – – –Class F units $ 16.61 52.35 91.75 208.86
return of capital $ – – – – –
Total annual distributions $ – – – – –
Net asset value per unit $ – 9.69 9.19 6.59 7.75
Ratios and supplemental data1999 20001 2001 2002 2003
Net assets (000’s) $ – 4,711 6,107 4,643 5,682
Number of unitsoutstanding (000’s) – 486 664 705 733
MER2 % – 2.36 2.65 2.69 2.68
Portfolio turnoverrate % – – 2.38 5.86 5.281 These figures are for the period from November 30, 2000 to
December 31, 2000.2 We may from time to time absorb some of the operating expenses that
the fund would otherwise pay. In 2003, the management expense ratio
153
CA
PIT
AL
GL
OB
AL
DIS
CO
VE
RY
FU
ND
EQ
UIT
Y F
UN
DS

Capital Global Discovery RSP FundFund details to seek enhanced returns, but will only do so if there are
suitable counterparties available, if the transactions areFund type Global equity fund
considered appropriate and after first giving itsDate established December 15, 2000
Type of securities Class A and Class F units of a mutual unitholders 60 days’ prior written notice. You’ll find morefund trust information about repurchase, reverse repurchase and
Eligible for Yes. Units of the fund are not foreign securities lending transactions on page 3.registered plans? property.
Portfolio advisor Capital International AssetManagement (Canada), Inc. Top 10 holdings at September 30, 2004
The following are the top 10 holdings of CapitalWhat does the fund invest in?International-Global Discovery, the underlying fund:
Investment objectives
American International Group, Inc. 3.4%The fund’s objective is long-term growth of capitalTime Warner Inc. 2.6%through exposure to stocks of companies in the servicesLowe’s Companies, Inc. 2.5%and information area of the global economy, whileNHN Corp. 2.1%maintaining 100% eligibility for registered plans. The fundPerusahaan Perseroan (Persero)currently uses derivatives that are linked to the perform- PT Telekomunikasi Indonesia Tbk 2.0%
ance of Capital International-Global Discovery. It also First Data Corp. 2.0%invests directly in Class I units of Capital International- IAC/InterActiveCorp. 1.8%
Global Discovery. eBay Inc. 1.6%
Wells Fargo & Co. 1.6%Any change to the fundamental investment objectives Applied Materials, Inc. 1.6%must be approved by a majority of votes cast at a meetingof unitholders called for that purpose. The information contained in this list may change due to
ongoing portfolio transactions of the underlying fund. CurrentInvestment strategies holdings may be found at www.capitalinternationalfunds.ca.This is an RSP Fund. It aims to track the performance of You can get a copy of the simplified prospectus of theCapital International-Global Discovery as closely as possi- underlying fund by calling us at 1-800-268-9269ble by: (416-750-3863 in Toronto) for English, or 1-800-387-5004) investing in Class I units of Capital International-Global for French, by asking your mutual fund representative, or
Discovery up to the foreign content limit at www.sedar.com.) using forward contracts that are linked to the perform-
ance of Capital International-Global Discovery. The What are the risks of investing in the fund?fund enters into the forward contracts with a
This fund indirectly has the same risks as Capitalcounterparty, which is usually a large financialInternational-Global Discovery:institution.) equity risk
The fund may place the balance of its assets on deposit) foreign investment riskwith a Canadian financial institution or may invest in
Canadian money market instruments. This allows the fund ) emerging markets riskto maintain 100% registered plan eligibility and to cover ) currency riskits positions in the forward contracts. The fund will only
) liquidity riskuse derivatives as permitted by securities regulations.) derivative riskYou’ll find more information in About the RSP Funds on
page 2. ) repurchase and reverse repurchase transaction risk
) securities lending riskThe fund may enter into repurchase transactions, reverserepurchase transactions and securities lending agreements
154
CA
PIT
AL
GL
OB
AL
DIS
CO
VE
RY
RS
P F
UN
DE
QU
ITY
FU
ND
S

% Class F Units) class risk 2518.04%20
) underlying fund risk. 1510
5The fund also has RSP Fund risk. 0-5
-10You’ll find details about each risk starting on page 164. -15-20-25Who should invest in this fund? -30 -29.20%-35
2002* 2003This fund may be suitable for you if:* Jan. 8, 2002 to Dec. 31, 2002.
) you hold your units in a registered plan other than anRESP and your plan holds the maximum allowable Overall past performanceamount of foreign property
This chart shows how a $10,000 investment in the fund) you want the growth potential of having exposure to would have changed in value, compared with the Morgan
equity securities of global information and services Stanley Capital International (MSCI) World Index andcompanies compared with a blended index of 50% Lipper Multi-Cap
) you’re investing for at least three years Growth Funds Index, 25% Russell 2500 Index and 25%MSCI Europe, Australasia and Far East (EAFE) Index.) you can accept higher risk.
If you’re investing through a non-registered account orRESP or your registered plan holds less than themaximum allowable amount of foreign property, youshould invest in the Capital Global Discovery Funddirectly because you’ll usually get a better return. Thefund’s distributions are primarily considered income,which is taxed at a higher rate than capital gains whenreceived outside of a registered plan. This income isgenerally realized more frequently than capital gainsrealized by the Capital Global Discovery Fund.
Past performance at December 31
This section shows how the fund has performed in thepast and gives you an idea of the risk involved. Thesefigures don’t tell you how the fund will perform in the
Dec.2000
Dec.2001
Dec.2002
Dec.2003
$
Dec. 152000
0
10,000
20,000
$8,596(a)
$8,435(c)
$8,685(b)
$7,722$7,673
$7,514
Capital Global Discovery RSP Fund
MSCI World Index
Blended Index
(a) Blended Index
(b) MSCI World Index
(c) Capital Global Discovery RSP Fund
Class A Units
Class F Units
The MSCI World Index is an index of approximately 1,600 companies listedfuture.on stock exchanges in the 22 countries that make up the MSCI nationalindexes.
Year-by-year returnsRussell 2500 Index measures the performance of the 2,500 smallestcompanies in the Russell 3000 Index, which represents approximately 17%These charts show the fund’s annual performance, whichof the total market capitalization of the Russell 3000 Index. The Russell
changes from year to year. 3000 Index measures the performance of the 3,000 largest U.S. companiesbased on total market capitalization, which represents approximately 98%
% Class A Units of the investable U.S. equity market.30
MSCI EAFE Index measures the performance of 60% of the companies listed17.20%20 in 20 countries in the region. Companies are weighted by their market
capitalization.10
The Lipper Multi-Cap Growth Funds Index measures the performance of0funds that, by portfolio practice, invest in a variety of market capitalization-3.60% -4.38%
-10 ranges without concentrating 75% of their equity assets in any one marketcapitalization range over an extended period of time. Multi-cap funds-20typically have between 25% to 75% of their assets invested in companies
-30 -28.53% with market capitalizations (on a three-year weighted basis) above 300% ofthe dollar-weighted median market capitalization of the middle 1,000-40
2000 2001 2002 2003 securities of the S&P SuperComposite 1500 Index. Multi-cap growth funds
155
CA
PIT
AL
GL
OB
AL
DIS
CO
VE
RY
RS
P F
UN
DE
QU
ITY
FU
ND
S

typically have an above-average price-to-earnings ratio, price-to-book ratio, Ratios and supplemental dataand three-year sales-per-share growth value, compared to the S&PSuperComposite 1500 Index. 1999 20001 2001 2002 2003
Net assets (000’s) $ – 177 1,949 1,598 1,805
Annual compound returns Number of unitsoutstanding (000’s) – 18 212 243 234
This table shows the fund’s annual compound returns, MER2 % – 2.51 2.99 3.01 3.00
compared with the MSCI World Index and compared with a Portfolio turnover rate % – – 5.08 84.10 11.871 These figures are for the period from November 30, 2000 toblended index of 50% Lipper Multi-Cap Growth Funds Index,
December 31, 2000.25% Russell 2500 Index and 25% MSCI EAFE Index.
2 We may from time to time absorb some of the operating expenses thatSince the fund would otherwise pay. In 2003, the management expense ratio
1 year 3 years inception of the fund would have been 5.67% had we not absorbed some ofCapital Global Discovery RSP Fund these expenses.
Class A units % 17.20 -7.13 -8.15
Class F units % 18.04 – -8.251
Financial highlights, Class F unitsMSCI World Index % 8.87 -8.62 2
at December 31Blended Index % 13.65 -9.09 3
Distributions and net asset value per unit1 January 8, 20022 Class A units 8.34% and Class F units -6.88%
1999 2000 2001 20023 20033 Class A units -8.97% and Class F units -7.37%
Distributions
Distribution policy from net income $ – – – – –
from realized gain $ – – – – –The fund distributes any income and capital gains in
return of capital $ – – – – –December of each calendar year. Total annual distributions $ – – – – –
Net asset value per unit $ – – – 6.65 7.85Distributions on units held in Scotia registered plans andCopilot non-registered accounts are always reinvested in
Ratios and supplemental dataadditional units of the fund. Distributions on units held inother registered plans and non-registered accounts are 1999 2000 2001 20023 2003reinvested in additional units of the fund, unless you tell Net assets (000’s) $ – – – 7 8us in writing that you want to receive cash distributions Number of units
outstanding (000’s) – – – 1 1by cheque or by deposit to your bank account.MER4 % – – – 1.92 1.93
Financial highlights, Class A units Portfolio turnover rate % – – – 84.10 11.87
at December 31 3 These figures are for the period from January 8, 2002 to December 31,2002.
Distributions and net asset value per unit4 We may from time to time absorb some of the operating expenses that
the fund would otherwise pay. In 2003, the management expense ratio1999 20001 2001 2002 2003of the fund would have been 9.92% had we not absorbed some of
Distributions these expenses.from net income $ – – – – –
from realized gain $ – – – – –Fund expenses indirectly borne by investors
return of capital $ – – – – –
Total annual distributions $ – – – – – This example shows the fund’s expenses on a $1,000Net asset value per unit $ – 9.62 9.20 6.57 7.70 investment with a 5% annual return.
Fees and expensespayable over 1 year 3 years 5 years 10 years
Class A units $ 30.75 96.94 169.91 386.77
Class F units $ 19.78 62.36 109.31 248.82
156
CA
PIT
AL
GL
OB
AL
DIS
CO
VE
RY
RS
P F
UN
DE
QU
ITY
FU
ND
S

Capital Global Small Companies FundFund details Top 10 holdings at September 30, 2004
Fund type Global small capitalization equity fund The following are the top 10 holdings of CapitalDate established December 15, 2000 International-Global Small Cap, the underlying fund:Type of securities Class A and Class F units of a mutual
fund trustFuji Seal, Inc. 1.5%
Eligible for Yes. Units of the fund are foreignAdvanced Energy Industries, Inc. 1.4%registered plans? property.
Cymer, Inc. 1.4%Portfolio advisor Capital International AssetManagement (Canada), Inc. Veeco Instruments Inc. 1.4%
ADVO, Inc. 1.4%
Pusan Bank 1.4%What does the fund invest in?EXEDY Corp. 1.4%Investment objectivesAker Kvaerner ASA 1.3%
The fund’s objective is to achieve long-term growth of Arbitron Inc. 1.3%capital through exposure to equity securities of companies Tsubaki Nakashima Co., Ltd. 1.3%located around the world with relatively small market
The information contained in this list may change due tocapitalizations of approximately $75 million to $2.25 bil-ongoing portfolio transactions of the underlying fund. Currentlion at the time of investment by investing its assets inholdings may be found at www.capitalinternationalfunds.ca.Class I units of Capital International-Global Small Cap.
You can get a copy of the simplified prospectus of theAny change to the fundamental investment objectivesunderlying fund by calling us at 1-800-268-9269must be approved by a majority of votes cast at a meeting(416-750-3863 in Toronto) for English, or 1-800-387-5004of unitholders called for that purpose.for French, by asking your mutual fund representative, orat www.sedar.com.Investment strategies
At least 65% of the funds’ assets will be exposed to equity What are the risks of investing in the fund?securities of small capitalization issuers, with investments
This fund indirectly has the same risks as Capitaloutside the U.S. in at least three countries.International-Global Small Cap:
Although the fund intends to have exposure to such) equity riskissuers, it may be exposed to cash, cash equivalents and) small company riskdebt securities when prevailing market and economic
conditions indicate that it is desirable to do so. ) foreign investment risk
) emerging markets riskThe fund may from time to time be exposed toinvestments in forward currency contracts in order to ) currency riskmanage risk and implement investment strategies in a
) liquidity riskmore efficient manner.
) derivative riskThe fund may enter into repurchase transactions, reverse
) repurchase and reverse repurchase transaction riskrepurchase transactions and securities lending agreements
) securities lending riskto seek enhanced returns, but will only do so if there aresuitable counterparties available, if the transactions are ) class riskconsidered appropriate and after first giving its ) underlying fund risk (as at October 1, 2004, Scotiaunitholders 60 days’ prior written notice. You’ll find more Securities Inc., Toronto, Ontario held approximatelyinformation about repurchase, reverse repurchase and 89.0% of the outstanding units of the fund.)securities lending transactions on page 3.
You’ll find details about each risk starting on page 164.
157
CA
PIT
AL
GL
OB
AL
SM
AL
L C
OM
PA
NIE
S F
UN
DE
QU
ITY
FU
ND
S
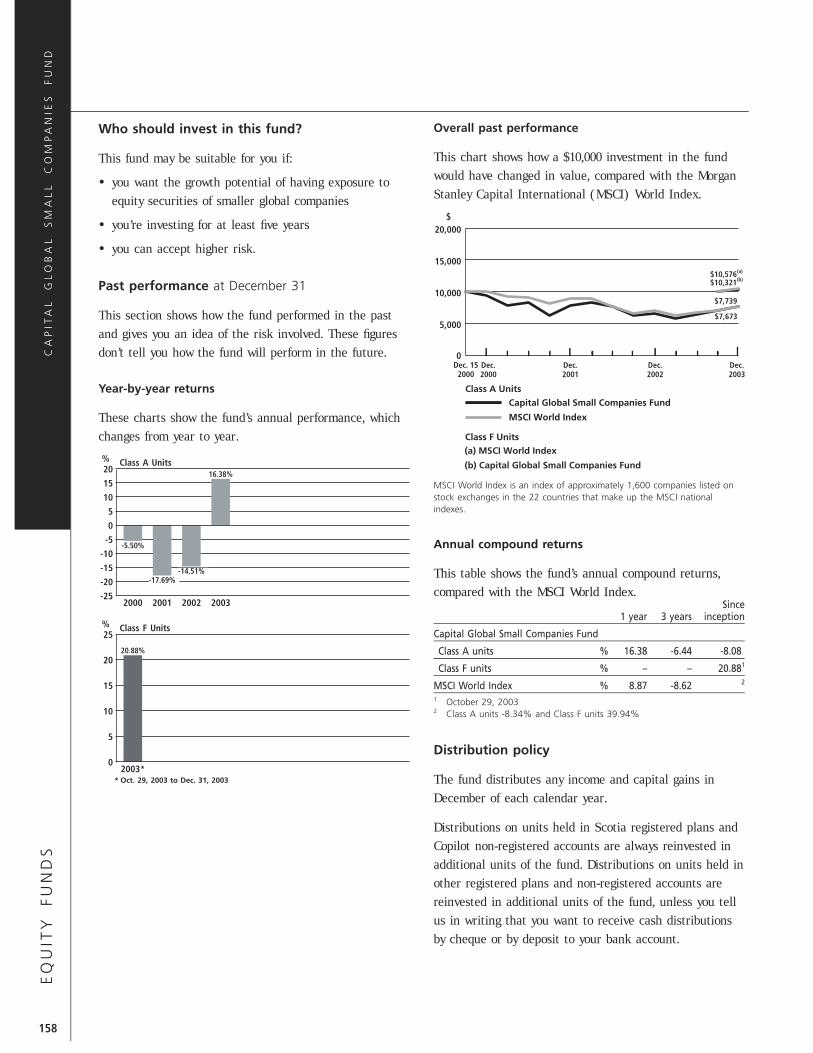
Overall past performanceWho should invest in this fund?
This chart shows how a $10,000 investment in the fundThis fund may be suitable for you if:would have changed in value, compared with the Morgan
) you want the growth potential of having exposure toStanley Capital International (MSCI) World Index.equity securities of smaller global companies
) you’re investing for at least five years
) you can accept higher risk.
Past performance at December 31
This section shows how the fund performed in the pastand gives you an idea of the risk involved. These figuresdon’t tell you how the fund will perform in the future.
Year-by-year returns
These charts show the fund’s annual performance, whichchanges from year to year.% Class A Units
Dec.2000
Dec.2001
Dec.2002
Dec.2003
$
Dec. 152000
Capital Global Small Companies Fund
MSCI World Index
0
5,000
10,000
15,000
20,000
$7,739
$10,576(a)
$10,321(b)
$7,673
Class A Units
Class F Units(a) MSCI World Index
(b) Capital Global Small Companies Fund20 16.38%15 MSCI World Index is an index of approximately 1,600 companies listed on
stock exchanges in the 22 countries that make up the MSCI national10indexes.5
0
-5-5.50% Annual compound returns
-10
-15 -14.51% This table shows the fund’s annual compound returns,-17.69%-20
compared with the MSCI World Index.-252000 2001 2002 2003 Since
1 year 3 years inception% Class F Units Capital Global Small Companies Fund25
20.88% Class A units % 16.38 -6.44 -8.0820
Class F units % – – 20.881
15 MSCI World Index % 8.87 -8.62 2
1 October 29, 200310 2 Class A units -8.34% and Class F units 39.94%
5
Distribution policy0
2003** Oct. 29, 2003 to Dec. 31, 2003 The fund distributes any income and capital gains in
December of each calendar year.
Distributions on units held in Scotia registered plans andCopilot non-registered accounts are always reinvested inadditional units of the fund. Distributions on units held inother registered plans and non-registered accounts arereinvested in additional units of the fund, unless you tellus in writing that you want to receive cash distributionsby cheque or by deposit to your bank account.
158
CA
PIT
AL
GL
OB
AL
SM
AL
L C
OM
PA
NIE
S F
UN
DE
QU
ITY
FU
ND
S

Financial highlights, Class A units Fund expenses indirectly borne by investorsat December 31
This example shows the fund’s expenses on a $1,000Distributions and net asset value per unitinvestment with a 5% annual return.
1999 20001 2001 2002 2003Fees and expensesDistributionspayable over 1 year 3 years 5 years 10 years
from net income $ – – – – –Class A units $ 29.32 92.42 161.98 368.72
from realized gain $ – – – – –Class F units $ 18.14 57.19 100.25 228.20
return of capital $ – – – – –
Total annual distributions $ – – – – –
Net asset value per unit $ – 9.15 7.53 6.44 7.49
Ratios and supplemental data
1999 20001 2001 2002 2003
Net assets (000’s) $ – 7,199 6,269 5,534 6,536
Number of unitsoutstanding (000’s) – 787 833 860 872
MER2 % – 2.52 2.81 2.86 2.86
Portfolio turnover rate % – – 2.57 4.16 3.091 These figures are for the period from November 30, 2000 to
December 31, 2000.2 We may from time to time absorb some of the operating expenses that
the fund would otherwise pay. In 2003, the management expense ratioof the fund would have been 3.32% had we not absorbed some ofthese expenses.
Financial highlights, Class F units at December 31
Distributions and net asset value per unit
1999 2000 2001 2002 20033
Distributions
from net income $ – – – – –
from realized gain $ – – – – –
return of capital $ – – – – –
Total annual distributions $ – – – – –
Net asset value per unit $ – – – – 7.50
Ratios and supplemental data
1999 2000 2001 2002 20033
Net assets (000’s) $ – – – – 6
Number of unitsoutstanding (000’s) – – – – 1
MER4 % – – – – 1.77
Portfolio turnover rate % – – – – 3.093 These figures are for the period from October 29, 2003 to December 31,
2003.4 We may from time to time absorb some of the operating expenses that
the fund would otherwise pay. In 2003, the management expense ratioof the fund would have been 7.55% had we not absorbed some ofthese expenses.
159
CA
PIT
AL
GL
OB
AL
SM
AL
L C
OM
PA
NIE
S F
UN
DE
QU
ITY
FU
ND
S

Capital Global Small Companies RSP FundFund details The fund may enter into repurchase transactions, reverse
repurchase transactions and securities lending agreementsFund type Global small capitalization equity fund
to seek enhanced returns, but will only do so if there areDate established December 15, 2000
suitable counterparties available, if the transactions areType of securities Class A and Class F units of a mutualfund trust considered appropriate and after first giving its
Eligible for Yes. Units of the fund are not foreign unitholders 60 days’ prior written notice. You’ll find moreregistered plans? property. information about repurchase, reverse repurchase andPortfolio advisor Capital International Asset securities lending transactions on page 3.Management (Canada), Inc.
Top 10 holdings at September 30, 2004What does the fund invest in?
The following are the top 10 holdings of CapitalInvestment objectives International-Global Small Cap, the underlying fund:The fund’s objective is long-term growth of capital
Fuji Seal, Inc. 1.5%through exposure to equity securities of companies Advanced Energy Industries, Inc. 1.4%located around the world with relatively small market Cymer, Inc. 1.4%capitalizations of approximately $75 million to $2.25 bil- Veeco Instruments Inc. 1.4%lion at the time of investment, while maintaining 100% ADVO, Inc. 1.4%
eligibility for registered plans. The fund currently uses Pusan Bank 1.4%
EXEDY Corp. 1.4%derivatives that are linked to the performance of CapitalAker Kvaerner ASA 1.3%International-Global Small Cap. It also invests directly inArbitron Inc. 1.3%Class I units of Capital International-Global Small Cap.Tsubaki Nakashima Co., Ltd. 1.3%
Any change to the fundamental investment objectivesmust be approved by a majority of votes cast at a meeting The information contained in this list may change due toof unitholders called for that purpose. ongoing portfolio transactions of the underlying fund. Current
holdings may be found at www.capitalinternationalfunds.ca.Investment strategies
You can get a copy of the simplified prospectus of theThis is an RSP Fund. It aims to track the performance of underlying fund by calling us at 1-800-268-9269Capital International-Global Small Cap as closely as (416-750-3863 in Toronto) for English, or 1-800-387-5004possible by: for French, by asking your mutual fund representative, or) investing in Class I units of Capital International-Global at www.sedar.com.
Small Cap up to the foreign content limit
) using forward contracts that are linked to the perform- What are the risks of investing in the fund?ance of Capital International-Global Small Cap. The
This fund indirectly has the same risks as Capitalfund enters into the forward contracts with aInternational-Global Small Cap:counterparty, which is usually a large financial) equity riskinstitution.) small company riskThe fund may place the balance of its assets on deposit) foreign investment riskwith a Canadian financial institution or may invest in
Canadian money market instruments. This allows the fund ) emerging markets riskto maintain 100% registered plan eligibility and to cover
) currency riskits positions in the forward contracts. The fund will only
) liquidity riskuse derivatives as permitted by securities regulations.You’ll find more information in About the RSP Funds on ) derivative riskpage 2. ) repurchase and reverse repurchase transaction risk
160
CA
PIT
AL
GL
OB
AL
SM
AL
L C
OM
PA
NIE
S R
SP
FU
ND
EQ
UIT
Y F
UN
DS

Year-by-year returns) securities lending risk
) class risk This chart shows the fund’s annual performance, whichchanges from year to year.) underlying fund risk (as at October 1, 2004, Scotia%Securities Inc., Toronto, Ontario held approximately Class A Units20
16.0% of the outstanding units of the fund.) 14.95%15
10The fund also has RSP Fund risk.5
0You’ll find details about each risk starting on page 164.-5
-10 -8.90%Who should invest in this fund?
-15 -14.83%-16.45%
-20This fund may be suitable for you if: 2000 2001 2002 2003
) you hold your units in a registered plan other than anOverall past performanceRESP and your plan holds the maximum allowable
amount of foreign property This chart shows how a $10,000 investment in the fundwould have changed in value, compared with the Morgan) you want the growth potential of having exposure toStanley Capital International (MSCI) World Index.equity securities of smaller global companies
) you’re investing for at least five years
) you can accept higher risk.
If you’re investing through a non-registered account orRESP or your registered plan holds less than themaximum allowable amount of foreign property, youshould invest in the Capital Global Small Companies Funddirectly because you’ll usually get a better return. Thefund’s distributions are primarily considered income,which is taxed at a higher rate than capital gains whenreceived outside of a registered plan. This income is
Dec.2000
Dec.2002
Dec.2001
Dec.2003
$
Dec. 152000
Capital Global Small Companies RSP Fund
MSCI World Index
0
5,000
10,000
15,000
20,000
$7,673
$7,453
Class A Units
generally realized more frequently than capital gainsMSCI World Index is an index of approximately 1,600 companies listed onrealized by the Capital Global Small Companies Fund.stock exchanges in the 22 countries that make up the MSCI nationalindexes.
Past performance at December 31Annual compound returns
This section shows how the fund has performed in theThis table shows the fund’s annual compound returns,past and gives you an idea of the risk involved. Thesecompared with the MSCI World Index.figures don’t tell you how the fund will perform in the
Sincefuture. 1 year 3 years inception
Capital Global SmallCompanies RSP Fund
Class A units % 14.95 -6.48 -9.21
MSCI World Index % 8.87 -8.62 -8.34
161
CA
PIT
AL
GL
OB
AL
SM
AL
L C
OM
PA
NIE
S R
SP
FU
ND
EQ
UIT
Y F
UN
DS

Distribution policy
The fund distributes any income and capital gains inDecember of each calendar year.
Distributions on units held in Scotia registered plans andCopilot non-registered accounts are always reinvested inadditional units of the fund. Distributions on units held inother registered plans and non-registered accounts arereinvested in additional units of the fund, unless you tellus in writing that you want to receive cash distributionsby cheque or by deposit to your bank account.
Financial highlights, Class A unitsat December 31
Distributions and net asset value per unit
1999 20001 2001 2002 2003
Distributions
from net income $ – – – – –
from realized gain $ – – – – –
return of capital $ – – – – –
Total annual distributions $ – – – – –
Net asset value per unit $ – 9.09 7.59 6.47 7.43
Ratios and supplemental data
1999 20001 2001 2002 2003
Net assets (000’s) $ – 149 497 500 619
Number of unitsoutstanding (000’s) – 16 65 77 83
MER2 % – 2.68 3.16 3.18 3.16
Portfolio turnoverrate % – – 20.94 49.65 18.401 These figures are for the period from November 30, 2000 to Decem-
ber 31, 2000.2 We may from time to time absorb some of the operating expenses that
the fund would otherwise pay. In 2003, the management expense ratioof the fund would have been 11.49% had we not absorbed some ofthese expenses.
Fund expenses indirectly borne by investors
This example shows the fund’s expenses on a $1,000investment with a 5% annual return.
Fees and expensespayable over 1 year 3 years 5 years 10 years
Class A units $ 32.39 102.11 178.98 407.40
162
CA
PIT
AL
GL
OB
AL
SM
AL
L C
OM
PA
NIE
S R
SP
FU
ND
EQ
UIT
Y F
UN
DS

What is a mutual fund and what are the risks of
investing in a mutual fund?
What are the risks?For many Canadians, mutual funds represent a simple andaffordable way to meet their financial goals. But what exactly While everyone wants to make money when they invest, youis a mutual fund, why invest in them, and what are the risks? could lose money, too. This is known as risk. Like other
investments, mutual funds involve some level of risk. TheWhat is a mutual fund?value of a fund’s securities can change from day to day for
A mutual fund is an investment that pools your money with many reasons, including changes in the economy, interestthe money of many other people. Professional portfolio rates, and market and company news. That means the value ofadvisors use that money to buy securities that they believe will mutual fund units can vary. When you sell your units in ahelp achieve the fund’s investment objectives. These securities fund, you could receive less money than you invested.could be stocks, bonds, mortgages, money market instruments,
The amount of risk depends on the fund’s investmentor a combination of these.objectives and the types of securities it invests in. A general
When you invest in a mutual fund, you receive units of the rule of investing is that the higher the risk, the higher thefund. Each unit represents a proportionate share of all of the potential for gains as well as losses. Cash equivalent fundsmutual fund’s assets. All of the investors in a mutual fund usually offer the least risk because they invest in highly liquid,share in the fund’s income, gains and losses. Investors also pay short-term investments such as treasury bills. Their potentialtheir share of the fund’s expenses. returns are tied to short-term interest rates. Income fundsWhy invest in mutual funds? invest in bonds and other fixed income investments. These
funds typically have higher long-term returns than cashMutual funds offer investors three key benefits: professionalequivalent funds, but they carry more risk because their pricesmoney management, diversification and accessibility.can change when interest rates change. Equity funds expose
) Professional money management. Professional portfolio investors to the highest level of risk because they invest inadvisors have the expertise to make the investment equity securities, such as common shares, whose prices candecisions. They also have access to up-to-the-minute infor- rise and fall significantly in a short period of time.mation on trends in the financial markets, and in-depth
Managing riskdata and research on potential investments.While risk is an important factor to consider when you’re) Diversification. Because your money is pooled with that ofchoosing a mutual fund, you should also think about yourother investors, a mutual fund offers diversification intoinvestment goals and when you’ll need your money. Formany securities that may not have otherwise been availableexample, if you’re saving for a large purchase in the next yearto individual investors.or so, you might consider investing in a fund with low risk. If
) Accessibility. Mutual funds have low investment minimums,you want your retirement savings to grow over the nextmaking them accessible to nearly everyone.20 years, you can probably afford to put more of your money
No guarantees in equity funds.While mutual funds have many benefits, it’s important to A carefully chosen mix of investments can help reduce risk asremember that an investment in a mutual fund isn’t you meet your investment goals. Your mutual fund representa-guaranteed. Unlike bank accounts or guaranteed investment tive can help you build a portfolio that’s suited to your goalscertificates (GICs), mutual fund units aren’t covered by the and risk comfort level. If you don’t have a mutual fundCanada Deposit Insurance Corporation (CDIC) or any other representative, we recommend using the Scotia˛ Investmentgovernment deposit insurer, and your investment in the Scotia Selector tool to determine your goals and personal risk profile.Mutual Funds is not guaranteed by Scotiabank, Montreal Trust It’s available at Scotiabank branches, by calling 1-800-268-9269,or National Trust. or on the Internet at www.scotiabank.com.
Under exceptional circumstances, a mutual fund may suspend If your investment goals or tolerance for risk changes,your right to sell your units. See Suspending your right to remember, you can and should change your investments tobuy, switch and sell units on page 173 for details. match your new situation.
163

Specific risks of mutual funds highest among issuers that have a low credit rating or nocredit rating. Issuers with a low credit rating usually offerThe value of the investments a mutual fund holds can changehigher interest rates to make up for the higher risk. Thefor a number of reasons. You’ll find the specific risks ofbonds of issuers with poor credit ratings generally have yieldsinvesting in each of the Scotia Mutual Funds in the individualthat are higher then bonds of issuers with superior creditfund descriptions starting on page 6. This section tells youratings. Bonds of issuers that have poor credit ratings tend tomore about each risk.be more volatile as there is a greater likelihood of bankruptcy
Asset-backed and mortgage-backed securities risk or default.Asset-backed securities are debt obligations that are backed by
Currency riskpools of consumer or business loans. Mortgage-backed securi-When a mutual fund buys an investment that’s denominated inties are debt obligations backed by pools of mortgages ona foreign currency, changes in the exchange rate between thatcommercial or residential real estate. If there are changes incurrency and the Canadian dollar will affect the value of thethe market perception of the issuers of these types offund.securities, or in the creditworthiness of the parties involved,
then the value of the securities may be affected. In the use of Derivative riskmortgage-backed securities, there is also a risk that there may
Derivatives can be useful for hedging against losses, gainingbe a drop in the interest rates charged on mortgages, aexposure to financial markets and making indirect invest-mortgagor may default on its obligations under a mortgage orments, but they involve certain risks:there may be a drop in the value of the property secured by) Hedging with derivatives may not achieve the intendedthe mortgage.
result. Hedging instruments rely on historical or anticipatedClass risk correlations to predict the impact of certain events, whichSome mutual funds offer two or more classes of units of the may or may not occur. If they occur, they may not have thesame fund. Although the value of each class is calculated predicted effect.separately, there’s a risk that the expenses or liabilities of one
) It’s difficult to hedge against trends that the market hasclass of units may affect the value of the other classes. If one already anticipated.class is unable to cover its liabilities, the other classes are
) Costs relating to entering and maintaining derivativeslegally responsible for covering the difference. We believe thatcontracts may reduce the returns of a fund.this risk is very low.
) A currency hedge will reduce the benefits of gains if theConcentration risk
hedged currency increases in value.Some mutual funds concentrate their investments in a single
) Currency hedging can be difficult in smaller emergingindustry, country or geographic area. This allows them to focusgrowth countries because of the limited size of thoseon the potential of that particular industry, country or area.markets.Other funds, such as index funds, may be permitted to
concentrate more of their assets in one or more securities ) Currency hedging provides no protection against changes inthan is usually permitted for mutual funds. This allows them the value of the underlying securities.to more accurately track the performance of their target
) There’s no guarantee that a liquid exchange or market forindex. Mutual funds that concentrate their investments tend derivatives will exist. This could prevent a fund closing outto have greater fluctuations in price than funds with broader its positions to realize gains or limit losses. At worst, a funddiversification. This is because they invest in fewer securities, might face losses from having to exercise underlying futuresand in the case of industry, country or geographically contracts.restricted funds, those securities may be affected by the same
) The prices of derivatives can be distorted if trading in theirfactors.underlying stocks is halted. Trading in the derivative might
Credit risk be interrupted if trading is halted in a large number of theA fixed income security, such as a bond, is a promise to pay underlying stocks. This would make it difficult for a fund tointerest and repay the principal on the maturity date. There’s close out its positions.always a risk that the issuer will fail to honour that promise. ) The other party in a derivatives contract might not be ableThis is called credit risk. Credit risk is lowest among issuers to meet its obligations.that have a high credit rating from a credit rating agency. It’s
164
) Derivatives trading on foreign markets may take longer and by laws of a province of Canada or of a state of the Unitedbe more difficult to complete. Foreign derivatives are States which limits the liability of the unitholders of thesubject to the foreign investment risks described below. income trust. A mutual fund may invest in income trusts,
including REITs, in Canada or elsewhere that are not governed) Investment dealers and futures brokers may hold a fund’sby similar laws. In such cases, to the extent that claims,assets on deposit as collateral in a derivative contract. As awhether in contract, in tort or as a result of tax or statutoryresult, someone other than the fund’s custodian is responsi-liability against a trust are not satisfied by the trust, holdersble for the safekeeping of that part of the fund’s assets.of units in the trusts, including a fund, could be held liable
Equity risk for such obligations. Income trusts generally seek to make thisFunds that invest in equities, such as common shares, are risk remote in the case of contract by including provisions inaffected by changes in the general economy and financial their agreements that the obligations of the income trust willmarkets, as well as by the success or failure of the companies not be binding on unitholders personally. However, the incomethat issued the securities. When stock markets rise, the value trust would still have exposure to damage claims not arisingof equity securities tends to rise. When stock markets fall, the from contract, such as personal injury and environmentalvalue of equity securities tends to fall. Convertible securities claims.may also be subject to interest rate risk.
Index riskEmerging markets risk Some mutual funds have an investment objective that requiresSome mutual funds may invest in foreign companies or them to duplicate the investment portfolio of a particulargovernments (other than the U.S.) which may be located in, index. Depending on market conditions, one or more of theor operate, in developing countries. Companies in these securities listed in that index may account for more than 10%markets may have limited product lines, markets or resources, of the net assets of the mutual fund. As an index mutual fundmaking it difficult to measure the value of the company. and the index it tracks become less diversified, the indexPolitical instability, possible corruption, as well as lower mutual fund is exposed to greater concentration and liquiditystandards of business regulation increase the risk of fraud and risk and may become more volatile.other legal issues. In addition to foreign investment risk
Interest rate riskdescribed below, these mutual funds may be exposed to
Mutual funds that invest in fixed income securities, such asgreater volatility as a result of such issues.bonds and money market instruments, are sensitive to changes
Foreign investment risk in interest rates. In general, when interest rates are rising, theInvestments issued by foreign companies or governments other value of these investments tends to fall. When rates arethan the U.S. can be riskier than investments in Canada and falling, fixed income securities tend to increase in value. Fixedthe U.S. Foreign countries can be affected by political, social, income securities with longer terms to maturity are generallylegal or diplomatic developments, including the imposition of more sensitive to changes in interest rates. Certain types ofcurrency and exchange controls. Some foreign markets can be fixed income securities permit issuers to repay principal beforeless liquid, are less regulated, and are subject to different the security’s maturity date. There is a risk that an issuer willreporting practices and disclosure requirements than issuers in exercise this prepayment right after interest rates have fallenNorth American markets. It may be more difficult to enforce a and the funds that hold these fixed income securities willfund’s legal rights in jurisdictions outside of Canada. In receive payments of principal before the expected maturitygeneral, securities issued in more developed markets, such as date of the security and may need to reinvest these proceedsWestern Europe, have lower foreign investment risk. Securities in securities that have lower interest rates.issued in emerging or developing markets, such as Southeast
Liquidity riskAsia or Latin America, have significant foreign investment risk
Liquidity is a measure of how quickly an investment can beand are exposed to the emerging markets risks describedsold for cash at a fair market price. If a fund can’t sell anabove.investment quickly, it may lose money or make a lower profit,especially if it has to meet a large number of redemptionIncome trust unit riskrequests. In general, investments in smaller companies,
Some mutual funds invest in real estate, royalty, income and smaller markets or certain sectors of the economy tend to beother investment trusts which are investment vehicles in the less liquid than other types of investments. The less liquid anform of trusts rather than corporations. Many income trusts, investment, the more its value tends to fluctuate.including real estate investment trusts (REITs), are governed
165

Real estate sector risk the RSP Funds. If the fees increase in the future, thereturns of the RSP Funds will be reduced even more.Some funds concentrate their investments in the real estate
sector of the marketplace. These funds are better able to ) If a counterparty doesn’t meet its obligations, the RSP Fundfocus on the real estate sector’s potential, however these funds will need to find another counterparty to replace existingare also riskier than funds with broader diversification. Sector forward contracts or to enter into new ones. If the RSPspecific funds tend to experience greater fluctuations in price Fund can’t find a replacement counterparty, it may have tobecause securities in the same industry tend to be affected by suspend new purchases or it may have to be terminated.the same factors. These funds must continue to follow their
) If changes to the Tax Act prevent the RSP Funds frominvestment objectives by investing in their particular sector using this type of forward contract, the RSP Funds mayeven during periods when the sector is performing poorly. become foreign property, unless an alternative strategyRepurchase and reverse repurchase transaction risk using other derivatives can be used.
Some mutual funds may enter into repurchase or reverse ) A large percentage of the RSP Fund’s assets may be placedrepurchase agreements to generate additional income. When a on deposit with one or more counterparties, which exposemutual fund agrees to sell a security at one price and buy it the RSP Fund to the credit risk of those counterparties.back on a specified later date from the same party with the If an underlying fund suspends redemptions, the RSP Fundexpectation of a profit, it is entering into a repurchase will be unable to value its portfolio and will automaticallyagreement. When a mutual fund agrees to buy a security at suspend the redemption of its units.one price and sell it back on a specified later date to the
For more information about how these RSP Funds usesame party with the expectation of a profit, it is entering intoderivatives, see page 2.a reverse repurchase agreement. Mutual funds engaging in
repurchase and reverse repurchase transactions are exposed to Securities lending riskthe risk that the other party to the transaction may become Some mutual funds may enter into securities lending transac-insolvent and unable to complete the transaction. In those tions to generate additional income from securities held in acircumstances, there is a risk that the value of the securities mutual fund’s portfolio. A mutual fund may lend securitiesbought may drop or the value of the securities sold may rise held in its portfolio to qualified borrowers who providebetween the time the other party becomes insolvent and the adequate collateral. In lending its securities, a mutual fund istime the fund recovers its investment. Mutual funds that exposed to the risk that the borrower may not be able toengage in these transactions reduce this risk by holding, as satisfy its obligations under the securities lending agreementcollateral, enough of the other party’s cash or securities to and the lending mutual fund is forced to take possession ofcover that party’s repurchase or reverse repurchase obligations. the collateral held. Losses could result if the collateral held byTo limit the risks associated with repurchase and reverse the mutual fund is insufficient, at the time the remedy isrepurchase transactions, the collateral held in respect of the exercised, to replace the securities borrowed. Mutual fundsrepurchase or reverse repurchase obligations must be marked must receive collateral worth no less than 102% of the valueto market on each business day and be fully collateralized at of the loaned securities and borrowers must adjust thatall times with acceptable collateral which has a value at least collateral daily to ensure this level is maintained. Prior toequal to 102% of the securities sold or cash paid for the entering into a securities lending agreement, a mutual fundsecurities by the mutual fund. Prior to entering into a must ensure that the aggregate value of the securities loanedrepurchase agreement, a mutual fund must ensure that the together with those that have been sold pursuant to repur-aggregate value of the securities of a mutual fund that have chase transactions, does not exceed 50% of its total assetbeen sold pursuant to repurchase transactions, together with value.any securities loaned, does not exceed 50% of its total asset
Share class riskvalue at the time that the mutual fund enters into thetransaction. Most mutual funds are mutual fund trusts. In certain
circumstances, mutual funds may choose to invest in mutualRSP Fund risk
fund corporations. Many mutual fund corporations haveThe RSP Funds that use forward contracts that are linked to established separate classes of shares. In many cases eachthe performance of underlying funds are subject to certain class of shares represents a separate portfolio of securitiesrisks: which is managed under distinct investment objectives which) Counterparties charge these RSP Funds fees for entering are not shared with other classes of shares of the mutual fund
into the forward contracts. These fees reduce the returns of corporation. The liabilities attributed to each class of shares of
166

a mutual fund corporation are liabilities of the corporation asa whole. If the assets attributed to one class of shares of amutual fund corporation are insufficient, assets attributed toother classes of shares may have to be used to cover thesedebts. Although the portfolios are different, and the value ofeach class of shares is calculated separately, there is a riskthat the expenses or liabilities of one class of shares mayaffect the value of the other classes.
Small company risk
The prices of shares issued by smaller companies tend tofluctuate more than those of larger corporations. Smallercompanies may not have established markets for theirproducts and may not have solid financing. These companiesgenerally issue fewer shares, which increases their liquidityrisk.
Underlying fund risk
Some mutual funds invest some or all of their assets inanother mutual fund, called the underlying fund. If a mutualfund or counterparty to a RSP Fund buys or sells a largenumber of units of the underlying fund, the underlying fundmay have to change its portfolio significantly to meet thepurchase or redemption requests. This can affect the perform-ance of the underlying fund.
167

Organization and management of the Scotia Mutual Funds
As manager, we are responsible for the overall business and operation of the funds. This includes:Manager
) arranging for portfolio advisory servicesScotia Securities Inc.16th Floor ) providing or arranging for administrative services.40 King Street West Scotia Securities Inc. is a wholly-owned subsidiary of The Bank of Nova Scotia.Toronto, OntarioM5H 1H1
As trustee, we control and have authority over each fund’s investments in trust for unitholders under the termsTrusteedescribed in a declaration of trust.
Scotia Securities Inc.Toronto, Ontario
As principal distributor, we market and sell the Scotia Mutual Funds where they qualify for sale in Canada. We mayPrincipal distributorhire sub-distributors to assist in the sale of funds.
Scotia Securities Inc.Toronto, Ontario
The custodian holds the investments of the funds and keeps them safe to ensure that they are used only for theCustodianbenefit of investors. The Bank of Nova Scotia is the parent company of Scotia Securities Inc.
The Bank of Nova ScotiaToronto, Ontario
As registrar, we keep a record of all unitholders of the funds, process orders and issue tax slips to unitholders.Registrar
Scotia Securities Inc.Toronto, Ontario
The auditors are independent chartered accounting firms. The firms audit the financial statements of the funds toAuditorsmake sure all reporting is accurate.
Ernst & Young LLPGaviller is the auditor of the Scotia Canadian Income Fund, Scotia CanGlobal Income Fund, Scotia Canadian DividendToronto, OntarioFund, Scotia Canadian Balanced Fund, Scotia Canadian Stock Index Fund, Scotia Canadian Small Cap Fund and Scotia
Gaviller & Company LLP American Stock Index Fund.Owen Sound, Ontario
Ernst & Young is the auditor of all other Scotia Mutual Funds.
The portfolio advisors provide investment advice and make the investment decisions for the funds.Portfolio advisorsYou’ll find the portfolio advisor for each fund in the fund descriptions starting on page 6.
Scotia Cassels InvestmentScotia Cassels Investment Counsel Limited and Scotia Capital Inc. are wholly-owned subsidiaries of The Bank of NovaCounsel LimitedScotia, which is the parent company of Scotia Securities Inc.Toronto, Ontario
Scotia Capital Inc.Toronto, Ontario
Capital International Asset Capital International Asset Management (Canada), Inc. is independent of Scotia Securities Inc.Management (Canada), Inc.Toronto, Ontario
State Street Global State Street Global Advisors, Ltd. is independent of Scotia Securities Inc.Advisors, Ltd.Montreal, Quebec
Bank of Ireland Asset Bank of Ireland Asset Management (U.S.) Limited is independent of Scotia Securities Inc.Management(U.S.) LimitedGreenwich, Connecticut
Alliance Capital Management Alliance Capital Management Canada, Inc. is independent of Scotia Securities Inc.Canada, Inc.Toronto, Ontario
TCW Investment TCW Investment Management Company is independent of Scotia Securities Inc.Management CompanyLos Angeles, California
168

Connor, Clark & Lunn Connor, Clark & Lunn Investment Management Ltd. is independent of Scotia Securities Inc.Investment Management Ltd.Vancouver, British Columbia
The name and address of the agent for service of process of State Street Global Advisors, Ltd., Bank of Ireland AssetManagement (U.S.) Limited and TCW Investment Management Company in Ontario is available from the OntarioSecurities Commission. Notwithstanding registration in Ontario, TCW Investment Management Company is not fullysubject to the requirements of the Securities Act (Ontario) and the regulations concerning proficiency, capital,insurance, record keeping, segregation of assets and statements. This portfolio advisor is located outside of Canadaand all or a substantial portion of its assets may be situated outside of Canada, which may make it difficult for clientsto enforce their legal rights against the portfolio advisor.
Funds that invest in underlying funds that are managed by us or our associates or affiliates will not vote any of thesecurities of those underlying funds. However, we may arrange for you to vote your share of those securities.
169
Purchases, switches and redemptions
Scotia Mutual Funds are no-load. That means you don’t pay a offered for sale under this simplified prospectus. The classessales commission when you buy, switch or sell units through have different fees and are intended for different investors:us or our affiliates. Selling your units is also known as ) Class A units are available to all investors. All of the Scotiaredeeming. Mutual Funds offered for sale under this simplified prospec-
tus offer Class A units.How to place orders
) Class F units are generally available only to investors whoYou can open an account and buy, switch or sell Scotia Mutual have fee-based accounts with ScotiaMcLeod. All of theFunds: Scotia Mutual Funds offered for sale under this simplified
prospectus offer Class F units, except for the Scotia T-Bill) by calling or visiting any branch of the Scotiabank Group, orFund, Scotia Premium T-Bill Fund, Scotia Money Marketoffice of ScotiaMcLeod.Fund, Scotia CanAm U.S. $ Money Market Fund, Scotia
) through Scotia OnLine at www.scotiabank.com, once you’ve Vision Funds and Scotia Young Investors Fund.signed up for this service. ScotiaMcLeod and we are responsible for deciding whether
you’re eligible for Class F units. We may make Class F unitsYou can also open an account and place orders through otheravailable to other potential investors from time to time. Ifregistered brokers or dealers. They may charge you a salesyou’re no longer eligible to hold your Class F units, we maycommission or other fee. Brokers and dealers must sendchange your units to Class A units or sell them.orders to us on the same day that they receive completed
orders from investors. ) Scotia Private Client units are available to investors whohave signed a discretionary investment management agree-All transactions are based on the price of the fund’s units – orment with Scotia Cassels Investment Counsel Limited orits net asset value per unit (NAVPU). All orders are processedScotiatrust. Of the mutual funds offered for sale under thisusing the next NAVPU calculated after the fund receives thesimplified prospectus, Scotia Private Client units are offeredorder.by the Scotia Money Market Fund, Scotia Canadian IncomeFund, Scotia Canadian Balanced Fund, Scotia Canadian
How we calculate net asset value per unitDividend Fund, Scotia Canadian Blue Chip Fund, Scotia
We usually calculate the NAVPU of each class of each fund as Canadian Small Cap Fund and Scotia American Growthof the close of trading on the Toronto Stock Exchange (the Fund.TSX) on each day that the TSX is open for trading. In ) Class I units are available only to eligible institutionalunusual circumstances, we may suspend the calculation of the investors and other qualified investors. Class I units areNAVPU. currently offered by Scotia Money Market Fund, Scotia
Canadian Bond Index Fund, Scotia Mortgage Income Fund,The NAVPU of each class of a fund is the current marketScotia Canadian Income Fund, Scotia CanGlobal Incomevalue of the proportionate share of the assets allocated to theFund, Scotia Canadian Stock Index Fund, Scotia Canadianclass, less the liabilities of the class and the proportionateDividend Fund, Scotia Canadian Blue Chip Fund, Scotiashare of the common expenses allocated to the class, dividedCanadian Growth Fund, Scotia Canadian Small Cap Fund,by the total number of units investors in that class areScotia American Stock Index Fund, Scotia American Growthholding.Fund, Scotia International Stock Index Fund, Scotia Global
All of the funds are valued in Canadian dollars, except the Growth Fund, Scotia Pacific Rim Growth Fund and ScotiaScotia CanAm U.S. $ Money Market Fund and Scotia CanAm Latin American Growth Fund. No management fees areU.S. $ Income Fund. These funds are valued in U.S. dollars. charged on Class I units. Instead, Class I investors negotiate
a separate fee that is paid directly to us.About the classes of units
How to buy the fundsScotia Mutual Funds are available in up to four classes of
Minimum investmentsunits: Class A units, Class F units, Scotia Private Client unitsand Class I units. Only Class A, Class F and Class I units are The minimum amounts for the initial and each additional
investment in Class A units of a fund are shown in the table
170

on the next page. See page 173 for details on Pre-Authorized additional investment is $50. The minimum initial investmentContributions. For Class F units of a fund (except Scotia for Class F units of the Scotia Partners Portfolios and ScotiaPartners Portfolios and Scotia Selected Funds), the minimum Selected Funds is as set out in the table. For Class I units ofinitial investment is $2,500 and the minimum for each a fund, the minimum initial investment is $1,000,000.
Minimum additionalinvestment (including
Minimum Pre-Authorizedinitial investment Contributions3)
All accounts All accounts, exceptexcept Scotia Asset Copilot andAllocation Services2 Destination Accounts2
and ican Invest TM
Program4 accounts
All Scotiaregistered plans,
Fund except Scotia RRIFs Scotia RRIFs
Scotia Canadian Bond Index Fund
Scotia Canadian Stock Index Fund
Scotia American Stock Index Fund
Scotia CanAm Stock Index Fund
Scotia Nasdaq Index Fund
Scotia International Stock Index Fund $1,000 $5,000 $50
Scotia T-Bill Fund
Scotia Money Market Fund
Scotia CanAm U.S. $ Money Market Fund1 $2,000 $10,000 $50
Scotia Premium T-Bill Fund5 $100,000 $250,000 $500
Scotia Young Investors Fund $100 $5,000 $25
Scotia CanAm U.S. $ Income Fund1
All other funds $500 $5,000 $50
Scotia Partners Portfolios
Scotia Selected Funds
Scotia Vision Funds $5,000 $5,000 $501 You can use Canadian or U.S. dollars to buy this fund.2 You must make and maintain a total investment of a least $30,000 to have a Copilot˛ or Destination˛ Account offered under Scotia Asset Allocation Services. Each
minimum additional investment (including Pre-Authorized Contributions) for the Copilot and Destination Accounts must be at least $100. The total investment you
must make and maintain for a SoloTM Account is at least $30,000. In addition, your initial investment, the minimum balance you must keep and the minimum
subsequent investment in each fund for the Solo Account must be at least the minimum shown here. See page 174 for details.3 If you choose to invest less frequently than monthly using Pre-Authorized Contributions (i.e. bi-monthly, quarterly, semi-annually or annually), the minimum
amount for each investment will be determined by multiplying the amounts shown here by twelve and then dividing the sum by the number of investments you
make over the course of one calendar year. For example, for most funds, if you choose to invest quarterly, the minimum investment for each quarter will be
$50×12÷4, or $150.4 The minimum initial investment for the Scotia Diversified Monthly Income Fund, Scotia Canadian Balanced Fund, Scotia Total Return Fund and Scotia Young
InvestorsTM Fund is waived when these funds are purchased through the ican Invest Program offered through Scotiabank. See page 173 for details.5 We have the right, without notice, to switch your units of the Scotia Premium T-Bill Fund for units of the Scotia T-Bill Fund if you do not maintain the minimum
investment shown here. You will be deemed not to have maintained the minimum investment if the current market value of your units on the last business day of
any month is less than the minimum investment shown. You are responsible for switching your investment back to the Scotia Premium T-Bill Fund if you are
subsequently able to meet the minimum investment shown.
More about buyingWe can change or waive these minimum investments at anytime. We can close your account if the value of your ) We can reject all or part of your order within one businessinvestment in a fund drops below the minimum initial day of the fund receiving it. If we reject your order, we’llinvestment that applies to your account. immediately return any money received, without interest. We
may reject your order if you’ve made several purchases andsales of a fund within a short period of time, usually90 days.
171

Changing to another class) You have to pay for your units when you buy them. If wedon’t receive payment for your purchase within three You can change Class A units to Class F units of the samebusiness days after the purchase price is determined, we’ll fund, if the fund is available in Class F units and you’resell your units on the next business day. If the proceeds eligible to hold them. If you’re no longer eligible to hold yourfrom the sale are more than the cost of buying the units, Class F units, you can change them to Class A units. Changingthe fund will keep the difference. If the proceeds are less units from one class to another class of the same fund is notthan the cost of buying the units, we must pay the shortfall. a disposition for tax purposes.We may collect the shortfall and any related costs from thedealer or broker who placed the order, or from you, if you How to sell your unitsplaced the order directly with us.
In general, your instructions to sell must be in writing, and) You can use Canadian or U.S. dollars to buy the Scotia
your bank, trust company, broker or dealer must guaranteeCanAm U.S. $ Money Market Fund and the Scotia CanAmyour signature. We may also require other proof of signingU.S. $ Income Fund. If you pay in Canadian dollars, we’llauthority.convert your payment to U.S. dollars at the Scotiabank daily
‘‘sell’’ exchange rate on the day the fund receives your We’ll send your payment to you by cheque or deposit it to yourorder. bank account or send it to your broker or dealer within three
business days of receiving your properly completed order. If) Your broker, dealer or we will send you a confirmation ofyou sell units within 90 days of buying them, you may have toyour purchase once your order is processed. If you buy unitspay a short-term trading fee. See Fees and expenses forthrough pre-authorized contributions, we’ll send you adetails.confirmation only for the initial investment and when you
change the amount of your regular investment.You can also sell units on a regular basis by setting up anautomatic withdrawal plan. See Optional services for details.
How to switch funds
More about sellingYou can switch from one Scotia Mutual Fund to another fund,unless you hold your funds in a Copilot or Destination ) You must provide all required documents within 10 businessAccount. See Optional services for details about these days of the day the redemption price is determined. If youaccounts. When we receive your order, we’ll sell units of the don’t, we’ll buy back the units as of the close of business onfirst fund and then use the proceeds to buy units of the the 10th business day. If the cost of buying the units is lesssecond fund. If you switch units within 90 days of buying than the sale proceeds, the fund will keep the difference. Ifthem, you may have to pay a short-term trading fee. See Fees the cost of buying the units is more than the sale proceeds,and expenses for details. we must pay the shortfall. We can collect the shortfall and
any related costs from the broker or dealer who placed theMore about switching order, or from you, if you placed the order directly with us.) The rules for buying and selling units also apply to ) Sell orders placed for a corporation, trust, partnership,
switches. agent, fiduciary, surviving joint owner or estate must beaccompanied by the required documents with proof of) You can switch between funds valued in different curren-signing authority. The sell order will be effective only whencies. If you’re switching from a fund valued in Canadianthe fund receives all required documents, properlydollars to a fund valued in U.S. dollars, we’ll convert yourcompleted.Canadian dollars to U.S. dollars at the Scotiabank daily
‘‘sell’’ exchange rate on the day the fund receives your ) If you hold units of the Scotia CanAm U.S. $ Money Marketorder. If you’re switching from a fund valued in U.S. dollars Fund or the Scotia CanAm U.S. $ Income Fund in a non-to a fund valued in Canadian dollars, we’ll convert your U.S. registered account, we’ll send you the sale proceeds in U.S.dollars to Canadian dollars at the Scotiabank daily ‘‘buy’’ dollars, unless you tell us in writing that you want torate on the day the fund receives your order. receive them in Canadian dollars. If you ask for payment in
Canadian dollars, we’ll convert the sale proceeds to) If you hold your units in a non-registered account, you mayCanadian dollars at the Scotiabank daily ‘‘buy’’ exchangerealize a capital gain or loss. Capital gains are taxable.rate on the day the fund receives your order.
) Your broker, dealer or we will send you a confirmation onceyour order is processed.
172

) If you hold your units in non-registered account, you may Your right to sell your units of the Capital U.S. Largerealize a capital gain or loss. Capital gains are taxable. Companies Fund, Capital U.S. Small Companies Fund, Capital
International Large Companies Fund, Capital Global Discovery) Your broker, dealer or we will send you a confirmation onceFund, Capital Global Small Companies Fund and theiryour order is processed. If you sell units through thecorresponding RSP Funds will be automatically suspendedautomatic withdrawal plan, we’ll send you a confirmationduring periods when the right to redeem one or more of theironly for the first withdrawal.underlying funds is suspended.
Suspending your right to buy, switch and sell units We will not accept orders to buy fund units during any periodwhen we’ve suspended investors’ rights to sell their units.Securities regulations allow us to temporarily suspend your
right to sell your fund units and postpone payment of your You may withdraw your sell order before the end of thesale proceeds: suspension period. Otherwise, we’ll sell your units at the) during any period when normal trading is suspended on any NAVPU next calculated when the suspension period ends.
exchange on which securities or derivatives that make upmore than 50% of the fund’s value or its underlying marketexposure are traded and there’s no other exchange wherethese securities or derivatives are traded, or
) with the approval of securities regulators.
Optional servicesThis section tells you about the accounts, plans and services simplified prospectus for the funds only if you request it. Ifthat are available to Scotia Mutual Fund investors. Call us at you would like to receive a copy of a renewal prospectus1-800-268-9269 (416-750-3863 in Toronto) or contact your along with any amendment, please contact us atbranch of Scotiabank Group for full details and application 1-800-268-9269, or fax your request to or visit your nearestforms. Scotiabank branch. The current renewal prospectus and any
amendments may be found at www.sedar.com or atPre-Authorized Contributions www.scotiabank.com/mutual funds. Although you do not
have a statutory right to withdraw from a purchase ofFollowing your initial investment, you can make regular mutual fund units made under a pre-authorized contribu-purchases using automatic transfers from your bank account tion, you will continue to have a right of action for damagesto the funds you choose. or rescission in the event a renewal prospectus contains a
misrepresentation, whether or not you request a renewalMore about Pre-Authorized Contributions
prospectus.) Pre-authorized contributions are available for non-registered
accounts, RRSPs and RESPs. See page 171 for the minimum The ican InvestTM Programinvestment amounts.
The ican Invest Program offered by Scotiabank is designed to) You can choose to invest weekly, bi-weekly, semi-monthly,
assess your current financial situation and recommend solu-monthly, bi-monthly, quarterly, semi-annually or annually.
tions for each of your goals by suggesting investment options) We’ll automatically transfer the money from your bank based on your particular needs. Through the Program, you
account at Scotiabank or any other selected Canadian determine an amount you can contribute towards each goal onfinancial institution to the funds you choose. a regular basis. Pre-authorized contributions will be made from
your bank account to the investments you select. The Scotia) You can change how much you invest and how often youDiversified Monthly Income Fund, Scotia Canadian Balancedinvest, or cancel the plan by telling us in writing.Fund, Scotia Total Return Fund, Scotia Young Investors Fund,
) We can change or cancel the plan at any time.Scotia Selected Funds and Scotia Partners Portfolios are
) Except for residents of Quebec, if you make purchases using eligible investments within the ican Invest Program. Minimumpre-authorized contributions, you will receive a renewal initial investments do not apply to
173

Foreign content monitoring serviceunits of some of these funds when purchased through theProgram. See page 171 for details. If your registered plan (other than an RESP) goes over the
foreign content limit, a penalty tax may apply. The foreignAutomatic Withdrawal Plan content limit is generally 30% of the cost of the investments in
your registered plan. The foreign content limit doesn’t apply toOur automatic withdrawal plan lets you receive regular cashRESPs. On February 23, 2005, the Minister of Financepayments from your funds. The table below shows the(Canada) announced as part of the Federal Budget that theminimum balance needed to start the plan and the minimumforeign property limit in the Tax Act will be repealed effectivefor each withdrawal.as of 2005. As of the date of this simplified prospectus, this
Minimum balance Minimum for measure has not been passed into law and there can be noFund to start the plan each withdrawal
assurance it will be passed into law. If the repeal of theScotia T-Bill Fund
foreign content limit becomes law, we will cease to offer thisScotia Money Market Fund $10,000 $100Scotia CanAm U.S. $ service.Money Market Fund1
Scotia Premium T-Bill Fund $250,000 $500 Our foreign content monitoring service will automatically keepAll other funds1 $5,000 $50 your Scotia registered plan within the foreign content limit. At1 You can use Canadian or U.S. dollars for the Scotia CanAm U.S. $ Money the end of each month, our computer system checks the
Market Fund and Scotia CanAm U.S. $ Income Fund.amount of foreign property in your account. If it’s more thanthe foreign content limit, the system will automatically sell aMore about the automatic withdrawal planportion of your foreign property funds and buy units of a fund
) The automatic withdrawal plan is only available for non- that isn’t foreign property. If you don’t specify which fund youregistered accounts. want the excess transferred to, we’ll transfer it to the Scotia
) You can choose to receive payments monthly, quarterly, T-Bill Fund. We don’t issue confirmations for thesesemi-annually or annually. transactions.
) We’ll automatically sell the necessary number of units to For Scotia Asset Allocation Services, the system will overridemake payments by cheque or by deposit to your bank the asset allocation if your plan exceeds the foreign contentaccount. limit. The system will reallocate the excess amount proportion-
) If you sell units within 90 days of buying them, you may ately among the funds that aren’t foreign property. See belowhave to pay a short-term trading fee. See Fees and expenses for details about these accounts.for details.
Scotia Asset Allocation Services) You may realize a capital gain or loss. Capital gains aretaxable. We offer the following accounts to help you maintain a
) You can change the funds and the amount or frequency of balanced portfolio of Scotia Mutual Funds. Whether you preferyour payments, or cancel the plan by telling us in writing. to choose the mix of funds yourself or let a portfolio manager
make the decisions for you, we’ll automatically rebalance your) We can change or cancel the plan, or waive the minimumportfolio according to the targets set for each fund. Theseamounts at any time.accounts are available only for Class A units of the funds. The
If you withdraw more money than your fund units are accounts are not appropriate for short-term investing.earning, you’ll eventually use up your investment.
SoloTM AccountRegistered plans
When you open a Solo Account, you choose the funds and theWe offer Scotia RRSPs, RRIFs, LIRAs, LRSPs and RESPs. You percentage invested in each fund. We’ll monitor your accountcan make lump-sum investments, or if you prefer, you can set and rebalance it on the last business day of each calendarup a regular investment plan using Pre-Authorized Contribu- quarter to maintain your investment mix. There’s no chargetions. You’ll find the minimum investment amounts on for this service.page 171.
More about Solo AccountsYou can also hold units of the funds in self-directed registered
) Solo Accounts are available for non-registered accounts andplans with other financial institutions. You may be charged aregistered plans.fee for these plans.
174

) Your initial investment must be at least $30,000. We may based on the portfolio’s objectives. The portfolios areclose your account if the total value of your investments periodically rebalanced to maintain these targets. Scotiafalls below $30,000. The value of each fund in your account Capital Inc. can change the asset mix, the funds and themust be at least the minimum initial investment amount for target ranges.that fund. See Minimum investments on page 171 for ) Switching between funds isn’t permitted.details.
) If you hold your funds in a non-registered account, you may) All of the Scotia Mutual Funds are eligible for Solo realize a capital gain or loss when the portfolio is
Accounts, except for the Scotia Premium T-Bill Fund, Scotia rebalanced. Capital gains are taxable.CanAm U.S. $ Money Market Fund and Scotia CanAm U.S. $
) If you hold your funds in a registered plan, our foreignIncome Fund.content monitoring service will override the asset allocation
) We’ll rebalance your portfolio on the last business day of the if it causes your registered plan to go over the foreigncalendar quarter according to the instructions we have on content limit. See Foreign content monitoring service onfile from you by the second last business day of that page 174 for details.quarter.
) We don’t issue a confirmation when your portfolio is) We’ll allocate additional investments according to the most rebalanced.
recent instructions you’ve given us.) There is an annual fee for this service. See Fees and
) If you hold your funds in a non-registered account, you may expenses for details.realize a capital gain or loss when your account is
) We can change or cancel the service at any time.rebalanced. Capital gains are taxable.
) If you hold your funds in a registered plan, our foreign Copilot portfolioscontent monitoring service will override the asset allocation
You can choose from the following Copilot portfolios:if it causes your registered plan to go over the foreigncontent limit. See Foreign content monitoring service on Copilotpage 174 for details. portfolio Portfolio objectives
Conservative Primarily intended to provide modest income while) You can change the funds and the percentage invested inIncome protecting investment principaleach fund by visiting your branch of Scotiabank Group.Income and Primarily intended to provide a high level of income and
) We don’t issue a confirmation when your portfolio isModest Growth moderate growth with moderate risk to investment principal
rebalanced.Balanced Income Primarily intended to provide a combination of growth and
) We can change the funds that are eligible for the account, and Growth income
when the accounts are rebalanced and minimum balances. Conservative Primarily intended to provide growth over the long term
Growth) We can change or cancel the service at any time.
Aggressive Primarily intended to provide above-average long-term
Growth growth accompanied by a higher level of riskCopilot˛ Account
With the Copilot Account, you choose one of our professionally Destination˛ Accountdesigned portfolios of Scotia Mutual Funds to suit your
Our Destination portfolios are specially designed for RRSPinvestment goals and risk comfort level. See the accompanyingaccounts to help investors reach their retirement goals. Thetable for details. Scotia Capital Inc. monitors, manages andmix of Scotia Mutual Funds depends on the number of yearsrebalances each portfolio to make sure it continues to meet itsuntil you plan to retire and your risk comfort level. As eachobjectives.portfolio nears its destination date, we gradually adjust themix to reduce risk and increase the potential for income inMore about Copilot Accountsthe years ahead. See the accompanying table for details.
) Copilot Accounts are available for non-registered accountsScotia Capital Inc. monitors, manages and rebalances eachand registered plans.portfolio to make sure it continues to meet its objectives.
) The minimum initial investment is $30,000.
) Scotia Capital Inc. chooses the asset mix and the funds foreach portfolio, and sets the target range for each fund
175

More about Destination Accounts
) The minimum initial investment is $30,000.
) Scotia Capital Inc. chooses the asset mix and the funds,and sets the target range for each fund based on theportfolio’s objectives. The portfolios are periodicallyrebalanced to maintain these targets. Scotia Capital Inc. canchange the asset mix, the funds and the target ranges.
) Switching between funds isn’t permitted.
) Our foreign content monitoring service will override theasset allocation if an allocation causes your registered planto go over the foreign content limit. See Foreign contentmonitoring service on page 174 for details.
) We don’t issue a confirmation when your portfolio isrebalanced.
) There is an annual fee for this service. See Fees andexpenses for details.
) We can change or cancel the service at any time.
The Destination portfolios
You can choose from the following Destination portfolios:
Destination portfolio Who it’s suited for
Destination 2005 and Suited for investors who are close to retirement.
Destination 2010 The portion of equity funds will gradually shift to
income funds as each portfolio nears its
destination date.
Destination 2015 and Suited for investors in their peak earning years
Destination 2020 who plan to retire between 2013 and 2023. The
objectives of the portfolios are reasonable growth
from equity funds while shifting to income funds
as each portfolio nears its destination date.
Destination 2025 and Suited for investors in their mid-earning years who
Destination 2030 can benefit from holding growth mutual funds in
their portfolio, given the long period of time until
retirement. Each portfolio will become more
conservative as the destination date draws near.
Destination 2035 and Suited for investors in their early earning years
Destination 2040 who want maximum growth from their
investments. Investors with approximately 40 years
to retirement can benefit from having a large
portion of their portfolio invested in equity funds.
As time passes, each portfolio will gradually
become more conservative.
176

Fees and expenses
This section describes the fees and expenses you may have to are no-load funds, a meeting of unitholders of the funds is notpay if you invest in the Scotia Mutual Funds. You may have to required to approve any increase in a fee or expense chargedpay some of these fees and expenses directly. The funds may to the funds. Any such increase will only be made ifhave to pay some of these fees and expenses, which reduces unitholders are notified of the increase at least 60 days beforethe value of your investment. Because Scotia Mutual Funds the date on which the increase will take effect.
Fees and expenses payable by the funds
Management fees Each fund pays us a management fee with respect to each class of units for providing generalmanagement services. The fee is calculated and paid daily. The maximum annual rates of themanagement fee for Class A and Class F units of the funds are as follows:
Class A units
Maximum annual
Fund management fee (%)
Cash Equivalent Funds
Scotia T-Bill Fund 1.00
Scotia Premium T-Bill Fund 0.501
Scotia Money Market Fund 1.00
Scotia CanAm˛ U.S. $ Money Market Fund 1.00
Income Funds
Scotia Canadian Bond Index Fund 0.70
Scotia Mortgage Income Fund 1.25
Scotia Canadian Income Fund 1.25
Scotia CanAm U.S. $ Income Fund 1.50
Scotia CanGlobal Income Fund 1.50
Balanced Funds
Scotia Diversified Monthly Income Fund 1.25
Scotia Canadian Balanced Fund 1.75
Scotia Total Return Fund 1.75
Scotia Selected FundsScotia Selected Income & Modest Growth Fund 1.60
Scotia Selected Balanced Income & Growth Fund 1.75
Scotia Selected Conservative Growth Fund 1.90
Scotia Selected Conservative Growth RSP Fund 1.90
Scotia Selected Aggressive Growth Fund 2.10
Scotia Selected Aggressive Growth RSP Fund 2.10
Scotia Partners PortfoliosScotia Partners Income & Modest Growth Portfolio 1.85
Scotia Partners Balanced Income & Growth Portfolio 2.00
Scotia Partners Conservative Growth Portfolio 2.15
Scotia Partners Aggressive Growth Portfolio 2.35
177

Fees and expenses payable by the funds (cont’d)
Class A units (cont’d)
Maximum annual
Fund management fee (%)
Scotia Vision FundsScotia Vision Conservative 2010 Fund 1.60
Scotia Vision Aggressive 2010 Fund 1.65
Scotia Vision Conservative 2015 Fund 1.70
Scotia Vision Aggressive 2015 Fund 1.75
Scotia Vision Conservative 2020 Fund 1.80
Scotia Vision Aggressive 2020 Fund 1.85
Scotia Vision Conservative 2030 Fund 2.00
Scotia Vision Aggressive 2030 Fund 2.05
Equity Funds
Canadian Equity FundsScotia Canadian Stock Index Fund 0.80
Scotia Canadian Dividend Fund 1.50
Scotia Canadian Blue Chip Fund 1.85
Scotia Canadian Growth Fund 1.85
Scotia Canadian Small Cap Fund 2.00
Scotia Resource Fund 2.00
Foreign Equity FundsScotia American Stock Index Fund 0.80
Scotia American Growth Fund 2.00
Scotia CanAm Stock Index Fund 0.80
Scotia Nasdaq Index Fund 0.80
Scotia Young Investors Fund 2.00
Scotia International Stock Index Fund 0.80
Scotia Global Growth Fund 2.00
Scotia European Growth Fund 2.00
Scotia Pacific Rim Growth Fund 2.00
Scotia Latin American Growth Fund 2.50
Capital International Series FundsCapital U.S. Large Companies Fund 2.00
Capital U.S. Large Companies RSP Fund 2.00
Capital U.S. Small Companies Fund 2.15
Capital U.S. Small Companies RSP Fund 2.15
Capital International Large Companies Fund 2.15
Capital International Large Companies RSP Fund 2.15
Capital Global Discovery Fund 2.20
Capital Global Discovery RSP Fund 2.20
Capital Global Small Companies Fund 2.35
Capital Global Small Companies RSP Fund 2.35
1 The fund pays a management fee distribution of 0.20% when the value of the fund held within an account is $250,000 to
$1,000,000. It pays a management fee distribution of 0.35% when the value of the fund held within an account is greater than
$1,000,000.
Funds that invest in other fundsAn underlying fund pays its own fees and expenses, which are in addition to the fees and expenses payable by a fund that invests in
the underlying fund.
No management or incentive fees are payable by a fund if the payment of those fees could reasonably be perceived as a duplication
of fees payable by an underlying fund for the same services.
No sales or redemption fees are payable by a fund when it buys or sells securities of an underlying fund that is managed by us or
one of our associates or affiliates or if the payment of those fees could reasonably be perceived as a duplication of fees paid by an
investor in the fund.
178

Fees and expenses payable by the funds (cont’d)
Class F units
Maximum annual
Fund management fee (%)
Income Funds
Scotia Canadian Bond Index Fund 0.35
Scotia Mortgage Income Fund 0.625
Scotia Canadian Income Fund 0.625
Scotia CanAm U.S. $ Income Fund 0.75
Scotia CanGlobal Income Fund 0.75
Balanced Funds
Scotia Diversified Monthly Income Fund 0.625
Scotia Canadian Balanced Fund 0.875
Scotia Total Return Fund 0.875
Scotia Selected FundsScotia Selected Income & Modest Growth Fund 0.60
Scotia Selected Balanced Income & Growth Fund 0.75
Scotia Selected Conservative Growth Fund 0.90
Scotia Selected Conservative Growth RSP Fund 0.90
Scotia Selected Aggressive Growth Fund 1.10
Scotia Selected Aggressive Growth RSP Fund 1.10
Scotia Partners PortfoliosScotia Partners Income & Modest Growth Portfolio 0.85
Scotia Partners Balanced Income & Growth Portfolio 1.00
Scotia Partners Conservative Growth Portfolio 1.15
Scotia Partners Aggressive Growth Portfolio 1.35
Equity Funds
Canadian Equity FundsScotia Canadian Stock Index Fund 0.40
Scotia Canadian Dividend Fund 0.75
Scotia Canadian Blue Chip Fund 0.925
Scotia Canadian Growth Fund 0.925
Scotia Canadian Small Cap Fund 1.00
Scotia Resource Fund 1.00
Foreign Equity FundsScotia American Stock Index Fund 0.40
Scotia American Growth Fund 1.00
Scotia CanAm Stock Index Fund 0.40
Scotia Nasdaq Index Fund 0.40
Scotia International Stock Index Fund 0.40
Scotia Global Growth Fund 1.00
Scotia European Growth Fund 1.00
Scotia Pacific Rim Growth Fund 1.00
Scotia Latin American Growth Fund 1.25
Capital International Series FundsCapital U.S. Large Companies Fund 1.00
Capital U.S. Large Companies RSP Fund 1.00
Capital U.S. Small Companies Fund 1.15
Capital U.S. Small Companies RSP Fund 1.15
Capital International Large Companies Fund 1.15
Capital International Large Companies RSP Fund 1.15
Capital Global Discovery Fund 1.20
Capital Global Discovery RSP Fund 1.20
Capital Global Small Companies Fund 1.35
Capital Global Small Companies RSP Fund 1.35
179

Fees and expenses payable by the funds (cont’d)
Class F units (cont’d)
Funds that invest in other fundsAn underlying fund pays its own fees and expenses, which are in addition to the fees and expenses payable by a fund that invests in
the underlying fund.
No management or incentive fees are payable by a fund if the payment of those fees could reasonably be perceived as a duplication
of fees payable by an underlying fund for the same services.
No sales or redemption fees are payable by a fund when it buys or sells securities of an underlying fund that is managed by us or
one of our associates or affiliates or if the payment of those fees could reasonably be perceived as a duplication of fees paid by an
investor in the fund.
Management fee distributionsIn addition to the management fee distribution for the Scotia Premium T-Bill Fund, the funds may pay you a management fee
distribution if you make a large investment. The distributions are negotiable and are reinvested in the fund. We may discontinue
management fee distributions by giving written notice to you or to your broker or dealer.
Operating expenses Each class of a fund is allocated its own expenses and its proportionate share of the fund’s expensesthat are common to all classes. Operating expenses may include legal fees, audit fees, custodial fees,taxes, brokerage commissions and unitholder communication costs. We may absorb any of these expenses.Scotia Mortgage Income Fund
The Scotia Mortgage Income Fund pays Scotia Mortgage Corporation, a wholly-owned subsidiary ofScotiabank, a fee for administering all mortgages it holds. The fee is equal to an annualized rate of 3/8of 1% of the average net asset value of the mortgages.
RSP Fund The RSP Funds, other than Scotia Selected Conservative Growth RSP Fund and Scotia Selectedderivatives costs Aggressive Growth RSP Fund, currently use forward contracts that are linked to the performance of an
underlying fund. These RSP Funds pay the costs of their forward contracts and other derivatives. Thesecosts are expected to be approximately 0.50% to 0.70% each year, but may increase.
Fees and expenses payable directly by you
Sales charges None
Redemption fee None
Switch fee None
Short-term Short-term trading by investors can increase the fund’s expenses, which affects all investors in the fund.trading fee To discourage short-term trading, a fund may charge a fee of 2% of the amount you sell or switch, if you:
) sell or switch your units within 90 days of buying them) cancel a Scotia Asset Allocation Service within 90 days of starting it.The fee doesn’t apply to cash equivalent funds or rebalancing that’s part of a Scotia Asset AllocationService.We may waive the fee.
180

Registered The trustee may charge a withdrawal fee of $25.plan fees
Other fees ) Pre-Authorized Contributions: None) Automatic Withdrawal Plan: None) Foreign content monitoring service: NoneScotia Asset Allocation Services
) Solo Account: None) Copilot Account: We deduct an annual fee of 0.10% of the total value of your account by the second
last business day of each year. The fee is deducted from the fund with the highest balance in youraccount on that day. The minimum fee is $25 and the maximum fee is $100. For example, the fee is$25 on accounts with a value of $25,000 or less, and $100 on accounts with a value of $100,000 ormore. This fee may be tax deductible. Please consult a tax expert for more information.
) Destination Account: We deduct an annual fee of 0.10% of the total value of your account by thesecond last business day of each year. The fee is deducted from the fund with the highest balance inyour account on that day. The minimum fee is $25 and the maximum fee is $100. For example, the feeis $25 on accounts with a value of $25,000 or less, and $100 on accounts with a value of $100,000 ormore. This fee may be tax deductible. Please consult a tax expert for more information.
Impact of sales charges
The Scotia Mutual Funds are no-load. That means you don’t ScotiaMcLeod and ScotiaMcLeod Direct Investing). You maypay a sales commission when you buy, switch or sell units pay a sales commission or other fee if you buy, switch or sellthrough Scotia Securities Inc. or Scotia Capital Inc. (including units through other registered brokers or dealers.
Dealer compensationMaximum annualThis section explains how we compensate employees, brokers
Fund service fee rateand dealers when you invest in Class A units of the funds.Scotia T-Bill FundScotia Money Market Fund
Sales commissions Scotia CanAm U.S. $ Money Market FundScotia Canadian Dividend Fund up to 0.50%
We may pay our employees an up-front sales commission of upScotia Canadian Income Fund up to 0.55%
to 1% of the amount you invest.Scotia Mortgage Income FundScotia CanAm Stock Index Fund up to 0.625%
Service fees Scotia CanAm U.S. $ Income FundScotia CanGlobal Income Fund
We may pay employees, brokers and dealers a service fee on Scotia Diversified Monthly Income FundClass A units. We don’t pay service fees on Class F units. The Scotia Canadian Balanced Fund up to 0.75%
fee is calculated daily and is based on the value of Class A Scotia Canadian Blue Chip FundScotia Canadian Growth Fundunits investors are holding of each fund sold by an employee,Scotia Canadian Small Cap Fundbroker or dealer at the following annual rates:Scotia Resource FundScotia American Growth FundMaximum annualScotia Young Investors FundFund service fee rateScotia Global Growth Fund
Scotia Premium T-Bill Fund up to 0.10% Scotia European Growth FundScotia Canadian Bond Index Fund Scotia Pacific Rim Growth FundScotia Canadian Stock Index Fund Capital U.S. Large Companies FundScotia American Stock Index Fund Capital U.S. Large Companies RSP FundScotia Nasdaq Index Fund Capital U.S. Small Companies FundScotia International Stock Index Fund up to 0.40% Capital U.S. Small Companies RSP Fund
181

Maximum annual
Fund service fee rate
Capital International Large Companies FundCapital International Large Companies RSP FundCapital Global Discovery FundCapital Global Discovery RSP FundCapital Global Small Companies FundCapital Global Small Companies RSP FundScotia Vision Conservative 2010 FundScotia Vision Aggressive 2010 FundScotia Vision Conservative 2015 FundScotia Vision Aggressive 2015 FundScotia Vision Conservative 2020 FundScotia Vision Aggressive 2020 FundScotia Vision Conservative 2030 FundScotia Vision Aggressive 2030 Fund up to 1.00%
Scotia Total Return Fund up to 1.125%
Scotia Partners Income & Modest Growth PortfolioScotia Partners Balanced Income & Growth PortfolioScotia Partners Conservative Growth PortfolioScotia Partners Aggressive Growth PortfolioScotia Selected Income & Modest Growth FundScotia Selected Balanced Income & Growth FundScotia Selected Conservative Growth FundScotia Selected Conservative Growth RSP FundScotia Selected Aggressive Growth FundScotia Selected Aggressive Growth RSP FundScotia Latin American Growth Fund up to 1.25%
Sales incentive programs
We may award prizes, such as cash or merchandise, toemployees or branches for sales of fund units. We estimatethat the annual cost of these prizes will not be more than $1for each $1,000 investment by a unitholder. The maximumvalue of any prize that may be awarded to an employee is$1,000 each year. Members of the Scotiabank Group mayinclude sales of units of the funds in their general employeeincentive programs. These programs involve many differentScotiabank Group products. We may offer other incentiveprograms, as long as Canadian securities regulators approvethem.
The funds or their unitholders pay no charges for incentiveprograms.
182

Dealer compensation from management fees
The cost of the sales and service commissions and sales management fees we received from the Scotia Mutual Fundsincentive programs was approximately 4.84% of the total during the financial year ended December 31, 2003.
Income tax considerations for investorsThis section is a summary of how investing in the Scotia hold up to 30% of the cost of the investments in your plan inMutual Funds can affect your taxes. It assumes that you’re an foreign property. Reinvested distributions and switches be-individual (other than a trust), a Canadian resident and you tween funds will affect the proportionate foreign propertyhold your units as capital property. Because tax laws vary by holdings in your registered plan. The foreign content limitprovince and every investor’s situation is different, we doesn’t apply to RESPs. If you hold your units in a Scotiarecommend that you get advice from a tax expert. registered plan (other than a Scotia RESP), our foreign
content monitoring service will automatically make sure thatHow your investment can earn money your plan doesn’t go over the foreign content limit. See
Foreign content monitoring service on page 174 for details. OnFunds earn money in the form of income and capital gains. February 23, 2005, the Minister of Finance (Canada) an-Income includes the interest and dividends a fund earns on its nounced as part of the Federal Budget that the foreigninvestments and gains on certain derivatives. Capital gains are property limit in the Tax Act will be repealed effective asearned when a fund sells investments for a profit. of 2005. As of the date of this simplified prospectus, this
measure has not been passed into law and there can be noYou earn money in the form of distributions when the fundassurance it will be passed into law.pays you your share of the income and capital gains it has
earned. In general, each fund will distribute enough of its netUnits held in a non-registered accountincome and net realized capital gains each year to unitholders
so it won’t have to pay income tax. Distributions from the funds
You can also earn money on any capital gain you realize when If you hold units of a fund in a non-registered account, youyou sell or switch your units for a profit. You can realize a must include your share of the fund’s distributions of netcapital loss if you sell or switch your units at a loss. income and the taxable portion of its distributions of net
capital gains (including any management fee distributions) inHow earnings are taxed your income, whether you receive the distributions in cash or
we reinvest them for you. In general, these distributions areThe tax you pay depends on whether you hold your units in ataxable to you as if you received the income or gain directly.registered plan or in a non-registered account.The higher a fund’s portfolio turnover rate, the greater thechance the fund will make distributions of capital gains.Units held in a registered plan
Distributions, including management fee distributions, mayIf you hold units of a fund in an RRSP, RRIF, RESP or otherinclude a return of capital. When a fund earns less incomeregistered plan, you pay no tax on distributions from the fundand capital gains than the amount distributed, the differenceon those units or on any capital gains that your registeredis a return of capital. A return of capital is not taxable, butplan receives from selling or switching units. When youwill reduce the adjusted cost base of your units of the fund. Ifwithdraw money from a registered plan, it will generally bethe adjusted cost base of your units is reduced to less thansubject to tax at your marginal tax rate. You should consultzero, you will be deemed to realize a capital gain to thewith a tax expert about the special rules that apply to RESPs.extent of the negative amount and the adjusted cost base of
You can hold foreign investments in your registered plan your units will be increased to nil.(other than an RESP) up to the foreign content limit under
The unit price of a fund may include income and/or capitalthe Tax Act. If your registered plan goes over the foreigngains that the fund has accrued or realized, but not yetcontent limit, a penalty tax may apply. In general, you candistributed. If you buy units of a fund just before it makes a
183

distribution, you’ll be taxed on that distribution, even though You may realize a foreign exchange gain or loss when you sellthe fund earned the amount before you owned it. For example, your units of the Scotia CanAm U.S. $ Money Market Fund ormany funds make their only, or most significant, distribution of the Scotia CanAm U.S. $ Income Fund.income and capital gains in December. If you buy units late in
Changing units from one class of a fund to another class ofthe year, you may have to pay tax on the income and capitalthe same fund is not a disposition for tax purposes, so nogains the fund earned for the whole year. That means you’llcapital gain or loss will result.end up paying tax on fund earnings that you had little or no
benefit from.Calculating adjusted cost base
We’ll issue a tax slip to you each year that shows you howYour capital gain or loss for tax purposes is the differencemuch of each type of income and return of capital the fundbetween the amount you receive when you sell or switch yourdistributed to you. You can claim any tax credits that apply tounits and the adjusted cost base of those units, less any coststhose earnings. For example, if the fund’s distributions includeof the sale.Canadian dividend income, you’ll qualify for that tax credit as
provided by the Tax Act. In general, the aggregate adjusted cost base of your unitsequals:
Capital gains (or losses) you realize) your initial investment, plus
In general, you must also include in computing your income ) additional investments, plusone half of any capital gains you realize from selling or
) reinvested distributions, minusswitching your units. You will have a capital gain if your sale
) any return of capital distributions, minusproceeds, less any costs of the sale, are more than theadjusted cost base of your units. You will have a capital loss if ) the adjusted cost base of any previous redemptions.your sale proceeds, less any costs of the sale, are less than the
You should keep detailed records of the purchase cost of youradjusted cost base of your units. You may use capital losses
investments and distributions you receive on those units soyou realize to offset capital gains.
you can calculate their adjusted cost base. You may want toIf you hold your units in a Scotia Asset Allocation Service, you get advice from a tax expert.may realize capital gains or losses when your portfolio isrebalanced for you.
What are your legal rights?Securities legislation in some provinces gives you the right to and get your money back, or to make a claim for damages, ifwithdraw from an agreement to buy mutual funds within two the simplified prospectus, annual information form or financialbusiness days of receiving the simplified prospectus, or to statements misrepresent any facts about the fund. These rightscancel your purchase within 48 hours of receiving confirmation must usually be exercised within certain time limits.of your order.
For more information, refer to the securities legislation of yourSecurities legislation in some provinces and territories also province or territory or consult your lawyer.allows you to cancel an agreement to buy mutual fund units
Additional informationCertain funds obtained relief from the Canadian securities Advisors to review the funds’ purchases, sales and continuedregulators to invest in common shares of The Bank of Nova holdings of common shares of The Bank of Nova Scotia. TheScotia. Eric F. Kirzner, Robert S. Bell and D. Murray Paton members of the Board of Advisors are independent from andhave been appointed members of an Independent Board of not associates or affiliates of Scotia Securities Inc., The Bank
184

of Nova Scotia or any of the funds’ portfolio advisors. TheBoard of Advisors must act in the best interests of the funds’unitholders. The Board of Advisors shall review, at leastquarterly, a fund’s investments in common shares of The Bankof Nova Scotia and must be satisfied that a decision to buy,sell or hold common shares of The Bank of Nova Scotia is inthe best interests of a fund, is made free from any influence ofThe Bank of Nova Scotia and without taking into account anyconsideration relevant to The Bank of Nova Scotia or itsassociates or affiliates, and that the fund’s holdings of TheBank of Nova Scotia common shares do not exceed thelimitations of applicable legislation. The Board of Advisorsmust report the results of its reviews to us at least quarterlyand must advise the securities regulators if it determines thata decision was not made in accordance with the foregoingrequirements or if any condition of the regulatory relief hasnot been satisfied. Each member of the Board of Advisorsreceives, a fee for each meeting of the Board of Advisorsattended by the member and is reimbursed for reasonableexpenses incurred for the purposes of such meetings. Thesefees will be allocated among the funds in a manner consideredfair and reasonable by the Board of Advisors.
The Board of Advisors may also review other matters whensuch review is required by the Canadian securities regulatorsas a condition to the funds obtaining relief from certainregulatory requirements.
185

Notes

Notes

You can find additional information about each fund in its
annual information form, its most recently filed annual or
interim financial statements and its most recently filed
annual or interim management reports of fund perform-
ance. These documents are incorporated by reference into
this simplified prospectus. That means they legally form
part of this document just as if they were printed in it.
You can get a copy of the funds’ annual information form,
financial statements, including a statement of portfolio
transactions, and, when available, management reports
of fund performance at no charge, by calling
1 800 268-9269 (416 750-3863 in Toronto) for English, or
1 800 387-5004 for French, or by asking your mutual
fund representative. You’ll also find this simplified
prospectus, the financial statements and, when available,
the management reports of fund performance on the
Internet at www.scotiabank.com.
These documents and other information about the funds,
such as information circulars and materials contracts, are
also available at www.sedar.com.
SCOTIA SECURITIES INC.16TH FLOOR40 KING STREET WESTTORONTO, ONTARIOM5H 1H1
Scotia Mutual FundsSimplified Prospectus Dated June 10, 2005 and Amended and RestatedSimplified Prospectus Dated June 10, 2005 Amending and Restatingthe Simplified Prospectus Dated October 29, 2004, as Amended onDecember 17, 2004 and on May 27, 2005
Class A and Class F units (unless otherwise noted) and Class I units where noted
Cash Equivalent FundsScotia T-Bill Fund (Class A units only)Scotia Premium T-Bill Fund (Class A units only)Scotia Money Market Fund (Class A and Class I units only)Scotia CanAm® U.S. $ Money Market Fund (Class A units only)
Income FundsScotia Canadian Bond Index Fund (Class I units available)Scotia Mortgage Income Fund (Class I units available)Scotia Canadian Income Fund (Class I units available)Scotia CanAm U.S. $ Income FundScotia CanGlobal Income Fund (Class I units available)
Balanced FundsScotia Diversified Monthly Income FundScotia Canadian Balanced FundScotia Total Return Fund
Scotia Selected™ FundsScotia Selected Income & Modest Growth FundScotia Selected Balanced Income & Growth FundScotia Selected Conservative Growth FundScotia Selected Conservative Growth RSP FundScotia Selected Aggressive Growth FundScotia Selected Aggressive Growth RSP Fund
Scotia Partners Portfolios®
Scotia Partners™ Income & Modest Growth PortfolioScotia Partners Balanced Income & Growth PortfolioScotia Partners Conservative Growth PortfolioScotia Partners Aggressive Growth Portfolio
Scotia Vision™ FundsScotia Vision Conservative 2010 Fund (Class A units only)Scotia Vision Aggressive 2010 Fund (Class A units only)Scotia Vision Conservative 2015 Fund (Class A units only)Scotia Vision Aggressive 2015 Fund (Class A units only)Scotia Vision Conservative 2020 Fund (Class A units only)Scotia Vision Aggressive 2020 Fund (Class A units only)Scotia Vision Conservative 2030 Fund (Class A units only)Scotia Vision Aggressive 2030 Fund (Class A units only)
Equity FundsCanadian Equity FundsScotia Canadian Stock Index Fund (Class I units available)Scotia Canadian Dividend Fund (Class I units available)Scotia Canadian Blue Chip Fund (Class I units available)Scotia Canadian Growth Fund (Class I units available)Scotia Canadian Small Cap Fund (Class I units available)Scotia Resource Fund
Foreign Equity FundsScotia American Stock Index Fund (Class I units available)Scotia American Growth Fund (Class I units available)Scotia CanAm Stock Index Fund Scotia Nasdaq Index Fund Scotia Young Investors® Fund (Class A units only)Scotia International Stock Index Fund (Class I units available) Scotia Global Growth Fund (Class I units available)Scotia European Growth FundScotia Pacific Rim Growth Fund (Class I units available)Scotia Latin American Growth Fund (Class I units available)
Capital International Series FundsCapital U.S. Large Companies FundCapital U.S. Large Companies RSP FundCapital U.S. Small Companies FundCapital U.S. Small Companies RSP FundCapital International Large Companies FundCapital International Large Companies RSP FundCapital Global Discovery FundCapital Global Discovery RSP FundCapital Global Small Companies FundCapital Global Small Companies RSP Fund
Cert no. SW-COC-1161
® Registered trademarks of The Bank of Nova Scotia. Scotia Securities Inc. is anauthorized user of the trademarks.
TM Trademarks of The Bank of Nova Scotia. Scotia Securities Inc. is an authorizeduser of the trademarks.
Scotia Securities Inc. and Scotia Capital Inc. are corporate entities separatefrom, although wholly-owned by, The Bank of Nova Scotia. ScotiaMcLeod andScotiaMcLeod Direct Investing are divisions of Scotia Capital Inc.
2920018