scott andrews - s&p gap study 2004-2010
TRANSCRIPT

S&P 500 ETF
“SPY”
Gap Study: 2004 – 2010
Copyright 2011, Master The Gap, Inc.

Copyright 2011, Master The Gap, Inc.
Disclaimer
This material is intended for educational purposes only and is believed to be accurate, but its accuracy is not guaranteed. Trading and investing has large potential rewards and large potential risks. You must be aware of, and fully understand, these risks and be willing to accept them in order to invest in
equity, futures, options, currencies and other financial markets. Do not trade with money that you cannot afford to lose. This material is neither a
solicitation nor an offer to buy or sell equities, futures, options, or currencies. No representation is being made that any account will or is likely to achieve
profits or losses similar to those discussed. The past performance of any trading system or methodology is not necessarily indicative of future results.
CFTC RULE 4.41 - HYPOTHETICAL OR SIMULATED PERFORMANCE RESULTS HAVE CERTAIN
LIMITATIONS. UNLIKE AN ACTUAL PERFORMANCE RECORD, SIMULATED RESULTS DO NOT REPRESENT ACTUAL TRADING. ALSO, SINCE THE TRADES HAVE NOT BEEN EXECUTED, THE RESULTS MAY HAVE
UNDER-OR-OVER COMPENSATED FOR THE IMPACT, IF ANY, OF CERTAIN MARKET FACTORS, SUCH AS LACK OF LIQUIDITY. SIMULATED TRADING PROGRAMS IN GENERAL ARE ALSO SUBJECT TO THE FACT THAT THEY ARE DESIGNED WITH THE BENEFIT OF HINDSIGHT. NO REPRESENTATION IS BEING MADE THAT ANY ACCOUNT WILL OR IS LIKELY TO ACHIEVE PROFIT OR LOSSES SIMILAR TO THOSE SHOWN.
Use this information at your own risk!!

Copyright 2011, Master The Gap, Inc.
Table of Contents Page #
• Introduction 4
• Testing Parameters 5
• Performance Summary – 1 year 6
• Equity Curve – 1 year 7
• Performance Summary – 7 year 8
• Results by Year 9
• Results by Month 10-11
• Equity Curve – 7yr 12
• By Day of Week 13
• By Day of Month 14
• By Size of Gap 15-17
• By Market Condition 18
• By Opening Location (i.e. “gap zone”) 19-22
• By Stop Size 23-24
• Stop/Target as % of Gap Size 25
• Summary 26-27
• Glossary 28-30

How to Use This Research
Do:
Create a gap trading plan using historical data as a guideline
Focus on avoiding the riskiest scenarios
Remember: “high probability” does not equal “certainty”
Focus on largest sample sizes and use great caution with small sample sizes
Don’t:
Bet the farm on this data!
Rely on small sample sizes
Over-interpret the data
Expect the future to perfectly reflect the past
Focus on scenarios based solely on expected profit – win rate should be considered since it is what helps you "stick with your plan long term"
Copyright 2011, Master The Gap, Inc.
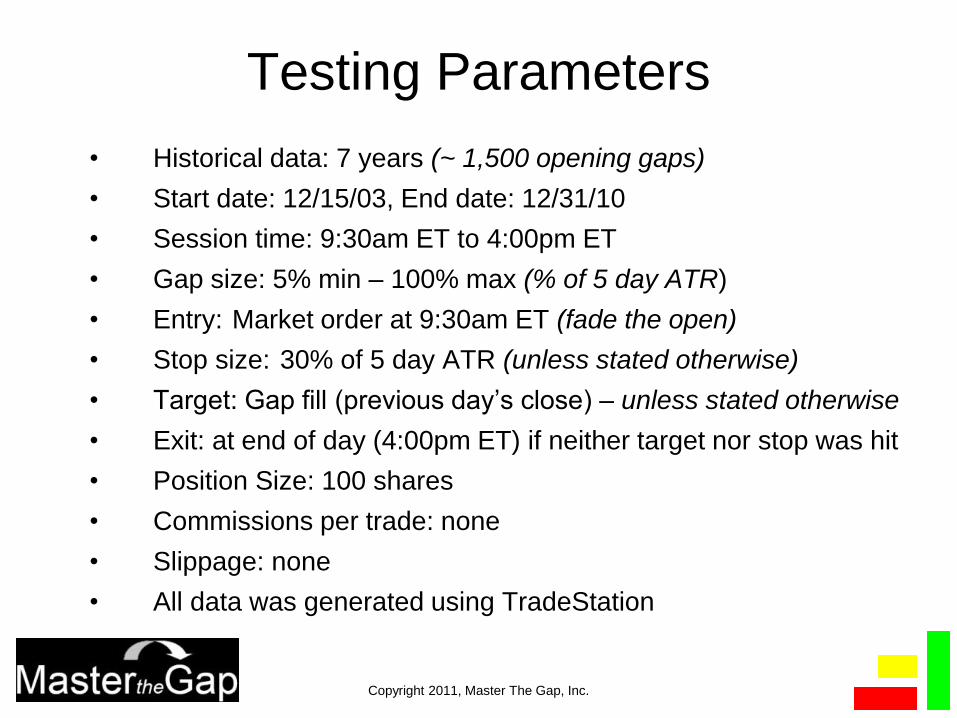
Testing Parameters
• Historical data: 7 years (~ 1,500 opening gaps)
• Start date: 12/15/03, End date: 12/31/10
• Session time: 9:30am ET to 4:00pm ET
• Gap size: 5% min – 100% max (% of 5 day ATR)
• Entry: Market order at 9:30am ET (fade the open)
• Stop size: 30% of 5 day ATR (unless stated otherwise)
• Target: Gap fill (previous day’s close) – unless stated otherwise
• Exit: at end of day (4:00pm ET) if neither target nor stop was hit
• Position Size: 100 shares
• Commissions per trade: none
• Slippage: none
• All data was generated using TradeStation
Copyright 2011, Master The Gap, Inc.

Performance Summary – 1yr
Copyright 2011, Master The Gap, Inc.

Equity Curve – 1yr
Copyright 2011, Master The Gap, Inc.

Performance Summary – 7yr
Copyright 2011, Master The Gap, Inc.

Results by Year
Copyright 2011, Master The Gap, Inc.

Results by Month
Copyright 2011, Master The Gap, Inc.

Results by Month
Copyright 2011, Master The Gap, Inc.

Equity Curve – 7yr
Copyright 2011, Master The Gap, Inc.

By Day of Week
Copyright 2011, Master The Gap, Inc.
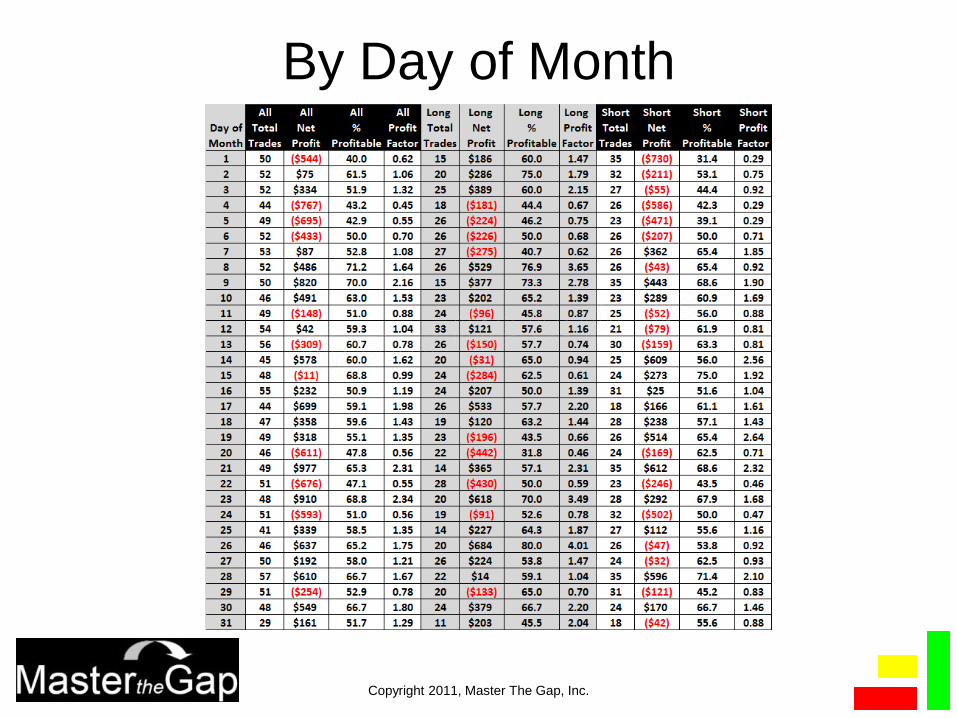
By Day of Month
Copyright 2011, Master The Gap, Inc.

By Gap Size: Small & Medium (5 - 40% of 5 day ATR)
Copyright 2011, Master The Gap, Inc.

By Gap Size: Large (40 - 100% of 5 day ATR)
Copyright 2011, Master The Gap, Inc.

By Gap Size: Monster (> 100% of 5 day ATR)
Copyright 2011, Master The Gap, Inc.

By Market Condition: Above/Below 10 Day SMA
Copyright 2011, Master The Gap, Inc.

By “Gap Zone” (opening location)
Definition: Location of the opening price
gap relative to the prior day’s
key price levels:
• Open
• High
• Low
• Close
“Location, location, location”… applies to gaps too!
High
Close
Open
Low
Copyright 2011, Master The Gap, Inc.

Why Gap Zones Work (opening location)
High
Close
Open
Low
Copyright 2011, Master The Gap, Inc.
They inherently incorporate:
Proven support & resistance
Short term trend
Gap size
Trader psychology

Gap ZoneSM Map
(prior day was Up,
next day gap opens between
prior Close and Open)
Copyright 2011, Master The Gap, Inc.
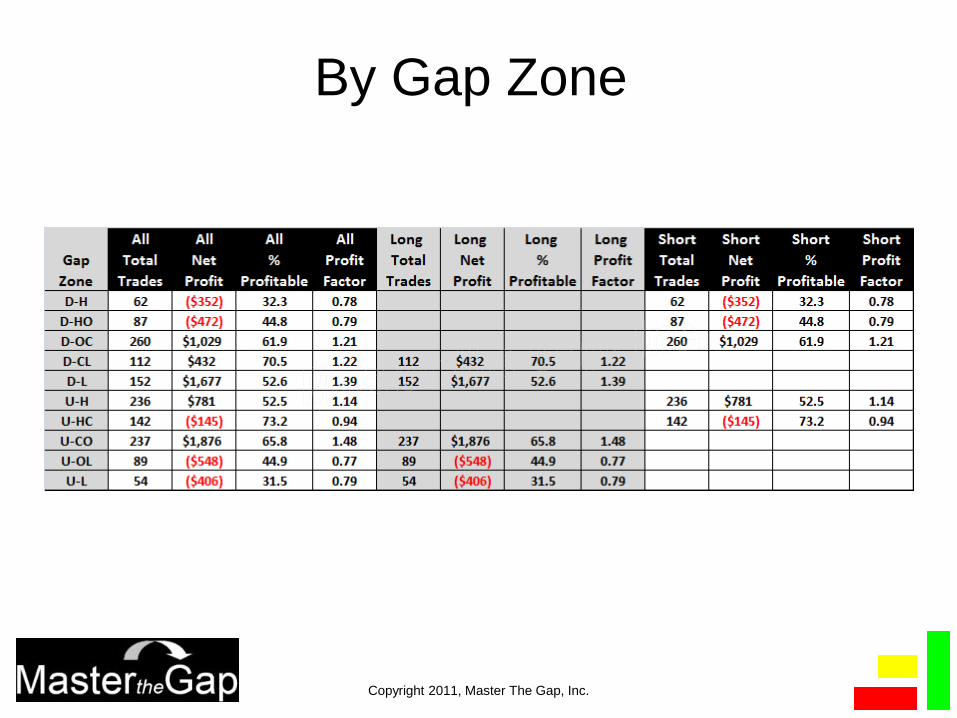
By Gap Zone
Copyright 2011, Master The Gap, Inc.

By Stop Size (% of 5 Day ATR)
Target = Gap Fill / Prior Close
Copyright 2011, Master The Gap, Inc.

By Stop Size (% of 5 Day ATR)
Target = 15% of 5 Day ATR Beyond Gap Fill
Copyright 2011, Master The Gap, Inc.

Stop & Target as % of Gap Size
Copyright 2011, Master The Gap, Inc.

SPY Summary
Observation: Down gaps are more profitable than up gaps
Idea: Reduce position size for up gaps
Observation: March and August are riskier months
Idea: Reduce position size in those months
Observation: Up gaps on Mon/Wed are riskier
Idea: Don’t trade up gaps on those days
Observation: Beginning of the month up gaps are riskier
Idea: Don’t trade up gaps at the beginning of the month
Observation: Small/Medium gaps outperform Large/Monster
Idea: Consider size of gap as part of your trading plan
Observation: Zone selection is important
Idea: Reduce position size or don’t trade gaps in risky zones
Copyright 2011, Master The Gap, Inc.
Final Thoughts…
This research should help create your gap trading plan. (it is not the plan)
Forward test by paper trading or using a simulator before risking your capital.
Be conservative and use your own judgment (when in doubt, sit it out!)
For Daily Gap probabilities, First Hour Range probabilities, testing tools, other research, and assistance with your trading plan, check out: www.masterthegap.com
Please credit MasterTheGap.com if referencing or using this data in anyway other than for your personal use.
Thank You & Good Gappin’!
Copyright 2011, Master The Gap, Inc.

Glossary ATR: Average True Range. ATR is a useful calculation for measuring the volatility of a market. It is calculated
by measuring the distance between the extreme high and low of a day, including the prior closing price (if it is beyond the day's trading range). By incorporating the prior day close, a more accurate measurement of a market's daily movement can be determined since the overnight gaps are included.
Breakaway Gaps: These gaps occur after a period of price consolidation. They are caused by a surge of demand to buy or sell the market, typically in response to a significant event. The gaps are not filled during the same trading day (often not for many days or weeks) and are associated with above average volume. Gap traders “go with” / “follow” these opening gaps by trading in the same direction.
Common Gaps: These gaps occur throughout a market’s typical ebb and flow in response to a wide variety of events and news. They are often associated with average or below average volume and generally fill the same day. Gap traders “fade” these types of gaps by trading in the opposite direction of the gap.
Continuation (or Runaway) Gaps: These gaps occur during, and in the direction of, an ongoing trend and are generally viewed as confirmation of a trend’s strength. They are associated with above average volume and often do not fill the same day. Gap traders “go with” / “follow” these opening gaps by trading in the same direction.
Exhaustion Gaps: These gaps occur at or very near the end of a trend. They are typically associated with very high volume as the very last buyers (or sellers if the asset is in a downtrend) jump aboard a trend that is ending and are overrun by opposing market forces as prices stall and often reverse sharply that day. Gap traders “fade” these types of gaps by trading in the opposite direction of the gap.
Extended Target: This term refers to the placement of an exit price for a gap trade that is beyond or through the gap fill area (prior day/session closing price). It is often quite profitable to trade gaps using an extended target if historical data supports the probability of price continuation.
Fade: This term means to enter a trade in the opposite direction of the opening gap move. For example, to fade an "up" gap, you would "sell" / "go short." To fade a "down" gap, you would "buy" / "go long."
Copyright 2011, Master The Gap, Inc.

Glossary (continued) Futures Contract: A standardized financial obligation for a buyer to purchase an asset (or the seller to sell an
asset), such as a financial instrument or physical commodity at a pre-set future date and price. Futures are used to hedge or speculate on the price movement of an asset. While a futures contract does obligate the trader; in real life, this obligation is avoided by simply exiting the position, much like selling a stock in the equity markets would close a trade.
Gap: The most common definition of a “gap” is the difference between an asset or instrument’s opening price and its prior day closing price. This difference shows up visually on a technical price chart as an open space or “gap.” (Note: some traders define a gap as the difference between the prior day high or low and the next day’s opening price.)
Gap Down / Down Gap: An opening price that is below the prior day/session closing price.
Gap Up / Up Gap: An opening price that is above the prior day/session closing price.
Gap Fill / Close: When prices pull back from the open of a session and retrace all the way back to the prior session’s closing price, the opening gap is considered to have “filled” or “closed.”
Go With/Follow: This is a trade where you “follow" the gap by trading in the direction of the gap (as opposed to fading it.) Prices opening in some zones increase the likelihood of a continuation or breakaway gap and are less likely to fill and may be candidates for “following” the gap.
Gapper: A unique individual that has evolved beyond his/her trading peers by recognizing the superior return on time, effort and capital of the "gap fade." This elite trader can be recognized by his/her enviable lifestyle and finances
Gap Zones: The areas defined by the prior day's Open, High, Low and Close. By including the prior day's direction (open to close), gap zones can be extremely useful for segmenting, analyzing and trading opening gaps. Gap zones work well for analyzing gap setups because they inherently incorporate: support and resistance, short term trend, gap size, & trader psychology.
Go Long: This is when you buy a security in anticipation of being able to sell it later at a higher price for a profit.
Heat: This is a slang term for "maximum adverse excursion" which describes how far a trade moved away from the desired direction before becoming a winner. This is a good statistic to track for all trades.
Copyright 2011, Master The Gap, Inc.
Mini / E-Mini: An electronically traded futures contract that is equal to only a small portion of a normal futures contract. E-minis contracts are available on many indices such as the S&P 500, Dow, NASDAQ 100, and Russell 2000, as well as commodities such as oil and gold Trading E-mini contracts has many advantages for individuals, including high liquidity, low cost, tax advantages and nearly 24 hour trading.
Profit Expectancy / Expected Value (EV): In lay terms, it simply how much profit per trade one would expect to average over time (based upon historical averages) for a given set-up. The formula: (average profit per winner * probability of winning) - (average loss per loser * probability of losing). This is also known as EV or "expected value." Note: this number is far more important than just the probability of profits. It may feel good to have a high winning percentage, but it may not be profitable over the long term.
Profit Factor (PF): This is another way to measure the attractiveness of a trade set-up. It is the historical net profits of a strategy (generated by the winning trades) divided by the historical net losses of the losers. A profit factor greater than 1.0 was a money making strategy and less than 1.0 was a losing strategy. Generally, the bigger the profit factor, the greater its long term profitability and attractiveness.
Regular/ Pit Session: This term is synonymous with the “open outcry” or pit session hours for a given market, e.g. 9:30 – 16:15 EST for the S&P 500. Many markets trade nearly 24 hours a day electronically; however, the bulk of volume is transacted during their “regular” trading hours. For this reason, the regular session’s open, high, low, and closing prices carry great significance for most traders and their systems.
Short: This is when you sell a security with anticipation of buying it back at a lower price for a profit.
SMA: Simple Moving Average – useful for segmenting and analyzing historical probabilities using daily data.
Win Rate: This term describe the percentage of trades for a given setup that hit their target or could have been exited at the end of the day for a profit.
Zone: The areas defined by the prior day's Open, High, Low and Close. By including the prior day's direction (open to close), gap zones can be extremely useful for segmenting, analyzing and trading opening gaps. Gap zones work well for analyzing gap setups because they inherently incorporate: support and resistance, short term trend, gap size, & trader psychology.
Glossary (continued)
Copyright 2011, Master The Gap, Inc.