scott biersdorff, chee wai lee, allen d. malony, sameer shende, wyatt spear...
TRANSCRIPT
Scott Biersdorff, Chee Wai Lee, Allen D. Malony, Sameer Shende, Wyatt Spear{scottb,cheelee,malony,shende,wspear}@cs.uoregon.edu
Dept. Computer and Information Science
Performance Research Laboratory
University of Oregon
TAU Potpourriand Working with Open Components,
Interfaces, and Environments
Potpourri: a mixture of dried petals and spices placed in a bowl, origin 17th century,
from French, literally ‘rotten pot’
TAU PotpourriCScADS 2010
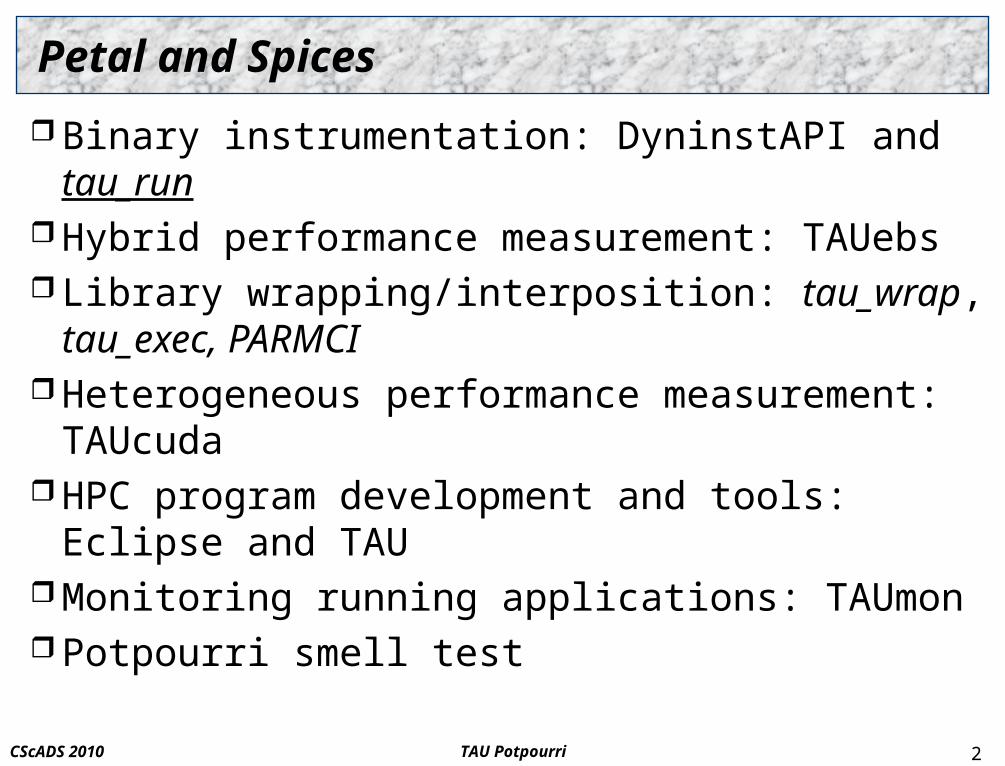
Petal and Spices
Binary instrumentation: DyninstAPI and tau_run Hybrid performance measurement: TAUebs Library wrapping/interposition: tau_wrap, tau_exec,
PARMCI Heterogeneous performance measurement: TAUcuda HPC program development and tools: Eclipse and TAU Monitoring running applications: TAUmon Potpourri smell test
2
TAU PotpourriCScADS 2010
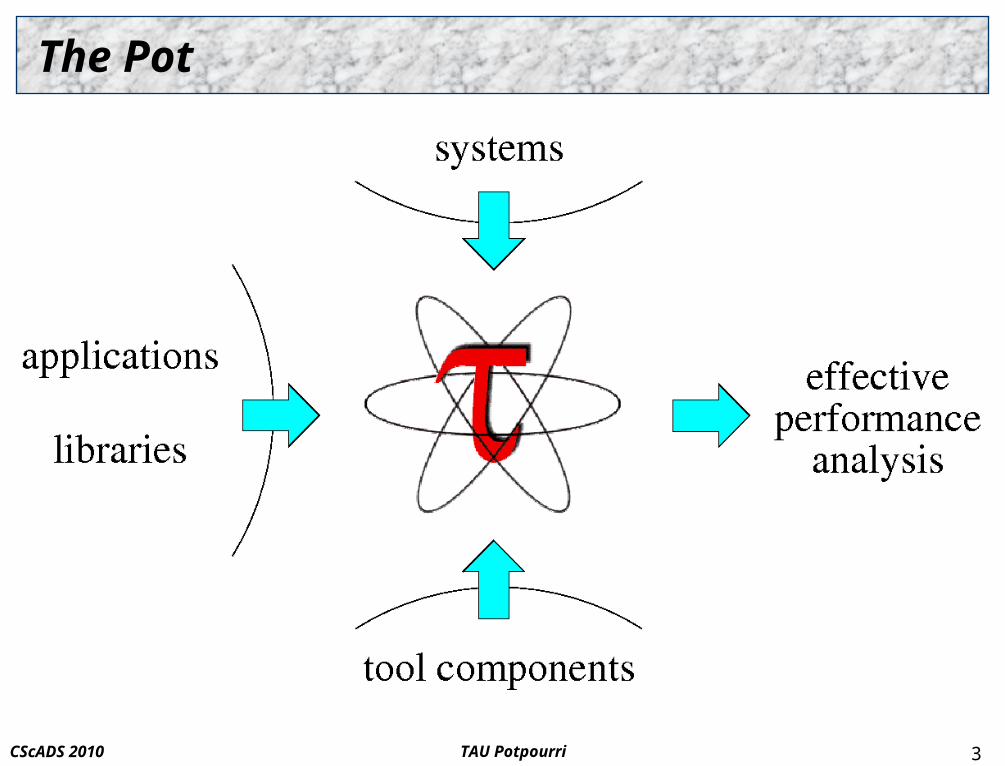
The Pot
3
TAU PotpourriCScADS 2010
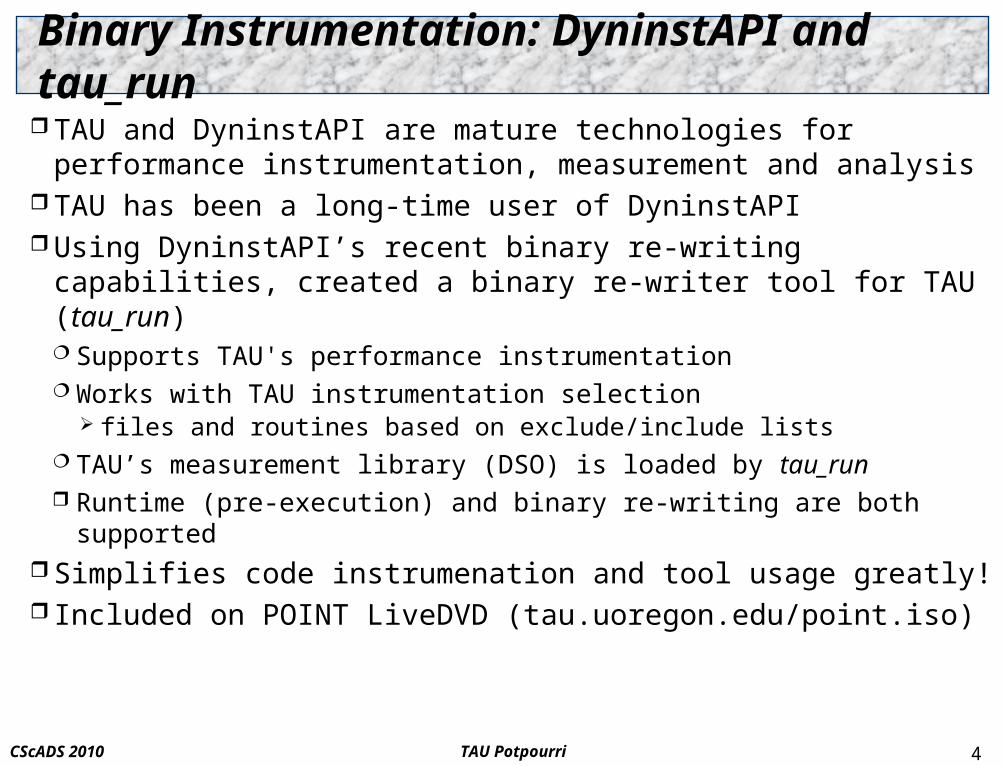
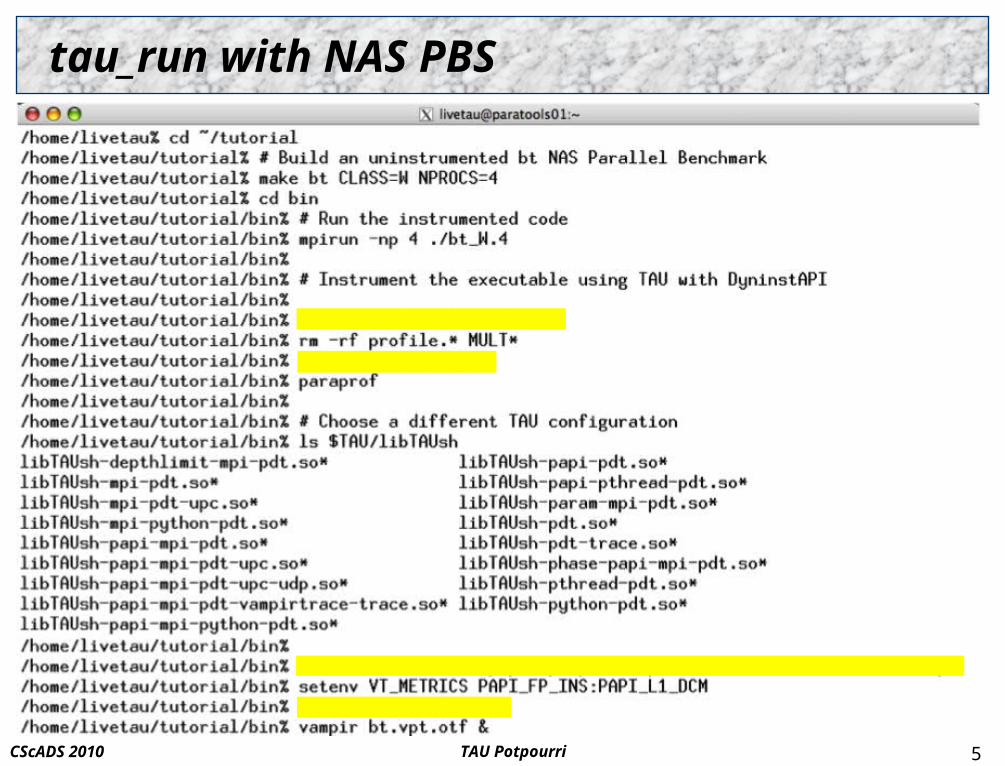
Binary Instrumentation: DyninstAPI and tau_run
TAU and DyninstAPI are mature technologies for performance instrumentation, measurement and analysis
TAU has been a long-time user of DyninstAPI Using DyninstAPI’s recent binary re-writing capabilities,
created a binary re-writer tool for TAU (tau_run) Supports TAU's performance instrumentation Works with TAU instrumentation selection
files and routines based on exclude/include lists TAU’s measurement library (DSO) is loaded by tau_run Runtime (pre-execution) and binary re-writing are both supported
Simplifies code instrumenation and tool usage greatly! Included on POINT LiveDVD (tau.uoregon.edu/point.iso)
4
TAU PotpourriCScADS 2010
tau_run with NAS PBS
5
TAU PotpourriCScADS 2010
Going Forward
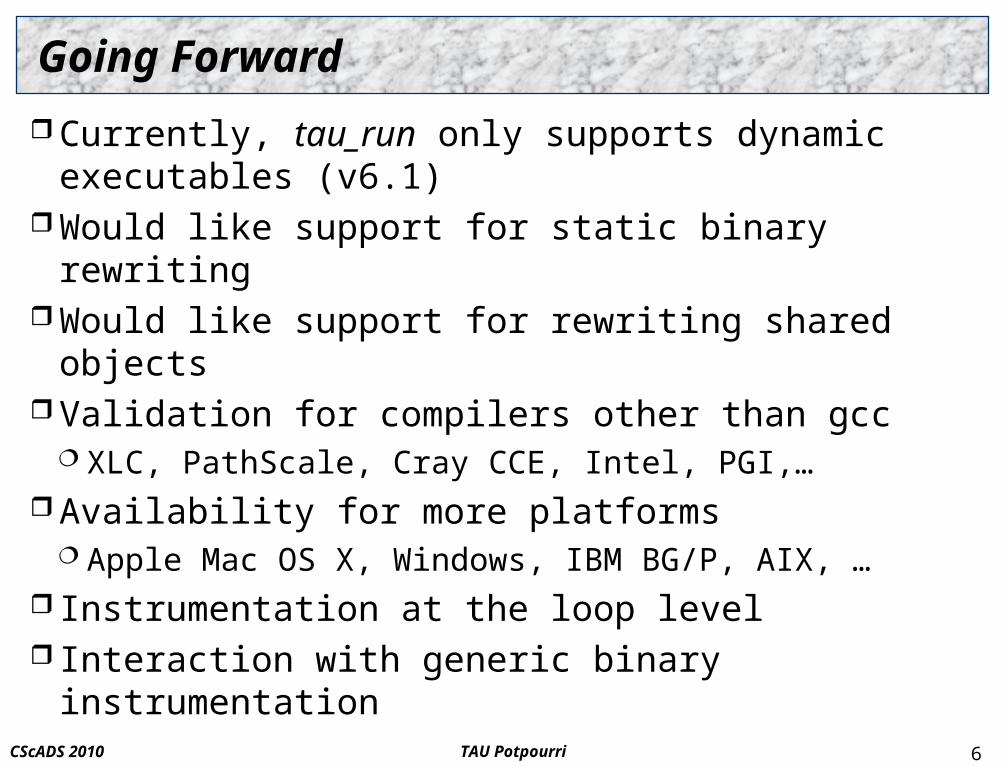
Currently, tau_run only supports dynamic executables (v6.1)
Would like support for static binary rewriting Would like support for rewriting shared objects Validation for compilers other than gcc
XLC, PathScale, Cray CCE, Intel, PGI,… Availability for more platforms
Apple Mac OS X, Windows, IBM BG/P, AIX, … Instrumentation at the loop level Interaction with generic binary instrumentation
6
TAU PotpourriCScADS 2010
Hybrid Performance Measurement: TAUebs
7
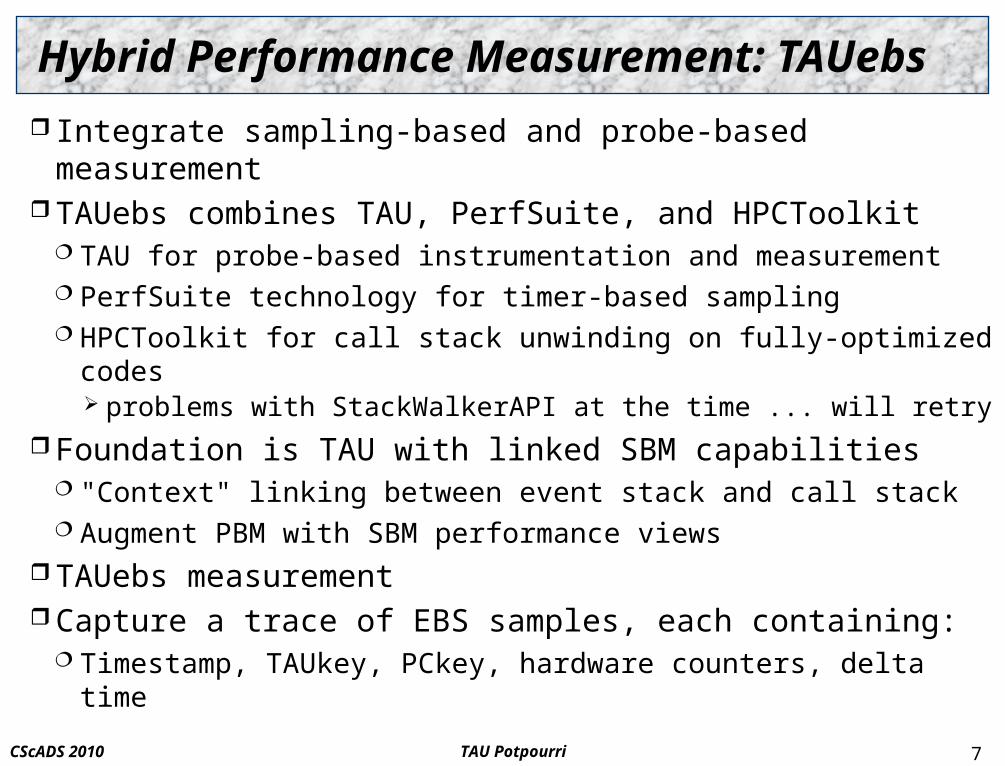
Integrate sampling-based and probe-based measurement TAUebs combines TAU, PerfSuite, and HPCToolkit
TAU for probe-based instrumentation and measurement PerfSuite technology for timer-based sampling HPCToolkit for call stack unwinding on fully-optimized codes
problems with StackWalkerAPI at the time ... will retry
Foundation is TAU with linked SBM capabilities "Context" linking between event stack and call stack Augment PBM with SBM performance views
TAUebs measurement Capture a trace of EBS samples, each containing:
Timestamp, TAUkey, PCkey, hardware counters, delta time
TAU PotpourriCScADS 2010
TAUebs Data Analysis (Profile)
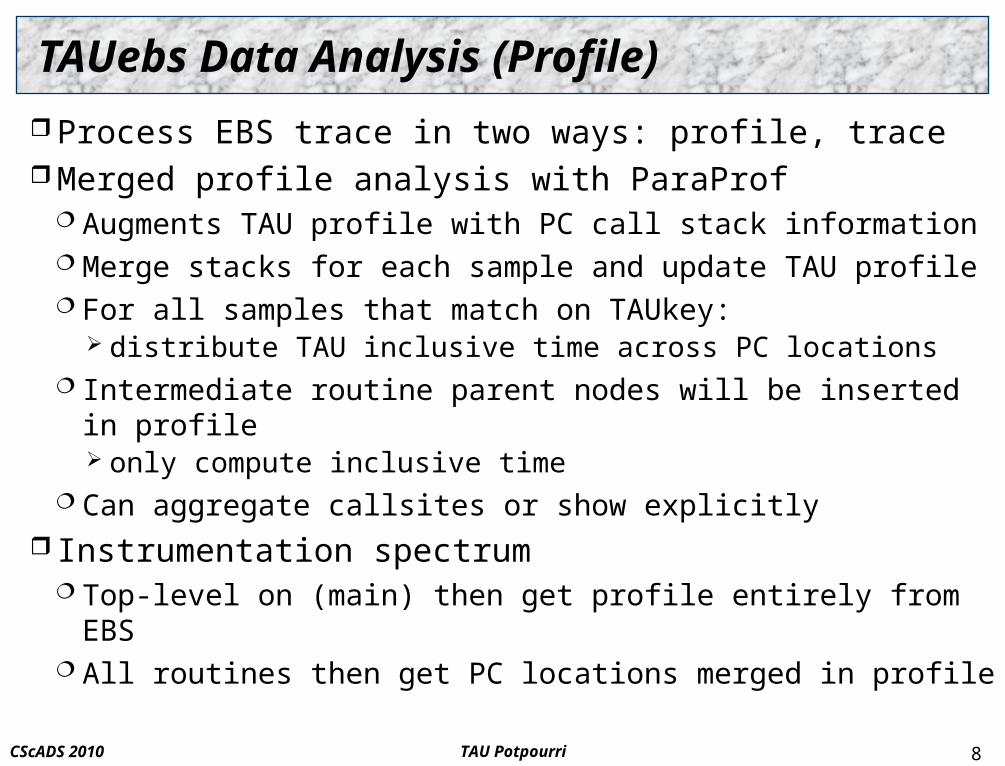
Process EBS trace in two ways: profile, trace Merged profile analysis with ParaProf
Augments TAU profile with PC call stack information Merge stacks for each sample and update TAU profile For all samples that match on TAUkey:
distribute TAU inclusive time across PC locations Intermediate routine parent nodes will be inserted in profile
only compute inclusive time Can aggregate callsites or show explicitly
Instrumentation spectrum Top-level on (main) then get profile entirely from EBS All routines then get PC locations merged in profile
8
TAU PotpourriCScADS 2010
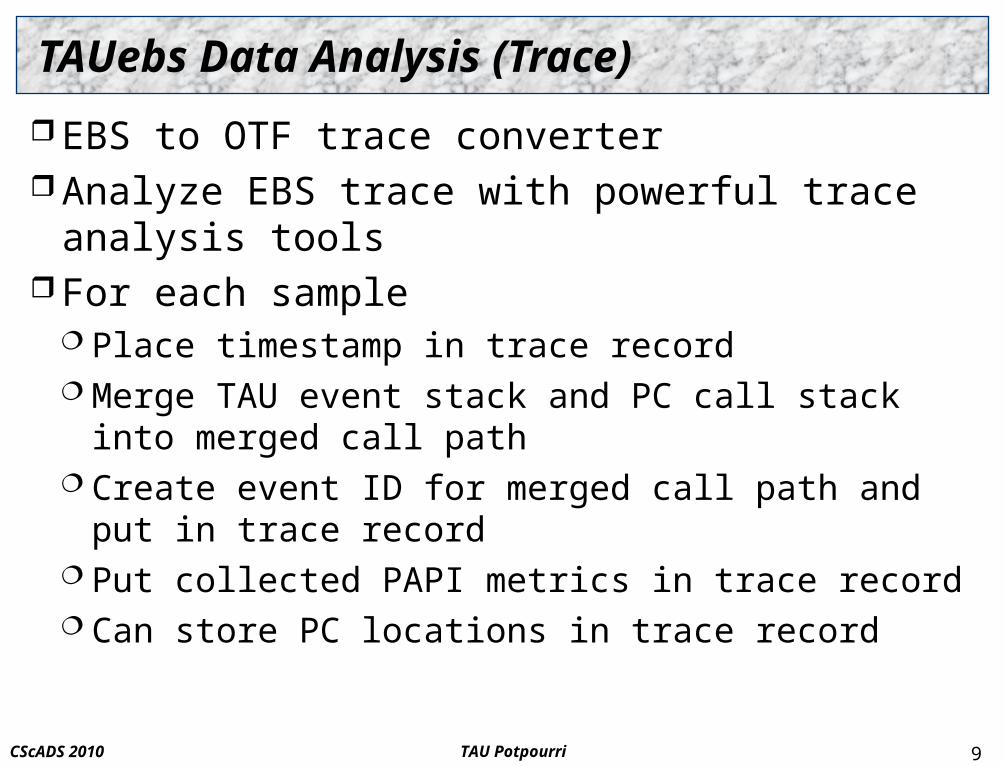
TAUebs Data Analysis (Trace)
EBS to OTF trace converter Analyze EBS trace with powerful trace analysis tools For each sample
Place timestamp in trace record Merge TAU event stack and PC call stack into merged call path Create event ID for merged call path and put in trace record Put collected PAPI metrics in trace record Can store PC locations in trace record
9
TAU PotpourriCScADS 2010
Real World Examples
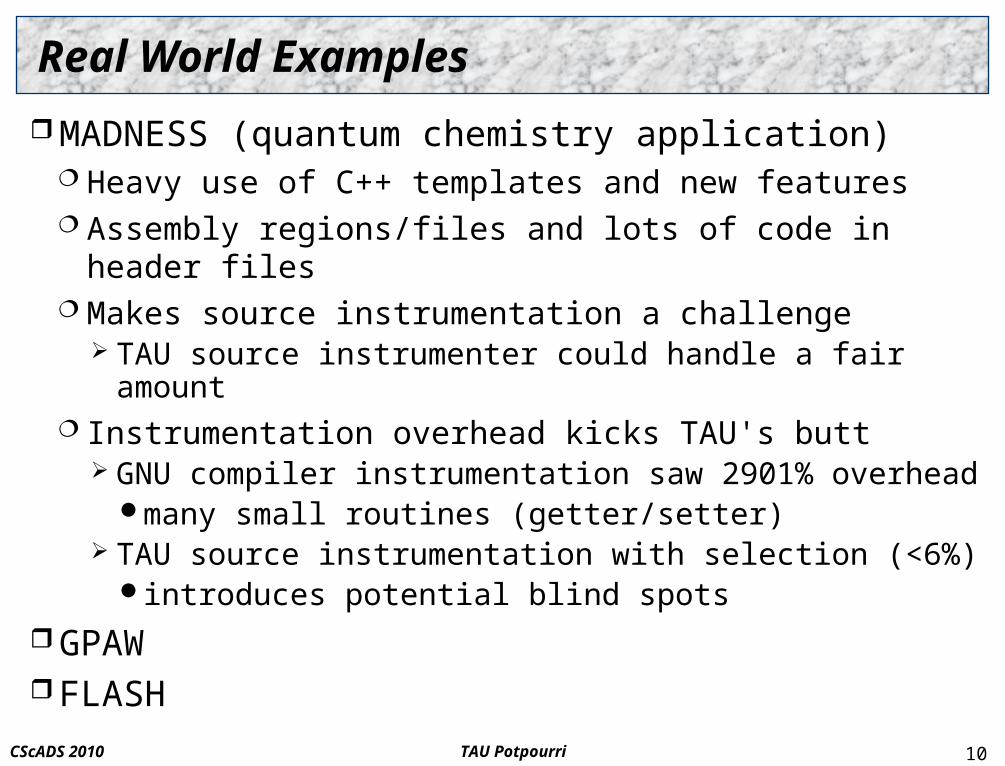
MADNESS (quantum chemistry application) Heavy use of C++ templates and new features Assembly regions/files and lots of code in header files Makes source instrumentation a challenge
TAU source instrumenter could handle a fair amount Instrumentation overhead kicks TAU's butt
GNU compiler instrumentation saw 2901% overheadmany small routines (getter/setter)
TAU source instrumentation with selection (<6%)introduces potential blind spots
GPAW FLASH
10
TAU PotpourriCScADS 2010
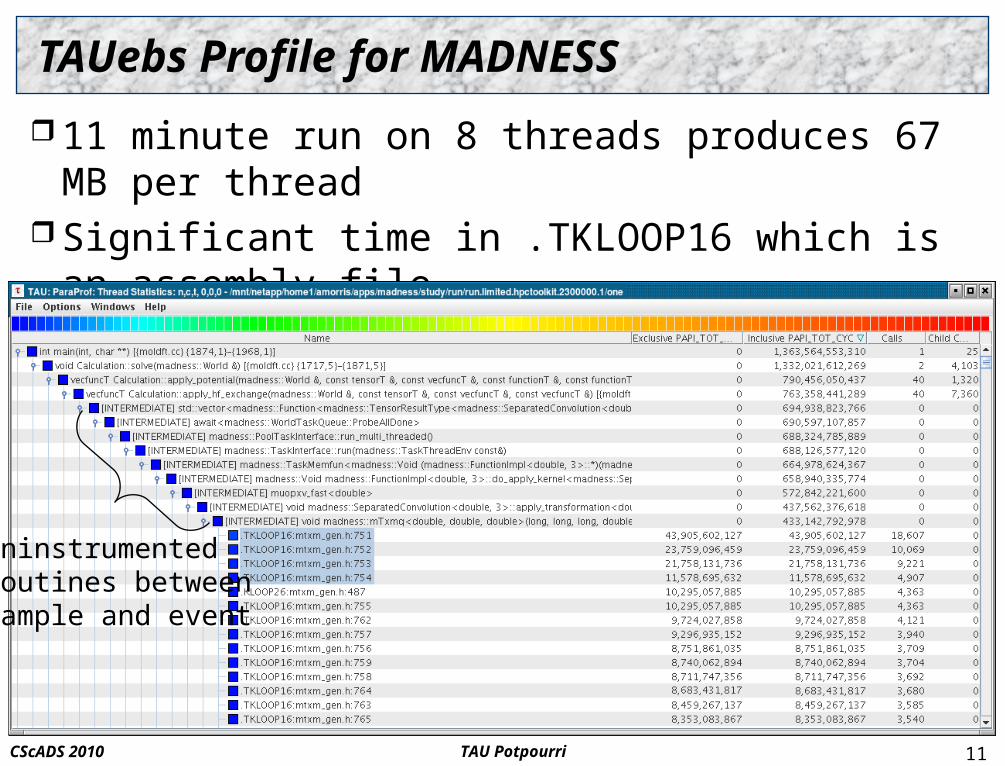
TAUebs Profile for MADNESS
11 minute run on 8 threads produces 67 MB per thread Significant time in .TKLOOP16 which is an assembly file Profile for each thread
11
uninstrumentedroutines betweensample and event
TAU PotpourriCScADS 2010
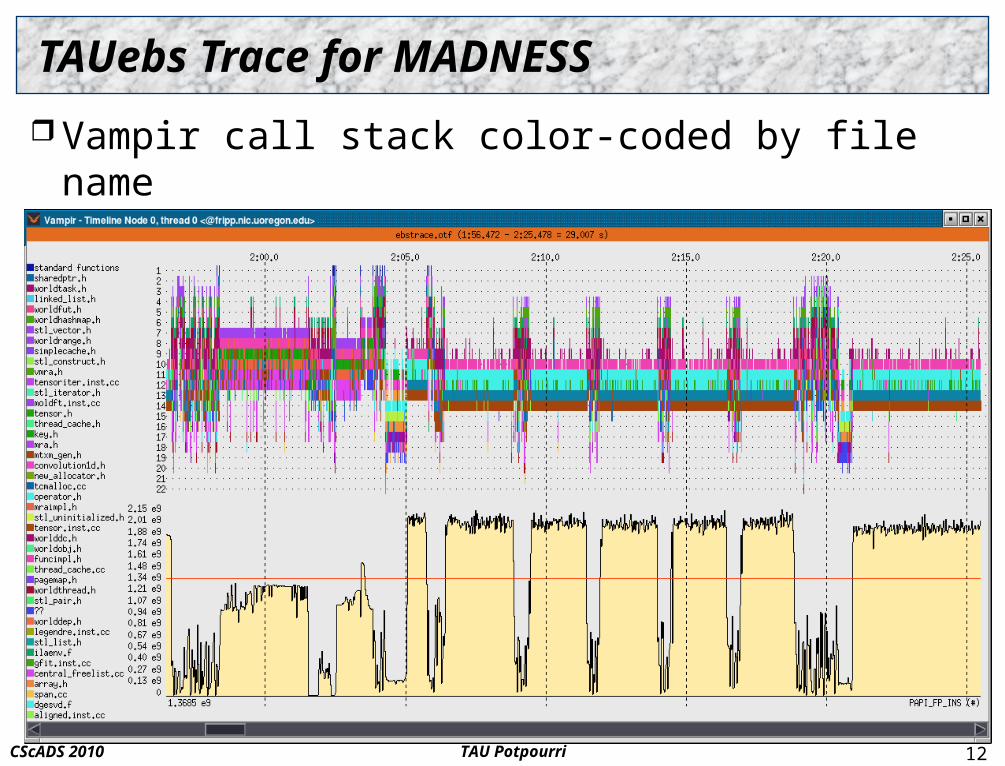
TAUebs Trace for MADNESS
Vampir call stack color-coded by file name Flops rate
12
TAU PotpourriCScADS 2010
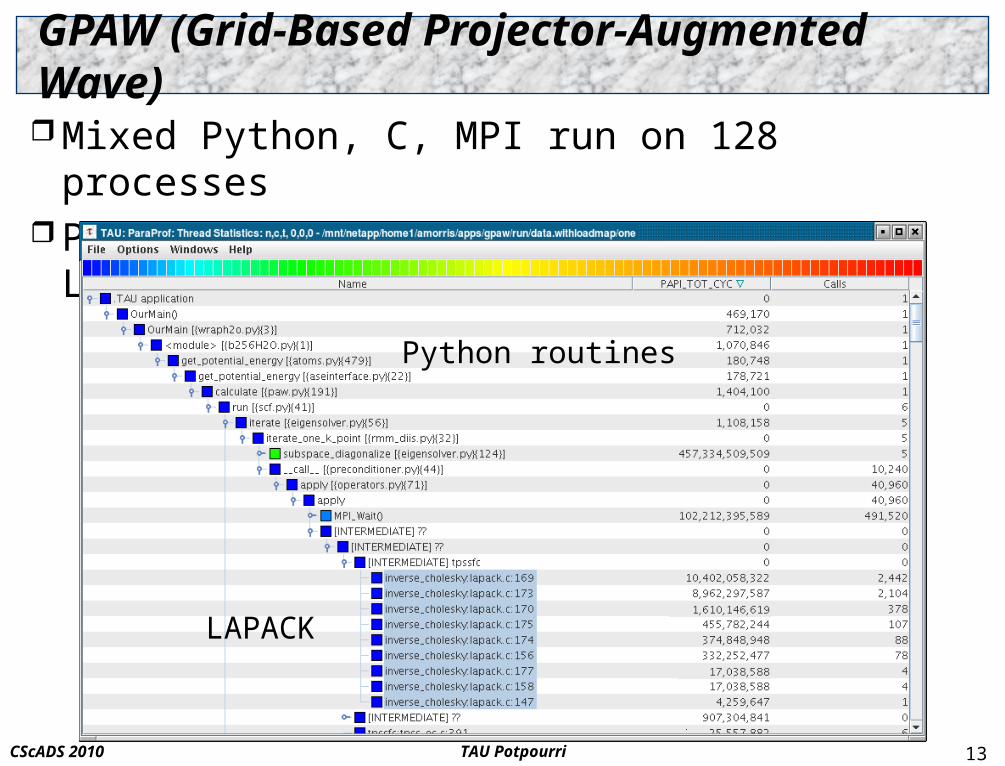
GPAW (Grid-Based Projector-Augmented Wave)
Mixed Python, C, MPI run on 128 processes Python performance interface and LD_PRELOAD
13
Python routines
LAPACK
TAU PotpourriCScADS 2010
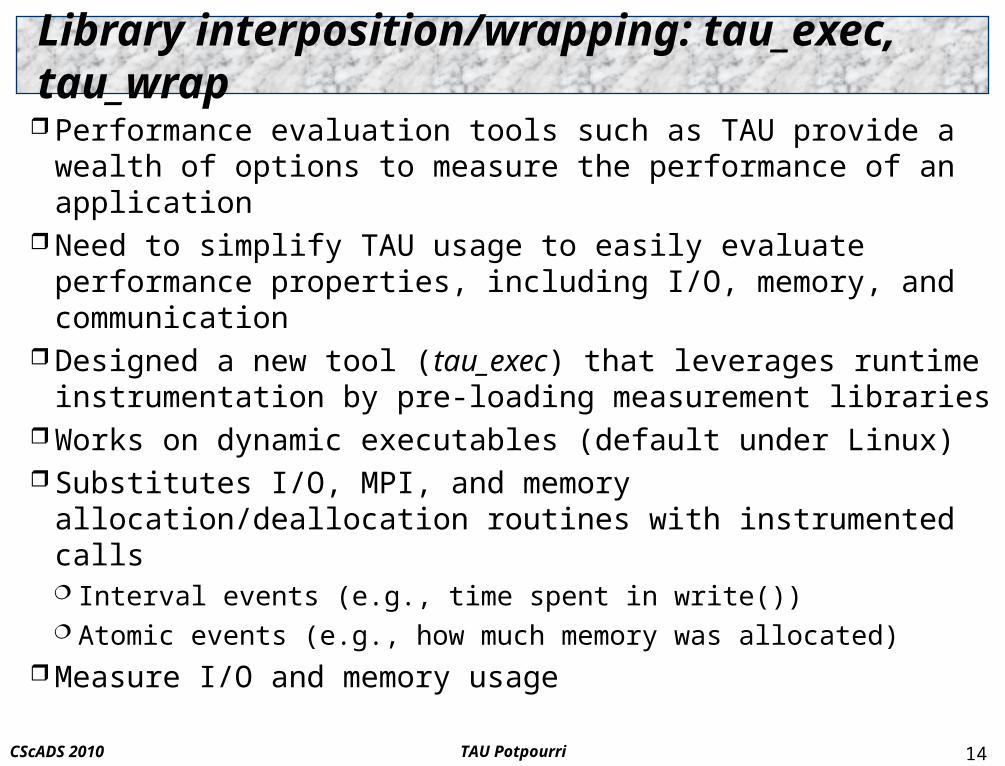
Library interposition/wrapping: tau_exec, tau_wrap
Performance evaluation tools such as TAU provide a wealth of options to measure the performance of an application
Need to simplify TAU usage to easily evaluate performance properties, including I/O, memory, and communication
Designed a new tool (tau_exec) that leverages runtime instrumentation by pre-loading measurement libraries
Works on dynamic executables (default under Linux) Substitutes I/O, MPI, and memory allocation/deallocation
routines with instrumented calls Interval events (e.g., time spent in write()) Atomic events (e.g., how much memory was allocated)
Measure I/O and memory usage14
TAU PotpourriCScADS 2010
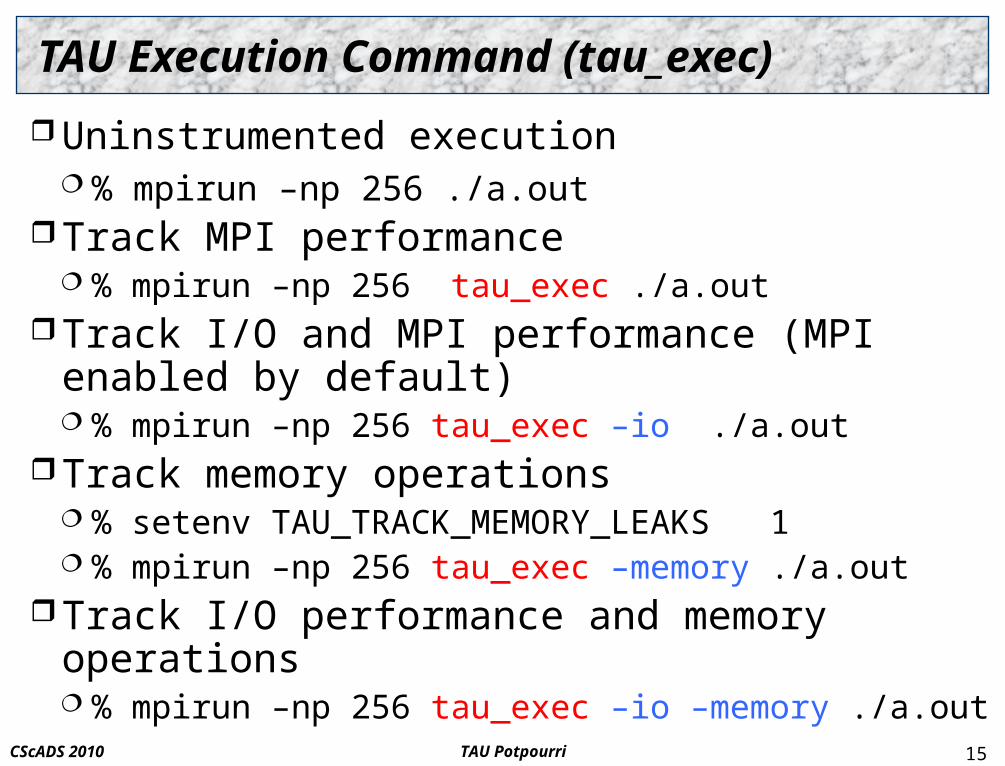
TAU Execution Command (tau_exec)
Uninstrumented execution % mpirun –np 256 ./a.out
Track MPI performance % mpirun –np 256 tau_exec ./a.out
Track I/O and MPI performance (MPI enabled by default) % mpirun –np 256 tau_exec –io ./a.out
Track memory operations % setenv TAU_TRACK_MEMORY_LEAKS 1 % mpirun –np 256 tau_exec –memory ./a.out
Track I/O performance and memory operations % mpirun –np 256 tau_exec –io –memory ./a.out
15
TAU PotpourriCScADS 2010
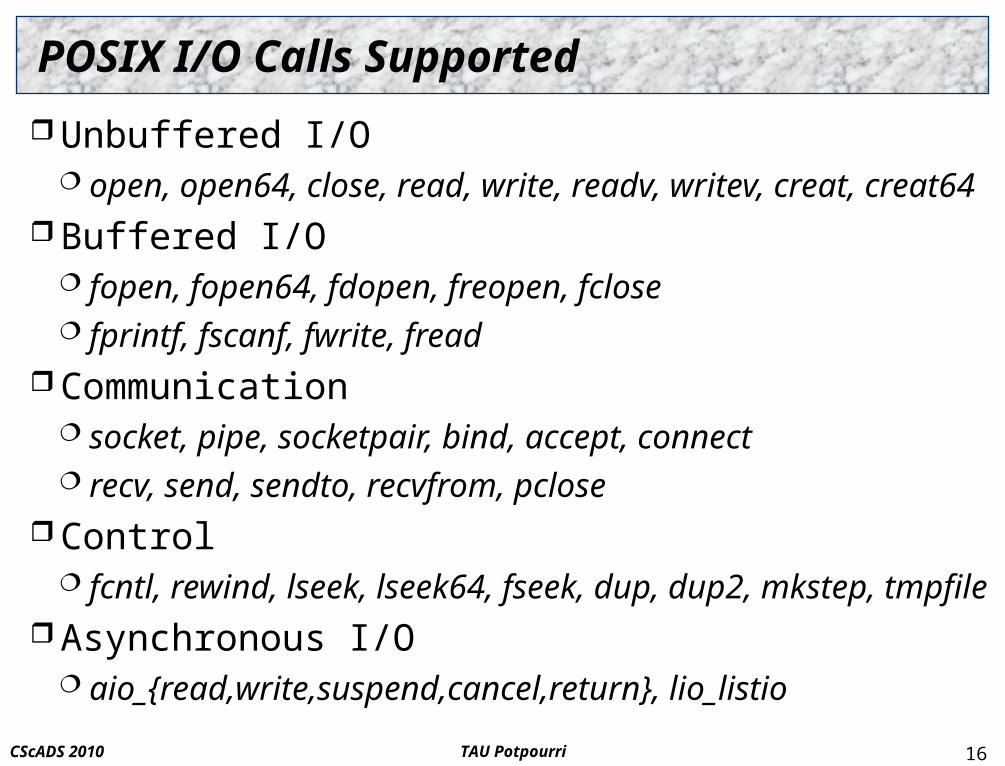
POSIX I/O Calls Supported
Unbuffered I/O open, open64, close, read, write, readv, writev, creat, creat64
Buffered I/O fopen, fopen64, fdopen, freopen, fclose fprintf, fscanf, fwrite, fread
Communication socket, pipe, socketpair, bind, accept, connect recv, send, sendto, recvfrom, pclose
Control fcntl, rewind, lseek, lseek64, fseek, dup, dup2, mkstep, tmpfile
Asynchronous I/O aio_{read,write,suspend,cancel,return}, lio_listio
16
TAU PotpourriCScADS 2010
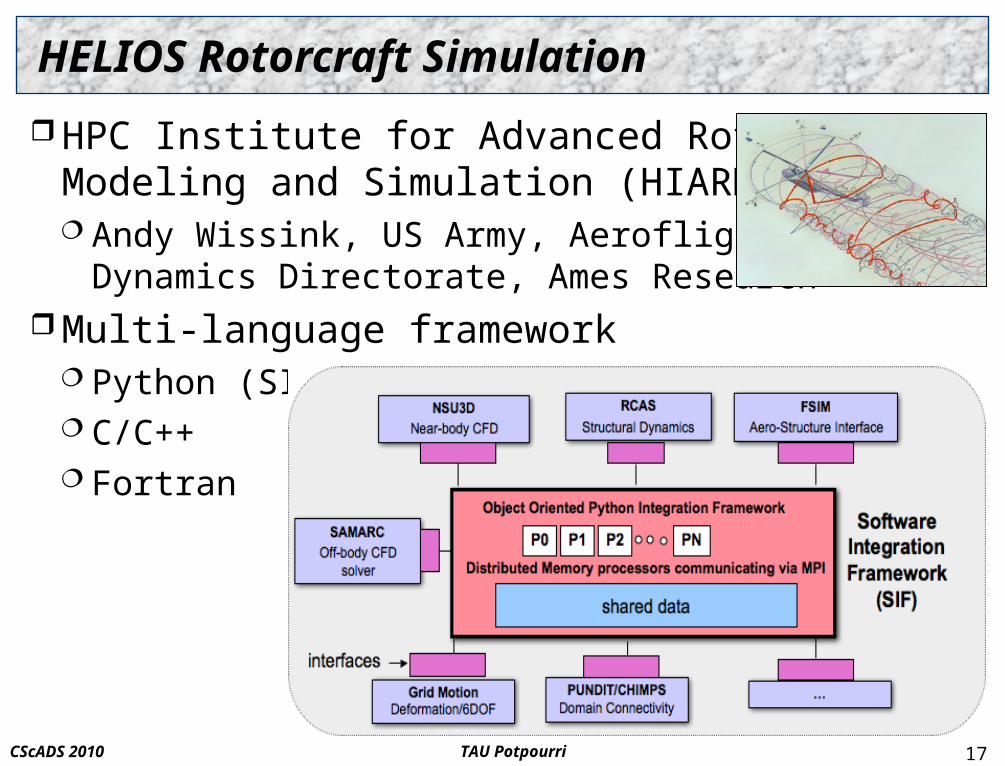
HELIOS Rotorcraft Simulation
HPC Institute for Advanced RotorcraftModeling and Simulation (HIARMS) Andy Wissink, US Army, Aeroflight
Dynamics Directorate, Ames Research Multi-language framework
Python (SIF) C/C++ Fortran
17
TAU PotpourriCScADS 2010
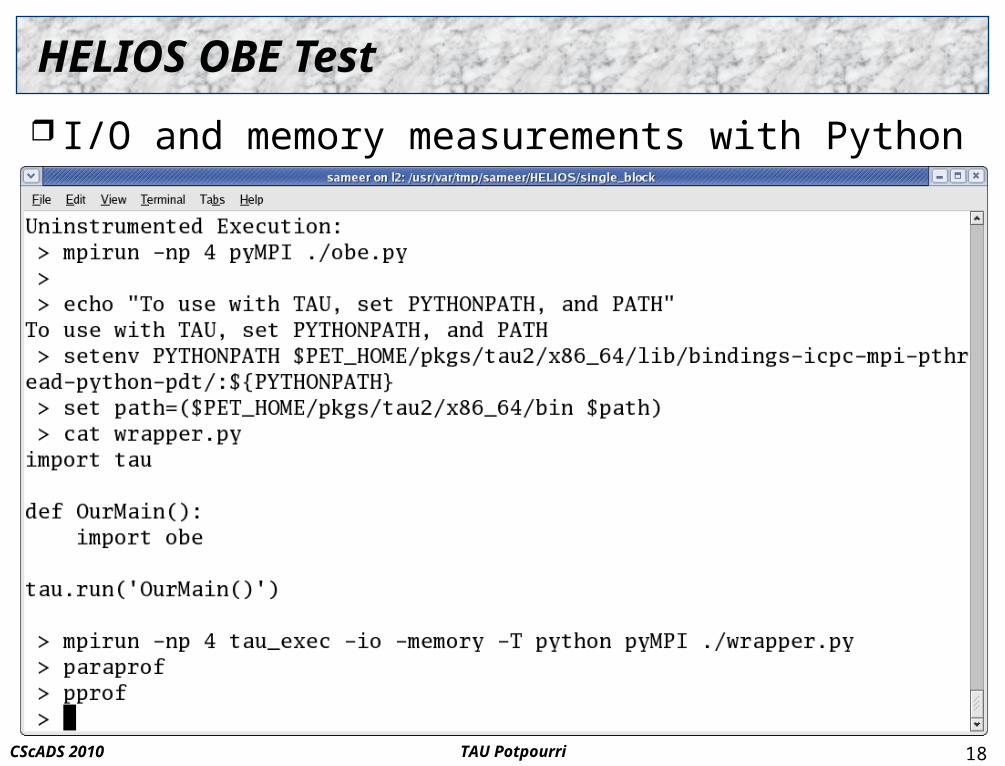
HELIOS OBE Test
I/O and memory measurements with Python wrapper
18
TAU PotpourriCScADS 2010
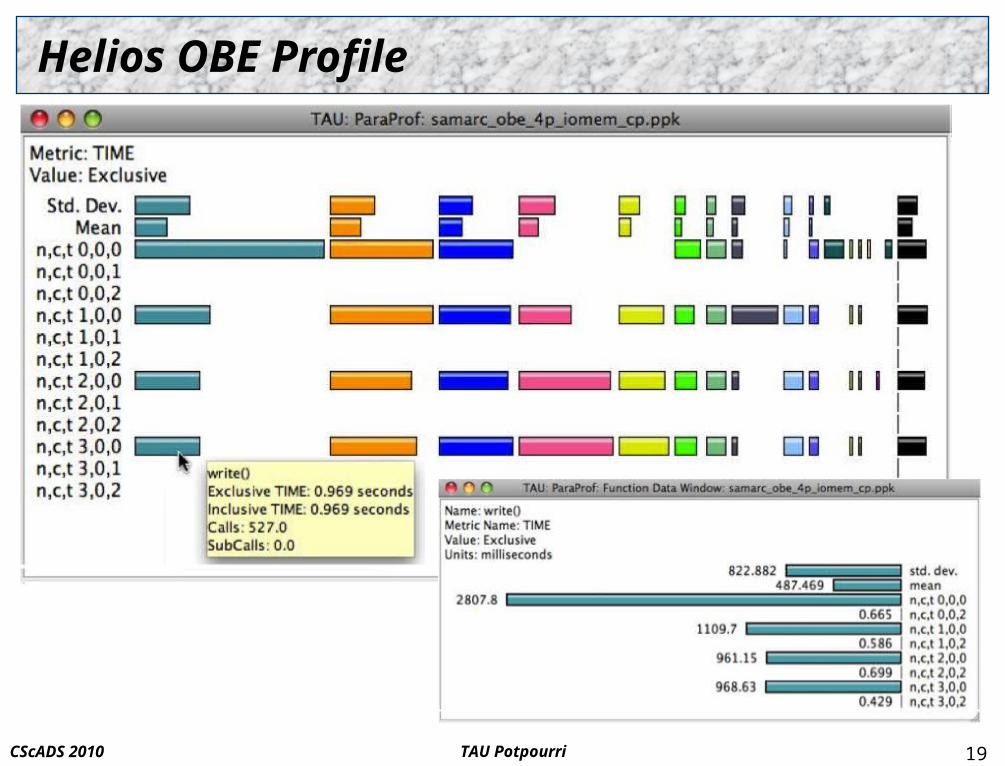
Helios OBE Profile
19
TAU PotpourriCScADS 2010
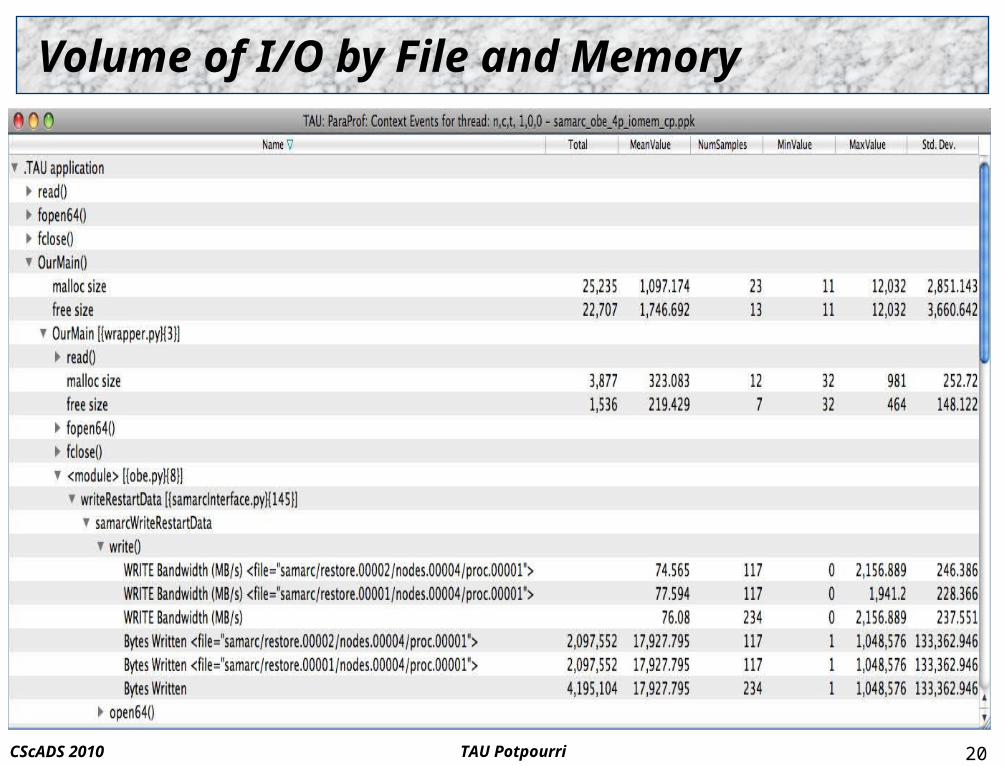
Volume of I/O by File and Memory
20
TAU PotpourriCScADS 2010
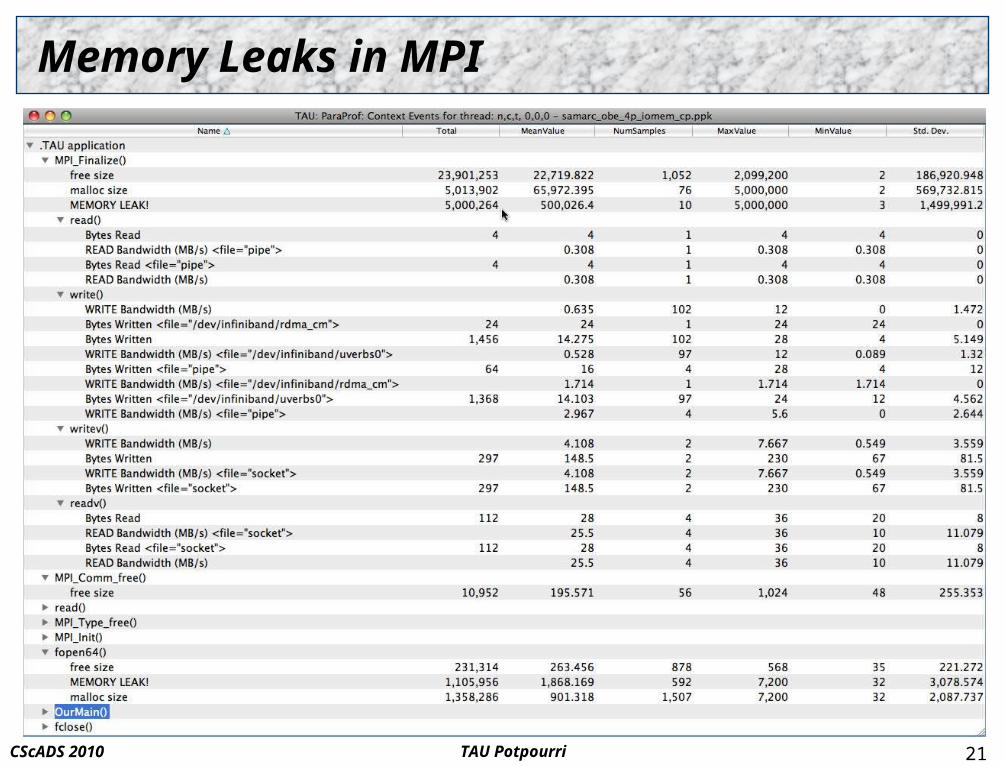
Memory Leaks in MPI
21
TAU PotpourriCScADS 2010
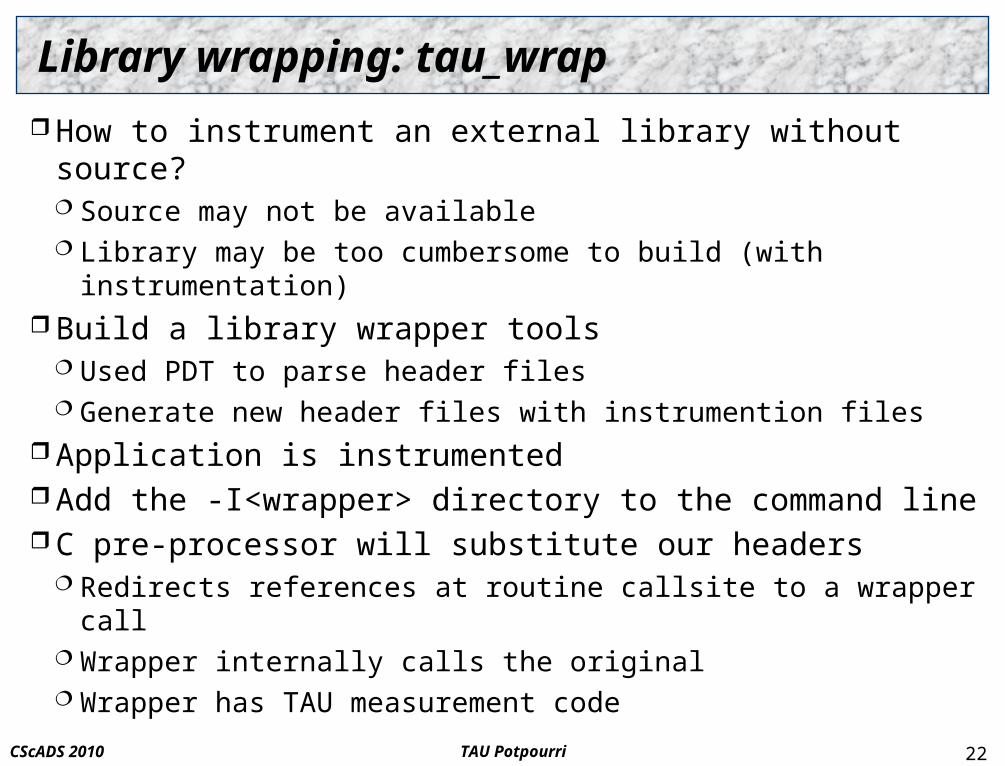
Library wrapping: tau_wrap
How to instrument an external library without source? Source may not be available Library may be too cumbersome to build (with instrumentation)
Build a library wrapper tools Used PDT to parse header files Generate new header files with instrumention files
Application is instrumented Add the -I<wrapper> directory to the command line C pre-processor will substitute our headers
Redirects references at routine callsite to a wrapper call Wrapper internally calls the original Wrapper has TAU measurement code
22
TAU PotpourriCScADS 2010
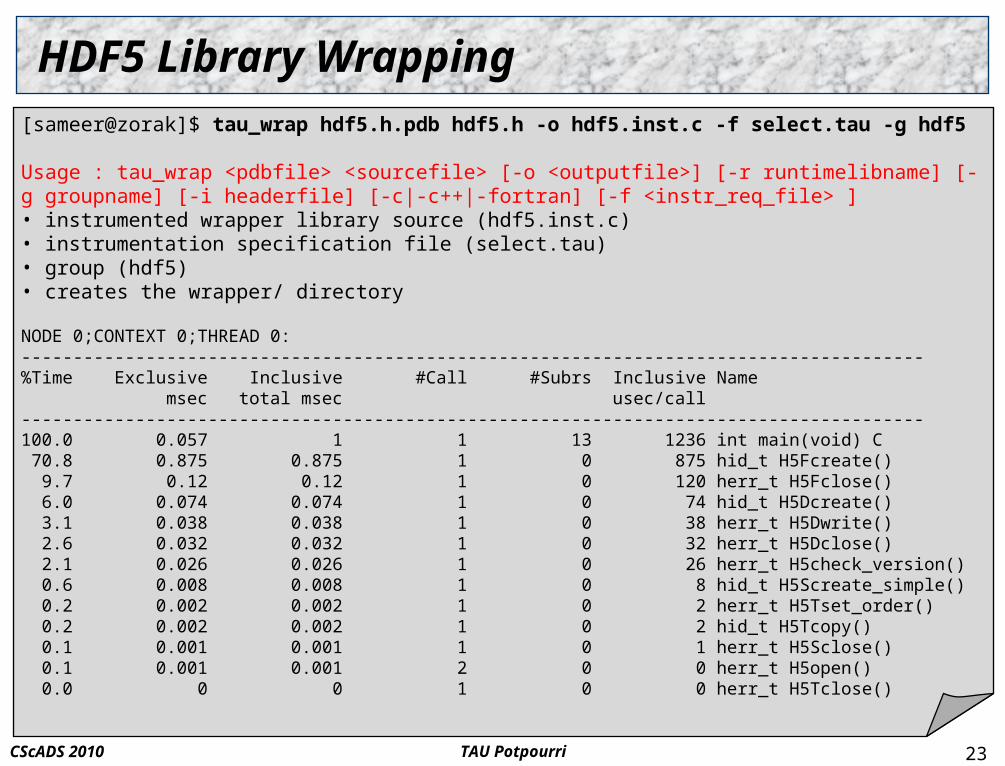
HDF5 Library Wrapping
23
[sameer@zorak]$ tau_wrap hdf5.h.pdb hdf5.h -o hdf5.inst.c -f select.tau -g hdf5
Usage : tau_wrap <pdbfile> <sourcefile> [-o <outputfile>] [-r runtimelibname] [-g groupname] [-i headerfile] [-c|-c++|-fortran] [-f <instr_req_file> ]• instrumented wrapper library source (hdf5.inst.c)• instrumentation specification file (select.tau)• group (hdf5)• creates the wrapper/ directory
NODE 0;CONTEXT 0;THREAD 0:---------------------------------------------------------------------------------------%Time Exclusive Inclusive #Call #Subrs Inclusive Name msec total msec usec/call---------------------------------------------------------------------------------------100.0 0.057 1 1 13 1236 int main(void) C 70.8 0.875 0.875 1 0 875 hid_t H5Fcreate() 9.7 0.12 0.12 1 0 120 herr_t H5Fclose() 6.0 0.074 0.074 1 0 74 hid_t H5Dcreate() 3.1 0.038 0.038 1 0 38 herr_t H5Dwrite() 2.6 0.032 0.032 1 0 32 herr_t H5Dclose() 2.1 0.026 0.026 1 0 26 herr_t H5check_version() 0.6 0.008 0.008 1 0 8 hid_t H5Screate_simple() 0.2 0.002 0.002 1 0 2 herr_t H5Tset_order() 0.2 0.002 0.002 1 0 2 hid_t H5Tcopy() 0.1 0.001 0.001 1 0 1 herr_t H5Sclose() 0.1 0.001 0.001 2 0 0 herr_t H5open() 0.0 0 0 1 0 0 herr_t H5Tclose()
TAU PotpourriCScADS 2010
NWChem and One-sided Communication
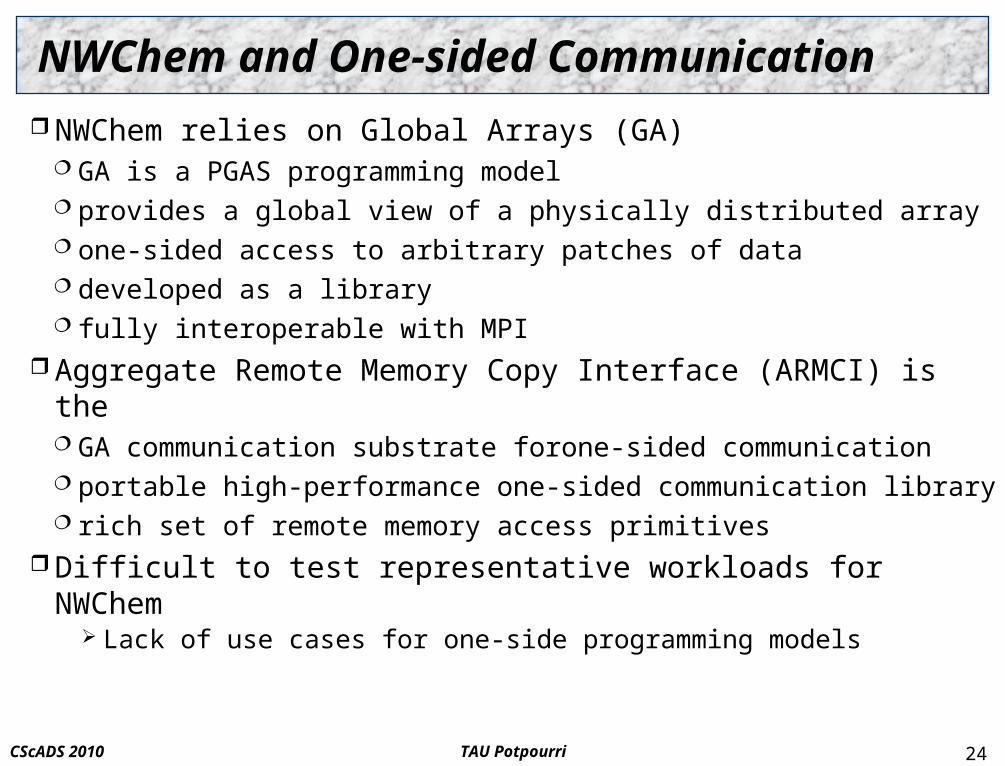
NWChem relies on Global Arrays (GA) GA is a PGAS programming model provides a global view of a physically distributed array one-sided access to arbitrary patches of data developed as a library fully interoperable with MPI
Aggregate Remote Memory Copy Interface (ARMCI) is the GA communication substrate forone-sided communication portable high-performance one-sided communication library rich set of remote memory access primitives
Difficult to test representative workloads for NWChem Lack of use cases for one-side programming models
24
TAU PotpourriCScADS 2010
NWChem Characterization
Strong-scaling of modest problems helps to understand the behavior of larger scientifically significant problems represent behavior of real calculations on future systems
Understand interplay between data-server and compute processes as a function of scaling Large numerical computation per node at small scale can
obscure the cost of maintaining passive-target progress Larger scale decreases numerical work per node and increases
the fragmentation of data, increasing messages Vary #nodes, cores-per-node, and memory buffer pinning
Understand trade-off of core allocation all to computation versus some to communication
25
TAU PotpourriCScADS 2010
NWChem Instrumentation
Source-base instrumentation of NWChem application routines
Developed an ARMCI interposition library (PARMCI) defines weak symbols and name-shifted PARMCI interface similar to PMPI for MPI
Developed a TAU PARMCI library intervals events around interface routines atomic events to capture communication size and destination
Wrapped external libraries BLAS (DGEMM)
Need portable instrumentation to conduct cross-platform experiments
26
TAU PotpourriCScADS 2010
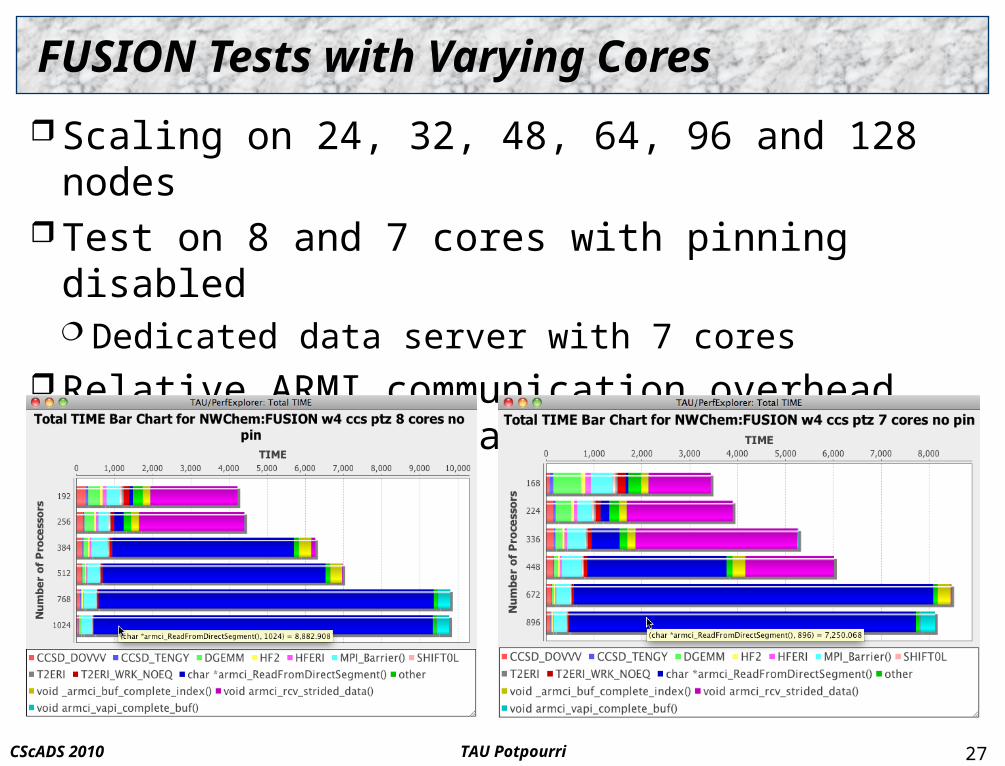
FUSION Tests with Varying Cores
Scaling on 24, 32, 48, 64, 96 and 128 nodes Test on 8 and 7 cores with pinning disabled
Dedicated data server with 7 cores Relative ARMI communication overhead increases with
greater number of nodes (cores)
27
TAU PotpourriCScADS 2010
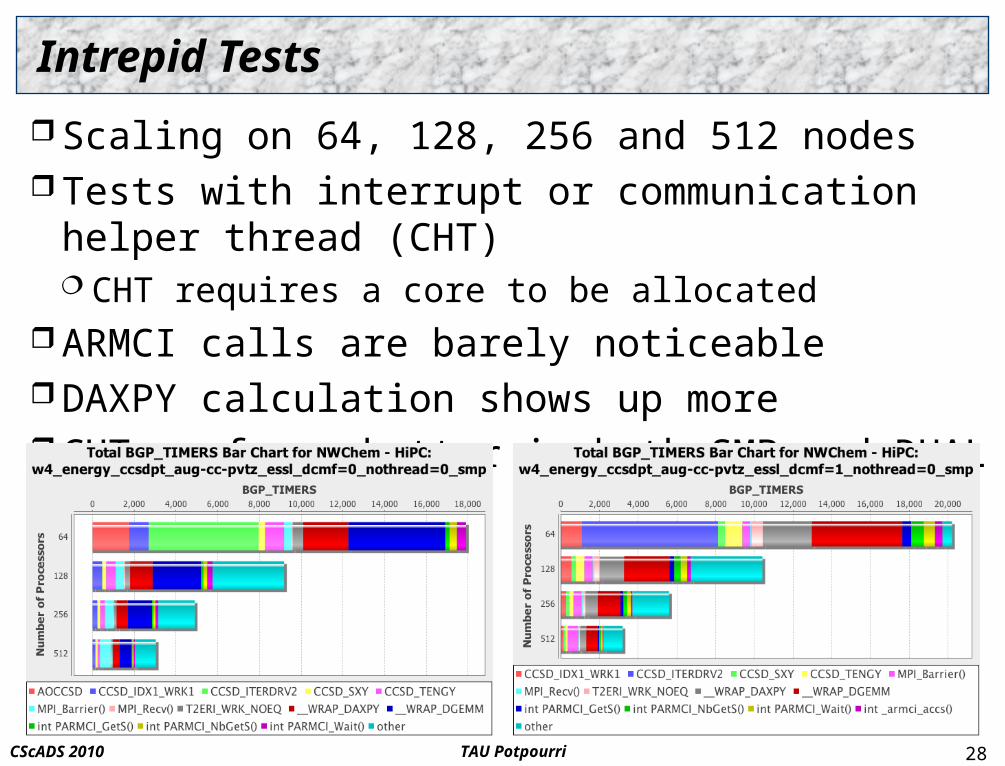
Intrepid Tests
Scaling on 64, 128, 256 and 512 nodes Tests with interrupt or communication helper thread (CHT)
CHT requires a core to be allocated ARMCI calls are barely noticeable DAXPY calculation shows up more CHT performs better in both SMP and DUAL modes
28
TAU PotpourriCScADS 2010
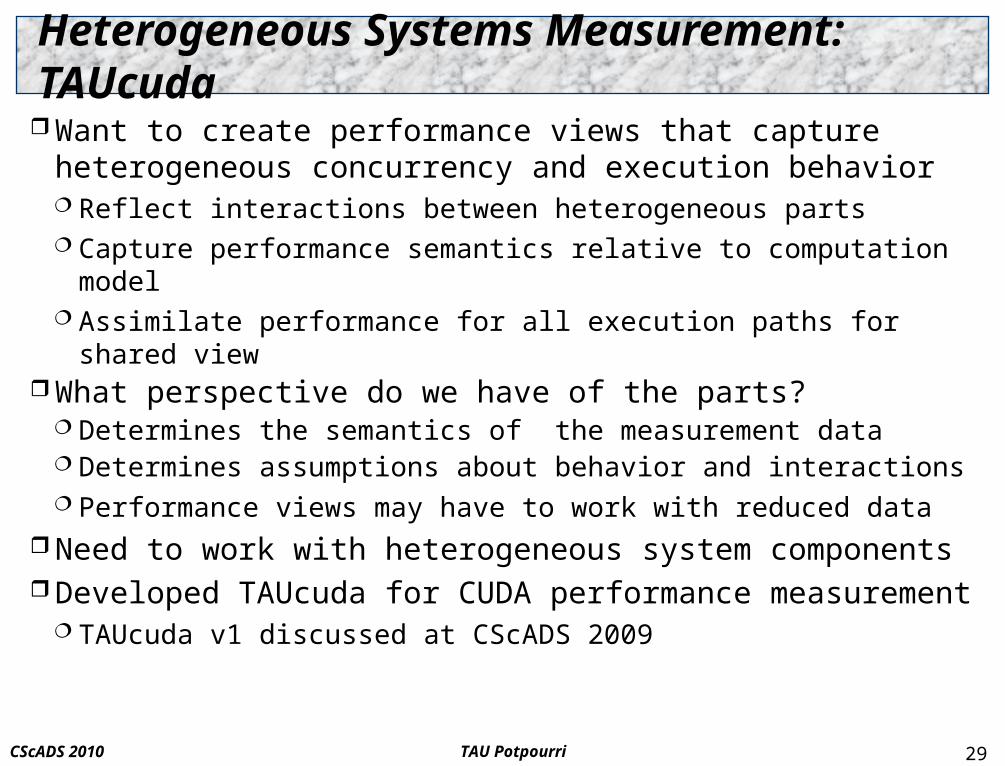
Heterogeneous Systems Measurement: TAUcuda
Want to create performance views that capture heterogeneous concurrency and execution behavior Reflect interactions between heterogeneous parts Capture performance semantics relative to computation model Assimilate performance for all execution paths for shared view
What perspective do we have of the parts? Determines the semantics of the measurement data Determines assumptions about behavior and interactions Performance views may have to work with reduced data
Need to work with heterogeneous system components Developed TAUcuda for CUDA performance measurement
TAUcuda v1 discussed at CScADS 2009
29
TAU PotpourriCScADS 2010
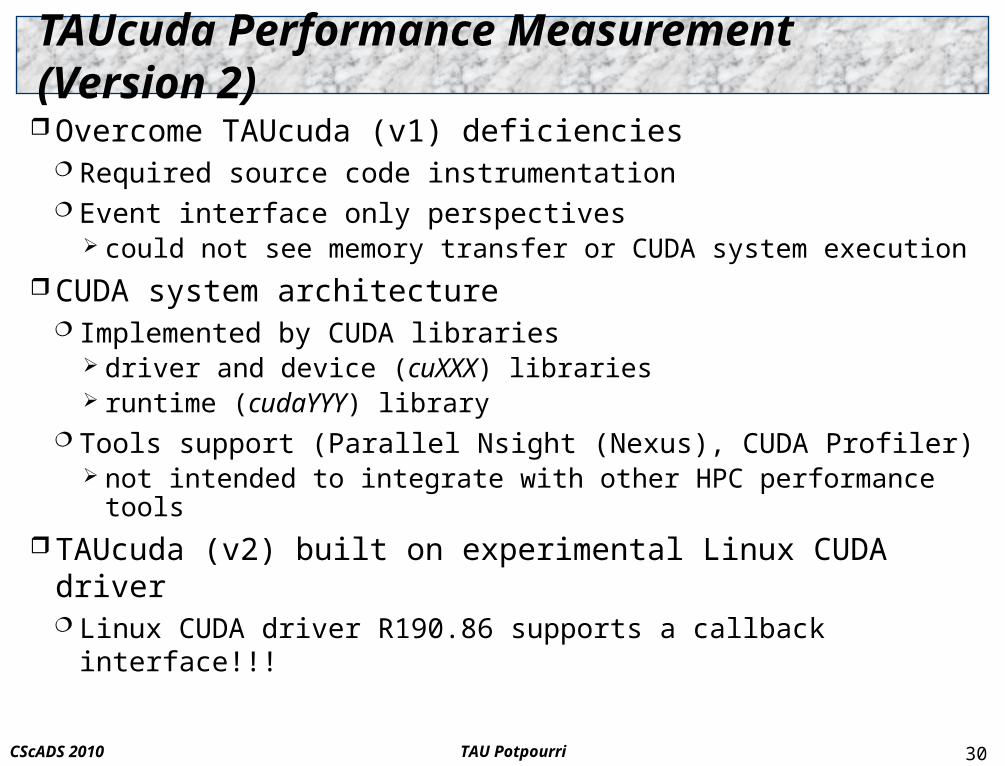
TAUcuda Performance Measurement (Version 2)
Overcome TAUcuda (v1) deficiencies Required source code instrumentation Event interface only perspectives
could not see memory transfer or CUDA system execution
CUDA system architecture Implemented by CUDA libraries
driver and device (cuXXX) libraries runtime (cudaYYY) library
Tools support (Parallel Nsight (Nexus), CUDA Profiler) not intended to integrate with other HPC performance tools
TAUcuda (v2) built on experimental Linux CUDA driver Linux CUDA driver R190.86 supports a callback interface!!!
30
TAU PotpourriCScADS 2010
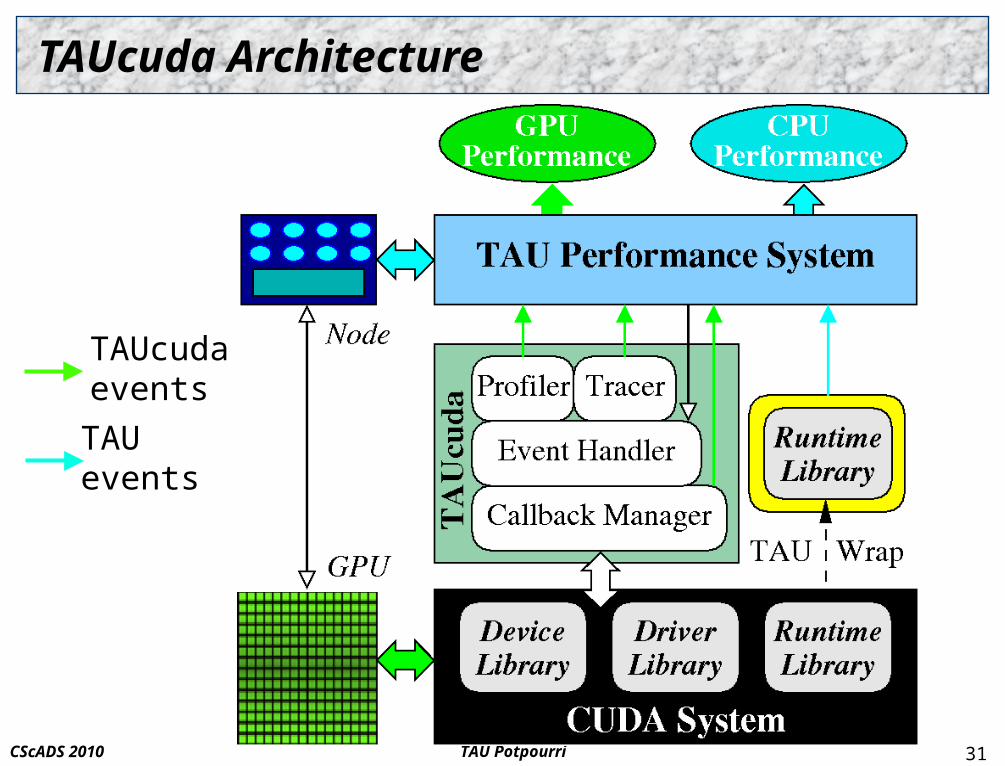
TAUcuda Architecture
TAUevents
TAUcudaevents
31
TAU PotpourriCScADS 2010
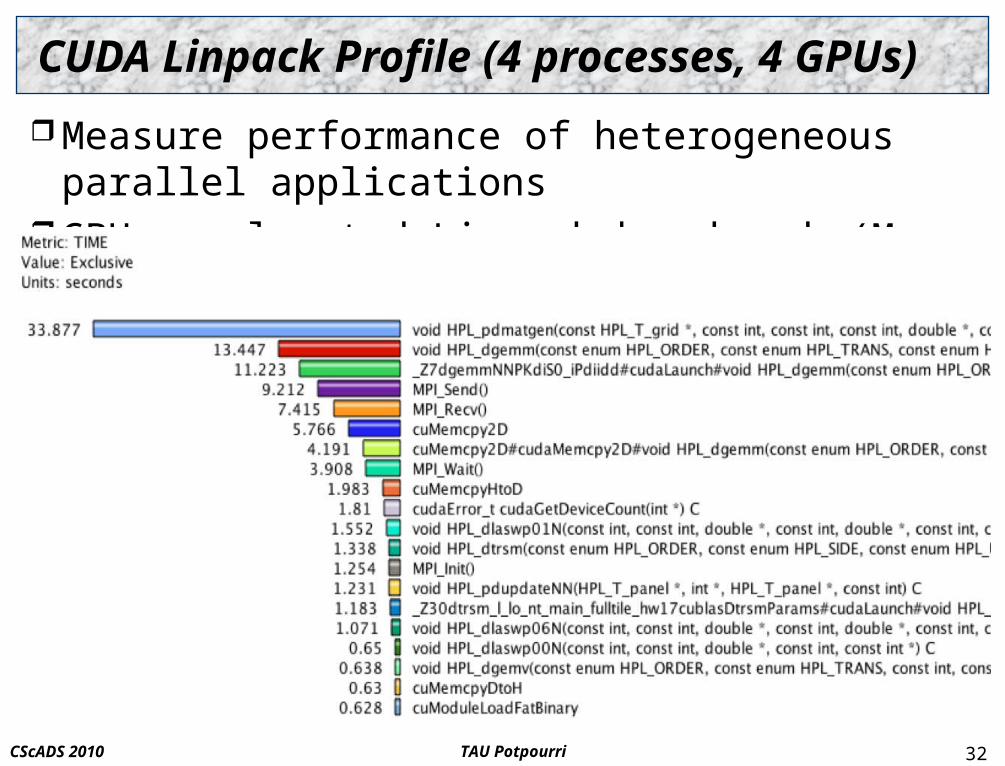
CUDA Linpack Profile (4 processes, 4 GPUs)
Measure performance of heterogeneous parallel applications GPU-accelerated Linpack benchmark (M. Fatica, NVIDIA)
32
TAU PotpourriCScADS 2010
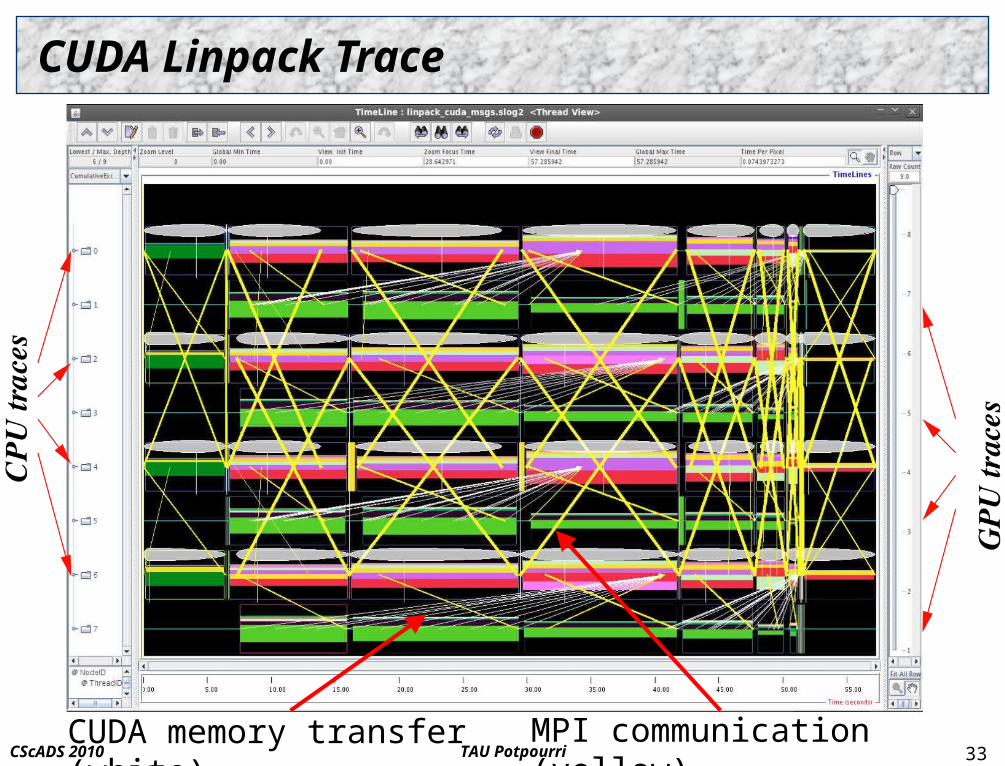
CUDA Linpack Trace
33MPI communication (yellow)CUDA memory transfer (white)
TAU PotpourriCScADS 2010
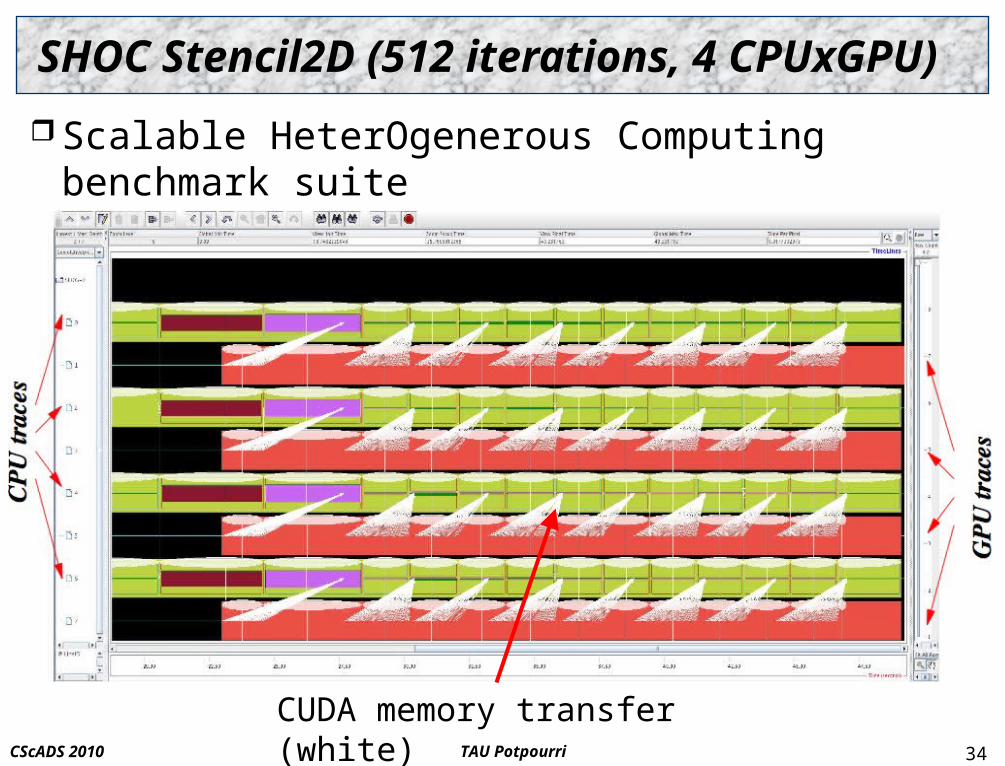
SHOC Stencil2D (512 iterations, 4 CPUxGPU)
Scalable HeterOgenerous Computing benchmark suite CUDA / OpenCL kernels and microbenchmarks (ORNL)
34
CUDA memory transfer (white)
TAU PotpourriCScADS 2010
TAU and Eclipse
How to make performance measurement, analysis, and tuning a part of the software development cycle?
Multi-year work with Eclipse IDE (www.eclipse.org) Benefits: portable, project transition: familiar interface, supports
multiple languages (Java, C/C++, Fortran, …) Features: syntax highlighting, refactoring, code management Modular plug-in based architecture allows for easy extension Environments: JDT, CDT, PTP (www.eclipse.org/{jdt,cdt,ptp})
High-performance software development environments IDE features for parallel programming + parallel tools Eclipse PTP: integrate features and interface with parallel tools
35
TAU PotpourriCScADS 2010
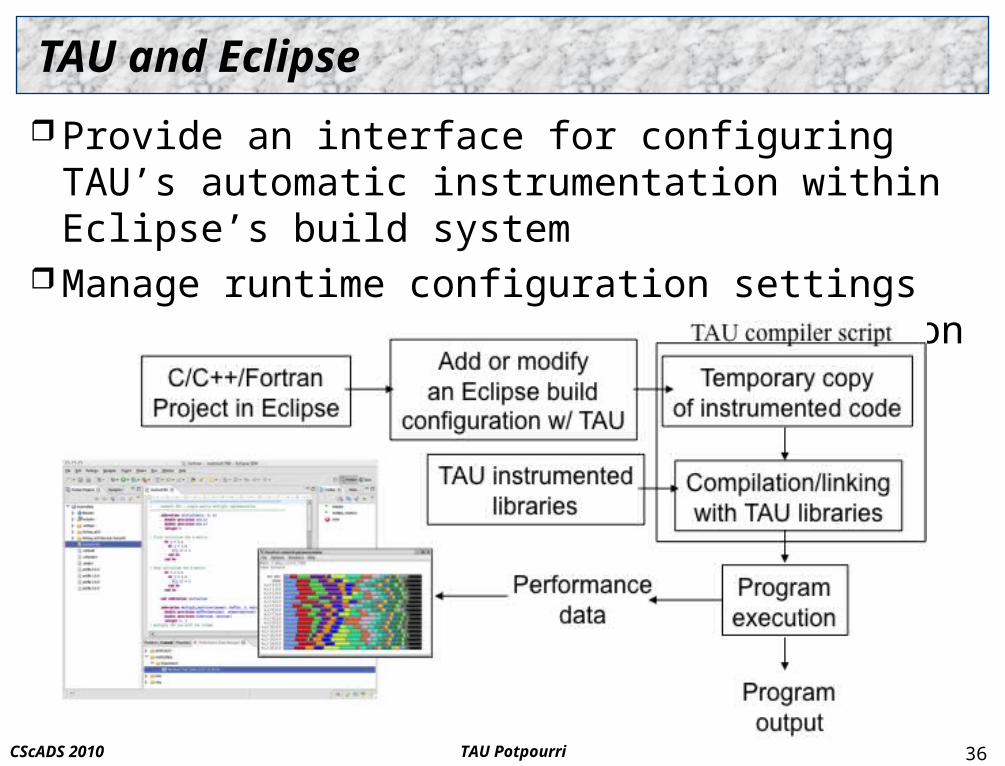
TAU and Eclipse
Provide an interface for configuring TAU’s automatic instrumentation within Eclipse’s build system
Manage runtime configuration settings and environment variables for execution of TAU instrumented programs
36
TAU PotpourriCScADS 2010
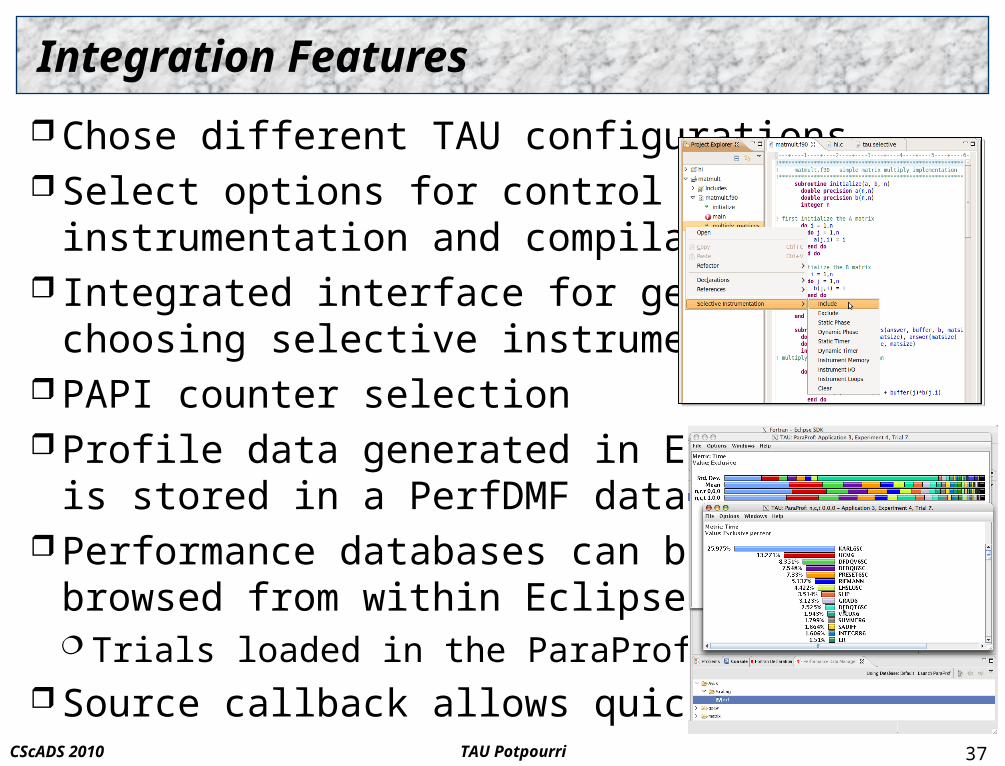
Integration Features
Chose different TAU configurations Select options for control of
instrumentation and compilation Integrated interface for generating and
choosing selective instrumentation PAPI counter selection Profile data generated in Eclipse
is stored in a PerfDMF database Performance databases can be
browsed from within Eclipse Trials loaded in the ParaProf
Source callback allows quick navigation37
TAU PotpourriCScADS 2010
Dynamic Tool Definitions
Developed External Tools Framework (ETFw) Initially to extend and generalize the TAU plug-ins Considered for general tool integration in Eclipse
TAU plug-ins’ functionality was generalized to XML for: Portability and ease of modification Simpler alternative to Eclipse plug-in for tool integration Use additionally for workflow creation
Tools selected /configured in a launch configuration window
ETFx adds Eclipse support for analysis tools including: Valgrind, PerfSuite, Scalasca, VampirTrace
Other tool developers are leveraging the ETFw38
TAU PotpourriCScADS 2010
Monitoring running Applications: TAUmon
Scalable access to a running application’s performance information is valuable
Access can happen after an application completes (but before parallel teardown) or while an application is still running
Two-way access needed for support of advanced operations TAUmon
Design as a transport-neutral application monitoring framework Base on prior /existing work with various transport systems:
Supermon, MRNet, MPI
Recent work by Chee Wai Lee
39
TAU PotpourriCScADS 2010
Overall design principles
40
Modular and transparent access to parallel transport systems Support for minimal user intervention with different
system-specific launch mechanisms Modular support for scalable monitoring operations
Based on aggregation algorithms and techniques Simple overall statistics: mean, min, max, standard deviation Histograms Clustering results (various types)
Modular support for data delivery to output locations Local or remote visualization/analysis tools Local or remote storage
TAU PotpourriCScADS 2010
Current implementation and API
TAU_ONLINE_DUMP() collective operations in application Called by all thread / processes Works with parallel profiles
Appropriate version of TAU selected for transport system User instruments application with TAU support for desired
monitoring transport system User submits instrumented application to parallel job
system Other launch systems must be submitted along with the
application to the job scheduler as needed Currently supported through different machine-specific job-
submission scripts
41
TAU PotpourriCScADS 2010
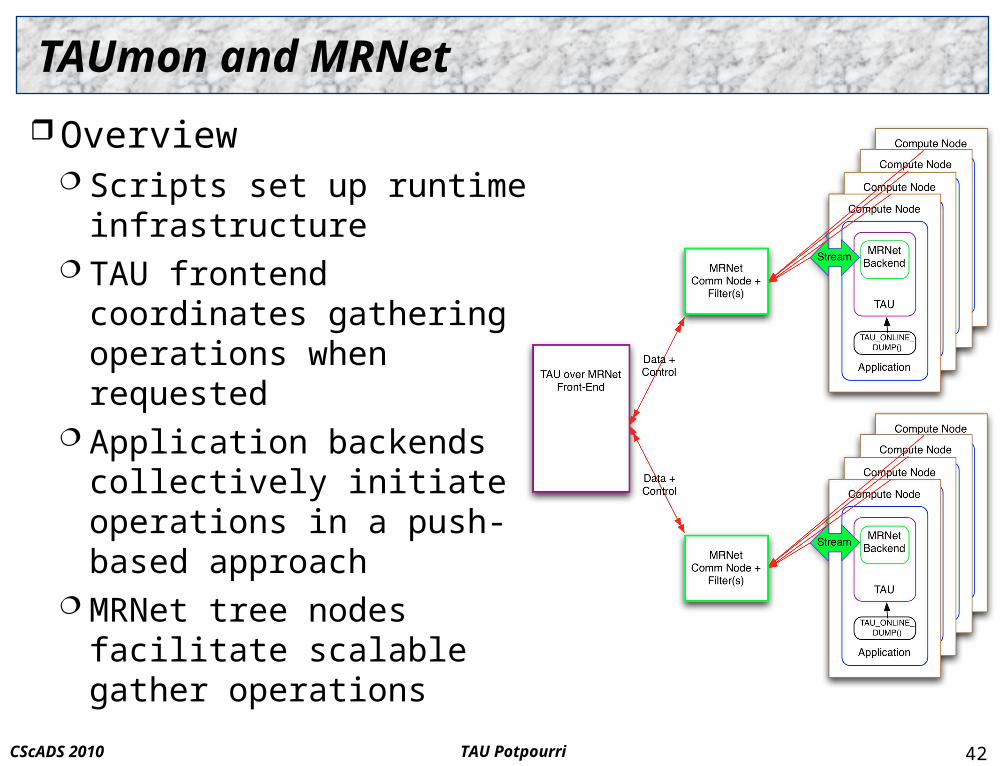
TAUmon and MRNet
Overview Scripts set up runtime
infrastructure TAU frontend coordinates
gathering operations when requested
Application backends collectively initiate operations in a push-based approach
MRNet tree nodes facilitate scalable gather operations
42
TAU PotpourriCScADS 2010
MRNet Network Configuration
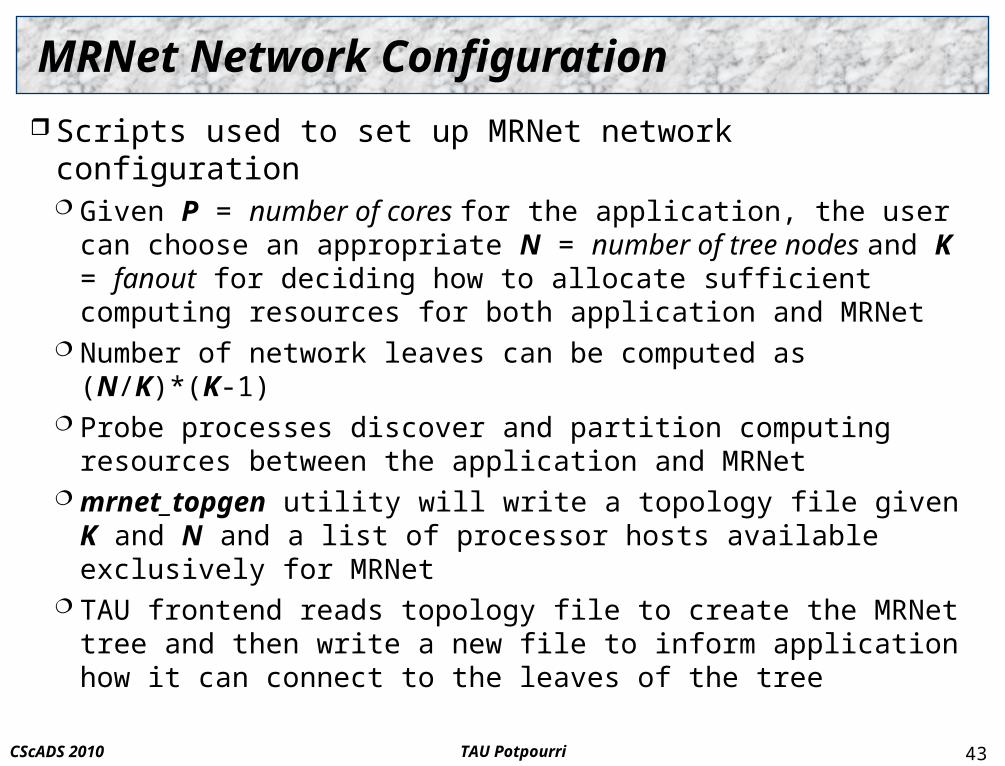
Scripts used to set up MRNet network configuration Given P = number of cores for the application, the user can
choose an appropriate N = number of tree nodes and K = fanout for deciding how to allocate sufficient computing resources for both application and MRNet
Number of network leaves can be computed as (N/K)*(K-1) Probe processes discover and partition computing resources
between the application and MRNet mrnet_topgen utility will write a topology file given K and N
and a list of processor hosts available exclusively for MRNet TAU frontend reads topology file to create the MRNet tree and
then write a new file to inform application how it can connect to the leaves of the tree
43
TAU PotpourriCScADS 2010
Monitoring Operation with MRNet
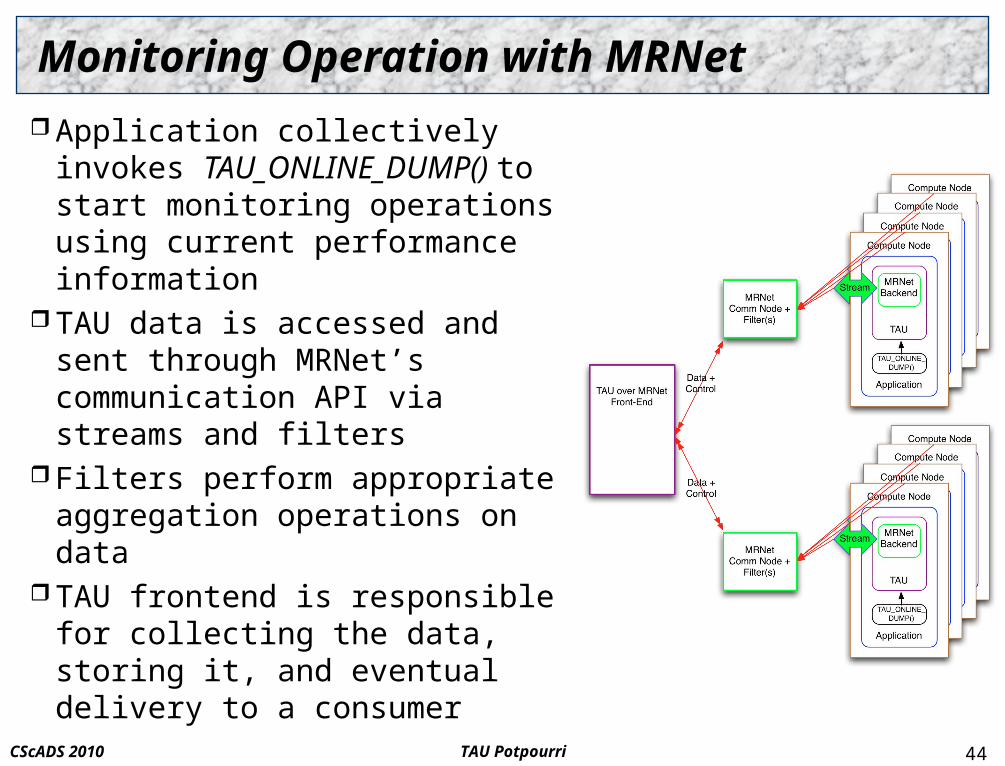
Application collectively invokes TAU_ONLINE_DUMP() to start monitoring operations using current performance information
TAU data is accessed and sent through MRNet’s communication API via streams and filters
Filters perform appropriate aggregation operations on data
TAU frontend is responsible for collecting the data, storing it, and eventual delivery to a consumer
44
TAU PotpourriCScADS 2010
Experiences with MRNet - 1
Parallel system-specific (e.g. Cray XT5 and BG/P) launch mechanisms required
Key technical challenges: Efficient data offload from application to MRNet tree Support for user control of MRNet tree for performance
Other challenges: Current compiler-related incompatibility on the Cray Providing uniform launch scripts across different parallel
machines
45
TAU PotpourriCScADS 2010
Experiences with MRNet - 2
Extra computing resources must be dedicated to MRNet tree This can be viewed as an advantage or limitation
Resources required are system-dependent: On Cray systems, MRNet front-end resides on login node,
intermediate tree nodes reside on dedicated (set aside by user) compute nodes, application processes (backends) reside on the remaining compute nodes
On BG/P systems, MRNet front-end (and possibly some tree nodes) reside on login node, intermediate tree nodes reside on IO nodes (not known a-priori until after compute nodes are launched), backends reside on compute nodes
46
TAU PotpourriCScADS 2010
TAUmon and MPI
Also developing TAUmon to use MPI-based transport No separate launch mechanisms required Parallel gather operations implemented as a binomial heap with
staged MPI point-to-point calls (Rank 0 serves as root) Limitations:
Application shares the same parallel infrastructure with monitoring transport
Monitoring operations may cause performance intrusion Currently, no flexibility for user control of transport network
configuration
47
TAU PotpourriCScADS 2010
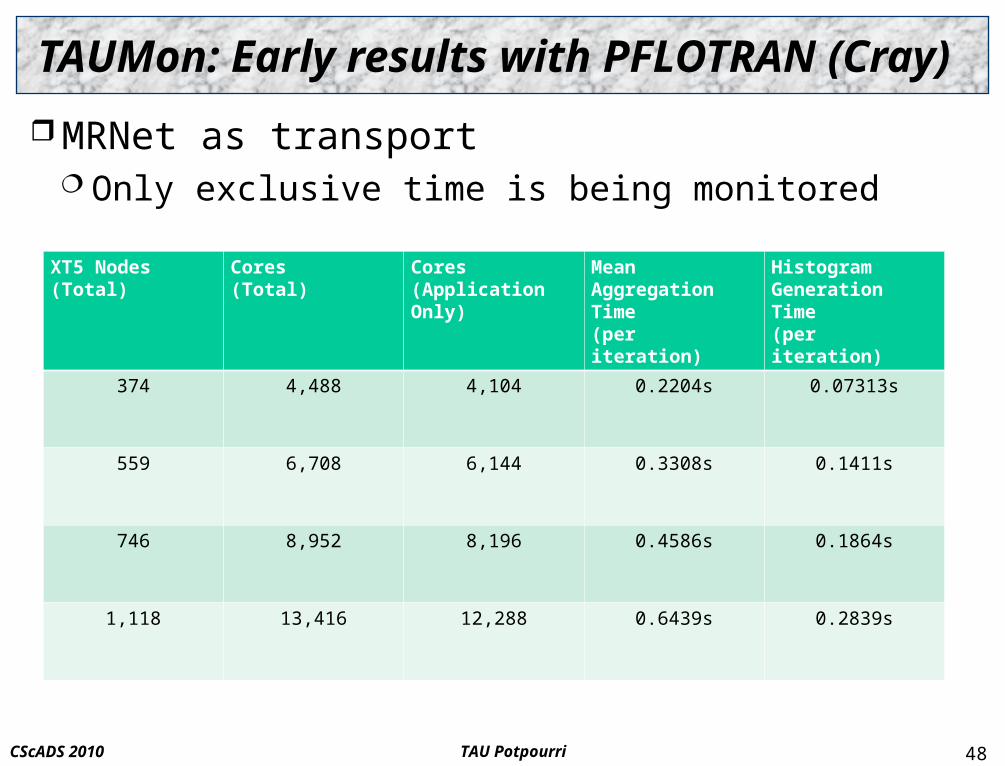
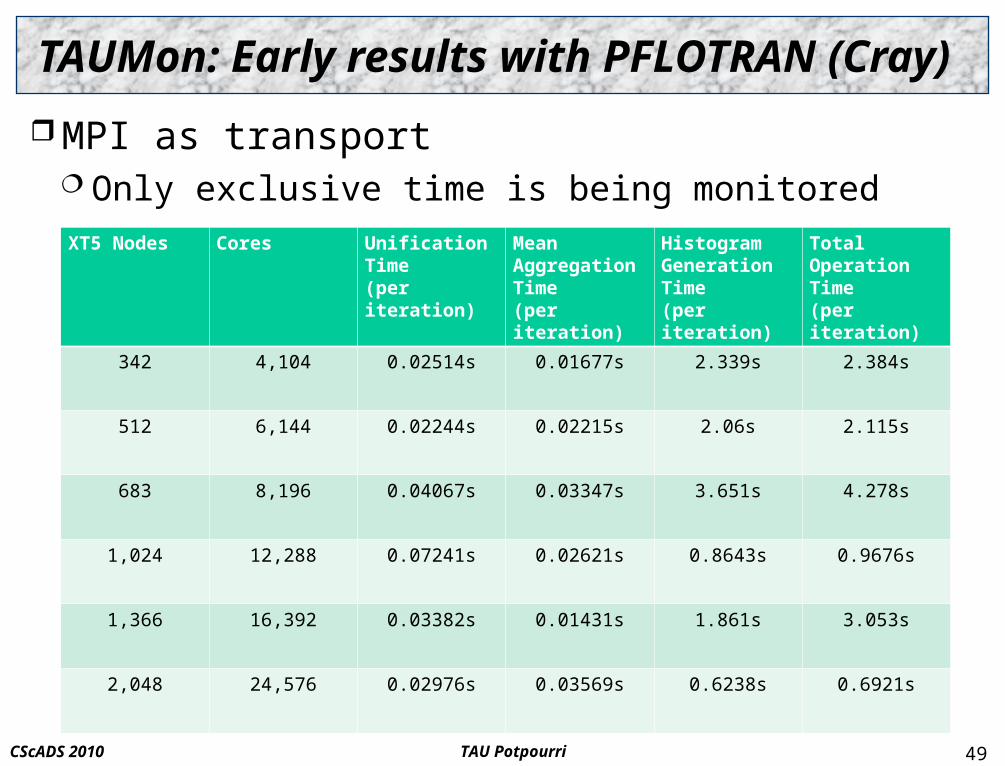
TAUMon: Early results with PFLOTRAN (Cray)
MRNet as transport Only exclusive time is being monitored
48
XT5 Nodes(Total)
Cores(Total)
Cores(Application Only)
Mean Aggregation Time(per iteration)
Histogram Generation Time(per iteration)
374 4,488 4,104 0.2204s 0.07313s
559 6,708 6,144 0.3308s 0.1411s
746 8,952 8,196 0.4586s 0.1864s
1,118 13,416 12,288 0.6439s 0.2839s
TAU PotpourriCScADS 2010
TAUMon: Early results with PFLOTRAN (Cray)
MPI as transport Only exclusive time is being monitored
49
XT5 Nodes Cores Unification Time(per iteration)
Mean Aggregation Time(per iteration)
Histogram Generation Time(per iteration)
Total Operation Time(per iteration)
342 4,104 0.02514s 0.01677s 2.339s 2.384s
512 6,144 0.02244s 0.02215s 2.06s 2.115s
683 8,196 0.04067s 0.03347s 3.651s 4.278s
1,024 12,288 0.07241s 0.02621s 0.8643s 0.9676s
1,366 16,392 0.03382s 0.01431s 1.861s 3.053s
2,048 24,576 0.02976s 0.03569s 0.6238s 0.6921s
TAU PotpourriCScADS 2010
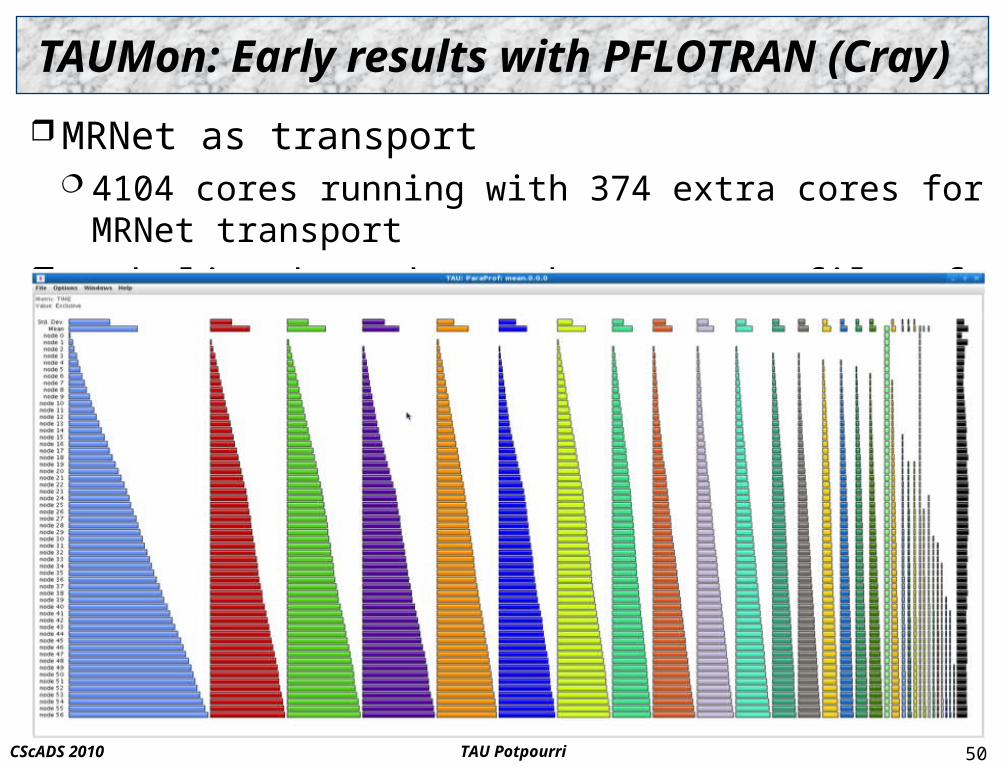
TAUMon: Early results with PFLOTRAN (Cray)
MRNet as transport 4104 cores running with 374 extra cores for MRNet transport
Each line bar shows the mean profile of an iteration
50
TAU PotpourriCScADS 2010
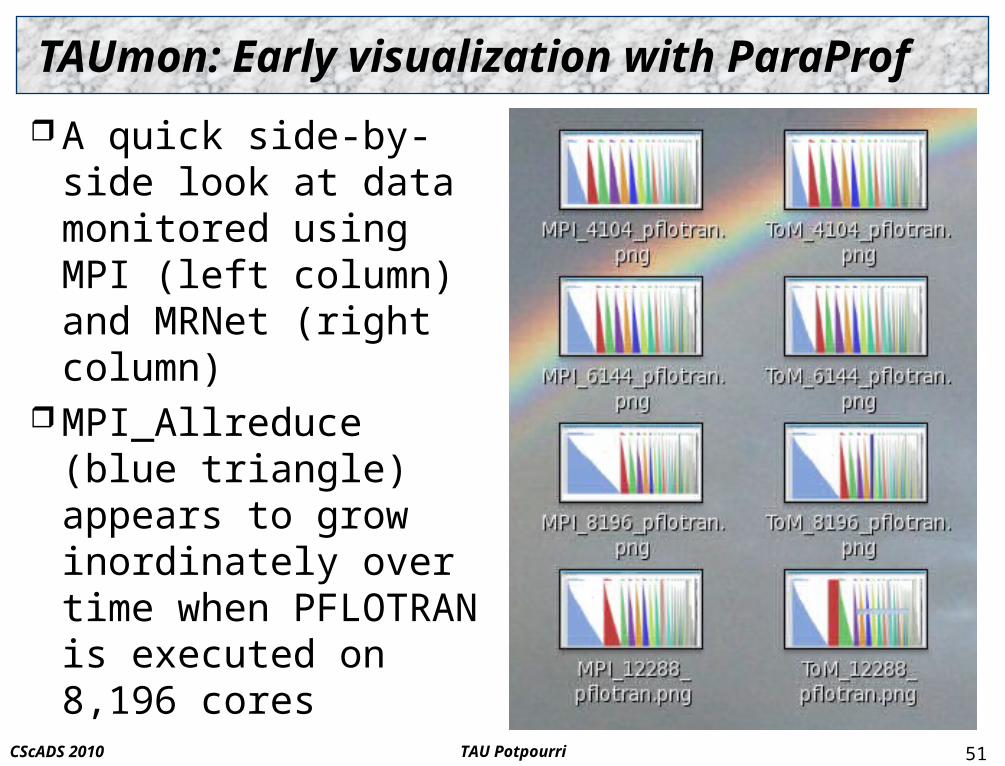
TAUmon: Early visualization with ParaProf
A quick side-by-side look at data monitored using MPI (left column) and MRNet (right column)
MPI_Allreduce (blue triangle) appears to grow inordinately over time when PFLOTRAN is executed on 8,196 cores
51
TAU PotpourriCScADS 2010
Support Acknowledgements
Department of Energy (DOE) Office of Science
ASC/NNSA
Department of Defense (DoD) HPC Modernization Office (HPCMO)
NSF Software Development for Cyberinfrastructure (SDCI) Research Centre Juelich Argonne National Laboratory Technical University Dresden ParaTools, Inc. NVIDIA
52