scott creek - australia's official weather forecasts & weather … · australia-6 1....
TRANSCRIPT
Australia-6
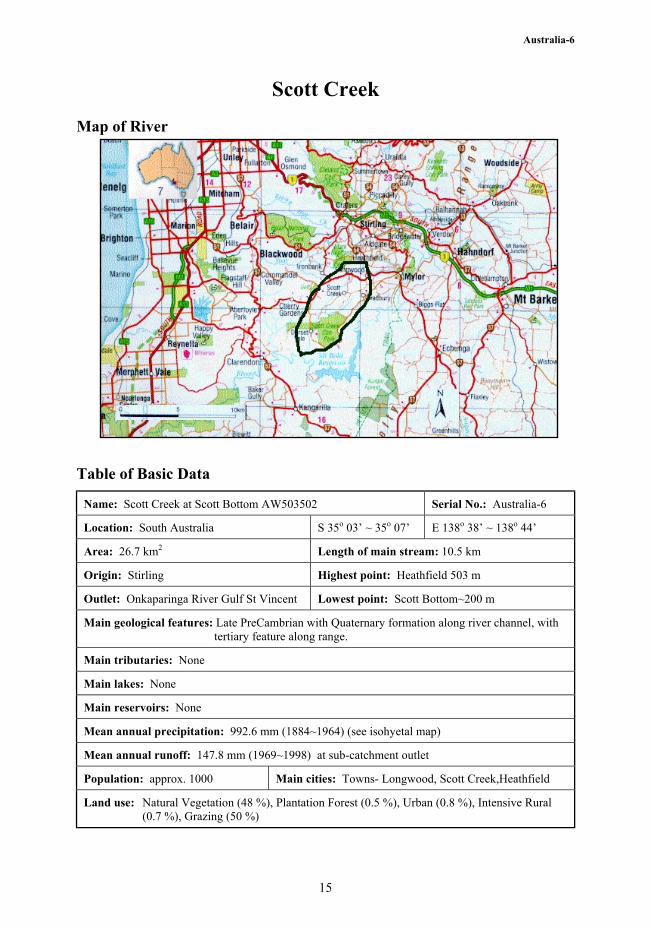
Scott Creek
Map of River
Table of Basic Data
Name: Scott Creek at Scott Bottom AW503502 Serial No.: Australia-6
Location: South Australia S 35o 03’ ~ 35o 07’ E 138o 38’ ~ 138o 44’
Area: 26.7 km2 Length of main stream: 10.5 km
Origin: Stirling Highest point: Heathfield 503 m
Outlet: Onkaparinga River Gulf St Vincent Lowest point: Scott Bottom~200 m
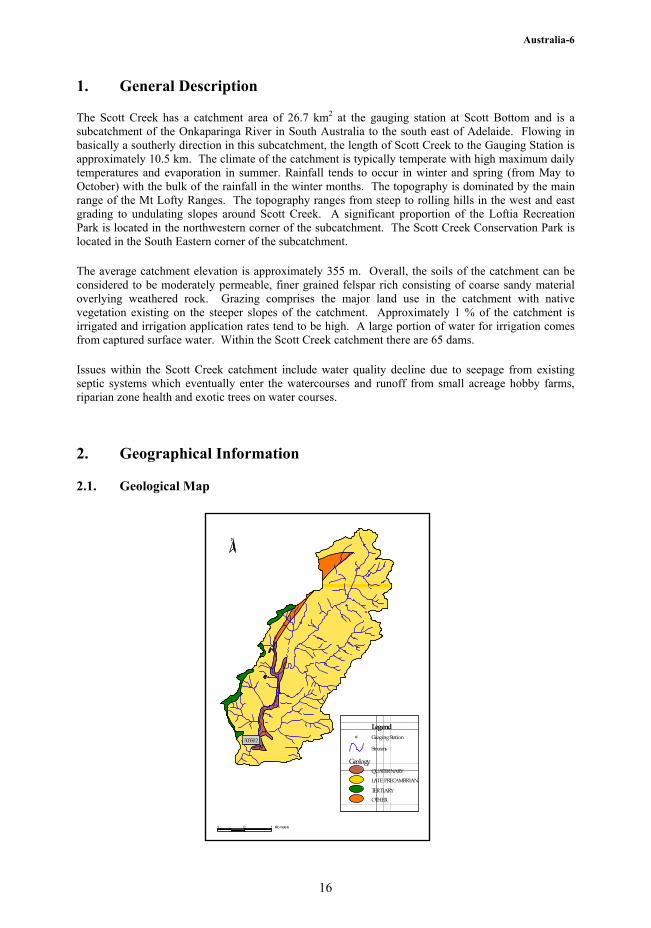
Main geological features: Late PreCambrian with Quaternary formation along river channel, with tertiary feature along range.
Main tributaries: None
Main lakes: None
Main reservoirs: None
Mean annual precipitation: 992.6 mm (1884~1964) (see isohyetal map)
Mean annual runoff: 147.8 mm (1969~1998) at sub-catchment outlet
Population: approx. 1000 Main cities: Towns- Longwood, Scott Creek,Heathfield
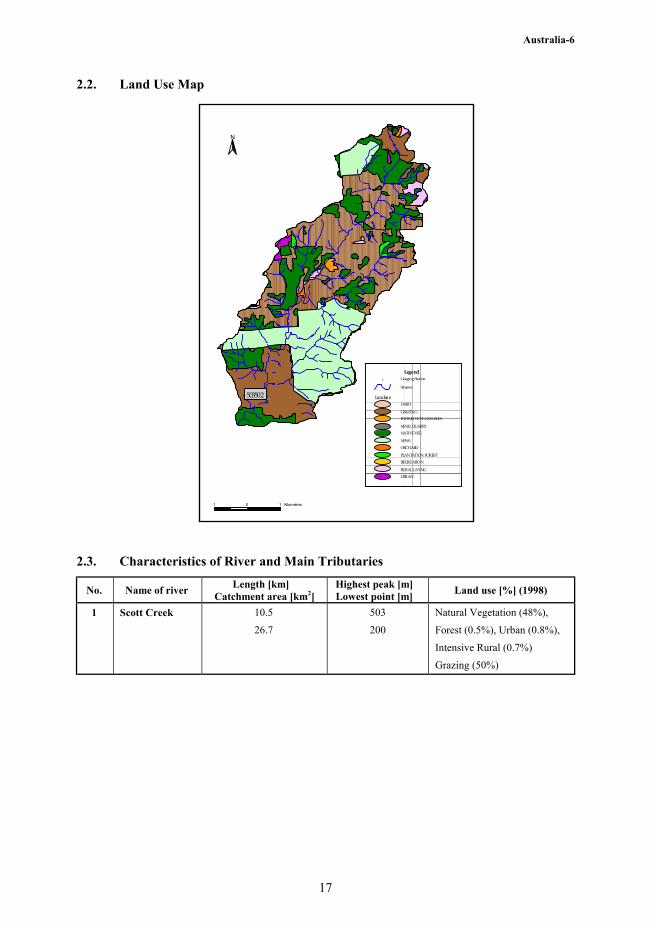
Land use: Natural Vegetation (48 %), Plantation Forest (0.5 %), Urban (0.8 %), Intensive Rural (0.7 %), Grazing (50 %)
15
Australia-6
1. General Description
The Scott Creek has a catchment area of 26.7 km2 at the gauging station at Scott Bottom and is a subcatchment of the Onkaparinga River in South Australia to the south east of Adelaide. Flowing in basically a southerly direction in this subcatchment, the length of Scott Creek to the Gauging Station is approximately 10.5 km. The climate of the catchment is typically temperate with high maximum daily temperatures and evaporation in summer. Rainfall tends to occur in winter and spring (from May to October) with the bulk of the rainfall in the winter months. The topography is dominated by the main range of the Mt Lofty Ranges. The topography ranges from steep to rolling hills in the west and east grading to undulating slopes around Scott Creek. A significant proportion of the Loftia Recreation Park is located in the northwestern corner of the subcatchment. The Scott Creek Conservation Park is located in the South Eastern corner of the subcatchment.
The average catchment elevation is approximately 355 m. Overall, the soils of the catchment can be considered to be moderately permeable, finer grained felspar rich consisting of coarse sandy material overlying weathered rock. Grazing comprises the major land use in the catchment with native vegetation existing on the steeper slopes of the catchment. Approximately 1 % of the catchment is irrigated and irrigation application rates tend to be high. A large portion of water for irrigation comes from captured surface water. Within the Scott Creek catchment there are 65 dams.
Issues within the Scott Creek catchment include water quality decline due to seepage from existing septic systems which eventually enter the watercourses and runoff from small acreage hobby farms, riparian zone health and exotic trees on water courses.
2. Geographical Information
2.1. Geological Map
1 0 1 Kilometers
N
# 5 0 3 5 0 2 G u a g i n g S t a t i o n #
S t r e a m s G e o l o g y
Q U A T E R N A R Y L A T E P R E C A M B R I A N T E R T I A R Y O T H E R
L e g e n d
16
Australia-6
2.2. Land Use Map
# 5 0 3 5 0 2
N
1 0 1 K i l o m e t e r s
G u a g i n g S t a t i o n #
S t r e a m s L a n d u s e
D A I R Y G R A Z I N G I N T E N S I V E
V E G E T A B L E S
M I N E / Q U A R R Y N A T I V E
V E G
N P W S O R C H A R D P L A N T A T I O N
F O R E S T
R E C R E A T I O N R U R A L
L I V I N G
U R B A N
L e g e n d
2.3. Characteristics of River and Main Tributaries
No. Name of river Length [km] Catchment area [km2]
Highest peak [m] Lowest point [m] Land use [%] (1998)
1 Scott Creek 10.5
26.7
503
200
Natural Vegetation (48%),
Forest (0.5%), Urban (0.8%),
Intensive Rural (0.7%)
Grazing (50%)
17
Australia-6
18
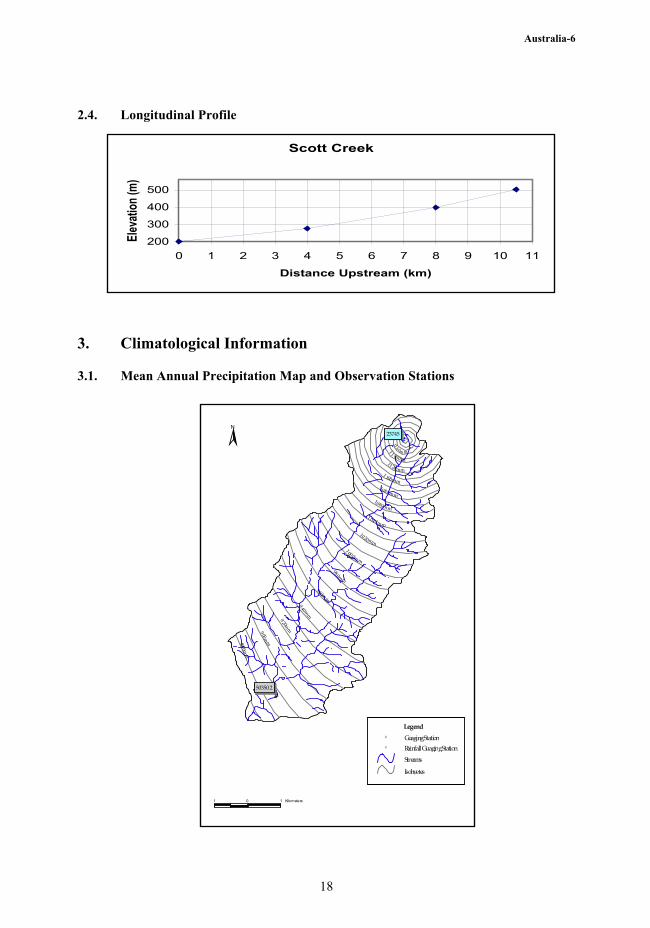
2.4. Longitudinal Profile
3. Climatological Information
3.1. Mean Annual Precipitation Map and Observation Stations
Rainfall Guaging Station
Guaging Station#
#
Str eams
Isohyetes
Legend
#
#503502
23745
880mm
9 00mm
920mm
940mm
960mm
980mm
100 0m m
10 20mm
1 040mm
1060mm
1080mm
1 100mm
11 20mm
11 40mm
11 60m m
N
1 0 1 Kilometers
Scott Creek
200
300
400
500
0 1 2 3 4 5 6 7 8 9 10 11
Distance Upstream (km)
Eleva
tion (
m)
RainfallGuagingStationGuagingStation#
#
Streams
Isohyetes
Legend
Australia-6
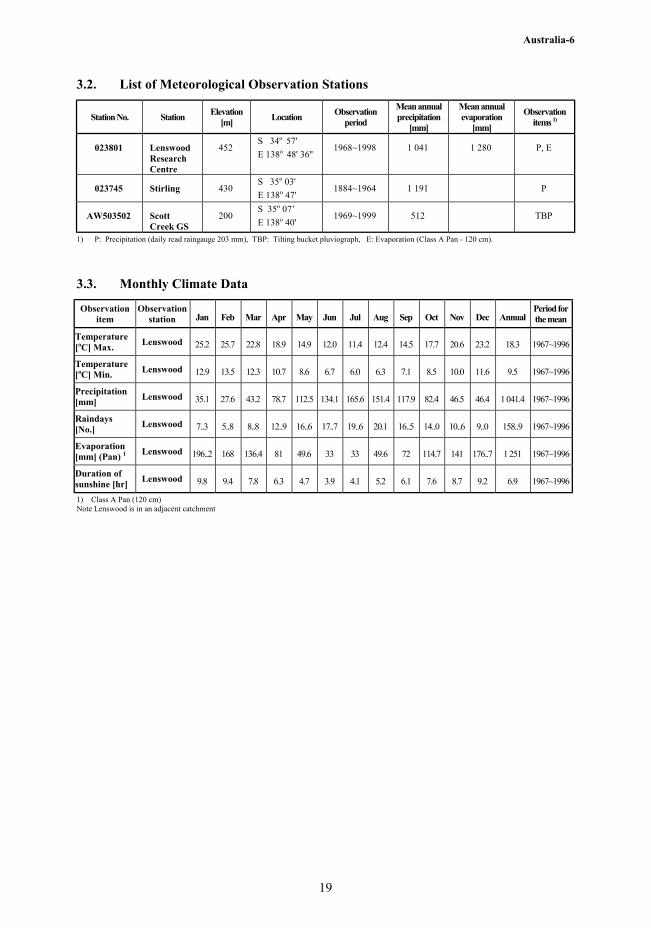
3.2. List of Meteorological Observation Stations
Station No. Station Elevation [m] Location Observation
period
Mean annual precipitation
[mm]
Mean annual evaporation
[mm]
Observation items 1)
023801 Lenswood Research Centre
452 S 34o 57' E 138o 48' 36''
1968~1998 1 041 1 280 P, E
023745 Stirling 430 S 35o 03' E 138o 47'
1884~1964 1 191 P
AW503502 Scott Creek GS
200 S 35o 07’ E 138o 40'
1969~1999 512 TBP
1) P: Precipitation (daily read raingauge 203 mm), TBP: Tilting bucket pluviograph, E: Evaporation (Class A Pan - 120 cm).
3.3. Monthly Climate Data
Observation item
Observation station Jan Feb Mar Apr May Jun Jul Aug Sep Oct Nov Dec Annual
Period for the mean
Temperature [oC] Max. Lenswood 25.2 25.7 22.8 18.9 14.9 12.0 11.4 12.4 14.5 17.7 20.6 23.2 18.3 1967~1996
Temperature [oC] Min. Lenswood 12.9 13.5 12.3 10.7 8.6 6.7 6.0 6.3 7.1 8.5 10.0 11.6 9.5 1967~1996
Precipitation [mm] Lenswood 35.1 27.6 43.2 78.7 112.5 134.1 165.6 151.4 117.9 82.4 46.5 46.4 1 041.4 1967~1996
Raindays [No.] Lenswood 7..3 5..8 8..8 12..9 16..6 17..7 19..6 20.1 16..5 14..0 10..6 9..0 158..9 1967~1996
Evaporation [mm] (Pan) 1 Lenswood 196..2 168 136.4 81 49.6 33 33 49.6 72 114.7 141 176..7 1 251 1967~1996
Duration of sunshine [hr] Lenswood 9.8 9.4 7.8 6.3 4.7 3.9 4.1 5.2 6.1 7.6 8.7 9.2 6.9 1967~1996
1) Class A Pan (120 cm) Note Lenswood is in an adjacent catchment
19
Australia-6
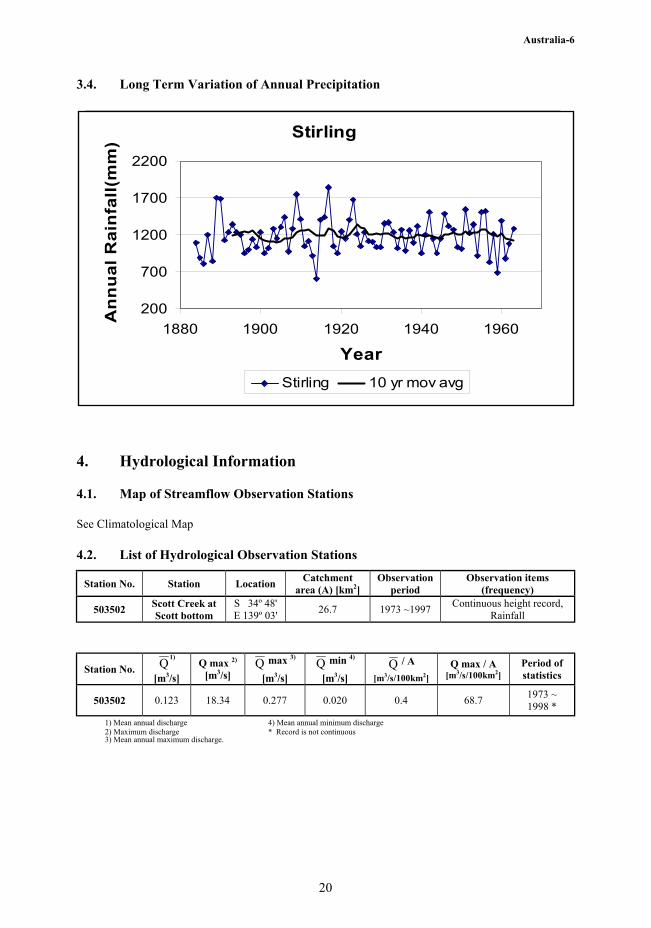
3.4. Long Term Variation of Annual Precipitation
Stirling
200
700
1200
1700
2200
1880 1900 1920 1940 1960
Year
An
nu
al
Ra
infa
ll(m
m)
Stirling 10 yr mov avg
4. Hydrological Information
4.1. Map of Streamflow Observation Stations
See Climatological Map
4.2. List of Hydrological Observation Stations
Station No. Station Location Catchment area (A) [km2]
Observation period
Observation items (frequency)
503502 Scott Creek at Scott bottom
S 34º 48' E 139º 03' 26.7 1973 ~1997 Continuous height record,
Rainfall
Station No. Q 1)
[m3/s] Q max 2)
[m3/s] Q max 3)
[m3/s] Q min 4)
[m3/s] Q / A
[m3/s/100km2] Q max / A
[m3/s/100km2] Period of statistics
503502 0.123 18.34 0.277 0.020 0.4 68.7 1973 ~ 1998 *
1) Mean annual discharge 4) Mean annual minimum discharge 2) Maximum discharge * Record is not continuous 3) Mean annual maximum discharge.
20
Australia-6
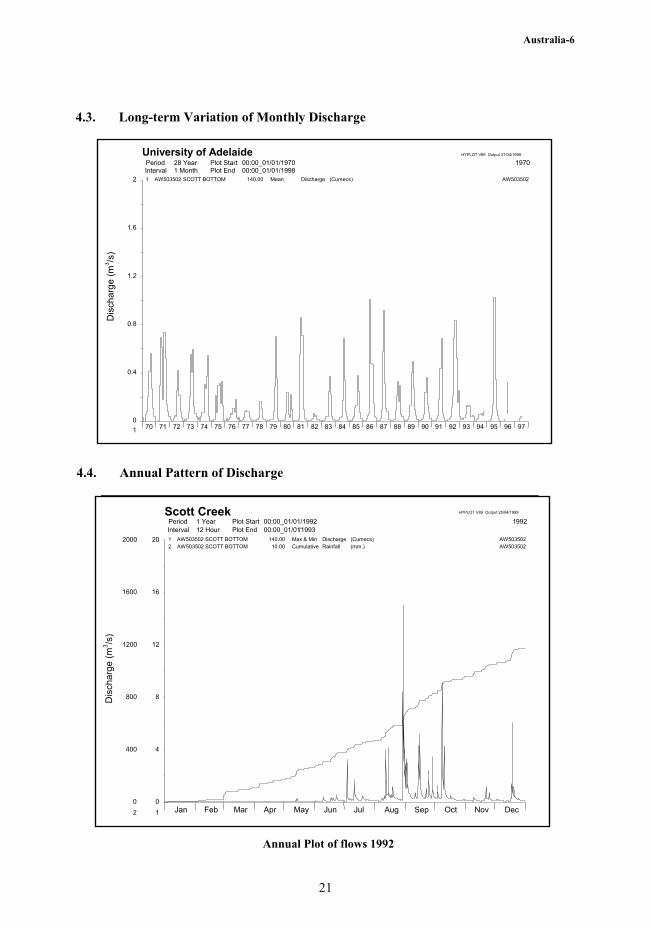
4.3. Long-term Variation of Monthly Discharge D
isch
arge
(m3 /s
)
(Cumecs) Discharge 2
1.6
1.2
0.8
0.4
0 1 97 96 95 94 93 92 91 90 89 88 87 86 85 84 83 82 81 80 79 78 77 76 75 74 73 72 71 70
Univ rsity of Adelaide ePeriod
HYPLOT V89 Output 27/04/1999 1970
AW503502 00:00_01/01/1998 00:00_01/01/1970 Mean 140.00 Interval
1 Plot Start Plot End 28 Year
1 Month AW503502 SCOTT BOTTOM
4.4. Annual Pattern of Discharge
400
0 2
1600 16
8
12
800
1200
Dis
char
ge (m
3 /s)
4
0 1 Dec Nov Oct Sep Aug Jul Jun May Apr Mar Feb Jan
Scott Creek HYPLOT V89 Output 25/04/1999 1992 Period Interval Plot Start Plot End
1 Year 12 Hour 00:00_01/01 /1993 2 00:00_01/01/199
20 1 2 AW503502 SC 3502 OTT BOTTOM SCOTT BOTTOM
140.00 10.00 Max & Min
Cumulative Dischar egRainfall (Cum s)ec
(mm.) AW503502 AW503502 2000
AW50
Annual Plot of flows 1992
21
Australia-6
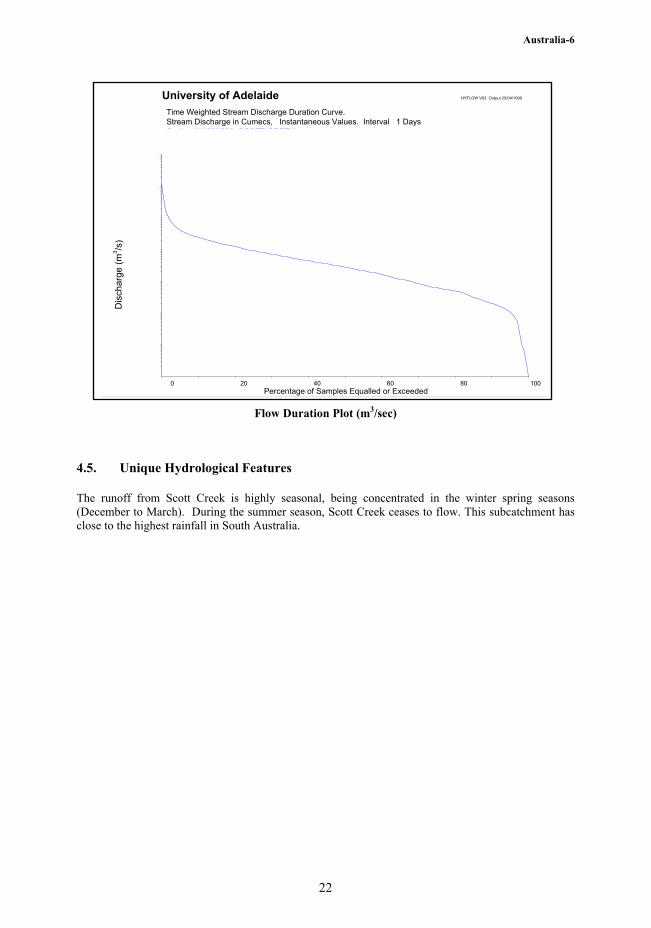
University of Adelaide HYFLOW V63 Output 25/04/1999
Time Weighted Stream Discharge Duration Curve. Stream Discharge in Cumecs, Instantaneous Values. Interval 1 Days
Percentage of Samples Equalled or Exceeded 0 20 40 60 80 100
0.0001
0.00001
0.001
0.01
0.1
1
10
100100
10
1
0.1
0.01
0.001
0.0001
0.00001
Station AW503502 SCOTT CREEKPeriod of Record 28/03/1969 to 18/11/1998Station AW503502 SCOTT CREEK Period of Record 28/03/1969 to 18/11/1998
Dis
char
ge (m
3 /s)
Flow Duration Plot (m3/sec)
4.5. Unique Hydrological Features
The runoff from Scott Creek is highly seasonal, being concentrated in the winter spring seasons (December to March). During the summer season, Scott Creek ceases to flow. This subcatchment has close to the highest rainfall in South Australia.
22
Australia-6
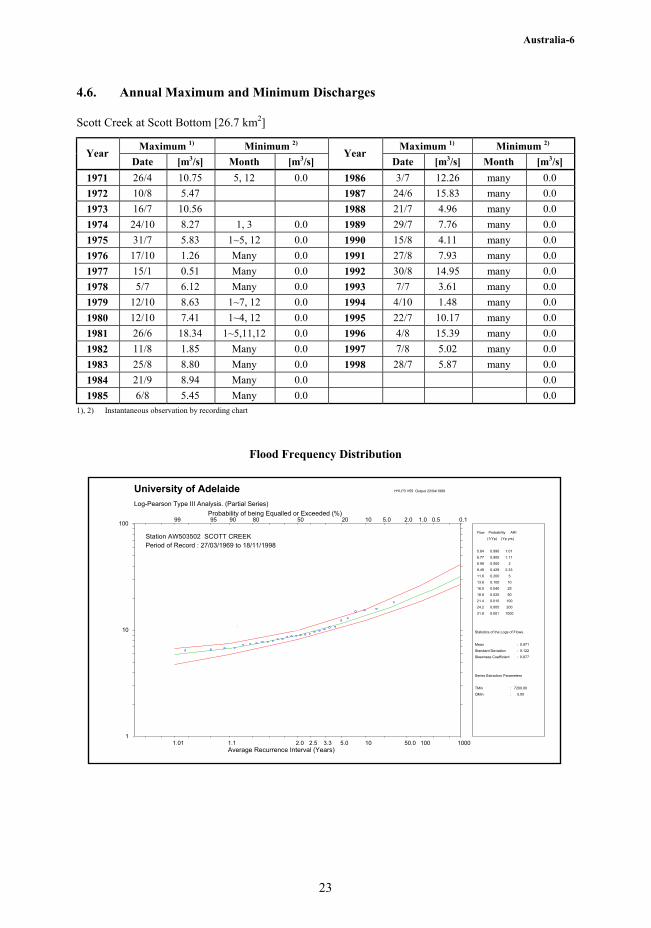
4.6. Annual Maximum and Minimum Discharges
Scott Creek at Scott Bottom [26.7 km2]
Maximum 1) Minimum 2) Maximum 1) Minimum 2) Year
Date [m3/s] Month [m3/s] Year
Date [m3/s] Month [m3/s] 1971 26/4 10.75 5, 12 0.0 1986 3/7 12.26 many 0.0 1972 10/8 5.47 1987 24/6 15.83 many 0.0 1973 16/7 10.56 1988 21/7 4.96 many 0.0 1974 24/10 8.27 1, 3 0.0 1989 29/7 7.76 many 0.0 1975 31/7 5.83 1~5, 12 0.0 1990 15/8 4.11 many 0.0 1976 17/10 1.26 Many 0.0 1991 27/8 7.93 many 0.0 1977 15/1 0.51 Many 0.0 1992 30/8 14.95 many 0.0 1978 5/7 6.12 Many 0.0 1993 7/7 3.61 many 0.0 1979 12/10 8.63 1~7, 12 0.0 1994 4/10 1.48 many 0.0 1980 12/10 7.41 1~4, 12 0.0 1995 22/7 10.17 many 0.0 1981 26/6 18.34 1~5,11,12 0.0 1996 4/8 15.39 many 0.0 1982 11/8 1.85 Many 0.0 1997 7/8 5.02 many 0.0 1983 25/8 8.80 Many 0.0 1998 28/7 5.87 many 0.0 1984 21/9 8.94 Many 0.0 0.0 1985 6/8 5.45 Many 0.0 0.0
1), 2) Instantaneous observation by recording chart
Flood Frequency Distribution
University of Adelaide HYLP3 V55 Output 22/04/1999
Log-Pearson Type III Analysis. (Partial Series)
Average Recurrence Interval (Years)
Probability of being Equalled or Exceeded (%)
1.01 1.1 2.0 2.5 3.3 5.0 10 50.0 100 1000
99 95 90 80 50 20 10 5.0 2.0 1.0 0.5 0.1
1
10
100
Station AW503502 SCOTT CREEKPeriod of Record : 27/03/1969 to 18/11/1998
Flow Probability ARI
(1/Yp) (Yp yrs)
5.84 0.990 1.01
6.77 0.900 1.11
8.99 0.500 2
9.49 0.429 2.33
11.6 0.200 5
13.6 0.100 10
16.5 0.040 25
18.8 0.020 50
21.4 0.010 100
24.2 0.005 200
31.8 0.001 1000
Statistics of the Logs of Flows.
Mean : 0.971
Standard Deviation : 0.122
Skewness Coefficient : 0.877
Series Extraction Parameters
TMin : 7200.00
QMin : 5.00
Stre
am D
isch
arge
in C
umec
sSt
ream
Dis
char
ge (m
3 /s)
5% 5% Confidence Limit Confidence Limit
95% Confidence Limit 95% Confidence Limit
23
Australia-6
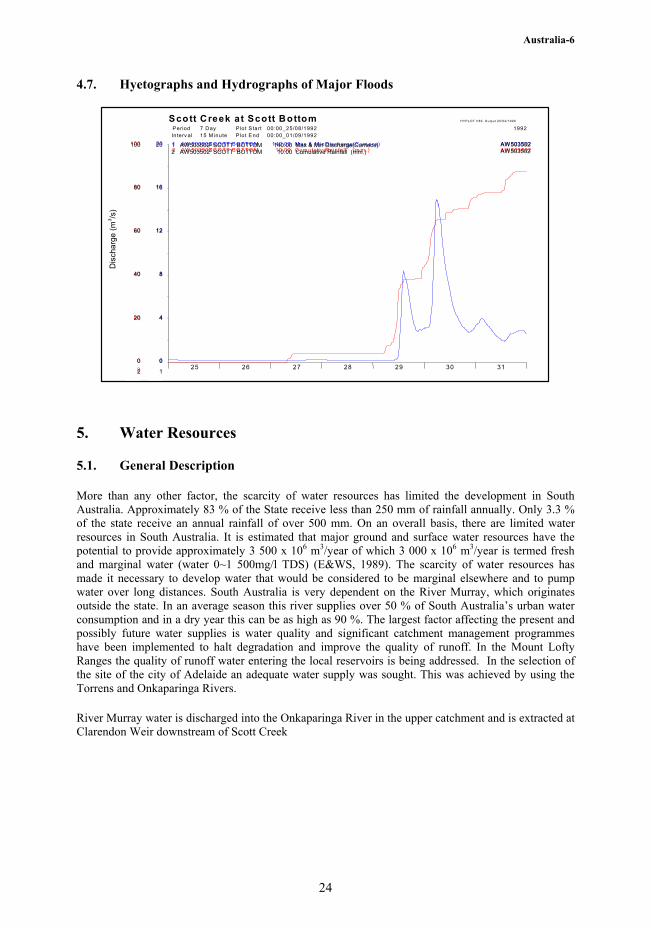
4.7. Hyetographs and Hydrographs of Major Floods
Scott Creek at Scott Bottom H YP LOT V 89 O utput 25 /04/1999
25 26 27 28 29 30 31
Period In terv al
Plot S tart Plot End
7 Day 15 M inute 00:00_01/09/1992
00:00_25/08/1992 1992
1
0
4
8
12
16
20 20
16
12
8
4
0
1
1 AW 503502 SC O TT BO TTO M 140.00 M ax & M in Discharge (Cum ecs) 2 AW 503502 SC O TT BO TTO M 10.00 Cum ulativ e Rainfall (m m .)1 AW503502 SCOTT BOTTOM 140.00 Max & Min Discharge(Cumecs) 2 AW503502 SCOTT BOTTOM 10.00 Cumulative Rainfall (mm.)
AW 503502 AW 503502 AW503502 AW503502
0
1
2
20
40
60
80
00
100
80
60
40
20
0
2
Dis
char
ge (m
3 /s)
5. Water Resources
5.1. General Description
More than any other factor, the scarcity of water resources has limited the development in South Australia. Approximately 83 % of the State receive less than 250 mm of rainfall annually. Only 3.3 % of the state receive an annual rainfall of over 500 mm. On an overall basis, there are limited water resources in South Australia. It is estimated that major ground and surface water resources have the potential to provide approximately 3 500 x 106 m3/year of which 3 000 x 106 m3/year is termed fresh and marginal water (water 0~1 500mg/l TDS) (E&WS, 1989). The scarcity of water resources has made it necessary to develop water that would be considered to be marginal elsewhere and to pump water over long distances. South Australia is very dependent on the River Murray, which originates outside the state. In an average season this river supplies over 50 % of South Australia’s urban water consumption and in a dry year this can be as high as 90 %. The largest factor affecting the present and possibly future water supplies is water quality and significant catchment management programmes have been implemented to halt degradation and improve the quality of runoff. In the Mount Lofty Ranges the quality of runoff water entering the local reservoirs is being addressed. In the selection of the site of the city of Adelaide an adequate water supply was sought. This was achieved by using the Torrens and Onkaparinga Rivers.
River Murray water is discharged into the Onkaparinga River in the upper catchment and is extracted at Clarendon Weir downstream of Scott Creek
24
Australia-6
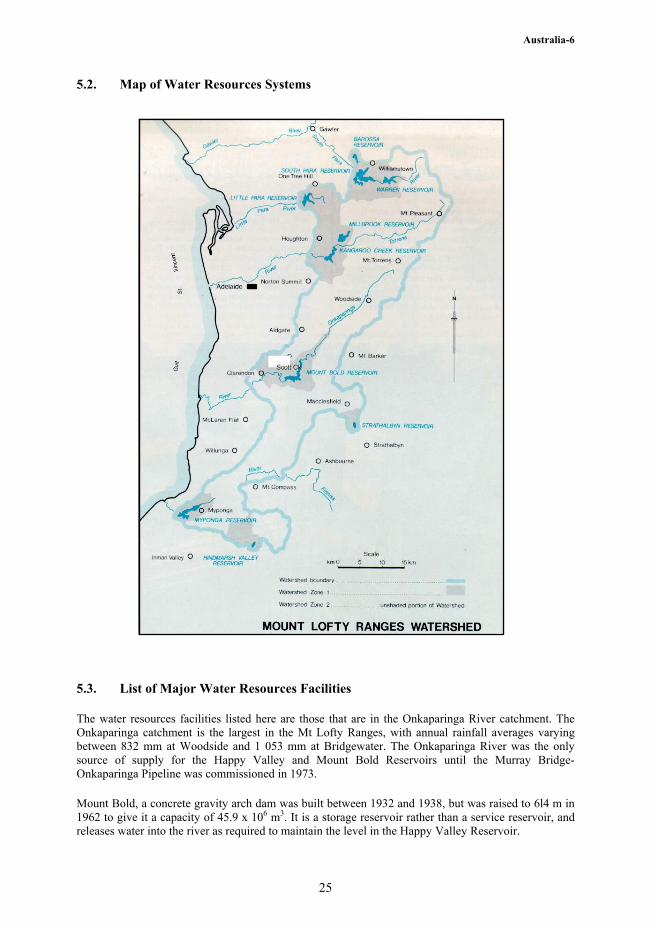
5.2. Map of Water Resources Systems
5.3. List of Major Water Resources Facilities
The water resources facilities listed here are those that are in the Onkaparinga River catchment. The Onkaparinga catchment is the largest in the Mt Lofty Ranges, with annual rainfall averages varying between 832 mm at Woodside and 1 053 mm at Bridgewater. The Onkaparinga River was the only source of supply for the Happy Valley and Mount Bold Reservoirs until the Murray Bridge-Onkaparinga Pipeline was commissioned in 1973.
Mount Bold, a concrete gravity arch dam was built between 1932 and 1938, but was raised to 6l4 m in 1962 to give it a capacity of 45.9 x 10⁶ m3. It is a storage reservoir rather than a service reservoir, and releases water into the river as required to maintain the level in the Happy Valley Reservoir.
25
Australia-6
Happy Valley is a service reservoir which although relatively small (12.7x10⁶ m3) serves more consumers than any other reservoir. It is an off-stream storage, formed by an earthen embankment built between 1892 and 1896. It is fed by a 5 km long tunnel from the Clarendon Weir.
Major Reservoirs
Name of river* Name of dam (reservoir)
Catchment area [km2]
Gross capacity [106m3] Purpose 1) Year of
completion Happy Valley
Reservoir Earth Dam, Offstream Storage
12.7 W 1896
Onkaparinga River
Mt Bold Reservoir 384 30.2
45.9
W 1938
mod 1962 1) W: Municipal water supply
6. Socio-cultural Characteristics
The climate of the Mt Lofty Ranges was conducive to being populated by early settlers. It had the highest annual rainfall area within the state. Settlement of other country regions was confined to places that had small streams, soaks or springs augmented by small earthen dams and wells. The development of South Australia has been characterized by the development of pipelines from the River Murray. The River Murray provides a source of water for domestic, industry and agricultural pursuits along its banks. It is also the main source of water for Adelaide and many towns far distant from the river including Whyalla, Woomera and Keith. Serious consideration for augmenting Adelaide’s water supply include utilizing local runoff, rainwater tanks, urban stormwater runoff in conjunction with aquifer storage and recovery, and treated effluent.
7. References, Databooks and Bibliography
Bureau of Meteorology, (1988): Climatic Atlas of Australia, AGPS, Canberra, April 1988, 70 pp. Daniell, T.M and Hill, P.I., (1993): Flood Hydrology Study of the Onkaparinga River (Report for the
Onkaparinga Flood Study Steering Committee) Department of Civil and Environmental Engineering, University of Adelaide, May 1993, 156pp.
Department of Environment Heritage and Aboriginal Affairs, (1999): South Central Regional Network- Water Resources Project (unpublished Report).
Department of Primary Industries and Energy, (1987): 1985 Review of Australia’s Water Resources and Water Use, Volumes 1 and 2, AGPS, Canberra, November 1987, 114 pp.
Department of Resources and Energy, (1983): Water 2000: Consultants Report No. 7, Water Quality Issues, AGPS, Canberra, 310 pp.
Department of Resources and Energy, (1983): Water 2000: Consultants Report No. 9, In-stream and Environmental Issues, AGPS, Canberra, 374 pp.
Department of Resources and Energy, (1983): Water 2000: Consultants Report No. 12, Water Demand and Availability with reference to Particular Regions, AGPS, Canberra, 321 pp.
Engineering and Water Supply Department, (1988): Development of South Australia’s Water Resources, Information Bulletin No.11, April 1988.
Engineering and Water Supply Department, (1988): Adelaide’s Water Supply -Summary of the System, Information Bulletin No.7, April 1988.
26