scott layne, nexterra systems
TRANSCRIPT
BioEnergy Conference
Oakland University, April 2011
Biomass Gasification
Nexterra Systems Corp.
www.oakland.edu/cerc School of Engineering & Computer Science – Clean Energy Research Center
Presenter
Scott Layne, CEM
Regional VP, Sales
Technology: Gasification
Feedstocks: Woody waste
Output: Syngas, hot water, steam, electricity
Size Range: 2-10 mWe, 10 to 120 million BTU/hr
Commercial Status: Commercial since 2003
Projects Installed: 6 systems, 3 in construction
Target Market: Institutional, industrial, government, district
energy, wastewater treatment
1 │
BioEnergy Conference
Oakland University, April 2011
BIOMASS GASIFICATION
Domestic, Dispatchable Renewable Heat & Power
www.oakland.edu/cerc School of Engineering & Computer Science – Clean Energy Research Center
Presenter
Scott Layne, CEM
Nexterra Systems Corp.
Presentation:
Background & overview of technologies
Business of biomass
Example projects
2 │
Gasification Background
4
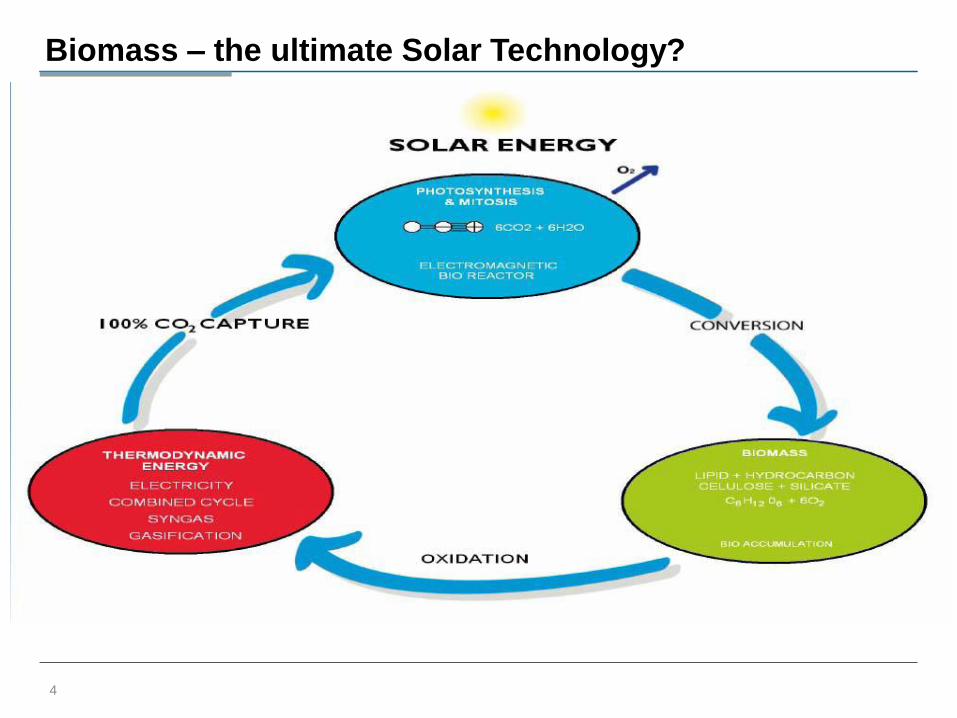
Biomass – the ultimate Solar Technology?
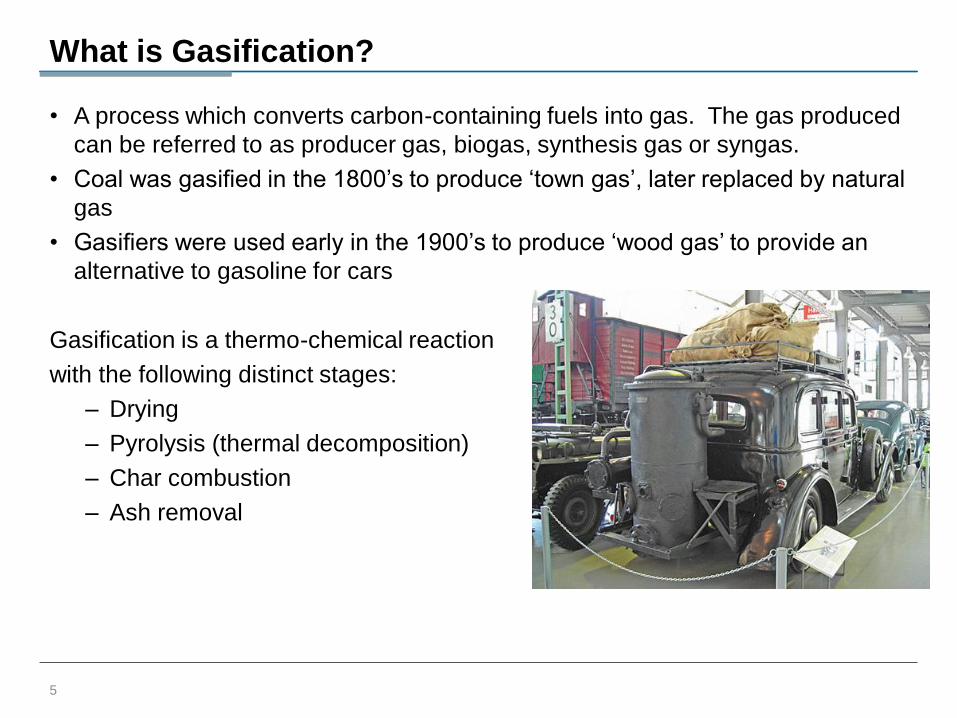
What is Gasification?
• A process which converts carbon-containing fuels into gas. The gas produced
can be referred to as producer gas, biogas, synthesis gas or syngas.
• Coal was gasified in the 1800‟s to produce „town gas‟, later replaced by natural
gas
• Gasifiers were used early in the 1900‟s to produce „wood gas‟ to provide an
alternative to gasoline for cars
Gasification is a thermo-chemical reaction
with the following distinct stages:
– Drying
– Pyrolysis (thermal decomposition)
– Char combustion
– Ash removal
5
Gasification Technologies
• Fast Pyrolosis
• Slow Pyrolosis
• Anaerobic Digestion
• Dry Anaerobic Digestion
• High Temperature Decomposition (Plasma)
6
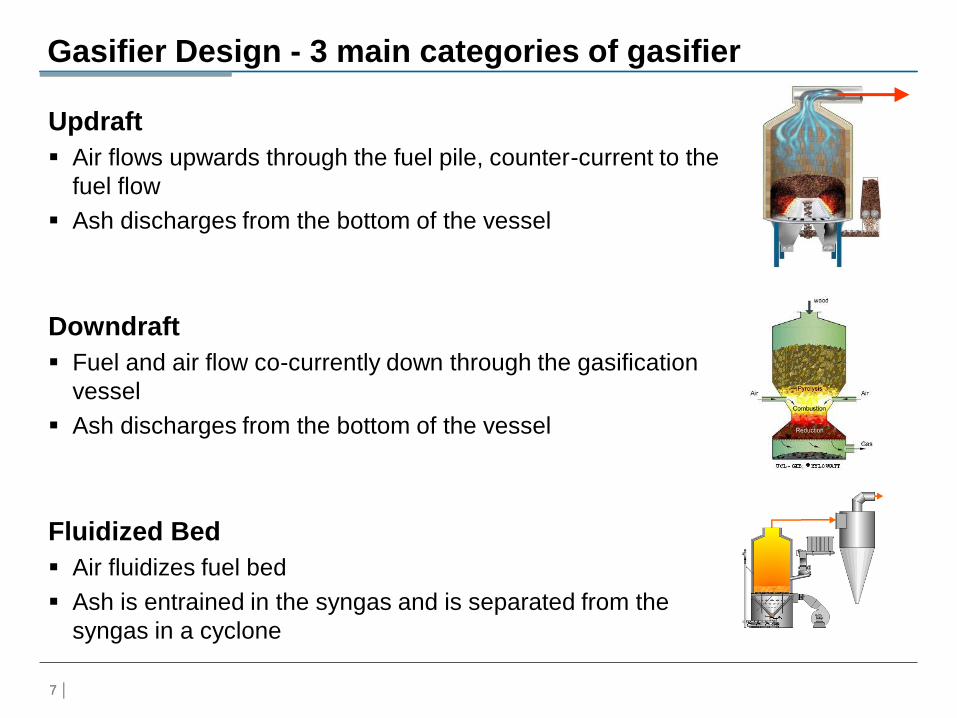
Gasifier Design - 3 main categories of gasifier
Updraft
Air flows upwards through the fuel pile, counter-current to the
fuel flow
Ash discharges from the bottom of the vessel
Downdraft
Fuel and air flow co-currently down through the gasification
vessel
Ash discharges from the bottom of the vessel
Fluidized Bed
Air fluidizes fuel bed
Ash is entrained in the syngas and is separated from the
syngas in a cyclone
7 │ 7
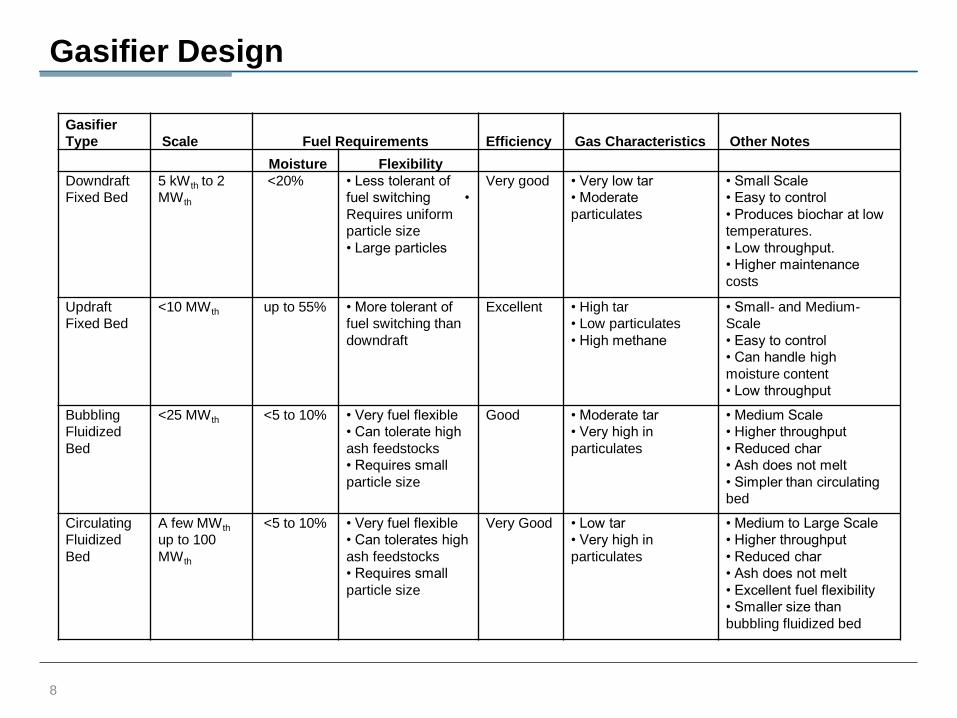
Gasifier Design
Gasifier
Type Scale Fuel Requirements Efficiency Gas Characteristics Other Notes
Moisture Flexibility
Downdraft
Fixed Bed
5 kW th to 2
MW th
<20% • Less tolerant of
fuel switching •
Requires uniform
particle size
• Large particles
Very good • Very low tar
• Moderate
particulates
• Small Scale
• Easy to control
• Produces biochar at low
temperatures.
• Low throughput.
• Higher maintenance
costs
Updraft
Fixed Bed
<10 MW th up to 55% • More tolerant of
fuel switching than
downdraft
Excellent • High tar
• Low particulates
• High methane
• Small- and Medium-
Scale
• Easy to control
• Can handle high
moisture content
• Low throughput
Bubbling
Fluidized
Bed
<25 MW th <5 to 10% • Very fuel flexible
• Can tolerate high
ash feedstocks
• Requires small
particle size
Good • Moderate tar
• Very high in
particulates
• Medium Scale
• Higher throughput
• Reduced char
• Ash does not melt
• Simpler than circulating
bed
Circulating
Fluidized
Bed
A few MW th
up to 100
MW th
<5 to 10% • Very fuel flexible
• Can tolerates high
ash feedstocks
• Requires small
particle size
Very Good • Low tar
• Very high in
particulates
• Medium to Large Scale
• Higher throughput
• Reduced char
• Ash does not melt
• Excellent fuel flexibility
• Smaller size than
bubbling fluidized bed
8
Gasification vs. Combustion
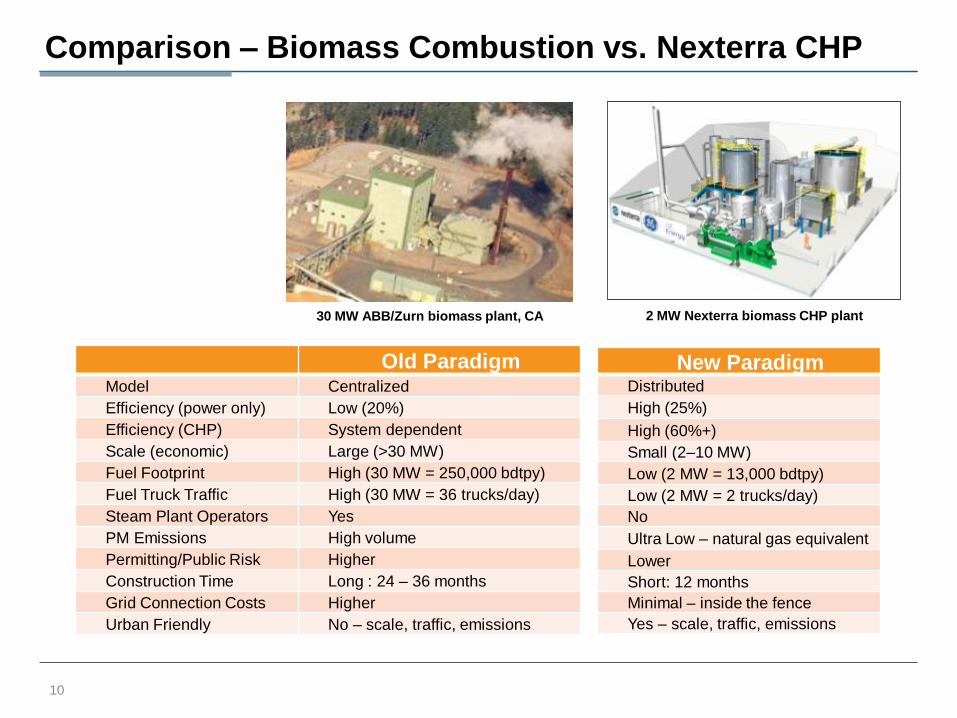
30 MW ABB/Zurn biomass plant, CA 2 MW Nexterra biomass CHP plant
Comparison – Biomass Combustion vs. Nexterra CHP
10
Old Paradigm Model Centralized
Efficiency (power only) Low (20%)
Efficiency (CHP) System dependent
Scale (economic) Large (>30 MW)
Fuel Footprint High (30 MW = 250,000 bdtpy)
Fuel Truck Traffic High (30 MW = 36 trucks/day)
Steam Plant Operators Yes
PM Emissions High volume
Permitting/Public Risk Higher
Construction Time Long : 24 – 36 months
Grid Connection Costs Higher
Urban Friendly No – scale, traffic, emissions
New Paradigm Distributed
High (25%)
High (60%+)
Small (2–10 MW)
Low (2 MW = 13,000 bdtpy)
Low (2 MW = 2 trucks/day)
No
Ultra Low – natural gas equivalent
Lower
Short: 12 months
Minimal – inside the fence
Yes – scale, traffic, emissions
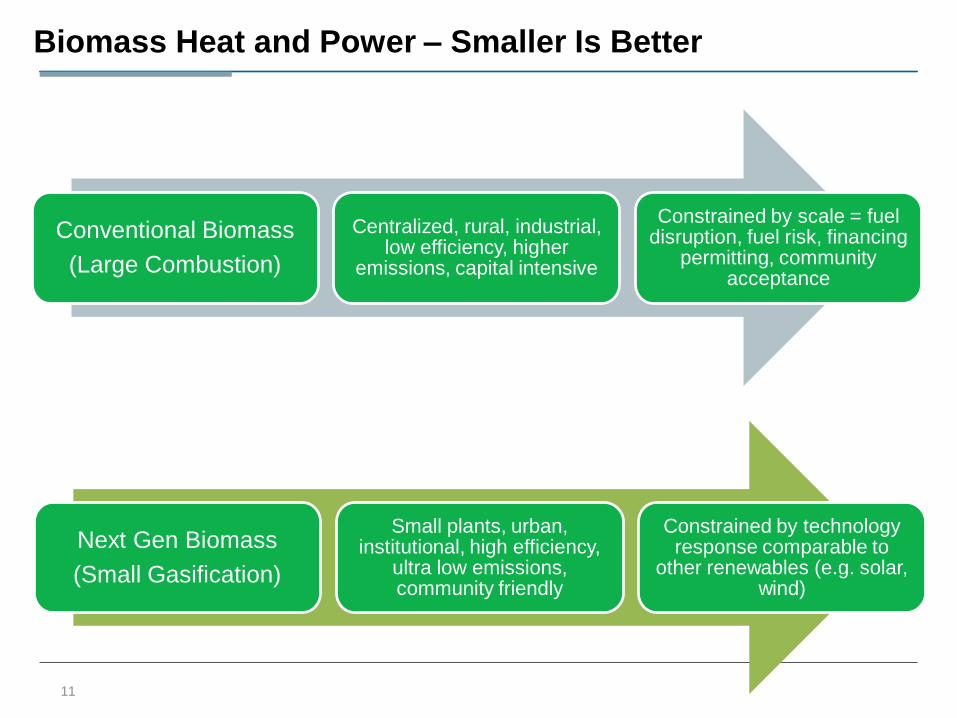
Biomass Heat and Power – Smaller Is Better
Conventional Biomass
(Large Combustion)
Centralized, rural, industrial, low efficiency, higher
emissions, capital intensive
Constrained by scale = fuel disruption, fuel risk, financing
permitting, community acceptance
11
Next Gen Biomass
(Small Gasification)
Small plants, urban, institutional, high efficiency,
ultra low emissions, community friendly
Constrained by technology response comparable to
other renewables (e.g. solar, wind)
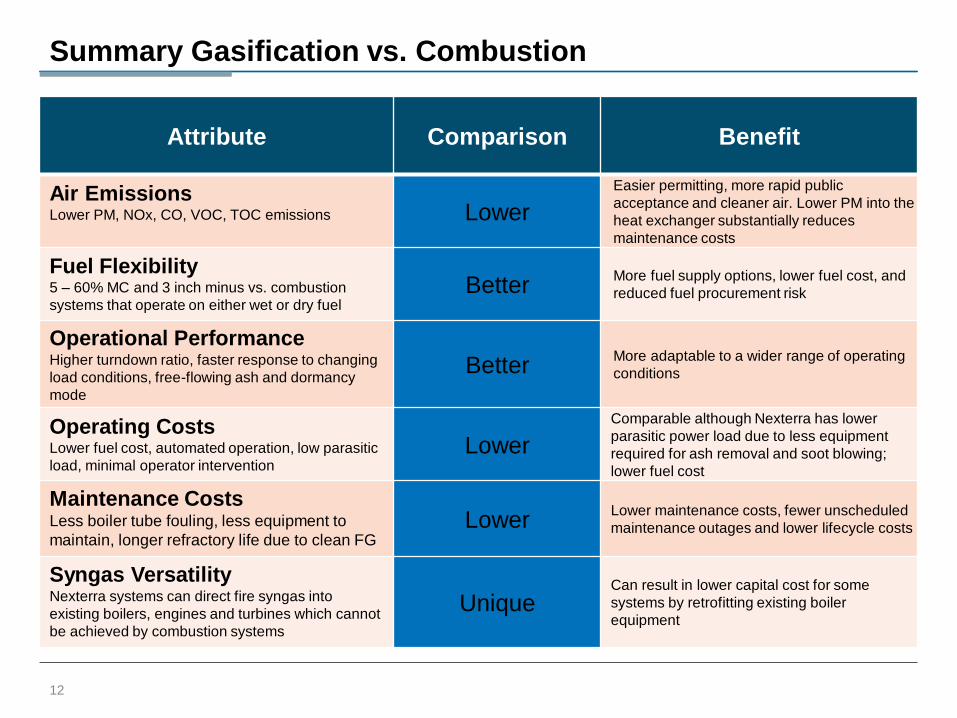
Summary Gasification vs. Combustion
Attribute Comparison Benefit
Air Emissions Lower PM, NOx, CO, VOC, TOC emissions Lower
Easier permitting, more rapid public
acceptance and cleaner air. Lower PM into the
heat exchanger substantially reduces
maintenance costs
Fuel Flexibility 5 – 60% MC and 3 inch minus vs. combustion
systems that operate on either wet or dry fuel Better
More fuel supply options, lower fuel cost, and
reduced fuel procurement risk
Operational Performance Higher turndown ratio, faster response to changing
load conditions, free-flowing ash and dormancy
mode
Better More adaptable to a wider range of operating
conditions
Operating Costs Lower fuel cost, automated operation, low parasitic
load, minimal operator intervention Lower
Comparable although Nexterra has lower
parasitic power load due to less equipment
required for ash removal and soot blowing;
lower fuel cost
Maintenance Costs Less boiler tube fouling, less equipment to
maintain, longer refractory life due to clean FG Lower
Lower maintenance costs, fewer unscheduled
maintenance outages and lower lifecycle costs
Syngas Versatility Nexterra systems can direct fire syngas into
existing boilers, engines and turbines which cannot
be achieved by combustion systems
Unique Can result in lower capital cost for some
systems by retrofitting existing boiler
equipment
12
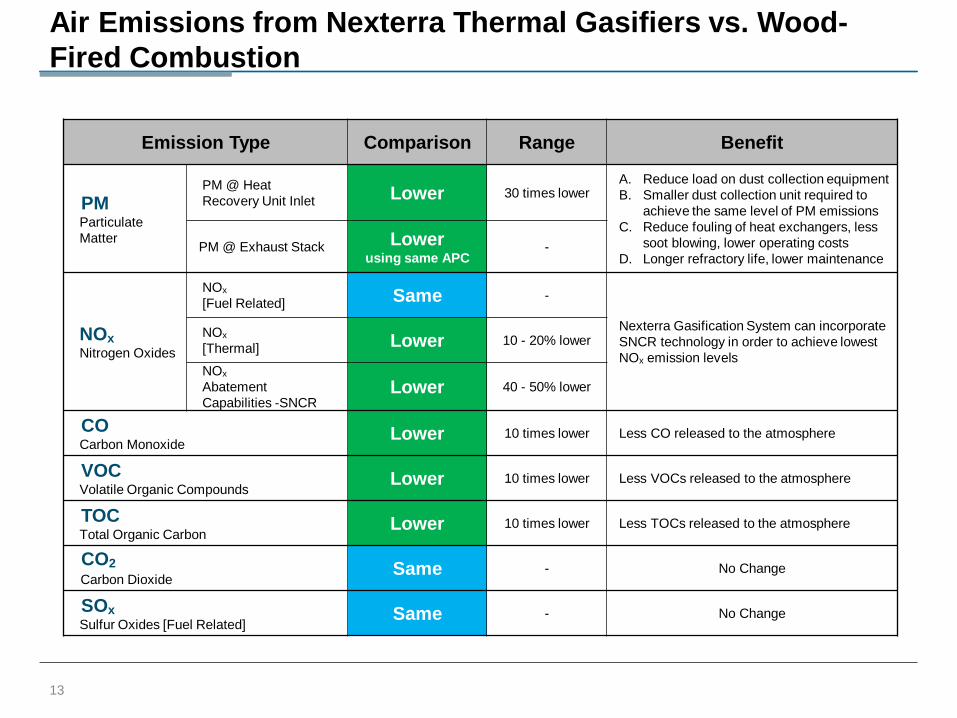
Air Emissions from Nexterra Thermal Gasifiers vs. Wood-
Fired Combustion
Emission Type Comparison Range Benefit
PM Particulate
Matter
PM @ Heat
Recovery Unit Inlet Lower 30 times lower A. Reduce load on dust collection equipment
B. Smaller dust collection unit required to
achieve the same level of PM emissions
C. Reduce fouling of heat exchangers, less
soot blowing, lower operating costs
D. Longer refractory life, lower maintenance PM @ Exhaust Stack Lower
using same APC -
NOx Nitrogen Oxides
NOx
[Fuel Related] Same -
Nexterra Gasification System can incorporate
SNCR technology in order to achieve lowest
NOx emission levels
NOx
[Thermal] Lower 10 - 20% lower
NOx
Abatement
Capabilities -SNCR Lower 40 - 50% lower
CO Carbon Monoxide
Lower 10 times lower Less CO released to the atmosphere
VOC Volatile Organic Compounds
Lower 10 times lower Less VOCs released to the atmosphere
TOC Total Organic Carbon
Lower 10 times lower Less TOCs released to the atmosphere
CO2 Carbon Dioxide
Same - No Change
SOx Sulfur Oxides [Fuel Related]
Same - No Change
13
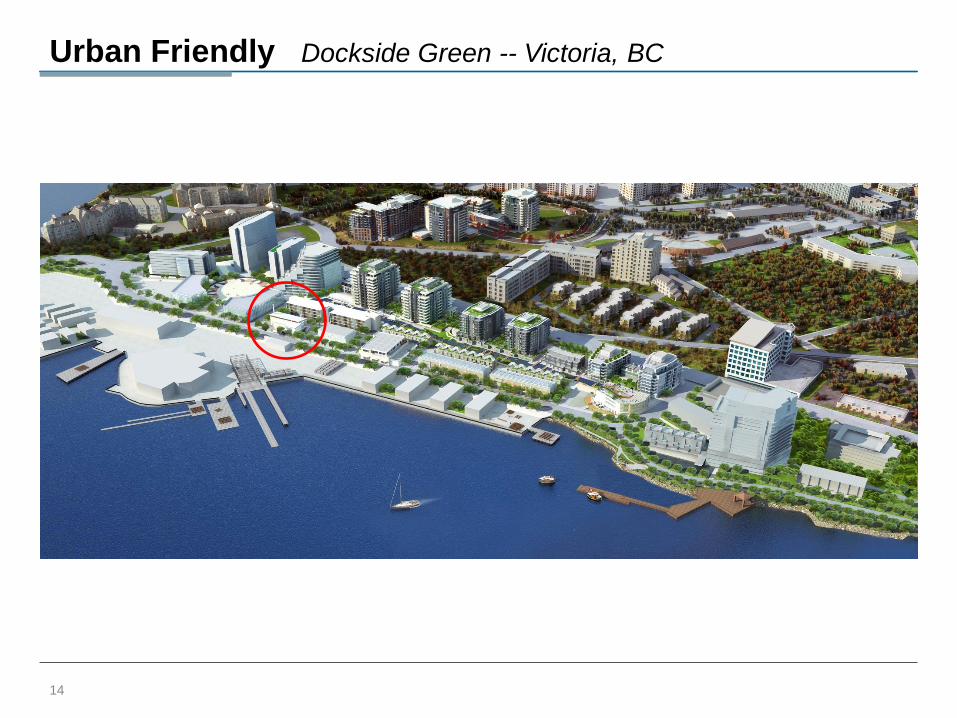
Urban Friendly Dockside Green -- Victoria, BC
14
The Business of Biomass
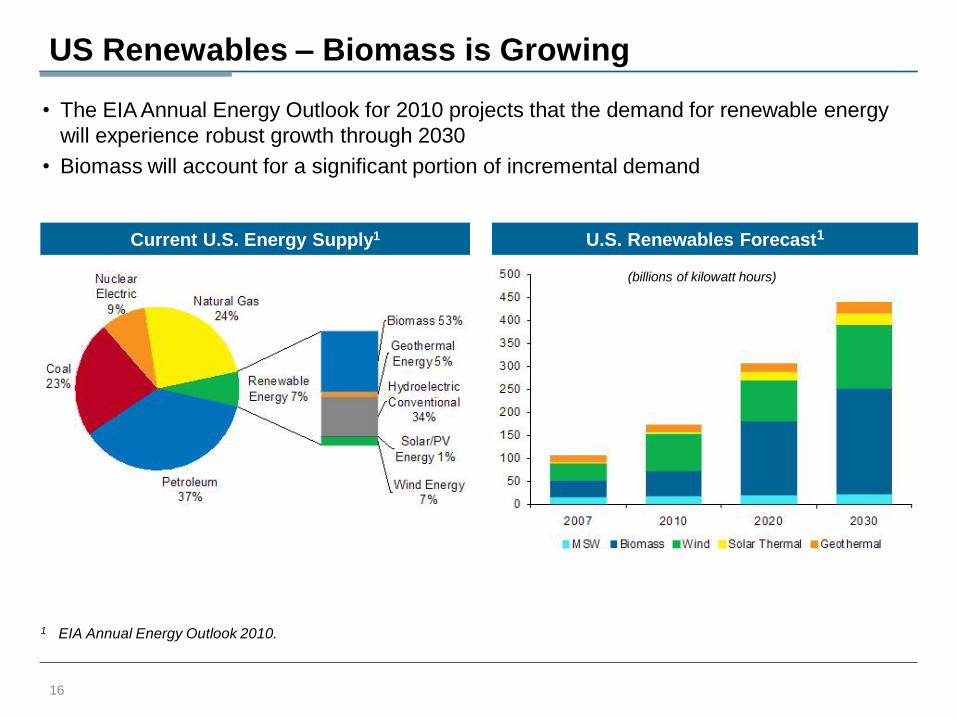
US Renewables – Biomass is Growing
• The EIA Annual Energy Outlook for 2010 projects that the demand for renewable energy
will experience robust growth through 2030
• Biomass will account for a significant portion of incremental demand
1 EIA Annual Energy Outlook 2010.
Current U.S. Energy Supply1 U.S. Renewables Forecast1
(billions of kilowatt hours)
16
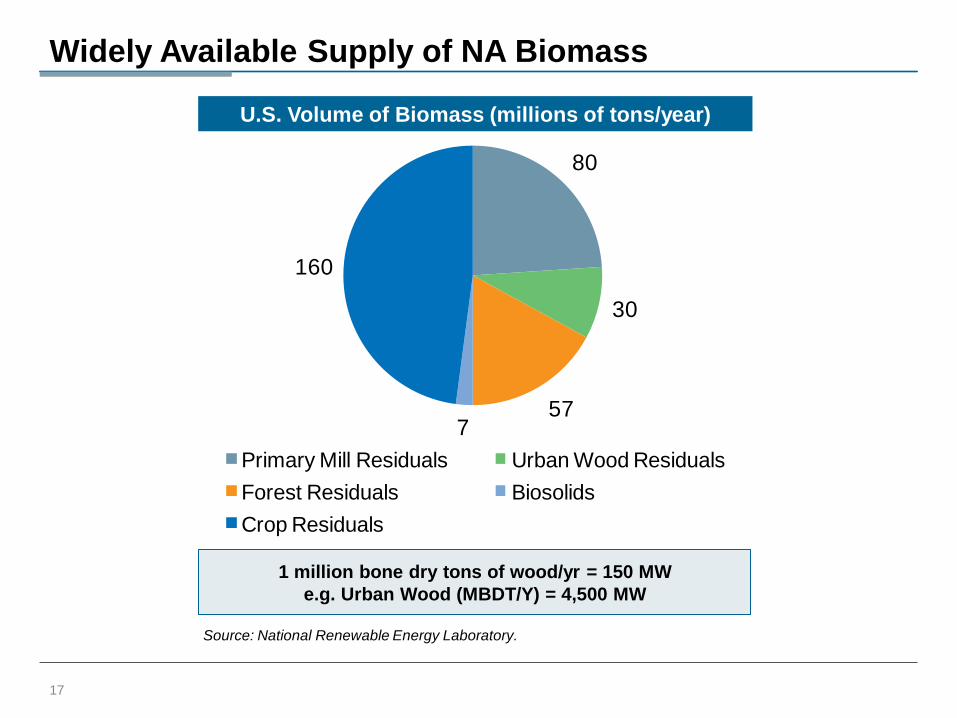
Widely Available Supply of NA Biomass
80
30
577
160
Primary Mill Residuals Urban Wood Residuals
Forest Residuals Biosolids
Crop Residuals
1 million bone dry tons of wood/yr = 150 MW
e.g. Urban Wood (MBDT/Y) = 4,500 MW
U.S. Volume of Biomass (millions of tons/year)
Source: National Renewable Energy Laboratory.
17
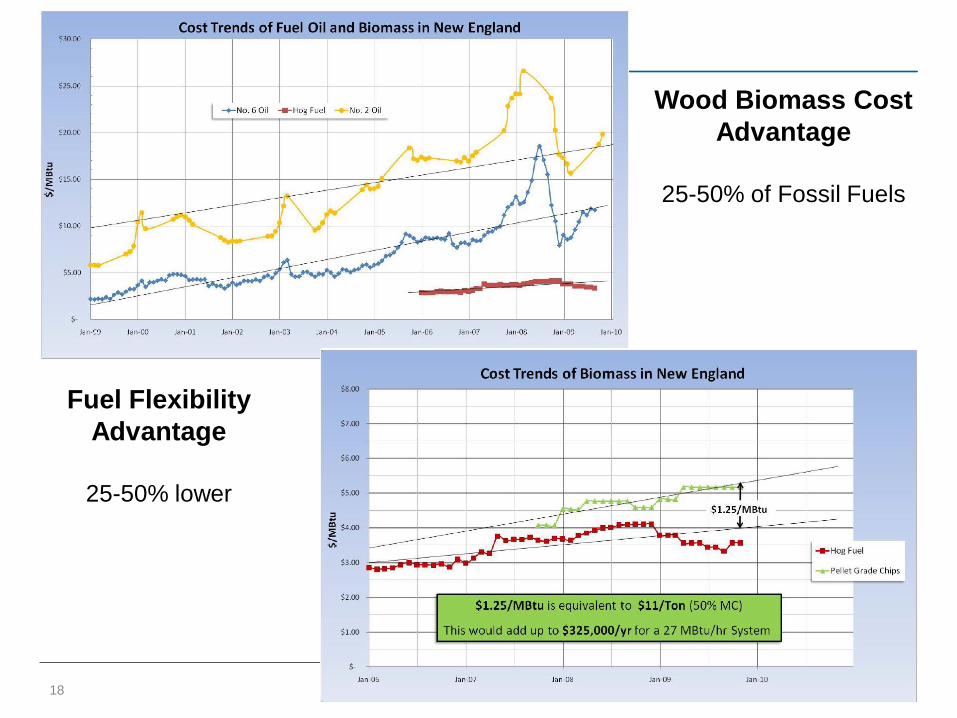
Wood Biomass Cost
Advantage
25-50% of Fossil Fuels
Fuel Flexibility
Advantage
25-50% lower
18
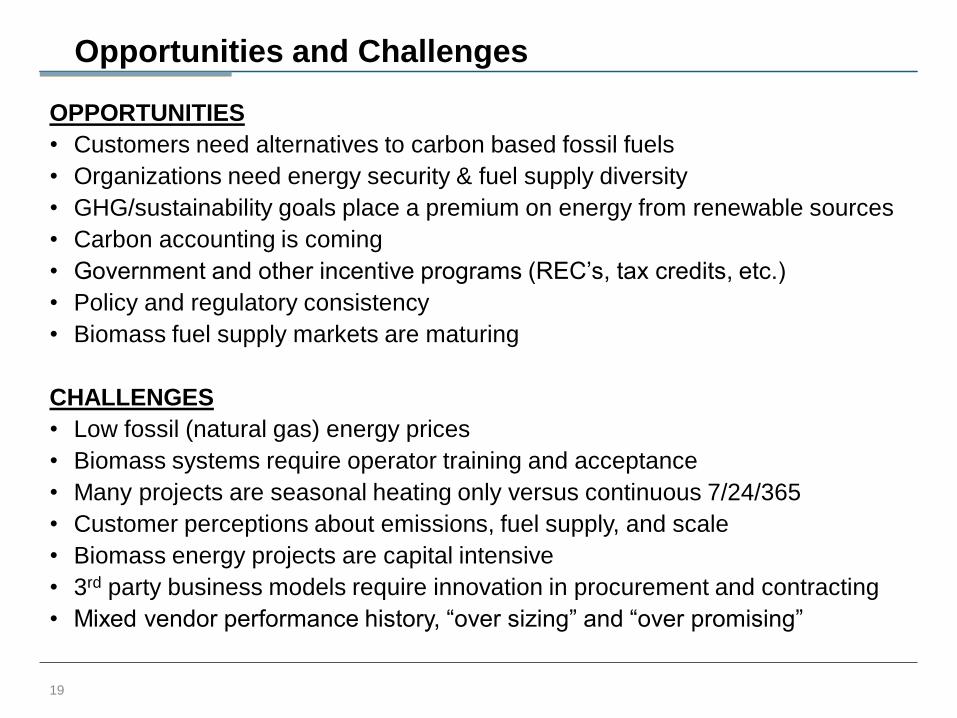
Opportunities and Challenges
OPPORTUNITIES
• Customers need alternatives to carbon based fossil fuels
• Organizations need energy security & fuel supply diversity
• GHG/sustainability goals place a premium on energy from renewable sources
• Carbon accounting is coming
• Government and other incentive programs (REC‟s, tax credits, etc.)
• Policy and regulatory consistency
• Biomass fuel supply markets are maturing
CHALLENGES
• Low fossil (natural gas) energy prices
• Biomass systems require operator training and acceptance
• Many projects are seasonal heating only versus continuous 7/24/365
• Customer perceptions about emissions, fuel supply, and scale
• Biomass energy projects are capital intensive
• 3rd party business models require innovation in procurement and contracting
• Mixed vendor performance history, “over sizing” and “over promising”
19
Overview of Nexterra Technology
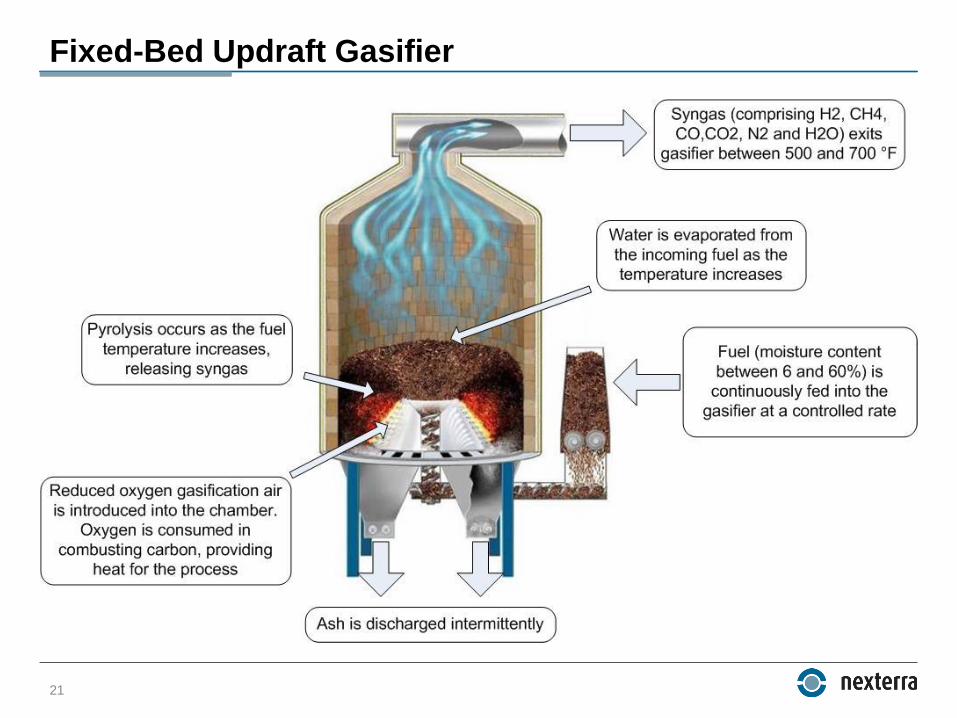
Fixed-Bed Updraft Gasifier
21
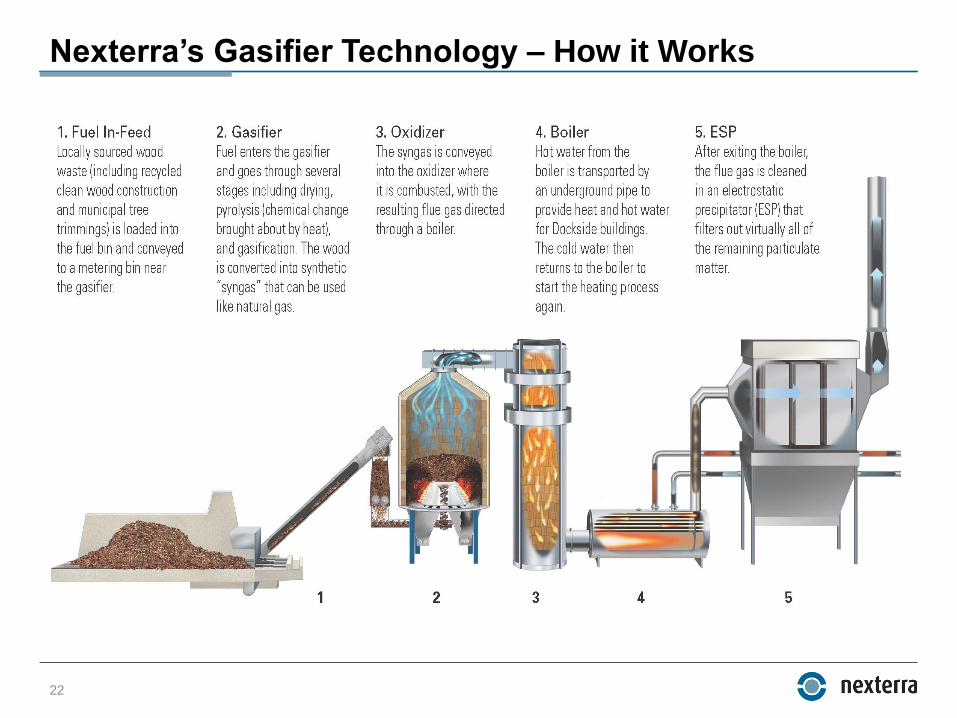
Nexterra’s Gasifier Technology – How it Works
22
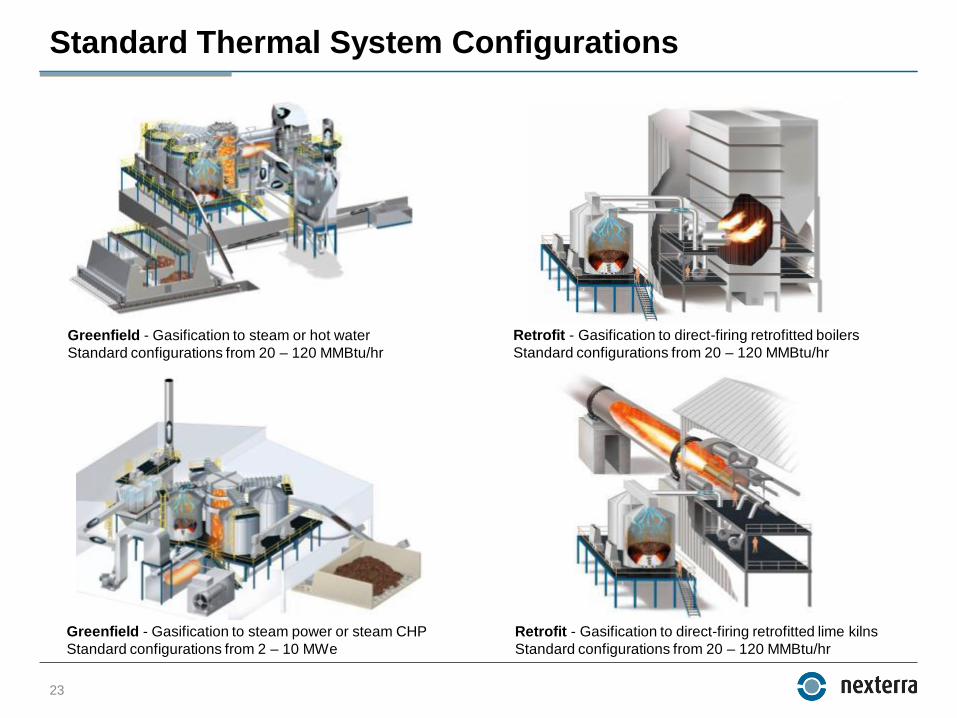
Standard Thermal System Configurations
Greenfield - Gasification to steam or hot water
Standard configurations from 20 – 120 MMBtu/hr
Greenfield - Gasification to steam power or steam CHP
Standard configurations from 2 – 10 MWe
Retrofit - Gasification to direct-firing retrofitted boilers
Standard configurations from 20 – 120 MMBtu/hr
Retrofit - Gasification to direct-firing retrofitted lime kilns
Standard configurations from 20 – 120 MMBtu/hr
23
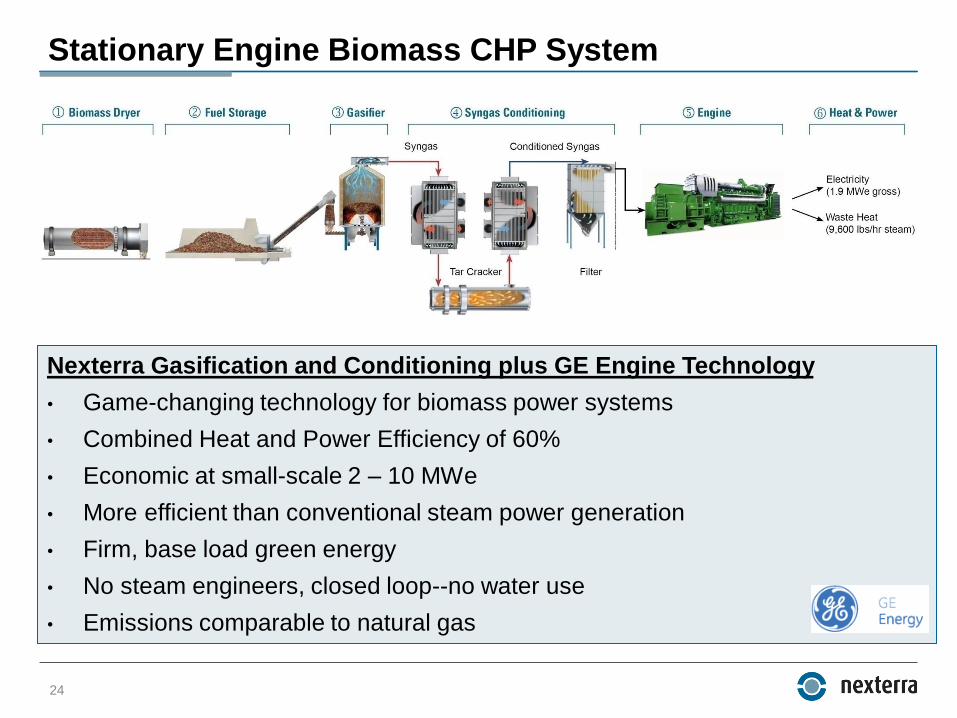
Stationary Engine Biomass CHP System
24
Nexterra Gasification and Conditioning plus GE Engine Technology
• Game-changing technology for biomass power systems
• Combined Heat and Power Efficiency of 60%
• Economic at small-scale 2 – 10 MWe
• More efficient than conventional steam power generation
• Firm, base load green energy
• No steam engineers, closed loop--no water use
• Emissions comparable to natural gas
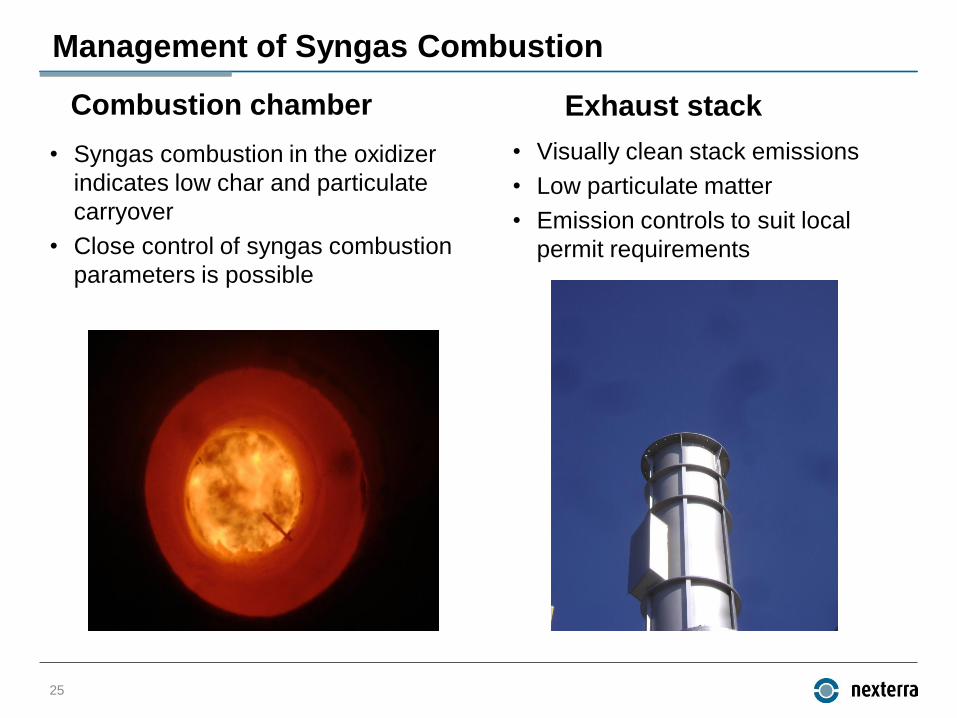
• Syngas combustion in the oxidizer
indicates low char and particulate
carryover
• Close control of syngas combustion
parameters is possible
Exhaust stack
• Visually clean stack emissions
• Low particulate matter
• Emission controls to suit local
permit requirements
Combustion chamber
Management of Syngas Combustion
25
Gasification Technologies
27
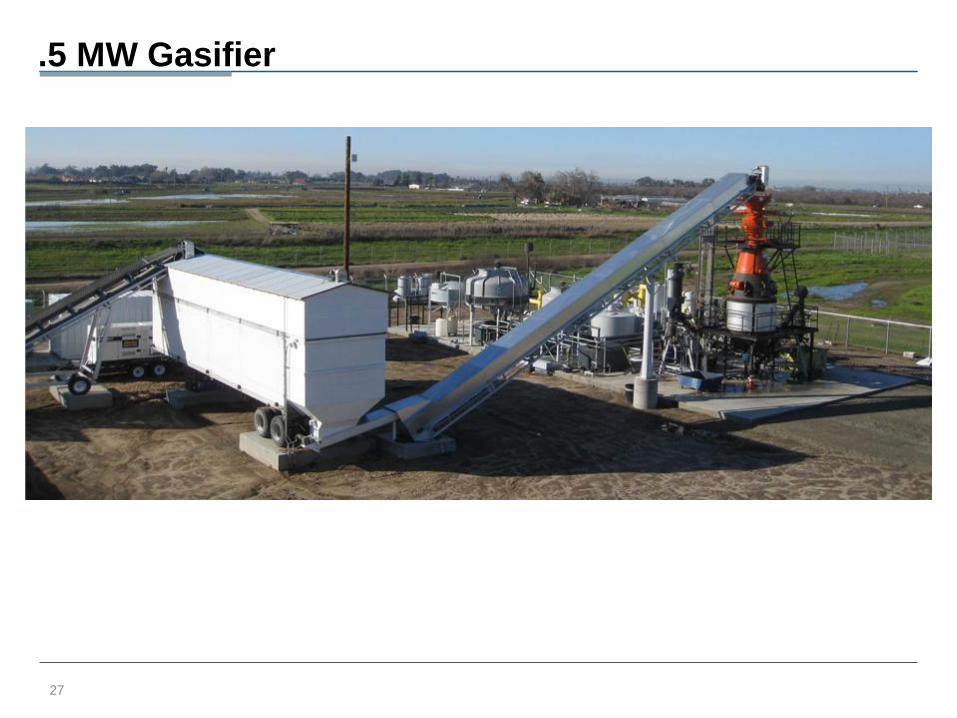
.5 MW Gasifier
28
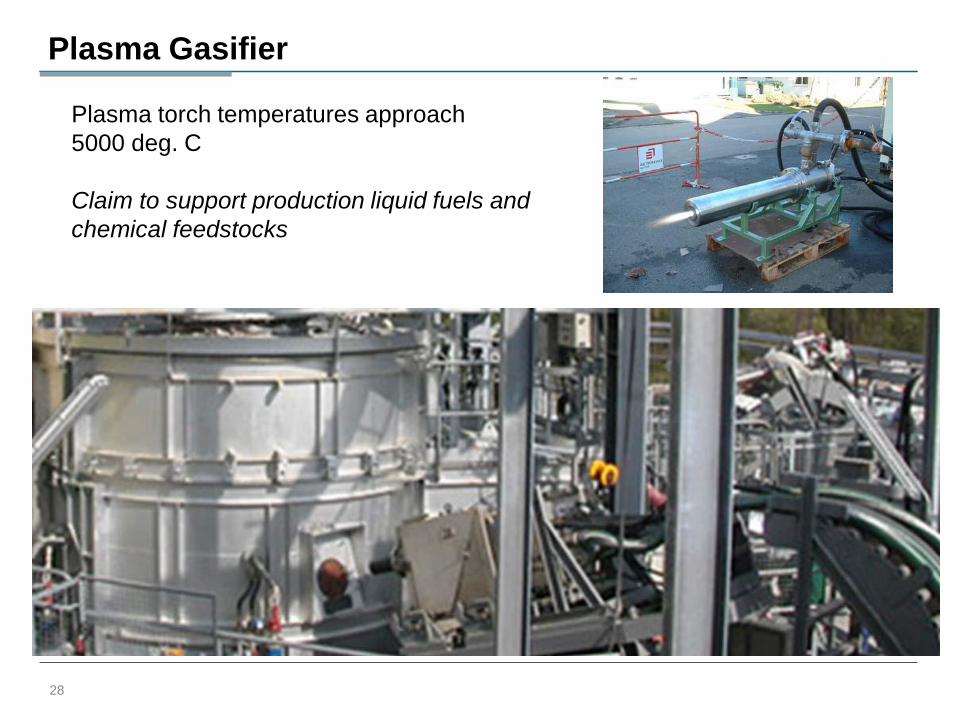
Plasma Gasifier
Plasma torch temperatures approach
5000 deg. C
Claim to support production liquid fuels and
chemical feedstocks
Biomass Feedstocks
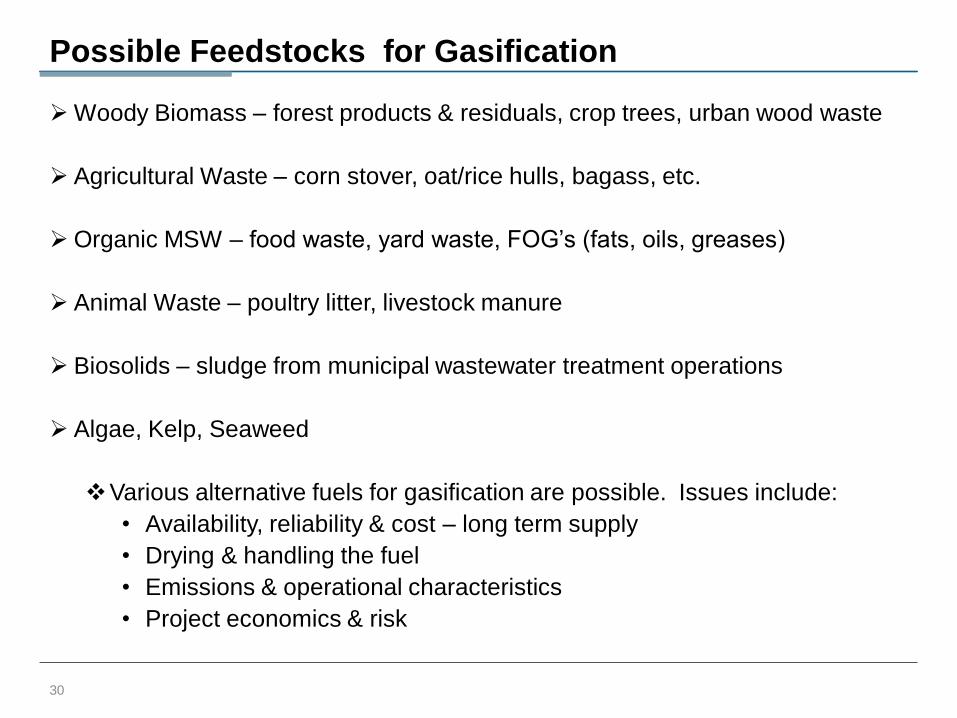
Possible Feedstocks for Gasification
Woody Biomass – forest products & residuals, crop trees, urban wood waste
Agricultural Waste – corn stover, oat/rice hulls, bagass, etc.
Organic MSW – food waste, yard waste, FOG‟s (fats, oils, greases)
Animal Waste – poultry litter, livestock manure
Biosolids – sludge from municipal wastewater treatment operations
Algae, Kelp, Seaweed
Various alternative fuels for gasification are possible. Issues include:
• Availability, reliability & cost – long term supply
• Drying & handling the fuel
• Emissions & operational characteristics
• Project economics & risk
30
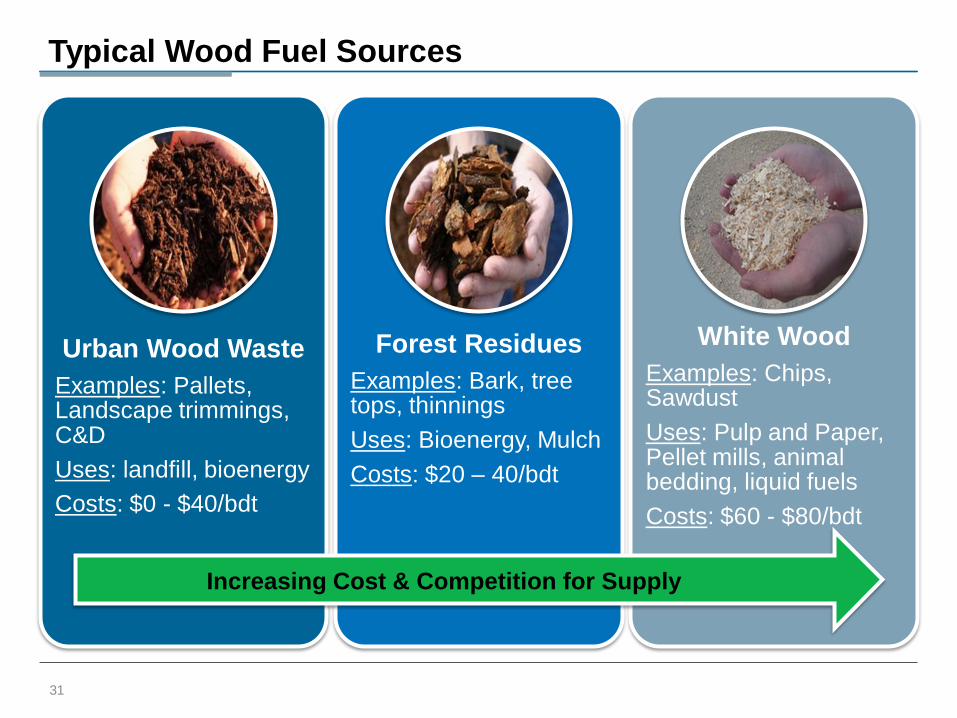
Typical Wood Fuel Sources
Urban Wood Waste
Examples: Pallets, Landscape trimmings, C&D
Uses: landfill, bioenergy
Costs: $0 - $40/bdt
Forest Residues
Examples: Bark, tree tops, thinnings
Uses: Bioenergy, Mulch
Costs: $20 – 40/bdt
White Wood
Examples: Chips, Sawdust
Uses: Pulp and Paper, Pellet mills, animal bedding, liquid fuels
Costs: $60 - $80/bdt
31
Increasing Cost & Competition for Supply
32
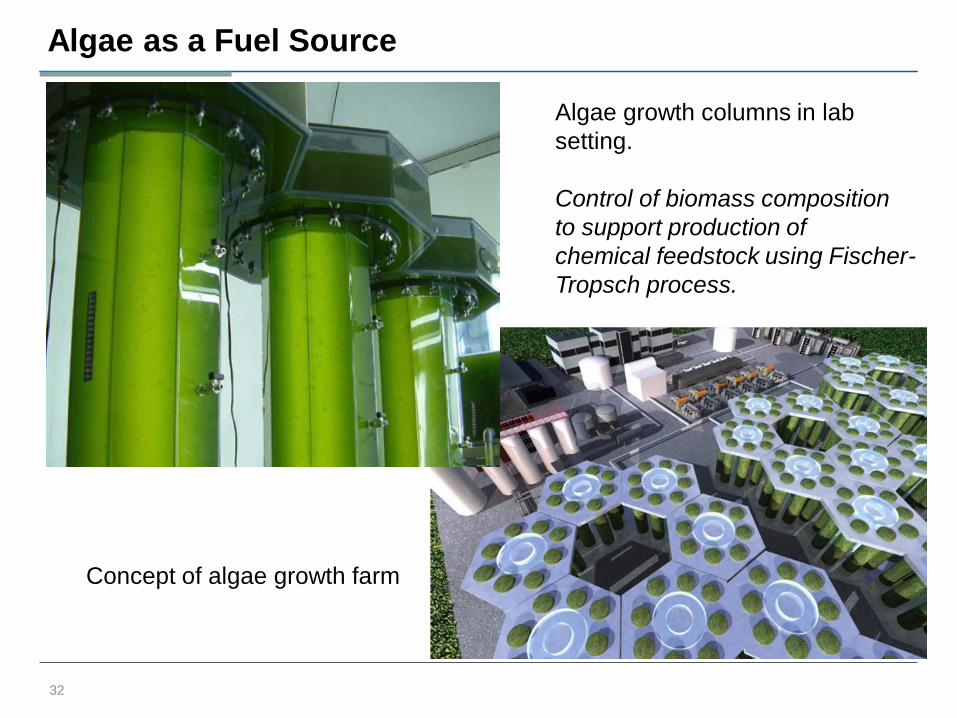
Algae as a Fuel Source
Algae growth columns in lab
setting.
Control of biomass composition
to support production of
chemical feedstock using Fischer-
Tropsch process.
Concept of algae growth farm
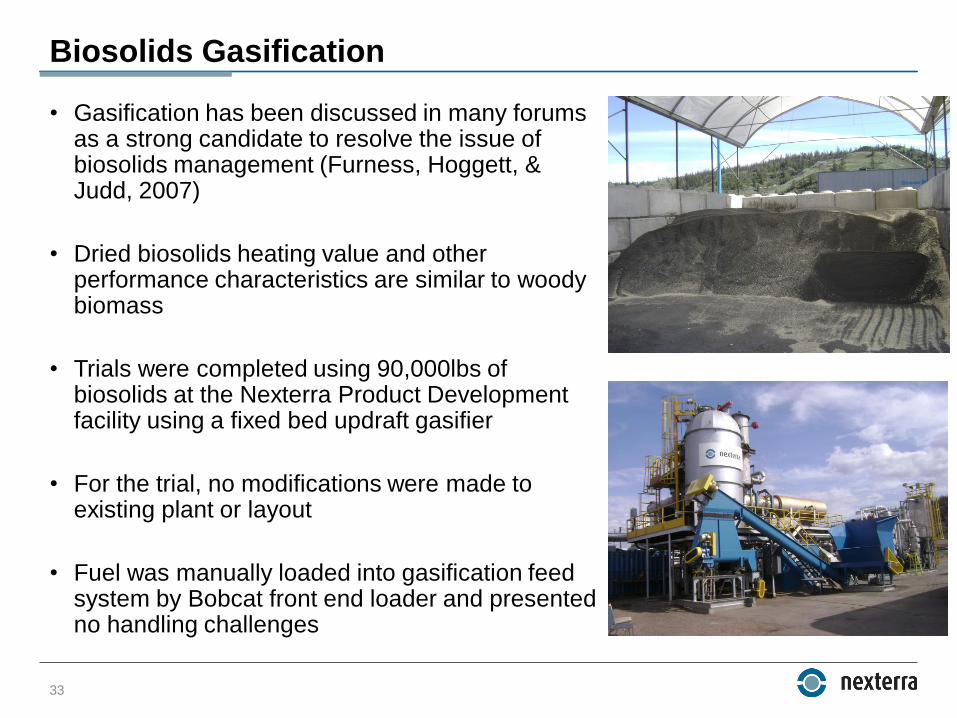
Biosolids Gasification
• Gasification has been discussed in many forums as a strong candidate to resolve the issue of biosolids management (Furness, Hoggett, & Judd, 2007)
• Dried biosolids heating value and other performance characteristics are similar to woody biomass
• Trials were completed using 90,000lbs of biosolids at the Nexterra Product Development facility using a fixed bed updraft gasifier
• For the trial, no modifications were made to existing plant or layout
• Fuel was manually loaded into gasification feed system by Bobcat front end loader and presented no handling challenges
33
Sample Projects
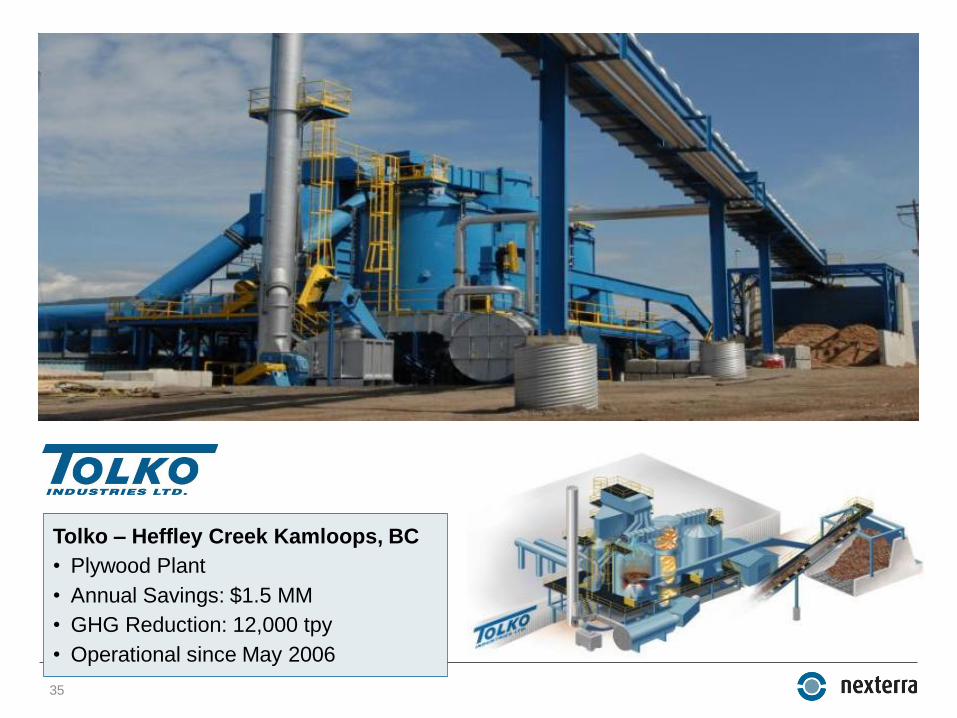
Tolko – Heffley Creek Kamloops, BC
• Plywood Plant
• Annual Savings: $1.5 MM
• GHG Reduction: 12,000 tpy
• Operational since May 2006
35
/ 36
Confidential – Not for distribution
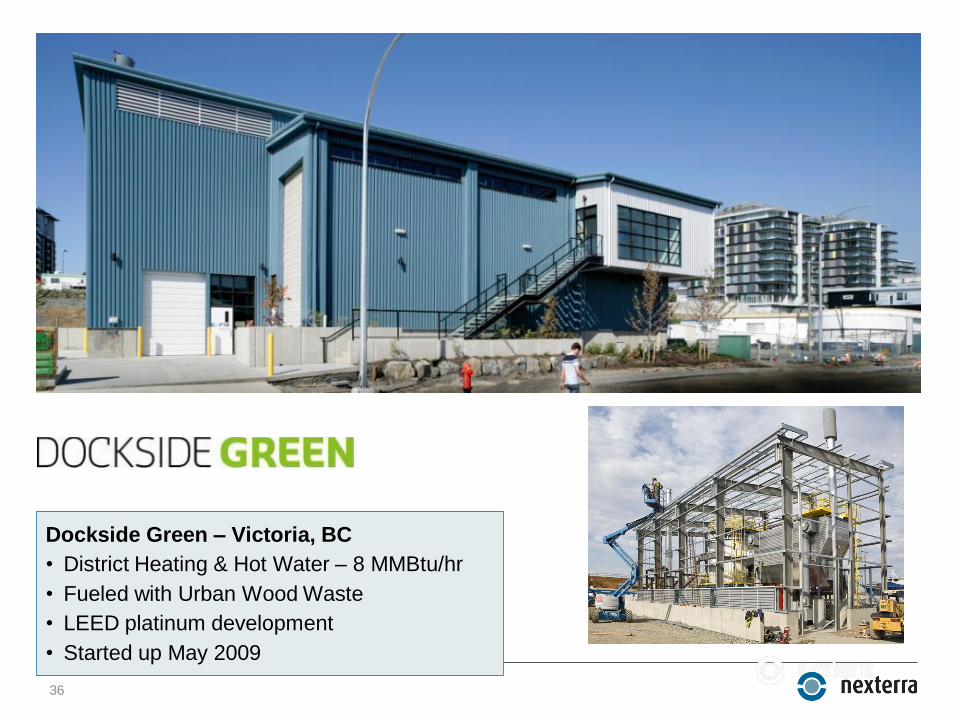
Dockside Green – Victoria, BC
• District Heating & Hot Water – 8 MMBtu/hr
• Fueled with Urban Wood Waste
• LEED platinum development
• Started up May 2009
36
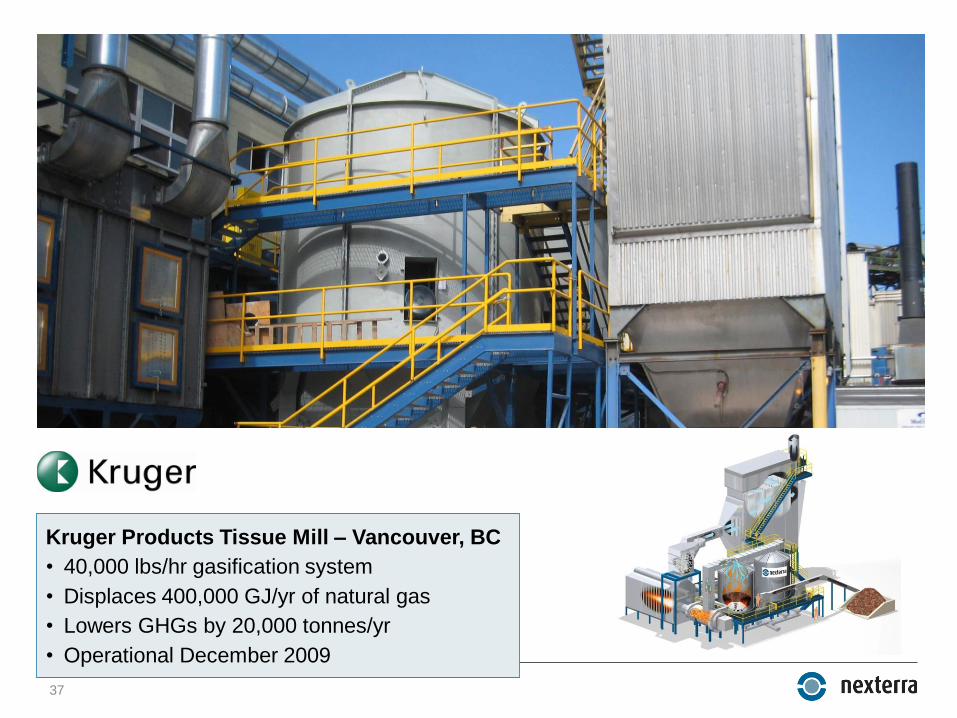
Kruger Products Tissue Mill – Vancouver, BC
• 40,000 lbs/hr gasification system
• Displaces 400,000 GJ/yr of natural gas
• Lowers GHGs by 20,000 tonnes/yr
• Operational December 2009
37
Conclusions
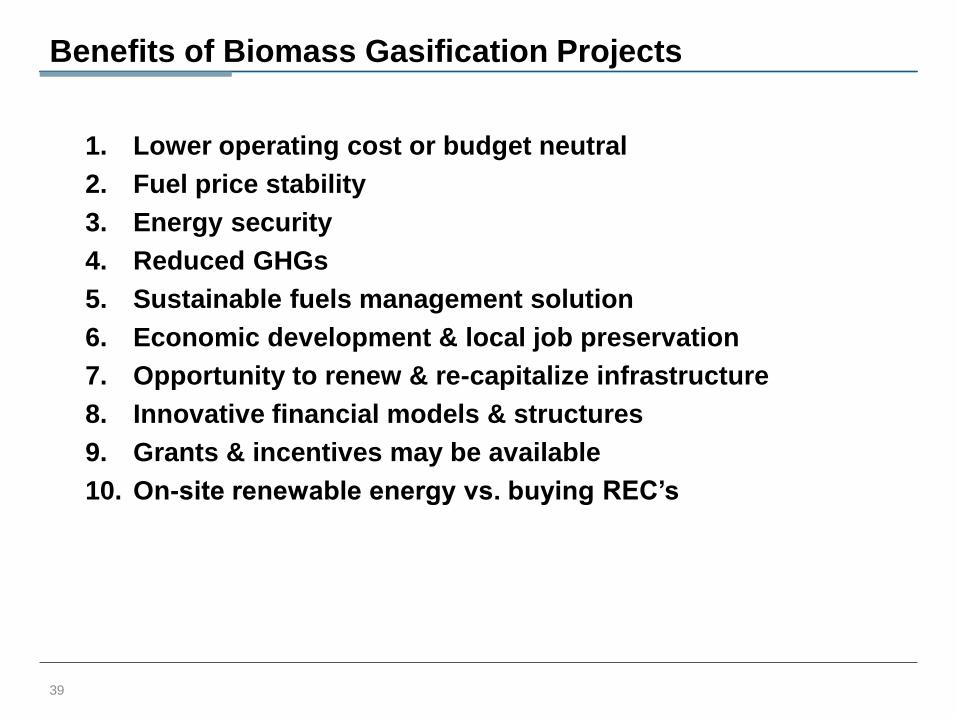
Benefits of Biomass Gasification Projects
1. Lower operating cost or budget neutral
2. Fuel price stability
3. Energy security
4. Reduced GHGs
5. Sustainable fuels management solution
6. Economic development & local job preservation
7. Opportunity to renew & re-capitalize infrastructure
8. Innovative financial models & structures
9. Grants & incentives may be available
10. On-site renewable energy vs. buying REC’s
39
Thank You
Scott Layne, CEM
Vice President of Sales
North Region USA
484.354.5636
www.nexterra.ca