scott macon healthcare review: january 2018
TRANSCRIPT
SCOTT-MACON HEALTHCARE REVIEW:
JANUARY 2018
January 2018 Healthcare Review 2
Healthcare Overview, Mean Revenue Multiples 4
Healthcare Overview, Mean EBITDA Multiples 5
Analysis of Selected Healthcare, Medical and 6
Pharmaceutical Merger and Acquisition Transactions
January 1—January 31, 2018
Analysis of Selected 11
Publicly-Traded Healthcare, Medical and
Pharmaceutical Companies
Scott-Macon Professionals’ 22
Representative Closed Transactions
Scott-Macon Contact Information 23
CO
NT
EN
TS

2
J A N U A R Y 2 0 1 8
H E A L T H C A R E R E V I E W
Dear Clients and Friends,
Scott-Macon is pleased to present our
Healthcare Review covering January 2018.
If you haven’t done so already, please
email me at [email protected]
to automatically continue receiving our
publications in the future as we are transi-
tioning to digital publishing with email dis-
tribution.
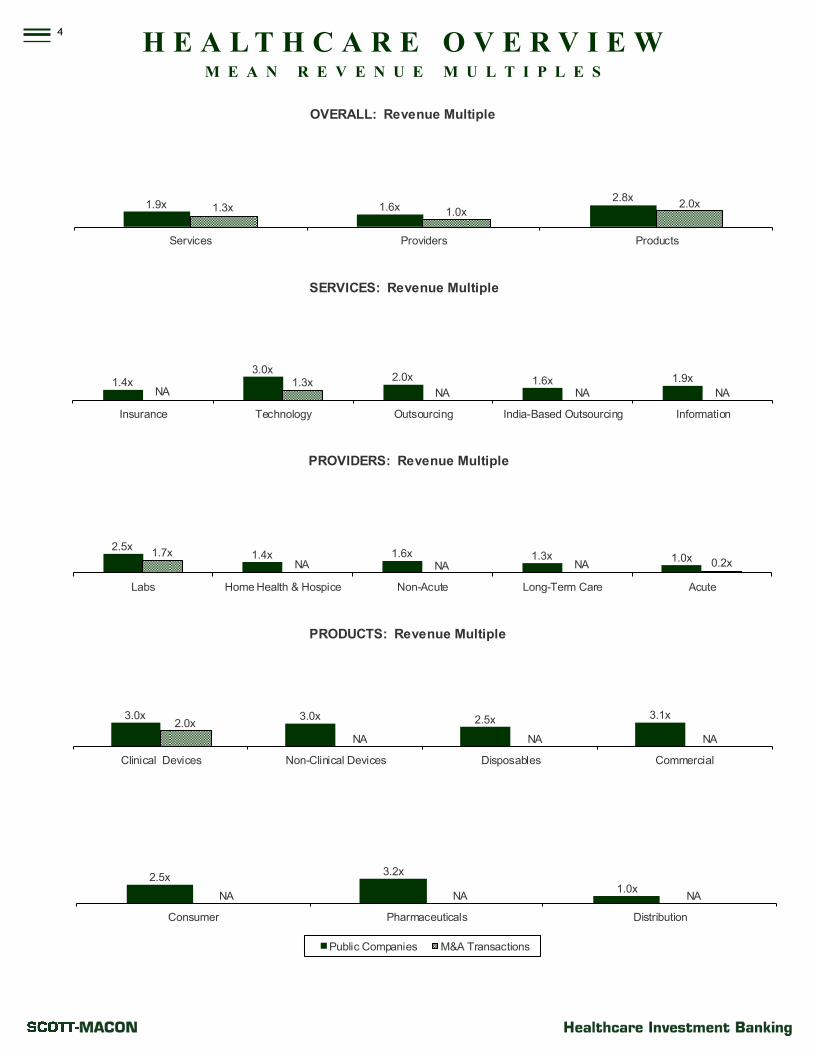
Pages four and five represent a visual
snapshot of the average multiples for all of
the healthcare, medical and pharmaceutical
transactions that either closed or were an-
nounced during January, along with the av-
erage multiples for the major publicly-
traded healthcare, medical and pharmaceu-
tical companies.
In the Technology Services arena, the
four largest deals by disclosed valuation
were the buyout of ProVation Medical for
$180 million; the purchase of Maestro
Healthcare by AXA of France for $155
million; Connecture’s going-private deal
for $104 million, or 1.3X revenues; and the
takeover of Practice Fusion by Allscripts
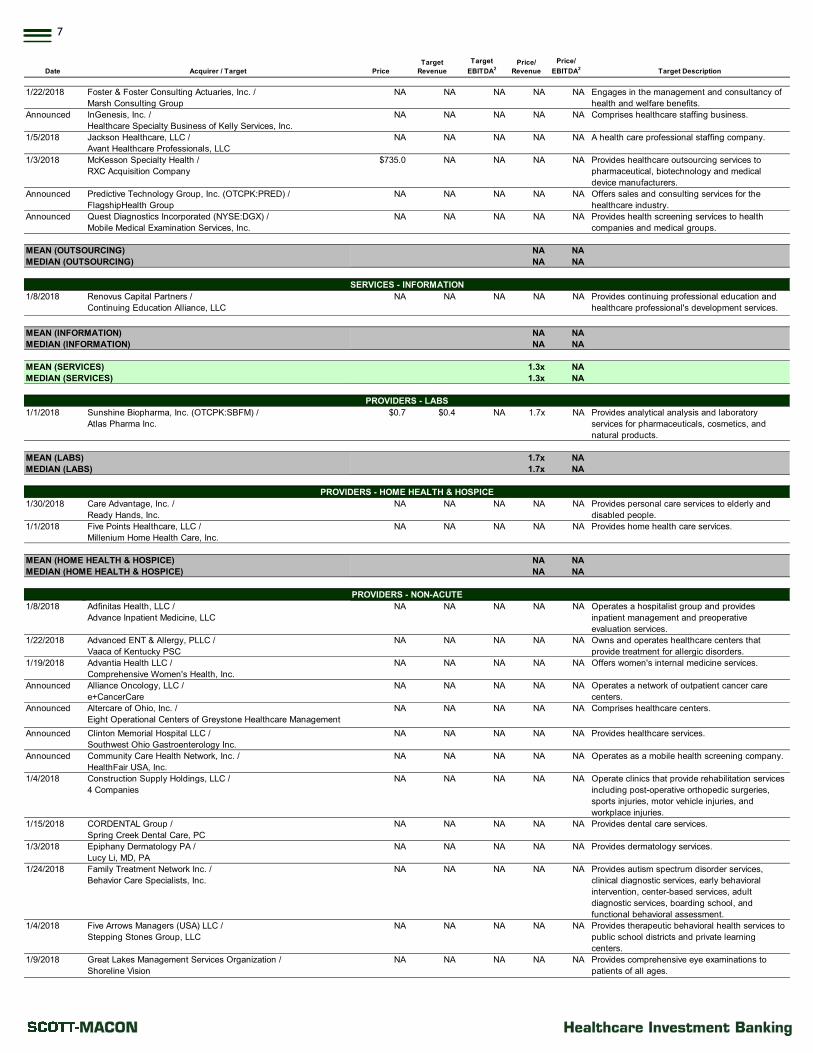
for $100 million. In the Outsourcing Ser-
vices segment, the largest deal for the
month was McKesson’s buyout of RXC
for $735 million, expanding its enormous
footprint into yet another specialty out-
sourcing business. Also, lab giant Quest
picked up a health screening company as it
expands its service offerings across its
enormous client base.
Turning next to the Provider space,
while Labs and Home Health/Hospice had
a fairly quiet month, the Non-Acute area
saw lots of activity, including MFC’s $87
million buyout of 7 ambulatory surgery
centers; Skyline’s purchase of Whiteall for
$26 million; and Invesque’s purchase of a
rehab center for $21 million. In the Long-
Term Care segment, the largest deal for
January was Sienna’s acquisition of ten fa-
cilities in Ontario for $368 million. The
Acute Care area was once again very
3
busy—the merger of Hackensack Merid-
ian with JFK in New Jersey creates one
of the largest hospital systems in the
state. In addition, American Academic
acquired one of Tenet’s hospitals for
$170 million.
In the Products area, Weigao of
Hong Kong closed on Argon in the Clini-
cal Devices area for $844 million, or
12.4X EBITDA. The Pharmaceuticals
space was very active in January, with
the largest deal by disclosed value being
Celgene’s acquisition of Impact for a
cool $7 billion. In addition, Aphria an-
nounced its deals for Nuuvera and Bro-
ken Coast Cannabis for $638 million and
$185 million respectively. In addition,
publicly-traded Melinta picked up the in-
fectious disease business of Medicines
Company for $304 million. Lastly, in the
Distribution area, AmerisourceBergen
picked up smaller competitor H. D.
Smith for $815 million.
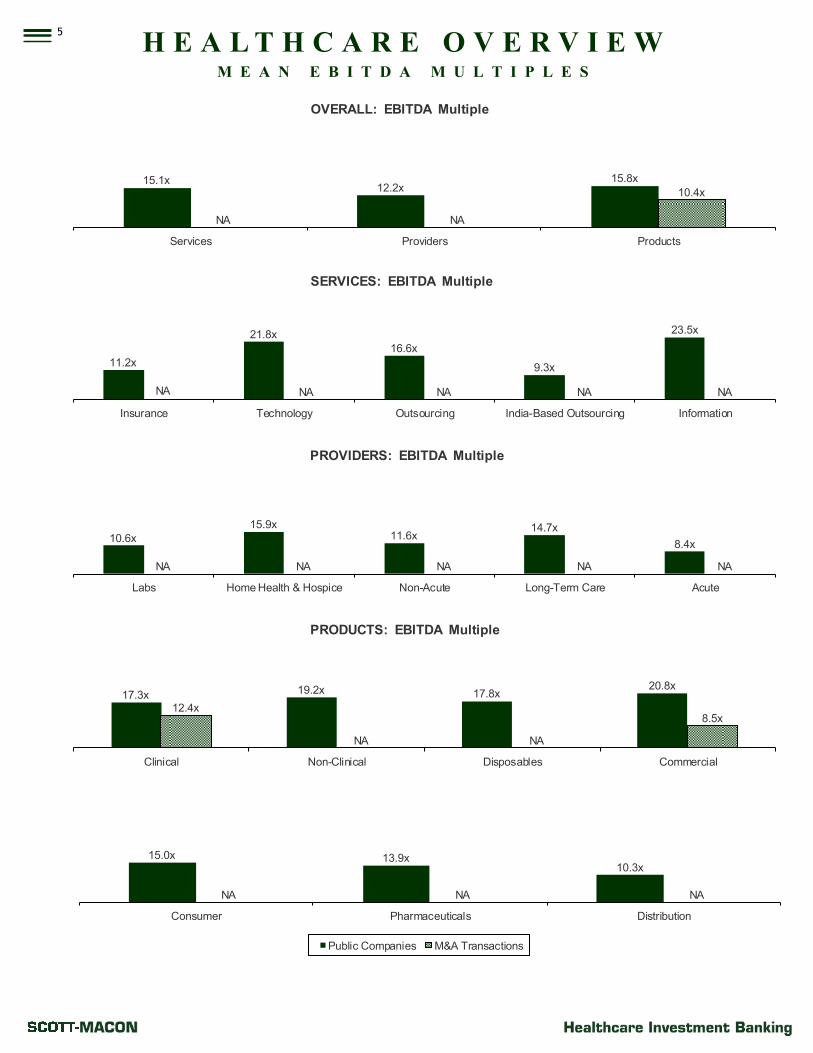
Following the mergers and acquisi-
tions analysis, we present an analysis of
publicly-traded Services, Providers, and
Products companies by sector. Mean
EBITDA multiples for Services compa-
nies ended the fourth quarter at 15.1X
(down from 15.4X in December 2017);
Providers at 12.2X (down from 12.4X in
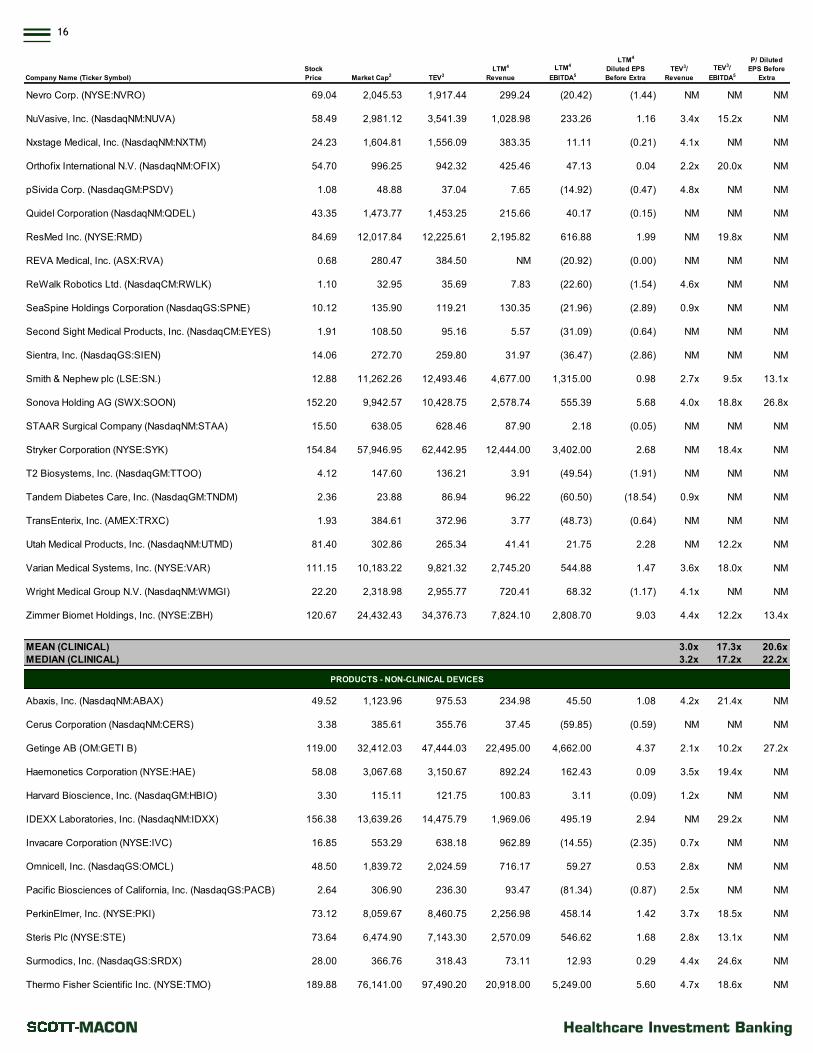
December 2017); and Products at 15.8X
(unchanged from 15.8X in December
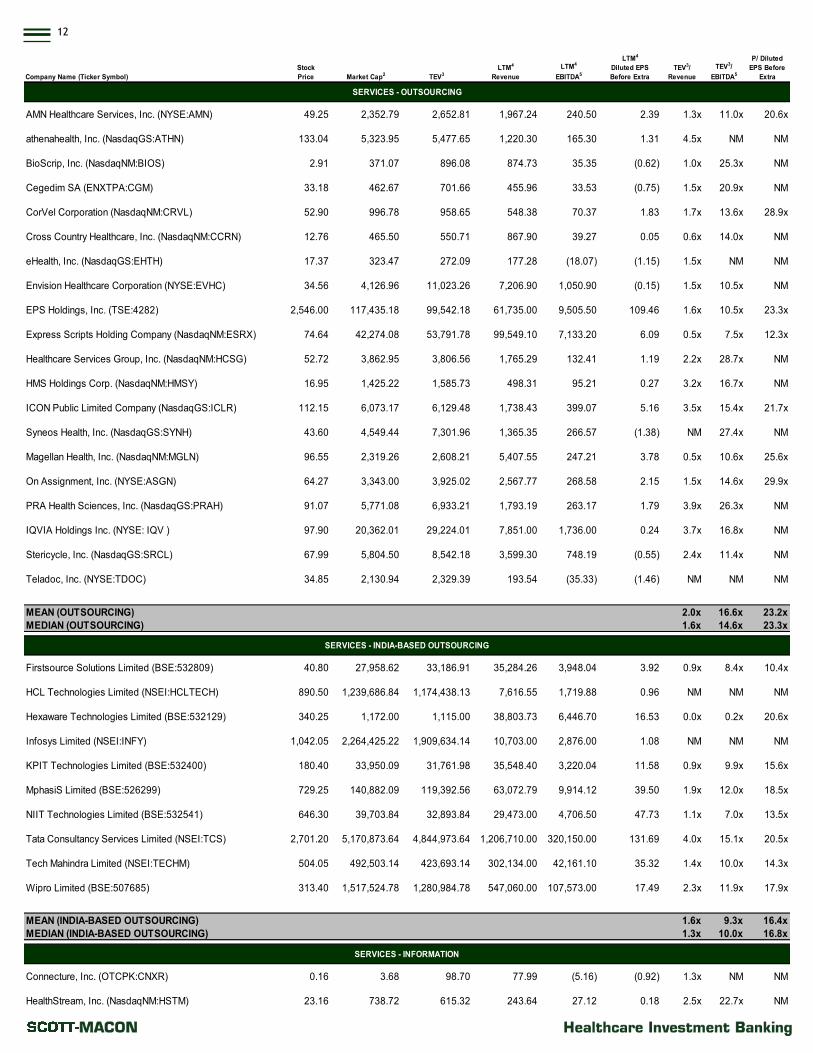
2017). Technology services companies
ended January at 21.8X, while Outsourc-
ing services companies were 16.6X. The
Insurance segment EBITDA multiple
came in at 11.2X (down from 11.3X De-
cember 2017).
Finally, contact information for the
Scott-Macon Healthcare Investment
Banking Group Professionals appears on
the back cover. We welcome your call or
email to discuss your thoughts on this ar-
ticle.
Sincerely yours,
Nathan D. Cortright
Managing Director
Group Head – Healthcare Investment Banking
4
1.9x 1.6x2.8x
1.3x 1.0x2.0x
Services Providers Products
OVERALL: Revenue Multiple
H E A L T H C A R E O V E R V I E W M E A N R E V E N U E M U L T I P L E S
2.5x1.4x 1.6x 1.3x 1.0x1.7x
NA NA NA 0.2x
Labs Home Health & Hospice Non-Acute Long-Term Care Acute
PROVIDERS: Revenue Multiple
3.0x 3.0x 2.5x 3.1x2.0x
NA NA NA
Clinical Devices Non-Clinical Devices Disposables Commercial
PRODUCTS: Revenue Multiple
2.5x3.2x
1.0xNA NA NA
Consumer Pharmaceuticals Distribution
Public Companies M&A Transactions
1.4x3.0x
2.0x 1.6x 1.9x
NA1.3x
NA NA NA
Insurance Technology Outsourcing India-Based Outsourcing Information
SERVICES: Revenue Multiple
5
15.1x12.2x
15.8x
NA NA
10.4x
Services Providers Products
OVERALL: EBITDA Multiple
H E A L T H C A R E O V E R V I E W M E A N E B I T D A M U L T I P L E S
17.3x 19.2x 17.8x20.8x
12.4x
NA NA
8.5x
Clinical Non-Clinical Disposables Commercial
PRODUCTS: EBITDA Multiple
11.2x
21.8x
16.6x
9.3x
23.5x
NA NA NA NA NA
Insurance Technology Outsourcing India-Based Outsourcing Information
SERVICES: EBITDA Multiple
10.6x
15.9x11.6x
14.7x
8.4x
NA NA NA NA NA
Labs Home Health & Hospice Non-Acute Long-Term Care Acute
PROVIDERS: EBITDA Multiple
15.0x 13.9x10.3x
NA NA NA
Consumer Pharmaceuticals Distribution
Public Companies M&A Transactions

6 ANALYSIS OF SELECTED HEALTHCARE, MEDICAL AND PHARMACEUTICAL
SERVICES AND PRODUCTS MERGER & ACQUISITION TRANSACTIONS1
(CLOSED OR ANNOUNCED BETWEEN JANUARY 1—JANUARY 31, 2018) ($ Millions Except Per Share Data)
Date Acquirer / Target Price
Target
Revenue
Target
EBITDA2
Price/
Revenue
Price/
EBITDA2
Target Description
MEAN (INSURANCE) NA NA
MEDIAN (INSURANCE) NA NA
Announced Allscripts Healthcare, LLC /
Practice Fusion, Inc.
$100.0 NA NA NA NA Offers cloud-based electronic health records
software platform to doctors.
Announced AXA SA (ENXTPA:CS) /
Maestro Healthcare Technology, Inc.
$155.0 NA NA NA NA Provides integrated “one stop shopping” along
with private labeled exchange solutions, and
employee health and benefits management
solutions for brokers, small employers, and
Fortune 1000 organizations.
1/18/2018 Change Healthcare Holdings, Inc. /
National Decision Support Company
NA NA NA NA NA Designs and develops cloud based solutions that
deliver medical guidelines to point of care through
electronic health record systems.
Announced Clearlake Capital Group, L.P. /
ProVation Medical, Inc.
$180.0 NA NA NA NA Offers procedure documentation and coding
software that improves medical records, as well as
and enhances communication, care coordination,
and patient satisfaction.
1/30/2018 DAXKO LLC /
Club Automation, LLC
NA NA NA NA NA Management software developer for health and
athletic clubs and medically integrated wellness
centers.
1/2/2018 Doctors' Administrative Solutions, LLC /
Integra IT Solutions, LLC
NA NA NA NA NA Provides IT services focusing on medical software,
medical billing, and IT managed services.
1/17/2018 El Sevier /
Via Oncology, LLC
NA NA NA NA NA Operates as a developer of treatment algorithms
for cancer.
Announced Francisco Partners Management LLC /
Connecture, Inc. (OTCPK:CNXR)
$104.3 $78.0 NM 1.3x NM Operates as a Web-based consumer shopping,
enrollment, and retention platform for health
insurance distribution.
Announced Hitachi Healthcare Americas Corporation /
Vidistar, LLC
NA NA NA NA NA Provides medical imaging software solutions for
physicians and hospitals.
1/2/2018 Inspirata, Inc. /
Artificial Intelligence in Medicine, Inc.
NA NA NA NA NA Develops tools that leverage Artificial Intelligence
and Natural Language Processing to extract
cancer related information and data from clinical
documents.
1/31/2018 Inspirata, Inc. /
Omnyx, LLC
NA NA NA NA NA Develops digital pathology solutions for the
anatomic pathologist in the hospital and reference
lab.
Announced InTouch Technologies, Inc. /
TruClinic LLC
NA NA NA NA NA Offers a telemedicine solution that enables
providers, patients, and health systems to
connect face-to-face through a web-based video-
conferencing port.
1/12/2018 Mölnlycke Health Care AB /
Tissue Analytics, Inc.
NA NA NA NA NA Enables home health agencies, nursing homes,
and practices to send patient photographs for
remote patient evaluation and management tools
using skin and wound analysis algorithms to
measure, segment, and classify the images.
1/24/2018 Network Billing Systems, L.L.C. /
IQMax, Inc.
$1.1 NA NA NA NA Offers a cross enterprise communication tool that
enables physicians, nurses, and other team
members to message and share pertinent patient
information securely.
1/16/2018 New Directions Behavioral Health, LLC /
E4 LLC
NA NA NA NA NA Offers a product that combines EAP, wellness,
and care coordination data into a customized
profile for individuals.
1/16/2018 Press Ganey Holdings, Inc. /
Bivarus, Inc.
NA NA NA NA NA Develops a cloud-based analytics platform for
measuring continuous quality improvement of the
patient experience to hospital-based outpatient
service lines, community-based clinics, and group
practices through patient-centered insights.
1/2/2018 Quantitative Medical Systems, Inc. /
Assets of Infian, LLC
NA NA NA NA NA Comprises electronic health record solutions
business.
1/29/2018 StateServ Medical, LLC /
Network Medical, Inc.
NA NA NA NA NA Offers a durable medical equipment benefits
management software solution that controls costs,
mitigates risks, increases transparency, and
optimizes operational efficiencies for hospice
operators and DME providers.
1/10/2018 VitalHub Corp. (TSXV:VHI) /
HInext Inc.
$3.3 $2.6 NA NA NA Provides information technology consulting and
management, project management, and software
development services.
MEAN (TECHNOLOGY) 1.3x NA
MEDIAN (TECHNOLOGY) 1.3x NA
1/19/2018 American Surgical Professionals, Inc. /
Chesapeake Medical Staffing, LLC
NA NA NA NA NA Provides various health care and medical staffing
services.
1/1/2018 EVIO, Inc. (OTCPK:EVIO) /
C3 Labs, LLC
$1.0 NA NA NA NA Operates cannabis focused contract research
organization.
SERVICES - INSURANCE
SERVICES - TECHNOLOGY
SERVICES - OUTSOURCING
7
Date Acquirer / Target Price
Target
Revenue
Target
EBITDA2
Price/
Revenue
Price/
EBITDA2
Target Description
1/22/2018 Foster & Foster Consulting Actuaries, Inc. /
Marsh Consulting Group
NA NA NA NA NA Engages in the management and consultancy of
health and welfare benefits.
Announced InGenesis, Inc. /
Healthcare Specialty Business of Kelly Services, Inc.
NA NA NA NA NA Comprises healthcare staffing business.
1/5/2018 Jackson Healthcare, LLC /
Avant Healthcare Professionals, LLC
NA NA NA NA NA A health care professional staffing company.
1/3/2018 McKesson Specialty Health /
RXC Acquisition Company
$735.0 NA NA NA NA Provides healthcare outsourcing services to
pharmaceutical, biotechnology and medical
device manufacturers.
Announced Predictive Technology Group, Inc. (OTCPK:PRED) /
FlagshipHealth Group
NA NA NA NA NA Offers sales and consulting services for the
healthcare industry.
Announced Quest Diagnostics Incorporated (NYSE:DGX) /
Mobile Medical Examination Services, Inc.
NA NA NA NA NA Provides health screening services to health
companies and medical groups.
MEAN (OUTSOURCING) NA NA
MEDIAN (OUTSOURCING) NA NA
1/8/2018 Renovus Capital Partners /
Continuing Education Alliance, LLC
NA NA NA NA NA Provides continuing professional education and
healthcare professional's development services.
MEAN (INFORMATION) NA NA
MEDIAN (INFORMATION) NA NA
MEAN (SERVICES) 1.3x NA
MEDIAN (SERVICES) 1.3x NA
1/1/2018 Sunshine Biopharma, Inc. (OTCPK:SBFM) /
Atlas Pharma Inc.
$0.7 $0.4 NA 1.7x NA Provides analytical analysis and laboratory
services for pharmaceuticals, cosmetics, and
natural products.
MEAN (LABS) 1.7x NA
MEDIAN (LABS) 1.7x NA
1/30/2018 Care Advantage, Inc. /
Ready Hands, Inc.
NA NA NA NA NA Provides personal care services to elderly and
disabled people.
1/1/2018 Five Points Healthcare, LLC /
Millenium Home Health Care, Inc.
NA NA NA NA NA Provides home health care services.
MEAN (HOME HEALTH & HOSPICE) NA NA
MEDIAN (HOME HEALTH & HOSPICE) NA NA
1/8/2018 Adfinitas Health, LLC /
Advance Inpatient Medicine, LLC
NA NA NA NA NA Operates a hospitalist group and provides
inpatient management and preoperative
evaluation services.
1/22/2018 Advanced ENT & Allergy, PLLC /
Vaaca of Kentucky PSC
NA NA NA NA NA Owns and operates healthcare centers that
provide treatment for allergic disorders.
1/19/2018 Advantia Health LLC /
Comprehensive Women's Health, Inc.
NA NA NA NA NA Offers women's internal medicine services.
Announced Alliance Oncology, LLC /
e+CancerCare
NA NA NA NA NA Operates a network of outpatient cancer care
centers.
Announced Altercare of Ohio, Inc. /
Eight Operational Centers of Greystone Healthcare Management
Corp.
NA NA NA NA NA Comprises healthcare centers.
Announced Clinton Memorial Hospital LLC /
Southwest Ohio Gastroenterology Inc.
NA NA NA NA NA Provides healthcare services.
Announced Community Care Health Network, Inc. /
HealthFair USA, Inc.
NA NA NA NA NA Operates as a mobile health screening company.
1/4/2018 Construction Supply Holdings, LLC /
4 Companies
NA NA NA NA NA Operate clinics that provide rehabilitation services
including post-operative orthopedic surgeries,
sports injuries, motor vehicle injuries, and
workplace injuries.
1/15/2018 CORDENTAL Group /
Spring Creek Dental Care, PC
NA NA NA NA NA Provides dental care services.
1/3/2018 Epiphany Dermatology PA /
Lucy Li, MD, PA
NA NA NA NA NA Provides dermatology services.
1/24/2018 Family Treatment Network Inc. /
Behavior Care Specialists, Inc.
NA NA NA NA NA Provides autism spectrum disorder services,
clinical diagnostic services, early behavioral
intervention, center-based services, adult
diagnostic services, boarding school, and
functional behavioral assessment.
1/4/2018 Five Arrows Managers (USA) LLC /
Stepping Stones Group, LLC
NA NA NA NA NA Provides therapeutic behavioral health services to
public school districts and private learning
centers.
1/9/2018 Great Lakes Management Services Organization /
Shoreline Vision
NA NA NA NA NA Provides comprehensive eye examinations to
patients of all ages.
SERVICES - INFORMATION
PROVIDERS - LABS
PROVIDERS - HOME HEALTH & HOSPICE
PROVIDERS - NON-ACUTE

8
Date Acquirer / Target Price
Target
Revenue
Target
EBITDA2
Price/
Revenue
Price/
EBITDA2
Target Description
1/15/2018 Integrated Dermatology LLC /
Dermatology & Advanced Skin Care, Inc.
NA NA NA NA NA Provides dermatology services.
1/11/2018 Invesque Inc. (OTCPK:MHIV.F) /
State Of Art Post Acute Transitional Care Facility In Lincoln of
Mainstreet Property Group, LLC
$21.6 NA NA NA NA Comprises post-acute transitional care facility.
1/5/2018 Jefferson Health System, Inc. /
Magee Rehabilitation Hospital
NA $60.0 NA NA NA Provides physical and cognitive rehabilitation
services for persons with disabilities.
1/11/2018 LENSAR, Inc. /
Laser Business Unit of Precision Eye Services, Inc.
NA NA NA NA NA Comprises business operation that offers mobile
laser cataract service.
1/10/2018 MEDNAX, Inc. (NYSE:MD) /
Tri-Valley Neonatal Medical Group, Inc.
NA NA NA NA NA Operates as a neonatology physician practice
which provides neonatology and newborn
nursery services.
Announced MFC Nueterra Holding Company, LLC /
Seven Ambulatory Surgical Centers of Meridian Surgical Partners,
LLC
$87.7 NA NA NA NA Comprises seven ambulatory surgical centers.
1/9/2018 Ochsner Health System /
New Orleans Urgent Care, L.L.C.
NA NA NA NA NA Offers urgent care services.
1/16/2018 Omni Eye Services, Inc. /
Phillips Eye Center
NA NA NA NA NA Operates an ophthalmic care and surgery facility.
1/19/2018 One Vision Eye Partners /
Arlington Eye Center, Inc.
NA NA NA NA NA Operates as an eye care center.
Announced PinnacleHealth System Inc. /
ARMAR, Inc.
NA NA NA NA NA Offers emergency basic life support and advance
life support ambulance services.
1/15/2018 Proex Physical Therapy, LLC /
ProEx Physical Therapy's Norwell, MA Clinic
NA NA NA NA NA Owns and operates clinics that provides physical
therapy services.
1/5/2018 Project 1493, LLC /
Pre-Qualified Medicinal Cannabis Dispensary in San Juan
NA NA NA NA NA Comprises a medical marijuana dispensary.
1/4/2018 Radiology Partners, Inc. /
Renaissance Imaging Medical Associates, Inc.
NA NA NA NA NA Provides diagnostic imaging and radiology
services.
1/4/2018 Skyline Healthcare, LLC /
Whitehall OpCo, LLC
$26.0 NA NA NA NA Provides nursing and rehabilitation services.
1/4/2018 SSM Health /
Agnesian Healthcare, Inc.; Monroe Clinic, Inc.
NA NA NA NA NA Provides healthcare services and operates not-for-
profit integrated healthcare facilities.
1/24/2018 Sun Capital Partners, Inc. /
ClearChoice Holdings, LLC
NA NA NA NA NA Develops and manages dental-treatment centers.
1/4/2018 Upstream Rehabilitation Inc. /
Drayer Physical Therapy Institute, LLC
NA NA NA NA NA Owns and operates outpatient physical therapy
clinics.
MEAN (NON-ACUTE) NA NA
MEDIAN (NON-ACUTE) NA NA
1/31/2018 Affinity Living Group, LLC; LTC Properties, Inc. (NYSE:LTC) /
Inverness At Spartanburg
$10.0 NA NA NA NA Comprises an assisted living and memory care
community.
1/2/2018 ElderWood Senior Care, Inc. /
Elderwood of Lakeside at Brockport
$11.5 NA NA NA NA Operates a nursing facility.
1/2/2018 ElderWood Senior Care, Inc. /
Lakeside Beikirch Care Center Inc.
$11.5 NA NA NA NA Operates a nursing facility and offers short term
rehabilitation services.
1/1/2018 HMG Park Manor of Friendswood, LLC /
Friendship Haven Healthcare and Rehabilitation Center
NA NA NA NA NA Provides short and long-term healthcare.
1/17/2018 Mainstreet Property Group, LLC /
Chisholm Creek Healthcare, Inc.
NA NA NA NA NA Operates a senior care and assisted living facility.
Announced Sienna Senior Living Inc. (TSX:SIA) /
Portfolio of Ten Seniors Housing Assets in Ontario
$368.0 NA NA NA NA Comprises ten independent supportive living and
assisted living retirement residences.
Announced Unknown Buyer /
Comprehensive Healthcare Management Services LLC
NA NA NA NA NA Operates long- term-care facilities and provides
rehabilitation and nursing care.
1/23/2018 Unknown Buyer /
Park Manor At Bee Cave
NA NA NA NA NA Comprises nursing facility.
MEAN (LONG-TERM CARE) NA NA
MEDIAN (LONG-TERM CARE) NA NA
1/11/2018 American Academic Health System, LLC /
Tenet HealthSystem Hahnemann; Tenet HealthSystem St.
Christopher's Hospital For Children
$170.0 $790.0 NM 0.2x NM Operates as an academic medical center and
operates a children hospital that offers pediatric
care.
Announced Baylor Scott & White Health LLC /
25% of Baylor Scott & White at Centennial and 23.67% of Baylor
Scott & White at Lake Pointe
NA NA NA NA NA Own and operate hospitals.
1/1/2018 BJC Health System, Inc. /
Memorial Hospital Belleville
NA NA NA NA NA Owns and operates a 222 bed capacity hospital.
1/3/2018 Hackensack Meridian Health, Inc. /
JFK Health System, Inc.
NA NA NA NA NA Operates an acute care hospital, inpatient and
outpatient rehabilitation centers, and nursing and
convalescent facilities.
1/18/2018 Inland Real Estate Acquisitions, Inc. /
Surgical Hospital of Oklahoma, L.L.C.
NA NA NA NA NA Operates an in-patient facility that provides
healthcare services to patients.
Announced Lateral Investment Management LLC /
Assets and Business of Green Valley Hospital, LLC
$31.5 $0.0 NM NA NM Comprises assets and business which owns and
operates a hospital.
Announced Rennova Health, Inc. (OTCPK:RNVA) /
HMA Fentress County General Hospital, LLC
NA NA NA NA NA 85-bed hospital that offers acute care, medical,
and surgical services.
Announced St. Luke's Hospital /
Des Peres Hospital, Inc.
NA NA NA NA NA Owns and operates a hospital.
MEAN (ACUTE) 0.2x NA
MEDIAN (ACUTE) 0.2x NA
MEAN (PROVIDERS) 1.0x NA
MEDIAN (PROVIDERS) 1.0x NA
PROVIDERS - LONG-TERM CARE
PROVIDERS - ACUTE

9
Date Acquirer / Target Price
Target
Revenue
Target
EBITDA2
Price/
Revenue
Price/
EBITDA2
Target Description
Announced 9332073 Canada Inc. /
Ergoresearch Ltd. (TSXV:ERG)
$11.5 $11.1 NM 1.0x NM Manufactures and sells custom foot and general
orthotics.
1/2/2018 Arcamed, LLC /
Veracity Medical Solutions, Inc.
NA NA NA NA NA Manufactures medical devices.
Announced Celularity, Inc. /
All Assets of Alliqua BioMedical, Inc.
$26.9 $20.5 NM 1.3x NM Comprises regenerative medical products that
assist the body in the repair or replacement of soft
tissue.
1/8/2018 FHC, Inc. /
Atanse Inc.
NA NA NA NA NA Develops precision neurosurgical instruments for
biotechnology companies seeking to deliver
therapeutics in brain.
1/16/2018 LivaNova PLC (NasdaqGS:LIVN) /
ImThera Medical, Inc.
NA NA NA NA NA Develops implantable neurostimulation devices for
the treatment of obstructive sleep apnea.
Announced RTI Surgical, Inc. (NasdaqGS:RTIX) /
Zyga Technology, Inc.
NA $4.0 NA NA NA Engages in the research, design, development,
and commercialization of minimally invasive
products for the treatment of underserved
conditions of the lumbar spine.
1/23/2018 Weigao International Medical Hong Kong Limited /
Argon Medical Devices, Inc.
$844.2 $225.4 $68.0 3.7x 12.4x Manufactures and sells medical devices for
interventional radiology, vascular surgery,
interventional cardiology, and critical care
procedures.
MEAN (CLINICAL DEVICES) 2.0x 12.4x
MEDIAN (CLINICAL DEVICES) 1.3x 12.4x
1/25/2018 Abattis Bioceuticals Corp. (OTCPK:ATTB.F) /
GT Therapeutics Corporation
$7.9 NA NA NA NA Manufactures medical marijuana vaporizers.
MEAN (NON-CLINICAL DEVICES) NA NA
MEDIAN (NON-CLINICAL DEVICES) NA NA
1/24/2018 Young Innovations Inc. /
Mydent International, Inc.
NA NA NA NA NA Manufactures and sells consumables used in the
dental operatory and other healthcare industries.
MEAN (DISPOSABLES) NA NA
MEDIAN (DISPOSABLES) NA NA
1/9/2018 CBx Sciences LLC /
Cannabis Brands and Product Development Platform Rights of
Evolab
NA NA NA NA NA Comprises cannabis brands and product
development platform.
1/17/2018 Ipca Pharmaceuticals, Inc.; Onyx Scientific Limited /
Pisgah Labs, Inc.
$9.7 NA $1.1 NA 8.5x Offers custom and fine chemical, active
pharmaceutical ingredients and drug substance
manufacturing for various corporations,
businesses, entrepreneurs, and government
agencies.
1/24/2018 Mobile Science Technologies Inc. /
RedX Medical LLC
NA NA NA NA NA Operates as a regulated company that owns and
operates a medical waste disposal business.
MEAN (COMMERCIAL) NA 8.5x
MEDIAN (COMMERCIAL) NA 8.5x
1/5/2018 Hildred Capital Partners, LLC /
Crown Laboratories, Inc.
NA NA NA NA NA Manufactures and markets products like
shampoos, lotions and moisturizers referred by
dermatologists and oncologists.
MEAN (CONSUMER PRODUCTS) NA NA
MEDIAN (CONSUMER PRODUCTS) NA NA
1/31/2018 Alliance Growers Corp. (CNSX:ACG) /
Biotech Canna
$6.4 NA NA NA NA Produces cannabis for medical purposes.
Announced Aphria Inc. (TSX:APH) /
Broken Coast Cannabis Ltd.
$185.4 NA NA NA NA Produces medical cannabis products.
Announced Aphria Inc. (TSX:APH) /
Nuuvera Inc. (TSXV:NUU)
$638.8 NA NA NA NA Produces medicinal marijuana products.
1/25/2018 Canopy Growth Corporation (TSX:WEED) /
Green Hemp Industries Ltd., Certain Assets And Intellectual
Property
$0.7 NA NA NA NA Comprises medical hemp farming operations and
associated assets, equipment, and genetic stock.
1/26/2018 CASI Pharmaceuticals, Inc. (NasdaqCM:CASI) /
ANDA Portfolio of Sandoz Inc.
$18.0 NA NA NA NA Comprises a portfolio of drug development and
manufacturing.
Announced Celgene Corporation (NasdaqGS:CELG) /
Impact Biomedicines, Inc.
$7,000.0 NA NA NA NA Engages in the development of cancer
treatments.
Announced Future Farm Technologies Inc. (CNSX:FFT) /
BCWC, Inc.
$10.0 NA NA NA NA Produces and retails medical marijuana.
Announced Isodiol International Inc. (CNSX:ISOL) /
CBD assets of Green Island Naturals
$1.6 NA NA NA NA Comprises cannabidiol-containing medicinal
products manufacturing assets.
1/11/2018 Ligand Pharmaceuticals Incorporated (NasdaqGM:LGND) /
Verrow Pharmaceuticals, LLC.
$2.0 NA NA NA NA Drug development company which develops
gadolinium-based contrast agents, anticancer
agents, and aminoglycosides to reduce acute
kidney injury during medical interventions.
Announced Luminor Medical Technologies Inc. (CNSX:LMT) /
Rise Research Inc.
$3.2 NA NA NA NA Develops cannabis consumer products for both
medical and adult-use consumer market sectors.
PRODUCTS - CLINICAL DEVICES
PRODUCTS - NON-CLINICAL DEVICES
PRODUCTS - DISPOSABLES
PRODUCTS - COMMERCIAL
PRODUCTS - CONSUMER
PRODUCTS - PHARMACEUTICALS

10
Date Acquirer / Target Price
Target
Revenue
Target
EBITDA2
Price/
Revenue
Price/
EBITDA2
Target Description
1/5/2018 Melinta Therapeutics, Inc. (NasdaqGS:MLNT) /
Medicines Company, Infectious Disease Business
$304.5 NA NA NA NA Comprises pharmaceutical products.
Announced NovaQuest Capital Management, L.L.C. /
Viamet Pharmaceuticals, Inc.
NA NA NA NA NA Offers novel antifungal agents through a
proprietary medicinal chemistry platform.
Announced Praxis Precision Medicines, Inc. /
Z944 Assets of EPIRUS Biopharmaceuticals, Inc.
$1.0 NA NA NA NA Comprises pharmaceutical product portfolio.
Announced Ravenquest Biomed Inc. (CNSX:RQB) /
Bloomera Inc.
$27.2 NA NA NA NA Produces cannabis for medical purpose.
1/17/2018 Relmada Therapeutics, Inc. (OTCPK:RLMD) /
Global Rights to Develop And Market Dextromethadone
NA NA NA NA NA Comprises rights to develop and market
dextromethadone, a novel N-methyl-D-aspartate
receptor antagonist, for the treatment of
neurological conditions.
1/18/2018 Torrent Pharmaceuticals Limited (BSE:500420) /
Bio-Pharm, Inc.
NA NA NA NA NA Manufactures and distributes generic
pharmaceutical products.
1/30/2018 Unknown Buyer /
CorePharma, LLC
NA NA NA NA NA Develops, manufactures, and markets generic
and branded prescription pharmaceuticals.
Announced We Grow BC Ltd. /
AREV Nutrition Sciences Inc. (CNSX:AREV)
NA NA NM NA NM Engages in developing natural health products.
MEAN (PHARMACEUTICALS) NA NA
MEDIAN (PHARMACEUTICALS) NA NA
1/2/2018 AmerisourceBergen Corporation (NYSE:ABC) /
H. D. Smith, LLC
$815.0 NA NA NA NA Distributes and supplies healthcare products and
business solutions to manufacturers and
healthcare providers.
1/2/2018 WMK, Inc. /
Accessible Mobility Center, LLC
NA NA NA NA NA Engages in sales and rental service of wheelchair
vans and other accessibility products.
MEAN (DISTRIBUTION) NA NA
MEDIAN (DISTRIBUTION) NA NA
MEAN (PRODUCTS) 2.0x 10.4x
MEDIAN (PRODUCTS) 1.3x 10.4x
1) Source: Financial Information from SEC filings and other publicly-available sources
2) EBITDA: Earnings Before Interest, Taxes, Depreciation and Amortization
3) NA: Not Available
4) NM: Not Meaningful
PRODUCTS - DISTRIBUTION

11
ANALYSIS OF SELECTED PUBLICLY-TRADED
HEALTHCARE, MEDICAL AND PHARMACEUTICAL
SERVICES AND PRODUCTS COMPANIES1
(JANUARY 31, 2018) ($ Millions Except Per Share Data)
Company Name (Ticker Symbol)
Stock
Price Market Cap2 TEV3
LTM4
Revenue
LTM4
EBITDA5
LTM4
Diluted EPS
Before Extra
TEV3/
Revenue
TEV3/
EBITDA5
P/ Diluted
EPS Before
Extra
Aetna Inc. (NYSE:AET) 180.39 58,838.23 63,304.23 60,535.00 5,685.00 5.68 1.0x 11.1x NM
Amerisafe, Inc. (NasdaqGS:AMSF) 61.60 1,185.18 1,104.81 378.83 93.28 3.36 2.9x 11.8x 18.3x
Anthem, Inc. (NYSE:ANTM) 225.01 57,773.68 68,813.58 90,039.40 5,875.60 14.35 0.8x 11.7x 15.7x
Centene Corporation (NYSE:CNC) 100.88 17,408.51 17,934.51 44,870.00 2,221.00 4.84 0.4x 8.1x 20.8x
Cigna Corporation (NYSE:CI) 203.09 50,071.78 51,815.78 41,616.00 4,935.00 8.77 1.2x 10.5x 23.2x
CNO Financial Group, Inc. (NYSE:CNO) 24.69 4,142.05 7,135.65 4,212.00 1,016.10 2.78 1.7x 7.0x 8.9x
Humana Inc. (NYSE:HUM) 248.07 34,624.56 29,860.56 53,456.00 2,677.00 12.61 0.6x 11.2x 19.7x
Independence Holding Company (NYSE:IHC) 27.45 407.97 386.12 316.14 29.36 1.93 1.2x 13.2x 14.2x
Molina Healthcare, Inc. (NYSE:MOH) 76.68 4,377.97 2,740.97 19,014.00 151.00 (5.33) 0.1x 18.2x NM
ProAssurance Corporation (NYSE:PRA) 57.15 3,052.68 3,334.14 894.70 202.75 2.71 3.7x 16.4x 21.1x
Triple-S Management Corporation (NYSE:GTS) 24.85 585.88 348.13 2,937.30 65.41 1.74 0.1x 5.3x 14.2x
Trupanion, Inc. (NasdaqGM:TRUP) 29.27 879.27 861.32 228.50 2.34 (0.08) 3.8x NM NM
UnitedHealth Group Incorporated (NYSE:UNH) 220.46 213,640.61 230,815.61 201,159.00 17,454.00 10.72 1.1x 13.2x 20.6x
WellCare Health Plans, Inc. (NYSE:WCG) 201.11 8,953.73 5,256.43 16,180.30 700.30 7.97 0.3x 7.5x 25.2x
MEAN (INSURANCE) 1.4x 11.2x 18.4x
MEDIAN (INSURANCE) 1.1x 11.2x 19.7x
Allscripts Healthcare Solutions, Inc. (NasdaqNM:MDRX) 14.55 2,628.91 4,402.77 1,714.44 173.78 (1.16) 2.6x 25.3x NM
Castlight Health, Inc. (NYSE:CSLT) 3.75 501.52 419.88 124.31 (51.97) (0.48) 3.4x NM NM
Cerner Corporation (NasdaqNM:CERN) 67.39 22,401.44 22,084.39 4,987.91 1,387.39 2.01 4.4x 15.9x NM
CompuGroup Medical Societas Europaea (DB:COP) 55.14 2,741.68 3,067.55 608.40 126.43 0.83 NM 24.3x NM
Computer Programs and Systems, Inc. (NasdaqNM:CPSI) 30.05 404.11 547.65 263.42 27.54 0.44 2.1x 19.9x NM
Craneware plc (AIM:CRW) 14.65 391.43 350.49 57.80 17.31 0.49 NM 20.3x 29.8x
Evolent Health, Inc. (NYSE:EVH) 12.30 918.61 788.56 409.23 (48.26) (1.11) 1.9x NM NM
HealthEquity, Inc. (NasdaqGS:HQY) 46.66 2,830.98 2,605.91 215.90 66.95 0.74 NM NM NM
Inovalon Holdings, Inc. (NasdaqGS:INOV) 15.00 2,188.10 1,906.43 430.83 73.24 0.12 4.4x 26.0x NM
Medidata Solutions, Inc. (NasdaqGS:MDSO) 63.37 3,706.70 3,583.26 528.79 82.13 0.70 NM NM NM
Model N, Inc. (NYSE:MODN) 15.75 461.95 461.59 131.17 (28.23) (1.38) 3.5x NM NM
Quality Systems, Inc. (NasdaqGS:QSII) 13.58 864.66 893.11 527.63 50.98 0.28 1.7x 17.5x NM
RaySearch Laboratories AB (publ) (OM:RAY B) 171.00 5,862.35 5,842.29 571.48 189.10 3.53 NM NM NM
Simulations Plus, Inc. (NasdaqCM:SLP) 16.10 278.29 272.07 25.79 10.88 0.35 NM 25.0x NM
Veeva Systems Inc. (NYSE:VEEV) 55.28 7,813.46 7,055.38 650.81 162.54 0.86 NM NM NM
MEAN (TECHNOLOGY) 3.0x 21.8x NM
MEDIAN (TECHNOLOGY) 3.0x 22.3x NM
SERVICES - TECHNOLOGY
SERVICES - INSURANCE
12
Company Name (Ticker Symbol)
Stock
Price Market Cap2 TEV3
LTM4
Revenue
LTM4
EBITDA5
LTM4
Diluted EPS
Before Extra
TEV3/
Revenue
TEV3/
EBITDA5
P/ Diluted
EPS Before
Extra
AMN Healthcare Services, Inc. (NYSE:AMN) 49.25 2,352.79 2,652.81 1,967.24 240.50 2.39 1.3x 11.0x 20.6x
athenahealth, Inc. (NasdaqGS:ATHN) 133.04 5,323.95 5,477.65 1,220.30 165.30 1.31 4.5x NM NM
BioScrip, Inc. (NasdaqNM:BIOS) 2.91 371.07 896.08 874.73 35.35 (0.62) 1.0x 25.3x NM
Cegedim SA (ENXTPA:CGM) 33.18 462.67 701.66 455.96 33.53 (0.75) 1.5x 20.9x NM
CorVel Corporation (NasdaqNM:CRVL) 52.90 996.78 958.65 548.38 70.37 1.83 1.7x 13.6x 28.9x
Cross Country Healthcare, Inc. (NasdaqNM:CCRN) 12.76 465.50 550.71 867.90 39.27 0.05 0.6x 14.0x NM
eHealth, Inc. (NasdaqGS:EHTH) 17.37 323.47 272.09 177.28 (18.07) (1.15) 1.5x NM NM
Envision Healthcare Corporation (NYSE:EVHC) 34.56 4,126.96 11,023.26 7,206.90 1,050.90 (0.15) 1.5x 10.5x NM
EPS Holdings, Inc. (TSE:4282) 2,546.00 117,435.18 99,542.18 61,735.00 9,505.50 109.46 1.6x 10.5x 23.3x
Express Scripts Holding Company (NasdaqNM:ESRX) 74.64 42,274.08 53,791.78 99,549.10 7,133.20 6.09 0.5x 7.5x 12.3x
Healthcare Services Group, Inc. (NasdaqNM:HCSG) 52.72 3,862.95 3,806.56 1,765.29 132.41 1.19 2.2x 28.7x NM
HMS Holdings Corp. (NasdaqNM:HMSY) 16.95 1,425.22 1,585.73 498.31 95.21 0.27 3.2x 16.7x NM
ICON Public Limited Company (NasdaqGS:ICLR) 112.15 6,073.17 6,129.48 1,738.43 399.07 5.16 3.5x 15.4x 21.7x
Syneos Health, Inc. (NasdaqGS:SYNH) 43.60 4,549.44 7,301.96 1,365.35 266.57 (1.38) NM 27.4x NM
Magellan Health, Inc. (NasdaqNM:MGLN) 96.55 2,319.26 2,608.21 5,407.55 247.21 3.78 0.5x 10.6x 25.6x
On Assignment, Inc. (NYSE:ASGN) 64.27 3,343.00 3,925.02 2,567.77 268.58 2.15 1.5x 14.6x 29.9x
PRA Health Sciences, Inc. (NasdaqGS:PRAH) 91.07 5,771.08 6,933.21 1,793.19 263.17 1.79 3.9x 26.3x NM
IQVIA Holdings Inc. (NYSE: IQV ) 97.90 20,362.01 29,224.01 7,851.00 1,736.00 0.24 3.7x 16.8x NM
Stericycle, Inc. (NasdaqGS:SRCL) 67.99 5,804.50 8,542.18 3,599.30 748.19 (0.55) 2.4x 11.4x NM
Teladoc, Inc. (NYSE:TDOC) 34.85 2,130.94 2,329.39 193.54 (35.33) (1.46) NM NM NM
MEAN (OUTSOURCING) 2.0x 16.6x 23.2x
MEDIAN (OUTSOURCING) 1.6x 14.6x 23.3x
Firstsource Solutions Limited (BSE:532809) 40.80 27,958.62 33,186.91 35,284.26 3,948.04 3.92 0.9x 8.4x 10.4x
HCL Technologies Limited (NSEI:HCLTECH) 890.50 1,239,686.84 1,174,438.13 7,616.55 1,719.88 0.96 NM NM NM
Hexaware Technologies Limited (BSE:532129) 340.25 1,172.00 1,115.00 38,803.73 6,446.70 16.53 0.0x 0.2x 20.6x
Infosys Limited (NSEI:INFY) 1,042.05 2,264,425.22 1,909,634.14 10,703.00 2,876.00 1.08 NM NM NM
KPIT Technologies Limited (BSE:532400) 180.40 33,950.09 31,761.98 35,548.40 3,220.04 11.58 0.9x 9.9x 15.6x
MphasiS Limited (BSE:526299) 729.25 140,882.09 119,392.56 63,072.79 9,914.12 39.50 1.9x 12.0x 18.5x
NIIT Technologies Limited (BSE:532541) 646.30 39,703.84 32,893.84 29,473.00 4,706.50 47.73 1.1x 7.0x 13.5x
Tata Consultancy Services Limited (NSEI:TCS) 2,701.20 5,170,873.64 4,844,973.64 1,206,710.00 320,150.00 131.69 4.0x 15.1x 20.5x
Tech Mahindra Limited (NSEI:TECHM) 504.05 492,503.14 423,693.14 302,134.00 42,161.10 35.32 1.4x 10.0x 14.3x
Wipro Limited (BSE:507685) 313.40 1,517,524.78 1,280,984.78 547,060.00 107,573.00 17.49 2.3x 11.9x 17.9x
MEAN (INDIA-BASED OUTSOURCING) 1.6x 9.3x 16.4x
MEDIAN (INDIA-BASED OUTSOURCING) 1.3x 10.0x 16.8x
Connecture, Inc. (OTCPK:CNXR) 0.16 3.68 98.70 77.99 (5.16) (0.92) 1.3x NM NM
HealthStream, Inc. (NasdaqNM:HSTM) 23.16 738.72 615.32 243.64 27.12 0.18 2.5x 22.7x NM
SERVICES - OUTSOURCING
SERVICES - INDIA-BASED OUTSOURCING
SERVICES - INFORMATION

13
Company Name (Ticker Symbol)
Stock
Price Market Cap2 TEV3
LTM4
Revenue
LTM4
EBITDA5
LTM4
Diluted EPS
Before Extra
TEV3/
Revenue
TEV3/
EBITDA5
P/ Diluted
EPS Before
Extra
National Research Corporation (NasdaqGS:NRCI.B) 56.06 979.63 945.66 116.03 38.85 0.88 NM 24.3x NM
MEAN (INFORMATION) 1.9x 23.5x NM
MEDIAN (INFORMATION) 1.9x 23.5x NM
MEAN (SERVICES) 1.9x 15.1x 19.5x
MEDIAN (SERVICES) 1.6x 13.4x 20.5x
Charles River Laboratories International, Inc. (NYSE:CRL) 109.45 5,183.72 6,231.82 1,845.91 447.12 4.10 3.4x 13.9x 26.7x
China Cord Blood Corporation (NYSE:CO) 9.95 1,129.57 540.26 861.68 370.40 2.39 0.6x 1.5x 4.2x
Foundation Medicine, Inc. (NasdaqGS:FMI) 68.20 2,491.41 2,444.59 132.81 (141.42) (4.47) NM NM NM
Genomic Health, Inc. (NasdaqGS:GHDX) 34.20 1,189.66 1,070.69 336.03 11.07 (0.13) 3.2x NM NM
Invitae Corporation (NYSE:NVTA) 9.08 480.74 447.14 52.06 (102.63) (2.53) NM NM NM
Laboratory Corporation of America Holdings (NYSE:LH) 159.51 16,238.12 23,074.12 9,891.70 1,898.90 7.17 2.3x 12.2x 22.2x
NeoGenomics, Inc. (NasdaqCM:NEO) 8.86 712.43 835.40 251.31 22.57 (0.35) 3.3x NM NM
Quest Diagnostics Incorporated (NYSE:DGX) 98.49 13,424.13 17,026.13 7,709.00 1,552.00 5.50 2.2x 11.0x 17.9x
Sonic Healthcare Limited (ASX:SHL) 22.86 9,661.31 12,193.79 5,122.14 830.10 1.02 2.4x 14.7x 22.4x
MEAN (LABS) 2.5x 10.6x 18.7x
MEDIAN (LABS) 2.4x 12.2x 22.2x
Addus HomeCare Corporation (NasdaqGS:ADUS) 34.80 400.22 398.31 416.30 34.09 1.53 1.0x 11.7x 22.8x
Almost Family, Inc. (NasdaqNM:AFAM) 55.35 773.12 923.02 749.77 42.57 1.19 1.2x 21.7x NM
Amedisys, Inc. (NasdaqNM:AMED) 52.71 1,788.80 1,813.56 1,471.81 115.64 1.26 1.2x 15.7x NM
Chemed Corporation (NYSE:CHE) 243.02 3,880.06 3,943.69 1,641.84 238.50 4.54 2.4x 16.5x NM
LHC Group, Inc. (NasdaqNM:LHCG) 61.25 1,119.59 1,292.63 1,003.77 93.71 2.32 1.3x 13.8x 26.4x
MEAN (HOME HEALTH) 1.4x 15.9x 24.6x
MEDIAN (HOME HEALTH) 1.2x 15.7x 24.6x
AAC Holdings, Inc. (NYSE:AAC) 9.00 215.99 413.33 271.83 35.68 (0.06) 1.5x 11.6x NM
Acadia Healthcare Company, Inc. (NasdaqGS:ACHC) 32.63 2,866.66 6,078.60 2,814.69 574.00 1.98 2.2x 10.6x 16.5x
Civitas Solutions, Inc. (NYSE:CIVI) 17.10 640.26 1,264.58 1,474.51 147.80 0.17 0.9x 8.6x NM
Concord Medical Services Holdings Limited (NYSE:CCM) 3.33 145.44 381.04 406.65 (54.13) (7.21) 0.9x NM NM
CoreCivic, Inc. (NYSE:CXW) 22.50 2,659.60 4,038.07 1,789.06 429.59 1.67 2.3x 9.4x 13.5x
DaVita Inc. (NYSE:DVA) 72.25 13,246.47 22,572.97 15,212.89 2,436.32 2.66 1.5x 9.3x 27.2x
GEO Group, Inc. (NYSE: GEO) 23.60 2,885.31 5,596.99 2,261.02 389.26 1.35 2.5x 14.4x 17.5x
Hanger, Inc. (OTCPK:HNGR) 15.75 555.06 1,072.35 1,042.05 65.97 (2.99) 1.0x 16.3x NM
Encompass Health Corporation (NYSE:EHC) 49.41 4,857.54 7,870.44 3,844.40 820.60 2.76 2.0x 9.6x 17.9x
MEDNAX, Inc. (NYSE:MD) 53.44 4,954.14 6,721.22 3,378.26 598.87 2.82 2.0x 11.2x 18.9x
The Providence Service Corporation (NasdaqGS:PRSC) 59.34 789.55 774.71 1,603.46 63.44 (1.67) 0.5x 12.2x NM
RadNet, Inc. (NasdaqNM:RDNT) 10.10 481.00 1,098.57 911.57 115.95 0.23 1.2x 9.5x NM
Select Medical Holdings Corporation (NYSE:SEM) 17.65 2,362.00 5,784.26 4,298.85 492.34 0.72 1.3x 11.7x 24.5x
SERVICES - OUTSOURCING
PROVIDERS - LABS
PROVIDERS - HOME HEALTH & HOSPICE
PROVIDERS - NON-ACUTE

14
Company Name (Ticker Symbol)
Stock
Price Market Cap2 TEV3
LTM4
Revenue
LTM4
EBITDA5
LTM4
Diluted EPS
Before Extra
TEV3/
Revenue
TEV3/
EBITDA5
P/ Diluted
EPS Before
Extra
U.S. Physical Therapy, Inc. (NYSE:USPH) 72.20 908.36 1,051.48 391.92 61.66 1.61 2.7x 17.1x NM
MEAN (NON-ACUTE) 1.6x 11.6x 19.4x
MEDIAN (NON-ACUTE) 1.5x 11.2x 17.9x
Brookdale Senior Living Inc. (NYSE:BKD) 9.70 1,807.99 6,785.03 3,960.70 702.27 (4.60) 1.7x 9.7x NM
Capital Senior Living Corporation (NYSE:CSU) 13.49 411.15 1,406.45 464.10 79.57 (1.65) 3.0x 17.7x NM
Ensign Group, Inc. (NasdaqNM:ENSG) 22.20 1,135.99 1,389.66 1,794.66 130.32 0.91 0.8x 10.7x 24.4x
Five Star Senior Living Inc. (NasdaqCM:FVE) 1.50 75.07 105.00 1,130.14 12.77 (0.53) 0.1x 8.2x NM
Welltower Inc. (NYSE:HCN) 63.77 23,617.66 36,522.99 4,205.18 2,043.60 2.47 NM 17.9x 25.8x
Sabra Health Care REIT, Inc. (NasdaqGS:SBRA) 18.77 3,345.42 6,303.00 300.97 250.75 0.87 NM 25.1x 21.6x
Genesis Healthcare, Inc. (NYSE:GEN) 0.76 72.36 4,529.12 5,349.98 419.78 (5.70) 0.8x 10.8x NM
Ventas, Inc. (NYSE:VTR) 60.01 21,373.39 32,951.19 3,556.64 1,897.51 3.26 NM 17.4x 18.4x
MEAN (LONG-TERM CARE) 1.3x 14.7x 22.5x
MEDIAN (LONG-TERM CARE) 0.8x 14.1x 23.0x
Community Health Systems, Inc. (NYSE:CYH) 4.26 477.15 14,487.15 16,764.00 1,655.00 (5.82) 0.9x 8.8x NM
HCA Healthcare, Inc. (NYSE:HCA) 87.84 31,099.97 64,998.97 43,614.00 8,188.00 5.95 1.5x 7.9x 14.8x
Kindred Healthcare, Inc. (NYSE:KND) 9.70 887.23 4,207.26 6,995.55 453.57 (2.21) 0.6x 9.3x NM
LifePoint Health, Inc. (NasdaqNM:LPNT) 49.80 1,962.91 4,866.71 6,406.20 749.10 4.22 0.8x 6.5x 11.8x
Tenet Healthcare Corporation (NYSE:THC) 15.16 1,530.20 18,469.20 19,061.00 1,995.00 (5.52) 1.0x 9.3x NM
Universal Health Services, Inc. (NYSE:UHS) 113.35 10,757.94 14,804.70 10,242.76 1,697.23 7.28 1.4x 8.7x 15.6x
MEAN (ACUTE) 1.0x 8.4x 14.0x
MEDIAN (ACUTE) 0.9x 8.7x 14.8x
MEAN (PROVIDERS) 1.6x 12.2x 19.6x
MEDIAN (PROVIDERS) 1.4x 11.2x 18.9x
ABIOMED, Inc. (NasdaqNM:ABMD) 187.41 8,286.55 8,039.31 543.99 150.44 1.99 NM NM NM
Accelerate Diagnostics, Inc. (NasdaqCM:AXDX) 26.20 1,451.42 1,330.10 2.10 (61.87) (1.20) NM NM NM
Accuray Incorporated (NasdaqNM:ARAY) 4.30 360.85 427.02 400.69 6.61 (0.29) 1.1x NM NM
Agilent Technologies, Inc. (NYSE:A) 66.97 21,632.52 20,969.52 4,472.00 1,095.00 2.10 4.7x 19.2x NM
Align Technology, Inc. (NasdaqNM:ALGN) 222.19 17,814.68 17,135.62 1,473.41 389.23 2.83 NM NM NM
Alliqua BioMedical, Inc. (NasdaqCM:ALQA) 1.81 9.02 17.65 20.50 (13.21) (8.62) 0.9x NM NM
Alphatec Holdings, Inc. (NasdaqNM:ATEC) 2.66 41.38 89.81 102.55 (2.91) (1.98) 0.9x NM NM
Analogic Corporation (NasdaqGS:ALOG) 83.75 1,045.60 898.24 472.13 42.28 (5.70) 1.9x 21.2x NM
AngioDynamics, Inc. (NasdaqNM:ANGO) 16.63 610.58 656.31 344.63 46.49 (0.27) 1.9x 14.1x NM
Anika Therapeutics, Inc. (NasdaqGS:ANIK) 53.91 790.42 637.71 112.76 52.92 2.12 NM 12.0x 25.4x
AtriCure, Inc. (NasdaqNM:ATRC) 18.24 628.81 633.11 169.81 (20.27) (1.02) 3.7x NM NM
Avinger, Inc. (NasdaqCM:AVGR) 7.28 5.98 38.92 12.70 (43.42) (87.55) 3.1x NM NM
Baxter International Inc. (NYSE:BAX) 64.64 35,217.94 35,191.94 10,561.00 2,249.67 1.30 3.3x 15.6x NM
Bio-Techne Corporation (NasdaqGS:TECH) 129.55 4,853.23 5,068.00 577.04 188.11 1.95 NM 26.9x NM
BioTelemetry, Inc. (NasdaqGS:BEAT) 29.90 969.00 1,154.84 237.88 46.49 1.33 4.9x 24.8x 22.4x
PROVIDERS - LONG-TERM CARE
PROVIDERS - ACUTE
PRODUCTS - CLINICAL DEVICES

15
Company Name (Ticker Symbol)
Stock
Price Market Cap2 TEV3
LTM4
Revenue
LTM4
EBITDA5
LTM4
Diluted EPS
Before Extra
TEV3/
Revenue
TEV3/
EBITDA5
P/ Diluted
EPS Before
Extra
Boston Scientific Corporation (NYSE:BSX) 24.79 34,041.52 39,513.52 9,048.00 2,514.67 0.08 4.4x 15.7x NM
Bruker Corporation (NasdaqNM:BRKR) 34.32 5,359.87 5,419.27 1,705.70 282.00 0.94 3.2x 19.2x NM
Cardiovascular Systems, Inc. (NasdaqGS:CSII) 23.69 808.34 724.02 204.78 4.82 (0.06) 3.5x NM NM
Catalent, Inc. (NYSE:CTLT) 41.08 5,457.87 6,949.87 2,299.70 442.80 0.55 3.0x 15.7x NM
ConforMIS, Inc. (NasdaqGS:CFMS) 2.38 107.80 82.94 79.04 (53.82) (1.35) 1.0x NM NM
CONMED Corporation (NasdaqNM:CNMD) 50.97 1,423.79 1,888.09 796.39 128.42 1.97 2.4x 14.7x 25.9x
Corindus Vascular Robotics, Inc. (AMEX:CVRS) 1.01 190.59 164.64 6.00 (34.72) (0.23) NM NM NM
CryoLife, Inc. (NYSE:CRY) 19.15 692.08 705.91 181.91 17.99 0.28 3.9x NM NM
Cutera, Inc. (NasdaqGS:CUTR) 45.35 628.32 577.85 141.74 7.98 0.75 4.1x NM NM
Cytosorbents Corporation (NasdaqCM:CTSO) 6.50 186.49 181.06 13.59 (10.39) (0.40) NM NM NM
DexCom, Inc. (NasdaqNM:DXCM) 57.39 4,987.37 4,792.27 668.70 (45.10) (0.56) NM NM NM
Edwards Lifesciences Corporation (NYSE:EW) 112.71 23,851.68 23,482.88 3,435.30 1,103.63 2.88 NM 21.3x NM
Ekso Bionics Holdings, Inc. (OTCBB:EKSO) - 127.60 101.18 7.49 (26.61) (1.03) NM NM NM
Endologix, Inc. (NasdaqNM:ELGX) 5.35 446.48 610.26 184.62 (54.29) (0.92) 3.3x NM NM
Entellus Medical, Inc. (NasdaqGM:ENTL) 24.39 621.43 617.86 86.25 (29.36) (1.24) NM NM NM
Enzo Biochem, Inc. (NYSE:ENZ) 8.15 382.44 316.40 109.20 0.99 (0.04) 2.9x NM NM
Exactech, Inc. (NasdaqNM:EXAC) 49.45 712.74 715.03 264.45 43.18 0.03 2.7x 16.6x NM
Fresenius SE & Co. KGaA (DB:FRE) 64.81 35,934.83 61,905.83 32,623.00 6,015.00 3.20 1.9x 10.3x 20.2x
GenMark Diagnostics, Inc. (NasdaqGM:GNMK) 4.17 228.50 171.04 51.38 (52.63) (1.22) 3.3x NM NM
Genomic Health, Inc. (NasdaqGS:GHDX) 34.20 1,189.66 1,070.69 336.03 11.07 (0.13) 3.2x NM NM
Glaukos Corporation (NYSE:GKOS) 25.65 886.60 777.79 150.78 8.23 (0.03) NM NM NM
Globus Medical, Inc. (NYSE:GMED) 41.10 3,961.06 3,623.40 611.53 210.10 1.10 NM 17.2x NM
Hologic, Inc. (NasdaqNM:HOLX) 42.75 11,785.47 14,622.57 3,058.80 1,011.30 2.64 4.8x 14.5x 16.2x
Illumina, Inc. (NasdaqNM:ILMN) 218.49 31,899.54 31,164.54 2,752.00 666.00 4.92 NM NM NM
Inogen, Inc. (NasdaqGS:INGN) 119.08 2,485.24 2,322.15 236.50 39.94 1.23 NM NM NM
Integer Holdings Corporation (NYSE:ITGR) 45.30 1,434.64 3,020.96 1,431.03 274.70 0.63 2.1x 11.0x NM
Integra LifeSciences Holdings Corporation
(NasdaqNM:IART) 47.86 3,755.93 4,445.73 1,075.30 245.22 0.61 4.1x 18.1x NM
Intersect ENT, Inc. (NasdaqGM:XENT) 32.40 954.37 851.87 91.00 (17.75) (0.62) NM NM NM
Intuitive Surgical, Inc. (NasdaqNM:ISRG) 364.94 40,890.74 38,745.94 3,128.90 1,174.90 5.67 NM NM NM
Invuity, Inc. (NasdaqGM:IVTY) 6.20 106.26 112.05 37.75 (35.67) (2.47) 3.0x NM NM
IRadimed Corporation (NasdaqCM:IRMD) 15.15 159.91 134.70 22.37 2.30 0.13 NM NM NM
K2M Group Holdings, Inc. (NasdaqGS:KTWO) 18.00 779.91 819.74 252.02 (3.86) (0.96) 3.3x NM NM
LeMaitre Vascular, Inc. (NasdaqGM:LMAT) 31.84 613.40 575.88 98.00 23.69 0.78 NM 24.3x NM
LivaNova PLC (NasdaqGS:LIVN) 79.92 3,853.07 3,913.64 1,226.80 188.77 1.17 3.2x 20.7x NM
Masimo Corporation (NasdaqNM:MASI) 84.80 4,381.71 4,091.77 756.13 194.18 6.24 NM 21.1x 13.6x
Medtronic plc (NYSE:MDT) 80.75 109,294.96 124,957.96 29,639.00 9,166.00 3.64 4.2x 13.6x 22.2x
Meridian Bioscience, Inc. (NasdaqNM:VIVO) 14.00 592.31 589.88 206.25 52.33 0.51 2.9x 11.3x 27.4x
NanoString Technologies, Inc. (NasdaqGM:NSTG) 7.47 189.61 148.29 104.90 (37.46) (2.05) 1.4x NM NM
Natus Medical Incorporated (NasdaqNM:BABY) 38.20 1,170.59 1,192.42 477.23 44.14 (0.10) 2.5x 27.0x NM
16
Company Name (Ticker Symbol)
Stock
Price Market Cap2 TEV3
LTM4
Revenue
LTM4
EBITDA5
LTM4
Diluted EPS
Before Extra
TEV3/
Revenue
TEV3/
EBITDA5
P/ Diluted
EPS Before
Extra
Nevro Corp. (NYSE:NVRO) 69.04 2,045.53 1,917.44 299.24 (20.42) (1.44) NM NM NM
NuVasive, Inc. (NasdaqNM:NUVA) 58.49 2,981.12 3,541.39 1,028.98 233.26 1.16 3.4x 15.2x NM
Nxstage Medical, Inc. (NasdaqNM:NXTM) 24.23 1,604.81 1,556.09 383.35 11.11 (0.21) 4.1x NM NM
Orthofix International N.V. (NasdaqNM:OFIX) 54.70 996.25 942.32 425.46 47.13 0.04 2.2x 20.0x NM
pSivida Corp. (NasdaqGM:PSDV) 1.08 48.88 37.04 7.65 (14.92) (0.47) 4.8x NM NM
Quidel Corporation (NasdaqNM:QDEL) 43.35 1,473.77 1,453.25 215.66 40.17 (0.15) NM NM NM
ResMed Inc. (NYSE:RMD) 84.69 12,017.84 12,225.61 2,195.82 616.88 1.99 NM 19.8x NM
REVA Medical, Inc. (ASX:RVA) 0.68 280.47 384.50 NM (20.92) (0.00) NM NM NM
ReWalk Robotics Ltd. (NasdaqCM:RWLK) 1.10 32.95 35.69 7.83 (22.60) (1.54) 4.6x NM NM
SeaSpine Holdings Corporation (NasdaqGS:SPNE) 10.12 135.90 119.21 130.35 (21.96) (2.89) 0.9x NM NM
Second Sight Medical Products, Inc. (NasdaqCM:EYES) 1.91 108.50 95.16 5.57 (31.09) (0.64) NM NM NM
Sientra, Inc. (NasdaqGS:SIEN) 14.06 272.70 259.80 31.97 (36.47) (2.86) NM NM NM
Smith & Nephew plc (LSE:SN.) 12.88 11,262.26 12,493.46 4,677.00 1,315.00 0.98 2.7x 9.5x 13.1x
Sonova Holding AG (SWX:SOON) 152.20 9,942.57 10,428.75 2,578.74 555.39 5.68 4.0x 18.8x 26.8x
STAAR Surgical Company (NasdaqNM:STAA) 15.50 638.05 628.46 87.90 2.18 (0.05) NM NM NM
Stryker Corporation (NYSE:SYK) 154.84 57,946.95 62,442.95 12,444.00 3,402.00 2.68 NM 18.4x NM
T2 Biosystems, Inc. (NasdaqGM:TTOO) 4.12 147.60 136.21 3.91 (49.54) (1.91) NM NM NM
Tandem Diabetes Care, Inc. (NasdaqGM:TNDM) 2.36 23.88 86.94 96.22 (60.50) (18.54) 0.9x NM NM
TransEnterix, Inc. (AMEX:TRXC) 1.93 384.61 372.96 3.77 (48.73) (0.64) NM NM NM
Utah Medical Products, Inc. (NasdaqNM:UTMD) 81.40 302.86 265.34 41.41 21.75 2.28 NM 12.2x NM
Varian Medical Systems, Inc. (NYSE:VAR) 111.15 10,183.22 9,821.32 2,745.20 544.88 1.47 3.6x 18.0x NM
Wright Medical Group N.V. (NasdaqNM:WMGI) 22.20 2,318.98 2,955.77 720.41 68.32 (1.17) 4.1x NM NM
Zimmer Biomet Holdings, Inc. (NYSE:ZBH) 120.67 24,432.43 34,376.73 7,824.10 2,808.70 9.03 4.4x 12.2x 13.4x
MEAN (CLINICAL) 3.0x 17.3x 20.6x
MEDIAN (CLINICAL) 3.2x 17.2x 22.2x
Abaxis, Inc. (NasdaqNM:ABAX) 49.52 1,123.96 975.53 234.98 45.50 1.08 4.2x 21.4x NM
Cerus Corporation (NasdaqNM:CERS) 3.38 385.61 355.76 37.45 (59.85) (0.59) NM NM NM
Getinge AB (OM:GETI B) 119.00 32,412.03 47,444.03 22,495.00 4,662.00 4.37 2.1x 10.2x 27.2x
Haemonetics Corporation (NYSE:HAE) 58.08 3,067.68 3,150.67 892.24 162.43 0.09 3.5x 19.4x NM
Harvard Bioscience, Inc. (NasdaqGM:HBIO) 3.30 115.11 121.75 100.83 3.11 (0.09) 1.2x NM NM
IDEXX Laboratories, Inc. (NasdaqNM:IDXX) 156.38 13,639.26 14,475.79 1,969.06 495.19 2.94 NM 29.2x NM
Invacare Corporation (NYSE:IVC) 16.85 553.29 638.18 962.89 (14.55) (2.35) 0.7x NM NM
Omnicell, Inc. (NasdaqGS:OMCL) 48.50 1,839.72 2,024.59 716.17 59.27 0.53 2.8x NM NM
Pacific Biosciences of California, Inc. (NasdaqGS:PACB) 2.64 306.90 236.30 93.47 (81.34) (0.87) 2.5x NM NM
PerkinElmer, Inc. (NYSE:PKI) 73.12 8,059.67 8,460.75 2,256.98 458.14 1.42 3.7x 18.5x NM
Steris Plc (NYSE:STE) 73.64 6,474.90 7,143.30 2,570.09 546.62 1.68 2.8x 13.1x NM
Surmodics, Inc. (NasdaqGS:SRDX) 28.00 366.76 318.43 73.11 12.93 0.29 4.4x 24.6x NM
Thermo Fisher Scientific Inc. (NYSE:TMO) 189.88 76,141.00 97,490.20 20,918.00 5,249.00 5.60 4.7x 18.6x NM
PRODUCTS - NON-CLINICAL DEVICES

17
Company Name (Ticker Symbol)
Stock
Price Market Cap2 TEV3
LTM4
Revenue
LTM4
EBITDA5
LTM4
Diluted EPS
Before Extra
TEV3/
Revenue
TEV3/
EBITDA5
P/ Diluted
EPS Before
Extra
Waters Corporation (NYSE:WAT) 193.19 15,364.98 14,067.82 2,309.08 799.97 0.25 NM 17.6x NM
MEAN (NON-CLINICAL) 3.0x 19.2x 27.2x
MEDIAN (NON-CLINICAL) 2.8x 18.6x 27.2x
Atrion Corporation (NasdaqNM:ATRI) 630.60 1,167.77 1,107.82 145.87 49.35 18.05 NM 22.4x NM
Becton, Dickinson and Company (NYSE:BDX) 214.06 57,028.85 61,693.85 12,093.00 3,333.00 4.60 NM 18.5x NM
Halyard Health, Inc. (NYSE:HYH) 46.18 2,162.91 2,577.21 1,606.20 187.40 1.20 1.6x 13.8x NM
ICU Medical, Inc. (NasdaqNM:ICUI) 216.00 4,276.76 4,041.55 1,018.18 102.14 1.44 4.0x NM NM
Merit Medical Systems, Inc. (NasdaqNM:MMSI) 43.20 2,168.59 2,423.09 694.67 113.98 0.59 3.5x 21.3x NM
Nipro Corporation (TSE:8086) 1,672.00 278,032.29 645,030.29 370,021.00 59,401.00 91.08 1.7x 10.9x 18.4x
Retractable Technologies, Inc. (AMEX:RVP) 0.68 22.21 10.73 32.47 (3.16) (0.17) 0.3x NM NM
Teleflex Incorporated (NYSE:TFX) 248.82 11,209.16 12,441.64 2,065.13 556.04 5.53 NM 22.4x NM
Terumo Corporation (TSE:4543) 5,340.00 1,879,641.12 2,099,248.12 553,664.00 137,151.00 174.90 3.8x 15.3x NM
MEAN (DISPOSABLES) 2.5x 17.8x 18.4x
MEDIAN (DISPOSABLES) 2.6x 18.5x 18.4x
Bio-Rad Laboratories, Inc. (NYSE:BIO) 238.67 7,101.59 6,820.06 2,111.17 244.52 0.80 3.2x 27.9x NM
Cambrex Corporation (NYSE:CBM) 48.00 1,573.32 1,454.92 529.55 175.70 3.04 2.7x 8.3x 15.8x
Cantel Medical Corp. (NYSE:CMD) 102.87 4,314.05 4,444.83 795.20 154.17 1.81 NM 28.8x NM
ChromaDex Corporation (NasdaqCM:CDXC) 5.88 316.33 292.88 23.27 (7.61) (0.22) NM NM NM
DENTSPLY SIRONA Inc. (NasdaqNM:XRAY) 65.83 15,120.03 16,384.63 3,898.90 821.70 (3.45) 4.2x 19.9x NM
Exact Sciences Corporation (NasdaqCM:EXAS) 52.54 6,290.64 5,834.21 213.82 (118.76) (1.15) NM NM NM
Fluidigm Corporation (NasdaqGS:FLDM) 5.89 227.63 360.43 99.28 (59.74) (2.22) 3.6x NM NM
Hill-Rom Holdings, Inc. (NYSE:HRC) 84.29 5,548.05 7,632.95 2,776.00 532.60 2.94 2.7x 14.3x 28.7x
Ion Beam Applications SA (ENXTBR:IBAB) 23.89 699.54 678.37 335.26 26.42 0.39 2.0x 25.7x NM
Luminex Corporation (NasdaqNM:LMNX) 19.70 867.87 756.96 300.64 52.01 0.66 2.5x 14.6x 29.8x
Mettler-Toledo International Inc. (NYSE:MTD) 619.52 15,846.78 16,746.91 2,656.72 641.44 16.49 NM 26.1x NM
Natera, Inc. (NasdaqGS:NTRA) 8.99 483.38 460.45 206.47 (117.69) (2.43) 2.2x NM NM
Neogen Corporation (NasdaqGS:NEOG) 61.66 3,143.16 2,983.40 384.31 83.69 1.01 NM NM NM
OraSure Technologies, Inc. (NasdaqNM:OSUR) 18.86 1,143.83 983.69 145.14 25.37 0.52 NM NM NM
Oxford Immunotec Global PLC (NasdaqGM:OXFD) 13.97 358.40 320.53 101.76 (23.87) (2.03) 3.1x NM NM
QIAGEN N.V. (NYSE:QGEN) 30.93 7,001.81 7,796.86 1,417.54 473.87 0.17 NM 16.5x NM
Quotient Limited (NasdaqGM:QTNT) 4.95 225.52 309.00 23.10 (65.24) (2.80) NM NM NM
Rockwell Medical, Inc. (NasdaqGM:RMTI) 5.82 301.25 262.33 55.85 (21.40) (0.43) 4.7x NM NM
Trinity Biotech plc (NasdaqGS:TRIB) 5.10 117.83 150.62 98.27 6.21 (1.65) 1.5x 24.2x NM
TrovaGene, Inc. (NasdaqCM:TROV) 0.31 16.23 10.29 0.39 (25.16) (1.01) NM NM NM
Veracyte, Inc. (NasdaqGM:VCYT) 6.53 222.28 206.46 70.61 (21.49) (0.81) 2.9x NM NM
West Pharmaceutical Services, Inc. (NYSE:WST) 98.67 7,326.54 7,287.04 1,565.80 330.10 2.50 4.7x 22.1x NM
MEAN (COMMERCIAL) 3.1x 20.8x 24.8x
MEDIAN (COMMERCIAL) 2.9x 22.1x 28.7x
PRODUCTS - DISPOSABLES
PRODUCTS - COMMERCIAL

18
Company Name (Ticker Symbol)
Stock
Price Market Cap2 TEV3
LTM4
Revenue
LTM4
EBITDA5
LTM4
Diluted EPS
Before Extra
TEV3/
Revenue
TEV3/
EBITDA5
P/ Diluted
EPS Before
Extra
Cooper Companies Inc. (NYSE:COO) 217.88 10,665.06 11,749.06 2,139.00 659.10 7.52 NM 17.8x 29.0x
Essilor International Société Anonyme (ENXTPA:EI) 114.95 24,645.15 27,322.15 7,441.00 1,730.00 3.56 3.7x 15.8x NM
Insulet Corporation (NasdaqNM:PODD) 69.00 4,014.96 4,084.15 436.82 9.14 (0.50) NM NM NM
Nutrisystem, Inc. (NasdaqGS:NTRI) 52.60 1,567.64 1,478.02 674.67 94.69 1.83 2.2x 15.6x 28.7x
USANA Health Sciences, Inc. (NYSE:USNA) 74.05 1,776.65 1,584.90 1,027.05 145.42 3.62 1.5x 10.9x 20.5x
MEAN (CONSUMER) 2.5x 15.0x 26.0x
MEDIAN (CONSUMER) 2.2x 15.7x 28.7x
Abbott Laboratories (NYSE:ABT) 57.07 99,336.08 112,401.08 27,390.00 6,847.00 0.20 4.1x 16.4x NM
AbbVie Inc. (NYSE:ABBV) 96.71 154,390.72 182,926.72 28,216.00 12,223.33 3.30 NM 15.0x 29.3x
AcelRx Pharmaceuticals, Inc. (NasdaqGM:ACRX) 2.03 101.94 56.40 13.69 (36.12) (1.12) 4.1x NM NM
Achillion Pharmaceuticals, Inc. (NasdaqGS:ACHN) 2.88 397.03 75.67 15.00 (69.40) (0.49) NM NM NM
Acorda Therapeutics, Inc. (NasdaqNM:ACOR) 21.45 1,002.73 1,142.45 540.52 88.01 (1.21) 2.1x 13.0x NM
Adamas Pharmaceuticals, Inc. (NasdaqGM:ADMS) 33.89 771.98 683.66 0.04 (73.21) (3.37) NM NM NM
Akorn, Inc. (NasdaqGS:AKRX) 32.23 4,031.03 4,499.54 938.66 296.16 0.59 4.8x 15.2x NM
Alexion Pharmaceuticals, Inc. (NasdaqGS:ALXN) 119.59 26,717.56 28,449.56 3,472.00 1,378.00 2.24 NM 20.6x NM
Alimera Sciences, Inc. (NasdaqGM:ALIM) 1.33 91.97 169.54 37.45 (13.38) (0.31) 4.5x NM NM
Allergan plc (NYSE:AGN) 163.58 54,403.94 84,242.04 15,478.90 6,491.90 (22.20) NM 13.0x NM
Amphastar Pharmaceuticals, Inc. (NasdaqGS:AMPH) 19.24 884.57 863.58 243.32 8.94 (0.00) 3.5x NM NM
Ampio Pharmaceuticals, Inc. (AMEX:AMPE) 4.07 309.08 307.26 - (12.50) (0.20) NM NM NM
ANI Pharmaceuticals, Inc. (NasdaqGM:ANIP) 64.45 750.39 883.65 167.76 65.85 0.64 NM 13.4x NM
Antares Pharma, Inc. (NasdaqCM:ATRS) 1.99 311.78 299.16 54.67 (14.64) (0.11) NM NM NM
Aradigm Corporation (NasdaqCM:ARDM) 6.70 97.30 99.24 12.22 (10.70) (0.98) NM NM NM
Array BioPharma Inc. (NasdaqNM:ARRY) 12.80 2,521.95 2,194.11 47.26 (111.42) (0.74) NM NM NM
Arrowhead Pharmaceuticals, Inc. (NasdaqGS:ARWR) 3.68 275.37 211.74 31.41 (32.31) (0.47) NM NM NM
Astellas Pharma Inc. (TSE:4503) 1,437.00 2,915,982.50 2,611,819.50 1,305,465.00 316,296.00 88.87 2.0x 8.3x 16.2x
AstraZeneca PLC (LSE:AZN) 51.21 64,830.91 75,553.40 22,465.00 6,199.00 2.37 3.4x 12.2x 21.6x
BioDelivery Sciences International, Inc. (NasdaqCM:BDSI) 2.95 164.86 180.81 51.97 (25.41) 0.10 3.5x NM 29.2x
Bristol-Myers Squibb Company (NYSE:BMY) 61.28 100,296.96 101,748.96 20,776.00 4,192.00 0.61 4.9x 24.3x NM
Clovis Oncology, Inc. (NasdaqGS:CLVS) 68.00 3,333.01 2,987.12 38.55 (238.83) (8.26) NM NM NM
Compugen Ltd. (NasdaqGM:CGEN) 2.50 127.86 89.40 0.05 (34.99) (0.71) NM NM NM
Corcept Therapeutics Incorporated (NasdaqCM:CORT) 18.06 2,061.08 1,985.93 129.73 36.24 0.29 NM NM NM
Curis, Inc. (NasdaqGM:CRIS) 0.70 114.79 88.43 9.00 (53.17) (0.40) NM NM NM
Depomed, Inc. (NasdaqGS:DEPO) 8.05 507.26 1,028.19 410.23 110.22 (1.83) 2.5x 9.3x NM
DURECT Corporation (NasdaqGM:DRRX) 0.92 136.93 115.16 20.65 (31.13) (0.15) NM NM NM
Egalet Corporation (NasdaqGM:EGLT) 1.00 43.00 67.65 24.47 (68.72) (3.17) 2.8x NM NM
Eli Lilly and Company (NYSE:LLY) 84.46 88,445.48 95,101.48 22,871.30 6,514.43 (0.19) 4.2x 14.6x NM
Elite Pharmaceuticals, Inc. (OTCPK:ELTP) 0.09 72.54 82.64 7.01 (8.51) (0.01) NM NM NM
Endo International plc (NasdaqNM:ENDP) 7.75 1,730.68 9,273.10 3,941.73 109.18 (19.25) 2.4x NM NM
PRODUCTS - PHARMACEUTICALS
PRODUCTS - CONSUMER

19
Company Name (Ticker Symbol)
Stock
Price Market Cap2 TEV3
LTM4
Revenue
LTM4
EBITDA5
LTM4
Diluted EPS
Before Extra
TEV3/
Revenue
TEV3/
EBITDA5
P/ Diluted
EPS Before
Extra
Foamix Pharmaceuticals Ltd. (NasdaqGM:FOMX) 6.01 224.97 148.44 4.11 (59.82) (1.59) NM NM NM
GlaxoSmithKline plc (LSE:GSK) 17.88 87,495.73 111,478.97 40,400.34 11,890.97 0.63 2.8x 9.4x 28.2x
Heska Corporation (NasdaqCM:HSKA) 80.21 581.02 579.91 135.69 22.32 1.91 4.3x 26.0x NM
ImmunoGen, Inc. (NasdaqGS:IMGN) 6.41 847.73 655.90 84.23 (66.02) (1.33) NM NM NM
Impax Laboratories, Inc. (NasdaqGS:IPXL) 16.65 1,234.93 1,863.04 791.30 101.61 (6.25) 2.4x 18.3x NM
Infinity Pharmaceuticals, Inc. (NasdaqGS:INFI) 2.03 102.94 53.37 6.00 (44.86) (1.14) NM NM NM
Innoviva, Inc. (NasdaqGS:INVA) 14.19 1,532.74 1,968.00 191.31 157.52 0.85 NM 12.5x 16.6x
INSYS Therapeutics, Inc. (NasdaqGM:INSY) 9.62 705.31 583.66 164.07 (35.58) (2.57) 3.6x NM NM
Ironwood Pharmaceuticals, Inc. (NasdaqGS:IRWD) 14.99 2,244.84 2,415.76 291.53 (86.96) (0.96) NM NM NM
Jazz Pharmaceuticals PLC (NasdaqGS:JAZZ) 134.65 8,072.33 9,199.63 1,578.92 777.48 6.07 NM 11.8x 22.2x
Johnson & Johnson (NYSE:JNJ) 139.72 375,360.58 394,453.58 74,361.00 25,672.00 5.75 NM 15.4x 24.3x
Juniper Pharmaceuticals, Inc. (NasdaqGS:JNP) 4.85 52.59 34.39 59.12 8.66 0.62 0.6x 4.0x 7.8x
Karyopharm Therapeutics Inc. (NasdaqGS:KPTI) 9.60 452.94 333.53 0.12 (117.53) (2.65) NM NM NM
Lannett Company, Inc. (NYSE:LCI) 23.20 874.64 1,653.42 630.74 237.47 1.13 2.6x 7.0x 20.6x
Mallinckrodt Public Limited Company (NYSE:MNK) 22.56 2,143.31 7,605.51 3,179.30 653.50 (9.43) 2.4x 11.6x NM
Merck & Co., Inc. (NYSE:MRK) 56.27 153,304.06 169,381.06 39,804.00 12,860.00 1.03 4.3x 13.2x NM
Mylan N.V. (NasdaqGS:MYL) 42.31 22,696.62 36,651.32 11,936.60 3,880.50 1.62 3.1x 9.4x 26.2x
Neos Therapeutics, Inc. (NasdaqGM:NEOS) 10.20 295.77 295.20 20.73 (60.04) (3.26) NM NM NM
Novartis AG (SWX:NOVN) 84.55 196,778.85 217,481.06 49,527.00 14,898.00 2.81 4.4x 14.6x NM
Novo Nordisk A/S (CPSE:NOVO B) 53.95 131,869.05 128,824.68 17,991.11 8,480.17 2.46 NM 15.2x 21.9x
Opko Health, Inc. (NasdaqGS:OPK) 4.90 2,741.08 2,791.82 1,149.29 (66.72) (0.19) 2.4x NM NM
Osiris Therapeutics, Inc. (OTCPK:OSIR) 6.00 207.16 - 86.60 4.41 0.05 NM NM NM
Pacira Pharmaceuticals, Inc. (NasdaqGS:PCRX) 45.65 1,852.02 1,830.98 280.45 (17.23) (1.31) NM NM NM
Pernix Therapeutics Holdings, Inc. (NasdaqGM:PTX) 2.40 28.31 284.82 134.70 11.31 (12.83) 2.1x 25.2x NM
Perrigo Company plc (NYSE:PRGO) 87.16 12,275.68 15,186.58 4,994.40 1,122.00 (9.21) 3.0x 13.5x NM
Pfizer Inc. (NYSE:PFE) 36.22 215,896.82 243,341.82 52,471.00 20,680.00 1.62 4.6x 11.8x 22.4x
Phibro Animal Health Corporation (NasdaqGM:PAHC) 33.50 1,346.19 1,615.95 769.71 118.20 1.69 2.1x 13.7x 19.8x
Progenics Pharmaceuticals, Inc. (NasdaqGS:PGNX) 5.95 418.11 369.45 12.46 (51.44) (0.80) NM NM NM
Recro Pharma, Inc. (NasdaqCM:REPH) 9.25 176.93 160.51 70.15 (19.08) (2.07) 2.3x NM NM
Rigel Pharmaceuticals, Inc. (NasdaqNM:RIGL) 3.88 568.39 500.31 7.48 (68.69) (0.59) NM NM NM
Roche Holding AG (SWX:ROG) 252.93 215,770.49 232,847.94 56,548.20 22,346.43 11.76 4.1x 10.4x 21.5x
Sanofi (ENXTPA:SAN) 86.28 108,087.97 117,347.10 43,020.92 12,098.45 4.26 2.7x 9.7x 20.3x
Sarepta Therapeutics, Inc. (NasdaqGS:SRPT) 55.64 3,596.12 3,009.78 102.73 (192.89) (2.04) NM NM NM
Sucampo Pharmaceuticals, Inc. (NasdaqNM:SCMP) 17.95 842.60 1,061.09 250.47 107.24 (3.37) 4.2x 9.9x NM
Supernus Pharmaceuticals, Inc. (NasdaqGM:SUPN) 39.85 2,042.80 1,928.25 276.18 88.63 1.10 NM 21.8x NM
Takeda Pharmaceutical Company Limited (TSE:4502) 56.83 44,569.00 51,018.38 15,653.53 3,070.20 1.85 3.3x 16.6x NM
Taro Pharmaceutical Industries Ltd. (NYSE:TARO) 104.71 4,199.14 2,806.71 748.05 412.51 8.13 3.8x 6.8x 12.9x
Teligent, Inc. (NasdaqGS:TLGT) 3.63 193.84 274.08 69.89 1.10 (0.23) 3.9x NM NM
Teva Pharmaceutical Industries Limited (NYSE:TEVA) 18.95 19,253.20 58,519.20 23,418.00 6,548.00 (5.87) 2.5x 8.9x NM

20
Company Name (Ticker Symbol)
Stock
Price Market Cap2 TEV3
LTM4
Revenue
LTM4
EBITDA5
LTM4
Diluted EPS
Before Extra
TEV3/
Revenue
TEV3/
EBITDA5
P/ Diluted
EPS Before
Extra
TherapeuticsMD, Inc. (NasdaqGS:TXMD) 6.04 1,307.06 1,158.76 17.14 (78.68) (0.39) NM NM NM
Valeant Pharmaceuticals International, Inc. (TSX:VRX) 26.20 27,899.20 57,468.90 8,964.00 3,584.00 3.92 NM 16.0x 6.7x
Zoetis Inc. (NYSE:ZTS) 72.04 35,104.25 38,855.25 5,124.00 1,806.00 1.90 NM 21.5x NM
Zogenix, Inc. (NasdaqGM:ZGNX) 40.05 1,371.81 1,326.31 20.81 (83.45) (4.40) NM NM NM
MEAN (PHARMACEUTICALS) 3.2x 13.9x 20.3x
MEDIAN (PHARMACEUTICALS) 3.2x 13.4x 21.6x
AmerisourceBergen Corporation (NYSE:ABC) 91.82 20,024.29 21,382.87 153,143.83 2,444.41 1.64 0.1x 8.7x NM
Aceto Corporation (NasdaqGS:ACET) 10.33 311.03 567.94 741.23 73.71 (0.17) 0.8x 7.7x NM
Cardinal Health, Inc. (NYSE:CAH) 61.27 19,275.77 28,126.77 130,578.00 3,041.00 3.43 0.2x 9.2x 17.9x
CVS Health Corporation (NYSE:CVS) 72.50 73,448.93 96,682.93 182,351.00 12,331.00 4.86 0.5x 7.8x 14.9x
Diplomat Pharmacy, Inc. (NYSE:DPLO) 20.07 1,464.17 1,586.05 4,475.00 72.65 0.12 0.4x 21.8x NM
Henry Schein, Inc. (NasdaqNM:HSIC) 69.88 10,967.97 13,191.12 12,264.42 1,033.47 3.48 1.1x 12.8x 20.1x
McKesson Corporation (NYSE:MCK) 155.95 32,511.59 40,043.59 205,442.00 3,766.00 22.75 0.2x 10.6x 6.9x
Medicines Company (NasdaqGS:MDCO) 27.34 1,972.22 2,405.97 85.03 (345.86) (9.17) NM NM NM
Owens & Minor, Inc. (NYSE:OMI) 18.88 1,156.51 1,975.35 9,296.80 214.64 1.26 0.2x 9.2x 15.0x
Patterson Companies, Inc. (NasdaqNM:PDCO) 36.13 3,346.75 4,344.25 5,532.30 391.26 1.70 0.8x 11.1x 21.2x
PetMed Express, Inc. (NasdaqGS:PETS) 45.50 926.74 858.31 269.51 51.93 1.70 3.2x 16.5x 26.8x
Premier, Inc. (NasdaqGS:PINC) 29.19 1,670.11 1,717.29 1,531.97 447.16 1.74 1.1x 3.8x 16.8x
Prestige Brands Holdings, Inc. (NYSE:PBH) 44.41 2,355.46 4,404.57 1,025.88 345.68 7.29 4.3x 12.7x 6.1x
Rite Aid Corporation (NYSE:RAD) 1.97 2,064.26 8,968.22 31,955.62 937.17 0.10 0.3x 9.6x 18.9x
Vitamin Shoppe, Inc. (NYSE:VSI) 4.40 105.48 240.59 1,214.79 76.92 (10.64) 0.2x 3.1x NM
MEAN (DISTRIBUTION) 1.0x 10.3x 16.4x
MEDIAN (DISTRIBUTION) 0.4x 9.4x 17.3x
MEAN (PRODUCTS) 2.8x 15.8x 20.3x
MEDIAN (PRODUCTS) 3.0x 15.1x 20.5x
1) Source: Financial Information from SEC filings and other publicly-available sources
2) Market Cap: Total Value of Company's Stock; Equal to the Number of Shares Outstanding Times the Price per Share
3) TEV (Total Enterprise Value): Market Capitalization Plus Debt Less Cash
4) LTM: Latest Twelve Months
5) EBITDA: Earnings Before Interest, Taxes, Depreciation and Amortization
6) NA: Not Available
7) NM: Not Meaningful
PRODUCTS - DISTRIBUTION

21
Note: Disclaimer
In the preparation of the information contained in this document, Scott-Macon, Ltd. has endeavored to present information that is as accurate and cur-rent as possible from sources believed to be reliable. However, inadvertent errors can occur. Therefore, the information is provided “as is”, without any representation or warranty of any kind, expressed or implied. Any reproduction, retransmission, republication, or other use of all or part of this docu-ment is expressly prohibited, unless written permission has been granted by Scott-Macon, Ltd. All other rights are reserved.
Copyright 2018 © Scott-Macon, Ltd.

22

ABOUT SCOTT-MACON
Scott-Macon is an investment banking firm providing corporate advisory services to a broad range of industries, including a spe-
cific focus on the healthcare, medical and pharmaceutical services and products industries. Founded in 1973, Scott-Macon has
20 senior professionals with an average of 20 years’ experience in investment banking.
SERVICES AND CAPABILITIES
• Corporate Sales — Assisting privately-held and publicly-traded companies to arrange sale, divestiture and merger transac-
tions as well as corporate valuations for board or management use.
• Acquisition Advisory — Providing assistance in identifying acquisition prospects, contacting companies, and negotiating ac-
quisition transactions.
• Capital Raising — Arranging for the private placement of equity and debt securities.
• Strategic Planning — Planning overall corporate objectives, reviewing strategic alternatives, and creating plans for maximiz-
ing value.
HEALTHCARE INVESTMENT BANKING GROUP
PROFESSIONALS
Robert B. Dimmitt
Senior Managing Director
Spencer R. Berg
Vice President
Leslie S. Lau
Vice President
Merritt Piro
Analyst
Nathan D. Cortright
Group Head
Jeffrey M. Tepper
Managing Director
Joshua H. Keatts
Vice President
George B. James
Senior Associate
CONTACT INFORMATION
Telephone: 212-755-8200
Facsimile: 212-755-8255
www.scott-macon.com