scottish industry/science partnership (sisp) report · pdf filescottish industry/science...
TRANSCRIPT
Fisheries Research Services
West of four – effectiveness of windsock area closure
SCOTTISH INDUSTRY / SCIENCE PARTNERSHIP (SISP)Report No 02/09
S I S PProject 008/07
Orkney Isles
Western Isles
Shetland Isles
58°N
59°N
60°N
5°W6°W7°W8°W9°W10°W 4°W 3°W 2°W 1°W 1°E 2°E0°
WINDSOCK AREA
A Jaworski and I PennyFebruary 2009

SCOTTISH INDUSTRY/SCIENCE PARTNERSHIP (SISP) REPORT NO 02/09
WEST OF FOUR – EFFECTIVENESS OF WINDSOCK AREA CLOSURE
SISP PROJECT NUMBER: 008/07
Andrzej Jaworski and Iain Penny Fisheries Research Services Marine Laboratory PO Box 101 375 Victoria Road Aberdeen AB11 9DB FRS Tel: +44 (0)1224-295416 FRS Fax: +44 (0)1224-295511 FRS E-mail: [email protected], [email protected]
West of Four – Effectiveness of Windsock Area Closure
2
CONTENTS
Executive Summary
PART 1 – SISP SURVEY PART 2 – ANALYSIS OF HISTORICAL SURVEY DATA (1990–2008) PART 3 – COMMENTS FROM INDUSTRY PARTNER
PART 1 – SISP SURVEY
Introduction Objectives Charter and survey details Results
Fish abundance Mean size Catch weight and composition
Discussion Fish abundance Mean fish size and catch weight Reference to historical analysis Future surveys Side effect of closure – static gear
Conclusions
PART 2 – ANALYSIS OF HISTORICAL SURVEY DATA (1990–2008) Introduction Methods Results
Haddock Whiting Flatfish Saithe and hake Anglerfish Cod Commercial fish (aggregate category) Norway pout and poor cod Grey gurnard and lesser argentine Lesser spotted dogfish Other elasmobranchs
Conclusions PART 3 – COMMENTS FROM INDUSTRY PARTNER
Introduction Industry Perspective – Summary
Acknowledgements References Table and Figure Legends
Tables and Figures
Annex 1 – Report of the Skipper of the MFV Enterprise Annex 2 – FRS Survey Report MFV Enterprise Annex 3 – Summary of Industry Partner Review of Report
West of Four – Effectiveness of Windsock Area Closure
EXECUTIVE SUMMARY
PART 1 – SISP SURVEY
1. As part of the Scottish Industry/Science Partnership (SISP), the Scottish White Fish Producers Association and Fisheries Research Services conducted a survey on a chartered commercial fishing boat (MFV Enterprise) in March 2008 to assess the effectiveness of the Windsock closed area.
2. The mean catch weight, catch composition, abundance and mean size of the
principal commercial fish stocks were compared inside and outside the closed area. The effect of other factors (such as depth, substrate type and tow duration) were accounted for in the analyses.
3. Fish abundance: Cod abundance was higher inside the closed area, particularly the
large size classes (> 60 cm). Some other stocks (whiting, anglerfish and black-bellied anglerfish) showed similar tendencies, but the observed differences were generally less significant. An opposite effect was observed for smaller fish (< 40 cm), such as flatfish and small anglerfish. Their abundance (particularly that of plaice and small anglerfish) was lower inside the closed area. No apparent differences were found for haddock and saithe.
4. Fish size: Differences in mean size were consistent with the differences in
abundance across fish sizes. Mean size was found to be larger inside the closed area for most of the main stocks (including cod).
5. Catch weight and composition: Mean catch weight (per standard tow) was 78%
higher inside than outside the closed area. Inside vs. outside differences in catch composition reflected the differences in fish abundance across species with a higher proportion of fish such as cod and whiting, and a smaller proportion of flatfish (particularly that of plaice) inside the closed area
6. The opposite effects for small and large fish are consistent with the effects observed
in the analysis of the historical survey data for the Windsock and in similar studies of other closed areas (e.g. in Iceland). This may be explained by a higher predation pressure of larger fish on smaller fish inside the closed area.
7. The survey results are consistent with the hypothesis that the Windsock area may
play an important role in protection of cod and anglerfish. The apparently adverse effect on flatfish inside the closure does not seem to affect greatly their population status in Area VI.
8. More evidence for the effectiveness of the Windsock closure may be obtained from
further survey charters in the study area and there is scope to improve their design.
PART 2 – ANALYSIS OF HISTORICAL SURVEY DATA (1990–2008)
9. Historical data on fish abundance collected during standard surveys conducted in the Windsock area and adjacent waters by FRS during the period 1990–March 2008 (including the pre-closure and post-closure periods) were subject to analysis.
3
West of Four – Effectiveness of Windsock Area Closure
10. The data were collected in two seasons, February–April and October–December.
Sampling stations were located at depths of 80 to 212 m. Tow duration varied widely from 10 to 61 minutes. A standard GOV survey trawl with a mesh size of 20 mm in the codend was used throughout the whole study period.
11. In total, 37 surveys took place and 228 valid hauls were made in the Windsock and
reference area during the study period. about 1.25 million demersal fish were caught in the study area.
12. Norway pout was by far the most abundant species (78% of the demersal fish catch).
Haddock (9%) and whiting (3%) were most abundant among commercial demersal species. Twenty-eight demersal species were recorded with an average frequency of one or more fish per standard trawl of 30 minutes.
13. The Windsock closure had a positive impact on some species:
• haddock and larger anglerfish • large cod and haddock showed positive trends only in the most recent period • cod numbers were extremely variable and the recently observed increase for
this species needs to be considered cautiously • lesser spotted dogfish, as well as other elasmobranchs, increased markedly
in the Windsock area following the closure.
14. The closure appeared to have an adverse effect on:
• small fish, particularly Norway pout and poor cod • small size classes of other fish such as flatfish (particularly plaice and lemon
sole) and anglerfish • small haddock and whiting declined in the whole study area, but their decline
was more pronounced outside the Windsock.
15. The examined post-closure period was relatively short (effectively just over four years) and recovery in most demersal fish species may be expected to take longer.
16. A more conclusive assessment of the effectiveness of the Windsock closure would
be possible with longer time series for the post-closure period, i.e. with more data to be collected over the next few years.
PART 3 – COMMENTS FROM INDUSTRY PARTNER
17. The skipper of the MFV Enterprise during the SISP survey (Douglas Ironside) summarised the SISP survey as follows;
“Windsock seems to be full with spotted dogs. The further west the better the size of fish. There is a spread of monk on all the tows we tried. Was disappointed to see so little cod. The back of Sule tows was the only cod we saw. Good mark of decent haddock both tows at North East Rona.”
18. Following on an early draft of this report, the SWFPA industry partner (including
David Lovie, Douglas Ironside, Peter Lovie and Alan Addison) provided an industry perspective. An edited summary is included in the report.
4

West of Four – Effectiveness of Windsock Area Closure
PART 1 – SISP SURVEY
INTRODUCTION In 2000, the EU Commission and Council noted the urgent requirement to establish a recovery plan for cod (Gadus morhua) to the west of Scotland. The immediate requirement was to try to ensure that as many cod as possible could spawn. The Windsock area was one of two areas identified for closure under emergency measures for 2001. The area to be protected was considered by scientists, the industry and the Commission in January 2001 and was enforced from 6 March to 30 April in 2001 (EC, 2001). Derogations were provided for pelagic fishing with encircling gears and some categories of pelagic trawls; the use of pots and creels for shellfish and crustaceans was also permitted. The scope of this closure was modified at the 2003 December meeting of the Council of Ministers to operate throughout the year 2004 (EC, 2003). It has remained in place since then. The March 2007 Edinburgh Cod Symposium identified the need for an assessment of this closure, although it acknowledged that the assessment would prove difficult in the absence of baseline data. In 2007, Fisheries Research Services (FRS) examined historical data (back to 1994) from research vessel surveys inside and around the Windsock area, but the results did not show any conclusive effects of the closure. The Scientific, Technical and Economic Comittee for Fisheries at its plenary meeting in November 2007 recommended that the Windsock closure be maintained (STECF, 2007). The Committee recognised, however, that “(...) it would not be sufficient by itself to protect cod, but that its removal would not help to improve cod recovery measures” (STECF, 2007). STECF went on to suggest that an expansion of the closure might be more effective. STECF also noticed that the available information on the cod stock in and around the closure was too poorly spatially resolved to disentangle any closure effects from other effects. Fishermen have generally supported temporary closures to allow fish populations to grow to optimum size provided there is scientific advice that supports such closures. Thus, there is an urgent need for clear scientific evidence of the effects of the Windsock closure. In 2007, the Scottish Industry / Science Partnership (SISP) initiated a new project involving a commercial vessel charter with the goal of assessing the effect of the closure on the principal fish stocks. The project was conducted as a partnership between the Scottish White Fish Producers Association (SWFPA) and FRS. The charter took place in March 2008. The results of the project are presented in Part 1 of this report. The report is supplemented by the results in Part 2 of the re-run analysis of historical survey data collected by FRS during the period 1990–March 2008. Objectives The main objective of the project was to assess the effect of the Windsock closure on the stocks of cod and other species. The specific objectives were as follows:
1. To assess whether there have been any differences in catch weight and composition as well as in fish abundance and mean size between the closed area and the adjacent fishing grounds.
2. To evaluate the obtained results in a wider context.
To achieve the first objective, a survey charter was conducted by FRS in liaison with the SWFPA. The data collected during the survey, total catch in weight, and fish numbers by
5
West of Four – Effectiveness of Windsock Area Closure
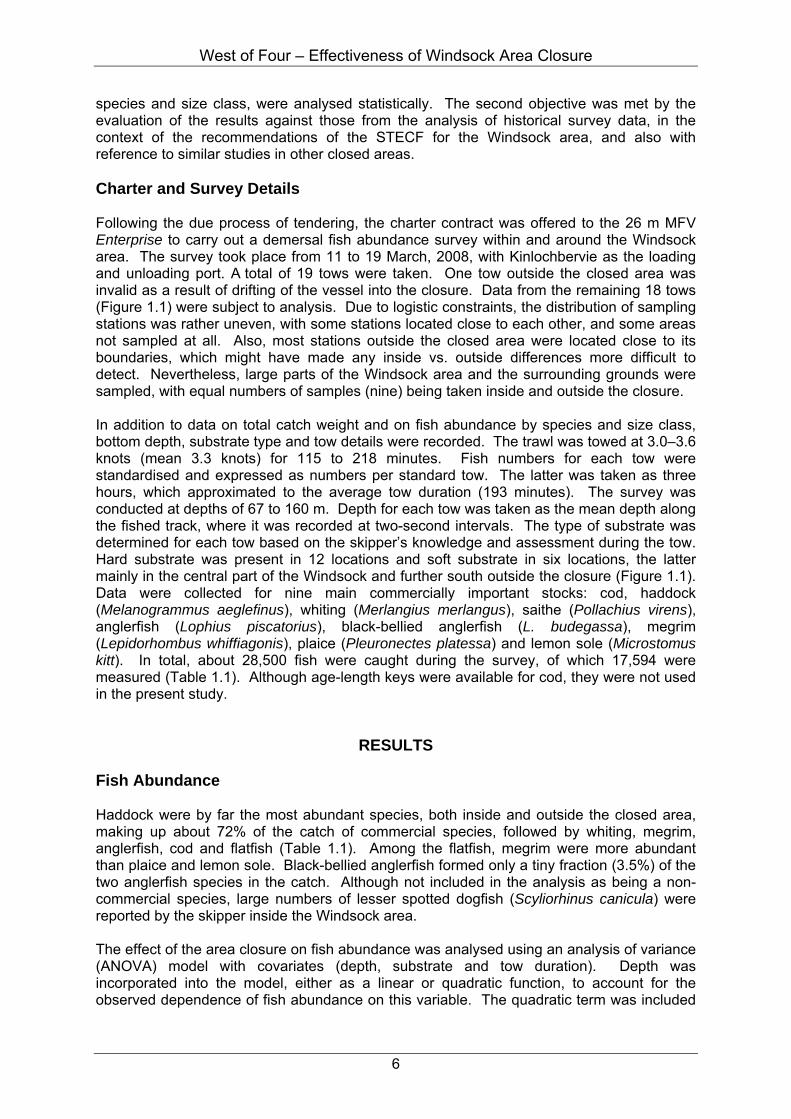
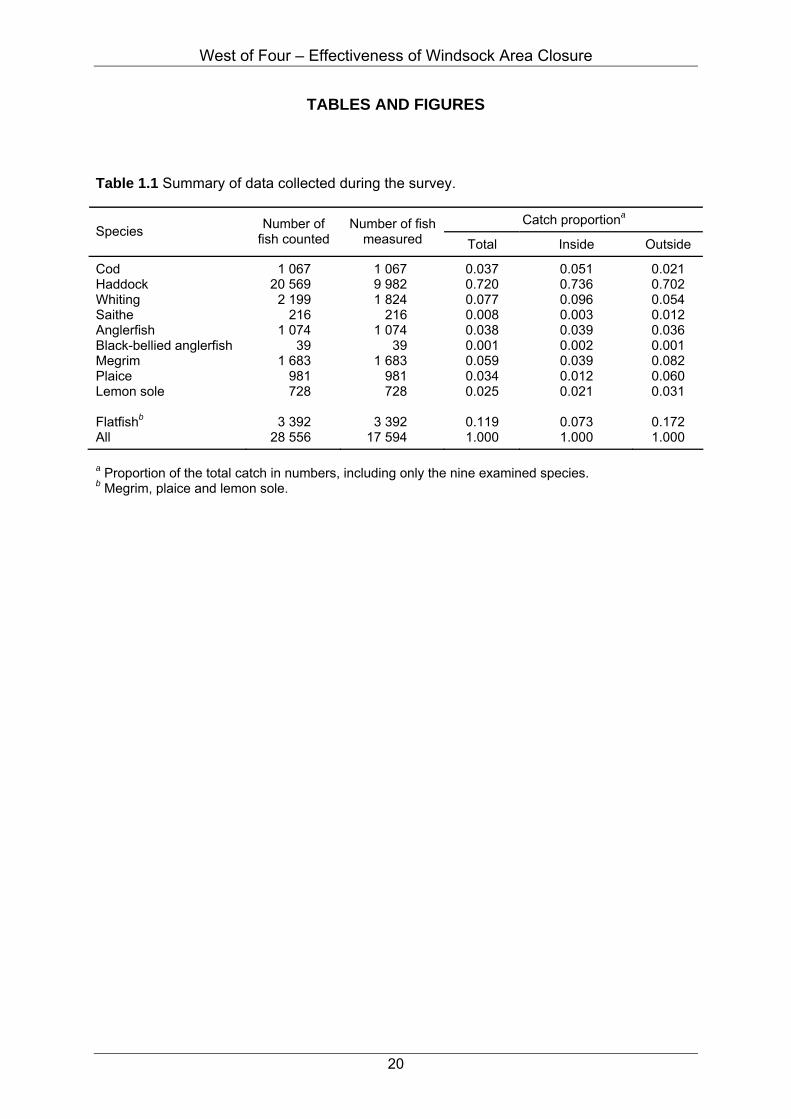
species and size class, were analysed statistically. The second objective was met by the evaluation of the results against those from the analysis of historical survey data, in the context of the recommendations of the STECF for the Windsock area, and also with reference to similar studies in other closed areas. Charter and Survey Details Following the due process of tendering, the charter contract was offered to the 26 m MFV Enterprise to carry out a demersal fish abundance survey within and around the Windsock area. The survey took place from 11 to 19 March, 2008, with Kinlochbervie as the loading and unloading port. A total of 19 tows were taken. One tow outside the closed area was invalid as a result of drifting of the vessel into the closure. Data from the remaining 18 tows (Figure 1.1) were subject to analysis. Due to logistic constraints, the distribution of sampling stations was rather uneven, with some stations located close to each other, and some areas not sampled at all. Also, most stations outside the closed area were located close to its boundaries, which might have made any inside vs. outside differences more difficult to detect. Nevertheless, large parts of the Windsock area and the surrounding grounds were sampled, with equal numbers of samples (nine) being taken inside and outside the closure. In addition to data on total catch weight and on fish abundance by species and size class, bottom depth, substrate type and tow details were recorded. The trawl was towed at 3.0–3.6 knots (mean 3.3 knots) for 115 to 218 minutes. Fish numbers for each tow were standardised and expressed as numbers per standard tow. The latter was taken as three hours, which approximated to the average tow duration (193 minutes). The survey was conducted at depths of 67 to 160 m. Depth for each tow was taken as the mean depth along the fished track, where it was recorded at two-second intervals. The type of substrate was determined for each tow based on the skipper’s knowledge and assessment during the tow. Hard substrate was present in 12 locations and soft substrate in six locations, the latter mainly in the central part of the Windsock and further south outside the closure (Figure 1.1). Data were collected for nine main commercially important stocks: cod, haddock (Melanogrammus aeglefinus), whiting (Merlangius merlangus), saithe (Pollachius virens), anglerfish (Lophius piscatorius), black-bellied anglerfish (L. budegassa), megrim (Lepidorhombus whiffiagonis), plaice (Pleuronectes platessa) and lemon sole (Microstomus kitt). In total, about 28,500 fish were caught during the survey, of which 17,594 were measured (Table 1.1). Although age-length keys were available for cod, they were not used in the present study.
RESULTS Fish Abundance Haddock were by far the most abundant species, both inside and outside the closed area, making up about 72% of the catch of commercial species, followed by whiting, megrim, anglerfish, cod and flatfish (Table 1.1). Among the flatfish, megrim were more abundant than plaice and lemon sole. Black-bellied anglerfish formed only a tiny fraction (3.5%) of the two anglerfish species in the catch. Although not included in the analysis as being a non-commercial species, large numbers of lesser spotted dogfish (Scyliorhinus canicula) were reported by the skipper inside the Windsock area. The effect of the area closure on fish abundance was analysed using an analysis of variance (ANOVA) model with covariates (depth, substrate and tow duration). Depth was incorporated into the model, either as a linear or quadratic function, to account for the observed dependence of fish abundance on this variable. The quadratic term was included
6

West of Four – Effectiveness of Windsock Area Closure
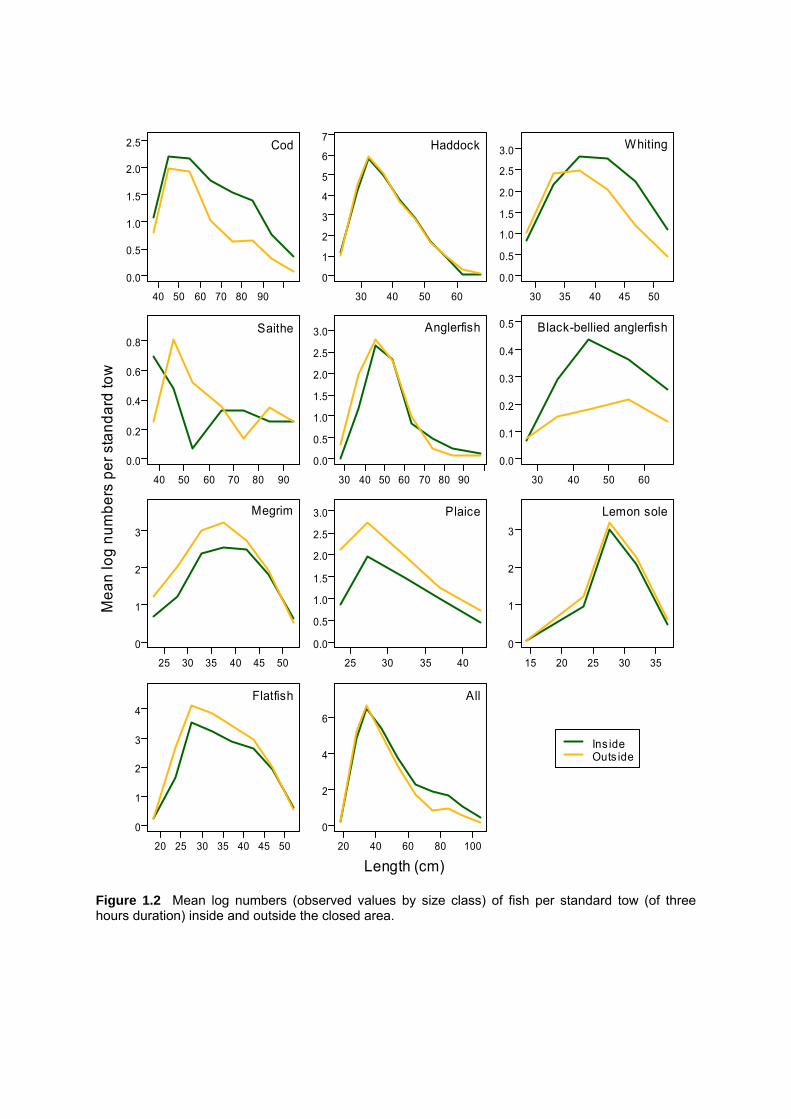
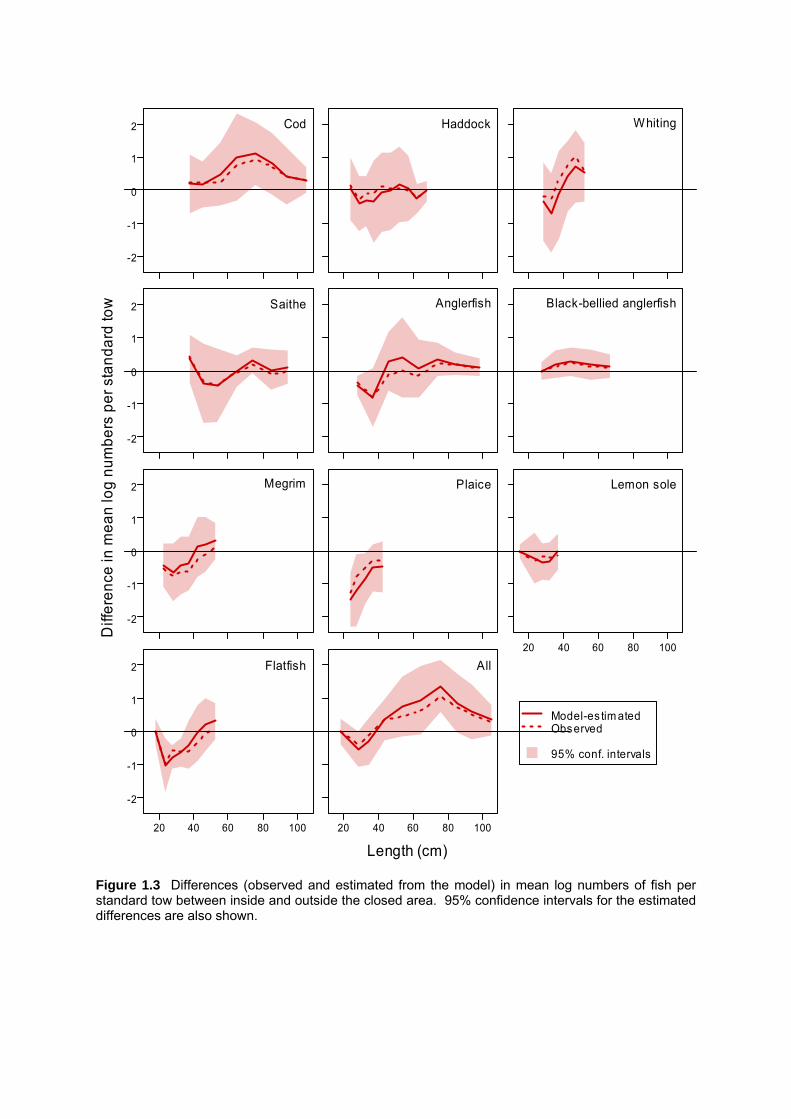
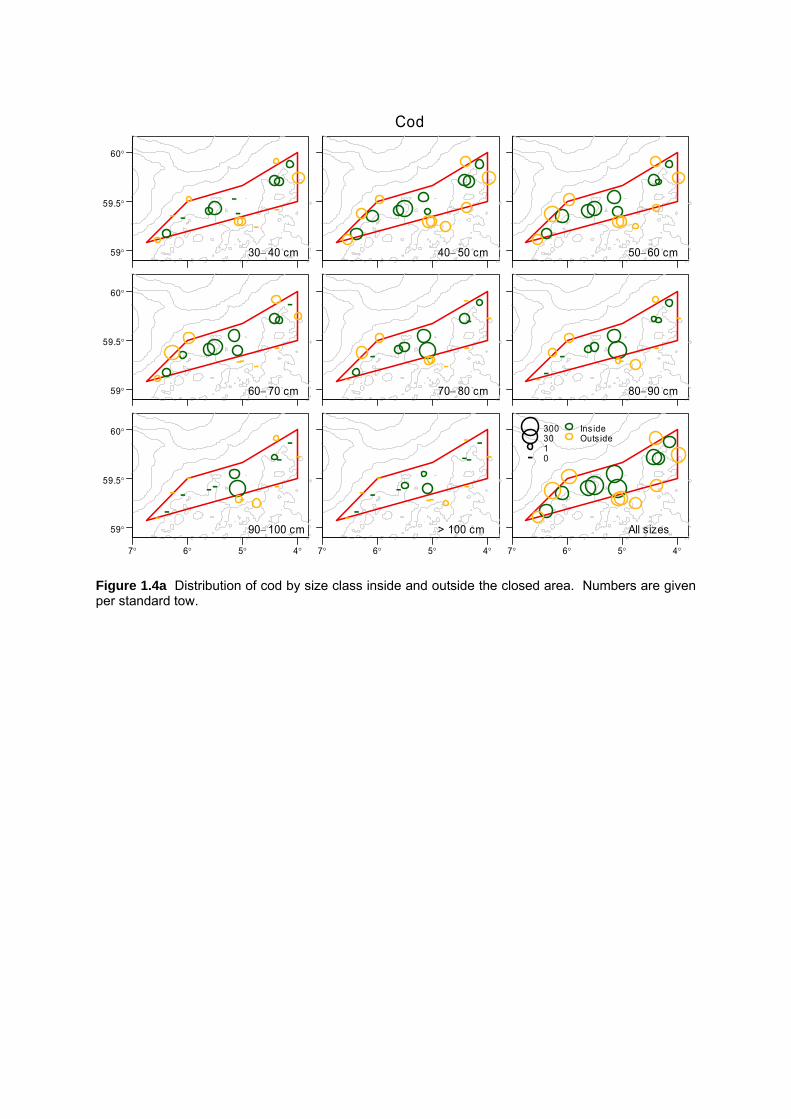
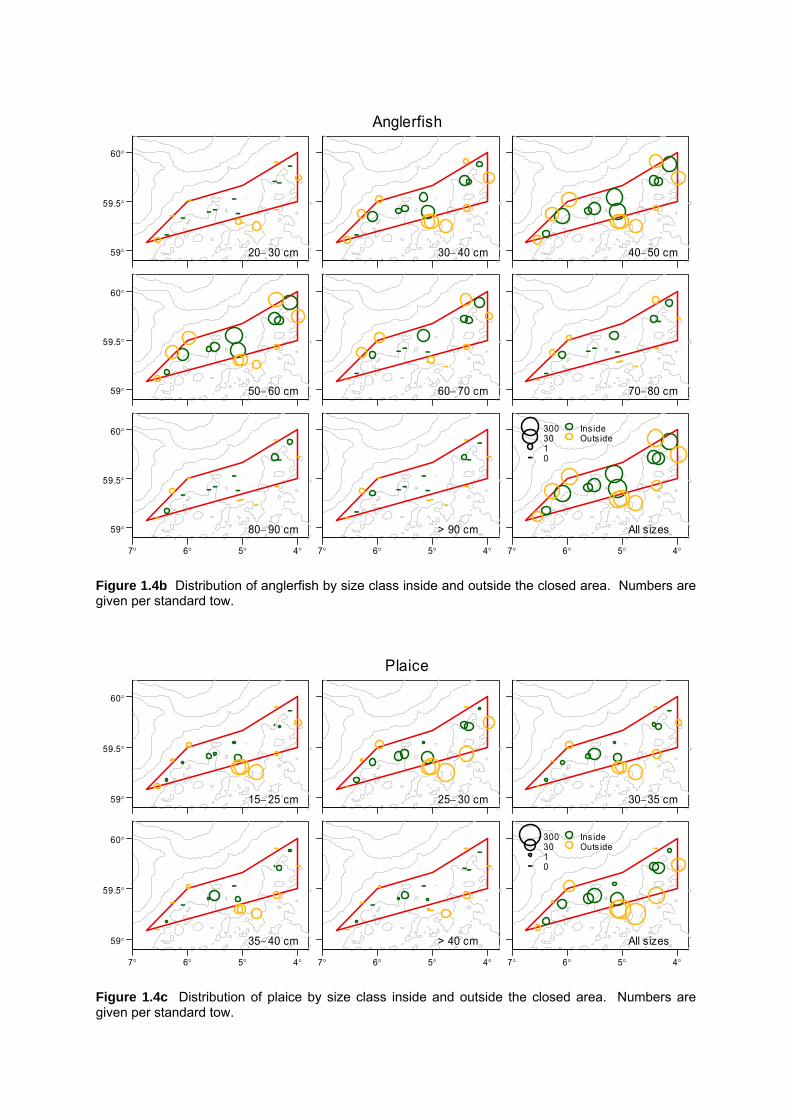
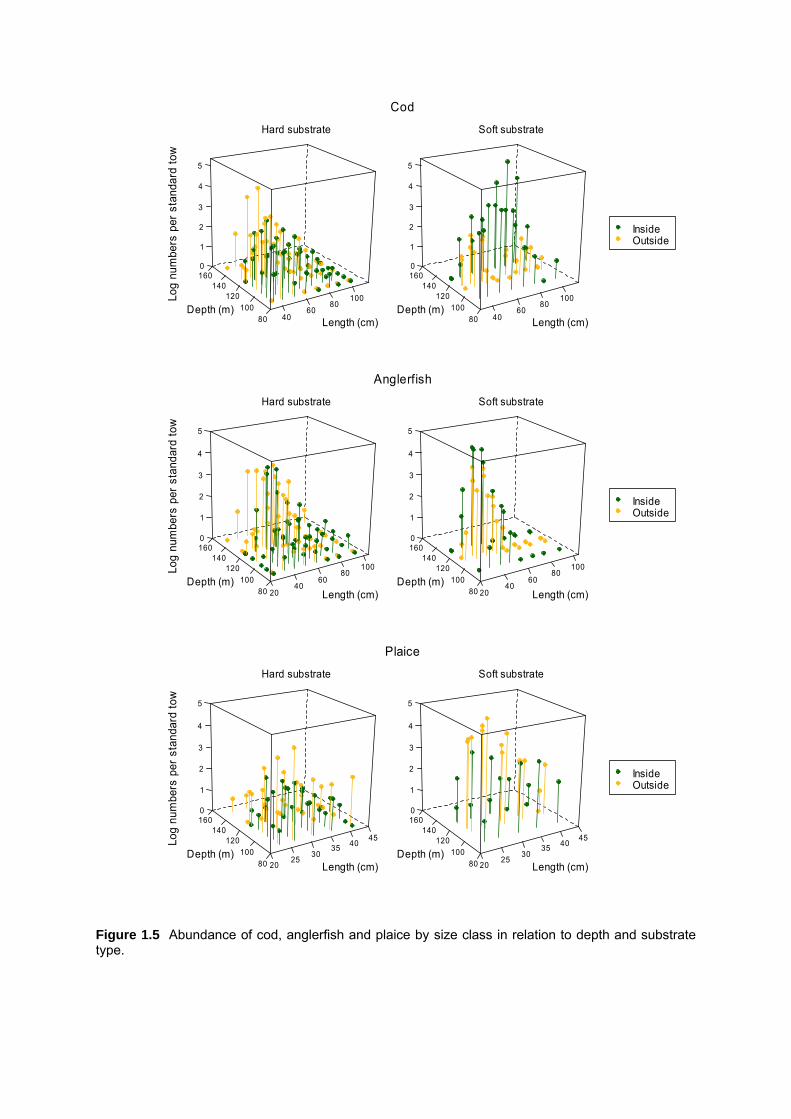
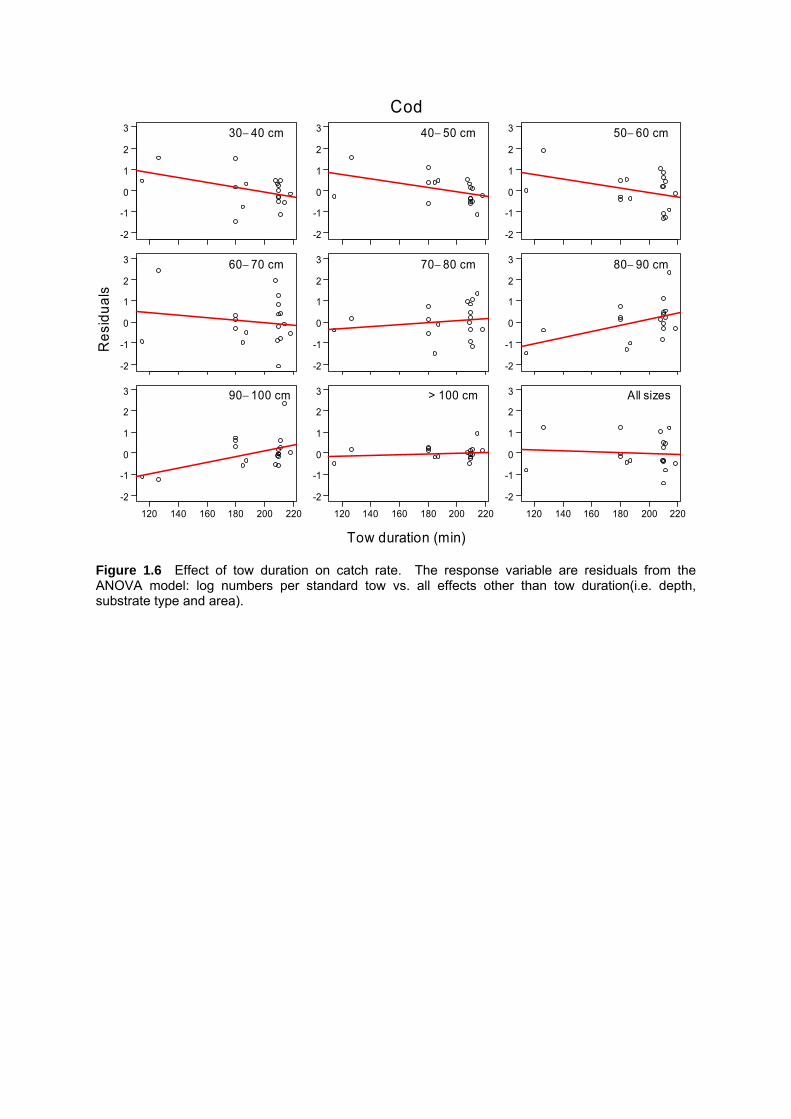
in the model only when the resulting parabola was concave downward, which suggested a unimodal species response along the gradient of depth. Otherwise, a linear relationship between depth and fish abundance was assumed. The effect of tow duration was also assumed to be linear. Substrate and area were fitted as categorical variables, with two levels each: hard and soft (substrate), and inside and outside (area). The response variable (fish numbers per standard tow) was logarithmically transformed before the analysis to achieve variance homogeneity (Gunderson, 1993). The model was deployed separately for each 10-cm (in cod, saithe and the two species of anglerfish) or 5-cm size class (haddock, whiting and flatfish). The observed cod abundance (i.e. with no other effects involved) was higher inside the closed area (Figures 1.2, 1.3, 1.4a). This was particularly evident for large size classes: cod > 60 cm were five times more abundant inside the closed area. Cod abundance depended greatly upon the substrate type; large cod were more abundant on the soft substrate whereas smaller cod tended to be more abundant on the hard substrate (Figure 1.5, upper panel). An opposite (and statistically significant) effect of tow duration on the catch rate of cod was observed for small and large size classes (about 30–50 cm and 80–100 cm, respectively): with increasing tow duration, the catch rate decreased in small cod whereas it increased in large cod (Figure 1.6). The abundance of large cod (> 50 cm) also tended to increase with depth. The difference in cod abundance between areas inside and outside, estimated from the ANOVA model with covariates, was even more pronounced than the observed difference (Figure 1.3). Despite the inclusion of covariates in the model for cod, the variation in abundance remained high which resulted in low significance of differences in abundance between inside and outside the closed area for most size classes (with p < 0.05 only in 70–80 cm size class, and p < 0.1 in 80–90 cm size class, but with p < 0.05 also for all size classes above 60 cm taken together). Some other stocks (larger size classes of whiting and of the two anglerfish species) showed similar tendencies as cod, but the observed differences for their single size classes were not significant. However, combined large classes of anglerfish (> 75 cm), although present in small numbers in the catch, were significantly more abundant (three times, p < 0.05) inside the closed area (Figures 1.2, 1.3, 1.4b). The abundance of anglerfish varied with depth, tending to increase (in anglerfish > 40 cm) with increasing depth (Figure 1.5, middle panel). In contrast to cod, smaller anglerfish were more abundant on the soft substrate whereas larger anglerfish tended to be more abundant on the hard substrate. The abundance of whiting was highly dependent on depth with highest densities observed at depths within the range 80–100 m. Larger whiting (> 40 cm) was found to be more abundant on the soft substrate (not shown). An opposite effect to that observed in cod and bigger whiting and anglerfish was found in smaller fish (< 40 cm, such as flatfish and small anglerfish; Figures 1.2, 1.3, 1.4c). Their abundance was lower inside the closed area (significantly in small and medium-sized plaice, and small anglerfish). Plaice abundance was highly dependent on substrate type and depth (Figure 1.5, lower panel). They were significantly more abundant on the soft substrate and tended to decrease in number with increasing depth. No apparent differences between inside and outside were found for haddock and saithe (Figures 1.2, 1.3). The observed abundances of haddock were nearly equal in the two areas across their size range. Saithe abundance was generally low and no clear differences were observed for this stock. The general pattern: more larger fish (> 40 cm) and fewer smaller fish (< 40 cm) inside the closed area could also be seen for the combined category “all fish”, formed by the nine species under study (Figures 1.2, 1.3).
7

West of Four – Effectiveness of Windsock Area Closure
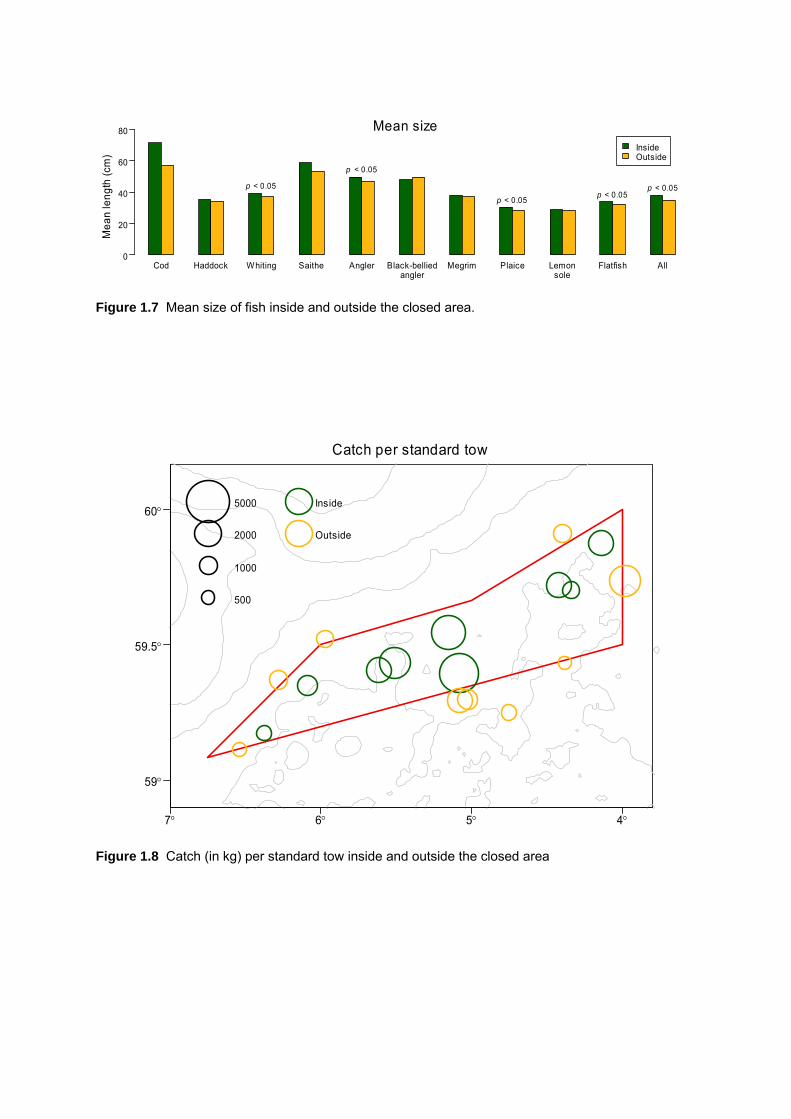
Mean Size Mean size for each species was calculated as a weighted mean length for all tows inside or outside the closure. An ANOVA model with covariates was applied separately for each species, and for two aggregated categories of flatfish and “all fish”, with no transformation of the response variable. The differences in mean size inside vs. outside the closure were consistent with the differences in abundance across fish sizes. Mean size was found to be larger inside the closed area for most of the main stocks (including cod, Figure 1.7). As with fish abundance, high variation in mean size was observed. The observed difference in mean size of cod between inside and outside was 14 cm, but it had low statistical significance (p = 0.07, with the model-estimated difference of 8 cm). Substrate type and, to a lesser extent, depth explained a considerable amount of variation in mean size, mainly for cod and anglerfish (not shown). Mean size of cod increased significantly with tow duration (not shown), which was consistent with the catch rate changing with increasing tow duration (decreasing catch rate for small cod and increasing catch rate for large cod). Catch Weight and Composition Mean catch weight per standard tow and proportion of each species in the catch were also modelled using an ANOVA model with covariates to account for other effects in addition to the area effect. Proportions were modelled using a logistic response model. The observed mean catch weight (per standard tow) was 78% higher inside than outside the closure (p < 0.05, Figure 1.8), which was consistent with the general pattern: more larger fish and fewer smaller fish inside than outside the closed area. Inside vs. outside differences in catch composition reflected the differences in fish abundance across species with a higher proportion of fish such as cod and whiting, and a smaller proportion of flatfish (particularly that of plaice) inside the closed area (Table 1.1).
DISCUSSION This project provides the first evidence of differences in some characteristics of the demersal fish populations in the Windsock area and around it. This evidence is based on data from just one survey and is thus a snapshot of the demersal fish community. It should be noted, however, that the number of hauls taken during this study was considerably higher than the numbers of hauls taken in the study area during single surveys conducted annually by FRS. Fish Abundance The main finding of this study is that large size classes of cod and anglerfish were more abundant and small fish (mainly small anglerfish and flatfish) less abundant inside the closed area. This may be explained by a higher predation pressure of larger fish on smaller fish inside the closed area. This suggestion would be consistent with the effects observed in the analysis of historical survey data for the Windsock area (see Part 2) and in similar studies of other closed areas e.g. in Iceland (Jaworski et al., 2006). Interestingly, the shift in response of fish, in terms of abundance, to area closures in the latter example was also found at 30–40 cm: large fish increased whereas small fish decreased in abundance after the area closure. In one area, these changes were reversed within seven years of its re-opening to fishing. All this evidence indicates some equlibrium between small and large fish in the ecosystem. This equilibrium may be disturbed by a substantial change in fishing effort (closure or re-opening).
8
West of Four – Effectiveness of Windsock Area Closure
In the present study, there were no apparent effects of the Windsock closure on abundance of haddock and saithe (in the historical analysis, there was a significant but relatively low effect on abundance of haddock). This may signify that these two species are less site-attached, making detection of any inside vs. outside differences more difficult. Mean Fish Size and Catch Weight Mean size of most species examined in the present study was larger inside the Windsock area. Also the mean catch weight per standard tow was markedly higher inside the closure. Although the statistical significance of all of these differences was generally low (primarily due to high variation in data), all these findings put together form a consistent picture of the fish community in the Windsock area and adjacent fishing grounds. Reference to Historical Analysis The results presented here generally agree with those obtained from the historical analysis of historical survey data (see Part 2). Fish size distributions for the areas inside and outside the Windsock in the post-closure period were very similar to those observed in the present study for most species. The historical analysis showed a positive effect of the closure on large size classes of anglerfish: they increased markedly in the Windsock, and the resulting difference between inside and outside was apparent in the present study. Although the historical analysis did not show significant effect of the closure on cod, the most recently observed trends there find support in the present study. Also skippers’ reports confirm high abundance of anglerfish and cod in “West of Four” in 2008. The observed positive effect on haddock from the historical analysis, although statistically significant, was rather low in magnitude, and therefore was not detected in the present analysis. The historical analysis showed a general decline in small fish in the study area. For a number of species, this decline was more pronounced in the Windsock, which could be attributed to the closure. This effect is substantiated by the present study, where markedly smaller numbers of small fish were found inside compared to outside. The skipper’s observation on large numbers of spotted dogfish in the Windsock during the survey charter (see Part 3) confirms the results of the historical analysis for this population. The historical analysis shows that also other elasmobranchs may have benefitted from the closure. Future Surveys As the historical analysis shows, any effects of the area closure may become evident only after several years following the closure. It is likely that any surveys in the study area in the future (annual FRS surveys or survey charters) may provide more evidence about the effectiveness of the Windsock closure. It should be noted that there is scope to improve the design of any future survey charters within the Windsock area and in adjacent waters to increase the power of the statistical tests. First of all, sampling stations should be distributed more evenly and those from outside the closed area should be located at a considerable distance from its boundaries to account for possible spill-over effects. Using the same type of gear in a series of survey charters would be preferred, e.g. the net used for the anglerfish survey (see Part 3). To
9

West of Four – Effectiveness of Windsock Area Closure
make sensible comparisons, any future survey charter should be conducted consistently during the same season as the present one (early spring). Side Effect of Closure – Static Gear It should also be noted that since the Windsock has been closed it has become a popular area for the deployment of static gear. There was a total of 18 landings of edible brown crab (Cancer pagurus) in March 2008 from five different vessels equating to a combined monthly landing of approximately 64 tonnes. During the trials (11th–19th March 2008) there were four landings by five vessels with a combined landing of approximately 25 tonnes. The above figures were extracted from official statistics. These statistics will include areas outwith the exclusion but due to trawling activity in the surrounding area and anecdotal evidence gathered by staff at the time of the survey, the overwhelming majority of the landings can be considered to be from within the closure. There is some concern among skippers that codling are a bycatch in the creel fishery. They suggest additional sampling in the creel areas in any future surveys (see Part 3).
CONCLUSIONS Part 1 of this report demonstrates that the closure of the Windsock area has had beneficial effects on large fish in the closed area (such as cod and large anglerfish). As the observed effects support the objectives of this closure, maintaining it may be considered as beneficial for the cod stock in the long term. The apparently adverse effect of the closure on flatfish inside the closure seems not to affect their populations at a wider spatial scale considering their present status in Area VI. Some modification of the closure (a change in shape and not necessarily an extension) may be re-considered alongside other measures of the recovery plan for cod. This might open the possibility for fishermen to take more haddock from the area. Re-opening of the Windsock area to fishing or a change of its status to a seasonal closure seems likely to reverse the beneficial effects observed so far. Any modification of the closure would require more thorough knowledge of the distribution of the commercial stocks in the closed area and around it, in relation to important environmental factors such as depth, temperature and habitat type, but also in relation to the spatial distribution of fishing effort. In addition, any future modification of the closure should also consider the effects on the local static gear fishery that has arisen in the area, as well as on the benthos which by the end of 2008 has experienced seven years with reduced or no demersal trawling.
10

West of Four – Effectiveness of Windsock Area Closure
PART 2 – ANALYSIS OF HISTORICAL SURVEY DATA (1990–2008)
INTRODUCTION For the purpose of this analysis, historical data on fish abundance collected during standard surveys conducted by FRS during the period 1990–March 2008 were retrieved from the Fisheries Management Database. To make comparisons of fish abundance inside and outside the Windsock area, a reference area surrounding the closed area was delineated (Figure 2.1). The survey data for the Windsock and adjacent waters were collected in two seasons, February–April (mainly during the West Coast Groundfish Survey) and October–December (exclusively during the Mackerel Recruit Survey). Sampling stations were located at depths of 80 to 212 m (mean 129 m). Tow duration varied widely from 10 to 61 minutes (mean 37 minutes). A GOV survey trawl with a mesh size of 20 mm in the codend was used throughout the whole study period. In total, 37 surveys took place and 228 valid hauls were made in the Windsock and reference area during the study period.
METHODS The analyses were conducted individually for the main demersal species (including demersal, benthopelagic and bathydemersal species according to the classification by Fish Base) and for the aggregate category of commercial demersal species, by size class and for all size classes combined. A two-way ANOVA model was used with two main factors: “area” and “period”. The numbers of fish (the response variable in the model) were log-transformed before analysis. Depth, tow duration, season and year (the latter as a nested factor in period) were included in the model as other explanatory variables (covariates) to reduce the magnitude of error variance. The factor “area” had two levels: inside and outside. The factor “period” had also two levels: before and after the closure. Although the Windsock area was first established in March 2001, it was only closed during two months (March and April) in 2001–2003. Its status was changed to a year-round closure from December 2003 onwards. This latter date was considered as the effective closure time for the purpose of the present analysis. The interaction between “area” and “period” in the ANOVA model was considered to result from the changes in the status of the Windsock area.
RESULTS
In total, about 1.25 million demersal fish were caught in the study area (inside and outside the Windsock) during the surveys in 1990–March 2008. Norway pout was by far the most abundant species (78% of the demersal fish catch, Figure 2.2). Haddock (9%) and whiting (3%) were most abundant among commercial demersal species. Twenty-eight demersal species were recorded with an average frequency of one or more fish per standard trawl of 30 minutes.
11
West of Four – Effectiveness of Windsock Area Closure
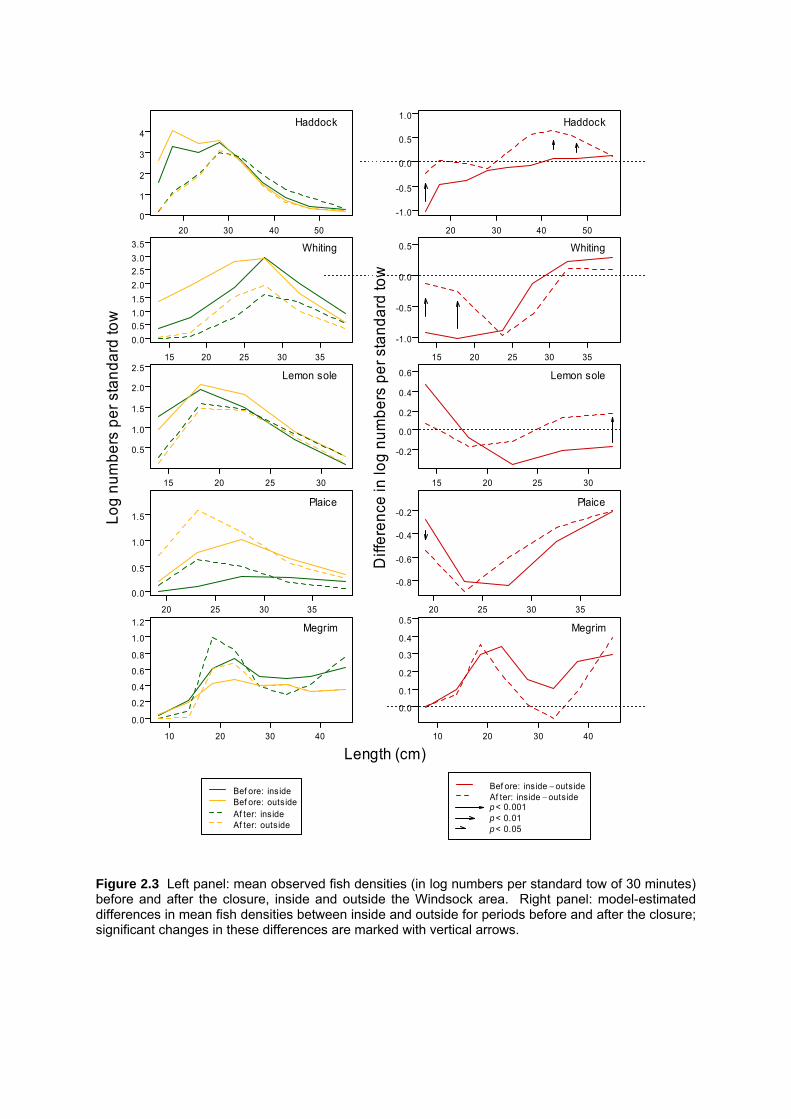
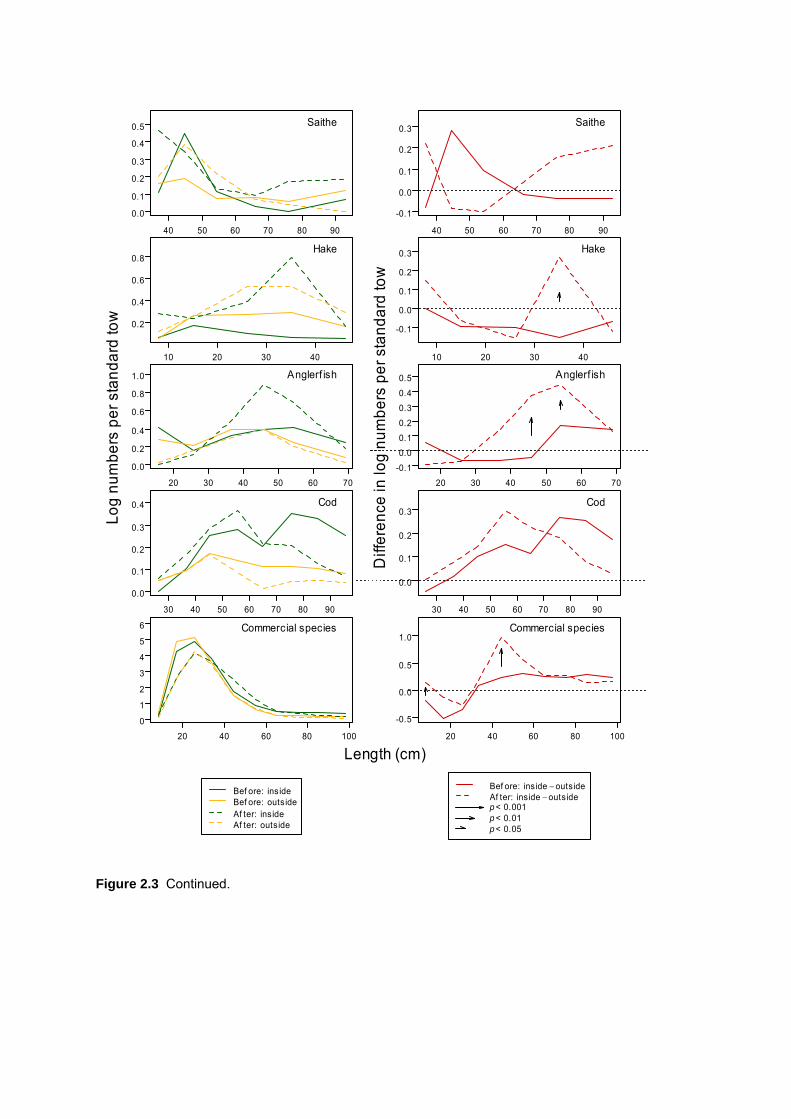
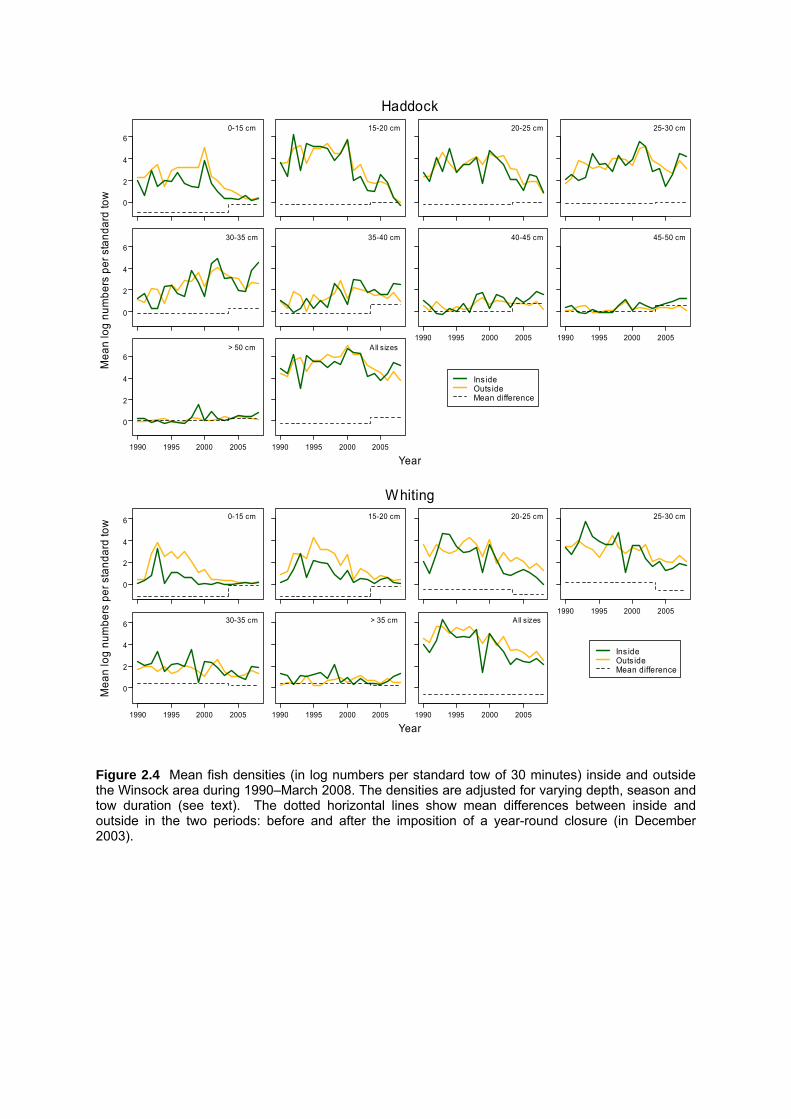
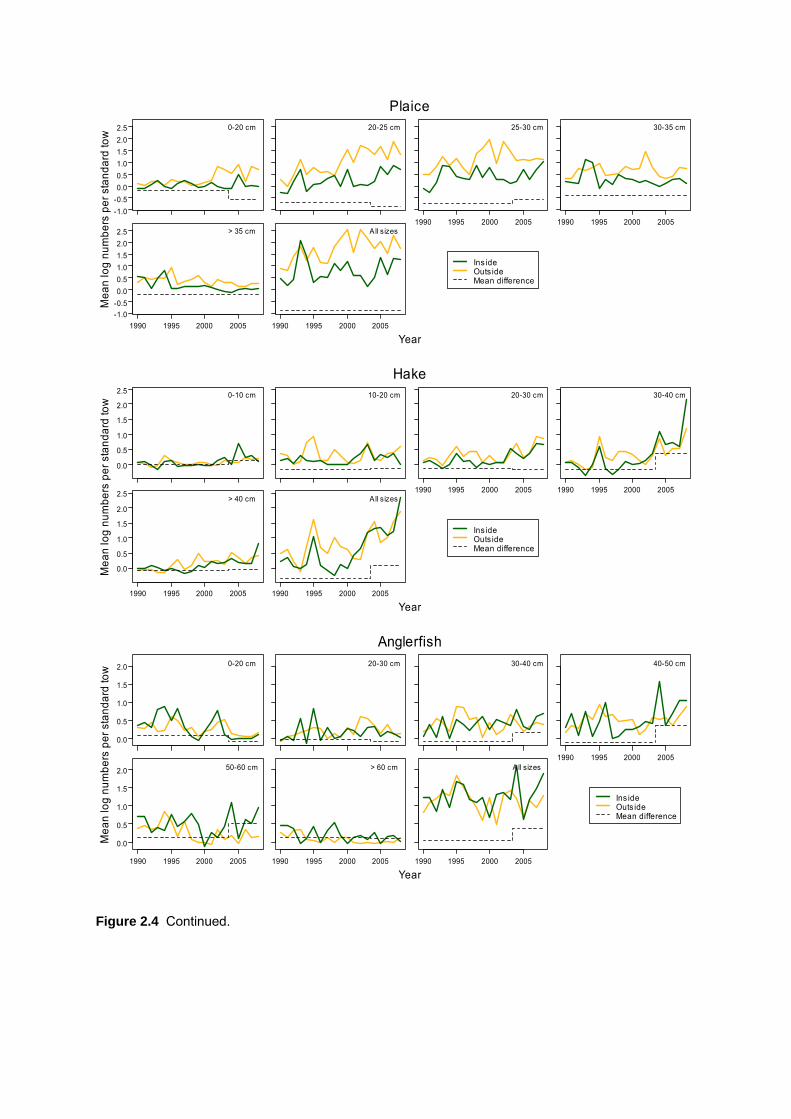
Numbers and size distributions of fish for individual species in the Windsock and reference area differed more or less before the closure reflecting the differences in environmental factors between the two areas (Figure 2.3, left panel). In the period after the closure, the numbers and size distributions changed, to various extent, as a result of changes in fish populations. In some cases, the difference in numbers between the two areas had a different pattern before and after the closure, which could be attributable to the closure, i.e. to the reduction in fishing effort inside the Windsock area (Figure 2.3, right panel). The results of the analysis are presented below in more detail for selected fish species and categories. Haddock Before the closure, small haddock (≤ 25 cm) were less abundant inside than outside the Windsock but after the closure, their numbers dropped to low and nearly equal levels in the two areas (Figure 2.3, left panel for haddock). Larger haddock (> 30 cm) were slightly more abundant inside than outside in the pre-closure period, but after the closure, their number inside was over two times greater than outside. As a result, the difference between inside and outside increased after the closure for most size classes (see the upward shift in Figure 2.3, right panel for haddock). This shows that the closure had, on the whole, a positive effect on the abundance of haddock. This positive trend for inside vs.outside can also be seen from the time series for the two areas (Figure 2.4 for haddock), particularly for the most recent years for large haddock. Whiting Small whiting responded similarly to small haddock: before the closure, small whiting (≤ 20 cm) were less abundant (12 times) inside than outside, and after the closure there was a general decline in the whole study area to very low levels, almost equal inside and outside the Windsock area (Figures 2.3 and 2.4 for whiting). No significant effect was observed for larger size classes of whiting. Flatfish The patterns of change in the difference between inside and outside were similar for lemon sole and plaice (Figure 2.3 for the respective species and Figure 2.4 for plaice) in that the closure tended to have a positive effect on their larger size classes (particularly in large lemon sole), and an adverse effect on their smaller size classes (particularly in plaice). This shift in response was found at 20 cm for lemon sole and at 25 cm for plaice. However, for most size classes of lemon sole and plaice, and for all sizes of megrim (Figures 2.3 and 2.4 for megrim), any apparent effects of the closure were not significant. Saithe and Hake No significant effects of the closure were found for saithe and hake (Figure 2.3 for the respective species) except for one size class of hake. At 30–40 cm, hake in the pre-closure period were, on average, almost eight times less abundant inside than outside, but after the closure, their number inside was slightly greater than outside (Figure 2.4 for hake). Anglerfish The closure appeared to have opposite effects on small and large anglerfish, although the effect on small anglerfish was not significant (Figures 2.3 and 2.4 for anglerfish). Before the closure, the numbers of anglerfish at the respective sizes were nearly equal in the two areas.
12

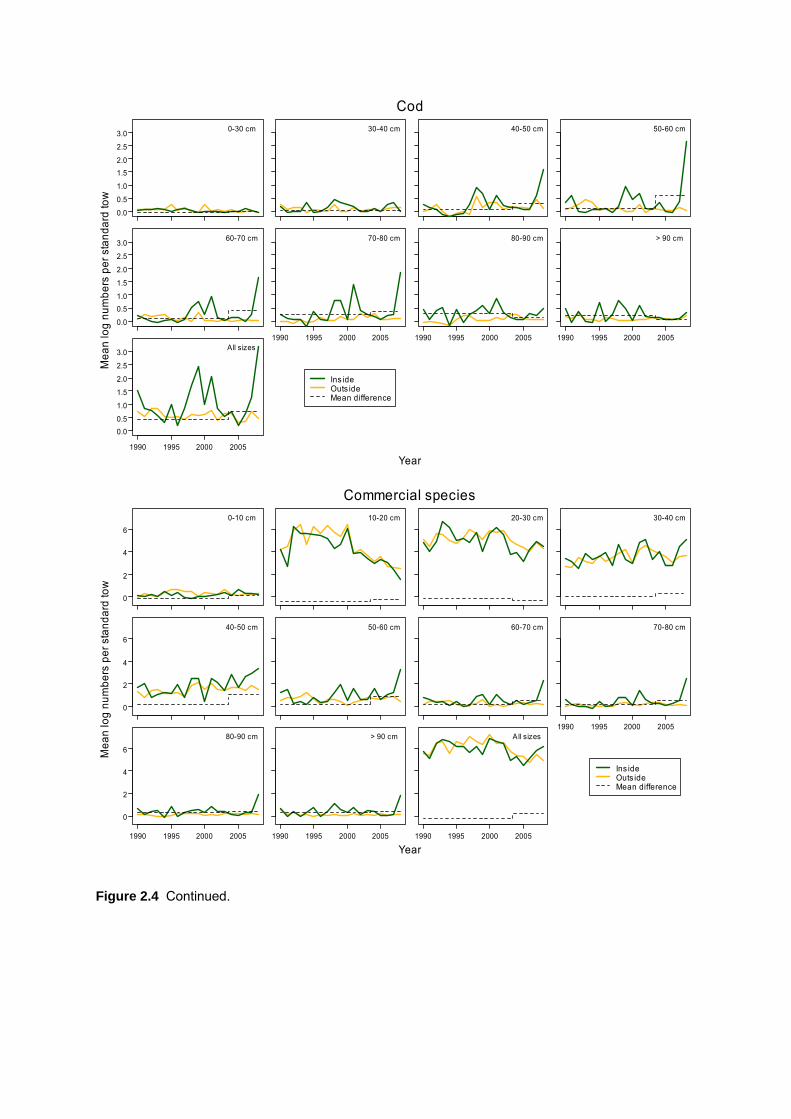
West of Four – Effectiveness of Windsock Area Closure
In the post-closure period, small anglerfish (≤ 30 cm) were nearly twice less abundant and larger anglerfish (> 30 cm) over three times more abundant inside the Windsock than outside. Cod Cod numbers were generally low in the study area (Figure 2.2). No significant effect of the closure was found for cod from the ANOVA model (Figure 2.3 for cod). However, the pre-closure pattern of their higher abundance inside compared to outside was mantained (or even enhanced for most sizes, though not significantly) after the closure. For large size classes (at about 40–80 cm) a marked increase inside the Windsock was observed for the most recent period (Figure 2.4 for cod), but this was mainly due to exceptionally large catches at single stations. Commercial Fish (aggregate category) The positive effect of the closure was apparent for the smallest and medium-sized fish (Figure 2.3 for commercial fish). In the smallest fish, this reflected mainly the observed effect on small haddock and whiting, while in medium-sized fish, mainly the observed effect on anglerfish. A marked increase in large size classes has been observed in recent years (Figure 2.4 for commercial fish), most of which has been generated by cod. Norway Pout and Poor Cod There was a general decline in abundance of Norway pout in the study area, but this decline was more pronounced inside the Windsock area (Figures 2.3 and 2.4 for Norway pout), particularly for larger Norway pout (> 14 cm). No significant effect of the closure was observed for poor cod, although in recent years, they have been declining sharply, similarly to Norway pout, inside the Windsock (Figures 2.3 and 2.4 for the respective species). Grey Gurnard and Lesser Argentine Grey gurnard and lesser argentine were the next most abundant non-commercial demersal species in the study area after Norway pout and poor cod. No significant effect of the closure was found for these two species (Figure 2.3 for the respective species). Lesser Spotted Dogfish The most pronounced effect of the Windsock closure was found for lesser spotted dogfish. Following the closure, nearly all size classes > 30 cm increased markedly in numbers inside the Windsock (Figures 2.3 and 2.4 for lesser spotted dogfish). Before the closure, dogfish were about 1.5 times more abundant outside the Windsock, whereas after the closure, they were four times more abundant inside the Windsock. Other Elasmobranchs Other elasmobranchs, such as spotted ray, spurdog, cuckoo ray (Leucoraja naevus) and blue skate (Dipturus batis), were all found in very small numbers in the study area (Figure 2.2). In general, there was an increase in their numbers following the closure both inside and outside the Windsock (not shown). The increase inside the Windsock tended to be higher than outside, but this difference was generally not significant. Only in large size classes of spurdog (50–70 cm), in all sizes classes of spurdog taken together, and in all size classes of elasmobranchs (other than lesser spotted dogfish) taken together, the difference between inside and outside increased significantly after the closure (not shown).
13
West of Four – Effectiveness of Windsock Area Closure
CONCLUSIONS The present study was an attempt to assess the impact of the Windsock closure on the demersal fish species. The available data included long time series (mainly for the pre-closure period) but showed a very high variability that in most cases could not sufficiently be accounted for with the applied method, and which made detection of any effects more difficult. The Windsock closure was found to have a positive impact on some commercial species such as haddock and larger anglerfish. Some commercial species, such as large cod and haddock, showed positive trends only in the most recent period. Cod numbers were extremely variable and the recently observed increase for this species needs to be considered cautiously. The most evident effect of the closure was found for a non-commercial species, lesser spotted dogfish, which increased markedly in the Windsock area following the closure. Other elasmobranchs, although much less abundant in the study area, responded to the closure similarly to lesser spotted dogfish. The closure appeared to have an adverse effect on small fish, particularly Norway pout and poor cod, but also on small size classes of other fish such as flatfish (particularly plaice and lemon sole) and anglerfish. Small haddock and whiting declined in the whole study area, but their decline was more pronounced outside the Windsock. It should to be noted that the examined post-closure period was relatively short (effectively just over four years) and recovery in most demersal fish species may be expected to take longer. A more conclusive assessment of the effectiveness of the Windsock closure would be possible with longer time series for the post-closure period, i.e. with more data to be collected over the next few years.
14

West of Four – Effectiveness of Windsock Area Closure
PART 3 – COMMENTS FROM INDUSTRY PARTNER
INTRODUCTION The skipper of the MFV Enterprise during the SISP survey (Douglas Ironside) returned a brief factual report of the SISP Survey as reproduced in Annex 1 (MFV Enterprise Report). The skippers own summary of the survey was:
“Windsock seems to be full with spotted dogs. The further west the better the size of fish. There is a spread of monk on all the tows we tried. Was disappointed to see so little cod. The back of Sule tows was the only cod we saw. Good mark of decent haddock both tows at North East Rona.”
Following on an early draft of this report, the SWFPA industry partner (including David Lovie, Douglas Ironside, Peter Lovie and Alan Addison) provided an industry perspective. An edited summary of these comments is as follows: Industry Perspective – Summary Future Surveys “We agree more surveys need to be done; maybe two each year, or more if possible. It is so important for Vla future fishing information”. Role of Windsock “We agree that the area of the Windsock closure plays a very important part in protecting cod, megrim and monkfish plus other species”. Haddock “Haddock at 72% of the total fish counted is a high percentage of the fish caught. It is sad that fishermen are deprived from catching them, particularly when the TAC entitlement is open for more haddock uptake. Can something be done to open up a haddock fishery just for a few months each year in part of the box?” Cod “Skippers report that cod west of four this year has been the best they have seen for a long time and to prove that five Real Time Closures (RTCs) were put in place, also suggesting that there is more codling to the west. WC skippers are not against RTCs and RTCs added to the Windsock closure should surely help the cod fishery plus other fisheries as well. Good hauls of codling have been caught west of four this year (2008) but with the low codling TAC it is just a matter of discard and move on. A simple answer is a bigger TAC which would reduce discards”. Closed areas “For as much as they do to protect cod in the North Sea, there is no annual closed areas in the North Sea. The Windsock covers over 80 miles which represents a good large fishing
15
West of Four – Effectiveness of Windsock Area Closure
area blocked off to fishing. This results in West Coast boats forced to fish in the North Sea and that is not their wish”. Anglerfish “On monkfish, D. Ironside reports a good spread of monkfish on all areas he has tried. West Coast skippers agree that yet again this year (2008) monk catches have been very good. The Vla allocation appears way out of line with the abundance of fish on the grounds”. Creel fishery “It is noted that creel boats blocked off three areas in the Windsock during the survey. It would have been interesting to have had a few more tows in the creel areas, something that if planned in advance could maybe be possible. It should be remembered that creelers catch codling”. Survey hauls “The area where Enterprise caught the two best hauls of codling was the favourite and first choice area to fished by the Kinlochbervie (KLB) 60 to 75 ft boats in past years. More so in the winter months for monk, codling, saithe, megrim, etc.” Impact of the closure “The closure of this area was the main reason for wiping out the biggest part of the KLB fleet. The very thought of making the closure bigger would end the whitefish fishing fleet completely. Effort in the 120m whitefish fleet is down 25 % this year (2008) already. The high price of fuel and more so in Highland ports can only cut effort also”. Fish abundance “It has been said that stocks are poor west, but when I look at your data 28,556 fish were counted on an 8 day trip in some poor weather – that is a fair bit of fish. What would the number of fish caught have been 10 years ago when 10 boats or more were working say 6 months of the year in the Windsock?” Elasmobranchs “Ask any skipper – “have you ever seen any quantity of whitefish along with spotted dogfish” and most fishermen would say “no”. They would all say you get them in areas that have not been fished for a while”. Cod “If records of boats fishing west were checked out, the percentage of cod they catch in relation to their total catch over the past five years would be less than 5% cod, or maybe with some boats less”. “For the biggest part of the year (2008) in the west, no codling can be recorded as the TAC allocation has been taken - so this means discarding and moving on. From the start of next year (2009) could a limit to land no more than 5 per cent cod be put in place to help reduce discards?”
16
West of Four – Effectiveness of Windsock Area Closure
Survey Design “Your survey was conducted in depths of 67 to 160m . Very little whitefish fishing is done in depths of less than 100m these days, with little or no effort there. The reason being that there is no whitefish there and that covers the West Coast and the biggest part of the North Sea also. Therefore, in the shallower waters some species will get a chance to grow”. “The skipper of the Enterprise mentioned that the week that the survey was being done good sized codling were being caught within 10 miles of the Windsock area”. “Nets: Maybe it would have been better if the net used for the monk survey had been used so that future Windsock surveys would all be done using the same net. An afterthought!”
17
West of Four – Effectiveness of Windsock Area Closure
ACKNOWLEDGEMENTS We thank the crew aboard MFV Enterprise for their assistance during sampling. We also acknowledge and thank the SWFPA for its support. FRS work was supported by the Scottish Government Marine Directorate. We thank Paul Fernandes and Bill Turrell for their comments on early versions of this report.
REFERENCES EC. 2001. Commission Regulation (EC) No 456/2001 of 6 March 2001 establishing
measures for the recovery of the stock of cod to the west of Scotland (ICES Division VIa) and associated conditions for the control of activities of fishing vessels. O.J. No. L 65, 7.3.2001, 13–16.
EC. 2003. Council Regulation (EC) No 2287/2003 fixing for 2004 the fishing opportunities
and associated conditions for certain fish stocks and groups of fish stocks, applicable in Community waters and, for Community vessels, in waters where catch limitations are required. O.J. No. L 344, 19.12.2003, 1–119.
Gunderson, D. R. 1993. Surveys of Fisheries Resources. John Wiley & Sons, Inc. New York.
249 pp. Jaworski, A., Solmundsson, J. and Ragnarsson, S.A. 2006. The effect of area closures on
the demersal fish community off the east coast of Iceland. ICES Journal of Marine Science 63: 897–911.
STECF. 2007. Commission Staff Working Document. 26th Plenary Meeting Report of the
Scientific, Technical and Economic Committee for Fisheries (PLEN-07-03). Plenary Meeting. 5–9 November, 2007, Ispra. Available at: https://stecf.jrc.ec.europa.eu/c/document_library/get_file?folderId=6879&name=DLFE-1203.pdf
18

West of Four – Effectiveness of Windsock Area Closure
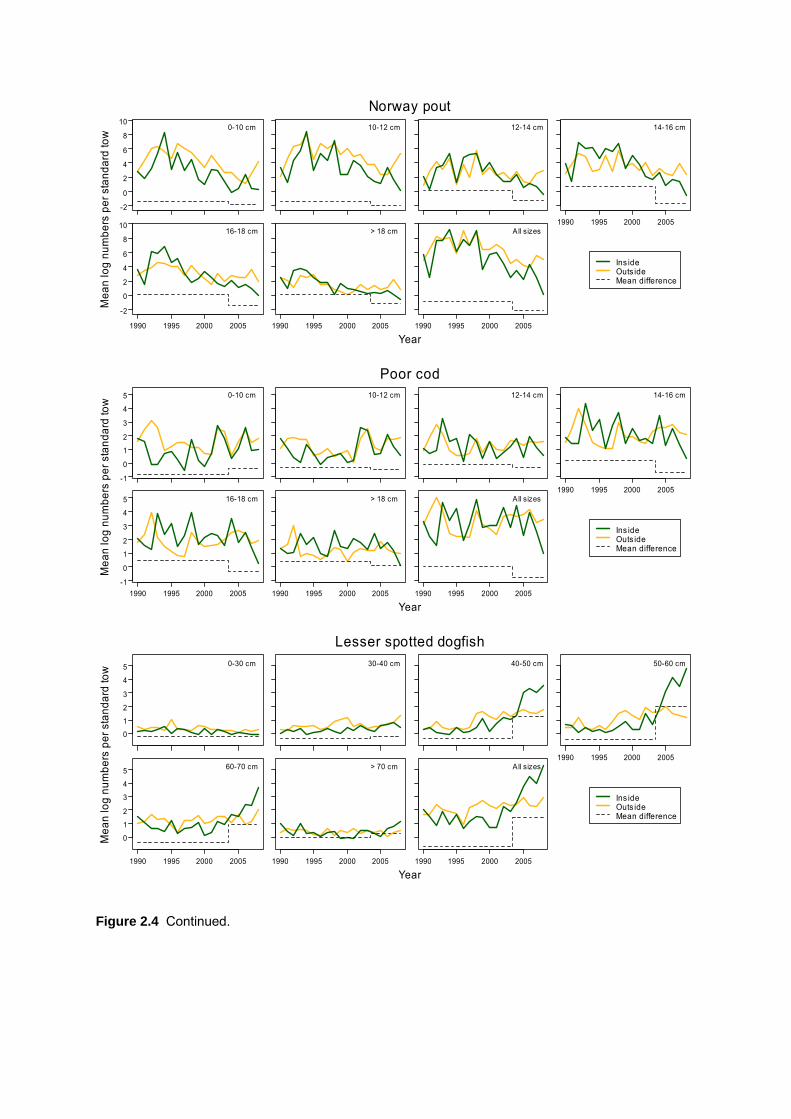
TABLE AND FIGURE LEGENDS Table 1.1 Summary of data collected during the survey. Figure 1.1 The Windsock closed area (red polygon) and location of survey sampling stations (as per legend). Figure 1.2 Mean log numbers (observed values by size class) of fish per standard tow (of three hours duration) inside and outside the closed area. Figure 1.3 Differences (observed and estimated from the model) in mean log numbers of fish per standard tow between inside and outside the closed area. 95% confidence intervals for the estimated differences are also shown. Figure 1.4a Distribution of cod by size class inside and outside the closed area. Numbers are given per standard tow. Figure 1.4b Distribution of anglerfish by size class inside and outside the closed area. Numbers are given per standard tow. Figure 1.4c Distribution of plaice by size class inside and outside the closed area. Numbers are given per standard tow. Figure 1.5 Abundance of cod, anglerfish and plaice by size class in relation to depth and substrate type. Figure 1.6 Effect of tow duration on catch rate. The response variable are residuals from the ANOVA model: log numbers per standard tow vs. all effects other than tow duration(i.e. depth, substrate type and area). Figure 1.7 Mean size of fish inside and outside the closed area. Figure 1.8 Catch (in kg) per standard tow inside and outside the closed area Figure 2.1 The Windsock area (red polygon, solid line), reference area (red polygon, dotted line) and location of sampling stations during the FRS surveys in 1990-March 2008. Figure 2.2 Main demersal fish species (on average > 1 fish per standard tow of 30 minutes) in the study area during 1990-March 2008. Commercial species are marked in bold. Figure 2.3 Left panel: mean observed fish densities (in log numbers per standard tow of 30 minutes) before and after the closure, inside and outside the Windsock area. Right panel: model-estimated differences in mean fish densities between inside and outside for periods before and after the closure; significant changes in these differences are marked with vertical arrows. Figure 2.4 Mean fish densities (in log numbers per standard tow of 30 minutes) inside and outside the Winsock area during 1990-March 2008. The densities are adjusted for varying depth, season and tow duration (see text). The dotted horizontal lines show mean differences between inside and outside in the two periods: before and after the imposition of a year-round closure (in December 2003).
19
West of Four – Effectiveness of Windsock Area Closure
20
TABLES AND FIGURES Table 1.1 Summary of data collected during the survey.
Catch proportiona Species Number of
fish counted Number of fish
measured Total Inside Outside
Cod 1 067 1 067 0.037 0.051 0.021 Haddock 20 569 9 982 0.720 0.736 0.702 Whiting 2 199 1 824 0.077 0.096 0.054 Saithe 216 216 0.008 0.003 0.012 Anglerfish 1 074 1 074 0.038 0.039 0.036 Black-bellied anglerfish 39 39 0.001 0.002 0.001 Megrim 1 683 1 683 0.059 0.039 0.082 Plaice 981 981 0.034 0.012 0.060 Lemon sole 728 728 0.025 0.021 0.031 Flatfishb 3 392 3 392 0.119 0.073 0.172 All 28 556 17 594 1.000 1.000 1.000 a Proportion of the total catch in numbers, including only the nine examined species. b Megrim, plaice and lemon sole.

8° 6° 4° 2°58°
59°
60°
61°
50
100
200
500
1000
1000
200 500
0 50 100 km
Inside - hard substrateInside - soft substarteOutside - hard substrateOutside - soft substarte
Figure 1.1 The Windsock closed area (red polygon) and location of survey sampling stations (as per legend).
40 50 60 70 80 90
0.0
0.5
1.0
1.5
2.0
2.5 Cod
30 40 50 60
0
1
2
3
4
5
6
7Haddock
30 35 40 45 50
0.0
0.5
1.0
1.5
2.0
2.5
3.0 Whiting
40 50 60 70 80 90
0.0
0.2
0.4
0.6
0.8Saithe
30 40 50 60 70 80 90
0.0
0.5
1.0
1.5
2.0
2.5
3.0 Anglerfish
30 40 50 60
0.0
0.1
0.2
0.3
0.4
0.5 Black-bellied anglerfish
25 30 35 40 45 50
0
1
2
3
Megrim
25 30 35 40
0.0
0.5
1.0
1.5
2.0
2.5
3.0 Plaice
15 20 25 30 35
0
1
2
3
Lemon sole
20 25 30 35 40 45 50
0
1
2
3
4Flatfish
20 40 60 80 100
0
2
4
6
All
Ins ideOuts ide
Length (cm)
Mea
n lo
g nu
mbe
rs p
er s
tand
ard
tow
Figure 1.2 Mean log numbers (observed values by size class) of fish per standard tow (of three hours duration) inside and outside the closed area.
-2
-1
0
1
2 Cod Haddock Whiting
-2
-1
0
1
2 Saithe Anglerfish Black-bellied anglerfish
-2
-1
0
1
2 Megrim Plaice
20 40 60 80 100
Lemon sole
-2
-1
0
1
2
20 40 60 80 100
Flatfish
20 40 60 80 100
All
Model-es tim atedObserved
95% conf. intervals
Length (cm)
Diff
eren
ce in
mea
n lo
g nu
mbe
rs p
er s
tand
ard
tow
Figure 1.3 Differences (observed and estimated from the model) in mean log numbers of fish per standard tow between inside and outside the closed area. 95% confidence intervals for the estimated differences are also shown.
59°
59.5°
60°
30−40 cm
---
---
40−50 cm 50−60 cm
59°
59.5°
60°
60−70 cm
-
----
70−80 cm
-
-
--
--
-
80−90 cm-
--
-
-
-
7° 6° 5° 4°
59°
59.5°
60°
90−100 cm-
- -
--
--
--
-
--
7° 6° 5° 4°
> 100 cm-
-
---
--
---
--
--
7° 6° 5° 4°
All sizes
300 30 1- 0
Ins ideOuts ide
Cod
Figure 1.4a Distribution of cod by size class inside and outside the closed area. Numbers are given per standard tow.
59°
59.5°
60°
20−30 cm-
- - --
---
---
-
--
30−40 cm-
40−50 cm
59°
59.5°
60°
50−60 cm 60−70 cm-
- ---
--70−80 cm
-- -
-
--
---
-
-
7° 6° 5° 4°
59°
59.5°
60°
80−90 cm
- - --
-
--
----
--
-
7° 6° 5° 4°
> 90 cm-
- --
--
--
----
--
-
7° 6° 5° 4°
All sizes
300 30 1- 0
Ins ideOuts ide
Anglerfish
Figure 1.4b Distribution of anglerfish by size class inside and outside the closed area. Numbers are given per standard tow.
59°
59.5°
60°
15−25 cm
--
25−30 cm
-
30−35 cm
--
-
7° 6° 5° 4°
59°
59.5°
60°
35−40 cm
--
-
--
-
7° 6° 5° 4°
> 40 cm
--
---
--
--
-
7° 6° 5° 4°
All sizes
- 300 30 1- 0
Ins ideOuts ide
Plaice
Figure 1.4c Distribution of plaice by size class inside and outside the closed area. Numbers are given per standard tow.
4060
80100
80100
120140
1600
1
2
3
4
5
Length (cm) Depth (m)
4060
80100
80100
120140
1600
1
2
3
4
5
Length (cm) Depth (m)
InsideOutside
Hard substrate Soft substrate
Cod
Log
num
bers
per
sta
ndar
d to
w
2040
6080
100
80100
120140
1600
1
2
3
4
5
Length (cm) Depth (m)
2040
6080
100
80100
120140
1600
1
2
3
4
5
Length (cm) Depth (m)
InsideOutside
Hard substrate Soft substrate
Anglerfish
Log
num
bers
per
sta
ndar
d to
w
20 2530
35 4045
80100
120140
1600
1
2
3
4
5
Length (cm) Depth (m)
20 2530
35 4045
80100
120140
1600
1
2
3
4
5
Length (cm) Depth (m)
InsideOutside
Hard substrate Soft substrate
Plaice
Log
num
bers
per
sta
ndar
d to
w
Figure 1.5 Abundance of cod, anglerfish and plaice by size class in relation to depth and substrate type.
-2
-1
0
1
2
3 30− 40 cm
-2
-1
0
1
2
3 40− 50 cm
-2
-1
0
1
2
3 50− 60 cm
-2
-1
0
1
2
3 60− 70 cm
-2
-1
0
1
2
3 70− 80 cm
-2
-1
0
1
2
3 80− 90 cm
120 140 160 180 200 220
-2
-1
0
1
2
3 90− 100 cm
120 140 160 180 200 220
-2
-1
0
1
2
3 > 100 cm
120 140 160 180 200 220
-2
-1
0
1
2
3 All sizes
Tow duration (min)
Res
idua
lsCod
Figure 1.6 Effect of tow duration on catch rate. The response variable are residuals from the ANOVA model: log numbers per standard tow vs. all effects other than tow duration(i.e. depth, substrate type and area).
Cod Haddock Whiting Saithe Angler Black-belliedangler
Megrim Plaice Lemonsole
Flatfish All
InsideOutside
Mean size
0
20
40
60
80
Mea
n le
ngth
(cm
)
p < 0.05
p < 0.05
p < 0.05 p < 0.05p < 0.05
Figure 1.7 Mean size of fish inside and outside the closed area.
7° 6° 5° 4°
59°
59.5°
60° 5000
2000
1000
500
Inside
Outside
Catch per standard tow
Figure 1.8 Catch (in kg) per standard tow inside and outside the closed area

8° 6° 4° 2°58°
59°
60°
61°
50
100
200
500
1000
1000
200 500
0 50 100 km
InsideOutside
Figure 2.1 The Windsock area (red polygon, solid line), reference area (red polygon, dotted line) and location of sampling stations during the FRS surveys in 1990–March 2008.
Mea
n nu
mbe
r per
sta
ndar
d to
w
0
100
200
300
400
3200
3300
Nor
way
pou
tH
addo
ckP
oor c
odW
hitin
g
Gre
y gu
rnar
d
Less
er a
rgen
tine
Lem
on s
ole
Less
er s
potte
d do
gfis
hD
ab
Red
gur
nard
Plai
ceLo
ng ro
ugh
dab
Meg
rim
Blu
e-m
outh
Saith
eTh
ickb
ack
sole
Hak
eA
ngle
rfish
Cod
Spo
tted
drag
onet
Dra
gone
tSp
otte
d ra
y
Nor
way
had
dock
John
dor
y
Sna
ke p
ipef
ish
Gre
ater
arg
entin
eSp
urdo
g
Witc
h
Oth
er
Tris
opte
rus
esm
arki
Mel
anog
ram
mus
aeg
lefin
us
Tris
opte
rus
min
utus
Mer
lang
ius
mer
lang
us
Eut
rigla
gur
nard
us
Arg
entin
a sp
hyra
ena
Mic
rost
omus
kitt
Scy
liorh
inus
can
icul
a
Lim
anda
lim
anda
Aspi
trigl
a cu
culu
s
Pleu
rone
ctes
pla
tess
a
Hip
pogl
osso
ides
pla
tess
oide
s
Lepi
dorh
ombu
s w
hiff
iago
nis
Hel
icol
enus
dac
tylo
pter
us
Polla
chiu
s vi
rens
Mic
roch
irus
varie
gatu
s
Mer
lucc
ius
mer
lucc
ius
Loph
ius
pisc
ator
ius
Gad
us m
orhu
a
Cal
liony
mus
mac
ulat
us
Cal
liony
mus
lyra
Raj
a m
onta
gui
Seb
aste
s vi
vipa
rus
Zeus
fabe
r
Ent
elur
us a
equo
reus
Arge
ntin
a si
lus
Squa
lus
acan
thia
s
Gly
ptoc
epha
lus
cyno
glos
sus
Figure 2.2 Main demersal fish species (on average > 1 fish per standard tow of 30 minutes) in the study area during 1990–March 2008. Commercial species are marked in bold.
20 30 40 500
1
2
3
4Haddock
20 30 40 50
-1.0
-0.5
0.0
0.5
1.0 Haddock
15 20 25 30 35
0.00.51.01.52.02.53.03.5 Whiting
15 20 25 30 35
-1.0
-0.5
0.0
0.5 Whiting
15 20 25 30
0.5
1.0
1.5
2.0
2.5Lemon sole
15 20 25 30
-0.2
0.0
0.2
0.4
0.6 Lemon sole
20 25 30 35
0.0
0.5
1.0
1.5Plaice
20 25 30 35
-0.8
-0.6
-0.4
-0.2Plaice
10 20 30 40
0.0
0.2
0.4
0.6
0.8
1.0
1.2 Megrim
10 20 30 40
0.0
0.1
0.2
0.3
0.4
0.5Megrim
Bef ore: insideBef ore: outsideAf ter: insideAf ter: outside
Bef ore: inside −outside Af ter: inside −outside p < 0.001 p < 0.01 p < 0.05
Length (cm)
Log
num
bers
per
sta
ndar
d to
w
Diff
eren
ce in
log
num
bers
per
sta
ndar
d to
w
Figure 2.3 Left panel: mean observed fish densities (in log numbers per standard tow of 30 minutes) before and after the closure, inside and outside the Windsock area. Right panel: model-estimated differences in mean fish densities between inside and outside for periods before and after the closure; significant changes in these differences are marked with vertical arrows.
40 50 60 70 80 90
0.0
0.1
0.2
0.3
0.4
0.5 Saithe
40 50 60 70 80 90
-0.1
0.0
0.1
0.2
0.3Saithe
10 20 30 40
0.2
0.4
0.6
0.8Hake
10 20 30 40
-0.1
0.0
0.1
0.2
0.3 Hake
20 30 40 50 60 70
0.0
0.2
0.4
0.6
0.8
1.0 Anglerf ish
20 30 40 50 60 70
-0.10.0
0.10.2
0.30.4
0.5 Anglerf ish
30 40 50 60 70 80 90
0.0
0.1
0.2
0.3
0.4 Cod
30 40 50 60 70 80 90
0.0
0.1
0.2
0.3Cod
20 40 60 80 100
0
1
2
3
4
5
6 Commercial species
20 40 60 80 100
-0.5
0.0
0.5
1.0Commercial species
Bef ore: insideBef ore: outsideAf ter: insideAf ter: outside
Bef ore: inside −outside Af ter: inside −outside p < 0.001 p < 0.01 p < 0.05
Length (cm)
Log
num
bers
per
sta
ndar
d to
w
Diff
eren
ce in
log
num
bers
per
sta
ndar
d to
w
Figure 2.3 Continued.

10 12 14 16 18
1
2
3
4
5Norw ay pout
10 12 14 16 18
-1.5
-1.0
-0.5
0.0
0.5 Norw ay pout
10 12 14 16 18 20
1.5
2.0
2.5Poor cod
10 12 14 16 18 20
-0.6
-0.4
-0.2
0.00.2
0.4 Poor cod
15 20 25 30 350
1
2
3Grey gurnard
15 20 25 30 35
-0.2
0.0
0.2
0.4
0.6
0.8 Grey gurnard
10 15 200.0
0.5
1.0
1.5
2.0
2.5
3.0 Lesser argentine
10 15 20
0.0
0.5
1.0Lesser argentine
30 40 50 60 70
0
1
2
3
4 Lesser spotted dogf ish
30 40 50 60 70
-0.5
0.0
0.5
1.0
1.5
2.0 Lesser spotted dogf ish
Bef ore: insideBef ore: outsideAf ter: insideAf ter: outside
Bef ore: inside −outside Af ter: inside −outside p < 0.001 p < 0.01 p < 0.05
Length (cm)
Log
num
bers
per
sta
ndar
d to
w
Diff
eren
ce in
log
num
bers
per
sta
ndar
d to
w
Figure 2.3 Continued.
0
2
4
60-15 cm 15-20 cm 20-25 cm 25-30 cm
0
2
4
630-35 cm 35-40 cm
1990 1995 2000 2005
40-45 cm
1990 1995 2000 2005
45-50 cm
1990 1995 2000 2005
0
2
4
6> 50 cm
1990 1995 2000 2005
All sizes
Ins ideOuts ideMean difference
Year
Mea
n lo
g nu
mbe
rs p
er s
tand
ard
tow
Haddock
0
2
4
6 0-15 cm 15-20 cm 20-25 cm
1990 1995 2000 2005
25-30 cm
1990 1995 2000 2005
0
2
4
6 30-35 cm
1990 1995 2000 2005
> 35 cm
1990 1995 2000 2005
All sizes
Ins ideOuts ideMean difference
Year
Mea
n lo
g nu
mbe
rs p
er s
tand
ard
tow
Whiting
Figure 2.4 Mean fish densities (in log numbers per standard tow of 30 minutes) inside and outside the Winsock area during 1990–March 2008. The densities are adjusted for varying depth, season and tow duration (see text). The dotted horizontal lines show mean differences between inside and outside in the two periods: before and after the imposition of a year-round closure (in December 2003).
-1.0-0.50.00.51.01.52.02.5 0-20 cm 20-25 cm
1990 1995 2000 2005
25-30 cm
1990 1995 2000 2005
30-35 cm
1990 1995 2000 2005-1.0-0.50.00.51.01.52.02.5 > 35 cm
1990 1995 2000 2005
All sizes
Ins ideOuts ideMean difference
Year
Mea
n lo
g nu
mbe
rs p
er s
tand
ard
tow
Plaice
0.0
0.5
1.0
1.5
2.0
2.5 0-10 cm 10-20 cm
1990 1995 2000 2005
20-30 cm
1990 1995 2000 2005
30-40 cm
1990 1995 2000 2005
0.0
0.5
1.0
1.5
2.0
2.5 > 40 cm
1990 1995 2000 2005
All sizes
Ins ideOuts ideMean difference
Year
Mea
n lo
g nu
mbe
rs p
er s
tand
ard
tow
Hake
0.0
0.5
1.0
1.5
2.0 0-20 cm 20-30 cm 30-40 cm
1990 1995 2000 2005
40-50 cm
1990 1995 2000 2005
0.0
0.5
1.0
1.5
2.0 50-60 cm
1990 1995 2000 2005
> 60 cm
1990 1995 2000 2005
All sizes
Ins ideOuts ideMean difference
Year
Mea
n lo
g nu
mbe
rs p
er s
tand
ard
tow
Anglerfish
Figure 2.4 Continued.
0.0
0.5
1.0
1.52.0
2.5
3.0 0-30 cm 30-40 cm 40-50 cm 50-60 cm
0.0
0.51.0
1.5
2.0
2.5
3.0 60-70 cm
1990 1995 2000 2005
70-80 cm
1990 1995 2000 2005
80-90 cm
1990 1995 2000 2005
> 90 cm
1990 1995 2000 2005
0.00.5
1.0
1.5
2.0
2.5
3.0 All sizes
Ins ideOuts ideMean difference
Year
Mea
n lo
g nu
mbe
rs p
er s
tand
ard
tow
Cod
0
2
4
60-10 cm 10-20 cm 20-30 cm 30-40 cm
0
2
4
640-50 cm 50-60 cm 60-70 cm
1990 1995 2000 2005
70-80 cm
1990 1995 2000 2005
0
2
4
6
80-90 cm
1990 1995 2000 2005
> 90 cm
1990 1995 2000 2005
All sizes
Ins ideOuts ideMean difference
Year
Mea
n lo
g nu
mbe
rs p
er s
tand
ard
tow
Commercial species
Figure 2.4 Continued.
-2
0
2
4
6
8
100-10 cm 10-12 cm 12-14 cm
1990 1995 2000 2005
14-16 cm
1990 1995 2000 2005
-2
0
2
4
6
8
1016-18 cm
1990 1995 2000 2005
> 18 cm
1990 1995 2000 2005
All sizes
Ins ideOuts ideMean difference
Year
Mea
n lo
g nu
mbe
rs p
er s
tand
ard
tow
Norway pout
-1
0
1
2
3
4
5 0-10 cm 10-12 cm 12-14 cm
1990 1995 2000 2005
14-16 cm
1990 1995 2000 2005-1
0
1
2
3
4
5 16-18 cm
1990 1995 2000 2005
> 18 cm
1990 1995 2000 2005
All sizes
Ins ideOuts ideMean difference
Year
Mea
n lo
g nu
mbe
rs p
er s
tand
ard
tow
Poor cod
0
1
2
3
4
5 0-30 cm 30-40 cm 40-50 cm
1990 1995 2000 2005
50-60 cm
1990 1995 2000 2005
0
1
2
3
4
5 60-70 cm
1990 1995 2000 2005
> 70 cm
1990 1995 2000 2005
All sizes
Ins ideOuts ideMean difference
Year
Mea
n lo
g nu
mbe
rs p
er s
tand
ard
tow
Lesser spotted dogfish
Figure 2.4 Continued.

Annex 1 – Report of the Skipper of the MFV Enterprise
Wind Sock Charter
Enterprise II BF1 11.03.08 (Douglas Ironside – Skipper Enterprise)
Tuesday 9am Fisheries Research at boat to install Scanmar equipment, fit 100 mm codends and extension. Sailed 6 pm Wednesday (12.03.08) 5.30 am Shot north west of sulesker for a double leg. This covered the west most point of the windsock. Tow time 3 hours. Bulk – 20 boxes. Mainly haddock and a lot of spotted dogs. “No cod. Monk NA”. Wednesday – 2nd Tow Area stky wks, east-north-east and east c-green. Tow time 3 hours. Bulk – 20 boxes. Mostly spotted dogs. 100 kgs monks. Knocked off for weather. North West 9. “Monk” Thursday (13.03.08) – Outside Windsock 5.30 am Forth Wk – south west Duration 3.5 hours Bulk – 20 boxes Fish type – mostly spotted dogs, mix monk and haddock. “Some monk” 2nd Tow Area – South west past chelarus gear Duration 3.5 hours Bulk – 20 boxes Fish type – mostly spotted dogs “No cod/monk” 3rd Tow Area – close south side Windsock (north west sulesker) Duration 3.5 hours Bulk – 20 boxes. Mostly haddock. Small unmarketable. “No cod, monk mentioned” Friday (14/03.08) – inside Windsock Inside wind sock – 5.30 am
i
iv
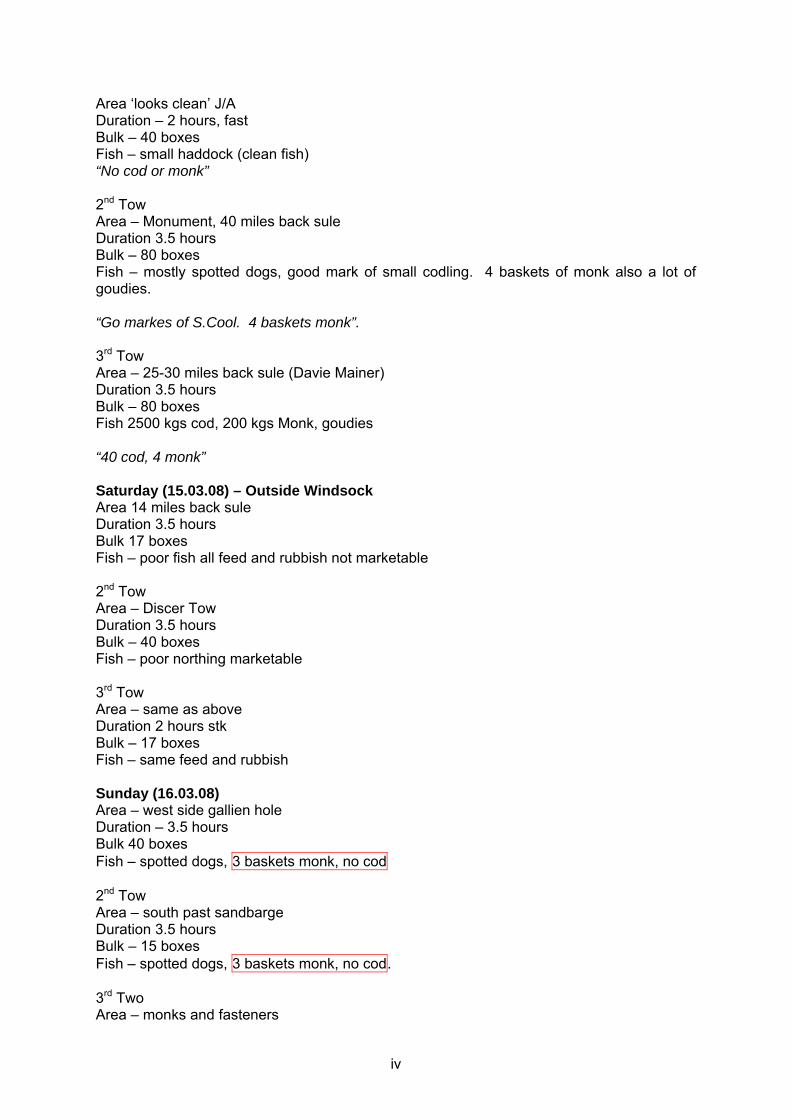
Area ‘looks clean’ J/A Duration – 2 hours, fast Bulk – 40 boxes Fish – small haddock (clean fish) “No cod or monk” 2nd Tow Area – Monument, 40 miles back sule Duration 3.5 hours Bulk – 80 boxes Fish – mostly spotted dogs, good mark of small codling. 4 baskets of monk also a lot of goudies. “Go markes of S.Cool. 4 baskets monk”. 3rd Tow Area – 25-30 miles back sule (Davie Mainer) Duration 3.5 hours Bulk – 80 boxes Fish 2500 kgs cod, 200 kgs Monk, goudies “40 cod, 4 monk” Saturday (15.03.08) – Outside Windsock Area 14 miles back sule Duration 3.5 hours Bulk 17 boxes Fish – poor fish all feed and rubbish not marketable 2nd Tow Area – Discer Tow Duration 3.5 hours Bulk – 40 boxes Fish – poor northing marketable 3rd Tow Area – same as above Duration 2 hours stk Bulk – 17 boxes Fish – same feed and rubbish Sunday (16.03.08) Area – west side gallien hole Duration – 3.5 hours Bulk 40 boxes Fish – spotted dogs, 3 baskets monk, no cod 2nd Tow Area – south past sandbarge Duration 3.5 hours Bulk – 15 boxes Fish – spotted dogs, 3 baskets monk, no cod. 3rd Two Area – monks and fasteners
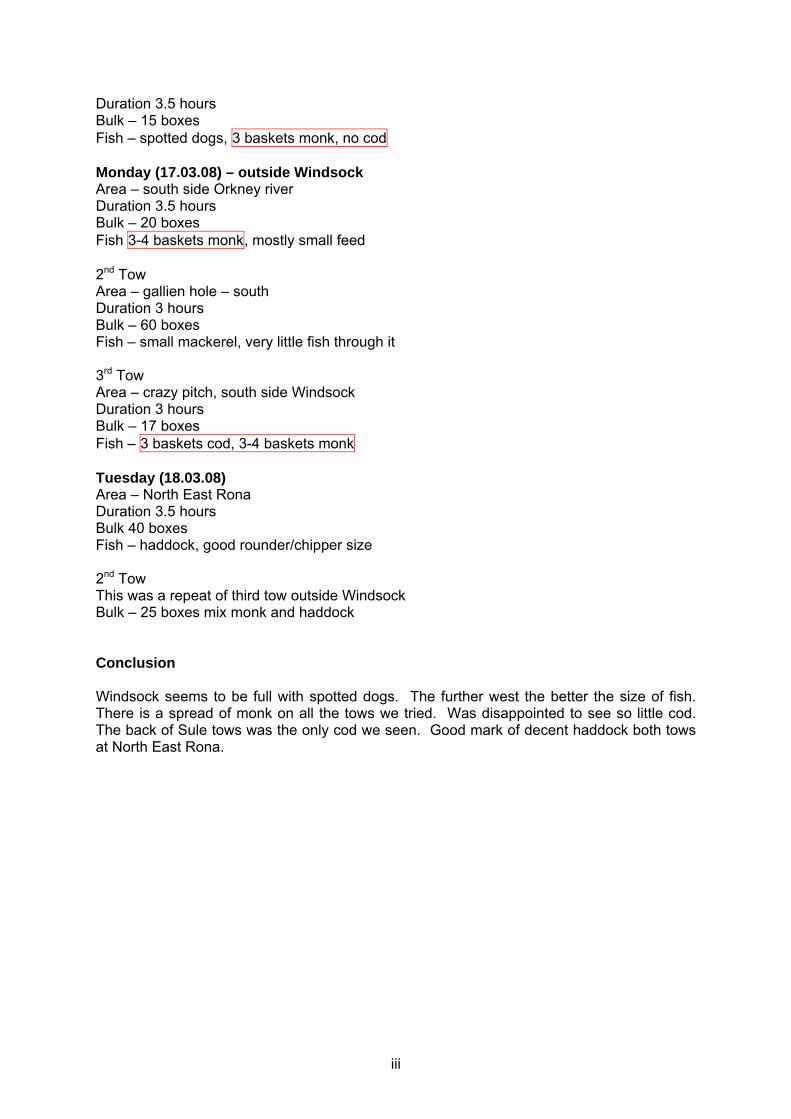
Duration 3.5 hours Bulk – 15 boxes Fish – spotted dogs, 3 baskets monk, no cod Monday (17.03.08) – outside Windsock Area – south side Orkney river Duration 3.5 hours Bulk – 20 boxes Fish 3-4 baskets monk, mostly small feed 2nd Tow Area – gallien hole – south Duration 3 hours Bulk – 60 boxes Fish – small mackerel, very little fish through it 3rd Tow Area – crazy pitch, south side Windsock Duration 3 hours Bulk – 17 boxes Fish – 3 baskets cod, 3-4 baskets monk Tuesday (18.03.08) Area – North East Rona Duration 3.5 hours Bulk 40 boxes Fish – haddock, good rounder/chipper size 2nd Tow This was a repeat of third tow outside Windsock Bulk – 25 boxes mix monk and haddock Conclusion Windsock seems to be full with spotted dogs. The further west the better the size of fish. There is a spread of monk on all the tows we tried. Was disappointed to see so little cod. The back of Sule tows was the only cod we seen. Good mark of decent haddock both tows at North East Rona.
iii
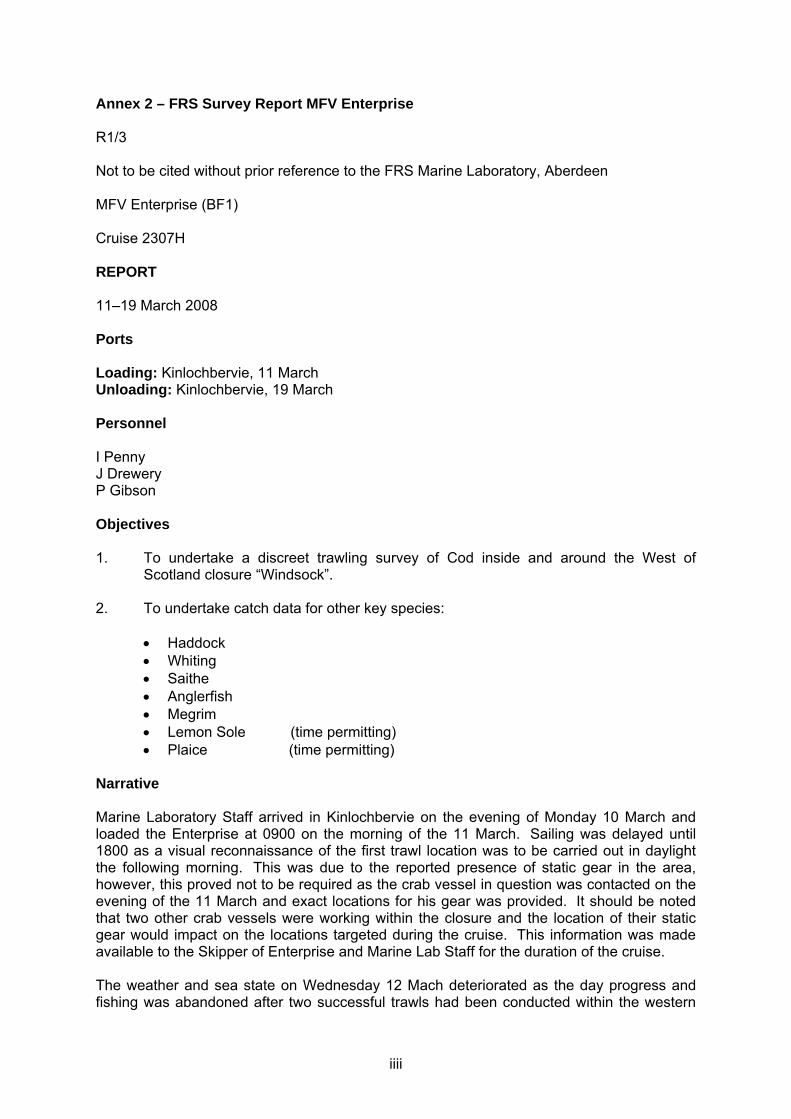
Annex 2 – FRS Survey Report MFV Enterprise R1/3 Not to be cited without prior reference to the FRS Marine Laboratory, Aberdeen MFV Enterprise (BF1) Cruise 2307H REPORT 11–19 March 2008 Ports Loading: Kinlochbervie, 11 March Unloading: Kinlochbervie, 19 March Personnel I Penny J Drewery P Gibson Objectives 1. To undertake a discreet trawling survey of Cod inside and around the West of
Scotland closure “Windsock”. 2. To undertake catch data for other key species:
• Haddock • Whiting • Saithe • Anglerfish • Megrim • Lemon Sole (time permitting) • Plaice (time permitting)
Narrative Marine Laboratory Staff arrived in Kinlochbervie on the evening of Monday 10 March and loaded the Enterprise at 0900 on the morning of the 11 March. Sailing was delayed until 1800 as a visual reconnaissance of the first trawl location was to be carried out in daylight the following morning. This was due to the reported presence of static gear in the area, however, this proved not to be required as the crab vessel in question was contacted on the evening of the 11 March and exact locations for his gear was provided. It should be noted that two other crab vessels were working within the closure and the location of their static gear would impact on the locations targeted during the cruise. This information was made available to the Skipper of Enterprise and Marine Lab Staff for the duration of the cruise. The weather and sea state on Wednesday 12 Mach deteriorated as the day progress and fishing was abandoned after two successful trawls had been conducted within the western
iiii
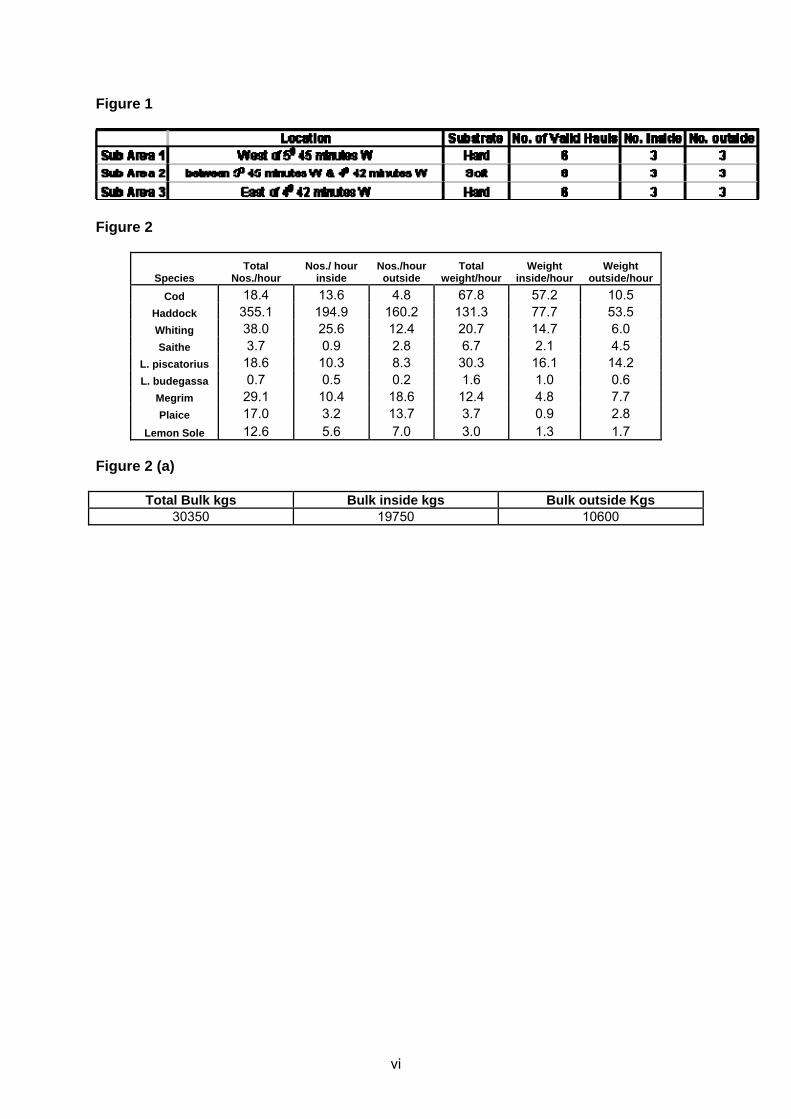
side of the closure, commencing at 0500 the following day. The second haul of the day was declared invalid due to problems on shooting causing the vessel to stray inside the closure during the trawl, the intention being to take the sample from outside the closure. The survey proceeded unhindered for the remainder of the survey managing to complete the program and recover the trawls lost earlier in the cruise. The Enterprise docked in Kinlochbervie at 0230 19 March, with staff returning to the Marine Lab at 0830 the same day. It was decided to conduct historical trawls from diary information from within the closure and close outside on locations similar in substrate and depth. As the “windsock” closure is such a large area a general plan was laid out based on sub areas of hard and soft ground. It should be noted that large areas were not covered due to static gear concentrations and time constraints. The trawl locations from out with the closure were to form a real time comparison with the samples from within the closure and with this in mind were made as similar as practicable. Results Enterprise completed 19 trawls of 3 – 3 and a half hours duration 18 of these being valid, with 480 Cod otoliths collected. A haul summary can be seen in Figure 1 giving information on the three sub areas and completed hauls. Figure 2 shows basic results for the cruise and the species sampled. A plot of the trawl tracks Figure 3 is available and shows static gear locations as well as indicating substrate type. In addition to the data collected on the survey, diary information has been collected from 5 vessels totalling 31 years collectively. I Penny 24 April 2008
v
vi
Figure 1
Figure 2
Species Total
Nos./hour Nos./ hour
inside Nos./hour outside
Total weight/hour
Weight inside/hour
Weight outside/hour
Cod 18.4 13.6 4.8 67.8 57.2 10.5 Haddock 355.1 194.9 160.2 131.3 77.7 53.5 Whiting 38.0 25.6 12.4 20.7 14.7 6.0 Saithe 3.7 0.9 2.8 6.7 2.1 4.5
L. piscatorius 18.6 10.3 8.3 30.3 16.1 14.2 L. budegassa 0.7 0.5 0.2 1.6 1.0 0.6
Megrim 29.1 10.4 18.6 12.4 4.8 7.7 Plaice 17.0 3.2 13.7 3.7 0.9 2.8
Lemon Sole 12.6 5.6 7.0 3.0 1.3 1.7 Figure 2 (a)
Total Bulk kgs Bulk inside kgs Bulk outside Kgs 30350 19750 10600
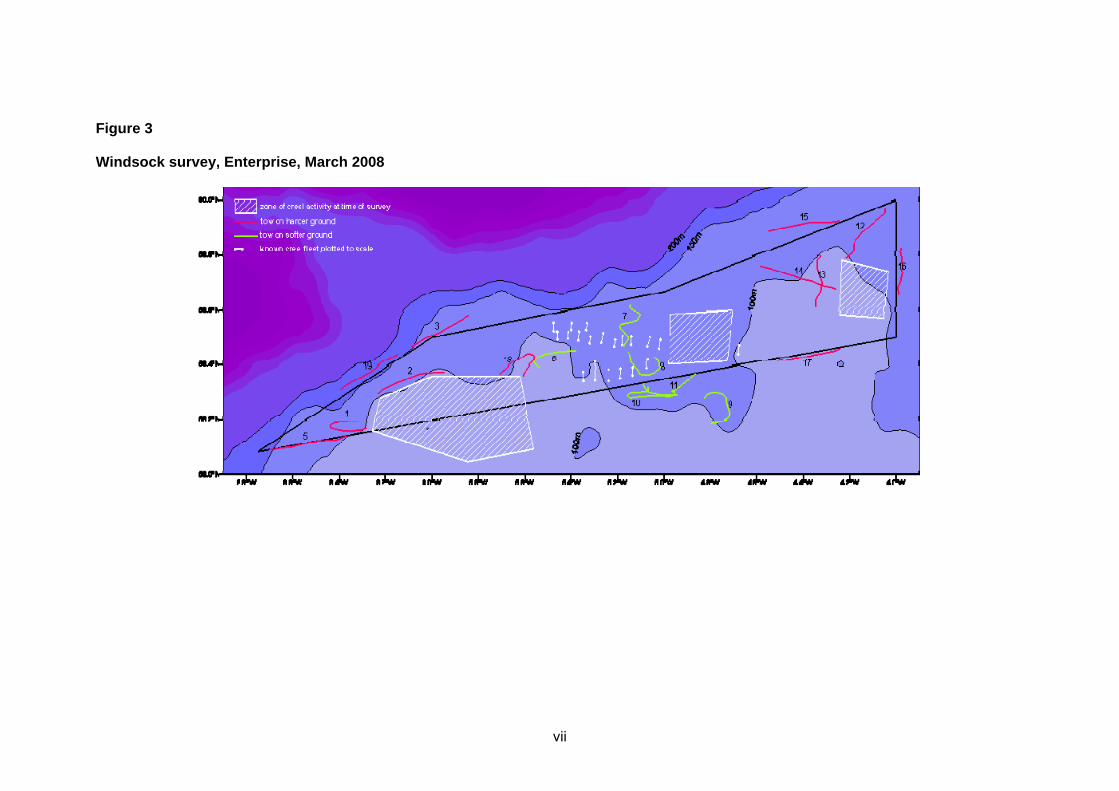
Figure 3 Windsock survey, Enterprise, March 2008
vii
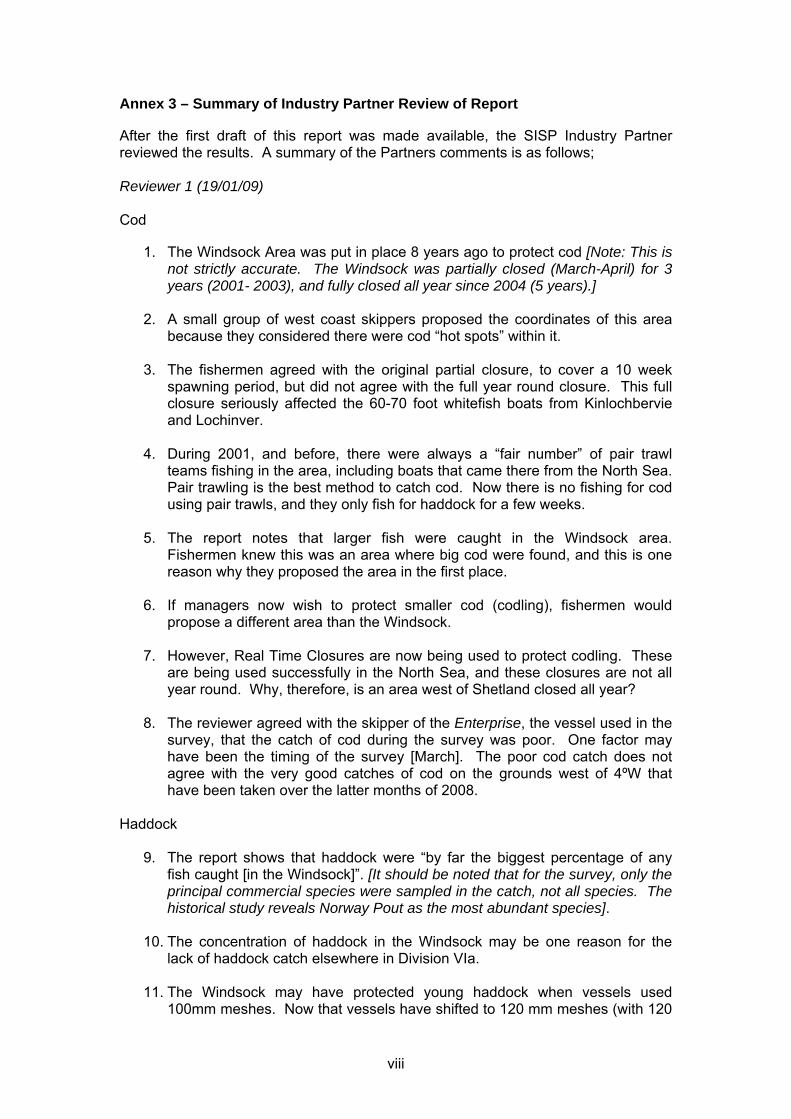
Annex 3 – Summary of Industry Partner Review of Report After the first draft of this report was made available, the SISP Industry Partner reviewed the results. A summary of the Partners comments is as follows; Reviewer 1 (19/01/09) Cod
1. The Windsock Area was put in place 8 years ago to protect cod [Note: This is not strictly accurate. The Windsock was partially closed (March-April) for 3 years (2001- 2003), and fully closed all year since 2004 (5 years).]
2. A small group of west coast skippers proposed the coordinates of this area
because they considered there were cod “hot spots” within it.
3. The fishermen agreed with the original partial closure, to cover a 10 week spawning period, but did not agree with the full year round closure. This full closure seriously affected the 60-70 foot whitefish boats from Kinlochbervie and Lochinver.
4. During 2001, and before, there were always a “fair number” of pair trawl
teams fishing in the area, including boats that came there from the North Sea. Pair trawling is the best method to catch cod. Now there is no fishing for cod using pair trawls, and they only fish for haddock for a few weeks.
5. The report notes that larger fish were caught in the Windsock area.
Fishermen knew this was an area where big cod were found, and this is one reason why they proposed the area in the first place.
6. If managers now wish to protect smaller cod (codling), fishermen would
propose a different area than the Windsock.
7. However, Real Time Closures are now being used to protect codling. These are being used successfully in the North Sea, and these closures are not all year round. Why, therefore, is an area west of Shetland closed all year?
8. The reviewer agreed with the skipper of the Enterprise, the vessel used in the
survey, that the catch of cod during the survey was poor. One factor may have been the timing of the survey [March]. The poor cod catch does not agree with the very good catches of cod on the grounds west of 4ºW that have been taken over the latter months of 2008.
Haddock
9. The report shows that haddock were “by far the biggest percentage of any fish caught [in the Windsock]”. [It should be noted that for the survey, only the principal commercial species were sampled in the catch, not all species. The historical study reveals Norway Pout as the most abundant species].
10. The concentration of haddock in the Windsock may be one reason for the
lack of haddock catch elsewhere in Division VIa.
11. The Windsock may have protected young haddock when vessels used 100mm meshes. Now that vessels have shifted to 120 mm meshes (with 120
viii
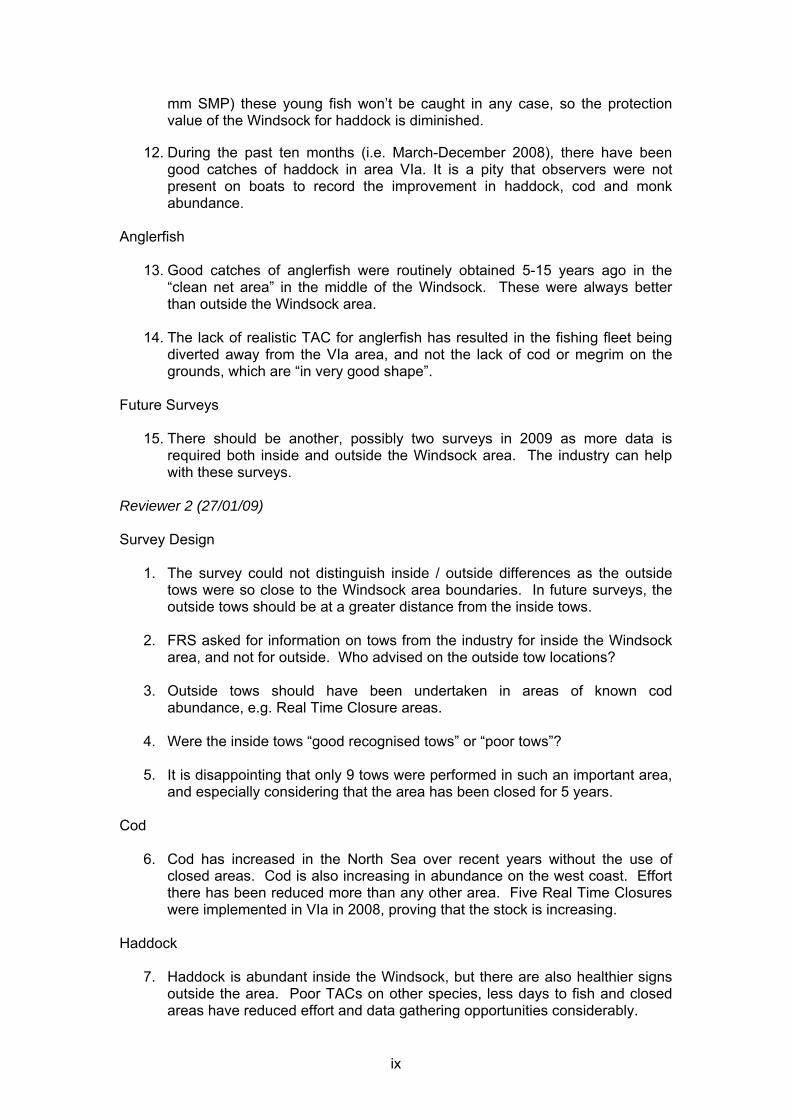
mm SMP) these young fish won’t be caught in any case, so the protection value of the Windsock for haddock is diminished.
12. During the past ten months (i.e. March-December 2008), there have been
good catches of haddock in area VIa. It is a pity that observers were not present on boats to record the improvement in haddock, cod and monk abundance.
Anglerfish
13. Good catches of anglerfish were routinely obtained 5-15 years ago in the “clean net area” in the middle of the Windsock. These were always better than outside the Windsock area.
14. The lack of realistic TAC for anglerfish has resulted in the fishing fleet being
diverted away from the VIa area, and not the lack of cod or megrim on the grounds, which are “in very good shape”.
Future Surveys
15. There should be another, possibly two surveys in 2009 as more data is required both inside and outside the Windsock area. The industry can help with these surveys.
Reviewer 2 (27/01/09) Survey Design
1. The survey could not distinguish inside / outside differences as the outside tows were so close to the Windsock area boundaries. In future surveys, the outside tows should be at a greater distance from the inside tows.
2. FRS asked for information on tows from the industry for inside the Windsock
area, and not for outside. Who advised on the outside tow locations?
3. Outside tows should have been undertaken in areas of known cod abundance, e.g. Real Time Closure areas.
4. Were the inside tows “good recognised tows” or “poor tows”?
5. It is disappointing that only 9 tows were performed in such an important area,
and especially considering that the area has been closed for 5 years. Cod
6. Cod has increased in the North Sea over recent years without the use of closed areas. Cod is also increasing in abundance on the west coast. Effort there has been reduced more than any other area. Five Real Time Closures were implemented in VIa in 2008, proving that the stock is increasing.
Haddock
7. Haddock is abundant inside the Windsock, but there are also healthier signs
outside the area. Poor TACs on other species, less days to fish and closed areas have reduced effort and data gathering opportunities considerably.
ix

x
Anglerfish
8. A four-year industry / science study using voluntary log books, diaries and observer trips indicates that the abundance of VIa anglerfish are healtheir than the low TAC reflects.
Future Surveys
9. The industry needs more surveys / charters to give an accurate stock estimate.