scottish natural heritage commissioned report · pdf filescottish natural heritage...
TRANSCRIPT

Scottish Natural Heritage
Commissioned Report 322Assessments of grazing and trampling impacts on uplandhabitats in the Cairngorms Core Area1995-2000

C O M M I S S I O N E D R E P O R T
Commissioned Report No. 322
Assessments of grazing and trampling impacts on upland habitats in the Cairngorms Core Area
1995-2000 (ROAME No. RASD/091A/97/CNG)
For further information on this report please contact:
David Horsfield Scottish Natural Heritage Silvan House 231 Corstorphine Road Edinburgh EH12 7AT Telephone: 0131 316 2613 E-mail: [email protected]
This report should be quoted as:
Horsfield, D. (2009). Assessments of grazing and trampling impacts on upland habitats in the Cairngorms Core Area 1995-2000. Scottish Natural Heritage Commissioned Report No. 322 (ROAME No. RASD/091A/97/CNG).
This report, or any part of it, should not be reproduced without the permission of Scottish Natural Heritage. This permission will not be withheld unreasonably. The views expressed by the author(s) of this report should not be taken as the views and policies of Scottish Natural Heritage.
© Scottish Natural Heritage 2009.

Assessments of grazing and trampling impacts on upland habitats in the Cairngorms Core Area 1995-2000 Commissioned Report No. 322 (ROAME No. RASD/091A/97/CNG) Contractor: Scottish Natural Heritage Year of publication: 2009 Author: David Horsfield
Background A survey of grazing, browsing and trampling impacts of large herbivores in the Cairngorms was carried out between 1995 and 2000 to assist the Cairngorms Partnership and Scottish Natural Heritage develop a management strategy for moorland and montane habitats.
Impacts on moorland and montane habitats in the Cairngorms Core Area were assessed in each 0.25 km square of the O.S. grid. The habitats assessed were dwarf-shrub heath, wind-clipped summit heath, blanket bog and grassland. The impact levels scored were light, moderate and heavy, which with mixed categories gave six classes in total. The objective of the assessments was to identify areas where habitats were impacted at levels likely to result in damage, deterioration or loss of the habitat. The survey also provided information on the causes of the impacts. Data were also gathered on the presence of large herbivores and tree and scrub regeneration.
Main findings Grazing or browsing and trampling impacts were assessed within 3903 0.25 km squares
of which almost 74% were given overall impact scores of light or light to moderate, with 15% moderate or light to heavy, while about 11% were assessed as moderate to heavy or heavy impacts where damage to habitats is likely.
Tree and scrub regeneration was recorded from 33% of survey squares but browsing on saplings was noted in almost 80% of these squares.
Deer (mainly red deer) were recorded from 88% of the survey squares. Sheep were recorded from 12% of survey squares while cattle were recorded only from
0.9% of squares. Grazing or browsing and trampling impacts were attributable to both red deer and sheep. Generally, heavy grazing and trampling impacts, where the habitats were likely to suffer
damage and deterioration, were localised. The main concentrations of moderate to heavy and heavy impacts were on the vegetation
of the base-rich Moinian and Dalradian rocks surrounding the acid granite core in Upper Deeside, Geldie Burn, Glen Quoich, Gleann an t-Slugain, Glen Feshie, Pityoulish, Dorback Burn-Braes of Abernethy, Inchrory, Craig Leek and Glen Clunie.
For further information on this project contact:David Horsfield, Scottish Natural Heritage, Silvan House, 231 Corstorphine Road, Edinburgh, EH12 7AT.
Tel: 0131–316 2613For further information on the SNH Research & Technical Support Programme contact:
DSU (Policy & Advice Directorate), Scottish Natural Heritage, Great Glen House, Inverness, IV3 8NW. Tel: 01463 725000 or [email protected]
COMMISSIONED REPORT
Summary
ii

Table of Contents Page
Summary ii
1 INTRODUCTION 1 2 METHODS 1
2.1 Field methods 1 2.2 Presentation of results 2 2.2.1 Impact and condition assessments 2 2.2.2 Standardisation of data 2 2.2.3 Determination of overall impact 3 2.2.4 Assignment of survey squares to estates 3
3 RESULTS 3 4 DISCUSSION 6 5 REFERENCES 29
List of Tables Page
Table 1 Number and proportion of overall impact scores for 0.25 km squares on estates in the Cairngorms Core Area……………………………………………………………10Table 2 Number of standardised impact scores for different habitats and extent of the habitat for each score within 0.25 km squares in the Cairngorms Core Area……………… 12Table 3 Number of standardised impact scores for different habitats and extent of each habitat within 0.25 km squares for Balmoral Estate within the Cairngorms Core Area…… 13Table 4 Number of standardised impact scores for different habitats and extent of each habitat within 0.25 km squares for Cairngorm Estate within the Cairngorms Core Area…. 14Table 5 Number of standardised impact scores for different habitats and extent of each habitat within 0.25 km squares for Glenavon Estate within the Cairngorms Core Area….. 15Table 6 Number of standardised impact scores for different habitats and extent of each habitat within 0.25 km squares for Glenfeshie Estate within the Cairngorms Core Area…. 16Table 7 Number of standardised impact scores for different habitats and extent of each habitat within 0.25 km squares for Invercauld Estate within the Cairngorms Core Area…. 17Table 8 Number of standardised impact scores for different habitats and extent of each habitat within 0.25 km squares for Killiehuntley Estate within the Cairngorms Core Area.. 18Table 9 Number of standardised impact scores for different habitats and extent of each habitat within 0.25 km squares for Mar Estate within the Cairngorms Core Area…………. 19Table 10 Number of standardised impact scores for different habitats and extent of each habitat within 0.25 km squares for Mar Lodge Estate within the Cairngorms Core Area… 20Table 11 Number of standardised impact scores for different habitats and extent of each habitat within 0.25 km squares for Pityoulish Estate within the Cairngorms Core Area….. 21Table 12 Number of standardised impact scores for different habitats and extent of each habitat within 0.25 km squares for Revack and Dorback Estate within the Cairngorms Core Area…………………………………………………………………………………………..22Table 13 Number of standardised impact scores for different habitats and extent of each habitat within 0.25 km squares for Rothiemurchus Estate within the Cairngorms Core Area…………………………………………………………………………………………………23Table 14 Number of standardised impact scores for different habitats and extent of each habitat within 0.25 km squares for RSPB estate within the Cairngorms Core Area………. 24Table 15 Number of standardised impact scores for different habitats and extent of each habitat within 0.25 km squares for Seafield Estate within the Cairngorms Core Area……. 25Table 16 Number of standardised impact scores for different habitats and extent of each habitat within 0.25 km squares for SNH estate within the Cairngorms Core Area………… 26
iii

Table 17 Number of standardised impact scores for different habitats and extent of each habitat within 0.25 km squares for various estates within the Cairngorms Core Area……. 27Table 18 Interpretation of surveys of browsing/grazing and trampling impact…………….. 28
List of Figures Page
Figure 1 0.25 km square survey squares of the grazing and trampling impact survey in the Cairngorms Core Area………………………………………………………………………. 32Figure 2 Map of major estates in the Cairngorms Core Area divided into 0.25 km squares……………………………………………………………………………………………..33Figure 3 0.25 km squares with overall grazing/browsing and trampling impact scores for upland habitats in the Cairngorms Core Area……………………………………………….....34Figure 4 0.25 km squares with standardised browsing and trampling impact scores for dwarf-shrub heath in the Cairngorms Core Area………………………………………………35Figure 5 0.25 km squares with standardised grazing/browsing and trampling impact scores for wind-clipped summit heath in the Cairngorms Core Area………………………..36Figure 6 0.25 km squares with standardised grazing/browsing and trampling impact scores for blanket bog in the Cairngorms Core Area ………………………………………….37Figure 7 0.25 km squares with standardised grazing and trampling impact scores for grassland in the Cairngorms Core Area…………………………………………………………38Figure 8 0.25 km squares with tree and scrub regeneration in the Cairngorms Core Area………………………………………………………………………………………………….39Figure 9 0.25 km squares showing presence of deer species in the Cairngorms Core Area………………………………………………………………………………………………… 40Figure 10 0.25 km squares showing presence of sheep and cattle in the Cairngorms Core Area…………………………………………………………………………………………..41Figure 11 0.25 km squares showing presence of mountain hare and rabbit in the Cairngorms Core Area…………………………………………………………………………….42Figure 12 0.25 km squares showing presence of grouse species and ptarmigan in the Cairngorms Core Area…………………………………………………………………………….43Figure 13 Light browsing impacts in dry dwarf-shrub heath showing tree regeneration (Scots pine and birch) on the northern slopes of the Kincardine Hills……………………….44Figure 14 Light browsing impacts in dry dwarf-shrub heath with tree regeneration (Scots pine and birch) in the Pass of Ryvoan…………………………………………………..44Figure 15 Heavy browsing impacts in dry dwarf-shrub heath showing drumstick and topiary heather, dead stems of heather and invasion by grassland…………………….……45Figure 16 Heavy browsing impacts in dry dwarf-shrub heath showing short, browsed heather, twisted and dead stems of heather and abundance of blaeberry apparently favoured by browsing. …………………………………………………………………………… 45Figure 17 Moderate browsing impacts in dry dwarf-shrub heath showing rounded bushes of heather and patchy incursion of grassland…………………………………………46Figure 18 Heavy browsing impacts in dry dwarf-shrub heath showing development of grassland and soil erosion on steep slopes…………………………………………………….46Figure 19 Dry dwarf-shrub heath showing heavy browsing impacts in glen bottom with gradients to mostly light impact on steep slopes at Baddoch, Glen Clunie…………………47Figure 20 Dry dwarf-shrub heath in Glen Clunie showing gradients in browsing impacts from heavy to moderate and light with moderate grazing impacts in smooth grassland…. 47Figure 21 Mixed heavy, moderate and light browsing impacts on dwarf-shrub heath in Glen Clunie and showing patchy development of grassland………………………………….48Figure 22 Red deer tracks crossing dry dwarf-shrub heath showing localised heavy and moderate browsing impacts………………………………………………………………………48Figure 23 Moderate trampling damage in Calluna-Eriophorum blanket bog showingwidespread but patchy bare peat………………………………………………………………..49
iv

Figure 24 Light grazing in tussock grassland dominated by mat-grass (Nardus stricta),showing the development of a tall, dense sward…………………………………………….49
APPENDIX 1 Habitats assessed
APPENDIX 2 Field Record Sheet for 1997 Habitat Condition Assessments
APPENDIX 3 Data file for the project
v

Acknowledgements I thank the contractors Paul Gill (Environmentally Sustainable Systems), Stuart Rae and Imogen Pearce (Institute of Terrestrial Ecology) and their staff who so ably carried out the bulk of the impact assessments.
Thanks are also due to landowners who gave permission to work on their land. I also thank SNH Area staff for arranging access permission.
I am grateful to my ex-colleagues Ro Scott for the basis of Table 18, Angus MacDonald whose methodology forms the basis of this work and Richard Tidswell for help with technical aspects of the work.
vi

1 INTRODUCTION In the Cairngorms high numbers of red deer and in places sheep, coupled with current management practices, threaten the existence of moorland and montane habitats that are susceptible to grazing and trampling impacts. A survey of grazing, browsing and trampling impacts of large herbivores in the Cairngorms was carried out to assist the Cairngorms Partnership (Cairngorms Working Party 1993) and Scottish Natural Heritage to develop a management strategy for moorland and montane habitats. The approach of MacDonald etal. (1998a, b) was adopted in carrying out the impact assessments.
The aim of the work was to provide impact assessments for four broad habitats of the moorland and montane areas of the Core Area of the Cairngorms (lying within the current Cairngorms National Park). The habitats assessed were dwarf-shrub heath, wind-clipped summit heath, blanket bog and grassland. Collectively these habitats make up the bulk of the vegetation cover of the survey area. The objective of the assessments was to identify areas where habitats were impacted at levels likely to result in damage, deterioration or loss of the habitat. The survey also provided information on the causes of the impacts. Data were also gathered on the presence of large herbivores and tree and scrub regeneration.
Maps are provided of impact assessments for individual habitats and a summary or overall impact map based on taking the assessments for the more susceptible habitats in each survey square. Different levels of impact on the habitats give different outlooks for maintenance or deterioration of the habitat. Generally, heavy grazing and trampling impacts, where the vegetation was likely to suffer damage and deterioration, were only locally extensive. The vegetation of the granite core of the Cairngorms has mainly low impacts while the vegetation of the base-rich Moinian and Dalradian rocks surrounding the granite core show proportionally more high and moderate impacts.
2 METHODS
2.1 Field methods The field methods were based on MacDonald et al. (1998a, b) and are similar to those used in many impact assessments, including Stolte, Henderson and Nolan (1998), Stolte et al.(1998), Henderson et al. (2000) and McConnell Associates (2001).
Grazing or browsing and trampling impacts in the habitats were assessed within 500 m x 500 m squares based on a subdivision of the O.S. 1 km square grid to give 0.25km square survey squares (referred to as “0.25 km squares”). Habitats assessed were dwarf-shrub heath, wind-clipped summit heath, blanket bog and grassland (smooth and tussock) (Appendix 1, MacDonald et al. 1998a).
The impact assessments were based on MacDonald et al. (1998a, b), which gives a series of field indicators for various habitats related to different categories or scores of grazing/browsing and trampling impact. Indicators used for the assessments included:
Direct impacts on plants, such as the proportion of leaf or shoot removed due to grazing or browsing.
Amount of bare and trampled ground. Frequency of erosion scars. Amount of herbivore dung deposited. Rates of flowering and fruiting of plant species. Sward height and cover. Growth form of different plant groups.
1
Trend indicators were used to indicate change in impact over the past year or a few years. These include: Persistent grazing- or browsing-induced plant growth forms. Relative heights of grasses and dwarf-shrubs.
Locating the 0.25 km squares and navigation was made with the help of O.S. 1:25,000 scale maps and aerial photographs. In 1995 areas of different habitats within survey squares were calculated from LCS88 maps (MLURI 1993), while from 1996, the extent of the habitats within each survey square was estimated as a percentage cover of the square in the field. In 1995, impacts were assessed where, individually, one or more of the target habitats were estimated to occupy at least 1 ha (4% of a survey square). In 1996 and subsequent years this was changed to >10%, or at least 2.5 ha, of the area of a 0.25 km square.
Impact assessments were undertaken by walking through the survey squares to observe and record the grazing and trampling indicators and their extent in the habitats. Routes over uniformly impacted habitats were a diagonal or “V” shape across a square or patch of habitat. In the case of more complex habitat mosaics and topography, routes that were more complex were taken to cover the full range of variation in vegetation and impacts.
Each habitat within a 0.25 km square was assigned an impact score depending on the overall level of the scores of the various indicators used. There were three main impact scores (light L, moderate M and heavy H) for most habitats. Habitats could also be assigned intermediate or mixed scores where more than one impact level occurred within the survey square to give six scores in total (L, LM, M, LH, MH, H). Only three impact scores: light, heavy and an intermediate or mixed score of light to heavy were available for wind-clipped summit heath (MacDonald et al. 1998b). In 1996 and in subsequent years the impact levels for each habitat were assigned to one of three ranges of proportion of habitat with particular scores within the survey square: 10<25%, 25-50%, >50%.
Within each 0.25 km square the presence of saplings of Scots pine, birch, rowan, willow and juniper growing above the level of the heather canopy was noted. The presence of browsing on the saplings was also recorded.
The presence of large herbivores including red deer, roe deer, reindeer, stock species sheep and cattle, lagomorphs, grouse and ptarmigan was recorded.
2.2 Presentation of results 2.2.1 Impact and condition assessments Field survey data were recorded for each 0.25 km square on a proforma giving an impact score for each of the habitats assessed and the impact score assessed for each indicator (Appendix 2).
These proforma refer to “condition categories” and “habitat condition assessments” which followed an early draft of MacDonald et al. (1998a, b). Since later drafts and the published guide dropped any reference to condition of habitats, to refer instead to impact categories (or scores) but with no other significant changes in the guidance, the latter has been adopted in the presentation of the results.
2.2.2 Standardisation of data For presentation of the data six impact classes or scores of light (L), light to moderate (LM), moderate (M), light to heavy (LH), moderate to heavy (MH) and heavy (H) are given. The 1995 field data were collected in this form. The field data from 1996 and subsequently, with
2

three ranges of proportion of impact levels, were standardised to give these six scores.Examples of standardisation are L (>50%) and M (10-25%) for a survey square standardised to LM, and H (>50%) and M (25-50%) standardised to MH.
2.2.3 Determination of overall impact Impact data are presented as an overall or summary impact score following MLURI (Henderson et al. 2000, Stolte et al. 1998). The MLURI overall assessment gives priority to impact scores for the most sensitive habitats to give a single impact assessment for each 0.25 km square. Dwarf-shrub heath and wind-clipped summit heath are regarded as the most sensitive habitats to herbivore browsing impacts and are given priority in the scoring. The flow chart below gives the procedure for determining the MLURI overall impact score.
Flow chart for determining the MLURI overall impact assessment for 0.25 km squares (Henderson et al. 2000, Stolte et al. 1998)
Ignore all impact scores relating to <25% of habitat area.
Where the higher impact score is >50% of habitat area all lower scores are ignored; where the lower impact score is >50%, coupled with a higher impact score at 25-50% of
habitat area then an intermediate score (e.g. light to moderate LM, moderate to heavy, MH) is used;
where scores are 50-50% use an intermediate or M score as appropriate; light (>50%) to heavy (25-50%) impact is scored as moderate (M) (except for wind-
clipped summit heath where LH is scored).
Take the highest impact score of either dwarf-shrub heath or wind-clipped summit heath.
If scores for neither of the above habitats are available, take the impact score for blanket mire or grassland if no score for blanket mire available.
Summarising the data in this way gives six impact scores as in 2.2.2 above.
2.2.4 Assignment of survey squares to estates Where estate boundaries pass through 0.25 km squares the assessments for that square were assigned to the estate with >50% of the square lying within its boundaries based on SNH digitised estate boundaries.
3 RESULTS This report is based on the work of Gill, Sales and Horsfield (1998), Gill and Scott (1996), Pearce (1997a, b) and Rae (1995, 1996 and 1997) who undertook the work on contract to SNH. Data from these surveys were included in Stolte et al. (1998), in a report on grazing and trampling impacts within the Cairngorm/Speyside Deer Management Group Area, which overlaps with the Cairngorms Core Area. Horsfield surveyed a gap in the assessments in Glen Clunie in 1999 and 2000. Details of a data file with the results of the project are given in Appendix 3. The file is available by request from the author.
Fig. 1 shows the extent of 0.25 km squares of the impact survey on an O.S. map base. Fig. 2 is a map of the major estates within the Cairngorms Core Area, divided into 0.25 km squares. Fig. 3 is a 0.25 km square distribution map of overall grazing/browsing and trampling impact scores for upland habitats in the Cairngorms Core Area. Table 1 gives the number of overall impact scores at different grazing and trampling impact levels for 0.25 km squares on individual estates. The Cairngorms Core Area was found to be generally not
3

heavily impacted; almost 74% of 3903 0.25 km squares were assessed as light or light to moderate impact, with 15% moderate or light to heavy, while there were only about 11% of squares assessed as moderate to heavy or heavy.
Figs 4-7 give 0.25 km square distribution maps of standardised grazing and trampling impact scores for respectively dwarf-shrub heath, wind-clipped summit heath, blanket bog and grassland. Table 2 gives the number of standardised impact scores and extent (ha) of different habitats for each impact score within 0.25 km squares. For dwarf-shrub heath and blanket bog 3.8% and 4.6% of squares were assessed as heavy and 8.4% and 5.0% as moderate-heavy respectively. Only 1.7% of 0.25 km squares with wind-clipped summit heath were assessed as heavy and about 11% as light to heavy impact. Grassland has a higher proportion of squares assessed as heavy (10.5%) and moderate impact (17.5%) compared to dwarf-shrub heath and blanket bog.
Tables 3-17 give the numbers of 0.25 km squares and area of habitat scored for each standardised impact score for each habitat on each estate.
Generally, the vegetation of the granite core of the Cairngorms has low grazing and trampling impacts with higher impacts only localised and sparse. The main concentrations of overall moderate to heavy and heavy impacts were found on the vegetation of the richer Moinian and Dalradian rocks (psammite, pelite, semi-pelite and meta-limestone), which surrounds the granite core. Areas with heavier impact include Linn of Dee, Upper Deeside (centred on Carn Bhac, south of Linn of Dee), Geldie Burn, Glen Lui, Glen Luibeg, Glen Derry, Glen Quoich, Gleann an t-Slugain, Glen Feshie, Pityoulish, Dorback Burn-Braes of Abernethy, Inchrory, Craig Leek and Glen Clunie (Figs 1, 3).
For dwarf-shrub heath (Fig. 4), the geographical pattern of impact is similar to overall impact. This is as expected, since dwarf-shrub heath is the predominant habitat determining the overall impact score. The gaps in assessments are mainly due to the absence of dwarf-shrub heath from the high montane plateaux.
The main concentrations of heavy (or light to heavy) impact in wind-clipped summit heath were found on Carn Bàn Mòr, on Mòine Mhòr and Mullach Clach à Bhlàir, on Beinn Bhrotain, in upper Deeside (Carn Liath), around Geldie Burn, on Mòine Bhealaid to North Top of Beinn a’ Bhuird and on Carn Eas to Creag an Dail Mhòr (Fig. 5).
Heavy and moderate to heavy impacts in blanket bog were recorded mainly in upper Deeside to the Geldie Burn and on Mòine Bhealaidh at high altitude (Fig. 6). Moderate (or light to heavy) impacts were recorded more widely, mainly on high ground in upper Glen Feshie, Glen Eidart and Allt Luineag and to the east around the River Gairn and in upper Glen Quoich. Smaller concentrations of moderate and heavy impact occurred above the Balloch Burn in Glen Clunie, above Ballochbuie Forest and on Craig Leek.
For grassland, the main concentrations of heavy, moderate to heavy and moderate impact were found in upper Deeside, north and south of the Geldie Burn, on Carn Cloich-mhuilinn and at Inchrory (Fig. 7). In Glen Feshie, Glen Clunie, around the River Gairn and in upper Quoich Water the heaviest impacts in grassland were mainly moderate with just a few moderate to heavy and heavy assessments.
4

Fig. 8 gives a 0.25 km square map of tree and scrub regeneration in the Cairngorms Core Area. Tree and scrub regeneration was recorded from 33% of 39221 survey squares but saplings were browsed in almost 80% of these squares. Tree and scrub regeneration was widespread but there were only six main areas where browsing was not recorded (or may be assumed to be light). These were the Northern Corries (Lairig Ghru to Ryvoan), Glen Feshie (Loch an Eilean to Auchlean), Upper Deeside (Cairn Toul to Ben MacDui), Glen Avon (Loch Avon to Strath Nethy) and upper Quoich Water (Carn Eas). The Northern Corries are well known for their profuse regeneration of species in subalpine scrub (Miller and Cummins 1982 and French, Miller and Cummins 1997).
Deer were recorded from 88% of 3922 survey squares (Fig. 9). The percentages for individual species were red deer (86.6%), roe deer (7.4%) and reindeer (0.6%). Red deer were found almost everywhere. Roe deer appear to be more localised and at least seven concentrations of records can be identified: Loch an Eilean to Auchlean, Coire Garbhlach, upper Glen Feshie, Linn of Dee to Carn Liath, upper Quoich Water, Craig Leek and Kincardine Hills to Bynack More. Most of these areas were near to woodland but some records are from tall heather moorland far from the edge of woodland.
Sheep were recorded from 12% of survey squares while cattle were only recorded from 0.9% of squares (Fig. 10). Sheep and cattle were highly localised. Sheep were recorded in many areas where heavy or moderate to heavy impacts were recorded (Figs 3-7), such as Allt Fhearnasdail, Pityoulish to Tulloch, Dorback Burn to Braes of Abernethy, Loch Builg to River Gairn, Craig Leek, Glen Clunie and upper Deeside (Carn Bhac, south of Linn of Dee) and may therefore be contributing towards the heavier impacts in these areas. However, they were not recorded from other areas where there were heavy and moderate to heavy impacts including Glen Feshie, Inchrory, Gleann t-Slugain to Glen Quoich, Glen Lui, Glen Luibeg, Glen Derry, Linn of Dee, Geldie Burn and Mòine Bhealaidh. Impacts in these areas may be attributed to red deer. In the largest area of heavy impact in Upper Deeside to the south of the Linn of Dee, sheep were recorded only in a restricted area and most of the impact was due to red deer (Gill and Scott 1996 and Rae 1995, 1996).
Red deer were recorded from almost all areas of heavy impact. There are no records for Allt Fhearnasdail and Craig Leek where sheep were presumably the main grazers. Any impacts in wind-clipped summit heath on the high plateaux can be attributed to red deer since sheep were rarely recorded from high ground and mountain hare were likewise largely absent. In most areas of heavy impact where both red deer and sheep were present, impact was likely to be due to a combination of sheep and red deer. This was the case in Glen Clunie where observations suggested that sheep and red deer were both responsible for impacts on the lower to upper slopes. Red deer tended to concentrate in high-altitude corries where impacts were likely to be due primarily to red deer.
Fig. 11 shows the presence of mountain hares and rabbits in 0.25 km squares. Mountain hare was widely distributed but largely absent from the high plateau and the glen bottoms. Rabbits were localized, usually occurring in smooth grassland. The main concentrations were on Craig Leek and other areas on Deeside; on Inchrory, Glen Feshie, Glen Clunie and the northern slopes of the Kincardine Hills. Fig. 12 shows the presence of grouse species and ptarmigan. Red grouse were widespread except for the high plateaux, while ptarmigan
1 Impact assessments are presented for 3903 survey squares but the total number of survey squares was 3922. The extra squares held habitats whose impact assessments are not given in this report, mostly plantation or native woodland. Tree and scrub regeneration and animal records were noted in all squares.
5

were mainly recorded from the high ground but there was some overlap with red grouse. Black grouse were localized and most records were from the Kincardine Hills and Deeside.
4 DISCUSSION These impact surveys were designed as a rapid method of covering all the ground. The main aim was to obtain a broad picture of impacts and to identify areas where damaging heavy impacts were concentrated. They were intended to give a baseline of broad impact levels that could be used as a basis for stratification of plot samples of more detailed monitoring such as the work of Welch and Scott (1997). Future comparisons of the 0.25 km square baseline may be by stratified random sampling of squares or complete re-survey of selected areas.
Different levels of impact on the habitats give different prognoses of deterioration or loss of the habitat. Heavy and possibly moderate impacts will generally cause deterioration or loss of the habitat concerned (Table 18, MacDonald et al. 1998a). Moderate impacts usually tend to maintain the habitat but may have deleterious structural effects on dwarf-shrub heath and blanket bog. Grazing sensitive species, including heather, may be slowly lost, though the flora is often rich in species generally. Light or light to moderate impacts will often maintain the habitat with high floristic diversity but if too light a few vigorous species may become dominant or scrub and woodland regeneration may occur. For most habitats, a light to moderate grazing impact is considered most beneficial for biodiversity (Milne et al. 1998).
The association found in this study of heavier grazing with the richer rocks is part of a wider picture in the Highlands. The poor rocks of the granite core appear to have preserved the area from more intensive grazing and land management practices. Other examples of granite uplands with relatively low intensity land-use are Lochnagar and Arran Northern Mountains. Both areas are managed primarily for deer stalking, but at levels which have generally preserved a predominance of heather. These areas contrast with hills of base-rich schist such as Caenlochan and Ben Lawers which have attracted larger numbers of herbivores both red deer and sheep. On these latter areas, the predominant vegetation is grassland or other vegetation with abundant graminoids. On steep well-drained slopes where there is access to grazing animals, Vaccinium myrtillus often dominates whereCalluna may be expected to dominate. On steep, rocky slopes where animals cannot gain access, patches of Calluna-dominated dwarf-shrub heath may occur suggesting that grazing animals, rather than rock types, are responsible for the fragmentary heather cover.
The results of the observations on tree regeneration supports Miller, Cummins and Hester (1998) that saplings are widespread but woodland regeneration is more restricted because of browsing by herbivores. According to Miller, Cummins and Hester (1998) many saplings are maintained in a suppressed state by repeated browsing and constitute a “sapling bank” from which rapid growth can occur once browsing pressure has been relieved.
Thomson et al. (2006) summarise comparable herbivore impact data for four Deer Management Groups (DMGs). One of these, Cairngorm/Speyside, overlaps with the Cairngorms Core Area by around two-thirds and data from the current study were incorporated in the full data set (Stolte et al. 1998). Consequently the impact profile for this DMG is close to that of the Cairngorms Core Area. Compared with the other three DMGs, all in the eastern Highlands, the Cairngorms Core Area is characterised by a much higher proportion of area with light impact class or score and lower proportions of area with light-moderate, moderate and moderate-heavy impacts. The proportion of area with a heavy impact score for the Cairngorms Core Area is similar to the Angus Glens and Ardverikie but lower than Tayside.
6

Nolan et al. (1996) provide a habitat impact assessment for Invercauld Estate, which overlaps in Deeside and Glen Clunie with the current study. Detailed comparisons are difficult because the impacts are presented as polygons of different sizes rather than as 0.25 km squares. However, the topographic pattern of impact is similar in the two studies. The current study appears to have found more light impact, less moderate impact and possibly less moderate-heavy and less heavy impact than Nolan et al. (1996).
Staines, Balharry and Welch (1995) provide evidence that since 1970 Calluna heath declined and grassland cover increased in Glen Feshie. Changes in composition of the vegetation were attributed to red deer although 30 cattle were summered in the glen from 1967-1972. Sheep were absent and grazing by hares and rabbits was light. According to Staines, Balharry and Welch (1995) in Glen Lui, where fertilizing has taken place and red deer have been given additional feed, heather has declined dramatically from 65% cover in 1946 to 61% in 1966 and 40% in 1989.
Watson (1989) believed a change occurred from heather-dominated to grass-dominated ground in Glen Clunie where red deer numbers have greatly increased since the late 1960’s.
McLeod (2002) reported the results of counts of sheep, red deer and mountain hares in the montane zone, in the summers of 1987-1999 on 47 sites in the Highlands. On two of the 10 Cairngorm study sites a few sheep were found in 1987-1990 but none in 1991-1999. On the Cairngorms red deer densities were generally low but a striking exception to this was Mòine Mhòr with a maximum density (1989-1997) of up to 98 deer per day per km square. Counts on Ben Avon were recorded as high as 21 deer per day per km square. McLeod (2002) suggests that the extremely high densities on Mòine Mhòr were likely to be having a detrimental effect on the montane vegetation. The Mòine Mhòr study site corresponds to an area of heavy impact in wind-clipped summit heath between Carn Bàn Mòr and Mullach Clach a’ Blair found in the current study while on Ben Avon wind-clipped summit heath was assessed extensively as light to heavy impact suggesting a more patchy heavy impact.
Scott, Welch and Gornall (1999) examined heather cover, height and offtake in sample plots within 0.25 km squares previously assigned to a range of grazing and trampling impact categories in the current study. Good agreement was found between the 1995/6 assessments (Gill and Scott 1996 and Rae 1995, 1996) and the authors’ plots in 1998. Of 40 0.25 km squares, only the six plots in one square were assigned to a different class (M instead of H). H-class plots had a high frequency of carpet heather while M-class plots had a high frequency of topiary heather and L-class had no carpet, drumstick or topiary heather. Heather height increased from H to M to L impact class. April % browsing in H, M and L impact plots was respectively 36%, 20% and 8% of shoots. With a shoot growth on average of 3 cm per year, this corresponds to the shoot browsing range of the three impact classes in MacDonald et al. (1998b). In a similar study in Glen Feshie (Scott, Mitchell and Welch 2001) heather cover in H-class plots decreased significantly in winter 1996/97 but not in winter 1999/2000. This suggested that changes in winter feeding sites in 1997 from the main glen where the high impacts occurred, to a side glen were responsible for a decrease in over-winter browsing in 1999/2000 in H-class squares.
Contractors’ reports on different parts of the study area provide information on the impacts of different herbivores. In many areas, there were no sheep, or few sheep and impacts were linked to high red deer densities (Gill and Scott 1996; Rae 1995, 1996, 1997 and Gill, Sales and Horsfield 1998). In the largest concentration of 0.25 km squares assessed as heavily impacted, in the south Geldie (and Deeside) area of Mar Lodge Estate, Rae (1996) counted over 3000 red deer, though this may have included some double counting. On the eastern part of the area alone, where heavy impact was particularly concentrated, over 2000 red
7

deer were counted. Only eight sheep were seen. Rae (1996) believed that red deer were eating out the heather and blaeberry in the area.
Where both red deer and sheep occur it is difficult to separate out their respective impacts. This applied in Glen Clunie where both occur in high numbers. Heavy impacts and apparent continuing loss of heather was attributed to both these large herbivores (personal observations).
Rabbits generally occurred in smooth grassland and areas of old improvement where they grazed the grasses short, but their effects were localised (Gill 1996; Gill, Sales and Horsfield 1998 and Rae 1995, 1996, 1997). They can impact on adjacent dwarf-shrub heath, browsing bushes to topiary form as on the northern slopes of the Kincardine Hills (personal observations). Rae (1995) notes rabbits as particularly numerous in dwarf-shrub heath north of Craig Leek on Deeside, probably because of base-enriched soils. MacDonald (2004) suggests rabbits cause the major impacts on both sward height and soil erosion in calcareous grassland on the eastern slopes of Craig Leek.
McLeod (2002) assessed the density of mountain hares as low on all his ten Cairngorm montane study sites, at around one animal for every 2.5 km2. On Inchrory Rae (1997) noted several hares seen per square kilometre. Even though higher densities were observed on other sites, McLeod (2002) concluded that it seemed very unlikely that hares on their own had a marked effect on montane plant communities.
The impact assessment methodology used in this study is easiest to apply where there are large tracts of a few kinds of habitat and where the gradients in impact are large in scale compared with the scale of the survey square. Potential difficulties for field surveyors are as follows:
Defining where the boundary of the 0.25 km square lies. Determining the extent of impact at different levels when the habitat itself is part of a
mosaic of habitats and the impact levels vary across the habitat. Recognising past burning and past and present climatic effects (and not mistaking them
for current browsing/grazing or trampling impacts). Use of impact indicators particularly where comparative levels need to be assessed. Weighting the value of different indicators to give a summary assessment.
MacDonald (2007) addresses some of these issues.
The exact line of a boundary of a survey square placed by a surveyor could affect the assessment for an individual square, although if impacts are missed in one square, they should be scored for an adjacent square, so that the overall picture of impacts may not be unduly affected. Estimation of proportions is subject to the same variation as estimation of plant cover or domin values but complicated by the large scale and different routes surveyors may take across a survey square. The surveyor also has to make a judgment as to when an adequate picture of impacts within the square has been obtained. This is necessarily subjective and may lead to variation in assessments between surveyors.
To minimise or avoid the last two difficulties, field workers should have a good knowledge of the methodology as described in MacDonald et al. (1998a, b). This includes a good understanding of impacts and behaviour, especially of fire and herbivores, including invertebrates. They also need to be able to recognise where damage is historical, whether due to herbivores, fire or due to the influence of climate. Current effects of climate on plant growth and flowering should also be taken into account. Surveyors need to be
8

knowledgeable enough to deduce the most probable cause of observed impacts and be able to recognise unambiguous field evidence. They should also recognise that uncertainty about the causes of impact may arise, especially where impacts have occurred in the past or where there are interactions between different kinds of impacts.
In conclusion, although some variation between surveyors is to be expected in applying the survey square methodology, this variation should not detract from the broad picture of impacts and their causes built up across a site by knowledgeable surveyors.
9

Table 1 Number and proportion of overall impact scores for 0.25 km squares on estates in the Cairngorms Core Area Estate name Overall impact scores
L LM MNo. 0.25
km squares
% in core area
% estatetotal
No.0.25 km squares
% in core area
% estateTotal
No.0.25 km squares
% in core area
% estateTotal
Balmoral 57 2.6 57.6 9 1.3 9.1 25 4.8 25.3Cairngorm 87 4.0 87.9 7 1.0 7.1 5 1.0 5.1Glenavon 361 16.6 67.5 66 9.4 12.3 68 13.0 12.7Glenfeshie 215 9.9 47.3 98 13.9 21.5 72 13.8 15.8Invercauld 298 13.7 54.8 77 10.9 14.2 97 18.6 17.8Killiehuntley 20 0.9 57.1 8 1.1 22.9 3 0.6 8.6Mar 8 0.5 57.1 1 0.1 7.1 5 1.0 35.7Mar Lodge 453 20.8 39.3 311 44.2 27.0 156 29.9 13.5Pityoulish 1 0.0 4.3 5 0.7 21.7 7 1.3 30.4Revack and Dorback 32 1.5 33.3 28 4.0 29.2 21 4.0 21.9Rothiemurchus 206 9.4 78.9 20 2.8 7.7 20 3.8 7.7RSPB 280 12.8 73.3 61 8.7 16.0 31 5.9 8.1Seafield 12 0.6 48.0 1 0.1 4.0 8 1.5 32.0SNH 110 5.0 85.3 9 1.3 7.0 0 0.0 0.0Various 40 1.8 75.5 3 0.4 5.7 4 0.8 7.5Core area total and % of core area 2180 55.8 704 18.0 522 13.4
10
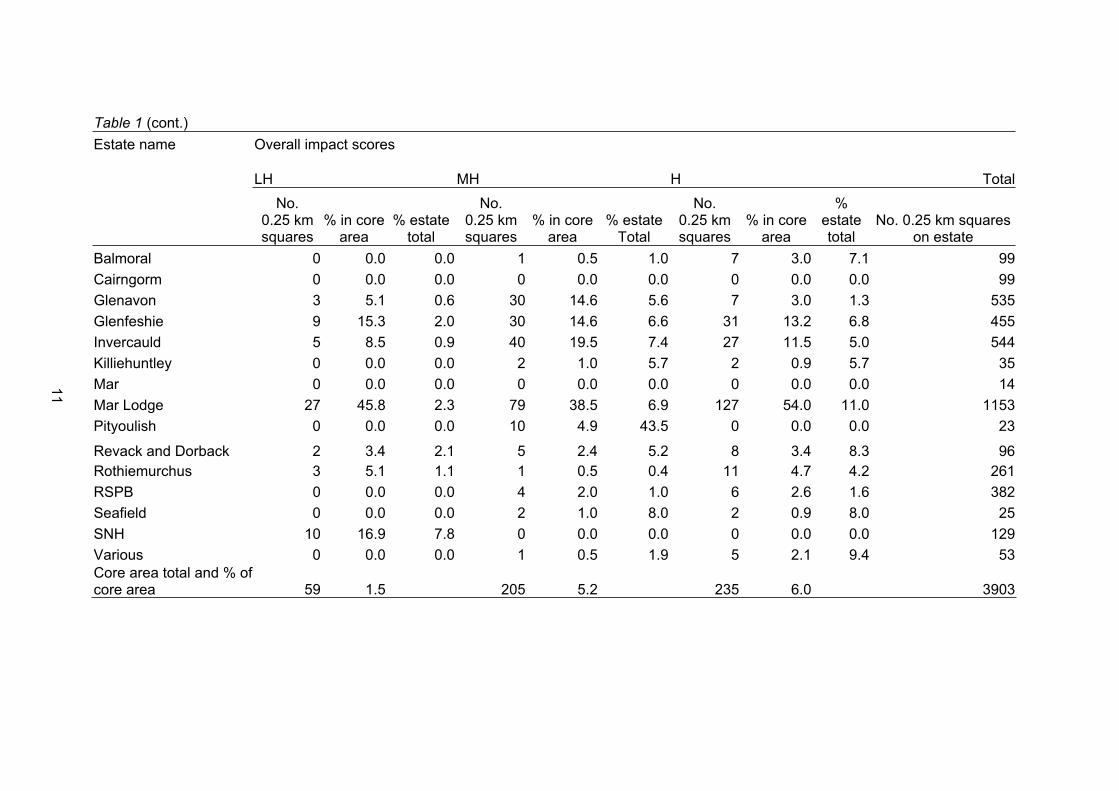
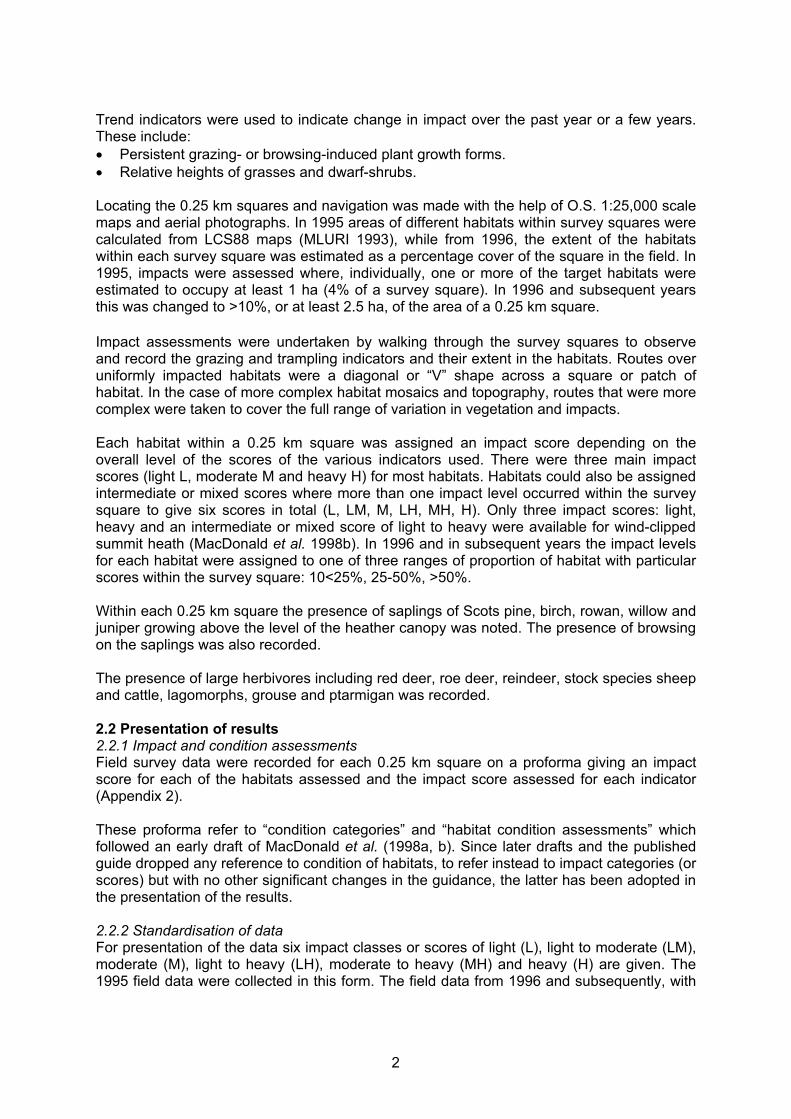
Table 1 (cont.)Estate name Overall impact scores
LH MH H Total No.
0.25 km squares
% in core area
% estatetotal
No.0.25 km squares
% in core area
% estateTotal
No.0.25 km squares
% in core area
%estatetotal
No. 0.25 km squares on estate
Balmoral 0 0.0 0.0 1 0.5 1.0 7 3.0 7.1 99Cairngorm 0 0.0 0.0 0 0.0 0.0 0 0.0 0.0 99Glenavon 3 5.1 0.6 30 14.6 5.6 7 3.0 1.3 535Glenfeshie 9 15.3 2.0 30 14.6 6.6 31 13.2 6.8 455Invercauld 5 8.5 0.9 40 19.5 7.4 27 11.5 5.0 544Killiehuntley 0 0.0 0.0 2 1.0 5.7 2 0.9 5.7 35Mar 0 0.0 0.0 0 0.0 0.0 0 0.0 0.0 14Mar Lodge 27 45.8 2.3 79 38.5 6.9 127 54.0 11.0 1153Pityoulish 0 0.0 0.0 10 4.9 43.5 0 0.0 0.0 23
Revack and Dorback 2 3.4 2.1 5 2.4 5.2 8 3.4 8.3 96Rothiemurchus 3 5.1 1.1 1 0.5 0.4 11 4.7 4.2 261RSPB 0 0.0 0.0 4 2.0 1.0 6 2.6 1.6 382Seafield 0 0.0 0.0 2 1.0 8.0 2 0.9 8.0 25SNH 10 16.9 7.8 0 0.0 0.0 0 0.0 0.0 129Various 0 0.0 0.0 1 0.5 1.9 5 2.1 9.4 53Core area total and % of core area 59 1.5 205 5.2 235 6.0 3903
11

Table 2 Number of standardised impact scores for different habitats and extent of the habitat for each score within 0.25 km squares in the Cairngorms Core Area
Habitat/ Dwarf-shrub heath Wind-clipped summit heath Blanket bog
Standardised impact score
No. 0.25 km
squares% 0.25 km
squaresHabitat
area (ha)
%habitatarea
No. 0.25 km
squares% 0.25 km
squaresHabitat
area (ha)
%habitatarea
No. 0.25 km
squares% 0.25 km
squaresHabitat
area (ha)
%habitatarea
L 1221 38.4 17396.3 37.0 1251 87.4 12289.6 85.2 799 53.9 5642.8 50.8 LM 1072 33.7 16654.3 35.4 0 0 0.0 0.0 330 22.3 2686.6 24.2 M 359 11.3 5385.1 11.5 0 0 0.0 0.9 184 12.4 1292.8 11.6 LH 140 4.4 2449.1 5.2 156 10.9 1923.1 13.3 27 1.8 322.9 2.9 MH 268 8.4 3863.9 8.2 0 0 0.0 0.0 74 5.0 620.9 5.6 H 121 3.8 1262.1 2.7 24 1.7 217.5 1.5 68 4.6 546.3 4.9 Total 3181 47010.8 1431 14430.2 1482 11112.3
Table 2 (cont.)
Habitat/ Grassland All habitats
Standardised impact score
No. 0.25 km
squares% 0.25 km
squaresHabitat
area (ha)% habitat
area
No. 0.25 km
squares% 0.25 km
squaresHabitat
area (ha) % habitat
areaL 686 48.5 1749.5 36.7 3957 52.7 37078.2 48.0LM 219 15.5 984.2 20.6 1621 21.6 20325.1 26.3M 247 17.5 772.6 16.2 790 10.5 7450.6 9.6LH 43 3.0 157.6 3.3 366 4.9 4852.7 6.3MH 72 5.1 319.5 6.7 414 5.5 4804.3 6.2H 148 10.5 786.1 16.5 361 4.8 2812.0 3.6Total 1415 4769.6 7509 77322.9
12

Table 3 Number of standardised impact scores for different habitats and extent of each habitat within 0.25 km squares for BalmoralEstate within the Cairngorms Core Area
Habitat/ Dwarf-shrub heath Wind-clipped summit heath
Standardised impact score
No. of 0.25 km squares %
Area of habitat (ha) %
No. of 0.25 km squares %
Area of habitat (ha) %
L 27 27.3 621.1 26.2 3 60.0 17.7 97.3LM 42 42.4 1019.8 43.0 0 0.0 0.0 0.0M 9 9.1 222.5 9.4 0 0.0 0.0 0.0LH 8 8.1 197.5 8.3 2 40.0 0.5 2.7MH 11 11.1 260.0 11.0 0 0.0 0.0 0.0H 2 2.0 50.0 2.1 0 0.0 0.0 0.0Total 99 2370.8 5 18.2
Habitat/ Blanket bog Grassland
Standardised No. of 0.25 km
squares % Area of habitat
(ha) % No. of 0.25 km
squares % Area of habitat
(ha) % L 1 14.3 12.5 48.1 6 60.0 12.5 62.5LM 3 42.9 3.0 11.5 1 10.0 0.0 0.0M 1 14.3 2.5 9.6 3 30.0 7.5 37.5LH 0 0.0 0.0 0.0 0 0.0 0.0 0.0MH 1 14.3 0.5 1.9 0 0.0 0.0 0.0H 1 14.3 7.5 28.8 0 0.0 0.0 0.0Total 7 26.0 10 20.0
13

Table 4 Number of standardised impact scores for different habitats and extent of each habitat within 0.25 km squares for Cairngorm Estate within the Cairngorms Core Area
Habitat/ Dwarf-shrub heath Wind-clipped summit heath
Standardised impact score
No. of 0.25 km squares %
Area of habitat (ha) %
No. of 0.25 km squares %
Area of habitat (ha) %
L 58 73.4 828.0 68.8 58 100.0 637.5 100.0LM 13 16.5 240.0 19.9 0 0.0 0.0 0.0M 6 7.6 100.3 8.3 0 0.0 0.0 0.0LH 1 1.3 13.8 1.1 0 0.0 0.0 0.0MH 1 1.3 21.3 1.8 0 0.0 0.0 0.0H 0 0.0 0.0 0.0 0 0.0 0.0 0.0Total 79 1203.3 58 637.5
Habitat/ Blanket bog Grassland
Standardised impact score
No. of 0.25 km squares %
Area of habitat (ha) %
No. of 0.25 km squares %
Area of habitat (ha) %
L 39 90.7 51.3 91.1 28 93.3 16.3 86.7LM 1 2.3 0.0 0.0 0 0.0 0.0 0.0M 2 4.7 5.0 8.9 1 3.3 0.0 0.0LH 1 2.3 0.0 0.0 1 3.3 2.5 13.3MH 0 0.0 0.0 0.0 0 0.0 0.0 0.0H 0 0.0 0.0 0.0 0 0.0 0.0 0.0Total 43 56.3 30 18.8
14

Table 5 Number of standardised impact scores for different habitats and extent of each habitat within 0.25 km squares for GlenavonEstate within the Cairngorms Core Area
Habitat/ Dwarf-shrub heath Wind-clipped summit heath
Standardised impact score
No. of 0.25 km squares %
Area of habitat (ha) %
No. of 0.25 km squares %
Area of habitat (ha) %
L 165 49.8 2352.7 34.2 209 91.3 2189.0 85.2LM 68 20.5 2765.5 40.2 0 0.0 0.0 0.0M 34 10.3 629.2 9.2 0 0.0 0.0 0.0LH 25 7.6 488.2 7.1 20 8.7 380.0 14.8MH 38 11.5 627.2 9.1 0 0.0 0.0 0.0H 1 0.3 8.4 0.1 0 0.0 0.0 0.0Total 331 6871.2 229 2569.0
Habitat/ Blanket bog Grassland
Standardised impact score
No. of 0.25 km squares %
Area of habitat (ha) %
No. of 0.25 km squares %
Area of habitat (ha) %
L 160 80.4 2059.4 87.9 60 33.0 210.0 31.0LM 28 14.1 242.7 10.4 53 29.1 183.8 27.1M 6 3.0 17.2 0.7 36 19.8 134.0 19.8LH 2 1.0 22.5 1.0 7 3.8 45.0 6.6MH 1 0.5 0.0 0.0 14 7.7 55.8 8.2H 2 1.0 0.0 0.0 12 6.6 49.0 7.2Total 199 2341.7 182 677.5
15

Table 6 Number of standardised impact scores for different habitats and extent of each habitat within 0.25 km squares for Glenfeshie Estate within the Cairngorms Core Area
Habitat/ Dwarf-shrub heath Wind-clipped summit heath
Standardised impact score
No. of 0.25 km squares %
Area of habitat (ha) %
No. of 0.25 km squares %
Area of habitat (ha) %
L 119 33.1 1605.2 36.8 127 78.4 1194.5 78.9LM 123 34.3 1477.8 33.9 0 0.0 0.0 0.0M 40 11.1 441.2 10.1 0 0.0 0.0 0.0LH 24 6.7 350.2 8.0 26 16.0 235.2 15.5MH 31 8.6 333.6 7.6 0 0.0 0.0 0.0H 22 6.1 154.9 3.6 9 5.6 85.1 5.6Total 359 4362.9 162 1514.7
Habitat/ Blanket bog Grassland
Standardised impact score
No. of 0.25 km squares %
Area of habitat (ha) %
No. of 0.25 km squares %
Area of habitat (ha) %
L 118 49.6 946.9 46.2 116 48.7 130.6 25.2LM 54 22.7 471.3 23.0 62 26.1 229.2 44.3M 44 18.5 373.6 18.2 45 18.9 117.0 22.6LH 7 2.9 115.5 5.6 10 4.2 21.6 4.2MH 15 6.3 144.3 7.0 5 2.1 19.1 3.7H 0 0.0 0.0 0.0 0 0.0 0.0 0.0Total 238 2051.7 238 517.4
16

Table 7 Number of standardised impact scores for different habitats and extent of each habitat within 0.25 km squares for InvercauldEstate within the Cairngorms Core Area
Habitat/ Dwarf-shrub heath Wind-clipped summit heath
Standardised impact score
No. of 0.25 km squares %
Area of habitat (ha) %
No. of 0.25 km squares %
Area of habitat (ha) %
L 212 44.4 3636.2 46.9 160 84.7 1492.2 82.5LM 106 22.2 1761.7 22.7 0 0.0 0.0 0.0M 64 13.4 1020.7 13.2 0 0.0 0.0 0.0LH 29 6.1 453.7 5.8 27 14.3 304.2 16.8MH 51 10.7 756.4 9.8 0 0.0 0.0 0.0H 15 3.1 128.9 1.7 2 1.1 12.3 0.7Total 477 7757.5 189 1808.7
Habitat/ Blanket bog Grassland
Standardised impact score
No. of 0.25 km squares %
Area of habitat (ha) %
No. of 0.25 km squares %
Area of habitat (ha) %
L 60 38.5 119.3 25.0 137 50.9 481.0 37.3LM 44 28.2 138.2 29.0 39 14.5 339.3 26.3M 36 23.1 171.2 35.9 58 21.6 277.5 21.5LH 3 1.9 0.0 0.0 6 2.2 53.5 4.1MH 8 5.1 18.3 3.8 22 8.2 80.7 6.2H 5 3.2 29.5 6.2 7 2.6 59.0 4.6Total 156 476.5 269 1291.1
17

Table 8 Number of standardised impact scores for different habitats and extent of each habitat within 0.25 km squares for Killiehuntley Estate within the Cairngorms Core Area
Habitat/ Dwarf-shrub heath Wind-clipped summit heath
Standardised impact score
No. of 0.25 km squares %
Area of habitat (ha) %
No. of 0.25 km squares %
Area of habitat (ha) %
L 20 57.1 295.8 66.8 4 100.0 34.7 100.0LM 8 22.9 88.4 20.0 0 0.0 0.0 0.0M 1 2.9 10.7 2.4 0 0.0 0.0 0.0LH 2 5.7 19.2 4.3 0 0.0 0.0 0.0MH 2 5.7 1.2 0.3 0 0.0 0.0 0.0H 2 5.7 27.6 6.2 0 0.0 0.0 0.0Total 35 443.0 4 34.7
Habitat/ Blanket bog Grassland
Standardised impact score
No. of 0.25 km squares %
Area of habitat (ha) %
No. of 0.25 km squares %
Area of habitat (ha) %
L 17 85.0 117.0 86.4 4 25.0 0.0 0.0LM 1 5.0 5.4 3.9 1 6.3 0.0 0.0M 0 0.0 0.0 0.0 3 18.8 10.2 20.5LH 0 0.0 0.0 0.0 2 12.5 0.1 0.3MH 0 0.0 0.0 0.0 0 0.0 0.0 0.0H 2 10.0 13.1 9.7 6 37.5 39.3 79.2Total 20 135.5 16 49.6
18

Table 9 Number of standardised impact scores for different habitats and extent of each habitat within 0.25 km squares for MarEstate within the Cairngorms Core Area
Habitat/ Dwarf-shrub heath Wind-clipped summit heath
Standardised impact score
No. of 0.25 km squares %
Area of habitat (ha) %
No. of 0.25 km squares %
Area of habitat (ha) %
L 6 50.0 103.4 54.2 4 100.0 25.0 100.0LM 1 8.3 25.0 13.1 0 0.0 0.0 0.0M 3 25.0 40.0 21.0 0 0.0 0.0 0.0LH 2 16.7 22.5 11.8 0 0.0 0.0 0.0MH 0 0.0 0.0 0.0 0 0.0 0.0 0.0H 0 0.0 0.0 0.0 0 0.0 0.0 0.0Total 12 190.9 4 25.0
Habitat/ Blanket bog Grassland
Standardised impact score
No. of 0.25 km squares %
Area of habitat (ha) %
No. of 0.25 km squares %
Area of habitat (ha) %
L 0 0.0 0.0 0.0 0 0.0 0.0 0.0LM 0 0.0 0.0 0.0 0 0.0 0.0 0.0M 0 0.0 0.0 0.0 1 100.0 0.1 100.0LH 0 0.0 0.0 0.0 0 0.0 0.0 0.0MH 0 0.0 0.0 0.0 0 0.0 0.0 0.0H 0 0.0 0.0 0.0 0 0.0 0.0 0.0Total 0 0.0 1 0.1
19

Table 10 Number of standardised impact scores for different habitats and extent of each habitat within 0.25 km squares for MarLodge Estate within the Cairngorms Core Area
Habitat/ Dwarf-shrub heath Wind-clipped summit heath
Standardised impact score
No. of 0.25 km squares %
Area of habitat (ha) %
No. of 0.25 km squares %
Area of habitat (ha) %
L 267 28.6 3180.2 24.9 364 85.2 3439.7 82.3LM 353 37.8 5098.2 39.9 0 0.0 0.0 0.0M 123 13.2 1830.2 14.3 0 0.0 0.0 0.0LH 24 2.6 388.6 3.0 54 12.6 668.2 16.0MH 102 10.9 1459.8 11.4 0 0.0 0.0 0.0H 65 7.0 807.7 6.3 9 2.1 73.2 1.8Total 934 12764.7 427 4181.1
Habitat/ Blanket bog Grassland
Standardised impact score
No. of 0.25 km squares %
Area of habitat (ha) %
No. of 0.25 km squares %
Area of habitat (ha) %
L 136 36.0 412.5 17.8 193 41.1 512.0 31.9LM 67 17.7 411.1 17.8 30 6.4 116.9 7.3M 70 18.5 494.7 21.4 86 18.3 190.7 11.9LH 10 2.6 117.1 5.1 14 3.0 35.0 2.2MH 39 10.3 402.8 17.4 27 5.7 128.2 8.0H 56 14.8 474.9 20.5 120 25.5 620.1 38.7Total 378 2313.1 470 1602.7
20

Table 11 Number of standardised impact scores for different habitats and extent of each habitat within 0.25 km squares for Pityoulish Estate within the Cairngorms Core Area
Habitat/ Dwarf-shrub heath Wind-clipped summit heath
Standardised impact score
No. of 0.25 km squares %
Area of habitat (ha) %
No. of 0.25 km squares %
Area of habitat (ha) %
L 0 0.0 0.0 0.0 0 0.0 0.0 0.0LM 6 26.1 105.0 33.5 0 0.0 0.0 0.0M 10 43.5 152.5 48.6 0 0.0 0.0 0.0LH 1 4.3 12.5 4.0 0 0.0 0.0 0.0MH 6 26.1 43.8 13.9 0 0.0 0.0 0.0H 0 0.0 0.0 0.0 0 0.0 0.0 0.0Total 23 313.8 0 0.0
Habitat/ Blanket bog Grassland
Standardised impact score
No. of 0.25 km squares %
Area of habitat (ha) %
No. of 0.25 km squares %
Area of habitat (ha) %
L 2 50.0 15.0 54.5 1 50.0 6.3 55.6LM 1 25.0 10.0 36.4 0 0.0 0.0 0.0M 1 25.0 2.5 9.1 1 50.0 5.0 44.4LH 0 0.0 0.0 0.0 0 0.0 0.0 0.0MH 0 0.0 0.0 0.0 0 0.0 0.0 0.0H 0 0.0 0.0 0.0 0 0.0 0.0 0.0Total 4 27.5 2 11.3
21
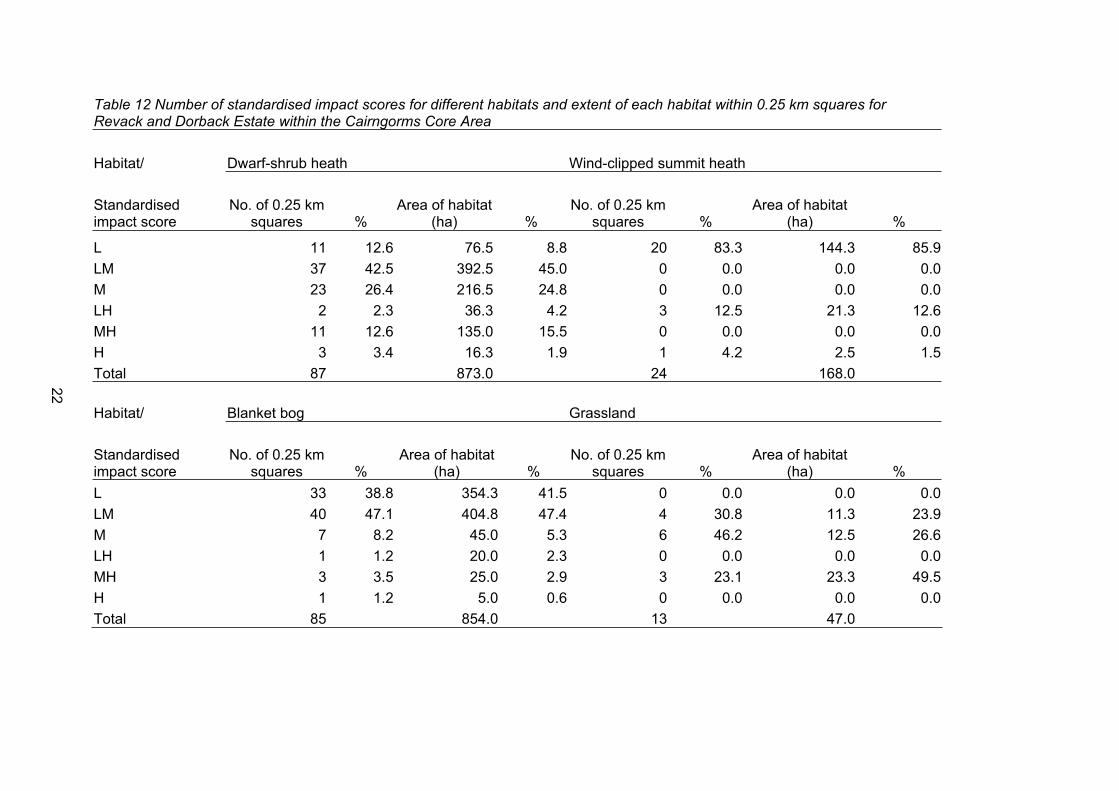
Table 12 Number of standardised impact scores for different habitats and extent of each habitat within 0.25 km squares for Revack and Dorback Estate within the Cairngorms Core Area
Habitat/ Dwarf-shrub heath Wind-clipped summit heath
Standardised impact score
No. of 0.25 km squares %
Area of habitat (ha) %
No. of 0.25 km squares %
Area of habitat (ha) %
L 11 12.6 76.5 8.8 20 83.3 144.3 85.9LM 37 42.5 392.5 45.0 0 0.0 0.0 0.0M 23 26.4 216.5 24.8 0 0.0 0.0 0.0LH 2 2.3 36.3 4.2 3 12.5 21.3 12.6MH 11 12.6 135.0 15.5 0 0.0 0.0 0.0H 3 3.4 16.3 1.9 1 4.2 2.5 1.5Total 87 873.0 24 168.0
Habitat/ Blanket bog Grassland
Standardised impact score
No. of 0.25 km squares %
Area of habitat (ha) %
No. of 0.25 km squares %
Area of habitat (ha) %
L 33 38.8 354.3 41.5 0 0.0 0.0 0.0LM 40 47.1 404.8 47.4 4 30.8 11.3 23.9M 7 8.2 45.0 5.3 6 46.2 12.5 26.6LH 1 1.2 20.0 2.3 0 0.0 0.0 0.0MH 3 3.5 25.0 2.9 3 23.1 23.3 49.5H 1 1.2 5.0 0.6 0 0.0 0.0 0.0Total 85 854.0 13 47.0
22

Table 13 Number of standardised impact scores for different habitats and extent of each habitat within 0.25 km squares for Rothiemurchus Estate within the Cairngorms Core Area
Habitat/ Dwarf-shrub heath Wind-clipped summit heath
Standardised impact score
No. of 0.25 km squares %
Area of habitat (ha) %
No. of 0.25 km squares %
Area of habitat (ha) %
L 85 42.1 1467.3 40.2 100 90.9 1169.1 90.6LM 89 44.1 1673.8 45.9 0 0.0 0.0 0.0M 10 5.0 176.3 4.8 0 0.0 0.0 0.0LH 11 5.4 267.5 7.3 7 6.4 77.0 6.0MH 3 1.5 41.8 1.1 0 0.0 0.0 0.0H 4 2.0 22.5 0.6 3 2.7 44.3 3.4Total 202 3649.1 110 1290.4
Habitat/ Blanket bog Grassland
Standardised impact score
No. of 0.25 km squares %
Area of habitat (ha) %
No. of 0.25 km squares %
Area of habitat (ha) %
L 23 63.9 153.7 68.2 58 82.9 218.8 86.8LM 10 27.8 27.9 12.4 8 11.4 27.5 10.9M 1 2.8 6.3 2.8 3 4.3 5.8 2.3LH 1 2.8 12.5 5.5 1 1.4 0.0 0.0MH 1 2.8 25.0 11.1 0 0.0 0.0 0.0H 0 0.0 0.0 0.0 0 0.0 0.0 0.0Total 36 225.3 70 252.0
23

Table 14 Number of standardised impact scores for different habitats and extent of each habitat within 0.25 km squares for RSPBestate within the Cairngorms Core Area
Habitat/ Dwarf-shrub heath Wind-clipped summit heath
Standardised impact score
No. of 0.25 km squares %
Area of habitat (ha) %
No. of 0.25 km squares %
Area of habitat (ha) %
L 133 47.8 1622.3 44.0 140 95.9 1186.2 94.5LM 102 36.7 1439.2 39.1 0 0.0 0.0 0.0M 25 9.0 338.8 9.2 0 0.0 0.0 0.0LH 7 2.5 130.0 3.5 6 4.1 68.8 5.5MH 7 2.5 110.0 3.0 0 0.0 0.0 0.0H 4 1.4 45.0 1.2 0 0.0 0.0 0.0Total 278 3685.2 146 1254.9
Habitat/ Blanket bog Grassland
Standardised impact score
No. of 0.25 km squares %
Area of habitat (ha) %
No. of 0.25 km squares %
Area of habitat (ha) %
L 171 64.5 1095.4 49.8 28 54.9 107.5 57.0LM 76 28.7 914.8 41.6 21 41.2 76.3 40.4M 15 5.7 175.0 8.0 2 3.9 5.0 2.6LH 0 0.0 0.0 0.0 0 0.0 0.0 0.0MH 2 0.8 2.5 0.1 0 0.0 0.0 0.0H 1 0.4 10.0 0.5 0 0.0 0.0 0.0Total 265 2197.6 51 188.8
24

Table 15 Number of standardised impact scores for different habitats and extent of each habitat within 0.25 km squares for Seafield Estate within the Cairngorms Core Area
Habitat/ Dwarf-shrub heath Wind-clipped summit heath
Standardised impact score
No. of 0.25 km squares %
Area of habitat (ha) %
No. of 0.25 km squares %
Area of habitat (ha) %
L 6 25.0 107.5 27.0 1 100.0 6.3 100.0LM 6 25.0 104.3 26.2 0 0.0 0.0 0.0M 8 33.3 133.8 33.6 0 0.0 0.0 0.0LH 1 4.2 25.0 6.3 0 0.0 0.0 0.0MH 3 12.5 27.5 6.9 0 0.0 0.0 0.0H 0 0.0 0.0 0.0 0 0.0 0.0 0.0Total 24 398.0 1 6.3
Habitat/ Blanket bog Grassland
Standardised impact score
No. of 0.25 km squares %
Area of habitat (ha) %
No. of 0.25 km squares %
Area of habitat (ha) %
L 6 66.7 60.0 72.7 0 0.0 0.0 0.0LM 2 22.2 20.0 24.2 0 0.0 0.0 0.0M 0 0.0 0.0 0.0 2 66.7 7.5 37.5LH 0 0.0 0.0 0.0 0 0.0 0.0 0.0MH 1 11.1 2.5 3.0 1 33.3 12.5 62.5H 0 0.0 0.0 0.0 0 0.0 0.0 0.0Total 9 82.5 3 20.0
25

Table 16 Number of standardised impact scores for different habitats and extent of each habitat within 0.25 km squares for SNH estate within the Cairngorms Core Area
Habitat/ Dwarf-shrub heath Wind-clipped summit heath
Standardised impact score
No. of 0.25 km squares %
Area of habitat (ha) %
No. of 0.25 km squares %
Area of habitat (ha) %
L 79 76.7 1028.5 74.0 56 83.6 731.0 81.3LM 23 22.3 350.8 25.3 0 0.0 0.0 0.0M 0 0.0 0.0 0.0 0 0.0 0.0 0.0LH 1 1.0 9.7 0.7 11 16.4 168.0 18.7MH 0 0.0 0.0 0.0 0 0.0 0.0 0.0H 0 0.0 0.0 0.0 0 0.0 0.0 0.0Total 103 1388.9 67 899.0
Habitat/ Blanket bog Grassland
Standardised impact score
No. of 0.25 km squares %
Area of habitat (ha) %
No. of 0.25 km squares %
Area of habitat (ha) %
L 20 80.0 175.6 82.4 52 94.5 73.0 100.0LM 4 16.0 37.5 17.6 0 0.0 0.0 0.0M 1 4.0 0.0 0.0 1 1.8 0.0 0.0LH 0 0.0 0.0 0.0 2 3.6 0.0 0.0MH 0 0.0 0.0 0.0 0 0.0 0.0 0.0H 0 0.0 0.0 0.0 0 0.0 0.0 0.0Total 25 213.1 55 73.0
26

Table 17 Number of standardised impact scores for different habitats and extent of each habitat within 0.25 km squares for variousestates within the Cairngorms Core Area
Habitat/ Dwarf-shrub heath Wind-clipped summit heath
Standardised impact score
No. of 0.25 km squares %
Area of habitat (ha) %
No. of 0.25 km squares %
Area of habitat (ha) %
L 33 67.3 471.8 63.9 6 100.0 22.5 100.0LM 6 12.2 112.5 15.2 0 0.0 0.0 0.0M 3 6.1 72.5 9.8 0 0.0 0.0 0.0LH 2 4.1 34.6 4.7 0 0.0 0.0 0.0MH 2 4.1 46.3 6.3 0 0.0 0.0 0.0H 3 6.1 0.9 0.1 0 0.0 0.0 0.0Total 49 738.4 6 22.5
Habitat/ Blanket bog Grassland
Standardised impact score
No. of 0.25 km squares %
Area of habitat (ha) %
No. of 0.25 km squares %
Area of habitat (ha) %
L 13 100.0 70.0 100.0 3 50.0 8.8 31.9LM 0 0.0 0.0 0.0 0 0.0 0.0 0.0M 0 0.0 0.0 0.0 0 0.0 0.0 0.0LH 0 0.0 0.0 0.0 0 0.0 0.0 0.0MH 0 0.0 0.0 0.0 0 0.0 0.0 0.0H 0 0.0 0.0 0.0 3 50.0 18.7 68.1Total 13 70.0 6 27.4
27

Table 18 Interpretation of surveys of browsing/grazing and trampling impact
BROWSING/GRAZING AND TRAMPLING IMPACT CLASS HABITATLight Moderate Heavy
Dwarf shrub heath
Maximum structural development and microclimatic effects; diverse bryophyte and lichen flora; potential for woodland regeneration
Changes to heather structure, potential loss of heather cover and replacement by other dwarf shrubs; increase of grassland cover and species
Death of heather, loss of structural diversity, lack of flowering leading to reduced nectar, pollen, fruit and seed resources; trend towards replacement of dwarf-shrub by grassland cover
Wind-clippedsummit heath
High diversity of specialist high-altitude species; often with high cover of woolly-fringe moss (Racomitrium) and lichens; where appropriate dwarf-shrubs abundant
Loss of woolly-fringe moss, lichens and dwarf shrubs and increase in grass and herb cover
Blanket bog Maximum bryophyte and structural diversity; mix of heather, other dwarf-shrubs and sedges
Loss of bryophyte diversity, decrease in heather cover, increase in sedge cover and of non-bog species, some risk of erosion especially on slopes
Loss of structural diversity, damage to pools, widespread peat erosion, loss of heather, often dominance of sedges
Grassland Potential for dominance of a few vigorous species; loss of species diversity especially smaller herb species; potential for invasion by dwarf shrubs, scrub or trees
Maximum plant species diversity
Possible loss of herb species; risk of soil erosion on steep slopes; lower diversity of invertebrates
Grey shading = some damage under moderate impact, widespread damage under heavy impacts. No shading = existing habitat type likely to persist.
28

5 REFERENCES
Cairngorms Working Party (1993). Common Sense and Sustainability: A Partnership for the Cairngorms. Scottish Office, Edinburgh.
French, D. D., Miller, G. R. and Cummins, R. P. (1997). Recent development of high-altitude Pinus sylvestris scrub in the northern Cairngorm mountains, Scotland. Biological Conservation, 79, 133-144.
Gill, J. P. and Scott, L. (1996). Cairngorms Project Moorland and Montane Habitat Condition Assessment Final Report to SNH. Contract RASD/063/96 CNG. (Unpublished Scottish Natural Heritage report).
Gill, J. P., Sales, D. and Horsfield, D. (1998). Cairngorms Montane and Moorland Habitat Survey and Impact Assessment ESS Report to SNH. (Unpublished Scottish Natural Heritage report).
Henderson, D. J., Alfaro, P., Stolte, A. M., Waterhouse, E. C. and Nolan, A. J. (2000). Rapid Assessment of Grazing and Trampling Impacts on Upland Habitats for The West Sutherland Deer Management Group Area. Macaulay Research and Consultancy Services Ltd, Aberdeen. (Unpublished report).
MacDonald, A. (2007). Addendum to The Guide to Upland Habitats: Surveying Land Management Impacts. Scottish Natural Heritage. (Unpublished Scottish Natural Heritage report. Objective id B171658).
MacDonald, A. (2004). Upper Deeside site for assessment (of deer impacts). Scottish Natural Heritage. Advisory Services Memorandum, Edinburgh.
MacDonald, A., Stevens, P., Armstrong, H., Immirzi, P. and Reynolds, P. (1998a). A Guide to Upland Habitats Surveying Land Management Impacts Volume 1 Background Information and Guidance for Surveyors. Scottish Natural Heritage, Battleby.
MacDonald, A., Stevens, P., Armstrong, H., Immirzi, P. and Reynolds, P. (1998b). A Guide to Upland Habitats Surveying Land Management Impacts Volume 2 The Field Guide.Scottish Natural Heritage, Battleby.
McLeod, D. (2002). Geographical variation in the density of grazing mammals on montane sites in the Highlands of Scotland. Scottish Natural Heritage Commissioned ReportF99AC402A. (Unpublished report).
McConnell Associates (2001). Damaging Impacts of red deer (Cervus elaphus L.) on the Natural Heritage of Inverpolly and Inchnadamph. Scottish Natural Heritage Commissioned Report AC211/01/02/53. (Unpublished report).
Milne, J., Birch, C., Hester, A., Armstrong, H. and Robertson, A. (1998). The impact of vertebrate herbivores on the natural heritage of the Scottish uplands - a review. Battleby. Scottish Natural Heritage Review No. 95. SNH, Battleby.
Miller, G. R. and Cummins, R. P. (1982). Regeneration of Scots pine Pinus sylvestris at a natural tree-line in the Cairngorm mountains, Scotland. Holarctic Ecology, 5, 27-34.
29

Miller, G. R., Cummins, R. P. and Hester, A. J. (1998). Red deer and woodland regeneration in the Cairngorms. Scottish Forestry, 52(1), 14-20.
MLURI (1993). The Land Cover of Scotland 1988: Final Report. Macaulay Land Use Research Institute, Aberdeen.
Nolan, A. J., Gillick, T. H., Sellers, J. E., Malcolm, A. and Milne, J. A. (1996). Invercauld Estate: Habitat Assessment and Options for Future Management. Macaulay Land Use Research Institute, Aberdeen. (Unpublished report).
Pearce, I. S. K. (1997a). Moorland and Montane Habitat Condition Assessment: Cairngorms. Contract RASD/091A/97 CNG. (Unpublished Scottish Natural Heritage report).
Pearce, I. S. K. (1997b). Moorland and Montane Habitat Condition Assessment: Data Supplement for Cairngorms. Contract RASD/091A/97 CNG. (Unpublished Scottish Natural Heritage report).
Rae, S. (1995). Cairngorms Moorland and Montane Habitat Survey and Condition Assessment Carn Dearg, Geldie and Braemar Survey Areas. (Unpublished Scottish Natural Heritage report).
Rae, S. (1996). Cairngorms Project: Continuation of Moorland and Montane Habitat Survey and Condition Assessment South Geldie Area. (Unpublished Scottish Natural Heritage report).
Rae, S. (1997). Cairngorms Project: Montane and Moorland Habitat Survey and Condition Assessment Inchrory Area. Edinburgh. (Unpublished Scottish Natural Heritage report).
Scott, D., Mitchell, R. and Welch, D. (2001). Cairngorms monitoring: changes in utilisation and browsing impacts on heather at Glen Feshie since 1996. Edinburgh. Scottish Natural Heritage Commissioned Report F99AC407. (Unpublished report).
Scott, D., Welch, D. and Gornall, J. (1999). Calibration and status assessment of heather habitat condition classes in Glen Geldie. Contract R/AC4/BAT/99/47. (Unpublished Scottish Natural Heritage report).
Staines, B. W., Balharry, R. and Welch, D. (1995). The impact of red deer and their management on the natural heritage in the uplands. In Heaths and Moorland: Cultural Landscapes. (eds D. B. A. Thompson & M. B. Usher), pp. 294-305. SNH/HMSO, Edinburgh.
Stolte, A. M., Henderson, D. J. and Nolan, A. J. (1998). Assessment of Impacts on Upland Habitats for North-East and South-West sections of Cairngorm/Speyside Deer Management Group Area. Macaulay Land Use Research Institute, Aberdeen. (Unpublished report).
Stolte, A.M., Nolan, A.J., Henderson, D.J. and Horsfield, D. (1998). Overall impact of grazing and trampling, Cairngorm/Speyside Deer Management Group Area. A report for the Deer Commission for Scotland and Scottish Natural Heritage. Macaulay Land Use Research Institute, Aberdeen. (Unpublished report).
30

Thomson, J., Bryce, J., Scott, R. and Horsfield, D. (2006). Deer management. In The Nature of the Cairngorms: Diversity in a changing environment. (eds P. Shaw & D. B. A. Thompson), pp. 367-379. The Stationery Office, Edinburgh.
Watson, A. (1989). Land use, reduction of heather and natural tree regeneration on open upland. pp. 25-27. In ITE Annual Report 1988. HMSO, London.
Welch, D. and Scott, D. (1997). Calibration and Status of Assessment of Heather Habitat Condition Classes in Glen Feshie. Contract RASD/102/017 CNG. (Unpublished Scottish Natural Heritage report).
31

Figure 1 0.25 km square survey squares of the grazing and trampling impact survey in the Cairngorms Core Area
32

Figure 2 Map of major estates in the Cairngorms Core Area divided into 0.25 km squares
33

Figure 3 0.25 km squares with overall grazing/browsing and trampling impact scores for upland habitats in the Cairngorms Core Area
34

Figure 4 0.25 km squares with standardised browsing and trampling impact scores for dwarf-shrub heath in the Cairngorms Core Area
35

Figure 5 0.25 km squares with standardised grazing/browsing and trampling impact scores for wind-clipped summit heath in the Cairngorms Core Area
36

Figure 6 0.25 km squares with standardised grazing/browsing and trampling impact scores for blanket bog in the Cairngorms Core Area
37

Figure 7 0.25 km squares with standardised grazing and trampling impact scores for grassland in the Cairngorms Core Area
38

Figure 8 0.25 km squares with tree and scrub regeneration in the Cairngorms Core Area
39

Figure 9 0.25 km squares showing presence of deer species in the Cairngorms Core Area
40

Figure 10 0.25 km squares showing presence of sheep and cattle in the Cairngorms Core Area
41

Figure 11 0.25 km squares showing presence of mountain hare and rabbit in the Cairngorms Core Area
42

Figure 12 0.25 km squares showing presence of grouse species and ptarmigan in the Cairngorms Core Area
43

Figure 13 Light browsing impacts in dry dwarf-shrub heath showing tree regeneration (Scots pine and birch) on the northern slopes of the Kincardine Hills.
Figure 14 Light browsing impacts in dry dwarf-shrub heath with tree regeneration (Scots pine and birch) in the Pass of Ryvoan
44
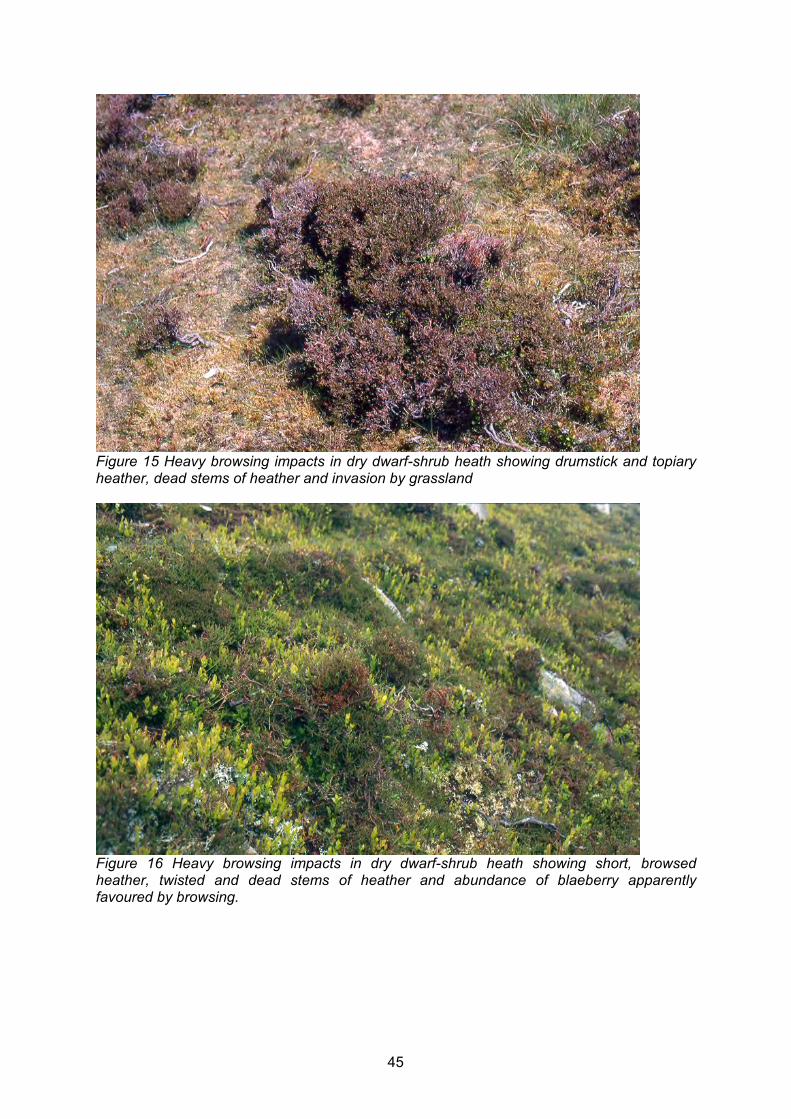
Figure 15 Heavy browsing impacts in dry dwarf-shrub heath showing drumstick and topiary heather, dead stems of heather and invasion by grassland
Figure 16 Heavy browsing impacts in dry dwarf-shrub heath showing short, browsed heather, twisted and dead stems of heather and abundance of blaeberry apparently favoured by browsing.
45

Figure 17 Moderate browsing impacts in dry dwarf-shrub heath showing rounded bushes of heather and patchy incursion of grassland.
Figure 18 Heavy browsing impacts in dry dwarf-shrub heath showing development of grassland and soil erosion on steep slopes.
46
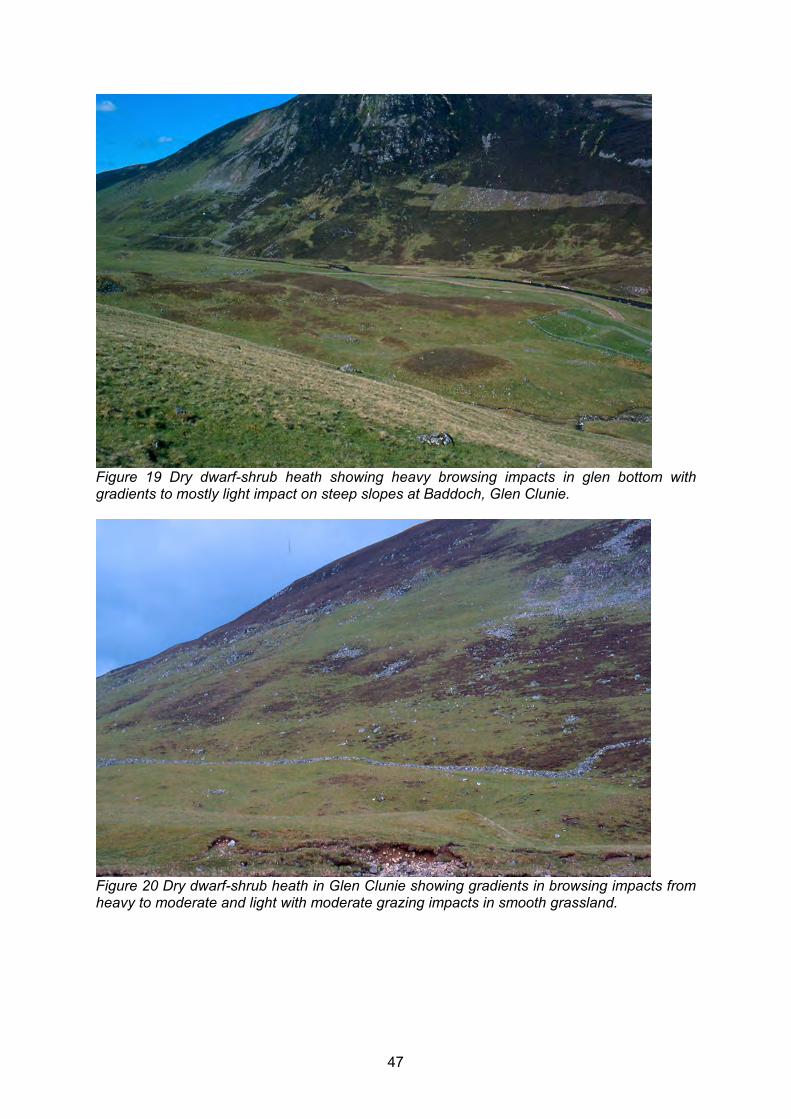
Figure 19 Dry dwarf-shrub heath showing heavy browsing impacts in glen bottom with gradients to mostly light impact on steep slopes at Baddoch, Glen Clunie.
Figure 20 Dry dwarf-shrub heath in Glen Clunie showing gradients in browsing impacts from heavy to moderate and light with moderate grazing impacts in smooth grassland.
47

Figure 21 Mixed heavy, moderate and light browsing impacts on dwarf-shrub heath in Glen Clunie and showing patchy development of grassland.
Figure 22 Red deer tracks crossing dry dwarf-shrub heath showing localised heavy and moderate browsing impacts.
48

Figure 23 Moderate trampling damage in Calluna-Eriophorum blanket bog showing widespread but patchy bare peat.
Figure 24 Light grazing in tussock grassland dominated by mat-grass (Nardus stricta),showing the development of a tall, dense sward.
49

APPENDIX 1 Habitats assessed
Dwarf-shrub heath Dwarf-shrub heath includes both dry heaths and wet heaths. Dry heaths are dominated solely by dwarf-shrubs. The main dominant of dry dwarf-shrub heath in the Cairngorms is heather (Calluna vulgaris), often mixed with blaeberry (Vaccinium myrtillus) while bell-heather (Erica cinerea) and crowberry (Empetrum nigrum) are more locally abundant. Wet heaths are dominated typically by dwarf-shrubs, usually heather and cross-leaved heath (Erica tetralix) mixed with sedges and grasses usually deer-grass (Trichophorum cespitosum) and purple moor-grass (Molinia caerulea).
All tall dwarf-shrub heath with upright growth forms is included. Therefore, all sub-montane or sub-alpine and forest-zone heath is included, while tall Calluna-dominated montane or alpine heaths are also included. Roughly, these heaths extend up to around an altitude of 850 m in the Cairngorms. Dry heath is the predominant vegetation on steep slopes while wet heath occupies shallow slopes which are generally too steep or too well-drained for blanket bog formation.
Wind-clipped summit heath This habitat includes vegetation of exposed ridges, cols, summits and the high plateaux of the Cairngorms. A wide range of montane or alpine dwarf-shrub heaths, moss-, sedge- and rush- heaths are included as follows:
1. prostrate dwarf-shrub heaths which are usually rich in lichens in the Cairngorms (dominated by either heather, blaeberry or crowberry or mixtures of these);
2. stiff-sedge – woolly-fringe moss-heath (Carex bigelowii-Racomitrium lanuginosummoss-heaths);
3. stiff-sedge and three-leaved rush (Juncus trifidus) heaths of the higher summits and plateaux.
Roughly, these habitats extend from an altitude of 750m up on to the highest ground in the Cairngorms. Prostrate heather heath can occur down to 600 m in exposed places.
Blanket bogBlanket bog is ombrogenous (rain fed) bog dominated by mixtures of heather and cotton-grasses (Eriophorum vaginatum and E. angustifolium), with cross-leaved heath, deer-grass, flying bent and usually with an abundance of bog-mosses (Sphagnum spp.). They are differentiated from wet heath by the abundance of single-headed cotton grass (E.vaginatum) and hummock-forming bog mosses such as S. capillifolium, S. papillosum and S. magellanicum. Blanket bogs are characterised by a structural patterning of hummocks and hollows, which sometimes includes bog-pools.
These bogs develop on deep peat; generally over 2 m in depth, but can occur on shallower peat of about 0.5 m in depth.
Grasslands (smooth and tussock)Two types of grassland, smooth and tussock are included. The smooth grasslands are the bent – sheep’s fescue (Agrostis-Festuca) grasslands of richer soils and include both species-poor and species-rich types. Tussock grasslands include grassland dominated by mat-grass (Nardus stricta) and heath-rush (Juncus squarrosus), which are usually developed on highly acidic soils and are species-poor.
These are grasslands of the sub-alpine and forest zones. They are only locally extensive in the Cairngorms, often occurring where there has been disturbance such as on debris fans,
50

on alluvial soils or on the richer rocks e.g. at Inchrory and in Glen Feshie and where heavy grazing has favoured grassland. Also included are snow-bed mat-grass grasslands of the montane or alpine zone, which are extensive above about 650 m.
Habitats with scattered trees These were assessed for impacts using the appropriate open habitat sections such as that for dwarf-shrub heath or grassland.
51

APPENDIX 2 Field Record Sheet for 1997 Habitat Condition Assessments SCOTTISH NATURAL HERITAGE Cairngorms ProjectMoorland and montane habitat condition assessment Field record sheet for 0.25 km2 survey units
Estate name: 1 km 2 grid reference: Date:0.25 km2:
Locality name: Surveyor:Management unit:Habitats Condition category Habitats Cond't categoryProportion >50% 25<50% 10<25% Proportion >50% 25<50% 10<25%Dwarf-shrub heath (sub-montane) Wind-clipped heath (montane) Calluna vulgaris heath Calluna-Cladonia(H10, H12, H16, H21, H22b) arbuscula heath (H13)Vaccinium myrtillus heath Vaccinium myrtillus-(H18, H22a) Cladonia arbuscula heath (H19)Wet heath (M15, M16) Vaccinium myrtillus-
R. lanuginosum heath (H20)Summary score Carex bigelowii-Racomitrium
lanuginosum moss-heath (U10)Grassland (montane and sub-montane) Carex bigelowii-PolytrichumAgrostis-Festuca alpinum grass-heath (U8)grassland (U4) Juncus trifidus-RacomitriumNardus-Festuca lanuginosum sedge-heath (U9)grassland (U5) Summary scoreJuncus squarrosusgrassland (U6) Blanket bogNardus stricta-Carex M17, M18, M19bigelowii grass-heath (U7)Deschampsia cespitosa- Additional habitats (NVC type)Galium saxatile grassland (U13)Summary score
Browsing/grazing impact category codes: Heavy: H Moderate: M Light: LProportion %: Dry heath Grass'd Wind-clipped heath Blanket bog Wet heathLand-use, management and tree/scrub regenerationGrazers: S D Burns:Deer Large patch >5ha Age(Red and Roe) (>100m wide)Sheep Medium 2 - 5ha Age
Cattle Small patch <2ha Age(<50m wide)
Rabbits U uncontrolled, C controlled, I intense, M moderate, L light. O old (6-10 years), R recent (<6 years)
Hares Hill drains: Stock feeding points:(Mt or B = brown) Active InactiveGrouse Erosion: 1-20/ha >20/ha (or give no.)Bl'k grouse Sheep/deer scars Sheet erosionPtarmigan 1 - 5% >5% 1-10/ha >10/ha
Bare peat GulliesOtherS: sighting D: dung Burrows (specify species) Active Other erosionTree/scrub reg'n:
<10/ha 10-100/ha >100/ha Browsed Unbrowsed <10/ha 10-100/ha>100/ha Browsed UnbrowsedScots pine Willow
Birch Juniper
Rowan Other
No. dung pettet groups (50m X 2m plots)A dung pellet group is an aggregation of more than 6 individual dung pellets
Target notes
52

APPENDIX 2 (cont.)DWARF-SHRUB HEATH AND SMOOTH GRASSLANDSite name: 1 km2 grid ref.: 0.25 km square: NW NE Date:
SW SE
GRAZING AND TRAMPLING FIELD INDICATORS Grazing/browsing impact
Dwarf-shrub heath (H10, H12, H16, H18, H21, H22, M15, M16)
Severe (additional indicators) Heavy Moderate Light
% of vigorous heather or blaeberry shoots browsed (figs in brackets where shoot growth <4 cm)
>80% long shoots browsed >66% (>33%) 33-66% (16-33%) <33% (<16%)
Summer browsing of heather Easy to find Negligible NegligibleBrowsing of cross-leaved heath, cowberry, bearberry & crowberry Some None None
Stem and branch breakage of heather by large herbivores
Widespread throughout the stand Conspicuous Inconspicuous Inconspicuous
Breadth of heavily browsed shrubs at interface with grassland
Very obviously heavily browsed throughout Broad (>10 m) Narrow (1-10 m)
Very narrow or absent (<1 m)
Dwarf-shrub seedlings uprooted in burnt areas Conspicuous Not conspicuous Little or noneFlowering and fruiting of heather or blaeberry Sparse Patchy AbundantAmount of bare, trampled ground Widespread Frequent Little or none Little or none
Amount of herbivore dung present (sheep and/or deer) V. conspicuous. Easy to findDifficult to find or absent
Trend indicators Chronic severe Chronic heavy I >ImpactChronic moderate D <Impact Chronic light
Presence/development of grazing-induced growth forms of Calluna/Vaccinium
1) presence of drumstick, topiary or carpet Almost everywhere Widespread Localised Very few or none2) older growth contorted, recent growth less contorted Yes (Fre)3) scattered, variably developed growth forms YesUpper canopy stripped of upright shoots ("tattered") with upright bush structure YesDwarf-shrubs short (<10cm), shorter and of lower ground cover than graminoids YesDwarf-shrubs mod. tall (>10cm), starting to overtop graminoids, variable cover YesSheep scars Actively eroding => Yes Yes <= RevegetatingSmooth grassland (U1, U2, U4, CG10...CG14 inc.) Heavy Moderate LightLeaves grazed of grasses (Agrostis canina, Festuca ovina/vivipara ) >66% 33-66% <33%Grazing of leaves of Ag cap, An od, Dan dec, D flex., F rubra etc. Nearly all >50% <50%Moss cover (particularly "feather" mosses) >50% cover <50% cover Not conspicuousSward height Mostly <3 cm Mostly 3-6 cm Mostly 6-9 cmFlowering of grasses and forbs >3 cm tall Sparse/none Scattered AbundantAccumulation of dead plant litter in the sward <1 cm deep 1-3 cm deep >3 cm deepBare ground not caused by moles, slippages or rock falls Frequent >20 ha-1 Scarce/absentBare ground with surface disturbed by hoof marks Widespread None None
Herbivore dung, sheep and/or deer (no. of pellet groups/100m2) Abundant (>30)Mod. abundant (10-30)
Little or none (<10)
Trend indicators Chronic heavy I >ImpactChronic moderate D <Impact Chronic light
Grazing impact assessment by sward ht. < or > by grazing of leaves < >
Flowering and height of potential tall herbs: 1) Dwarfed v. well developed Yes (dwarfed)Yes (well developed)
2) Not dwarfed but leaves and flowers grazed or dwarfed but flowering and little/no sign grazed Yes (grazed)
Yes (little or no grazing)
Cover of small, rosette, creeping or mat species (<>grass cover) High (>grass) Low (<grass)Tree and shrub saplings present and sward short Yes
53

APPENDIX 2 (cont.)TUSSOCK GRASSLAND, WIND-CLIPPED HEATHS AND BLANKET BOGSite name: 1 km2 grid ref.: 0.25 km square: NW NE Date:
SW SEGRAZING AND TRAMPLING FIELD INDICATORSTussock grassland (U5, U6, U7) Heavy Moderate LightSigns of grazing of Nardus tussocks (sheep/deer) Present Virtually none Virtuallly noneLeaves grazed of grasses (Agrostis canina, Festuca ovina/vivipara ) >66% 33-66% <33%Grazing of leaves of Ag cap, An od, Dan dec, D flex., F rubra etc. Nearly all >50% <50%Average inter-tussock sward height <3 cm 3-6 cm >6 cm
Flowering of associated inter-tussock herbs Sparse/noneMajority not flowering Abundant
Seedlings and saplings of trees & shrubs > 5 cm high Absent Absent PresentCover of Polytrichum commune and feather mosses High Present PresentDead plant litter Thin mat <3 cm Mat 3-6 cm Deep >6 cmAmount of bare ground: surface disturbed by hoof marks Widespread None or sparse None or sparse
Sheep scars Frequent (>20ha-1)Very localised (<20ha-1) Scarce or absent
Trend indicators Chronic heavy I >ImpactChronic moderate D <Impact Chronic light
Grazing impact assessment by sward ht. < or > by grazing of lvs/flws < >
Flowering and height of potential tall herbs: 1) Dwarfed v. well developed Yes (dwarfed)Yes (well developed)
2) Not dwarfed but leaves and flowers grazed v. dwarfed but flowering and little/no sign grazed Yes (grazed)
Yes (little or no grazing)
J. squ and small, rosette and mat herbs v. grasses and mosses abundantJ. squ /mat herbs major component =>
These being overgrown Low cover
Cover of mosses (Polytrichum commune and feather mosses) with other indicators suggesting light or mod. grazing High coverTree and shrub sapling present and inter-tussock sward short YesWind-clipped heaths (H13, H14, H19, H20, U9, U10) Severe Heavy LightGrazing of leaves of J trif , C bige , Des flex and Festuca spp >30% >10% <10%Browsing of any dwarf-shrubs present Noticeable NegligibleGrazing of leaves of broad-leaved Agrostis, Anthoxanthum, Poa spp. Majority InfrequentPatches of bare ground about 10cm across (in sheltered areas) Extensive Present Very littleHerbivore dung, sheep and/or deer (no. of pellet groups/100m2, minimum of 5 counts in each kind of heath/0.25km2)
>10 (>15 sheep only) >3 (>5 sheep only)
<3 (<5 sheep only)
Trend indicators Chronic severe Chronic heavy I >Impact D <Impact Chronic lightTotal cover of Galium saxatile, Potentilla erecta and fescues and wavy-hair grass >30%
>10% (>20% on lime-rich soils)
<10% (<20% on lime-rich soils)
Total cover of broad-leaved Agrostis, Anthoxanthum, Poa spp. Frequent >negligible NegligibleIndicators as for the two above AND other indicators suggest heavy or light usage Heavy LightBlanket bog (M17, M18, M19) Severe Heavy Moderate LightBrowsing on heather or blaeberry Extensive Easy to find Easy to find Difficult to findSee also Dwarf-shrub heath indicatorsBrowsing on Arcto uva-ursi , Emp nigrum , Erica tet & Vac vitis-idaea Some None None
Browsing on Myrica gale ExtensiveConspicuous and easy to find
Some - easy tofind but notconspicuous
Absent or difficult to find
Browsing of Betula nana Majority browsed Majority browsedMajority not browsed
Amount of flower or fruit on Rubus chamaemorus during season None Majority none Majority withCotton-grass (Eriophorum spp.) flowers during season Virtually none Little or none Patchy AbundantSphagnum and/or lichen cover Absent/patchy Patchy Abundant
Cover of "feather" mossesThin mats <<5cm deep Mats <10 cm deep
Mats >10cm deep
Trampling and grazing of pool systems and water tracks inc. Sphagnum Obviously trampledNo trampling, Intact
Trampling of Sphagnum moss hummocks and lawns Most trampled Minority trampled Most intact
Abundance of deer/sheep hoof prints in bare peatVirtually everywhere Extensive Patchy
Absent/ Inconspicuous
Herbivore dung: sheep and/or deer Easy to find Easy to find Rare/absent
Trend indicators Chronic heavy I >ImpactChronic moderate D <Impact Chronic light
Upper Calluna canopy stripped of upright shoots with a "tattered", open, upright canopy Yes
54

APPENDIX 3 Data file for the project An Excel spreadsheet with the data for the project is available on SNH’s eRDMS (Cairngorms Grazing and Trampling Impact Assessments 1995 2000 Summary Data, objective id A244877). The following gives a description of each of the fields:
ID1This field gives a reference number for each of the 3922 records holding data relating to a 0.25 km square.
GRID REF This field gives a 6-figure grid reference to the 1 km square and the quarter square is given by the compass bearings NW, NE, SE and SW.
SURVEYOR This is the name of the surveyor, or organisation that carried out the field survey.
ESTATE NAME Names of all the estates represented within each of the 0.25 km squares. These data were derived from the SNH GIS database.
ESTATE NAME (>50% 0.25 KM SQUARE) Names of the estates represented within each of the 0.25 km squares and occupying >50% of the area of the square.
YEARThis is year of survey.
GRID REF4 This field gives the grid reference for the mid point of the 0.25 km square.
X_COOR1 X coordinate of each 0.25 km square.
Y_COOR1Y coordinate of each 0.25 km square.
STANDARDISED IMPACT SCORE DWARF-SHRUB HEATH (and other habitats) Grazing/browsing and trampling impact score standardised to one of six scores: L – light, LM – light to moderate, M – moderate, MH – moderate to heavy, H – heavy and for wind-clipped heath only LH –light to heavy.
OVERALL IMPACT SCORE This is a summary impact score for a 0.25 km square giving priority to the score for the most sensitive habitat scored within the square. Due to the method of conversion from the field data they may not correspond to the standardised scores.
AREA OF DWARF-SHRUB HEATH (HA) (and other habitats) This is the area of the habitat within the 0.25 km square.
DEER, STOCK, LAGOMORPHS, GROUSE and PTARMIGAN This is presence of different species within each 0.25 km square.
55

TREE REGENERATION Presence of tree regeneration within each 0.25 km square (browsed and unbrowsed saplings).
56

Scottish Natural Heritage is a government body responsible to the Scottish Government.
Statement of principles:
Scottish Natural Heritage – the governmentbody that looks after all of Scotland’s nature andlandscapes, across all of Scotland, for everyone.Our 5 strategic priorities are:
– Caring for Scotland’s nature and landscapes– Helping to address climate change– Delivering health and well being– Supporting the Scottish economy– Delivering a high quality public service
Find out more at www.snh.org.uk
Policy and Advice Directorate, Great Glen House, Leachkin Road, Inverness IV3 8NWwww.snh.org.uk