scraping marking behaviour of the largest neotropical felids · rubio3, luciano m. verdade 4, rocio...
TRANSCRIPT
Submitted 21 February 2018Accepted 25 May 2018Published 19 June 2018
Corresponding authorFrancisco Palomares,[email protected]
Academic editorDavid Roberts
Additional Information andDeclarations can be found onpage 21
DOI 10.7717/peerj.4983
Copyright2018 Palomares et al.
Distributed underCreative Commons CC-BY 4.0
OPEN ACCESS
Scraping marking behaviour of thelargest Neotropical felidsFrancisco Palomares1, Noa González-Borrajo1, Cuauhtémoc Chávez2, YamelRubio3, Luciano M. Verdade4, Rocio Monsa4, Bart Harmsen5, Begoña Adrados1
and Marina Zanin6
1Department of Conservation Biology, Estación Biológica de Doñana, CSIC, Seville, Seville, España2Universidad Autónoma Metropolitana-Unidad Lerma, Lerma, Estado de México, Mexico3 Escuela de Biología, Universidad Autónoma de Sinaloa, Sinaloa, Mexico4Núcleo Laboratorial de Ecologia Evolutiva Aplicada, Universidade de São Paulo, CENA, Piracicaba,Sao Paulo, Brazil
5Panthera, New York, United States of America6Departamento de Biologia, Universidade Federal do Espírito Santo, Vitória, Espírito Santo, Brazil
ABSTRACTBackground. Details of how, why and in what conditions large felids make scrapesis unknown. Here, we examined the general hypothesis about the use of scrapes formarking proposals, as well as to communicate with other individuals to signalizeparticular points or areas of interest, by studying scrape-marking behaviour of jaguarsand pumas.Methods. We surveyed by scrapes between five days and two months mainly duringdry season in five study areas from Mexico (El Edén and San Ignacio), Belize(Cockscomb) and Brazil (Angatuba and Serra das Almas), which differed in presenceand/or abundance of jaguars and pumas. Paths were slowly walked while searchingfor scrapes by teams normally composed of two people and tracks were stored in GPS,distinguishing the type of path surveyed (unpaved track roads, trails and cross-country).Results. We found a total of 269 felid scrapes along 467 km of paths surveyed, obtaininga finding rate of 0.576 scrapes per km. Most scrapes were found in car tracks (0.629scrapes per km), followed by trails (0.581 scrapes per km), and rarely did we findscrapes in cross country (0.094 scrapes per km). In trails, scrapes were found in a similarfrequency in the centre and edge, whereas in car tracks they were mainly found in theedge. There were also clear differences in the position of the scrapes between study areasthat differed in presence and/or abundance of pumas and jaguars, with scrapes locatedmainly in the centre in areas only with pumas, in the centre and in the edge in areaswith a similar number of jaguars and pumas, and in the edge in area mainly dominatedby jaguars. The remarking rate tended to be higher in one of the areas with only pumaswhere natural vegetation was scarcer. Felids chose sites mainly covered by leaves andlocated in paths less wide, clean and rarely used.Discussion. Scrapingwas a frequent behaviour in the largest felids of America, althoughin some areas, scraping behaviour was rare. Scrapes seem to be signalizing some specificareas within territories and data suggest that they are made with the proposal ofcommunication between individuals. It seems that a high scraping behaviour in pumasis not related to the presence of jaguars.
How to cite this article Palomares et al. (2018), Scraping marking behaviour of the largest Neotropical felids. PeerJ 6:e4983; DOI10.7717/peerj.4983

Subjects EcologyKeywords Felids, Marking behaviour, Neotropic, Jaguar, Puma, Scraping behaviour
INTRODUCTIONCommunication plays an important role in mammalian populations and communities,providing, for instance, information about the presence, identity, health or social status ofindividuals of the same or different species, or location of feeding places within territoriesand their limits (Johnson, 1973; Mellen, 1993; Gosling & Roberts, 2001). Mammals usevisual, tactile, vocal or olfactory signals to communicate to each other or to signalize thearea (Reiger, 1979; MacDonald, 1980; Gorman & Trowbridge, 1989), and particularly incarnivore mammals, scent marking using urine, secretions, ground scratching, rubbing, orfaeces has been well-documented (Asa, Mech & Seal, 1985; Smith, McDougal & Miquelle,1989; Barja, De Miguel & Bárcena, 2005). Solitary carnivores have spatially dispersedpopulations and indirect scent-marking signals are the most frequently via of intraspecificand interspecific communication. Among the types of indirect marking signals, scratchespresent the characteristics of functioning both as visual and olfactory signals, since theground is removed and odour is added from the paw glands (Schaller, 1972; Peters & Mech,1975; Bekoff, 1979).
Scraping or scratching on the ground is a known behaviour in large felids (Emmons,1987; Jackson & Ahlborn, 1988; Ghoddousi et al., 2008). However, detailed descriptionof this marking behaviour, how and in what conditions felids make scrapes, and theintention behind felid scraping behaviour, are largely unknown and untested in mostspecies and situations (but see Smith, McDougal & Miquelle, 1989; Harmsen et al., 2010a;Allen, Wittmer & Wilmers, 2014). Scrapes are depressions in the ground made by felidswith their hind legs, moving back the dirt and making a pile of it at the end of the scrape(Smith, McDougal & Miquelle, 1989;Harmsen et al., 2010a; Logan & Sweanor, 2010; Fig. 1),although in occasions the front leg may also be used (Harmsen et al., 2010a).
Scrapes seem to be regularly created along territorial boundaries or prominent travel-ways (Seidensticker et al., 1973; Logan & Sweanor, 2010; Harmsen et al., 2010a). At least inpumas, most scrapes are thought to be made primarily by mature males and less often ornot at all by mature females or inmature individuals (Logan & Sweanor, 2010; Harmsenet al., 2010a; Allen, Wittmer & Wilmers, 2014). Harmsen et al. (2010a) specifically studiedscrape-marking behaviour in jaguars and pumas in one area of Central America, and foundthat both species scrape, although scrapes were spatially clustered along trails and malepumas scraped more often. Moreover, the scrapes tended to be larger in jaguars than inpumas, although not enough to be distinguished only by size.
Here, we studied scrapes and the scrape-marking behaviour of jaguars and pumas inseveral ecologically different areas of the Neotropic. We chose for surveys areas with onlypumas and other areas with the presence of both species but with different densities of eachfelid in order to be able to ascertain a possible interaction between the scrapes morphologyand scrape-marking behaviour and the sympatry between both species. We specificallyaimed first to describe how scrapes are, and the characteristic of the places where, scrapes
Palomares et al. (2018), PeerJ, DOI 10.7717/peerj.4983 2/25

Figure 1 Types of large felid scrapes. Examples of scrapes with different sizes and on different substrates.(A–C) are puma scrapes from Angatuba and the other ones could be from pumas or jaguars, although (D)and (F) could be from jaguars since they are much longer than wider and no marks from the two legs areobserved (see text for details). Mark of claws of both legs (even back leg foot tracks) are clearly appreciatedin (A) and (E) scrapes. The pile of dirt on the end of the scrape is marked in all cases, and in (A) and (B)length and width were measures indicated as well (note than (B) is one case where length and width wassimilar). Photos by Francisco Palomares.
Full-size DOI: 10.7717/peerj.4983/fig-1
Palomares et al. (2018), PeerJ, DOI 10.7717/peerj.4983 3/25

are found, examining if there are differences in scrapes and the scraping behaviour betweenareas differing in presence and density of both felids. Secondly, we examined the generalhypothesis about both felids species using scrapes for marking proposals, as well as tocommunicate with other individuals and to signalize particular points or areas of interest.If so, we expect (1) they will select specific points with particular characteristics whichwould facilitate other individuals detecting them, (2) the area around the point wouldpresent some distinctive general habitat characteristics in relation to other parts of thestudy area, and (3) scrapes will not be evenly distributed in space and will be concentratedin some given points where re-scraping will be frequent.
MATERIAL & METHODSStudy areasWe carried out the study mainly in five areas (Fig. 2): (1) two zones around San Ignaciomunicipality (México), (2) El Edén Ecological Reserve (México), (3) Cockscomb BasinForest Reserve (Belize), (4) three sites at Angatuba municipality (Brazil), and (5) the Serradas Almas Private Reserve of Natural Heritage (Brazil). The surveyed areas in San Ignacio(23◦31′ and 24◦26′N, 105◦44′ and 106◦44′W) have sandy and clay soils, and are dominatedby deciduous and semideciduous tropical forest with some areas of dry tropical forest(Rubio, Bárcenas & Beltrán, 2010). El Edén (21◦130′N, 87◦110′W), located in the State ofQuintana Roo, México, mainly has rocky soils and includes a great variety of ecosystems,mainly formed by semideciduous dry tall tropical forest dominated by trees (up to 25 m),and tropical short forest (up to 12 m) in the lower part, which usually floods during therainy season, savanna-like vegetation with some palm trees also floods during the rainyseason, and secondary regeneration plant communities located in formerly agricultural orcattle areas (Torres-Barragán et al., 2004). Cockscomb (16◦47′N, 88◦37′W) has sandy andclay soils and was heavily logged until the 1980s; in 1990 it was declared a wildlife sanctuary.Thus, the vegetation of Cocskomb is composed mainly of well-developed secondary, moist,broadleaf tropical forest at several stages of succession (Harmsen et al., 2010a; Rabinowitz& Nottingham, 1986). Angatuba is located in the south-central region of São Paulo state,and surveys were carried out in two adjacent ranches (Três Lagoas, 23◦22′S, 48◦28′W,and Arca, 23◦20′S, 48◦27′W), and in the Angatuba Ecological Station (23◦24′S, 48◦21′W),located 9 km from the ranches. Angatuba has sandy soils, a humid subtropical climate,is situated in the transitional region between the Atlantic Forest and Cerrado biomes,and some patches of autochthonous (Cerrado and Atlantic Forest) vegetation remain(Athayde et al., 2015), although most of the area in the ranches, and in lesser extensionin the Ecological Station, has been forested with eucalyptus and pine plantations. Serradas Almas is a private protected area located at the Ceará State in the Brazilian Caatingabiome (5◦8′29.15′′S; 40◦54′58.60′′W). Three main phytophysiognomies of Caatinga biomeare found in this reserve: seasonal and dense shrub vegetation, seasonal deciduous thornforest, and montane seasonal deciduous forest (Araújo & Martins, 1999; Lima et al., 2009).
Pumas were the only large felid species present in Serra das Almas andAngatuba, whereasboth species, pumas and jaguars, were present in the other three study areas, although in
Palomares et al. (2018), PeerJ, DOI 10.7717/peerj.4983 4/25
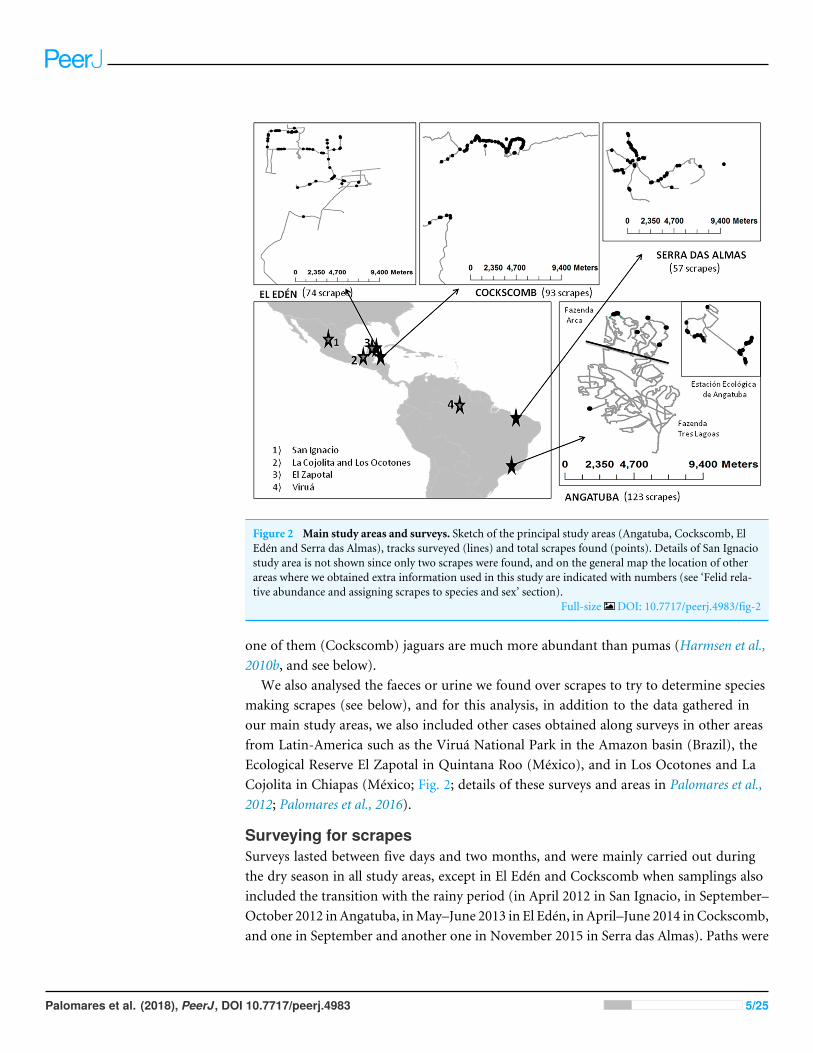
Figure 2 Main study areas and surveys. Sketch of the principal study areas (Angatuba, Cockscomb, ElEdén and Serra das Almas), tracks surveyed (lines) and total scrapes found (points). Details of San Ignaciostudy area is not shown since only two scrapes were found, and on the general map the location of otherareas where we obtained extra information used in this study are indicated with numbers (see ‘Felid rela-tive abundance and assigning scrapes to species and sex’ section).
Full-size DOI: 10.7717/peerj.4983/fig-2
one of them (Cockscomb) jaguars are much more abundant than pumas (Harmsen et al.,2010b, and see below).
We also analysed the faeces or urine we found over scrapes to try to determine speciesmaking scrapes (see below), and for this analysis, in addition to the data gathered inour main study areas, we also included other cases obtained along surveys in other areasfrom Latin-America such as the Viruá National Park in the Amazon basin (Brazil), theEcological Reserve El Zapotal in Quintana Roo (México), and in Los Ocotones and LaCojolita in Chiapas (México; Fig. 2; details of these surveys and areas in Palomares et al.,2012; Palomares et al., 2016).
Surveying for scrapesSurveys lasted between five days and two months, and were mainly carried out duringthe dry season in all study areas, except in El Edén and Cockscomb when samplings alsoincluded the transition with the rainy period (in April 2012 in San Ignacio, in September–October 2012 inAngatuba, inMay–June 2013 in El Edén, in April–June 2014 inCockscomb,and one in September and another one in November 2015 in Serra das Almas). Paths were
Palomares et al. (2018), PeerJ, DOI 10.7717/peerj.4983 5/25

only surveyed once except in Serra das Almas, which was sampled twice as mentioned).Nevertheless, in El Edén and Cockscomb, we also recorded opportunistically some otherscrapes after the first survey since we continued with other activities, which were notconsidered by estimating finding rates, but they were considered for estimating scrapessize, position in the paths, or re-scraping rate in order to not lose biological information.All paths were slowly walked (about 2–3 km per hour) while searching for scrapes byteams normally composed of two people and tracks stored in GPS, distinguishing the typeof path surveyed (unpaved track roads, trails and cross-country). We took attention inlooking for scrapes within path limits and in their borders, so when we detected felid tracksleaving the paths we tracked them when possible outside of the path in order to detectadditional scrapes outside from it. This was particularly possible in the study areas withsandy substrates such as Angatuba and Serra das Almas.
Most times a scrape was found, their position was recorded with a GPS, along otherassociated information such as position in the path (centre, wheel tracks, border, outsideand faraway; see below), type of substrate (ground or rock), cover of substrate (clean, grass,woody material, leaves), type, height and cover of vegetation around (in a 25 m diametercircle centred in the scrape), the use of the path by people (habitual, rare or abandoned),and if the path had any kind of maintenance or not. We did not record if scrapes had singleor double rakings as described by Harmsen et al. 2010a (Fig. 1). Scrapes were consideredto be in: (1) centre when situated in the space between the wheel tracks for the case ofunpaved track roads, or within the walkable part in the case of trails; (2) wheel tracks whenjust in the tracks left for wheels for the case of unpaved road; (3) border, outside or farawaywhen it was up to 1 m, between 1–5 m, and >5 m outside of the workable part of trails orfrom the wheel tracks of unpaved roads.
Additionally, when scrapes were relatively recent and, therefore, size was clearly defined,their length (without the pile of dirt accumulated in the back of scrape) and width weremeasured (Fig. 1). Scrape length was taken at the direction in which the scrape was madeby the felids, which could most times easily be distinguished by tracts left by the fingers ofanimals, and if not by the accumulated dirt on one of the extremes (Fig. 1).
Sampling inBrazil was carried out under licenses no. 11214 andno. 13781 of ICMBio, andno 131/2005 CGFAU/LIC, 13883-1 SISBIO and 15664-1 SISBIO of the Instituto Brasileirodo Meio Ambiente—IBAMA, and at the Mexican sites under the licence SGPA/DGVS/549of the Dirección General de Vida Silvestre (Semarnat). Sampling in Belize and posteriorexportation of the faeces was approved by the Forest Department of Belize with theRef. No. CD/60/3/14 (25). Faecal samples were exported from Brazil to Spain for geneticanalysis under IBAMA/CGENAutorizacão de Acesso licence no 063/05 and IBAMA/CITESexport licences no 0123242BR, 08BR002056/DF and 09BR003006/DF, and from Mexicoto Spain under the export licences no MX33790 and MX42916 of the Secretaria de MedioAmbiente/CITES.
Selection of scraping sitesWe examined if there was any kind of selection of the points used for scraping at twodifferent scales. First, we tested the selection at the microsite scale of the scrape (i.e.,
Palomares et al. (2018), PeerJ, DOI 10.7717/peerj.4983 6/25

substrate type and ground cover), in a plot of 1× 1 m side situated around the scrape, andcompared it with another 1 × 1 m plot situated just 5 m further on the same path walked.The distance of 5 m was arbitrarily chosen on the basis of being far enough to presenta random sampling of the characteristics of the ground in the path, but close enoughto be sure conditions of the path were similar. Within each 1 m plot we estimated thepercentage of clean ground or ground covered by grass, leaves, rocks, or woody material.Second, we looked if the path and vegetation characteristics of the scrapes presentedany particular features (path use, width and maintenance, and vegetation height, coverand type). These data were compared with their availability in the study area, which wasobtained by sampling these same variables every 500 m on the paths surveyed for scrapes.The vegetation types considered for each study area were Atlantic Forest, Cerrado, andplantations (eucalypt and pine altogether) in Angatuba; savannas, tall forest, short forestand secondary forest (regeneration forest) in El Edén; and tall forest and secondary forestin Cockscomb. In many occasions the paths were located just in the joint border of twovegetation types, so we independently recorded vegetation in each side of the path, andconsidered it as edge for analysis. Vegetation characteristics were measured in a 25 mdiameter circle centred in the scrape.
Felid relative abundance and assigning scrapes to species and sexWe got an index of jaguar and puma relative abundance (ratio jaguar/puma faeces) in eachstudy area by collecting faeces in the same tracks where scrapes were recorded.
On the other hand, when we found faeces or urine over scrapes we collected a piece ofthe faeces or the leaves with urine in order to identify the species and the sex of individualthat deposited them.
Faeces and urine were analyzed by non-invasive molecular techniques previouslydeveloped in our lab (see Roques et al., 2011; Roques et al., 2014 for further details).Although we cannot be sure the faeces or urine found over scrapes necessarily had tocome from the species and individuals who made the scrape, we considered it relevantto include this information. As mentioned previously in the Study Area section, for thisanalysis, in addition to the data gathered in our main study areas, we also included othercases obtained along surveys in other areas from Latin-America or in other samplings ofthe same areas.
Data analysisWe could not get all measures and variables for all study areas, so for each analysis wewill indicate for which areas data were available. Similarly, since there were many differenttypes of data and comparisons, the statistical analysis performed will be mentioned in theappropriate part of the result section.
Linear distribution of scrapes on paths was described by determining first the numberof scraping sites and the rate of re-scraping per site (i.e., the number of scrapes found ineach site). A site was defined as an area where one or more scrapes were found withina given distance. To determine this distance, we used the maximum distance we found(21 m) between scrapes in two intensive scraping sites that we found in the Angatuba
Palomares et al. (2018), PeerJ, DOI 10.7717/peerj.4983 7/25

area. Therefore, scrapes were considered as belonging to the same site if distance wasequal or inferior to 21 m. We are aware this distance of 21 m might not be the same forall study areas and situations, but it is the only objective information we had about thisissue. Furthermore, we also counted the number of scrapes we found between 0 and 21 m,between 22 and 100 m, between 101 and 500 m, and further than 501 m, in order to be ableto recognize if there were different patterns of linear distribution of scrapes among studyareas. These distance intervals were somewhat arbitrarily chosen, but according to the rangeof home range sizes of jaguars and pumas (see González-Borrajo, López-Bao & Palomares,2017), it is reasonable to think that they represent scrapes made in the same site, in the samearea, in a relatively close distance to another scrape, and in an isolated way, respectively.
Additionally, we determined if scrapes were spatially aggregated or randomly distributedon trails in each study area by the Ripley’s reduced second moment function K(r) froma point pattern in a window and the translation correction (Dixon, 2002; Ohser, 1983).To adapt the Ripley’s function to our specific case where scrapes were looked in lineartransects instead of areas, we considered as window the effective searching area of each studysite, which was formed by the total sampled transects with a width of 22 m. Therefore, theRipley’s function examines how distance between scrapes varied along the distance sampledin trails, and the curve formed by the Ripley’s functionmay inform on the patterns of linearspatial distributional of scrapes on trails. To statistically test if the observed distribution ofscrapes was significantly different from a random distribution, we generated 1,000 data setsof random positions of the same number, to that of observed scrapes in each study area,and looked to see if the observed Ripley’s function overlapped or not with the expectedones. If the observed Ripley’s function is above the expected ones it would indicate thatscrapes were closer together than expected by random. The analysis was performed withthe ‘spatstat’ package (Baddeley & Turner, 2005) in the R software (R Core Team, 2016).
RESULTSField samplings and finding ratesWe walked 467 km of paths once or more times, finding a total of 349 felid scrapes,considering those found during surveys for scrapes (269) and those found while carryingout other activities (80). Considering for all areas only scrapes found during the specificsamplings for scrapes (269 scrapes), we found a scraping rate of 0.576 scrapes per kmsurveyed (Table 1). The intensity of scraping behaviour differed among study areas andtype of path. The highest number of scrapes was found in Angatuba, but once corrected bykilometers surveyed, Serra das Almas was the area where finding rate was higher, followedby El Edén, Angatuba, Cockscomb, and San Ignacio where only two scrapes were foundin 67 km surveyed (X 2
= 37.90, d.f. = 4, p< 0.001; for differences among study areas;Table 1). Due to the low number of scrapes found in San Ignacio, we did not considerthis area for further analysis. Scrapes were not found with the same probability in all typesof path surveyed (X 2
= 12.64, d.f. = 2, p= 0.002). Most scrapes were found in car tracks(finding rate= 0.629 scrapes per km), followed by trails (0.581 scrapes per km), and rarelywe found scrapes in cross country (0.094 scrapes per km; Table 1). Differences between cartracks and trails were not statistically significant (X 2
= 0.17, d.f. = 1, p= 0.685).
Palomares et al. (2018), PeerJ, DOI 10.7717/peerj.4983 8/25

Table 1 Scrape finding rates. Kilometers surveyed and number of scrapes found in the five study areasand overall by type of path during the first survey in each study area except in Serra das Almas where datafrom two surveys were considered since the same track (37 km) was walked and time lap between surveyswas 2 months.
Study area Type of path Overall
Car tracks Trails Cross country
Km Scrapes Km Scrapes Km Scrapes Km Scrapes Scrapes/km
San Ignacio 26 – 17 1 24 1 67 2 0.030El Edén 39 16 48 44 5 2 92 62 0.674Angatuba 171 95 2 1 3 – 176 96 0.545Cockscomb 33 11 25 16 – – 58 27 0.466Serra Almas 6 – 68 57 – – 74 57 0.770Total 275 173 160 93 32 3 467 269 0.576
Position of scrapes in pathsMost scrapes were found in the border (43.7%) and centre (27.4%) of paths, although theyalso were recorded far away (15.7%), in the wheel car path (7.2%), and outside (6.0%)of the path (n= 318 scrapes with information). It is worth noting the relatively highnumber of scrapes found far away from paths, but data are biased because we found twohigh intensive scraping zones just 15–25 m from the edge of a car tracks and separated inbetween by 157 m in the Angatuba study area, where a total of 49 (39 plus 10, respectively)out of 96 scrapes found in the area were in these two points (Fig. 3). The two intensivescraping points covered a surface of 54 and 44 m2, respectively, between their furthestscrapes and could be located after tracking a puma for approximately 800 m that wasmoving by the car tracks and entered this area (Fig. 3). This area was used during all theduration of the study and is even still used three years later when we visited the studyarea again. We set a camera track in the area and two days later we recorded a male pumamaking two consecutive scrapes with the hind legs (Supplemental Information). He wasin scraping behaviour during 42 s and took 18 and 16 s in each scrape; he also deposited asmall fecal substance after the first scrape. Three years later, we set another camera trap inthe same point during four weeks, and we recorded four different pumas (two adult males,one adult female, and one individual of undetermined sex) visiting the point. Apart fromthese two intensive scraping sites, only one scrape was located far away from paths. Forfurther analysis, these two intensive scraping sites will be considered as two data points ifnot otherwise indicated.
By type of path, considering data from all study areas altogether, scrapes were foundin a similar frequency in the centre and edge of trails, whereas they were mainly foundin the edge in car tracks (Fig. 4). But the most interesting result was that there wereclear differences between study areas (trails: X 2
= 45.02,d.f .= 2,p< 0.001; car tracks:X 2= 37.02,d.f .= 6,p< 0.001; data from edge and outside grouped for analysis in both
cases; Fig. 4). In the areas with only pumas (Angatuba and Serra das Almas), scrapes weremainly found in the centre of the paths when these were trails, and in the wheel trackswhen paths were car tracks. However, in the areas with jaguars and pumas, most scrapes
Palomares et al. (2018), PeerJ, DOI 10.7717/peerj.4983 9/25

Figure 3 Intensive scraping points of pumas. Sketch of the two intensive scraping points (ISA1 andISA2) found after following a puma track in Angatuba study area during the survey of 2012. Aerial imagesobtained from Google Earth.
Full-size DOI: 10.7717/peerj.4983/fig-3
Figure 4 Position of scrapes on paths. Frequency distribution of the position of the scrapes on trails (A)and car tracks (B) in Angatuba, Cockscomb, El Edén, Serra das Almas and overall. There were no scrapeson trails in Angatuba and on car tracks in Serra das Almas.
Full-size DOI: 10.7717/peerj.4983/fig-4
Palomares et al. (2018), PeerJ, DOI 10.7717/peerj.4983 10/25
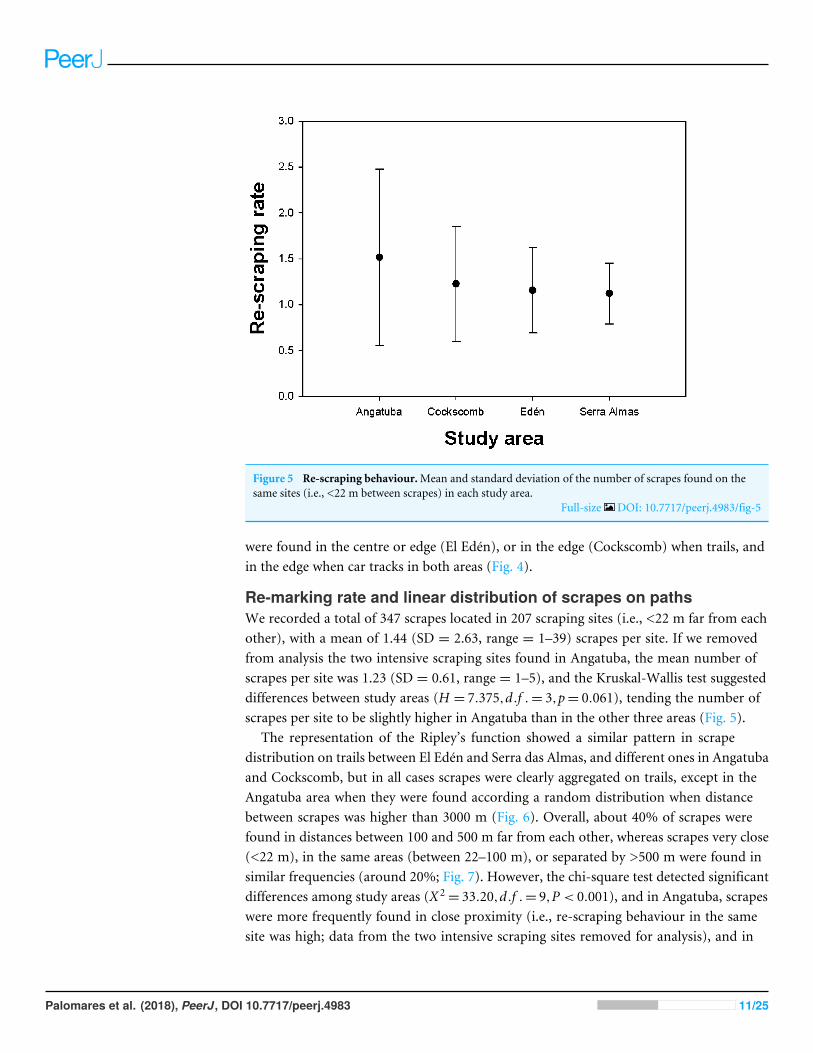
Figure 5 Re-scraping behaviour.Mean and standard deviation of the number of scrapes found on thesame sites (i.e., <22 m between scrapes) in each study area.
Full-size DOI: 10.7717/peerj.4983/fig-5
were found in the centre or edge (El Edén), or in the edge (Cockscomb) when trails, andin the edge when car tracks in both areas (Fig. 4).
Re-marking rate and linear distribution of scrapes on pathsWe recorded a total of 347 scrapes located in 207 scraping sites (i.e., <22 m far from eachother), with a mean of 1.44 (SD = 2.63, range = 1–39) scrapes per site. If we removedfrom analysis the two intensive scraping sites found in Angatuba, the mean number ofscrapes per site was 1.23 (SD = 0.61, range = 1–5), and the Kruskal-Wallis test suggesteddifferences between study areas (H = 7.375,d.f .= 3,p= 0.061), tending the number ofscrapes per site to be slightly higher in Angatuba than in the other three areas (Fig. 5).
The representation of the Ripley’s function showed a similar pattern in scrapedistribution on trails between El Edén and Serra das Almas, and different ones in Angatubaand Cockscomb, but in all cases scrapes were clearly aggregated on trails, except in theAngatuba area when they were found according a random distribution when distancebetween scrapes was higher than 3000 m (Fig. 6). Overall, about 40% of scrapes werefound in distances between 100 and 500 m far from each other, whereas scrapes very close(<22 m), in the same areas (between 22–100 m), or separated by >500 m were found insimilar frequencies (around 20%; Fig. 7). However, the chi-square test detected significantdifferences among study areas (X 2
= 33.20,d.f .= 9,P < 0.001), and in Angatuba, scrapeswere more frequently found in close proximity (i.e., re-scraping behaviour in the samesite was high; data from the two intensive scraping sites removed for analysis), and in
Palomares et al. (2018), PeerJ, DOI 10.7717/peerj.4983 11/25

Figure 6 Lineal distribution of scrapes on paths. Estimates of the Ripley’s reduced second momentfunction K(r), with the translation correction of Ohser (1983), from a point pattern of scrapes in trailssampled in each study area (A–E). The gray shadow represents the expected distribution of scrapes fol-lowing 1,000 random distributions (see text for details). The black line show the observed distribution ofdistances between consecutive scrapes. When the line is above the shadow area indicates that scrapes arecloser together than expected by random.
Full-size DOI: 10.7717/peerj.4983/fig-6
Palomares et al. (2018), PeerJ, DOI 10.7717/peerj.4983 12/25

Figure 7 Lineal distance between consecutive scrapes. Frequency distribution of distances betweenscrapes on linear paths for all data altogether and for every study area. There were significant differencesbetween study areas (X 2
= 33.202,d.f . = 9,P < 0.001), and also between all pair wise comparisons (allX 2 > 8.53,d.f .= 3, all P < 0.036), except between El Edén and Serra das Almas (X 2
= 3.605,d.f .= 3,P =0.307).
Full-size DOI: 10.7717/peerj.4983/fig-7
Cockscomb, felids made scrapes every 100–500 m with some re-scraping behaviour alongtransects, but also large sections (>500 m) of paths without scrapes (Fig. 7). Lineardistribution of scrapes in El Edén and Serra das Almas, however, was not statisticallydifferent (Fig. 7), with scrapes mainly found every 100–500 m, although there also werelarge sections (>500 m) of paths without scrapes.
Characteristic of sites with scrapesFelids made scrapes on sites mainly covered by leaves (88 cases; Fig. 1), and in less extensionon sites with grass (five cases), no coverage (three cases) or woody material (one case) inthe area of Cockscomb, and on sites mainly covered by leaves (58 cases), but also withno coverage (11 cases) or woody material (one case) in El Edén. When we compared thematerials covering the 1 × 1 m plots where scrapes were made, with the paired 1 × 1 mplots situated 5m away from scrapes to test for any kind of selection, we found that whereasin Cockscomb felids did not show any kind of selection, in El Edén they preferred to makescrapes in sites with leaves and without stones and grass (Table 2).
For all study areas with data, felids preferred scraping paths less wide (between 1.7 and3.0 m, depending of the study area), clean paths and rarely used (except for Cockscomb,where they preferred frequently used paths) than available; abandoned paths were used
Palomares et al. (2018), PeerJ, DOI 10.7717/peerj.4983 13/25

Table 2 Characteristics of microsites with scrapes.Mean and standard deviation of percentages of thesoil covered by different materials in 1× 1 m plots centred in scrapes and 5 m away in front of the scrapeon the path in the study areas of Cockscomb and El Edén. Probabilities of the Mann–Whitney U teststatistic to compare the paired 1×1 m plots are also showed.
Materials Cockscomb (n= 93) El Edén (n= 65)
Mean± SD P Mean± SD P
Scrape 5-m-away Scrape 5-m-away
Nothing 11.8± 21.36 7.0± 17.43 0.092 11.3± 22.56 18.4± 29.14 0.242Grass 2.7± 11.34 2.7± 11.34 1 0.8± 5.10 5.4± 16.40 0.005Leaves 85.5± 22.82 90.3± 19.86 0.124 78.8± 30.32 66.3± 35.73 0.009Woody 0 0 – 6.8± 16.95 2.9± 10.07 0.209Stones 0 0 – 2.3± 10.68 7.0± 17.65 0.019
less than available (Table 3). On the other hand, scrapes were found more in tall andshort forest and less than expected in savanna and secondary forest in El Edén, more intall forest in Cockscomb (practically the only available habitat type), and more in naturalvegetation (Atlantic Forest and Cerrado) and less than expected in edges of vegetation typesand plantations in Angatuba (Table 3). In scraping sites, vegetation height was shorter inAngatuba and taller in Cockscomb and El Edén than available, and vegetation cover washigher in Angatuba than available, but according availability in Cockscomb and El Edén(Table 3).
Size of scrapesFor a total of 202 scrapes from Angatuba, Cockscomb and El Edén width and length weremeasured. Width and length of the scrapes ranged between 10–36 cm and 14–88 cm,respectively, covering a total surface of 200–2,464 cm2. Width and length were, on average,21 cm and 25 cm, respectively, this last measure beingmore variable than the first (SD= 4.7and 10.6, respectively). On average, the ratio length/width was 1.23 ± 0.56 SD (range =0.53–4.35). However, univariate Kruskall-Wallis tests detected significant differencesamong study areas, and as a rule, scrapes were shorter and wider in El Edén than in theother two study areas (H = 30.014 and 24.574, respectively, d.f. = 2, p< 0.001 in bothcases; Fig. 8). The area where jaguars were absent (Angatuba) presented the intermediatevalues in scrape sizes (Fig. 8).
It is interesting to note that in Angatuba, where jaguars were absent, variability of data inscrape width was markedly higher than in the other two areas, fact that did not happenedfor length (Fig. 8). Furthermore, outsider values were mainly observed in Cockscomb forscrape length, and in lesser extent in El Edén, where both jaguars and pumas are present(Fig. 8). Additionally, most of these scrapes with outsider long sizes (approximately >40cm; Fig. 8) presented higher length/width ratios (mean length/width ratio of outsiders =2.74± 0.90. n= 13) than the average (1.26; n= 201, p= 0.04). Furthermore, in all these 13scrapes it was not clear the signal of two legs on the ground (Fig. 1). All this informationsuggests that these scrapes could be made by jaguars and probably with the front legsinstead of the hind legs.
Palomares et al. (2018), PeerJ, DOI 10.7717/peerj.4983 14/25

Table 3 Characteristics of the path and vegetation of the sites where scrapes where found (Observed) and availability for each study area(Available). Statistical tests for comparing the observed and available characteristics are also shown. ND, no data; NA, Not available that vegetationtype in the study area; Tall/Atlantic forest, it refers to tall forest for Cockscomb and El Edén, and Atlantic forest for Angatuba; Short forest/cerrado,it refers to short forest for El Edén and cerrado vegetation for Angatuba.
Variable Study area
Angatuba Cockscomb El Edén
Observed Available Observed Available Observed Available
Path widthN 49 268 96 280 70 181Mean± SD 3.0± 0.61 3.5± 1.69 1.7± 0.59 2.5± 2.69 1.7± 0.87 2.3± 0.83t student t = 1.95, P = 0.052 t = 2.97, P = 0.003 t = 5.13, P < 0.001
Path use (%)N 51 295 97 280 72 198Abandoned 7.8 13.9 0 0 16.7 36.4Rare 92.2 82.4 37.1 63.6 63.9 34.8Frequent 0 3.7 62.9 36.4 19.4 28.8X 2 test X 2
= 5.02, df = 2, p= 0.081 X 2= 19.49, df = 2, p< 0.001 X 2
= 18.79, df = 2, p< 0.001
Path cleaning (%)N 97 280 74 197Yes ND ND 100 100 90.5 75.1Not ND ND 0 0 9.5 24.9X 2 test – – X 2
= 6.88, df = 1, p= 0.009
Vegetation type (%)N 53 302 97 277 73 201Savanna – NA – NA 1.3 6.0Talk/Atlantic forest 56.6 6.0 100 98.9 13.7 1.5Secundary forest – NA – NA 67.1 84.6Short forest/cerrado 22.6 9.3 – NA 17.8 8.0Edge 18.7 52.6 1.1 – NAPlantationsa 1.9 32.1 – NA – NAX2 test X 2
= 126.57, df = 3, p< 0.001 X 2= 26.15, df = 3, p< 0.001b
Vegetation height (m)N 53 264 95 280 73 198Mean± SD 11.2± 3.63 14.1± 4.11 16.7± 3.73 14.7± 2.86 9.8± 3.89 8.5± 3.69t student t = 4.74, p< 0.001 t = 5.46, p< 0.001 t = 2.58, p= 0.010
Vegetation cover (%)N 53 267 97 280 73 198Mean± SD 3.6± 0.77 2.9± 0.63 3.7± 0.47 3.7± 0.46 3.8± 0.77 3.7± 0.74t student t = 4.80, p< 0.001 t = 0.18, p= 0.855 t = 0.34, p= 0.735
Notes.aIt included eucalyptus and pine plantations.bWe performed the test despite 20% of the expected values are less than 5 in order to not lose the biological interest of data.
Palomares et al. (2018), PeerJ, DOI 10.7717/peerj.4983 15/25

Figure 8 Length and width of scrapes. Box plots show differences in length (A), width (B) and the ratiobetween length and width (C) for scrapes sizes from three study areas. The box indicates the 25th and 75thpercentiles, a line within the box marks the median; error bars indicate the 90th and 10th percentiles, andpoint values outside the last percentiles (outsiders).
Full-size DOI: 10.7717/peerj.4983/fig-8
Palomares et al. (2018), PeerJ, DOI 10.7717/peerj.4983 16/25

Table 4 Identification of faeces and urine on scrapes. Felid species and sex determined for faeces orurine (the only one with asterisk) found on scrapes in different study areas. F, female; M, male; ND, sexnon-determined.
Study area Faeces from scrapes Ocelot
Jaguar Puma
Virua 1F, 1M 1M –El Zapotal – 1M –Los Ocotones 1M, 1ND – –La Cojolita – 1ND* –El Edén 12M 2M –Serra das Almas – 4M –Cockscomb 4M, 1ND –Angatuba 1M 1F
Scrapes by species and sex, and relative abundance of each speciesIn 43 scrapes, faeces or urine, respectively, were found over scrapes, and in 32 cases (31faeces and one urine) the felid could be identified (Table 4). Faeces were from jaguars in21 scrapes (18 from males, one from female and two undetermined sex) from Viruá, LosOcotones, El Edén and Cockscomb. Nine faeces were from pumas (all from males) fromViruá, El Zapotal, El Edén, Serra das Almas and Angatuba, and the only urine sampleidentified come from a puma in La Cojolita (Table 4). One faeces sample was identified asocelot (Table 4).
As expected in Antaguba and Serra das Almas we did not find faeces from jaguars,finding 26 and 34 faeces from pumas, respectively. In the other three study areas faecesfrom both species were found with ratios jaguar/puma of 0.4, 1.6 and 11.3 for San Ignacio,El Edén, and Cockscomb, for a total of 40, 50 and 37 faeces collected of both species ineach study area, respectively.
DISCUSSIONScraping encounter ratesScraping was a frequent behaviour in the largest felids of America. Aproximately, onescrape per 1.5 km was found when walking by unpaved track roads or trails in moststudy areas. Nevertheless, in some areas such as the dry forest of San Ignacio (northernMexico), scraping behaviour seemed to be rare. This last result is particularly surprising aspumas were more abundant than jaguars and reported in many different areas and habitats(previously and confirmed by this study too), as a felid in which scraping behaviour isfrequent (Harmsen et al., 2010a; Logan & Sweanor, 2010; Allen, Wittmer & Wilmers, 2014).In other areas from Amazon basin, we found an apparently low scraping behaviour forany species (F Palomares, pers. obs., 2004 and 2009), while surveying for faeces (Palomareset al., 2012; Palomares et al., 2016). In other areas such as the Pantanal, jaguars also seemto scrape infrequently (Schaller & Crawshaw Jr, 1980). Thus, the factors promoting anoticeable scraping behaviour in the largest felid of America is not related with their
Palomares et al. (2018), PeerJ, DOI 10.7717/peerj.4983 17/25

abundance or possible presence of one or both species, and some characteristics of theareas where they live might explain the observed differences.
Site selection for scrapingIt was clear that felids liked to scrape in well delimited and clean paths, independently ifthese were trails or unpaved track roads, somewhat avoiding sites without trails (but seeSeidensticker et al., 1973, for a contrasting result for pumas in Idaho). Furthermore, theypreferred paths rarely used although not abandoned ones, as the abandoned ones used tohave abundant plant regeneration and/or tall grassy vegetation, making, on one hand, itmore difficult for felids to move through them, and, on the other hand, to succeed with theobjective of signalling the path. Although in some well protected areas, such as Cockscomb,they preferred the more frequently used paths, which are also used for tourist visitationduring daylight. Nevertheless, it is interesting to note that this area has a long protectionhistory and tourist visitation, so animals may be relatively used to people, in addition tothe chance of encounters with people being smaller due to the crepuscular and nocturnalactivity habits of felids in the area (Harmsen et al., 2010b). It is also interesting to note thatthe only two intensive scraping sites detected were at 15–20 m further from the paths.Maybe animals prefer to do these intensive scraping sites slightly further from paths, but itmight simply be a consequence of roads or trails being periodically managed and trodden,and this might prevent the accumulation of scrapes. In fact, on paths of one or other typewe found a similar number of scrapes close together (what was called clustered scrapesby Harmsen et al., 2010a, or community scrapes by Allen, Wittmer & Wilmers, 2014). Wefound no report with such intensive scraping sites as those found in Angatuba in this study.
Scrapes seemed to be also done to signalize other elements of the habitats withinterritories. In addition to the result obtained on scrape aggregation and re-scrapingbehaviour, which suggest animals are intentionally marking some given sites and/orhabitats, somewhat, scrapes were not made at random and felids selected specific sites tomake scrapes both at substrate (microsite) scale and regarding the site level. Selection onmicrosite scale seemed to be conditioned by the type of substrate that would facilitate signaldetection. Felids showed preferences for sites with leaves, and avoided sites with grass andstones, and with a rocky substrate. Stones might make scraping more difficult and lessdetectable. As a matter of fact, in areas with no rocky substrate, we did not detect selectionof any particular microsite.
On the other hand, as a rule, felids did not evenly scrape in all types of vegetation found inthe study areas, and the pattern seemed to be also different between study areas according tothe main types of vegetation found. In the two more natural areas such as Cockscomb andEl Edén, felids selected the more natural and developed vegetation types among available,although they avoided the natural savanna habitat in El Edén. In Angatuba, pumas alsoselected the natural habitats (Atlantic Forest and Cerrado) and clearly avoided plantations.Therefore, it seems clear felids concentrate scrapes in the best quality areas within theirhome ranges. This hypothesis is also supported by the linear distribution of scrapes. Inthe area more altered and heterogeneous (Angatuba), re-scraping behaviour was higher.However, in the more homogeneous area according to habitat quality (Cockscomb),
Palomares et al. (2018), PeerJ, DOI 10.7717/peerj.4983 18/25

distribution of scrapes was more uniform and scrapes were mainly situated in regularinterval of 100–500 m. Finally, in the two areas where there was some level of regenerationof the natural vegetation (El Eden, and Serra das Almas), patterns of linear distributionof scrapes were similar, with scrapes regularly spaced every 100–500 m or isolated (i.e.,scrapes situated >500 m in between). These results suggest that felids mainly concentratescraping behaviour in the best natural available habitat types, and so scrapes would berelated to the use of optimal habitats (e.g., by higher prey availability and/or better refugesagainst disturbances).
Scrapes as a communication toolOur data suggest that scrapes are made with the proposal of communication betweenindividuals. First, the use of well delimited paths for scraping is already pointing inthat direction. Felids in general, and jaguar and pumas in particular, like to move onwell-established paths (Harmsen et al., 2010b; Palomares et al., 2012), so they are scrapingwhere there is a higher probability that other individuals or themselves can find the mark.Secondly, they sometimes left faeces or urine on scrapes, and both stuff may inform otherindividuals about sex, health, and reproductive and social status of individuals (Allen,Wittmer & Wilmers, 2014), which reinforced the role of scrapes as a way of intraspecificcommunication. Third, re-scraping behaviour in some given sites that are visited by severaldifferent individuals, suggests this communication role, fact confirmed by Allen, Wittmer& Wilmers (2014) and Allen et al. (2015) with pumas. Thus, it is also quite probablythat intensive scraping sites could be situated in contact borders between territories orto signalize important resources (Seidensticker et al., 1973; Smith, McDougal & Miquelle,1989), although our data did not allow testing for this possibility.
Who scrapes and differences in scrapes and scraping behaviourbetween jaguar and pumasOur data suggest that both jaguars and pumas make scrapes and that scraping behaviour infemale seems to be a rare event (but see Allen, Wittmer & Wilmers, 2014). In fact, we onlyfound jaguar female faeces on one scrape and in some occasions, we have been able to trackmale pumas (distinguished by footprint size and phototrapping) finding several associatedscrapes, whereas it has never been the case when a female was tracked. However, we canbe sure that female pumas visited scraping sites as a couple of them were photographedseveral times in one of the intensive scraping sites detected in the Angatuba study area.This conclusion is in agreement with previous studies (Seidensticker et al., 1973; Logan &Sweanor, 2010; Harmsen et al., 2010a; Allen, Wittmer & Wilmers, 2014). However, Allen,Wittmer & Wilmers (2014) confirmed that mature females also scrape, although much lessfrequently than mature male pumas (Allen et al., 2015). In addition, we cannot disregardthat some of the smaller scrapes found in this study come from ocelots since in other areasnot sampled for scrapes in some occasion we have observed small scrapes associated withocelot tracks (F Palomares, pers. obs., 2004 and 2009).
Our data indicate a human observer cannot distinguish between jaguar and pumascrapes based only on morphology differences. Scrape size of both species widely overlaps.
Palomares et al. (2018), PeerJ, DOI 10.7717/peerj.4983 19/25

Harmsen et al. (2010a) found similar results in one of our study areas (Cockscomb),although when faeces were over the scrape, they also found that general scrapes with jaguarfaeces were larger than scrapes with puma faeces. Despite the large overlap in the size ofscrapes of both species, our data indicate that jaguars made longer scrapes with constantwidth, which were not found in the areas with only pumas (Fig. 8). Such scrapes were oftensingle scrapes as defined by Harmsen et al. (2010a). In fact, we did not find single scrapesin the areas with only pumas as also reported by Allen, Wittmer & Wilmers (2014).
Another aspect that differentiates jaguar and puma scraping behaviour is position onthe paths. When only pumas were in an area (Angatuba and Serra das Almas), scrapes weremainly found on the walkable part of the paths (trail centre and wheel tracks on unpavedroad), whereas in the areas with jaguars, most scrapes were mainly found in the edge of thepath (Cockscomb) or on the edge and centre (El Edén). Note, that in Cockscomb jaguarsseem to be much more abundant than pumas (ratio jaguar/puma faeces was 11.3), whereasin El Edén was just slightly higher for jaguars (ratio = 1.6).
Scraping rate was lower in the area where, according to our data on genetic identificationof faeces, pumas were less abundant (Cockscomb), and higher in one of the areas with onlypuma presence (Serra das Almas). Furthermore, in the other area where only pumas werepresent (Angatuba), scraping rate was not higher than in El Edén (the area with both speciespresent), but this clearly was due to large areas of poor habitat quality (plantations) thatwere surveyed, where few scrapes were found. However, in this area re-scraping rates werehigher than in the other study areas. Thus, it seemed that scraping behaviour was higher inareas with only pumas, and therefore pumas seemed to be the most responsible for scrapes.This result is in agreement with the statements of Schaller & Crawshaw Jr (1980), but it isin opposition to Harmsen et al. (2010a), who suggest that the apparently frequent scrapingbehaviour of pumas in Cockscomb is probably due to jaguar presence in order to use aninconspicuous way of communication between individuals because of the risk of using amore direct mechanism. If so, they proposed that in areas where pumas were the largestcarnivores, scrape rates should be lower. Both in Angatuba and Serra das Almas, wherepumas were the largest carnivores, scraping rates were even higher than in Cockscomb.Thus, it seems that a high scraping behaviour in pumas is not related to the presence ofjaguars or other larger carnivores.
CONCLUSIONIn some areas, scraping was a frequent behaviour in both jaguars and pumas, and they weremainly made by males, although pumas seemed to be the most responsible for scrapes.Both felids liked to scrape in well delimited and clean paths, independently if these weretrails or unpaved track roads, somewhat avoiding sites without trails. Furthermore, theypreferred paths rarely used rather than abandoned ones.
Scrapes seemed to be also done to signalize other elements of the habitats withinterritories since scrapes were not made at random and felids selected specific sites to makescrapes both at the substrate (microsite) scale and regarding the site level. Nevertheless,selection on the microsite scale seemed to be conditioned by the type or substrate rather
Palomares et al. (2018), PeerJ, DOI 10.7717/peerj.4983 20/25

than to facilitate signal detection. Felids selected the more natural and developed vegetationtypes among those available to scrape, and clearly avoided plantations. Thus, scrapes weremore patchily distributed in the areas more altered and were more evenly distributed inthe more natural areas.
Scrapes from jaguars and pumas can not be distinguished based only in morphologydifferences, except for some long scrapes (>40 cm) that are made by jaguars. The mainaspect differentiating jaguar and puma scrapes was the position on the paths, with pumasmostly scraping on the walkable part of the paths (trail centre and wheel tracks on unpavedroad), whereas jaguars scraped on the edge of the path, and only jaguars made singlescrapes.
ACKNOWLEDGEMENTSWe thank the managers of the Edén Ecological Reserve (Marco Lazcano), El ZapotalEcological Reserve (Pronatura Península de Yucatán: Juan Carlos Faller and MaríaAndrade), Fazendas Três Lagoas (Denise Carmignani), Arca (Caetano Carmignani),Estacão Ecológica de Angatuba (Bárbara Heliodora Prado), Serra das Almas NaturalHeritage Reserve (Thiago Roberto Soares Vieira) for their logistical support. C Zapata andtwo anonymous referees made useful comments on the manuscript.
ADDITIONAL INFORMATION AND DECLARATIONS
FundingThis study was supported by the project CGL2010-16902 of the Spanish Ministry ofResearch and Innovation, the project CGL2013-46026-P of Ministerio de Economía,Industria y Competitividad, and the excellence project RNM2300 of the Junta de Andalucíaand the Formación de Profesorado Universitario fellowship AP2010-5373 from the SpanishMinistry of Education. LucianoM. Verdade has a productivity scholarship fromMinistérioda Ciência, Tecnologia, Inovacões e Comunicacões (Proc. No. 309468/2011-6). MarinaZanin is supported by Desenvolvimento Científico e Tecnológico fellowship number312627/2015-7. The funders had no role in study design, data collection and analysis,decision to publish, or preparation of the manuscript.
Grant DisclosuresThe following grant information was disclosed by the authors:Spanish Ministry of Research and Innovation: CGL2010-16902.Ministerio de Economía, Industria y Competitividad: CGL2013-46026-P.Junta de Andalucía and the Formación de Profesorado Universitario fellowship: RNM2300.Spanish Ministry of Education: AP2010-5373.Ministério da Ciência, Tecnologia, Inovacões e Comunicacões: 309468/2011-6.Desenvolvimento Científico e Tecnológico: 312627/2015-7.
Palomares et al. (2018), PeerJ, DOI 10.7717/peerj.4983 21/25
Competing InterestsThe authors declare there are no competing interests.
Author Contributions• Francisco Palomares conceived and designed the experiments, performed theexperiments, analyzed the data, contributed reagents/materials/analysis tools, preparedfigures and/or tables, authored or reviewed drafts of the paper, approved the final draft.• Noa González-Borrajo conceived and designed the experiments, performed theexperiments, analyzed the data, prepared figures and/or tables, authored or revieweddrafts of the paper, approved the final draft.• Cuauhtémoc Chávez, Yamel Rubio and Bart Harmsen performed the experiments,contributed reagents/materials/analysis tools, authored or reviewed drafts of the paper,approved the final draft.• Luciano M. Verdade conceived and designed the experiments, contributedreagents/materials/analysis tools, authored or reviewed drafts of the paper, approved thefinal draft.• Rocio Monsa performed the experiments, authored or reviewed drafts of the paper,approved the final draft.• Begoña Adrados and Marina Zanin analyzed the data, authored or reviewed drafts ofthe paper, approved the final draft.
Field Study PermissionsThe following information was supplied relating to field study approvals (i.e., approvingbody and any reference numbers):
Sampling inBrazil was carried out under licenses no. 11214 andno. 13781 of ICMBio, andno 131/2005 CGFAU/LIC, 13883-1 SISBIO and 15664-1 SISBIO of the Instituto Brasileirodo Meio Ambiente—IBAMA, and at the Mexican sites under the license SGPA/DGVS/549of the Dirección General de Vida Silvestre (Semarnat). Sampling in Belize and posteriorexportation of feces was approved by the Forest Department of Belize with the Ref. No.CD/60/3/14 (25). Fecal samples were exported from Brazil to Spain for genetic analysisunder IBAMA/CGEN Autorizacão de Acesso license no 063/05 and IBAMA/CITES exportlicenses no 0123242BR, 08BR002056/DF and 09BR003006/DF, and from Mexico to Spainunder the export licenses no MX33790 and MX42916 from the Secretaria de MedioAmbiente/CITES.
Data AvailabilityThe following information was supplied regarding data availability:
The raw data are provided in the Supplemental Files.
Supplemental InformationSupplemental information for this article can be found online at http://dx.doi.org/10.7717/peerj.4983#supplemental-information.
Palomares et al. (2018), PeerJ, DOI 10.7717/peerj.4983 22/25
REFERENCESAllenML,Wittmer HU, Houghtaling P, Smith J, Elbroch LM,Wilmers CC. 2015. The
role of scent marking in mate selection by female pumas (Puma concolor). PLOSONE 10:e0139087 DOI 10.1371/journal.pone.0139087.
AllenML,Wittmer HU,Wilmers CC. 2014. Puma communication behaviours:understanding functional use and variation among sex and age classes. Behaviour151:819–840 DOI 10.1163/1568539X-00003173.
Araújo FS, Martins FR. 1999. Fisionomia e organizacão da vegetacão do carrasco noplanalto da Ibiapaba, estado do Ceará. Acta Botânica Brasilica 13:1–13DOI 10.1590/S0102-33061999000100002.
Asa CS, Mech LD, Seal US. 1985. The use of urine, faeces, and anal-gland secre-tions in scent-marking by a captive wolf (Canis lupus) pack. Animal Behaviour33:1034–1036 DOI 10.1016/S0003-3472(85)80043-9.
Athayde EA, Cancian LF, Verdade LM,Morellato LPC. 2015. Functional and phylo-genetic diversity of scattered trees in an agricultural landscape: implications forconservation. Agriculture, Ecosystems & Environment 199:272–281DOI 10.1016/j.agee.2014.10.003.
Baddeley A, Turner R. 2005. Spatstat: an R package for analyzing spatial point patterns.Journal of Statistical Software 12.6:1–42 DOI 10.18637/jss.v012.i06.
Barja I, DeMiguel FJ, Bárcena F. 2005. Faecal marking behaviour of Iberian wolf indifferent zones of their territory. Folia Zoologica 54:21–29.
Bekoff M. 1979. Ground scratching by male domestic dogs: a composite signal. Journal ofMammalogy 60:847–848 DOI 10.2307/1380206.
Dixon PM. 2002. Ripley’s K Function. Encyclopedia of Environmetrics 3:1796–1803.Emmons LH. 1987. Comparative feeding ecology of felids in a neotropical rainforest.
Behavioural Ecology and Sociobiology 20:271–283 DOI 10.1007/BF00292180.Ghoddousi A, Hamidi AK, Ghadirian T, Ashayeri D, HamzehpourM,Moshiri H,
Zohrabi H, Julayi L. 2008. Territorial marking by the Persian Leopard (Pantherapardus saxicolor Pocock, 1927) in Bamu National Park, Iran. Zoology in the MiddleEast 4:101–103 DOI 10.1080/09397140.2008.10638293.
González-Borrajo N, López-Bao JV, Palomares F. 2017. Spatial ecology of jaguars,pumas, and ocelots: a review of the state of knowledge.Mammal Review 47:62–75DOI 10.1111/mam.12081.
GormanML, Trowbridge BJ. 1989. The role of odor in the social lives of carnivores. In:Gittleman JL, ed. Carnivore behaviour, ecology, and evolution. Ithaca: Springer US,57–88.
Gosling LM, Roberts SC. 2001. Scent-marking by male mammals: cheat-proof signals tocompetitors and mates. Advances in the Study of Behaviour 30:169–217DOI 10.1016/S0065-3454(01)80007-3.
Harmsen BJ, Foster RJ, Gutierrez SM,Marin SY, Doncaster CP. 2010a. Scrape-markingbehaviour of jaguars (Panthera onca) and pumas (Puma concolor). Journal ofMammalogy 91:1225–1234 DOI 10.1644/09-MAMM-A-416.1.
Palomares et al. (2018), PeerJ, DOI 10.7717/peerj.4983 23/25

Harmsen BJ, Foster RJ, Silver S, Ostro L, Doncaster CP. 2010b. Differential use of trailsby forest mammals and the implications for camera-trap studies: a case study fromBelize. Biotropica 42:126–133 DOI 10.1111/j.1744-7429.2009.00544.x.
Jackson R, Ahlborn G. 1988. Observations on the ecology of snow leopard in west Nepal.In: Freeman H, ed. Proceedings of the 5th international snow leopard symposium.Seattle: International Snow Leopard Trust and Wildlife Institute of India, 65–87.
Johnson RP. 1973. Scent marking in mammals. Animal Behaviour 21:521–535DOI 10.1016/S0003-3472(73)80012-0.
Lima JR, Sampaio EVS, Rodal MJN, Araújo FS. 2009. Composicão florística da florestaestacional decídua montana de Serra das Almas, CE, Brasil. Acta Botânica Brasilica23:756–763 DOI 10.1590/S0102-33062009000300015.
Logan K, Sweanor L. 2010. Behaviour and social organization of a solitary carnivore. In:Hornocker M, Negri S, eds. Cougar: ecology and conservation. Chicago: University ofChicago Press, 105–117.
MacDonald DW. 1980. Patterns of scent marking with urine and faeces amongstcarnivore communities. Symposia of the Zoological Society of London 45:107–139.
Mellen JD. 1993. A comparative analysis of scent-marking, social and reproductivebehaviour in 20 species of small cats (Felis). American Zoologist 33:151–166.
Ohser J. 1983. On estimators for the reduced second moment measure of point pro-cesses.Mathematische Operationsforschung und Statistik, series Statistics 14:63–71.
Palomares F, Fernández N, Roques S, Chávez C, Silveira L, Keller C, Adrados B. 2016.Fine-scale habitat segregation between two ecologically similar top predators. PLOSONE 11:e0155626 DOI 10.1371/journal.pone.0155626.
Palomares F, Roques S, Chávez C, Silveira L, Keller C, Sollmann R, Mello do Prado D,Carignano Torres P, Adrados B, Godoy JA, De Almeida Jácomo AT, Mundim Tor-res N, Malzoni FurtadoM, López-Bao JV. 2012.High proportion of male faeces injaguar populations. PLOS ONE 7:e52923 DOI 10.1371/journal.pone.0052923.
Peters RP, Mech LD. 1975. Scent-marking in wolves: radio-tracking of wolf packs hasprovided definite evidence that olfactory sign is used for territory maintenance andmay serve for other forms of communication within the pack as well. AmericanScientist 63:628–637.
R Core Team. 2016. R: a language and environment for statistical computing. Vienna: RFoundation for Statistical Computing. Available at https://www.R-project.org .
Rabinowitz AR, Nottingham BG. 1986. Ecology and behaviour of the jaguar (Pantheraorca) in Belize, Central America. Journal of Zoology 210:149–159.
Reiger I. 1979. Scent rubbing in carnivores. Carnivore 2:17–25.Roques S, Adrados B, Chavez C, Keller C, MagnussonWE, Palomares F, Godoy JA.
2011. Identification of Neotropical felid faeces using RCP-PCR.Molecular EcologyResources 11:171–175 DOI 10.1111/j.1755-0998.2010.02878.x.
Roques S, FurtadoM, Jácomo TA, Silveira L, Sollmann R, Torres NM, GodoyJA, Palomares F. 2014.Monitoring jaguar populations Panthera onca withnon-invasive genetics: a pilot study in Brazilian ecosystems. Oryx 48:361–369DOI 10.1017/S0030605312001640.
Palomares et al. (2018), PeerJ, DOI 10.7717/peerj.4983 24/25

Rubio Y, Bárcenas H, Beltrán A. 2010. Meseta de Cacaxtla. In: Ceballos G, MartínezL, García A, Espinoza E, Bazaury J, Dirzo R, eds. En Diversidad, amenazas y áreasprioritarias para la conservación de las selvas secas del Pacífico de México. F.C.E.México.
Schaller GB. 1972. The Serengeti lion. Chicago: University of Chicago Press.Schaller GB, Crawshaw Jr PG. 1980.Movement patterns of jaguar. Biotropica
12:161–168 DOI 10.2307/2387967.Seidensticker JC, Hornocker MG,WilesWV,Messick JP. 1973.Mountain lion social
organization in the Idaho primitive area.Wildlife Monographs 35:3–60.Smith JLD, McDougal C, Miquelle D. 1989. Scent marking in free-ranging tigers,
Panthera tigris. Animal Behaviour 37:1–10 DOI 10.1016/0003-3472(89)90001-8.Torres-Barragán A, Anaya AL, Alatorre R, Toriello C. 2004. Entomopathogenic
fungi from ‘El Eden Ecological Reserve, Quintana Roo, Mexico.Mycopathologia158:61–71 DOI 10.1023/B:MYCO.0000038424.01369.c8.
Palomares et al. (2018), PeerJ, DOI 10.7717/peerj.4983 25/25