screening 2014 - diva-portal.orgdiva-portal.org/smash/get/diva2:932530/fulltext01.pdf · sediment...
TRANSCRIPT

NUMBER C 138 NOVEMBER 2015 REPORT
Screening 2014 Analysis of UV-filters (and fragrances) used in cosmetics and textiles
Mikael Remberger, Momina Bibi, Lennart Kaj, Eva Brorström-Lundén

NATIONAL
ENVIRONMENTAL
MONITORING
COMMISSIONED BY
THE SWEDISH EPA
FILE NO.
CONTRACT NO.
PROGRAMME AREA
SUBPROGRAMME
NV-02760-14
2219-14-002
MILJÖGIFTSSAMORDNIG
SCREENING
Analysis of UV-flters (and fragrances) used in cosmetics and textiles
Report authors
Mikael Remberger, Momina Bibi, Lennart Kaj,
Eva Brorström-Lundén
Responsible publisher
IVL Swedish Environmental Research Institute
Postal address
P.O Box 210 60, S-100 31 Stockholm, Sweden
Telephone
+46 (0)10-788 65 00
Report title and subtitle
Screening 2014
Analysis of UV-filters (and fragrances) used in
cosmetics and textiles
Purchaser
Swedish Environmental Protection Agency, Unit for
hazardous substances and waste
SE-106 48 Stockholm, Sweden
Funding
National environmental monitoring
Keywords for location (specify in Swedish)
Keywords for subject (specify in Swedish)
UV-filter, doftämnen, kosmetika, solskyddsmedel
Period in which underlying data were collected
2014
Summary
A screening study concerning mainly substances used as UV-filters in sunscreen lotions has been
performed. The sampling program was focused on water and sediment from bathing sites and effluent
and sludge from WWTPs. Biota samples (fish muscle) were also included. Chemical analysis was
carried out for 22 UV-filters (of which 18 are used mainly in cosmetic products and 4 in textiles) and 2
substances used as fragrances. In surface water from a lake with a bathing site, sampled at noon on a
popular day for swimming, 13 UV-filters were found in a summed concentration of 170 ng/l. Dominating
compounds were OC, DBENZO, BP3, HMS, 3BC and ethylhexyl¬triazone. The dominating compounds
in sediment close to the bathing site were OC, DBENZO, BP3, EHS and UV360.
In WWTP effluents, all investigated substances, with the exception of BMDM and UV327, were detected.
Highest individual concentrations were found for bemotrizinol (2500 ng/l), UV360 (650 ng/l) and
DBENZO (560 ng/l). OC, BP, and OMC were also important and frequently detected components in the
effluents. In WWTP sludge, OC and UV360 were found in highest concentrations (44 000 and 21 000
ng/g dw respectively), the maximum summed concentration was 99 000 ng/g dw. This is in the same
range as what is often found as a summed concentration for phthalate plasticizers in sludge. Sediment
sampled downstream the discharge point of a WWTP did not show as high concentrations of UV-filters
as was found in the vicinity of the investigated bathing site. The highest levels of the UV-filter BP3
measured in sediments indicates a possible environmental risk.
To the best of our knowledge, ethylhexyltriazone, bemotrizinol, UV360 and iscotrizinol have not been
measured before in the Swedish environment and appears to be new important contaminants at bathing
sites and in WWTPs.

3
Author: Mikael Remberger, Momina Bibi, Lennart Kaj, Eva Brorström-Lundén
Funded by: Swedish Environmental Protection Agency
Report number: C 138
Edition: Only available as PDF for individual printing
© IVL Swedish Environmental Research Institute 2015
IVL Swedish Environmental Research Institute Ltd.,
P.O Box 210 60, S-100 31 Stockholm, Sweden
Phone: +46-10-788 65 00 Fax: +46-010-788 65 90
www.ivl.se
This report has been reviewed and approved in accordance with IVL's audited and approved management
system.

4
Table of Contents
Summary .............................................................................................................................................................. 5
Sammanfattning .................................................................................................................................................. 6
1 Introduction ............................................................................................................................................... 7
2 Chemical properties and use .................................................................................................................... 10
3 Previous measurements in the environment .......................................................................................... 13
4 Sampling program .................................................................................................................................... 13
5 Methods ..................................................................................................................................................... 15
5.1 Sampling ............................................................................................................................................ 15
5.2 Chemical analysis ............................................................................................................................. 16
5.2.1 GC-MS/MS analysis ................................................................................................................. 16
5.2.2 LC-MS/MS analysis ................................................................................................................. 17
5.2.3 Quality control ......................................................................................................................... 18
6 Results and discussion ............................................................................................................................. 20
6.1 Background ...................................................................................................................................... 21
6.2 Bathing sites ..................................................................................................................................... 21
6.3 WWTPs ............................................................................................................................................. 28
6.4 Fish ................................................................................................................................................... 36
6.5 Simplified risk assessment .............................................................................................................. 37
7 Conclusions .............................................................................................................................................. 41
8 Acknowledgements .................................................................................................................................. 42
9 References ................................................................................................................................................ 42
Appendix 1 Sample list ..................................................................................................................................... 45
Appendix 2 Results ........................................................................................................................................... 48

IVL-rapport C 138 Screening 2014 - Analysis of UV-filters (and fragrances) used in cosmetics and textiles
5
Summary
A screening study concerning mainly substances used as UV-filters in sunscreen lotions has been performed. The two main routes for these UV-filters to the aquatic environment after use are direct releases from the skin during bathing (outdoor) or during showering/bathing or washing of textiles. In the latter case the substances of concern will be transported with waste water to a waste water treatment plant (WWTP) and eventually to its receiving water. Thus, the sampling program was focused on water and sediment from bathing sites and effluent and sludge from WWTPs. Biota samples (fish muscle) were also included.
Chemical analysis was carried out for 22 UV-filters (of which 18 are used mainly in cosmetic products and 4 in textiles) and 2 substances used as fragrances.
In surface water from a lake with a bathing site, sampled at noon on a popular day for swimming, 13 UV-filters were found in a summed concentration of 170 ng/l. Dominating compounds were OC, DBENZO, BP3, HMS, 3BC and ethylhexyltriazone. Water samples taken at increasing distances from the bathing site showed an influence area on the km scale for many of the substances. In the morning and evening of the same day the number of detected substances and the summed concentrations were lower (approx. 50 ng/l). The concentrations on one day before and one day after the bathing season were even lower (approx 10 ng/l).
The dominating compounds in sediment close to the bathing site were OC, DBENZO, BP3, EHS and UV360. Sediment samples from increasing distances showed an impact from the bathing site for most substances, also for UV360 and iscotrizinol, which could not be seen in the water column. The concentrations in sediments during the season did not vary much, but UV360 showed an accumulation from May to October.
In WWTP effluents, all investigated substances, with the exception of BMDM and UV327, were detected. Highest individual concentrations were found for bemotrizinol (2500 ng/l), UV360 (650 ng/l) and DBENZO (560 ng/l). OC, BP, and OMC were also important and frequently detected components in the effluents.
In WWTP sludge, OC and UV360 were found in highest concentrations (44 000 and 21 000 ng/g dw respectively), the maximum summed concentration was 99 000 ng/g dw. This is in the same range as what is often found as a summed concentration for phthalate plasticizers in sludge.
Sediment sampled downstream the discharge point of a WWTP did not show as high concentrations of UV-filters as was found in the vicinity of the investigated bathing site. The highest levels of the UV-filter BP3 measured in sediments indicates a possible environmental risk.
To the best of our knowledge, ethylhexyltriazone, bemotrizinol, UV360 and iscotrizinol have not been measured before in the Swedish environment and appears to be new important contaminants at bathing sites and in WWTPs.

IVL-rapport C 138 Screening 2014 - Analysis of UV-filters (and fragrances) used in cosmetics and textiles
6
Sammanfattning
En screeningundersökning som huvudsakligen omfattat substanser som används som UV-filter i solskyddskrämer har utförts. Huvudsakliga vägar för dessa substanser att transporteras ut i miljön är genom direkt avnötning från huden vid badning i en sjö, eller via transport med tvättvatten till ett reningsverk och vidare till recipienten. Provtagningsprogrammet fokuserades på ytvatten och sediment från badsjöar och utgående vatten och slam från kommunala reningsverk. Biotaprover (fiskmuskel) ingick också.
Kemisk analys gjordes av 22 UV-filter (av vilka 18 huvudsakligen används i kosmetiska produkter och 4 i textilier) och två doftämnen.
I ytvatten från en badsjö provtaget mitt på dagen under en dag med många badande detekterades 13 UV-filter. Den sammanlagda koncentrationen var 170 ng/l. Dominerande föreningar var OC, DBENZO, BP3, HMS, 3BC och ethylhexyltriazone. Vattenprov insamlade på ökande avstånd från badplatsen visade ett påverkansområde i storleksordningen km för många av substanserna. Samma dags morgon och kväll var antalet substanser och även den sammanlagda koncentrationen lägre (ca 50 ng/l). Koncentrationer i prover tagna före och efter badsäsongen var ännu lägre (ca 10 ng/l).
Dominerande föreningar i sediment nära badplatsen var OC, DBENZO, BP3, EHS och UV360. Sediment från längre avstånd visade en påverkan från badplatsen för de flesta substanserna, även för UV360 och iscotrizinol, vilket inte kunde ses i vattenfasen. Sedimentkoncentrationen varierade inte så mycket under säsongen, men för UV360 sågs en ökning från maj till oktober.
I utgående vatten från reningsverk kunde alla substanser med undantag av BMDM och UV327 detekteras. Högsta koncentrationer uppmättes för bemotrizinol (2500 ng/l), UV360 (650 ng/l) and DBENZO (560 ng/l). OC, BP och OMC hittades också frekvent.
I reningsverksslam hittades OC och UV360 i högst koncentrationer (44 000 respektive 21 000 ng/g ts). den högsta sammanlagda koncentrationen var 99 000 ng/g ts. Detta är i samma storleksordning som vad som ofta uppmäts som sammanlagd koncentration av ftalater i reningsverksslam.
Sediment som provtagits nedströms utsläppspunkten för ett kommunalt reningsverk uppvisade inte lika höga koncentrationer av UV-filter som i sediment från badplatsen. De högsta koncentrationer som uppmätts av UV-filtret BP3 i sediment är tillräckligt höga för att utgöra en risk för miljöpåverkan.
Så vitt vi känner till har ethylhexyltriazone, bemotrizinol, UV360 och iscotrizinol inte tidigare påvisats som föroreningar i svensk miljö.

IVL-report C 138 Screening 2014 - Analysis of UV-filters (and fragrances) used in cosmetics and textiles
7
1 Introduction
As an assignment from the Swedish Environmental Protection Agency, a screening study concerning substances used as UV-filters or fragrances in cosmetic products has been performed. UV-filters are used in sunscreen lotions to protect the skin against sunburn and skin cancer caused by the UV (ultra violet) radiation from sunlight. Also some UV-filters used mainly in textile applications were included.
Two routes for UV-filters in cosmetics to the aquatic environment after use are direct releases from the skin during bathing (outdoor), during showering/bathing or washing of textiles. In the latter case the substances of concern will be transported with waste water to a waste water treatment plant (WWTP) and eventually to its receiving water.
The overall objectives of this screening were to assess the occurrence of selected substances in surface water and sediment and to identify the importance of the different pathways. This study is a follow up on a previous screening from 2009 (Remberger et al 2011).
The national sample program was supplemented with a regional program where six county administrative boards participated.
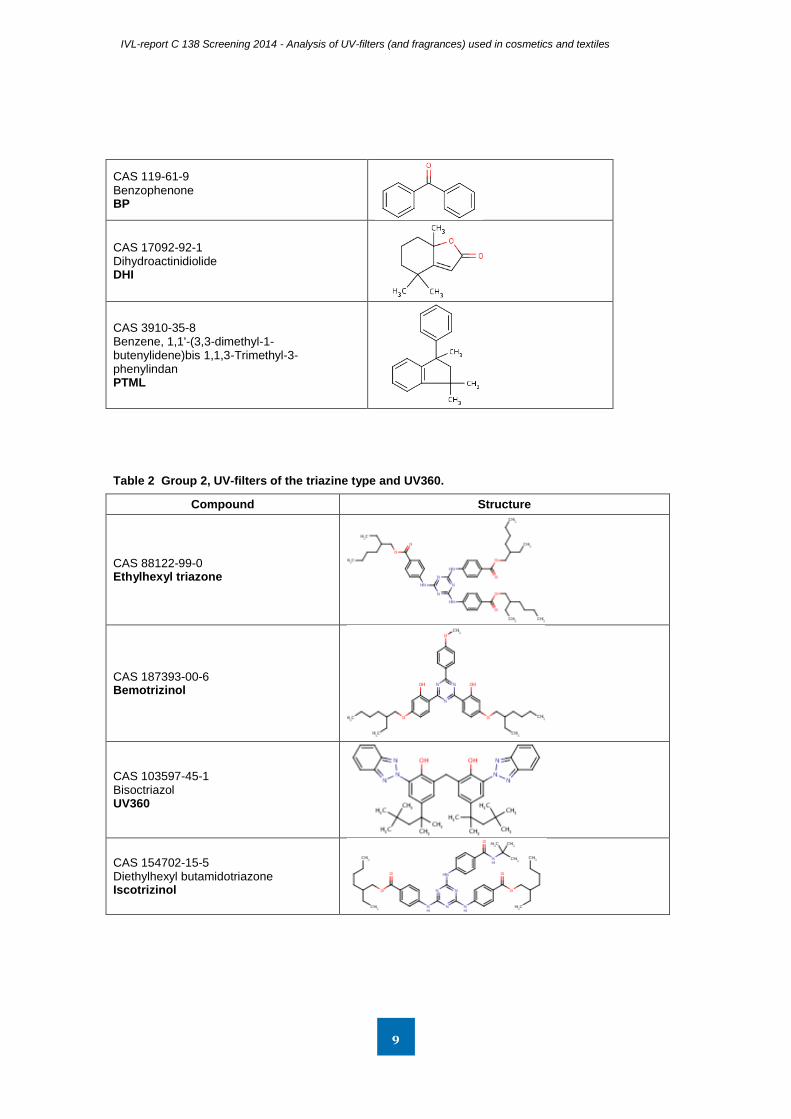
The substances included in the study are divided into three groups. The substances in the basic group, 14 UV-filters and two fragrances are listed in Table 1. The second group included three UV-filters of the triazine type and the high molecular weight benzotriazole UV360, Table 2. Finally, a third group consisted of four benzotriazoles, UV-filters mainly used in textile applications, Table 3. (In an early stage of the project the substance groups in Table 2 and Table 3 were referred to as Option 2 and Option 1 respectively.)
Triclosan (2,4,4'-Trichloro-2'-hydroxy diphenyl ether, CAS 3380-34-5) was included as a reference compound that can be used as a tracer for WWTP effluent.
Table 1 Group 1, Basic group , UV-filters and fragrances (DHI and PTML) used in cosmetics.
Substance Structure
CAS 70356-09-1 Avobenzone Butylmethoxydibenzoyl methane BMDM
CAS 118-60-5 2-Ethylhexyl salicylate EHS
O O
CH3
H3C
H3C
O
CH3
O
O OH
H3C
H3C

IVL-report C 138 Screening 2014 - Analysis of UV-filters (and fragrances) used in cosmetics and textiles
8
CAS 52253-93-7, 118-56-9 Homomenthyl salicylate 3,3,5-Trimethyl cyclohexyl salicylate Homosalate HMS
CAS 15087-24-8 3-Benzylidene camphor 3-BC
CAS 36861-47-9, 38102-62-4 4-Methyl benzylidene camphor Eusolex 6300 4-MBC
CAS 131-57-7 Oxybenzone Benzophenon-3 BP3
OOH
O
CH3
CAS 131-56-6 2,4-Dihydroxybensophenone DHB
CAS 131-53-3 2,2´-Dihydroxy-4-metoxybensophenone DHMB
CAS 21245-02-3 Ethylhexyl p-dimethylaminobenzoat EPABA
CAS 302776-68-7 Diethylamino hydroxybenzoylhexyl benzoate DBENZO
CAS 71617-10-2 2-Hydroxy-4-methoxybenzophenone Isoamyl p-methoxycinnamate IMC CAS 5466-77-3 2-Propenoic acid, 3-(4-methoxyphenyl)-, 2-ethylhexyl ester Ethylhexyl methoxycinnamate Octyl methoxycinnamate OMC
CAS 6197-30-4 Octocrylene OC
O
OOH
CH3
CH3
CH3
H3C
H3C
H3C
O
H3C
CH3
CH3O
CH3
O
O
N
CH3
CH3
CH3
H3C
CH3
CH3
O
O
O
H3C
O
O
O
CH3
CH3
CH3
IVL-report C 138 Screening 2014 - Analysis of UV-filters (and fragrances) used in cosmetics and textiles
9
CAS 119-61-9 Benzophenone BP
CAS 17092-92-1 Dihydroactinidiolide DHI
CAS 3910-35-8 Benzene, 1,1'-(3,3-dimethyl-1-butenylidene)bis 1,1,3-Trimethyl-3-phenylindan PTML
Table 2 Group 2, UV-filters of the triazine type and UV360.
Compound Structure
CAS 88122-99-0 Ethylhexyl triazone
CAS 187393-00-6 Bemotrizinol
CAS 103597-45-1 Bisoctriazol UV360
CAS 154702-15-5 Diethylhexyl butamidotriazone Iscotrizinol
IVL-report C 138 Screening 2014 - Analysis of UV-filters (and fragrances) used in cosmetics and textiles
10
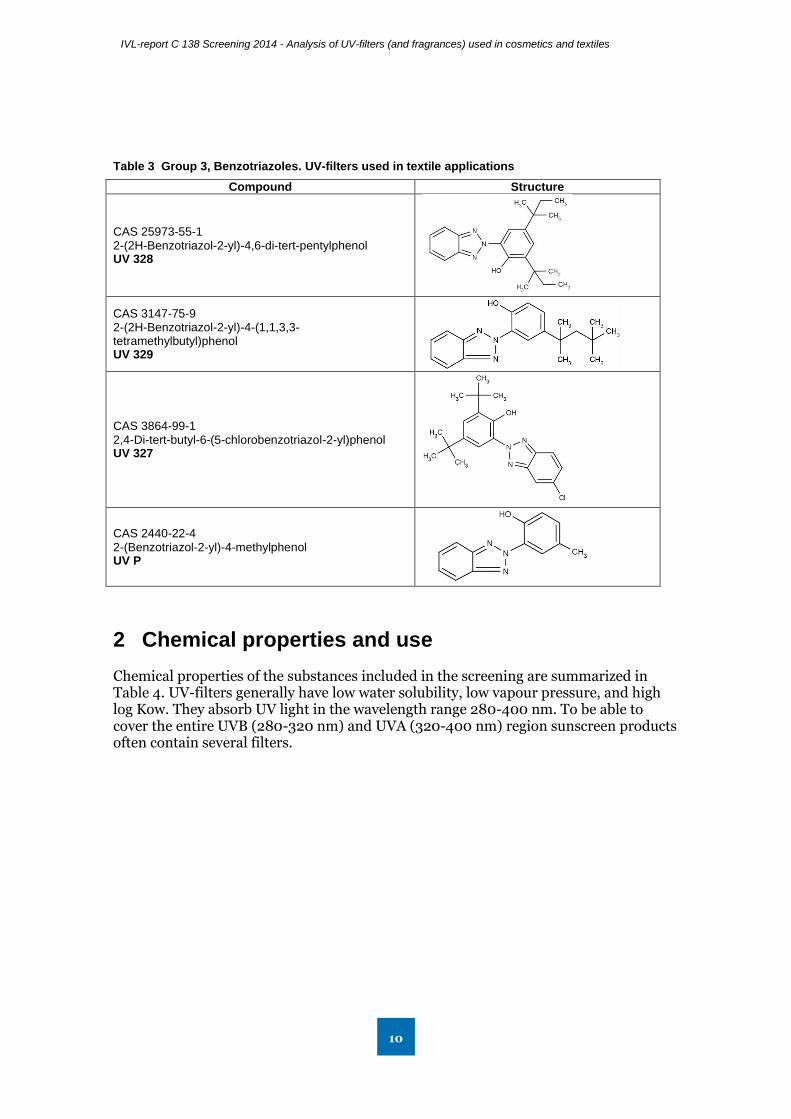
Table 3 Group 3, Benzotriazoles. UV-filters used in textile applications
Compound Structure
CAS 25973-55-1 2-(2H-Benzotriazol-2-yl)-4,6-di-tert-pentylphenol UV 328
CAS 3147-75-9 2-(2H-Benzotriazol-2-yl)-4-(1,1,3,3-tetramethylbutyl)phenol UV 329
CAS 3864-99-1 2,4-Di-tert-butyl-6-(5-chlorobenzotriazol-2-yl)phenol UV 327
CAS 2440-22-4 2-(Benzotriazol-2-yl)-4-methylphenol UV P
2 Chemical properties and use
Chemical properties of the substances included in the screening are summarized in Table 4. UV-filters generally have low water solubility, low vapour pressure, and high log Kow. They absorb UV light in the wavelength range 280-400 nm. To be able to cover the entire UVB (280-320 nm) and UVA (320-400 nm) region sunscreen products often contain several filters.

IVL-report C 138 Screening 2014 - Analysis of UV-filters (and fragrances) used in cosmetics and textiles
11
Table 4. Physical and chemical properties.
Substance Log Kow pKa Reference
BMDM 4.51 9.74 Rodil et al 2008
EHS 5.97 8.13 Rodil et al 2008
HMS 6.16 8.09 Rodil et al 2008
3-BC 5.3 - Ramos et al., 2015
4-MBC 5.47 - Giokas et al 2005
BP3 3.79; 3.52 7.56 Rodil et al 2008; Jeon et al. 2006
DHB 2.96 - ChemIDplus, (2015)
DHMB 3.82 - ChemIDplus, (2015)
EPABA 6.15 2.39 Rodil et al 2008
DBENZO 6.54 - Affected by pH. QSAR in Wernersson 2008
IMC 4.33 - ChemIDplus (2015)
OMC 5.80 - ChemIDplus (2015)
OC 6.88 - ChemIDplus (2015)
BP 3.18 - ChemIDplus (2015)
DHI 2.2 - PubChem.ncbi.hlm,hih.gov
PTML 5.9 - ChemIDplus (2015)
Ethylhexyl triazone 14.5 - PubChem.ncbi.hlm,hih.gov
Bemotrizinol 8.8 - PubChem.ncbi.hlm,hih.gov
UV360 12.46 7.62 Montesdeoca-Esponda et al. 2013
Izcotriazol 11.8 - PubChem.ncbi.hlm,hih.gov
UV328 7.25; 8.85 8.28 ChemIDplus (2015) Carpinteiro et al. 2010
UV329 6.2 - Thomas et al., 2013
UV327 9.41 7.81 Carpinteiro et al. 2010
UV P 4.31 4.30 ChemIDplus (2015), Carpinteiro et al. 2010
Group 1
BMDM is a sunscreen with good coverage of the UVA-spectrum and is often combined with UVB-filters in sunscreen products. It has complexing properties and metal ions e.g. Fe(III) may therefore induce photochemical degradation. BMDM degrades in the sunlight and loses effectiveness over time.
The salicylic acid based sunscreen filters (EHS, HMS) absorb ultraviolet rays with a wavelength from 295 nm to 315 nm (UVB). They do not protect against UVA and are relatively weak sunscreen filters. When exposed to sunlight HMS undergoes some degradation1.
Benzylidene camphor substances, (3-BC, 4-MBC) are agents that absorbs in the UVB range. All the camphor sunscreens are supposed to dissipate the photon energy by cis-trans isomerisation (Buser et al., 2005).
UV-filters based on bensophenone (BP3, DHB, DHMB, DBENZO) are typical broad-band filters and absorb both in UVA and UVB. Benzophenone filters have high stability to UV-light (BASF, 1995).
EPABA is used as an UVB blocker in sunscreens.
1 www.smartskincare.com

IVL-report C 138 Screening 2014 - Analysis of UV-filters (and fragrances) used in cosmetics and textiles
12
Cinnamic acid derivatives (IMC, OMC) absorb ultraviolet radiation in the UVB range. When exposed to sunlight OMC is converted into a less UV absorbing form, which reduces its effectiveness. This conversion can be partly prevented by certain other UV blockers 2. OMC is the most common UV-filter in sun lotions, used in over 90% of those available in Europe (Thomas et al, 2014).
OC is a highly stable sunscreen filter and does not degrade in sunlight. It protects other UV blocking agents from UV-induced degradation. It absorbs UVB, short UVA (UVA-2) but not long UVA. It is a relatively weak sunscreen, inadequate when used alone 3.
BP has a broad use as UV adsorbent e.g as photo initiator in UV-curing applications such as inks, imaging, and as clear coatings in the printing industry. Benzophenone prevents UV light from damaging scents and colours in products such as perfumes and soaps. It can also be added to plastic packaging as an UV blocker to prevent photo-degradation of the packaging polymers 4.
Group 2.
The triazines ethylhexyl triazone, bemotrizinol and iscotrizinol are used in cosmetic products. UV360 is not a triazine but have similar properties and usage and is therefore mentioned in this context. The substances in this group are extremely lipophilic (Table 4) and are resistant to UV-degradation. They are therefore also used as scavengers to other more UV-labile filters.
Group 3.
Benzotriazoles (UV328, UV329, UV327, UV P) are used as UV stabilizers in coated textiles. Benzotriazoles may to a large extent enter Sweden through imported finished goods.
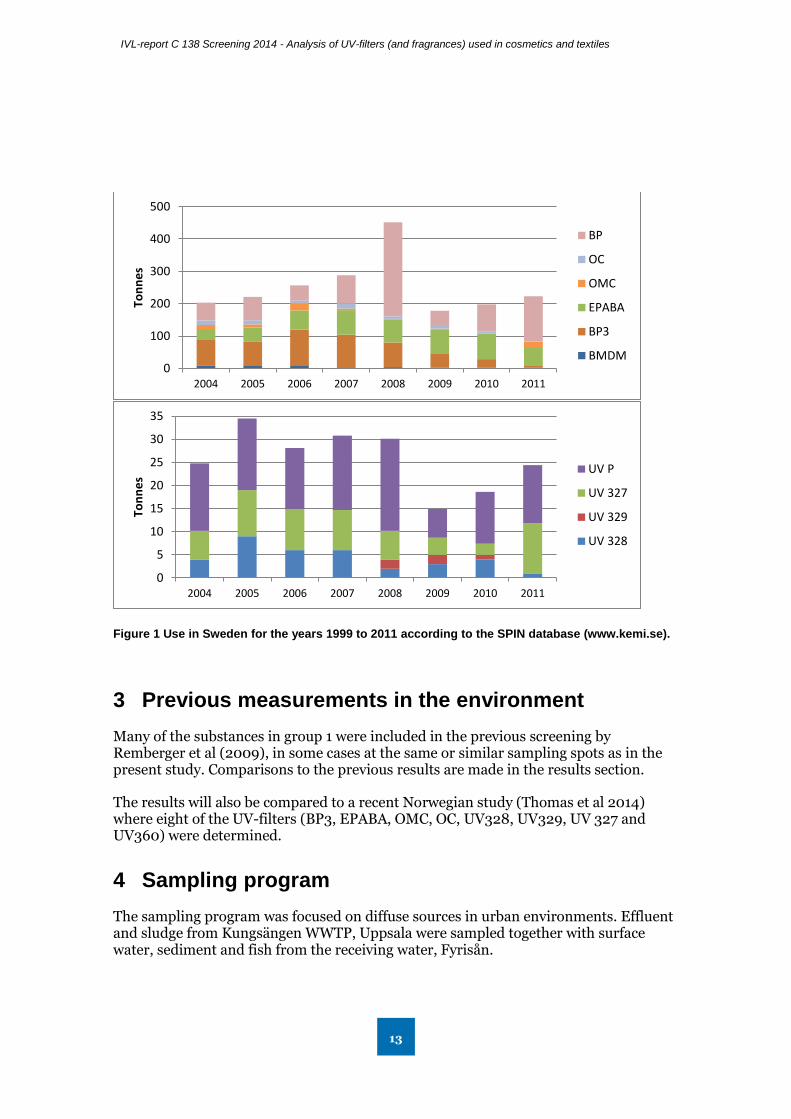
The use in Sweden according to the SPIN (Substances in preparations in the Nordic countries) database for BMDM, BP3, EPABA, OMC, OC, BP, UV328, UV329, UV327 and UV P is illustrated in Figure 1. EHS, DHB and PTML have registered annual amounts of zero or one tonne. Registered amounts of HMS, 4MBC and DBENZO are confidential. 3BC, DHMB, IMC and DHI were not registered in 2011. The amount of compounds that are imported as ingredients in finished cosmetic products is not included in the SPIN database, therefore the actual consumption is most likely higher than the figures presented.
2 www.smartskincare.com 3 www.smartskincare.com 4 https://en.wikipedia.org/wiki/Benzophenone
IVL-report C 138 Screening 2014 - Analysis of UV-filters (and fragrances) used in cosmetics and textiles
13
Figure 1 Use in Sweden for the years 1999 to 2011 according to the SPIN database (www.kemi.se).
3 Previous measurements in the environment
Many of the substances in group 1 were included in the previous screening by Remberger et al (2009), in some cases at the same or similar sampling spots as in the present study. Comparisons to the previous results are made in the results section.
The results will also be compared to a recent Norwegian study (Thomas et al 2014) where eight of the UV-filters (BP3, EPABA, OMC, OC, UV328, UV329, UV 327 and UV360) were determined.
4 Sampling program
The sampling program was focused on diffuse sources in urban environments. Effluent and sludge from Kungsängen WWTP, Uppsala were sampled together with surface water, sediment and fish from the receiving water, Fyrisån.
0
100
200
300
400
500
2004 2005 2006 2007 2008 2009 2010 2011
Ton
ne
s
BP
OC
OMC
EPABA
BP3
BMDM
0
5
10
15
20
25
30
35
2004 2005 2006 2007 2008 2009 2010 2011
Ton
ne
s
UV P
UV 327
UV 329
UV 328

IVL-report C 138 Screening 2014 - Analysis of UV-filters (and fragrances) used in cosmetics and textiles
14
Surface water was sampled upstream (-1.7 km) and close to (5 m) the effluent discharge point. Samples were also taken 150 m downstream (ds 1) and 4.6 km downstream (ds 3) the discharge point. The annual average flow in Fyrisån is 8.6 m3/s and the average effluent flow from Kungsängsverket is 2 200 m3/h (Uppsala vatten, 2011), i.e. a mean dilution factor of 14.
Effluent and sludge from the following WWTPs were also included: Ön, Umeå, Henriksdal, Stockholm and Rya, Göteborg.
For sampling at, and in the vicinity of a bathing site, the Lake Rönningesjön, Täby (Figure 2) was selected. This lake has a length of approx. 2.2 km and a width of 0.2–0.3 km. The average and maximum depth is 3.4 and 4.7 m respectively. It has two popular bathing sites, one at “J”, and one south west of “5”. Surface water and sediment were sampled from a jetty (J) and from a boat in a gradient from the jetty (sampling points 1 – 6) during a popular day for swimming in August 2014. To get the daily variation, water samples from the jetty were collected in the morning and in the evening of the same day. Surface water and sediment were also sampled in May and October, before and after the bathing season.
Figure 2 Map showing Lake Rönningesjön with sampling points.
Background samples (surface water, sediment and fish) were taken from the Lake Tärnan, Vallentuna, within the framework of the national freshwater environmental monitoring and from Lake Tärnan which has no connection to effluents from WWTPs but may receive direct anthropogenic contamination from people in the region.
IVL-report C 138 Screening 2014 - Analysis of UV-filters (and fragrances) used in cosmetics and textiles
15
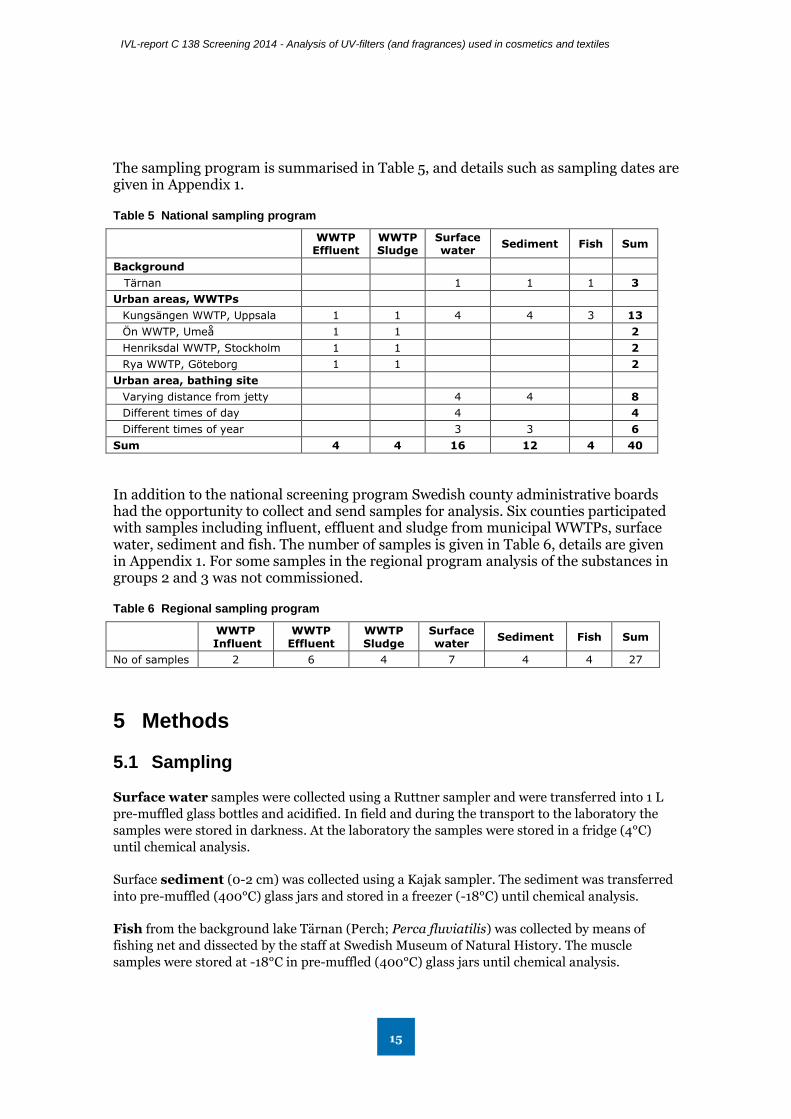
The sampling program is summarised in Table 5, and details such as sampling dates are given in Appendix 1.
Table 5 National sampling program
WWTP Effluent
WWTP Sludge
Surface water
Sediment Fish Sum
Background
Tärnan
1 1 1 3
Urban areas, WWTPs
Kungsängen WWTP, Uppsala 1 1 4 4 3 13
Ön WWTP, Umeå 1 1 2
Henriksdal WWTP, Stockholm 1 1 2
Rya WWTP, Göteborg 1 1 2
Urban area, bathing site
Varying distance from jetty
4 4
8
Different times of day 4 4
Different times of year 3 3 6
Sum 4 4 16 12 4 40
In addition to the national screening program Swedish county administrative boards had the opportunity to collect and send samples for analysis. Six counties participated with samples including influent, effluent and sludge from municipal WWTPs, surface water, sediment and fish. The number of samples is given in Table 6, details are given in Appendix 1. For some samples in the regional program analysis of the substances in groups 2 and 3 was not commissioned.
Table 6 Regional sampling program
WWTP Influent
WWTP Effluent
WWTP Sludge
Surface water
Sediment Fish Sum
No of samples 2 6 4 7 4 4 27
5 Methods
5.1 Sampling
Surface water samples were collected using a Ruttner sampler and were transferred into 1 L
pre-muffled glass bottles and acidified. In field and during the transport to the laboratory the
samples were stored in darkness. At the laboratory the samples were stored in a fridge (4°C)
until chemical analysis.
Surface sediment (0-2 cm) was collected using a Kajak sampler. The sediment was transferred
into pre-muffled (400°C) glass jars and stored in a freezer (-18°C) until chemical analysis.
Fish from the background lake Tärnan (Perch; Perca fluviatilis) was collected by means of
fishing net and dissected by the staff at Swedish Museum of Natural History. The muscle
samples were stored at -18°C in pre-muffled (400°C) glass jars until chemical analysis.
IVL-report C 138 Screening 2014 - Analysis of UV-filters (and fragrances) used in cosmetics and textiles
16
The fish samples from River Fyrisån were collected using fishing net. From the total catch
approximately 10 individuals of Perch (Perca fluviatilis) were selected, representing the second-
fifth year classes. The fish samples were wrapped in pre-cleaned aluminium foil and stored in a
freezer (-18°C) until dissection. Fish included in the regional sample program was delivered as
whole fish. Fish muscle was dissected at IVL laboratory using solvent washed scalpels and were
stored at -18°C in pre-muffled (400°C) glass jars until chemical analysis.
The staff at the different WWTPs collected effluent water (day samples). The samples were
collected in 1 L glass bottles. When the samples arrived to the laboratory they were acidified and
stored at –18°C until chemical analysis.
Sludge samples, from the anaerobic chambers, were taken by the staff at the different
WWTPs. The sludge was transferred into muffled glass jars and stored at -18°C until analysed.
5.2 Chemical analysis
The substances in Table 1 and Table 3 were analysed by gas chromatography followed by
tandem mass spectroscopy (GC-MS/MS), whereas the substances in Table 2 were analysed by
liquid chromatography followed by tandem mass spectroscopy (LC-MS/MS).
5.2.1 GC-MS/MS analysis
5.2.1.1 Sample preparation
Water sample volumes varied between 200 and 1000 ml depending on sample type. The un-
filtrated and acidified water was spiked with recovery standards and extracted using a solid
phase extraction column (Isolut ENV+, 200 mg) with Filter aid 400 on the top (3.5 g). The
cartridges were activated with toluene, methyl tert-butyl ether (MTBE), dichloromethane
(DCM), methanol and Milli-Q water. Samples were applied to the SPE columns at a flow rate of
5 ml/min. Milli-Q water was used to wash the SPE column before eluting. The analytes were
subsequently eluted with methanol, acetone, DCM and a mixture of hexane and MTBE (3:1).
The final extract was diluted with acidified ultra-pure water and extracted with a mixture of
toluene and MTBE (3:1).
Freeze dried sediment (2 g) or sludge (1 g) was acidified with phosphoric acid, spiked with
recovery standard and extracted with 15 mL MTBE: acetonitrile(ACN):methanol (60:30:10 )
using Microwave-assisted extraction (MAE) with a time program of 10 minutes at 80°C. The
methanol was washed away by shaking the extract with acidified water. The water was extracted
twice with hexane:MTBE (1:1). The extracts were pooled and cleaned-up on “graphitised carbon
black” (GCB) columns and subsequently fractionated on a silica gel column into two fractions F1
and F2 containing fragrance (DHI, PTML) and UV-filters respectively. The F1-fraction
contained high amount of elementary sulphur which was removed with the aid of metallic
cupper.
Fish muscle (10 g) was placed in a PTFE bomb, spiked with recovery standard, homogenised in
ACN and extracted using Microwave-assisted extraction (MAE) with a time program of 15
minutes at 85°C. The sample was transferred to a glass test tube and sodium sulphate and
sodium chloride was added. The sample was mixed and centrifuged. The extraction with ACN
IVL-report C 138 Screening 2014 - Analysis of UV-filters (and fragrances) used in cosmetics and textiles
17
was repeated. The pooled extract was diluted with water and extracted with hexan:MTBE and
hexan:DCM. The extract was dried over sodium sulphate, concentrated and subjected to clean-
up on a PSA (ethylenediamine-N-propyl) column.
5.2.1.2 Derivatization and instrumental analysis
The extract was reacted with the silylating reagent MSTFA (N-methyl-N-trifluoroacetamide)
and analysed for the substances in Table 1 and Table 3, with the exception of BMDM, using
GC-MS/MS.
In a second step the MSTFA derivatised extracts were methylated according to Nagtegaal et al.
(1997) with minor modifications. The extract was evaporated to dryness and re-dissolved in dry
MTBE (dried over molecular sieve 5 Å). Methyl-iodide and NaH was added and the test tube was
closed and shaken. The reaction was performed at 80°C for 2 hours. The test tube was cooled
and water and hexane was added. After extraction the organic phase was dried, concentrated
and transferred to a GC-vial and analysed for BMDM using GC-MS/MS analysis.
GC-MS/MS analysis was performed on a gas chromatograph (GC) coupled to a 7000A Triple
Quad MS (Agilent Technologies, Inc. Santa Clara, CA, USA). The instrument was equipped with
an auto injector (Agilent 7683B). The injection was in pulsed splitless mode (1 µl) at 240°C. The
detector was used in MRM mode with electron ionisation at energy of 70 eV. The fused silica
capillary column (VF-5MS 30 m × 0.25 mm i.d. × 0.25 µm film thickness, Varian) was held at
45°C for 1 min., ramped 15°C/min to 200°C, 5°C/min to 300°C, and 15°C/min to 325°C and
held at 325°C for 2 min. Helium was used as carrier gas. The analytes were identified by their
characteristic retention times and one product ion used for quantification. A second product ion
was used as qualifier to increase specificity of the detection. Quantification was based on
comparison of the peak area to the known peak area of the standard analytes.
5.2.2 LC-MS/MS analysis
5.2.2.1 Sample preparation
Water sample volumes varied between 200 and 1000 ml depending on sample type. The un-
filtrated and acidified water was spiked with recovery standards and extracted using solid phase
extraction (Isolute C18 –EC, 500 mg). The C18 cartridges were activated with DCM, acetone and
Milli-Q water. Samples were applied to the SPE columns at a flow rate of 5 ml/min. Milli-Q
water was used to wash the SPE column before eluting. The analytes were subsequently eluted
with methanol, acetone, DCM and a mixture of hexane and MTBE (3:1). The final extract was
diluted with acidified ultra-pure water and extracted with a mixture of toluene and MTBE (3:1).
The solvent was changed to methanol prior to LC-MS analysis.
Freeze dried sediment (1 g d.w.) or sludge (0.5 g d.w) was acidified with phosphoric acid, spiked
with recovery standard and extracted with 10 mL MTBE:DCM:methanol (45:45:10) using MAE
with a time program of 15 minutes at 75°C. The methanol was washed away by shaking the
extract with acidified water. The water was extracted twice with hexane:MTBE (1:1). The
extracts were pooled and cleaned-up on PSA columns.

IVL-report C 138 Screening 2014 - Analysis of UV-filters (and fragrances) used in cosmetics and textiles
18
5.2.2.2 Instrumental analysis
LC-MS/MS analysis was performed using an UFLC liquid chromatography system (Shimadsu
Scientific Instruments, Columbia, USA), equipped with an auto sampler, a quaternary pump,
and on-line degassing system. The compound separation was performed with a reversed phase
C8 column (Thermo Scientific, HvPURITY C8, 3.0 mm ID x 50 mm length, 5 m). Gradient
elution was performed with 5 mM acetic acid and 5 mM ammonium acetate in water as solvent
A and methanol as solvent B. The analytical detector was a triple quadrupole mass spectrometer
API 4000 (Applied Biosystems, California, USA). The mass spectrometer interface was an
electrospray ionization (EI) source. The instrument altered between positive and negative mode
during detection. Instrument control and data processing were performed by the Analyst
software.
5.2.3 Quality control
Possible memory effects were evaluated by a blank injection of hexane after standard samples of
varying concentrations. Laboratory blank samples were included in each batch. Standards were
analysed in a wide concentration range (5–500 ng/ml) and were used for evaluating the
linearity, sensitivity - quantification limit (LOD) defined as 3 times the standard deviation of the
blank, reproducibility of retention, precision as repeatability, and column stability. Method
recoveries were determined by spiking the standard solution to matrix at the following
concentration levels: Milli-Q water (100 ng/l), surface water (100 ng/l) and sewage effluent
(1000 ng/l). Analyte addition was made with the criteria that the spiking would be at a level at
least three times the original concentration in surface water and sewage effluent, respectively.
Samples were quantified using internal standard method. Several calibration standards covering
the whole concentration range were measured before, in the middle and at the end of sample
sequences. The maximum difference between results at quantification and qualification mass
transition was set to 20% as criterion for positive identification.
UV-filters are additives used in personal care products which potentially may cause
contamination of samples. Thus, these products were avoided when handling the samples.
Furthermore, nitrile plastic gloves were used throughout the analytical work. The use of plastic
materials was avoided. Glass equipment and silica gel was heated (400°C; 8 hours) prior to use.
Using these precautions, we experienced no problems concerning background levels in
analytical blank samples.
Sludge is a very complex matrix and contains a large number of (organic) substances. These
"natural" organic substances may be present in very high concentrations which can interfere
with the identification of the target substances. Therefore, both the extraction clean-up and
instrumental analysis methods was adapted in order to address this problems especially with
sludge samples. This worked well for all analytes determined with GC-MS/MS but not for the
compounds in option 2 determined with LC-MS/MS. In this case the determination suffered
serious matrix ionization suppression as a result of charge competition in the ESI source
between compounds in the sample matrix and the target analytes. This effect resulted in
diminished and irreproducible analytic response, but after dilution of the extracts we obtained
reliable results.
The following quality criteria were used to ensure correct identification and quantification of the
target compound: (a) the retention times should match those of the standard compounds within
IVL-report C 138 Screening 2014 - Analysis of UV-filters (and fragrances) used in cosmetics and textiles
19
± 0.05 min., (b) the intensity ratios of the selected ions should be within ± 15% of the expected /
theoretical value and (c) the signal-noise ratios should be greater than 3:1 (Haglund et al., 1993).
Internal standard (known amount of a recovery standard added to the samples) approach were
used for quantification, thus all reported values are recovery-corrected according to the recovery
standard. Acceptable recovery rates were >50 %. Method blanks were included for each sample
batch and analysed to assess background interferences and possible contamination of the
samples.
The limit of detection (LOD) was defined as three times the blank samples noise but in
consideration of the actual sample noise in the chromatogram retention windows of the target
analytes. Possible background levels of analytes were subtracted.
IVL-report C 138 Screening 2014 - Analysis of UV-filters (and fragrances) used in cosmetics and textiles
20
6 Results and discussion
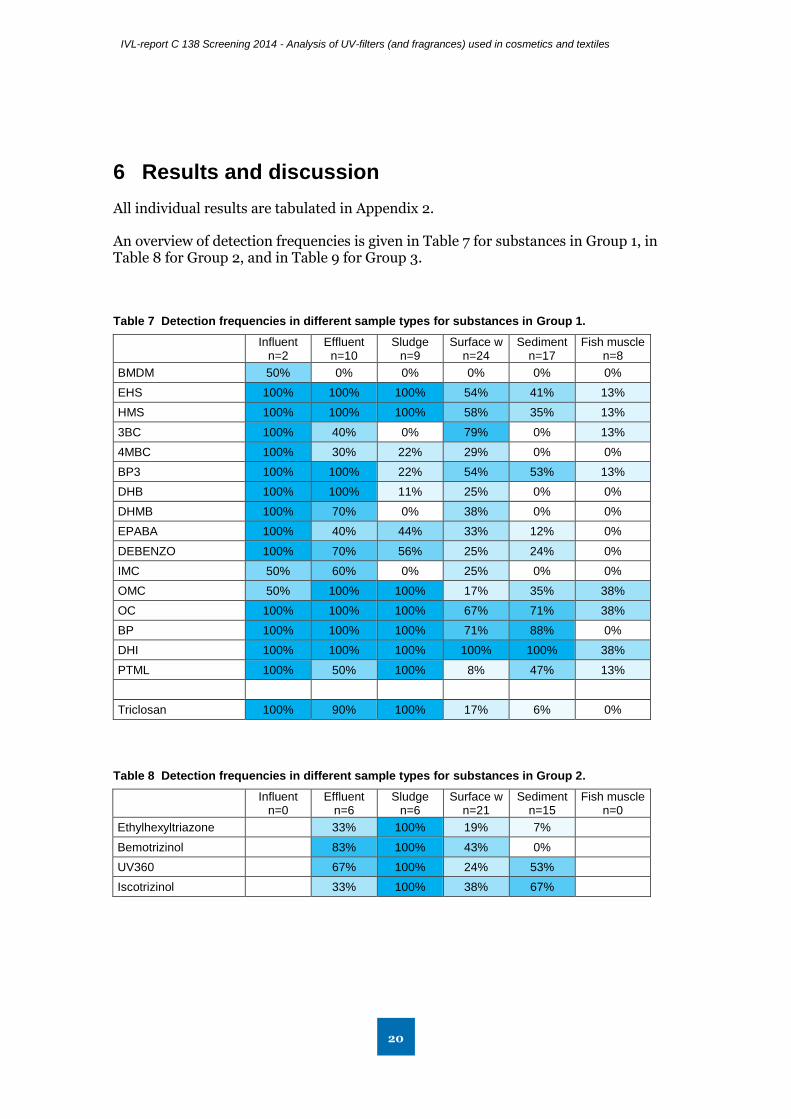
All individual results are tabulated in Appendix 2.
An overview of detection frequencies is given in Table 7 for substances in Group 1, in Table 8 for Group 2, and in Table 9 for Group 3.
Table 7 Detection frequencies in different sample types for substances in Group 1.
Influent
n=2 Effluent
n=10 Sludge
n=9 Surface w
n=24 Sediment
n=17 Fish muscle
n=8
BMDM 50% 0% 0% 0% 0% 0%
EHS 100% 100% 100% 54% 41% 13%
HMS 100% 100% 100% 58% 35% 13%
3BC 100% 40% 0% 79% 0% 13%
4MBC 100% 30% 22% 29% 0% 0%
BP3 100% 100% 22% 54% 53% 13%
DHB 100% 100% 11% 25% 0% 0%
DHMB 100% 70% 0% 38% 0% 0%
EPABA 100% 40% 44% 33% 12% 0%
DEBENZO 100% 70% 56% 25% 24% 0%
IMC 50% 60% 0% 25% 0% 0%
OMC 50% 100% 100% 17% 35% 38%
OC 100% 100% 100% 67% 71% 38%
BP 100% 100% 100% 71% 88% 0%
DHI 100% 100% 100% 100% 100% 38%
PTML 100% 50% 100% 8% 47% 13%
Triclosan 100% 90% 100% 17% 6% 0%
Table 8 Detection frequencies in different sample types for substances in Group 2.
Influent
n=0 Effluent
n=6 Sludge
n=6 Surface w
n=21 Sediment
n=15 Fish muscle
n=0
Ethylhexyltriazone 33% 100% 19% 7%
Bemotrizinol 83% 100% 43% 0%
UV360 67% 100% 24% 53%
Iscotrizinol 33% 100% 38% 67%
IVL-report C 138 Screening 2014 - Analysis of UV-filters (and fragrances) used in cosmetics and textiles
21
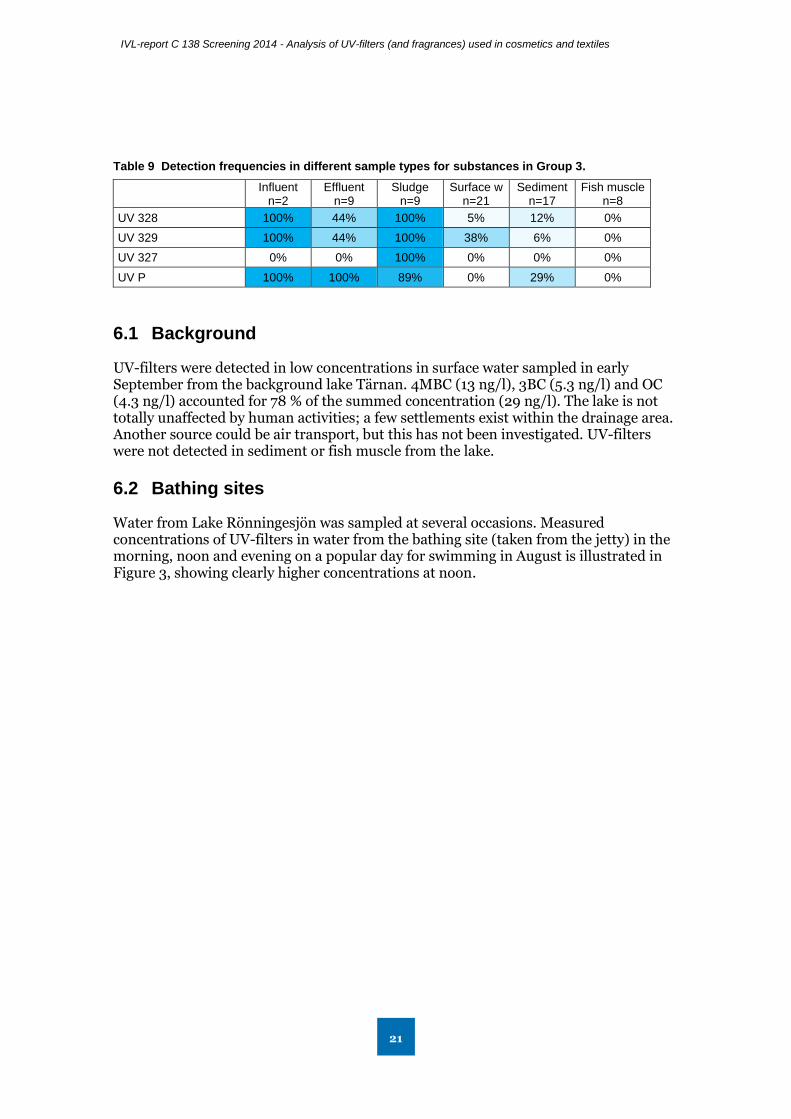
Table 9 Detection frequencies in different sample types for substances in Group 3.
Influent
n=2 Effluent
n=9 Sludge
n=9 Surface w
n=21 Sediment
n=17 Fish muscle
n=8
UV 328 100% 44% 100% 5% 12% 0%
UV 329 100% 44% 100% 38% 6% 0%
UV 327 0% 0% 100% 0% 0% 0%
UV P 100% 100% 89% 0% 29% 0%
6.1 Background
UV-filters were detected in low concentrations in surface water sampled in early September from the background lake Tärnan. 4MBC (13 ng/l), 3BC (5.3 ng/l) and OC (4.3 ng/l) accounted for 78 % of the summed concentration (29 ng/l). The lake is not totally unaffected by human activities; a few settlements exist within the drainage area. Another source could be air transport, but this has not been investigated. UV-filters were not detected in sediment or fish muscle from the lake.
6.2 Bathing sites
Water from Lake Rönningesjön was sampled at several occasions. Measured concentrations of UV-filters in water from the bathing site (taken from the jetty) in the morning, noon and evening on a popular day for swimming in August is illustrated in Figure 3, showing clearly higher concentrations at noon.

IVL-report C 138 Screening 2014 - Analysis of UV-filters (and fragrances) used in cosmetics and textiles
22
Figure 3 Lake Rönningesjön. Concentration in surface water at the jetty at different times on one
day in August. Basic group (top), triazines (bottom).
Out of the 14 UV-filters in the basic group nine was found. Dominating substances were OC, DBENZO, BP3, HMS, 3BC and ethylhexyltriazone. All four substances in the triazine group (group 2) were detected. The diurnal variation indicates a quick turnover of the UV-filters in the water column presumable caused by wind powered mixing and/or degradation.
The noon sample from August is compared to samples from before and after the bathing season (May and October) in Figure 4. The concentrations in May and October were much lower, but 4MBC, EHS and BP could be detected before the bathing season in May. The extremely lipophilic UV360 and the triazines (Group 2) was not detected.
0
50
100
150
Morning (8 am) Noon (12 am) Evening (6 pm)
ng/
l
BP
OC
DBENZO
BP3
3BC
HMS
EHS
0
10
20
30
40
50
Morning (8 am) Noon (12 am) Evening (6 pm)
ng/
l
Iscotrizinol
UV360
Bemotrizinol
Ethylhexyltriazone

IVL-report C 138 Screening 2014 - Analysis of UV-filters (and fragrances) used in cosmetics and textiles
23
Figure 4 Lake Rönningesjön. Concentration in surface water at the jetty at different times of year.
Basic group (top), triazines (bottom).
The UV-filters in Group 1 were measured at the same jetty in the screening 2009 (Remberger 2011). The composition then was quite similar to what was determined now but the concentrations were higher in 2009.
Concentrations of the UV-filters in the water at varying distances from the jetty (Figure 2, point 1-6) is shown in Figure 5. The concentration shows a decrease to point 1 but thereafter an increase to point 5, probably due to a second bathing site south west of this point. Through the whole gradient OC dominates but, at point 4, 3BC showed the highest concentration. These results indicate a transport of the UV-filters over large parts of the lake. The triazines showed a more local presence and were detected only in low concentrations away from the jetty.
0
20
40
60
80
100
120
140
160
180
May August October
ng/
l
BP
OC
DBENZO
DHMB
BP3
4MBC
3BC
HMS
EHS
0
10
20
30
40
50
May August October
ng/
l
Iscotrizinol
UV360
Bemotrizinol
Ethylhexyltriazone
IVL-report C 138 Screening 2014 - Analysis of UV-filters (and fragrances) used in cosmetics and textiles
24
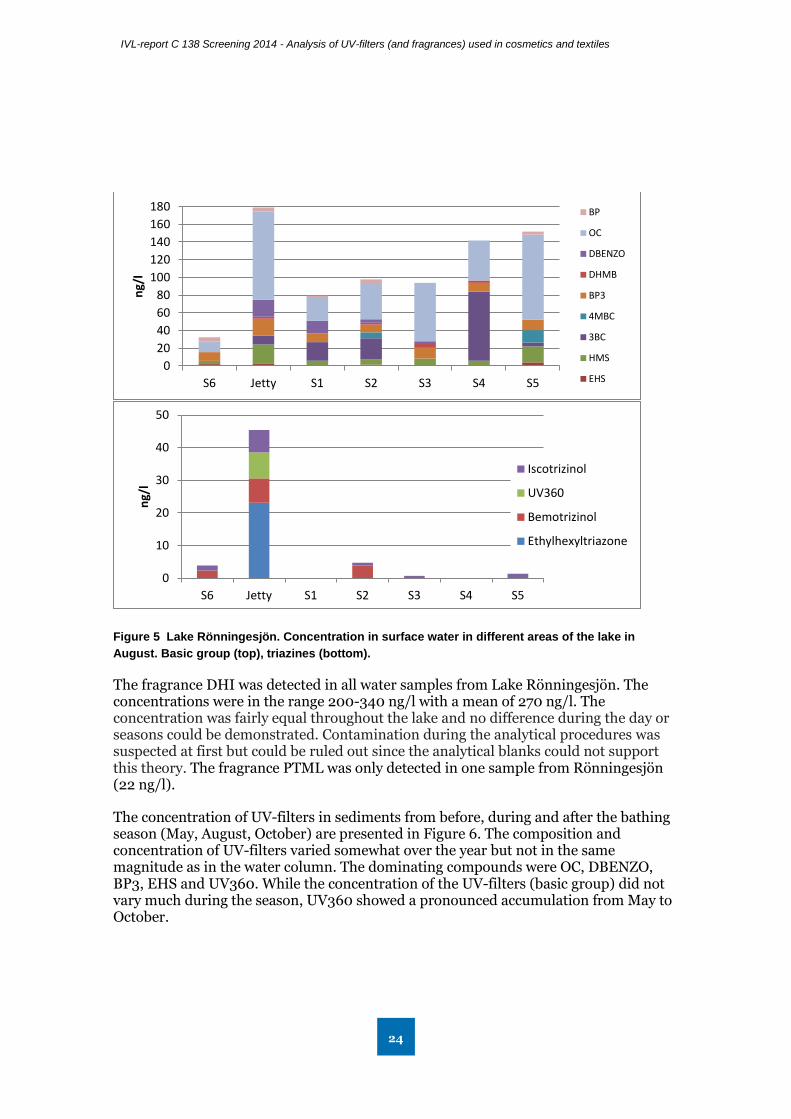
Figure 5 Lake Rönningesjön. Concentration in surface water in different areas of the lake in
August. Basic group (top), triazines (bottom).
The fragrance DHI was detected in all water samples from Lake Rönningesjön. The concentrations were in the range 200-340 ng/l with a mean of 270 ng/l. The concentration was fairly equal throughout the lake and no difference during the day or seasons could be demonstrated. Contamination during the analytical procedures was suspected at first but could be ruled out since the analytical blanks could not support this theory. The fragrance PTML was only detected in one sample from Rönningesjön (22 ng/l).
The concentration of UV-filters in sediments from before, during and after the bathing season (May, August, October) are presented in Figure 6. The composition and concentration of UV-filters varied somewhat over the year but not in the same magnitude as in the water column. The dominating compounds were OC, DBENZO, BP3, EHS and UV360. While the concentration of the UV-filters (basic group) did not vary much during the season, UV360 showed a pronounced accumulation from May to October.
0
20
40
60
80
100
120
140
160
180
S6 Jetty S1 S2 S3 S4 S5
ng/
l
BP
OC
DBENZO
DHMB
BP3
4MBC
3BC
HMS
EHS
0
10
20
30
40
50
S6 Jetty S1 S2 S3 S4 S5
ng/
l
Iscotrizinol
UV360
Bemotrizinol
Ethylhexyltriazone

IVL-report C 138 Screening 2014 - Analysis of UV-filters (and fragrances) used in cosmetics and textiles
25
Figure 6 Lake Rönningesjön. Concentration in sediment at S2 at different times of year. Basic
group (top), triazines (bottom).
Concentrations in the sediment at varying distances from the jetty (Figure 2, point S1–S5) are shown in Figure 7. Unlike the water gradient, the sediment gradient showed no pronounced impact from the second bathing site. Through the whole gradient OC dominated. BP3, DBENZO, EHS, BP, OMC and HMS were also detected in the whole gradient. The results indicate a transport of the UV-filters from the bathing sites (hot spots) over most of the lake. UV360 and, in lower concentration, iscotrizinol, were detected in the whole gradient unlike the situation in the water column.
Sediment concentrations were not measured in the previous screening concerning UV-filters in Lake Rönningesjön (Rembeger et al., 2011), so comparisons over time cannot be done.
0
50
100
150
200
250
300
350
May August October
ng/
g d
w
BP
OC
OMC
DBENZO
BP3
HMS
EHS
0
50
100
150
200
250
May August October
ng/
g d
w
4 Iscotrizinol
3 UV360
2 Bemotrizinol
1 Ethylhexyltriazone

IVL-report C 138 Screening 2014 - Analysis of UV-filters (and fragrances) used in cosmetics and textiles
26
Figure 7 Lake Rönningesjön. Concentration in sediment in different areas of the lake in August.
Basic group (top), triazines (bottom).
The fragrances DHI and PTML showed no clear concentration gradient in sediments from points S1–S5 in Lake Rönningesjön sampled in August. DHI was detected in all samples in the concentration range 220-420 ng/g dw (average 350 ng/g dw). The PTML concentration was significantly lower (4–21 ng/g dw).
The concentration of DHI in sediment from S2 was higher in October than in May and August (Figure 8). PTML showed low concentrations in May and August but was not detected in October.
0
100
200
300
400
500
600
S1 S2 S3 S4 S5
ng/
g d
w
BP
OC
OMC
DBENZO
BP3
HMS
EHS
0
50
100
150
200
S1 S2 S3 S4 S5
ng/
g d
w Iscotrizinol
UV360
Bemotrizinol
Ethylhexyltriazone

IVL-report C 138 Screening 2014 - Analysis of UV-filters (and fragrances) used in cosmetics and textiles
27
Figure 8 Lake Rönningesjön. Concentrations in sediment at S2 of fragrances at different times of
year.
Concentrations of the UV-filters in surface water from the different bathing sites in the regional sampling program are illustrated in Figure 9. The concentrations were lower compared to the concentrations in Lake Rönningesjön during daytime in the bathing season (Figure 5) but in the same range as in the morning and evening samples (Figure 3). The composition was also different. OC was not a dominating component as in Lake Rönningesjön. Instead the more important UV-filters were 3BC, IMC and BP3.
Figure 9 Concentrations of UV-filters in water from bathing sites in the regional sampling program.
Three out of four sediments from the regional program contained UV-filters in low concentrations: OC (21 ng/g dw) and BP (2.3-7.8 ng/g dw), Figure 10.
0
200
400
600
800
1000
May August October
ng/
g d
w
PTML
DHI
0
5
10
15
20
25
30
35
40
Åminne Årsunda beach Stenö Seabeach Mangenbadet Hasseldalen Stora Delsjön Kattegatt, Näset
ng/
l
BP
OC
IMC
DHMB
BP3
4MBC
3BC

IVL-report C 138 Screening 2014 - Analysis of UV-filters (and fragrances) used in cosmetics and textiles
28
Figure 10 Concentrations of UV-filters in sediment from bathing sites in the regional sampling
program.
6.3 WWTPs
Influent
Concentrations in influent waters to WWTPs were not a major priority for this project, but in the regional sample program two influents from medium size WWTPs were included. All UV-filters in the basic group were detected. The summed concentrations were 28 000 and 42 000 ng/l respectively in the two samples. Five substances: OC, 4MBC, HMS, EHS and BP3 together made up 97% and 92% of the summed concentration. The dominating substance in both cases was OC (Figure 11).
Figure 11 Concentration in WWTP influent waters
The summed concentrations in effluents from the same two WWTPs were 870 and 1 000 ng/l, respectively, which corresponds to summed removal efficiencies of 97 – 98%. For individual substances, calculated removal efficiencies were almost always above 90%.
0
5
10
15
20
25
30
Årsunda beach Stenö Seabeach Mangenbadet Hasseldalen
ng/
g d
w
BP
OC
0
10000
20000
30000
40000
50000
Simsholmen Värnamo
ng/
l
OC
BP3
4MBC
HMS
EHS

IVL-report C 138 Screening 2014 - Analysis of UV-filters (and fragrances) used in cosmetics and textiles
29
Effluent
Concentrations of the UV-filters in the basic group in effluent waters from ten WWTPs from both the national and regional programs are shown in Figure 12. The summed concentrations were 220–1800 ng/l. Individual concentrations showed a large variation with a maximum of 560 ng/l. Dominating UV-filters were OC, BP, BP3, DEBENZO, 3BC and OMC.
Figure 12 Concentration in WWTP effluent waters for UV-filters in the basic group. Substances with
higher concentrations (>100 ng/l in at least one sample) are shown in the upper graph, substances
with lower concentrations in the lower graph.
In the previous study (Remberger, 2011) effluents from eight WWTPs was included and summed concentrations ranged 23–1300 ng/l. In Norwegian effluents Tomas (2013) reported higher total concentrations, in the range 300–8900 ng/l; OC, BP3 and OMC dominated
The fragrance DHI was found in all effluents (24–73 ng/l) while PTML was found occasionally (<2–46 ng/l), Figure 13.
0
500
1000
1500
2000
ng/
l
BP
OC
OMC
DBENZO
DHMB
BP3
3BC
0
50
100
150
200
ng/
l
IMC
EPABA
DHMB
DHB
4MBC
HMS
EHS

IVL-report C 138 Screening 2014 - Analysis of UV-filters (and fragrances) used in cosmetics and textiles
30
Figure 13 Concentrations of fragrances in WWTP effluents.
Concentrations of substances in the triazine group (group 2) in effluent waters from six WWTPs are shown in Figure 14. Two effluents, Uppsala and Umeå, contained increased concentrations of bemotrizinol and UV360.
Figure 14 Concentration in WWTP effluent waters for substances in the triazine group.
The benzotriazoles (group 3, textile related UV-filters) were detected in low concentrations compared to the other UV filters and the triazines. UV P was detected in all nine samples (1.9–8.8 ng/l), UV329 was found in five (5–7 ng/l) and UV328 in three samples (0.7–5.6 ng/l). UV327 was not detected.
Sludge
Sludge from eight WWTPs were analysed for the substances in the basic group, Figure 15. Summed concentrations of the UV-filters ranged from 11 000 to 54 000 ng/g dw. All substances with the exception of 3BC, DHMB and IMC were detected in at least one sludge sample.
0
20
40
60
80
100
ng/
l
PTML
DHI
0
500
1000
1500
2000
2500
3000
3500
Uppsala Umeå Henriksdal Rya Fiskartorpet Trollhättan
ng/
l
Iscotrizinol
UV360
Bemotrizinol
EtHxTriazone

IVL-report C 138 Screening 2014 - Analysis of UV-filters (and fragrances) used in cosmetics and textiles
31
OC dominated in all samples. This may be explained by the fact that the compound is strongly lipofilic (Table 4) and thus will be concentrated in the sludge phase. The accumulation in sludge may also indicate a high resistance against microbial degradation.
Figure 15 Concentration in sludge for substances in the basic group. Substances with higher
concentrations (above), with lower concentrations (below),
One WWTP, Simsholmen, Jönköping, delivered two samples, one from the beginning of July, representing inflow from a cool period, and one from August when the temperature was higher, and presumably, so was the use of sunscreen products. The summed concentration in the sample from August was approximately doubled compared to the one from July, which is in line with that assumption.
The fragrance DHI was detected in the range 240-480 ng/g dw. PTML showed a greater concentration range (27-480 ng/g dw).
Six of the sludges were analysed for the triazine substances. All compounds were found in all sludge samples; UV360 showed the highest concentration in most of the samples (Figure 16).
0
10000
20000
30000
40000
50000
60000
ng/
g D
W
OC
DBENZO
HMS
EHS
0200400600800
1000120014001600
ng/
g D
W PTML
DHI
BP
OMC
DHB
4MBC

IVL-report C 138 Screening 2014 - Analysis of UV-filters (and fragrances) used in cosmetics and textiles
32
Figure 16 Concentration in sludge for substances in the triazine group.
The sludge samples were also analysed for group 3, the benzotriazoles (Figure 17). UV 328 was the dominating compound. The concentrations in the two samples from Simsholmen were fairly equal, probably reflecting the fact that these compounds are not primarily used in sunscreen products but in textiles.
Figure 17 Concentration in sludge for substances in the benzotriazole group.
In Figure 18 the summed concentrations of the three compound groups are shown together. The concentration of triazines were in the same magnitude as the the UV-filters in basic group (mostly OC); the concentration of benzotriazols were much lower.
0
10000
20000
30000
40000
50000
UppsalaWWTP
Umeå WWTP HenriksdalWWTP
Rya WWTP FiskartorpetWWTP
TrollhättanWWTP
ng/
g D
W
Iscotrizinol
UV360
Bemotrizinol
EtHxTriazone
0
100
200
300
400
500
600
ng/
g D
W
UV P
UV 327
UV 329
UV 328
IVL-report C 138 Screening 2014 - Analysis of UV-filters (and fragrances) used in cosmetics and textiles
33
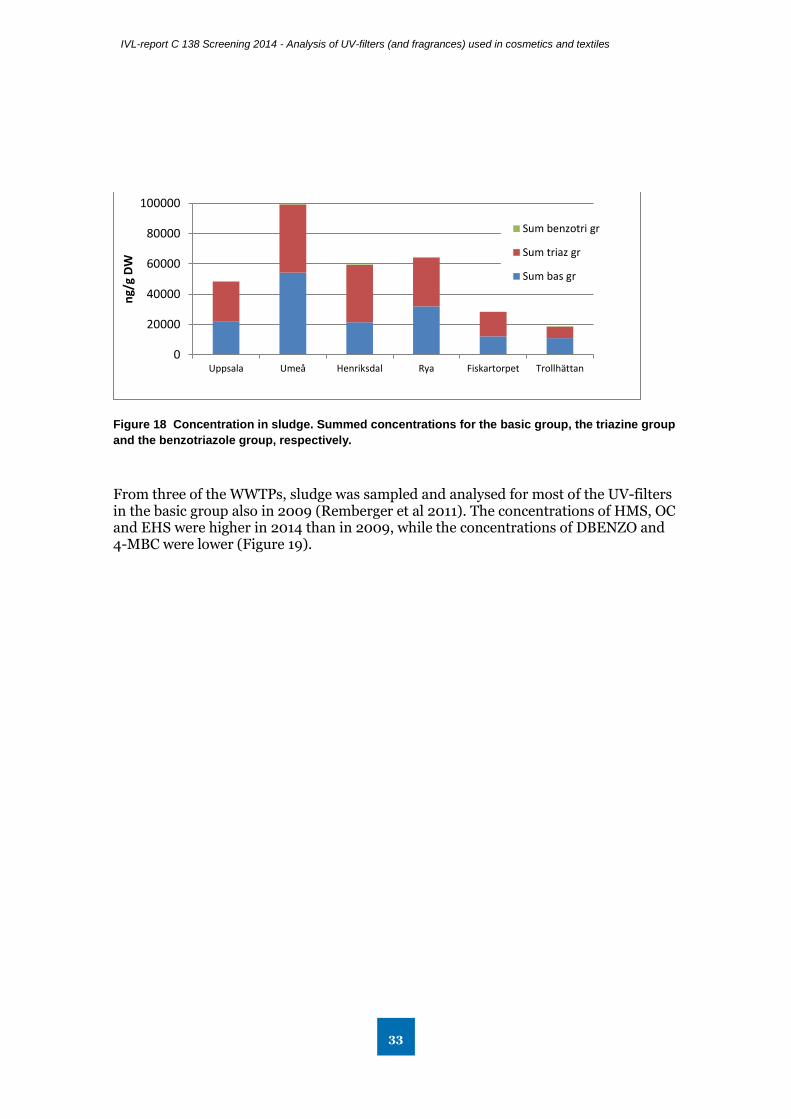
Figure 18 Concentration in sludge. Summed concentrations for the basic group, the triazine group
and the benzotriazole group, respectively.
From three of the WWTPs, sludge was sampled and analysed for most of the UV-filters in the basic group also in 2009 (Remberger et al 2011). The concentrations of HMS, OC and EHS were higher in 2014 than in 2009, while the concentrations of DBENZO and 4-MBC were lower (Figure 19).
0
20000
40000
60000
80000
100000
Uppsala Umeå Henriksdal Rya Fiskartorpet Trollhättan
ng/
g D
W
Sum benzotri gr
Sum triaz gr
Sum bas gr
IVL-report C 138 Screening 2014 - Analysis of UV-filters (and fragrances) used in cosmetics and textiles
34
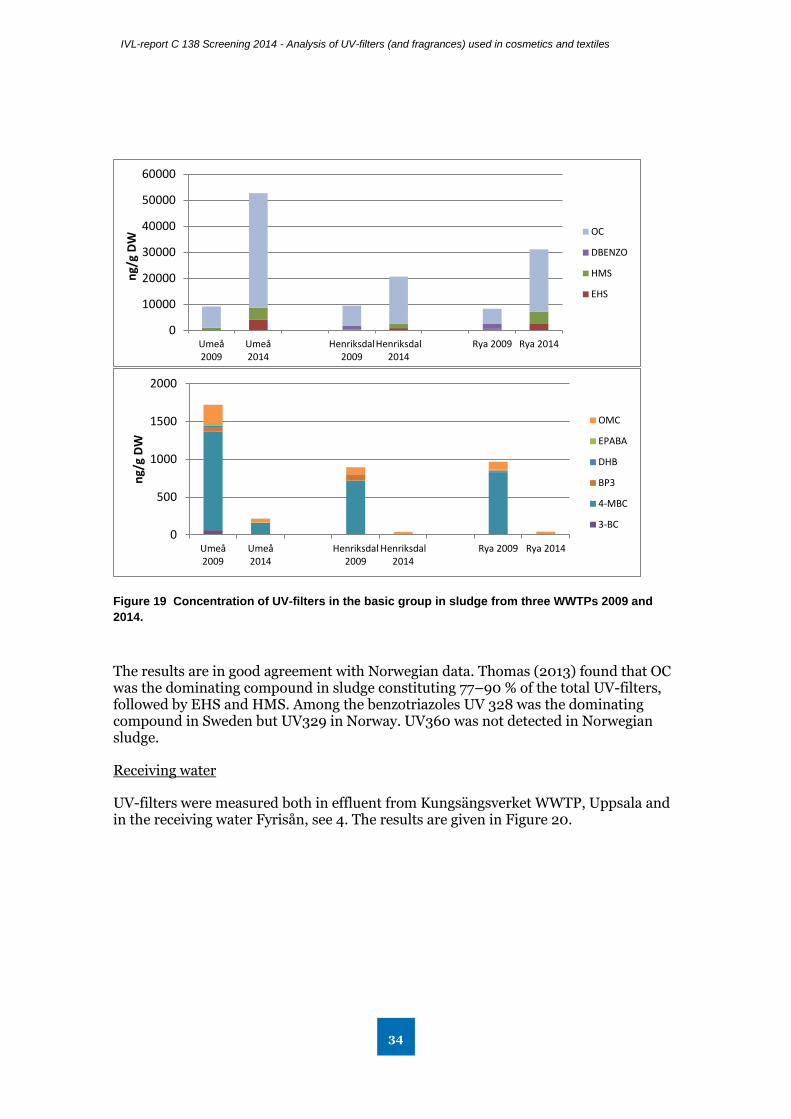
Figure 19 Concentration of UV-filters in the basic group in sludge from three WWTPs 2009 and
2014.
The results are in good agreement with Norwegian data. Thomas (2013) found that OC was the dominating compound in sludge constituting 77–90 % of the total UV-filters, followed by EHS and HMS. Among the benzotriazoles UV 328 was the dominating compound in Sweden but UV329 in Norway. UV360 was not detected in Norwegian sludge.
Receiving water
UV-filters were measured both in effluent from Kungsängsverket WWTP, Uppsala and in the receiving water Fyrisån, see 4. The results are given in Figure 20.
0
10000
20000
30000
40000
50000
60000
Umeå2009
Umeå2014
Henriksdal2009
Henriksdal2014
Rya 2009 Rya 2014
ng/
g D
W OC
DBENZO
HMS
EHS
0
500
1000
1500
2000
Umeå2009
Umeå2014
Henriksdal2009
Henriksdal2014
Rya 2009 Rya 2014
ng/
g D
W
OMC
EPABA
DHB
BP3
4-MBC
3-BC

IVL-report C 138 Screening 2014 - Analysis of UV-filters (and fragrances) used in cosmetics and textiles
35
Figure 20 Concentrations in surface water from River Fyrisån upstream the effluent discharge
point, in the effluent from Kungsängen WWTP, in surface water close to, and at two distances (150
m, 4.6 km) downstream the discharge point.
3BC, OC and DHB were detected upstream the effluent discharge point, but in low concentrations. The dominating UV-filters BP and OMC (and also DHB) in the effluent were clearly detected in the river water at the discharge point and at the two points downstream, showing a dilution factor of about six at all points. 3BC was not present in the effluent, but detected at the discharge point in about the same concentration as in the upstream water.
Bemotrizinol was detected in the effluent (Figure 14) in high concentrations but did not occur in the receiving water or sediment.
Sediment
Concentrations of UV-filters (and also the fragrance PTML) in sediments from River Fyrisån are shown in Figure 21. The sediment concentration is higher at the site “downstream 1” than close to the effluent discharge point, indicating that the conditions for sedimentation are more favourable at this point.
0
50
100
150
200
250
U-a upstream U-a effluent U-a effluent point U-a downstream1
U-a downstream3
ng/
l
BP
OC
OMC
DHMB
DHB
BP3
3BC
HMS
EHS

IVL-report C 138 Screening 2014 - Analysis of UV-filters (and fragrances) used in cosmetics and textiles
36
Figure 21 Concentrations in sediment from River Fyrisån close to, and at two distances (150m, 4.6
km) downstream the discharge point.
It can be noticed that the sediments from Lake Rönningesjön, influenced by bathing sites, generally showed higher concentrations of UV-filters than what was found downstream Uppsala WWTP.
Tomas (2014) reported data on eight UV-filters in sediments collected from Oslofjord and Lake Mjøsa in Norway. In sediments from Oslofjord OC (<0.7- 82 ng/g dw), UV328 (3-25 ng/g dw) and EHS (8-16 ng/g dw) was detected. In sediments from Lake Mjøsa only EHS was detected (10-20 ng/g dw). UV360, that was measured in significant concentrations (<20-240 ng/g dw) in the present study, was not detected in the Norwegian study.
6.4 Fish
Fish muscle was analysed for the substances in Group 1 and Group 3. None of the substances were detected in the sample from the background lake Tärnan. Fish from sites related to Uppsala WWTP (regional reference lake Valloxen, Fyrisån close to the discharge point and Downstream 3) contained OC (all sites), OMC, HMS and EHS in the concentration range 0.6-7.5 ng/g fw (Figure 22).
0
50
100
150
200
U-a effluent point U-a downstream 1 U-a downstream 3
ng/
g d
w
PTML
BP
OC
OMC
BP3
HMS
EHS

IVL-report C 138 Screening 2014 - Analysis of UV-filters (and fragrances) used in cosmetics and textiles
37
Figure 22 Fish (perch muscle) from Lake Tärnan, Lake Valloxen and two sites in River Fyrisån.
Fish from the regional program contained three UV-filters, 3BC, BP3 and OMC, just above the LOD in the concentration range 0.33-3.6 ng/g fw (Figure 23).
Figure 23 Fish muscle (Askimsviken sea trout, all others perch) from the regional sample program
Remberger (2011) detected two UV-filters (OC, OMC) in fish from the Stockholm area in the same concentration range as in the present study.
6.5 Simplified risk assessment
In a review concerning environmental concentrations and toxicity of personal care products in the aquatic environment (Braush & Rand. 2011) it was pointed out that UV filters are persistent in the environment while being continually replenished through normal usage. The main concerns are their ability to bioaccumulate and their potential for estrogenic activity. It was concluded that shortage of data on environmental concentrations and on toxic effects did not allow for a comprehensive risk profile to be developed.
0
2
4
6
8
10
Lake Tärnan Lake Valloxen U-a effluent point U-a downstr 3
nf/
g fw
OC
OMC
HMS
EHS
0
2
4
6
8
10
Mången Smedströmmen Stora Delsjön Askimsviken
ng/
g fw
OMC
BP3
3BC
IVL-report C 138 Screening 2014 - Analysis of UV-filters (and fragrances) used in cosmetics and textiles
38
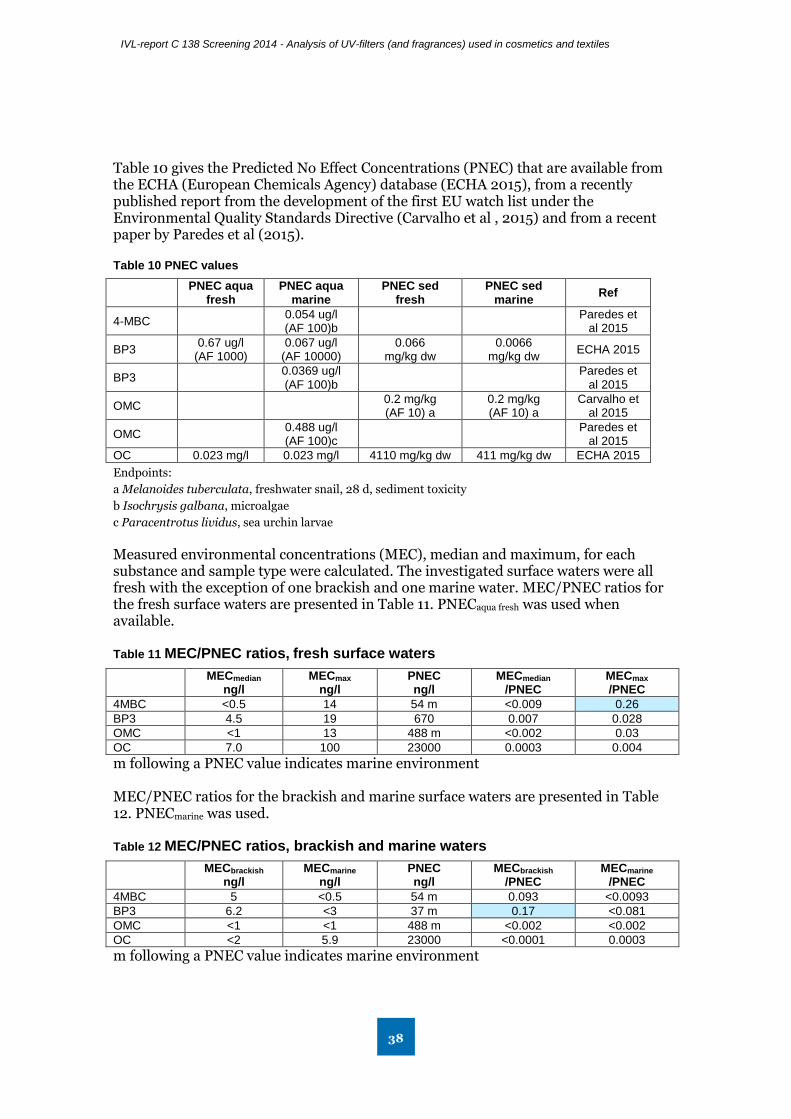
Table 10 gives the Predicted No Effect Concentrations (PNEC) that are available from the ECHA (European Chemicals Agency) database (ECHA 2015), from a recently published report from the development of the first EU watch list under the Environmental Quality Standards Directive (Carvalho et al , 2015) and from a recent paper by Paredes et al (2015).
Table 10 PNEC values
PNEC aqua
fresh PNEC aqua
marine PNEC sed
fresh PNEC sed
marine Ref
4-MBC 0.054 ug/l (AF 100)b
Paredes et
al 2015
BP3 0.67 ug/l
(AF 1000) 0.067 ug/l
(AF 10000) 0.066
mg/kg dw 0.0066
mg/kg dw ECHA 2015
BP3 0.0369 ug/l (AF 100)b
Paredes et
al 2015
OMC 0.2 mg/kg (AF 10) a
0.2 mg/kg (AF 10) a
Carvalho et al 2015
OMC 0.488 ug/l (AF 100)c
Paredes et
al 2015
OC 0.023 mg/l 0.023 mg/l 4110 mg/kg dw 411 mg/kg dw ECHA 2015
Endpoints:
a Melanoides tuberculata, freshwater snail, 28 d, sediment toxicity
b Isochrysis galbana, microalgae
c Paracentrotus lividus, sea urchin larvae
Measured environmental concentrations (MEC), median and maximum, for each substance and sample type were calculated. The investigated surface waters were all fresh with the exception of one brackish and one marine water. MEC/PNEC ratios for the fresh surface waters are presented in Table 11. PNECaqua fresh was used when available.
Table 11 MEC/PNEC ratios, fresh surface waters
MECmedian
ng/l MECmax
ng/l PNEC ng/l
MECmedian
/PNEC MECmax
/PNEC
4MBC <0.5 14 54 m <0.009 0.26
BP3 4.5 19 670 0.007 0.028
OMC <1 13 488 m <0.002 0.03
OC 7.0 100 23000 0.0003 0.004
m following a PNEC value indicates marine environment MEC/PNEC ratios for the brackish and marine surface waters are presented in Table 12. PNECmarine was used.
Table 12 MEC/PNEC ratios, brackish and marine waters
MECbrackish
ng/l MECmarine
ng/l PNEC ng/l
MECbrackish
/PNEC MECmarine
/PNEC
4MBC 5 <0.5 54 m 0.093 <0.0093
BP3 6.2 <3 37 m 0.17 <0.081
OMC <1 <1 488 m <0.002 <0.002
OC <2 5.9 23000 <0.0001 0.0003
m following a PNEC value indicates marine environment

IVL-report C 138 Screening 2014 - Analysis of UV-filters (and fragrances) used in cosmetics and textiles
39
MEC/PNEC ratios for effluent water after tenfold dilution are presented in Table 13. The receiving waters were all fresh, PNECaqua fresh were used when available.
Table 13 MEC/PNEC ratios, effluent water after tenfold dilution
MECmedian
ng/l MECmax
ng/l PNEC ng/l
MECmedian
/PNEC MECmax
/PNEC
4MBC <1.5 8.3 54 m <0.03 0.15
BP3 6.0 45 670 0.009 0.067
OMC 0.82 36 488 m 0.002 0.07
OC 9.4 49 23000 0.0004 0.002
m following a PNEC value indicates marine environment
A MEC/PNEC ratio above 1 indicates a potential environmental risk. The highest ratio for fresh surface water, 0.26, was seen for the maximum concentration measured for 4MBC. The PNEC used is for a marine environment and would probably be higher (the MEC/PNEC ratio lower) for fresh water.
The MEC/PNEC ratios obtained for effluent water after tenfold dilution do not indicate an environmental risk for recieving waters with low salinity. For a marine receiving water MECmax/PNEC for BP3 would have been close to 1 (0.67).
MEC/PNECfresh ratios for sediments are presented in Table 14.
Table 14 MEC/PNEC ratios, sediment
MECmedian ng/g dw
MECmax ng/g dw
PNEC ng/g dw
MECmedian
/PNEC MECmax
/PNEC
BP3 15 62 66 0.22 0.94
OMC <7 35 200 <0.04 0.18
OC 47 320 4110000 0.00001 0.0008
For BP3 the ratio is close to 1 for the highest concentration measured, which was in a sediment from the bathing site in Rönningesjön sampled in August.
It was recently pointed out (Downs, 2015) that the local use of BP3 in sunscreen lotions poses a hazard to coral reef conservation and threatens the resiliency of coral reefs to climate change.
For the rest of the investigated substances no PNEC values were available. ECHA has however identified UV-328 as a SVHC (Substance of Very High Concern) due to its PBT/vPvB properties (PBT: persistent, bio-accumulative and toxic; vPvB: very persistent and very bio-accumulative). The motivation is available in a SVHC Support document (ECHA 2014a) but the report states that “no data relevant for assessing the T-criterion can be reported”.
UV-320 has also been identified as a SVHC due to its PBT/vPvB properties (ECHA 2014b). Also for this substance it is stated that “no data relevant for assessing the T-criterion can be reported”. UV-328 and UV-320 were in December 2014 included on the Candidate List for eventual inclusion in Annex XIV to REACH (ECHA 2014c). UV-

IVL-report C 138 Screening 2014 - Analysis of UV-filters (and fragrances) used in cosmetics and textiles
40
320 was not included in this screening but the structure of UV-320 is derived from the structure of UV-327 by replacing the chlorine atom by a hydrogen. For UV-327 no decision on SVHC status has been made but a SVHC draft support document is available (ECHA 2013). This document states about toxicity: “The available studies show that UV-327 is not acutely toxic for aquatic organisms. There is no information on the long-term toxicity of UV-327. Based on the currently available data it was concluded that UV-327 does not fulfil the T-criterion.”

IVL-report C 138 Screening 2014 - Analysis of UV-filters (and fragrances) used in cosmetics and textiles
41
7 Conclusions
Bathing sites
UV-filters are transported from the bathing sites to more unaffected parts in a lake.
There is a diurnal turnover of the UV filters in the water column as a result of mixing and/or degradation (photo- and microbial degradation).
The UV filter concentrations are reduced in water after the bathing season but low amounts could be detected in spring before the next bathing season.
The levels in the sediments indicate a possible accumulation of UV-filters. This is especially clear for UV360.
Sediment may be a more reliable matrix than water for environmental assessments of UV-filters. Water samples give only a snapshot of the situation.
The highest levels of the UV-filter BP3 measured in sediments indicates a possible environmental risk.
Waste water treatment plants and receiving waters
In WWTPs about 97-98 % of the UV-filters are removed from the waste water.
The concentration in sludge of OC, HMS and EHS has increased between 2009 and 2015.
Two our knowledge ethylhexyltriazone, bemotrizinol, UV360 and iscotrizinol (the compounds in the option 2 group) have not been measured before in the Swedish environment and appears to be important new contaminants at bathing sites and in WWTPs.
The UV-filters mainly used in textile applications (option 1 group) were frequently detected in sludge and effluent water but more sparingly in surface water and sediment.
There is no obvious correlation between use in Sweden according to SPIN and the detected concentrations in the environment and effluents. For example, OC is the dominant UV filter in surface water, sediments and effluents but a minor component in SPIN. But, as already pointed out (Chapter 2), UV-filters contained in finished cosmetic products are not included in SPIN. On the other hand, BP is used in great amounts (SPIN-data) but is detected at low concentrations in environmental samples as well as in WWTP effluents. The explanation may be that OC and BP have different stability to photochemical and/or microbial degradation. The high concentration of OC in solid samples (sediment and sludge) can probably be attributed to the high Kow (Table 4).

IVL-report C 138 Screening 2014 - Analysis of UV-filters (and fragrances) used in cosmetics and textiles
42
BMDM (avobenzone) is a good UV-filter in cosmetic products (broad spectral range; effective UV-scavenger) but is susceptible to UV-degradation5. This fact may explanation why BMDM was detected in only one sample in this investigation. This is also valid for previous investigations: BMDM was rarely detected, and then in low concentrations, even in UV-contaminated environmental samples from bathing sites (Poiger et al., 2004; Giokas et al., 2004; Rodil et al., 2008; Remberger et al. 2011). Rodil et al. (2009), however, measured a quite high concentration (2431 ng/l) in lake water collected from a bathing site a hot summer day.
8 Acknowledgements
We thank Anders Forsman for lending a boat which made it possible to collect water and sediment samples in Lake Rönningesjön. The staffs on the WWTPs are acknowledged for sampling water and sludge included in the sampling program. Fish tissue, sediment and water from Lake Tärnan were provided by The Swedish Museum of Natural History.
The study was funded by the Swedish Environmental Protection Agency and the county administrative boards in Gotland, Gävleborg, Jönköping, Värmland, Västra Götaland and Östergötland.
9 References
BASF, 1995, Uvinul grades, UV absorbers for cosmetic products, ME 266 e, Register 20.
Brausch, J. M., Rand, G.M. (2011) A review of personal care products in the aquatic environment: environmental concentrations and toxicity. Chemosphere 82, 1518-1532
Brorström-Lundén, E., Hansson, K., Remberger, M., Kaj, L., Magnér, J., Andersson, H., Haglund, P., Andersson, R., Liljelind, P., Grabic, R., (2011), Screening of benzothiazoles, benzenediamines, dicyclohexylamine and benzotriazoles. IVL report B2023.
Buser, H.-R., M. D. Müller, Balmer, M. E.Poiger, T.Buerge, I. J. (2005). "Stereoisomer Composition of the Chiral UV Filter 4-Methylbenzylidene Camphor in Environmental Samples." Environ. Sci. Technol. 39(9): 3013-3019.
Carpinteiro, I., B. Abuín, I. Rodríguez, M. Ramil and R. Cela (2010). "Pressurized solvent extraction followed by gas chromatography tandem mass spectrometry for the determination of benzotriazole light stabilizers in indoor dust." Journal of Chromatography A 1217(24): 3729-3735.
Carvalho, R. N., Ceriani, L., Ippoliti, A., Lettieri, T. (2015) Development of the 1st watch list under the environmental quality standards directive. JRC Science and Policy Reports. Report EUR 27142 EN
5 http://www.smartskincare.com

IVL-report C 138 Screening 2014 - Analysis of UV-filters (and fragrances) used in cosmetics and textiles
43
ChemIDplus (2015) http://chem.sis.nlm.nih.gov/chemidplus/chemidlite.jsp
Downs, C.A., Kramarsky-Winter, E., Segal.R., Fauth, J., Knutson, S., Bronstein, O., Ciner, F.R., Jeger, R., Lichtenfeldt, Y., Woodley, C.M., Pennington, P., Cadenas, K., Kushmaro, A. Loya, Y. (2015) Toxicopathological effects of the sunscreen UV filter, oxybenzone (benzophenone-3), on coral planulae and cultured primary cells and its environmental contamination in Hawaii and the U.S. Virgin Islands. Archives of Environmental Contamination and Toxicology October 2015
Haglund, S. P., E. Jakobsson, L. Asplund, M. Athanasiadou and Å. Bergman (1993). "Determination of chlorinated naphthalenes in polychlorinated biphenyl products via capillary gas chromatography-mass spectrometry after separation by gel permeation chromatography." J. Chromatogr. 634: 79-86.
ECHA (2013) SVHC Draft support document UV-327 http://echa.europa.eu/documents/10162/14598345/support_document_uv-327_20130614_en.pdf
ECHA (2014a) SVHC Support document UV328 http://echa.europa.eu/documents/10162/d5b54a40-4ddf-4892-a25a-442dfab8f9f3
ECHA (2014b) SVHC Support document UV320 http://echa.europa.eu/documents/10162/8b110e69-c9aa-4601-b431-ee43177e0ee8
ECHA (2014c) Decision by the Executive Director http://echa.europa.eu/documents/10162/1c22d306-08f1-45ca-b1ca-c10cea647ea5.
ECHA (2015) http://www.echa.europa.eu/web/guest/information-on-chemicals/
Giokas, D. L., V. A. Sakkas and T. A. Albanis (2004). "Determination of residuals of UV filters in natural waters by solid-phase extraction coupled to liquid chromatograpy-photodiode array detection and gas chromatography-mass spectrometry." J Chromatogr. A 1026: 289-293.
Giokas, D. L., V. A. Sakkas, Albanis, T. A., Lampropoulou, D. A., (2005). "Determination of UV-filter residues in bathing waters by liquid chromatography UV-diode array and gas chromatography–mass spectrometry after micelle mediated extraction-solvent back extraction." J Chromatogr. A 1077: 19-27.
Langford, K. H., Tomas, K. V., (2008), Inputs of chemicals from recreational activities into the Norweigian coastal zone., J. Environ. Monit., 10: 894-898.
Läkemedelsverket (2013) Solskyddsprodukter. Tillsynsrapport från enheten för kosmetika och hygienprodukter, 2013-06-17. Läkemedelsverket.
Montesdeoca-Esponda, S., Z. Sosa-Ferrera and J. J. Santana-Rodríguez (2013). "Microwave-assisted extraction combined with on-line solid phase extraction followed by ultra-high-performance liquid chromatography with tandem mass spectrometric determination of benzotriazole UV stabilizers in marine sediments and sewage sludges." Journal of Separation Science 36(4): 781-788.

IVL-report C 138 Screening 2014 - Analysis of UV-filters (and fragrances) used in cosmetics and textiles
44
Nagtegaal, M., T. A. Ternes, W. Baumann and R. Nagel (1997). "UV-filtersubstanzen in wasser und fischen." Umweltchem. Ökotox. 9(2): 79-86.
Paredes, E., Perez, S., Rodil, R., Quintana, J.B., Beiras, R. (2014) Ecotoxicological evalustion of four UV filters using marine organisms from different trophic levels Isochrysis galbana, Mytilus galloprovincialis, Paracentrotus lividus, and Siriella armata Chemosphere 104, 44-50
Poiger, T., H. R. Buser, M. E. Balmer, P. A. Bergqvist and M. D. Muller (2004). "Occurrence of UV filter compounds from sunscreens in surface waters: regional mass balance in two Swiss lakes." Chemosphere 55(7): 951-963.
Ramos, S., V. Homem, A. Alves and L. Santos (2015). "Advances in analytical methods and occurrence of organic UV-filters in the environment — A review." Science of the Total Environment 526: 278-311.
Remberger, Mikael; Lilja, Karl; Kaj, Lennart; Viktor, Tomas; Brorström-Lundén, Eva (2011). Results from the Swedish National Screening programme 2009. Subreport 3: UV-filters. IVL Report B1971.
Rodil, R., J. B. Quintana, Lopez-Mahia, P., Muniategui-Lorenzo, S., Prada-Rodriguez, D., (2008). "Multiclass Determination of Sunscreen Chemicals in Water Samples by Liquid Chromatography-Tandem Mass Spectrometry." Anal. Chem. 80(4): 1307-1315.
Rodil, R., M. Moeder, R. Altenburger and M. Schmitt-Jansen (2009). "Photostability and phototoxicity of selected sunscreen agents and their degradation mixtures in water." Anal. Bioanal. Chem. 395: 1513-1524.
Thomas, K., Schlabach, M. Langford, K., Fjeld, E., Øxnevad, S., Rundberget, T., Bæk, K.Rostkowski, P. Harju, M. (2014) Screening program 2013. New bisphenols, organic peroxides, fluorinated siloxanes, organic UV-filters and selected PBT substances. Miljødirektoratet Report M-176/2014.
Wernersson (2008) UV-filter i solskyddskrämer – ett miljöproblem? Rapport till Naturvårdsverket. FB Engineering AB. 8 December 2008.
C,

IVL-report C 138 Screening 2014 - Analysis of UV-filters (and fragrances) used in cosmetics and textiles
45
Appendix 1 Sample list
ID Nat./County Municipallity Site Matrix Sampling date RT90 X RT90 Y
3379 National Vallentuna Tärnan Surface water 2014-09-10 6608704 164490
3380 National Vallentuna Tärnan Sediment 2014-09-10 6608704 164490
3734 National Vallentuna Tärnan Fish muscle, perch 2014-09-10 6608704 164490
3363 National Uppsala Uppsala WWTP Effluent 2014-09-04 6637475 1603969
3364 National Uppsala Uppsala WWTP Sludge 2014-09-03 6637475 1603969
3330 National Uppsala U-a upstream Surface water 2014-08-28 6638717 1602928
3331 National Uppsala U-a effluent point Surface water 2014-08-28 6637288 1603795
3332 National Uppsala U-a downstream 1 (150 m) Surface water 2014-08-28 6637143 1603849
3334 National Uppsala U-a downstream 3 (4.6 km) Surface water 2014-08-28 6634020 1604660
3349 National Uppsala U-a effluent point Sediment 2014-08-29 6637288 1603795
3350 National Uppsala U-a downstream 1 (150 m) Sediment 2014-08-29 6637143 1603849
3351 National Uppsala U-a downstream 3 (4.6 km) Sediment 2014-08-29 6634020 1604660
3720 National Uppsala U-a Valloxen, reg backgr Fish muscle, perch 2014-08-29 6624246 1612705
3721 National Uppsala U-a effluent point Fish muscle, perch 2014-08-29 6637288 1603795
3722 National Uppsala U-a downstream 3 (4.6 km) Fish muscle, perch 2014-08-29 6634020 1604660
3328 National Umeå Umeå WWTP Effluent 2014-08-20
3329 National Umeå Umeå WWTP Sludge 2014-08-20
3369 National Stockholm Henriksdal WWTP Effluent 2014-09-03
3372 National Stockholm Henriksdal WWTP Sludge 2014-09-04
3212 National Göteborg Rya WWTP Effluent 2014-07-30
3213 National Göteborg Rya WWTP Sludge 2014-07-30
3150 National Täby Rönningesjön, jetty May Surface water 2014-05-23
3151 National Täby Rönningesjön S5 May Surface water 2014-05-23
3242 National Täby Rönningesjön, jetty, morning Surface water 2014-08-08 6596355 1630476
3249 National Täby Rönningesjön, noon, jetty Surface water 2014-08-08 6596355 1630476
3241 National Täby Rönningesjön, jetty, evening Surface water 2014-08-07 6596355 1630476
3243 National Täby Rönningesjön August S1 Surface water 2014-08-08 6596313 1630428

IVL-report C 138 Screening 2014 - Analysis of UV-filters (and fragrances) used in cosmetics and textiles
46
ID Nat./County Municipallity Site Matrix Sampling date RT90 X RT90 Y
3244 National Täby Rönningesjön August S2 Surface water 2014-08-08 6596250 1630359
3245 National Täby Rönningesjön August S3 Surface water 2014-08-08 6595948 1630288
3246 National Täby Rönningesjön August S4 Surface water 2014-08-08 6595767 1630343
3247 National Täby Rönningesjön August S5 Surface water 2014-08-08 6595586 1630391
3248 National Täby Rönningesjön August S6 Surface water 2014-08-08 6596453 1630320
3464 National Täby Rönningesjön October S1 Surface water 2014-10-01 6596279 1630409
3467 National Täby Rönningesjön October S5 Sediment 2014-10-01 6595586 1630391
3152 National Täby Rönningesjön May S2 Sediment 2014-05-27 6596307 1630430
3250 National Täby Rönningesjön August S1 Sediment 2014-08-08 6596313 1630428
3251 National Täby Rönningesjön August S2 Sediment 2014-08-08 6596250 1630359
3252 National Täby Rönningesjön August S3 Sediment 2014-08-08 6595948 1630288
3253 National Täby Rönningesjön August S4 Sediment 2014-08-08 6595767 1630343
3254 National Täby Rönningesjön August S5 Sediment 2014-08-08 6595586 1630391
3465 National Täby Rönningesjön October S2 Sediment 2014-10-01 6596279 1630409
3346 Gotland Gotland Visby WWTP Effluent 2014-07-22
3347 Gotland Gotland Åminne Surface water 2014-07-22 6391405 1676247
3306 Gävleborg Sandviken Årsunda beach Storsjön Surface water 2014-08-15 6712248 1550825
3307 Gävleborg Sandviken Årsunda beach Storsjön Sediment 2014-08-15 6712248 1550825
3304 Gävleborg Söderhamn Stenö Seabeach Söderhamnsfjärden Surface water 2014-08-15 6793115 1574527
3305 Gävleborg Söderhamn Stenö Seabeach Söderhamnsfjärden Sediment 2014-08-15 6793115 1574527
3308 Jönköping Jönköping Simsholmen WWTP Influent 2014-07-10
3309 Jönköping Jönköping Simsholmen WWTP Effluent 2014-07-10
3310, 3311 Jönköping Jönköping Simsholmen WWTP Sludge 2014-07-09 and 2014-08-19
3276 Jönköping Värnamo Värnamo WWTP Influent 2014-08-12
3277 Jönköping Värnamo Värnamo WWTP Effluent 2014-08-12
3255 Värmland Karlstad Mången (Mangenbadet) Surface water 2014-08-11 6612371 1391184
3296 Värmland Karlstad Mången (Mangenbadet) Fish muscle, perch 2014-08-11 6612653 1390590
3256 Värmland Grums Långsjön (Hasseldalen) Surface water 2014-08-11 6591605 1345308
3224 Värmland Grums Långsjön (Hasseldalen) Sediment 2014-07-31 6591657 1345271
3223 Värmland Karlstad Mången (Mangenbadet) Sediment 2014-07-31 6612425 1391189
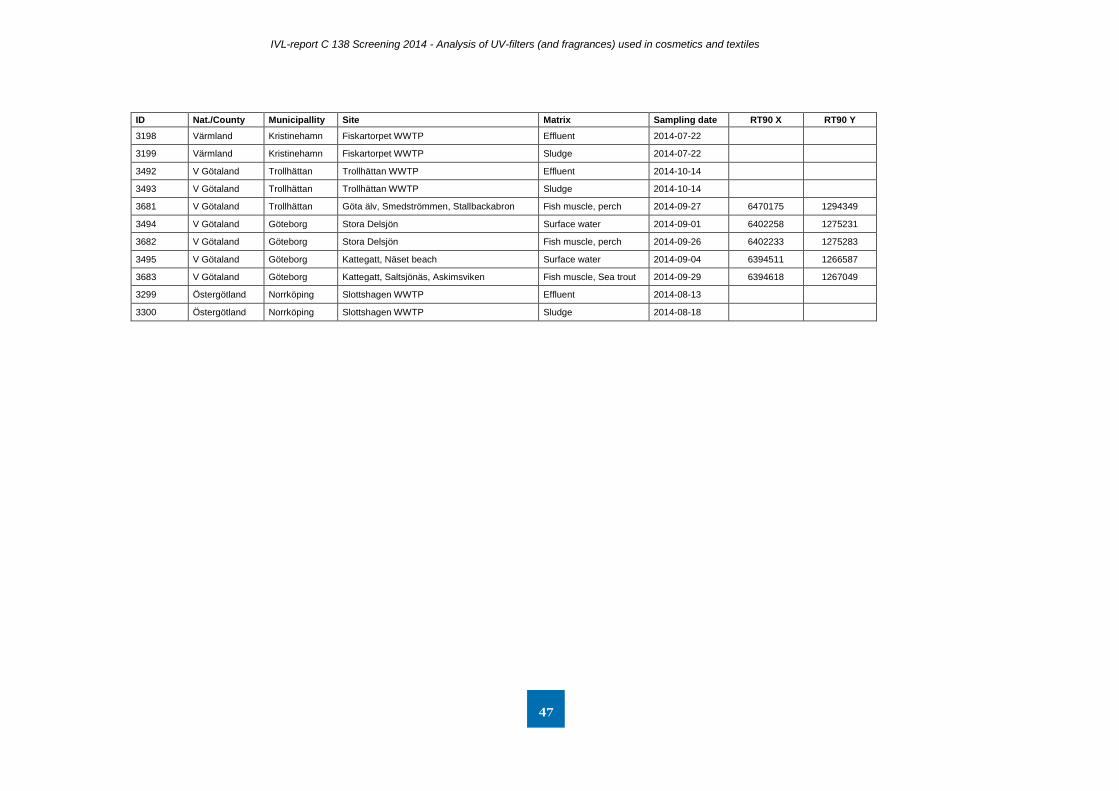
IVL-report C 138 Screening 2014 - Analysis of UV-filters (and fragrances) used in cosmetics and textiles
47
ID Nat./County Municipallity Site Matrix Sampling date RT90 X RT90 Y
3198 Värmland Kristinehamn Fiskartorpet WWTP Effluent 2014-07-22
3199 Värmland Kristinehamn Fiskartorpet WWTP Sludge 2014-07-22
3492 V Götaland Trollhättan Trollhättan WWTP Effluent 2014-10-14
3493 V Götaland Trollhättan Trollhättan WWTP Sludge 2014-10-14
3681 V Götaland Trollhättan Göta älv, Smedströmmen, Stallbackabron Fish muscle, perch 2014-09-27 6470175 1294349
3494 V Götaland Göteborg Stora Delsjön Surface water 2014-09-01 6402258 1275231
3682 V Götaland Göteborg Stora Delsjön Fish muscle, perch 2014-09-26 6402233 1275283
3495 V Götaland Göteborg Kattegatt, Näset beach Surface water 2014-09-04 6394511 1266587
3683 V Götaland Göteborg Kattegatt, Saltsjönäs, Askimsviken Fish muscle, Sea trout 2014-09-29 6394618 1267049
3299 Östergötland Norrköping Slottshagen WWTP Effluent 2014-08-13
3300 Östergötland Norrköping Slottshagen WWTP Sludge 2014-08-18

IVL-report C 138 Screening 2014 - Analysis of UV-filters (and fragrances) used in cosmetics and textiles
48
Appendix 2 Results
Results for substances in Group 1, Basic group.
Matrix ID Site Unit BMDM EHS HMS 3BC 4MBC BP3 DHB DHMB EPABA DBENZO IMC OMC OC BP DHI PTML Triklosan
Surface w 3379 Tärnan ng/l <1 0.6 2.2 5.3 13 <3 <0.5 <1 0.86 <3 1.2 <1 4.3 1.8 160 <1.6 <0.6
Surface w 3330 U-a upsteam ng/l <1 <0.5 <2 13 <0.5 <3 1 <1 <0.5 <2 1.5 <1 6 <0.6 21 <1.6 1.0
Surface w 3331 U-a effluent point ng/l <1 <0.5 3 9.1 <0.5 <3 2 <1 <0.5 <2 <0.5 13 <2 19 19 <1.6 2.3
Surface w 3332 U-a downstream 1 ng/l <1 <0.5 <2 <0.5 <0.5 <3 1 <1 0.55 <2 <0.5 6.9 3.6 8.4 14 <1.6 1.4
Surface w 3334 U-a downstream 3 ng/l <1 <0.5 4.7 <0.5 <0.5 <3 <0.5 <1 <0.5 3.1 <0.5 7.4 11 14 26 <1.6 <0.6
Surface w 3150 Rönningesjön, jetty, spring ng/l <1 2.4 <3 28 9.0 <5 <0.5 <2 <1 <2 <0.6 <2 <2 3 340 <3 <1
Surface w 3151 Rönningesjön S5, spring ng/l <1 <1 <3 <0.5 13 <5 1 <2 1.2 <2 <0.6 <2 <2 <1 310 <3 1.4
Surface w 3242 Rönningesjön, jetty, morning ng/l <1 2.6 <3 13 <1 9.4 <0.5 <2 1.5 13 1.1 <2 11 6.0 220 <3 <1
Surface w 3249 Rönningesjön, jetty, noon ng/l <1 2.3 22 10 <0.5 19 <0.5 2.4 2.0 19 <0.3 <1 100 4.3 220 <1.6 <0.6
Surface w 3241 Rönningesjön, jetty, evening ng/l <1 1.5 5.9 17 <1 11 <0.5 3.7 1.4 <1 <0.6 <2 8 3.4 300 <3 <1
Surface w 3243 Rönningesjön S1 ng/l <1 <1 5.9 21 <1 10 <0.5 <2 2.2 14 <0.6 <2 27 1.4 250 <3 <1
Surface w 3244 Rönningesjön S2 ng/l <1 1.6 5.7 24 6.7 8.6 <0.5 2.1 <1 4 2.0 <2 41 4.1 290 <3 <1
Surface w 3245 Rönningesjön S3 ng/l <1 <1 8.4 <1 <1 12 1 4.4 <1 3 <0.6 3 66 <1 270 22 <1
Surface w 3246 Rönningesjön S4 ng/l <1 <1 5.8 78 <1 10 0 2.8 <1 <2 <0.6 <2 45 <1 280 <3 <1
Surface w 3247 Rönningesjön S5 ng/l <1 4.0 18 4.4 14 12 <0.5 <2 2.3 <2 <0.6 <3 96 3.4 310 <3 <1
Surface w 3248 Rönningesjön S6 ng/l <1 2.0 3.6 <0.5 <1 10 <0.5 <2 <1 <2 <0.6 <4 12 4.8 240 <3 <1
Surface w 3464 Rönningesjön S1, autumn ng/l <1 2.6 1.6 <0.5 <0.5 <3 <0.5 24 <0.5 <2 <0.5 <1 16 0.8 250 <1.6 <0.6
Surface w 3347 Åminne ng/l <1 <0.5 <2 10 <0.5 3.9 <0.5 2.7 <0.5 <2 <0.5 <1 <2 2.0 89 <1.6 <0.6
Surface w 3306 Årsunda beach Storsjön ng/l <1 <0.5 <2 11 <0.5 5.0 <0.5 <1 <0.5 <2 <0.5 <1 <2 <0.6 100 <1.6 <0.6
Surface w 3304 Stenö Seabeach Söderhamnsfjärden
ng/l <1 <0.5 <2 8.1 5 6.2 <0.5 <1 <0.5 <2 <0.5 <1 <2 <0.6 63 <1.6 <0.6
Surface w 3255 Mången (Mangenbadet) ng/l <1 2.8 3.7 7.4 <0.5 <3 <0.5 <1 <0.5 <2 15 <1 <2 1.6 44 <1.6 <0.6
Surface w 3256 Långsjön (Hasseldalen) ng/l <1 0.5 <2 3.9 <0.5 <3 <0.5 <1 <0.5 <2 <0.5 <1 <2 <0.6 40 <1.6 <0.6
Surface w 3494 Stora Delsjön ng/l <1 0.9 1.2 7.9 7 6.3 <0.5 6.6 <0.5 <2 1.1 <1 2.6 1.7 44 18 <0.6
Surface w 3495 Kattegatt, Näsets beach ng/l <1 1.1 <1.5 18 <0.5 <3 <0.5 2.7 <0.5 <2 <0.5 <1 5.9 0.7 40 <1.6 <0.6
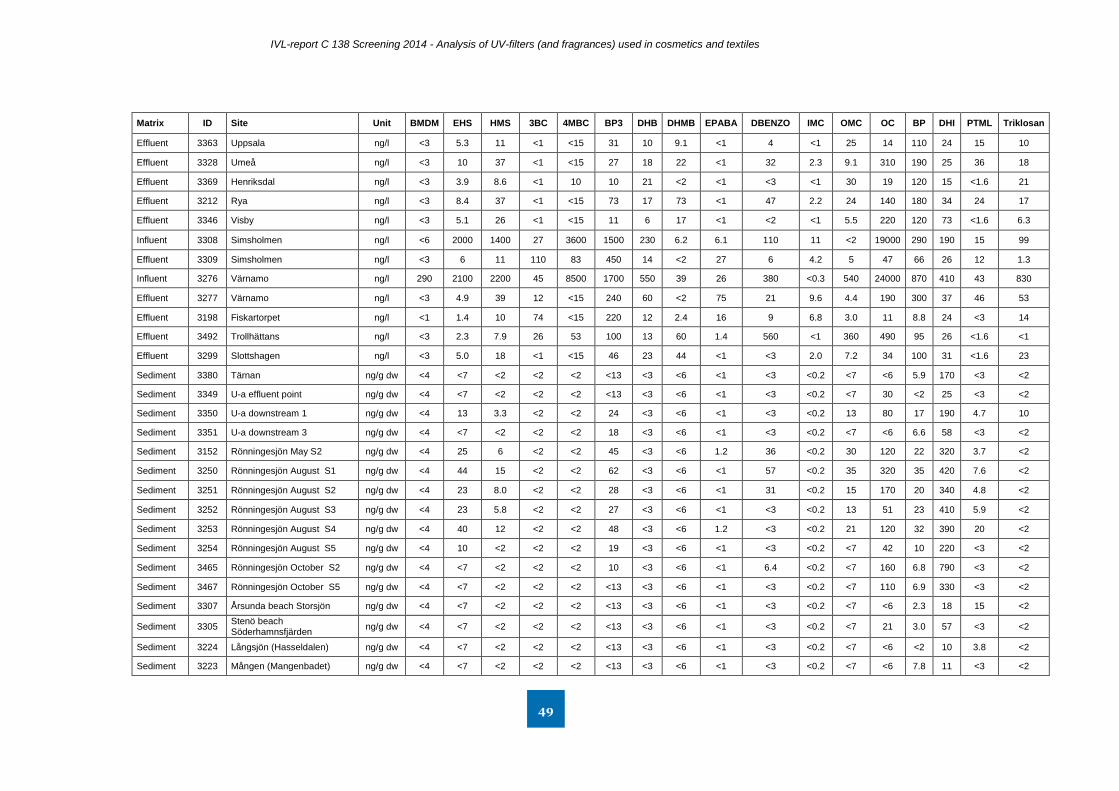
IVL-report C 138 Screening 2014 - Analysis of UV-filters (and fragrances) used in cosmetics and textiles
49
Matrix ID Site Unit BMDM EHS HMS 3BC 4MBC BP3 DHB DHMB EPABA DBENZO IMC OMC OC BP DHI PTML Triklosan
Effluent 3363 Uppsala ng/l <3 5.3 11 <1 <15 31 10 9.1 <1 4 <1 25 14 110 24 15 10
Effluent 3328 Umeå ng/l <3 10 37 <1 <15 27 18 22 <1 32 2.3 9.1 310 190 25 36 18
Effluent 3369 Henriksdal ng/l <3 3.9 8.6 <1 10 10 21 <2 <1 <3 <1 30 19 120 15 <1.6 21
Effluent 3212 Rya ng/l <3 8.4 37 <1 <15 73 17 73 <1 47 2.2 24 140 180 34 24 17
Effluent 3346 Visby ng/l <3 5.1 26 <1 <15 11 6 17 <1 <2 <1 5.5 220 120 73 <1.6 6.3
Influent 3308 Simsholmen ng/l <6 2000 1400 27 3600 1500 230 6.2 6.1 110 11 <2 19000 290 190 15 99
Effluent 3309 Simsholmen ng/l <3 6 11 110 83 450 14 <2 27 6 4.2 5 47 66 26 12 1.3
Influent 3276 Värnamo ng/l 290 2100 2200 45 8500 1700 550 39 26 380 <0.3 540 24000 870 410 43 830
Effluent 3277 Värnamo ng/l <3 4.9 39 12 <15 240 60 <2 75 21 9.6 4.4 190 300 37 46 53
Effluent 3198 Fiskartorpet ng/l <1 1.4 10 74 <15 220 12 2.4 16 9 6.8 3.0 11 8.8 24 <3 14
Effluent 3492 Trollhättans ng/l <3 2.3 7.9 26 53 100 13 60 1.4 560 <1 360 490 95 26 <1.6 <1
Effluent 3299 Slottshagen ng/l <3 5.0 18 <1 <15 46 23 44 <1 <3 2.0 7.2 34 100 31 <1.6 23
Sediment 3380 Tärnan ng/g dw <4 <7 <2 <2 <2 <13 <3 <6 <1 <3 <0.2 <7 <6 5.9 170 <3 <2
Sediment 3349 U-a effluent point ng/g dw <4 <7 <2 <2 <2 <13 <3 <6 <1 <3 <0.2 <7 30 <2 25 <3 <2
Sediment 3350 U-a downstream 1 ng/g dw <4 13 3.3 <2 <2 24 <3 <6 <1 <3 <0.2 13 80 17 190 4.7 10
Sediment 3351 U-a downstream 3 ng/g dw <4 <7 <2 <2 <2 18 <3 <6 <1 <3 <0.2 <7 <6 6.6 58 <3 <2
Sediment 3152 Rönningesjön May S2 ng/g dw <4 25 6 <2 <2 45 <3 <6 1.2 36 <0.2 30 120 22 320 3.7 <2
Sediment 3250 Rönningesjön August S1 ng/g dw <4 44 15 <2 <2 62 <3 <6 <1 57 <0.2 35 320 35 420 7.6 <2
Sediment 3251 Rönningesjön August S2 ng/g dw <4 23 8.0 <2 <2 28 <3 <6 <1 31 <0.2 15 170 20 340 4.8 <2
Sediment 3252 Rönningesjön August S3 ng/g dw <4 23 5.8 <2 <2 27 <3 <6 <1 <3 <0.2 13 51 23 410 5.9 <2
Sediment 3253 Rönningesjön August S4 ng/g dw <4 40 12 <2 <2 48 <3 <6 1.2 <3 <0.2 21 120 32 390 20 <2
Sediment 3254 Rönningesjön August S5 ng/g dw <4 10 <2 <2 <2 19 <3 <6 <1 <3 <0.2 <7 42 10 220 <3 <2
Sediment 3465 Rönningesjön October S2 ng/g dw <4 <7 <2 <2 <2 10 <3 <6 <1 6.4 <0.2 <7 160 6.8 790 <3 <2
Sediment 3467 Rönningesjön October S5 ng/g dw <4 <7 <2 <2 <2 <13 <3 <6 <1 <3 <0.2 <7 110 6.9 330 <3 <2
Sediment 3307 Årsunda beach Storsjön ng/g dw <4 <7 <2 <2 <2 <13 <3 <6 <1 <3 <0.2 <7 <6 2.3 18 15 <2
Sediment 3305 Stenö beach Söderhamnsfjärden
ng/g dw <4 <7 <2 <2 <2 <13 <3 <6 <1 <3 <0.2 <7 21 3.0 57 <3 <2
Sediment 3224 Långsjön (Hasseldalen) ng/g dw <4 <7 <2 <2 <2 <13 <3 <6 <1 <3 <0.2 <7 <6 <2 10 3.8 <2
Sediment 3223 Mången (Mangenbadet) ng/g dw <4 <7 <2 <2 <2 <13 <3 <6 <1 <3 <0.2 <7 <6 7.8 11 <3 <2

IVL-report C 138 Screening 2014 - Analysis of UV-filters (and fragrances) used in cosmetics and textiles
50
Matrix ID Site Unit BMDM EHS HMS 3BC 4MBC BP3 DHB DHMB EPABA DBENZO IMC OMC OC BP DHI PTML Triklosan
Sludge 3364 Uppsala ng/g dw <5 660 1200 <30 86 <10 <5 <1 <3 140 <1 27 19000 180 400 76 420
Sludge 3329 Umeå ng/g dw <5 4000 4700 <30 160 <10 <5 <1 6.4 <20 <1 49 44000 340 420 480 370
Sludge 3372 Henriksdal ng/g dw <5 800 1800 <30 <4 12 <5 <1 <3 <20 <1 28 18000 160 480 140 720
Sludge 3213 Rya ng/g dw <5 2700 4400 <30 <4 11 <5 <1 <3 <20 <1 31 24000 310 430 74 520
Sludge 3310 Simsholmen ng/g dw <5 780 1700 <30 <4 <10 <5 <1 4.7 <20 <1 28 13000 130 390 62 300
Sludge 3311 Simsholmen ng/g dw <5 1100 3000 <30 <4 <10 <5 <1 <3 1200 <1 38 25000 180 480 80 310
Sludge 3199 Fiskartorpet ng/g dw <5 590 420 <30 <4 <10 38 <1 6.4 650 <1 160 10000 54 240 29 120
Sludge 3493 Trollhättan ng/g dw <5 720 930 <30 <4 <10 <5 <1 <3 47 <1 18 8800 190 280 44 200
Sludge 3300 Slottshagen ng/g dw <5 1700 2400 <30 <4 <10 <5 <1 36 190 <1 31 17000 300 350 300 730
Fish muscle
3734 Tärnan ng/g fw <1 <0.5 <0.3 <3 <0.1 <0.4 <2 <2 <1 <1 <0.1 <0.3 <2 <4 <0.5 <1 <0.3
Fish muscle
3720 U-a Valloxen, reg backgr ng/g fw <1 <0.5 <0.3 <3 <0.1 <0.4 <2 <2 <1 <1 <0.1 <0.3 5.1 <4 <0.5 <1 <0.3
Fish muscle
3721 U-a effluent point ng/g fw <1 <0.5 <0.3 <3 <0.1 <0.4 <2 <2 <1 <1 <0.1 0.49 7.5 <4 0.6 <1 <0.3
Fish muscle
3722 U-a downstream 3 (4.6 km) ng/g fw <1 0.63 0.65 <3 <0.1 <0.4 <2 <2 <1 <1 <0.1 1.4 2.7 <4 1.2 <1 <0.3
Fish muscle
3296 Mången (Mangenbadet) ng/g fw <1 <0.5 <0.3 <3 <0.1 <0.4 <2 <2 <1 <1 <0.1 <0.3 <2 <4 1.4 <1 <0.3
Fish muscle
3681 Göta älv, Smedströmmen, Stallbackabron
ng/g fw <1 <0.5 <0.3 <3 <0.1 <0.4 <2 <2 <1 <1 <0.1 <0.3 <2 <4 <0.5 <1 <0.3
Fish muscle
3682 Stora Delsjön ng/g fw <1 <0.5 <0.3 <3 <0.1 0.44 <2 <2 <1 <1 <0.1 0.33 <2 <4 <0.5 3.8 <0.3
Fish muscle
3683 Kattegatt, Saltsjönäs, Askimsviken
ng/g fw <1 <0.5 <0.3 3.6 <0.1 <0.4 <2 <2 <1 <1 <0.1 <0.3 <2 <4 <0.5 <1 <0.3
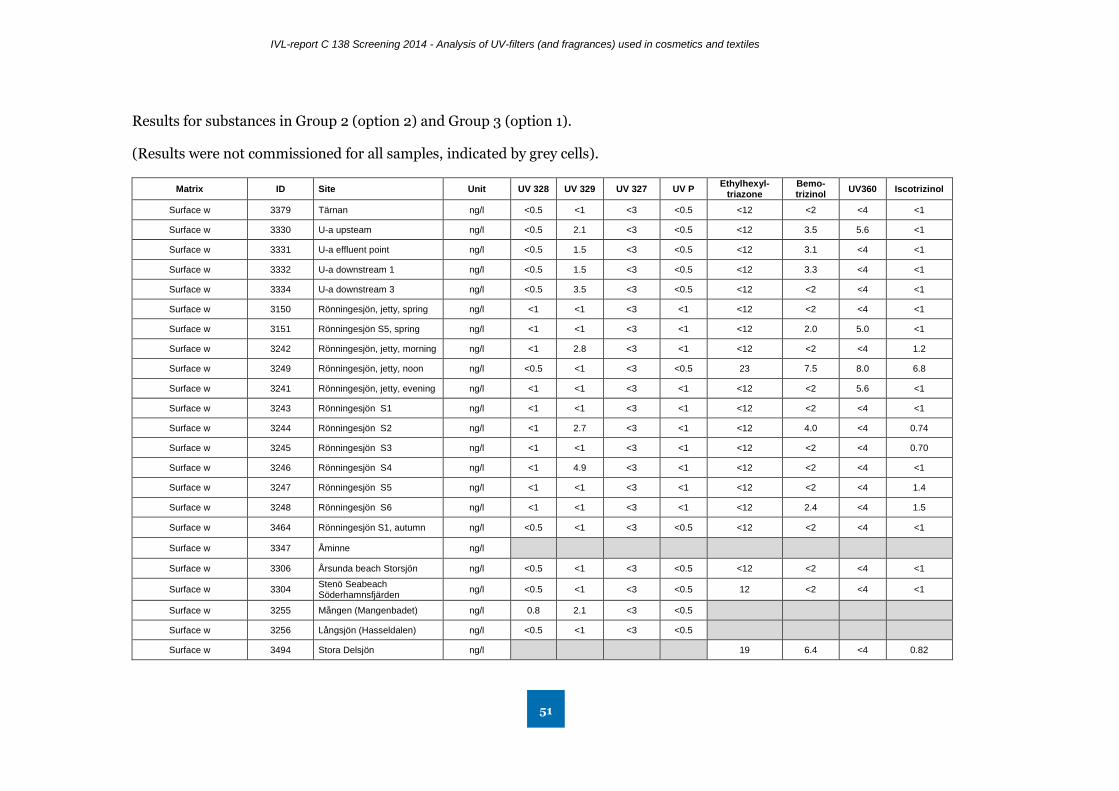
IVL-report C 138 Screening 2014 - Analysis of UV-filters (and fragrances) used in cosmetics and textiles
51
Results for substances in Group 2 (option 2) and Group 3 (option 1).
(Results were not commissioned for all samples, indicated by grey cells).
Matrix ID Site Unit UV 328 UV 329 UV 327 UV P Ethylhexyl-
triazone Bemo- trizinol
UV360 Iscotrizinol
Surface w 3379 Tärnan ng/l <0.5 <1 <3 <0.5 <12 <2 <4 <1
Surface w 3330 U-a upsteam ng/l <0.5 2.1 <3 <0.5 <12 3.5 5.6 <1
Surface w 3331 U-a effluent point ng/l <0.5 1.5 <3 <0.5 <12 3.1 <4 <1
Surface w 3332 U-a downstream 1 ng/l <0.5 1.5 <3 <0.5 <12 3.3 <4 <1
Surface w 3334 U-a downstream 3 ng/l <0.5 3.5 <3 <0.5 <12 <2 <4 <1
Surface w 3150 Rönningesjön, jetty, spring ng/l <1 <1 <3 <1 <12 <2 <4 <1
Surface w 3151 Rönningesjön S5, spring ng/l <1 <1 <3 <1 <12 2.0 5.0 <1
Surface w 3242 Rönningesjön, jetty, morning ng/l <1 2.8 <3 <1 <12 <2 <4 1.2
Surface w 3249 Rönningesjön, jetty, noon ng/l <0.5 <1 <3 <0.5 23 7.5 8.0 6.8
Surface w 3241 Rönningesjön, jetty, evening ng/l <1 <1 <3 <1 <12 <2 5.6 <1
Surface w 3243 Rönningesjön S1 ng/l <1 <1 <3 <1 <12 <2 <4 <1
Surface w 3244 Rönningesjön S2 ng/l <1 2.7 <3 <1 <12 4.0 <4 0.74
Surface w 3245 Rönningesjön S3 ng/l <1 <1 <3 <1 <12 <2 <4 0.70
Surface w 3246 Rönningesjön S4 ng/l <1 4.9 <3 <1 <12 <2 <4 <1
Surface w 3247 Rönningesjön S5 ng/l <1 <1 <3 <1 <12 <2 <4 1.4
Surface w 3248 Rönningesjön S6 ng/l <1 <1 <3 <1 <12 2.4 <4 1.5
Surface w 3464 Rönningesjön S1, autumn ng/l <0.5 <1 <3 <0.5 <12 <2 <4 <1
Surface w 3347 Åminne ng/l
Surface w 3306 Årsunda beach Storsjön ng/l <0.5 <1 <3 <0.5 <12 <2 <4 <1
Surface w 3304 Stenö Seabeach Söderhamnsfjärden
ng/l <0.5 <1 <3 <0.5 12 <2 <4 <1
Surface w 3255 Mången (Mangenbadet) ng/l 0.8 2.1 <3 <0.5
Surface w 3256 Långsjön (Hasseldalen) ng/l <0.5 <1 <3 <0.5
Surface w 3494 Stora Delsjön ng/l 19 6.4 <4 0.82

IVL-report C 138 Screening 2014 - Analysis of UV-filters (and fragrances) used in cosmetics and textiles
52
Matrix ID Site Unit UV 328 UV 329 UV 327 UV P Ethylhexyl-
triazone Bemo- trizinol
UV360 Iscotrizinol
Surface w 3495 Kattegatt, Näsets beach ng/l 14 16 18 1.6
Effluent 3363 Uppsala ng/l <1 6.7 <5 3.4 35 1600 180 <2
Effluent 3328 Umeå ng/l <1 7.0 <5 8.0 <30 2500 650 10
Effluent 3369 Henriksdal ng/l 0.7 <2 <5 1.9 39 18 27 <2
Effluent 3212 Rya ng/l <1 <2 <5 7.3 <30 33 14 6
Effluent 3346 Visby ng/l
Influent 3308 Simsholmen ng/l 48 6 <5 26
Effluent 3309 Simsholmen ng/l <1 <2 <5 8.6
Influent 3276 Värnamo ng/l 95 17 <5 70
Effluent 3277 Värnamo ng/l 5.6 <2 <5 8.8
Effluent 3198 Fiskartorpet ng/l <1 <2 <5 2.6 <30 26.0 <9 <2
Effluent 3492 Trollhättans ng/l 4.7 5 <5 5.5 <30 <6 <9 <2
Effluent 3299 Slottshagen ng/l 1.2 6 <5 5.1
Sediment 3380 Tärnan ng/g dw <6 <3 <5 <4 <70 <40 <20 <1
Sediment 3349 U-a effluent point ng/g dw <6 <3 <5 <4 <70 <40 <20 <1
Sediment 3350 U-a downstream 1 ng/g dw 10 5.4 <5 6.3 <70 <40 <20 <1
Sediment 3351 U-a downstream 3 ng/g dw <6 <3 <5 <4 <70 <40 <20 6.5
Sediment 3152 Rönningesjön S2 ng/g dw <6 <3 <5 4.5 <70 <40 29 3.0
Sediment 3250 Rönningesjön S1 ng/g dw <6 <3 <5 6.4 73.0 <40 170 18
Sediment 3251 Rönningesjön S2 ng/g dw <6 <3 <5 4.1 <70 <40 160 8.5
Sediment 3252 Rönningesjön S3 ng/g dw <6 <3 <5 <4 <70 <40 92 3.9
Sediment 3253 Rönningesjön S4 ng/g dw 7.1 <3 <5 5.2 <70 <40 100 5.8
Sediment 3254 Rönningesjön S5 ng/g dw <6 <3 <5 <4 <70 <40 110 2.6
Sediment 3465 Rönningesjön autumn S1 ng/g dw <6 <3 <5 <4 <70 <40 220 5.8
Sediment 3467 Rönningesjön autumn S5 ng/g dw <6 <3 <5 <4 <70 <40 240 8.1
Sediment 3307 Årsunda beach Storsjön ng/g dw <6 <3 <5 <4 <70 <40 <20 <1
Sediment 3305 Stenö beach Söderhamnsfjärden
ng/g dw <6 <3 <5 <4 <70 <40 <20 1.4

IVL-report C 138 Screening 2014 - Analysis of UV-filters (and fragrances) used in cosmetics and textiles
53
Matrix ID Site Unit UV 328 UV 329 UV 327 UV P Ethylhexyl-
triazone Bemo- trizinol
UV360 Iscotrizinol
Sediment 3224 Långsjön (Hasseldalen) ng/g dw <6 <3 <5 <4
Sediment 3223 Mången (Mangenbadet) ng/g dw <6 <3 <5 <4
Sludge 3364 Uppsala ng/g dw 290 40 22 52 4700 5000 15000 1700
Sludge 3329 Umeå ng/g dw 260 22 25 83 12000 15000 16000 2000
Sludge 3372 Henriksdal ng/g dw 300 56 27 130 6600 7100 21000 3100
Sludge 3213 Rya ng/g dw 280 49 20 69 5100 6300 19000 1800
Sludge 3310 Simsholmen ng/g dw 250 38 24 67
Sludge 3311 Simsholmen ng/g dw 290 51 28 62
Sludge 3199 Fiskartorpet ng/g dw 44 7.2 10 <10 3000 3100 9200 750
Sludge 3493 Trollhättan ng/g dw 170 35 15 35 1400 1200 4600 300
Sludge 3300 Slottshagen ng/g dw 300 50 25 88
Fish muscle 3734 Tärnan ng/g fw <0.3 <0.3 <0.3 <0.2
Fish muscle 3720 U-a Valloxen, reg backgr ng/g fw <0.3 <0.3 <0.3 <0.2
Fish muscle 3721 U-a effluent point ng/g fw <0.3 <0.3 <0.3 <0.2
Fish muscle 3722 U-a downstream 3 (4.6 km) ng/g fw <0.3 <0.3 <0.3 <0.2
Fish muscle 3296 Mången (Mangenbadet) ng/g fw <0.3 <0.3 <0.3 <0.2
Fish muscle 3681 Göta älv, Smedströmmen nedan Stallbackabron
ng/g fw <0.3 <0.3 <0.3 <0.2
Fish muscle 3682 Stora Delsjön ng/g fw <0.3 <0.3 <0.3 <0.2
Fish muscle 3683 Kattegatt, Saltsjönäs, Askimsviken
ng/g fw <0.3 <0.3 <0.3 <0.2

IVL Swedish Environmental Research Institute Ltd., P.O. Box 210 60,
S-100 31 Stockholm, Sweden
Phone: +46-10-788 65 00 Fax: +46-10-788 65 90
www.ivl.se
Add external logotypes