screening guidelines and data analysis for the application
TRANSCRIPT

Scholars' Mine Scholars' Mine
Doctoral Dissertations Student Theses and Dissertations
Spring 2017
Screening guidelines and data analysis for the application of in-Screening guidelines and data analysis for the application of in-
situ polymer gels for injection well conformance improvement situ polymer gels for injection well conformance improvement
Munqith Naeem Rashak Aldhaheri
Follow this and additional works at: https://scholarsmine.mst.edu/doctoral_dissertations
Part of the Petroleum Engineering Commons
Department: Geosciences and Geological and Petroleum Engineering Department: Geosciences and Geological and Petroleum Engineering
Recommended Citation Recommended Citation Aldhaheri, Munqith Naeem Rashak, "Screening guidelines and data analysis for the application of in-situ polymer gels for injection well conformance improvement" (2017). Doctoral Dissertations. 2555. https://scholarsmine.mst.edu/doctoral_dissertations/2555
This thesis is brought to you by Scholars' Mine, a service of the Missouri S&T Library and Learning Resources. This work is protected by U. S. Copyright Law. Unauthorized use including reproduction for redistribution requires the permission of the copyright holder. For more information, please contact [email protected].

SCREENING GUIDELINES AND DATA ANALYSIS FOR THE APPLICATION OF
IN-SITU POLYMER GELS FOR INJECTION WELL CONFORMANCE
IMPROVEMENT
by
MUNQITH NAEEM RASHAK ALDHAHERI
A DISSERTATION
Presented to the Faculty of the Graduate School of the
MISSOURI UNIVERSITY OF SCIENCE AND TECHNOLOGY
In Partial Fulfillment of the Requirements for the Degree
DOCTOR OF PHILOSOPHY
in
PETROLEUM ENGINEERING
2017
Approved by:
Baojun Bai (Advisor)
Mingzhen Wei (Co-Advisor)
Shari Dunn-Norman
Peyman Heidari
Mojdeh Delshad

2017
Munqith Naeem Rashak Aldhaheri
All Rights Reserved

iii
PUBLICATION DISSERTATION OPTION
This dissertation has been prepared in the form of three SPE technical papers that
are formatted according to the style used by the Society of Petroleum Engineers (SPE):
Paper I: Pages 89-155 have been published in SPE OnePetro.
Paper II: Pages 156-216 have been published in SPE OnePetro.
Paper III: Pages 217-273 have been published in SPE OnePetro.
In the first section, the problem of excessive water production, some
fundamentals of conformance engineering, and study objectives are presented. The major
study findings, conclusions, and future work recommendations are summarized in the
second section.

iv
ABSTRACT
Excessive water production represents a major industry challenge because of its
serious economic and environmental impacts. Polymer gels have been effectively applied
to mitigate water production and extend the productive lives of mature oilfields.
However, selecting a proper gel technology for a given reservoir is a challenging task for
reservoir engineers because of the associated geological and technical complexities and
the absence of efficient screening tools.
A comprehensive review for the worldwide gel field projects was conducted to
develop an integrated systematic methodology that determines the applicability of three
injection well gel technologies including bulk gels, colloidal dispersion gels, and weak
gels. Comparative analysis, statistical methods, and a machine learning technique were
utilized to develop a conformance agent selection advisor that consists of a standardized
selection system, conventional screening criteria, and advanced screening models.
The results indicated that gel technology selection is a two-step process that starts
by matching problem characteristics with gel technical specifications and mechanisms.
Then, the initial candidate technology is confirmed by screening criteria to ensure gel
compatibility with reservoir conditions. The most influential conformance problem
characteristics in the matching process are channeling strength, volume of problem zone,
problem development status, and the existence of crossflow. In addition to crossflow, the
presence of high oil saturations or unswept regions in the offending zones requires the
application of flood-size treating technologies that combine both displacement and
diversion mechanisms. The selection and design of gel technologies for a given
conformance problem greatly depend on the timing of the gel treatment in the flood life.

v
ACKNOWLEDGMENTS
First, thanks to Allah (God) for giving me the many blessings, opportunity, and
strength to complete this long research journey. Second, I would like to express my
sincere gratitude to my PhD advisors, Dr. Baojun Bai and Dr. Mingzhen Wei, for their
invaluable support throughout my research. They have always been excellent mentors,
contributors, supporters, and friends during the whole study.
I would also like to thank my committee members, Dr. Shari Dunn-Norman, Dr.
Peyman Heidari, and Dr. Mojdeh Delshad, for their valuable advice and
recommendations. I am very grateful to the Higher Committee for Educational
Development (HCED) in Iraq for granting me a PhD scholarship and financial support.
I am very thankful for my research group members, Yue Qiu, Dheiaa Alfarge, Na
Zhang, and Yandong Zhang, for being such wonderful partners and helpers. I would also
like to thank friends in my hometown and in Rolla, especially, Scott Robinson and Ali
Alhuraishawy, for their support and encouragement. I am deeply indebted to my
professors in the Petroleum Engineering department at University of Baghdad for their
guidance and support throughout my undergraduate and graduate studies.
A special thanks to my family for their love, support, encouragement, and prayers
throughout my study. To my parents, I do not only want to say thank you, I want to say I
am so sorry that I left you alone and waiting all this long time.
Ultimately, I would like to thank my lovely wife, Roaa, and my wonderful sons,
Murtagi, Ali, and Abu Alqasim, for their love and great patience throughout my study.
Without their steadfast support and kind encouragement, this study would have never
been completed. They are my rocks.

vi
TABLE OF CONTENTS
Page
PUBLICATION DISSERTATION OPTION ................................................................... iii
ABSTRACT ....................................................................................................................... iv
ACKNOWLEDGMENTS .................................................................................................. v
LIST OF ILLUSTRATIONS ........................................................................................... xiii
LIST OF TABLES ......................................................................................................... xviii
SECTION
1. INTRODUCTION ...................................................................................................... 1
1.1. PROBLEM STATEMENT AND SIGNIFICANCE .......................................... 1
1.2. RESEARCH OBJECTIVE AND WORK SCOPE ............................................. 4
2. LITERATURE REVIEW ........................................................................................... 8
2.1. OIL RECOVERY AND RESERVOIR CONFORMANCE ............................... 8
2.2. EXCESSIVE WATER PRODUCTION ........................................................... 12
2.3. CONFORMANCE PROBLEM TYPES ........................................................... 12
2.3.1. Wellbore Problems ................................................................................. 15
2.3.1.1. Water channeling behind pipe ...................................................15
2.3.1.2. Casing leaks ...............................................................................16
2.3.2. Near-Wellbore Problems ........................................................................ 17
2.3.2.1. High-permeability matrix-rock strata without crossflow ...........17
2.3.2.2. Water coning through fractures .................................................17
2.3.2.3. Water coning through matrix rock .............................................17
2.3.2.4. Water cusping through matrix rock ...........................................18

vii
2.3.3. Far-Wellbore Problems .......................................................................... 18
2.3.3.1. Mobility-induced viscous fingering ...........................................18
2.3.3.2. Fracture channeling ....................................................................20
2.3.3.3. Solution channels and interconnected vuggy porosity...............20
2.3.3.4. High-permeability matrix-rock strata with crossflow ................20
2.3.3.5. High-permeability matrix-rock directional trends .....................21
2.3.3.6. Water production from a single layer ........................................21
2.4. DIAGNOSIS OF CONFORMANCE PROBLEMS ......................................... 22
2.4.1. Chan Graphical Method ......................................................................... 24
2.4.2. Seright Et Al. Method ............................................................................ 28
2.4.3. Interwell Communication Analysis ........................................................ 29
2.4.4. Pressure Index Technique ...................................................................... 30
2.4.5. Well Zoning Procedures ......................................................................... 30
2.5. CONFORMANCE IMPROVEMENT TECHNOLOGIES .............................. 33
2.6. GEL AND POLYMER GEL CONFORMANCE TECHNOLOGIES ............. 37
2.6.1. Bulk Gels ................................................................................................ 43
2.6.2. Colloidal Dispersion Gels ...................................................................... 45
2.6.3. Weak Gels .............................................................................................. 48
2.7. TYPES OF CHEMICAL CONFORMANCE CONTROL ............................... 49
2.7.1. Water Shutoff Treatment ........................................................................ 50
2.7.2. Profile Control Treatment ...................................................................... 51
2.7.3. In-Depth Fluid Diversion Treatment ...................................................... 53
2.8. PLACEMENT TECHNIQUES OF CONFORMANCE CHEMICALS........... 53

viii
2.8.1. Bullhead Placement ................................................................................ 54
2.8.2. Mechanical Isolation Placement ............................................................. 54
2.8.3. Dual-Injection Placement ....................................................................... 55
2.8.4. Isoflow Placement .................................................................................. 56
2.8.5. Transient Placement ............................................................................... 56
2.9. EOR SCREENING CRITERIA ........................................................................ 57
2.9.1. Conventional Screening Criteria ............................................................ 57
2.9.2. Advanced Screening Criteria .................................................................. 58
2.10. PREVIOUS POLYMER GEL APPLICABILITY GUIDELINES................. 59
2.10.1. Numerical Screening Criteria. .............................................................. 61
2.10.2. Qualitative Well Candidate Selection Criteria ..................................... 66
2.10.3. Conformance Problems Classification ................................................. 68
2.11. LITERATURE REVIEW DISCUSSION ....................................................... 86
PAPER
I. Comprehensive Guidelines for the Application of In-Situ Polymer
Gels for Injection Well Conformance Improvement Based on Field Projects .......... 89
Abstract ................................................................................................................... 89
Introduction .............................................................................................................. 91
Polymer Gel Conformance Technologies ................................................................ 95
Bulk Gels ....................................................................................................... 95
Colloidal Dispersion Gels ................................................................................ 97
Weak Gels ....................................................................................................... 98
Polymer Gels Data: Features, Problems, and Analysis.......................................... 100
Evaluation of Polymer Gels Applicability Guidelines........................................... 108

ix
Reservoir Lithology and Formation Type ...................................................... 111
IOR/EOR Recovery Process .......................................................................... 112
Average Reservoir Permeability .................................................................... 113
Permeability Variation ................................................................................... 120
Reservoir Temperature ................................................................................... 122
Average Reservoir Depth ............................................................................... 124
Average Reservoir Thickness ......................................................................... 126
Oil Viscosity ................................................................................................... 126
Mobility Ratio ................................................................................................ 128
Pretreatment Water Cut .................................................................................. 131
Flood Maturity ................................................................................................ 134
Comparisons of Polymer Gels Applicability Guidelines ....................................... 139
Conclusions ............................................................................................................ 147
Nomenclature ......................................................................................................... 149
Acknowledgement ................................................................................................. 150
References .............................................................................................................. 150
II. A Roadmap to Successfully Select a Proper Gel Treatment Technology ............. 156
Abstract ................................................................................................................. 156
Introduction ............................................................................................................ 157
Polymer Gel Conformance Technologies .............................................................. 162
Bulk Gels ..................................................................................................... 162
Colloidal Dispersion Gels .............................................................................. 164
Weak Gels ..................................................................................................... 165

x
Components of Gel Technology Selection Process ............................................... 167
Review of Gel Field Projects ................................................................................. 170
New Classification of Conformance Problems ...................................................... 173
Communication Strength and Pattern ............................................................. 174
Direct Channeling Problems .................................................................174
Indirect Channeling Problems...............................................................177
Conformance Problem Status ......................................................................... 177
Undeveloped Conformance Problems ..................................................178
Developed Conformance Problems ......................................................179
Comprehensive Comparative Analysis of Conformance Problem
Characteristics ........................................................................................................ 179
Drive-Fluid Channeling Strength ................................................................... 180
Problem Zone Volume ................................................................................... 186
Problem Development Status ......................................................................... 192
Remaining Oil Saturation .....................................................................197
Integrated Comprehensive Selection System......................................................... 201
Conclusions ............................................................................................................ 209
Acknowledgement ................................................................................................. 210
References .............................................................................................................. 211
III. An Advanced Selection Tool for the Application of In-Situ Polymer
Gels for Undiagnosed Injection Wells ................................................................. 217
Abstract ................................................................................................................. 217
Introduction ............................................................................................................ 218
Polymer Gel Conformance Improvement Technologies ....................................... 223

xi
Bulk Gels ..................................................................................................... 224
Colloidal Dispersion Gels .............................................................................. 224
Weak Gels ..................................................................................................... 225
Logistic Regression Principles and Performance Measures .................................. 225
Database Compilation and Data Processing .......................................................... 230
Property Selection .......................................................................................... 231
Missing Data Treatment ................................................................................. 233
Outliers Identification and Treatment ............................................................ 235
Collinearity of Independent Variables ........................................................... 236
Selection and Treatment of Independent Variables ............................................... 237
Data Availability and Quality ......................................................................... 242
Discriminatory Powers ................................................................................... 243
Logistic Probability Plots ............................................................................... 243
Data Gaps ..................................................................................................... 245
Logistic Regression Stability and Separation ................................................. 250
Treatment of Independent Variables .............................................................. 251
Model Construction and Estimation ...................................................................... 253
Model Validation and Results Discussion ............................................................. 258
Conclusions ............................................................................................................ 267
Nomenclature ......................................................................................................... 268
Acknowledgement ................................................................................................. 269
References .............................................................................................................. 270

xii
SECTION
3. CONCLUSIONS AND RECOMMENDATIONS ................................................. 274
REFERENCES ............................................................................................................... 278
VITA .............................................................................................................................. 288

xiii
LIST OF ILLUSTRATIONS
Figure Page
SECTION
1.1. U.S. Oil, Water, and Gas Production in 2007 and 2012 .............................................. 2
2.1. Ideally Swept Pattern with Stable Displacement and Even Injection Profiles ............ 9
2.2. Poorly Swept Pattern with Non-Uniform Flood Front and Injection Profiles ........... 11
2.3. Conformance Problems Roots and Examples ............................................................ 14
2.4. Vertical and Areal Conformance Problems ............................................................... 15
2.5. Wellbore and Near-Wellbore Conformance Problems .............................................. 16
2.6. Far-Wellbore Reservoir Conformance Problems ....................................................... 19
2.7. RPM Treatment of a Single Formation ...................................................................... 22
2.8. Chan Diagnostic Plots for Conformance Problems ................................................... 27
2.9. Trends of Water Flow Rates for a Strong Channeling Problem ................................ 31
2.10. Interwell Communication Map ................................................................................ 31
2.11. Injection Well Pressure Drawdown Curve for PI Technique .................................. 32
2.12. Communication Map Used for Well Zoning ........................................................... 35
2.13. Form and Structure of Bulk Gels ............................................................................. 42
2.14. Dry and Swollen Preformed Gel Particles ............................................................... 42
2.15. Illustration of Gel Treatment Function and Objective ............................................. 43
2.16. Development Stages of Colloidal Dispersion Gels .................................................. 46
2.17. Types of Gel Conformance Improvement Treatments ............................................ 52
2.18. Conformance Agent Placement Techniques ............................................................ 55
2.19. Transient Placement Technique ............................................................................... 56

xiv
2.20. Comparison of Numbers of Screening Criteria for EOR Methods .......................... 62
2.21. Development Stages of Conformance Agent Selection Process.............................. 70
2.22. Amoco’s Process Logic for Matching Conformance Problems and Solutions ........ 73
2.23. Problem Identification and Fluid Selection Screens of Water
Control Expert System ............................................................................................. 74
2.24. Comprehensive Conformance Problem and Solution Matrix .................................. 78
2.25. Distributions of gel projects according to reservoir types ....................................... 81
2.26. Comparison of average permeability applicability ranges for gel systems ............. 82
2.27. Permeability variation coefficient distributions for polymer gel projects ............... 82
2.28. Schematic Map of Gel Treated Injectors in EMSU Field ........................................ 84
Paper I
1. Development of screening criteria of polymer gels and common EOR methods ......... 92
2. Original Dykstra-Parsons coefficient (blue) and five imputed (red)
data sets using MICE package in R ............................................................................ 103
3. Porosity and permeability crossplot for different formation types ............................. 104
4. Illustration of three standard deviations rule and interquartile range method ............ 105
5. Distributions of (a) polymer gel projects and (b) treatments per
reservoir lithology and formation type ....................................................................... 112
6. Distributions of (a) polymer gel projects and (b) treatments according
to IOR/EOR process ................................................................................................... 114
7. Porosity distributions for (a) polymer gel projects and (b) treatments ....................... 116
8. Average permeability distributions for (a) polymer gel projects and (b)
treatments .................................................................................................................... 117
9. Comparison of permeability applicability ranges for polymer gels: (a)
composite systems and (b) according to reservoir lithology and formation type ....... 118
10. Permeability variation distributions for (a) polymer gel projects and
(b) treatments ............................................................................................................ 121

xv
11. Reservoir temperature distributions for (a) polymer gel projects and
(b) treatments ............................................................................................................ 123
12. Reservoir depth distributions for (a) polymer gel projects and (b) treatments ......... 125
13. Reservoir net pay thickness distributions for (a) polymer gel projects
and (b) treatments ..................................................................................................... 127
14. Oil viscosity distributions for (a) polymer gel projects and (b) treatments .............. 129
15. Oil API gravity distributions for polymer gel (a) projects and (b) treatments.......... 130
16. Formation water salinity distributions for (a) polymer gel projects
and (b) treatments ..................................................................................................... 132
17. Mobility ratio distributions for (a) polymer gel projects and (b) treatments ............ 133
18. Pre-treatment water cut distributions for (a) polymer gel projects
and (b) treatments ..................................................................................................... 135
19. Oil recovery factor distributions for polymer gel (a) projects and
(b) treatments ............................................................................................................ 137
20. Ranges of recovery factor at startup of gel projects categorized
according to IOR/EOR process ................................................................................. 138
21. Comparison of applicability guidelines of CDGs and polymer flooding ................. 145
22. Comparison of developed screening criteria for gel technologies ............................ 146
23. Application of the developed guidelines for a dual-agent history case .................... 147
Paper II
1. Comprehensive Conformance Problem Matrix .......................................................... 161
2. Components and stages required for matching conformance problems
and polymer gels ......................................................................................................... 169
3. Typical association trends of water injection and production rates for
different channeling strengths ..................................................................................... 176
4. Comparison of the average permeability applicability ranges for
different gel technologies ............................................................................................ 182
5. Comparison of interwell tracer breakthrough times in gel project summary ............. 182

xvi
6. Distributions of polymer gel projects according to reservoir type ............................. 183
7. Permeability variation coefficient distributions for polymer gel projects .................. 184
8. Drive-fluid Channeling Strength Applicability Ranges of Polymer Gels .................. 186
9. Distributions of (a) reported and (b) estimated problem zone volumes
for bulk gel projects .................................................................................................... 188
10. Estimation of problem zone volume in case of flood-size gel treatments ................ 190
11. Distributions of the estimated problem zone volume for CDG projects .................. 190
12. Comparison of the estimated problem zone volumes in gel field projects ............... 191
13. Comparison of the pre-treatment water cut frequencies in gel Projects ................... 194
14. Treatment time-lapse distributions for polymer gel projects .................................... 196
15. Scatter plot for the pre and post-treatment water cut shows trends of
water production during and after conformance remediation for different
gel technologies ........................................................................................................ 197
16. Integrated Roadmap for Gel Technology Selection for Injection Well
Conformance Improvement ...................................................................................... 205
17. Generalized Polymer Gel Selection Matrix for Injection Well
Conformance Improvement ...................................................................................... 206
18. Water injection and production history of Big Mac Unit ......................................... 207
Paper III
1. Conventional screening criteria for polymer gel technologies ................................... 222
2. Polymer gel screening results for an illustrative sandstone reservoir
field produces by waterflooding ................................................................................. 223
3. Illustration of the sigmoid S-shaped logistic distribution function ............................. 226
4. Illustrative Receiver Operation Characteristic Curve (ROC) plot
shows typical curves for a classification model .......................................................... 229
5. Comparison of permeability applicability ranges for polymer gels
according to reservoir lithology and formation type ................................................... 230

xvii
6. Distributions of polymer gel projects according to reservoir
lithology/formation type (left) and IOR/EOR process (right) .................................... 232
7. AUC heuristic variable selection approach for logistic model
bias-variance trade-off ................................................................................................ 241
8. Distributions of logistic probabilities of gel systems for some screening
parameters that match conformance considerations and/or field application
trends ........................................................................................................................... 246
9. Logistic probability plots for some independent variables that have
complex or similar distributions ................................................................................. 248
10. Logistic probability plot for reservoir temperature shows the
approximations of the validity limits of MCAP and OCAP gels.............................. 250
11. Prediction profiler plots and logistic probability plot for reservoir temperature ...... 252
12. Profiler plots show prediction results of one BG history case before
the treatment of IOR/EOR independent variable ...................................................... 253
13. Comparisons of variable effect (left) and importance (right)
summaries for the logistic classification models ...................................................... 257
14. Prediction profiler plot for G2 model shows correct prediction trends
for some influential variables.................................................................................... 262
15. Prediction profiler plots used to monitor performances of logistic
models in screening of polymer gels ........................................................................ 263
16. A snapshot for the Excel spreadsheet of the G4 logistic model
shows screening results for a bulk gel history case .................................................. 265

xviii
LIST OF TABLES
Table Page
SECTION
2.1. Summary of Conformance Problem Diagnostic Techniques and Methods ............... 25
2.2. EMSU Field Treatment Selection Matrix .................................................................. 33
2.3. Ranking of Potential Well Candidate for BW Technology ....................................... 34
2.4. Conformance Improvement Materials and Techniques ............................................. 35
2.5. Representative Types of conformance Improvement Technologies .......................... 38
2.6. Oilfield Conformance Improvement Gel Technologies ............................................ 41
2.7. Types of Chemical Conformance Improvement Treatments ..................................... 51
2.8. Polymer Flooding Screening Criteria ........................................................................ 58
2.9. Summary of Screening Criteria for Colloidal Dispersion Gels ................................. 63
2.10. Summary of Screening Criteria for Metallically-Crosslinked Bulk Gels ................ 65
2.11. General Conformance Decision Matrix ................................................................... 72
2.12. Conformance Problems That are Attractive to Treat With Bulk Gels ..................... 76
2.13. Excessive Water Production and Treatment Categories .......................................... 77
2.14. Some Proposed Cut-offs for Diagnosis Parameters of Drive-fluid
Channeling Strength................................................................................................. 86
Paper I
1. Statistics of Projects and Treatments in Injection-Well Gel Field
Projects Survey (1978-2015) ...................................................................................... 102
2. Descriptive Statistic Summary of Screening Parameters for Polymer
Gel Projects ................................................................................................................. 106
3. Summary of Screening and Matching Parameters Required for
Selection of Polymer Gel Technologies ..................................................................... 110

xix
4. Ranges of Average Permeability for Different Lithologies and
Formation Types in Gel Projects Database ................................................................. 115
5. Application Permeability Ranges of Polymer Gels Analyzed
According to Reservoir Lithology and Formation Type ............................................. 119
6. Summary of Quantitative Screening Parameters for Application
of Polymer Gels in Injection Wells ............................................................................. 141
7. Extensive Comparison of Applicability Criteria of Two Gel Technologies ............... 143
Paper II
1. Summary of Screening and Matching Parameters Required for
Selection of Polymer Gel Technologies ..................................................................... 170
2. Generalized Classification Framework for the Injection Well Reservoir-Related
Conformance Problems and Their Associated Symptoms .......................................... 175
3. Some Proposed Cut-offs for Diagnosis Parameters of Drive-fluid
Channeling Strength.................................................................................................... 181
4. Statistical Comparison of the Reported and the Estimated Problem
Zone Volumes for Bulk Gel Projects .......................................................................... 189
5. Descriptive Summary of Problem Zone Volume Estimations in Gel Projects ........... 191
6. Statistical Summary of Pre-Treatment Water Cut in Polymer Gel Projects ............... 195
7. Statistical Summary of Treatment Time-Lapse in Polymer Gel Project Survey ........ 195
8. Eight Possible Situations for Reservoir Conformance Problems and
Their Corresponding Solutions ................................................................................... 203
Paper III
1. Some Expert Opinions for Drive-fluid Channeling Strength Used in
Evaluation of Polymer Gels Applicability .................................................................. 219
2. Statistics of Projects and Treatments in Injection-Well Gel Field
Project Survey ............................................................................................................. 231
3. Descriptive Statistical Summary of Screening Parameters in Gel
Project Database.......................................................................................................... 234
4. Pearson Correlation Matrix for all Quantitative Independent Variables .................... 238

xx
5. Values of Variance Inflation Factor for Independent Variables
Considered in G4 Model ............................................................................................. 239
6. Summary of Independent Variables Selection Criteria for Logistic
Classification Models.................................................................................................. 242
7. Results of likelihood ratio test for the G4 model and a variant (G4.2)
without categorical regressors..................................................................................... 259
8. Performances of Logistic Classification Models for Training and
Validation Samples Using Three Global Predictivity Measures ................................ 260
9. Confusion Matrix for Results of G3 and G2 Models for Unsuccessful
Gel Pilots ..................................................................................................................... 261

162
1. INTRODUCTION
1.1. PROBLEM STATEMENT AND SIGNIFICANCE
Excessive water production represents a major industry challenge because of its
serious economic and environmental impacts. The problem of producing and disposing of
large quantities of injection water is becoming more crucial due to the tightening
economic constraints caused by the falling oil prices. In addition, water production is
continuing to have high rates in mature oilfields despite the great attention that is paid by
oil and gas companies toward water management practices.
By way of illustration, the 2015 report of Veil Environmental Company shows
that in 2012, the U.S. oilfields produced about 21.2 billion barrels water versus only 2.26
billion barrels oil. This implies that the national water-oil-ratio in the U.S. oilfields is
about 9.2. This report also illustrates that the U.S. produced water volumes in 2012 are
comparable to the 2007 estimates (21 billion barrels), as shown in Figure 1.1. Regarding
water management practices, the report illustrates that about 38.9% of these 21.2 billion
barrels of water is injected into disposal wells in a non-commercial way. If it is assumed
that the average transporting and pumping cost is $1.00 per barrel, then the total cost of
disposing the above percent of the produced water (i.e., 38.9%) is about 8.25 billion
dollars per year. McCurdy (2011) provided that the average disposal cost of one barrel
water is $0.25 and its transportation cost is $1.00 per hour.
Evidently, the above production statistics reveal that there is a persistent need to
plan and conduct more efficient water control treatments with optimized designs to keep
these tremendous water quantities in petroleum reservoirs and improve oil recovery. The

2
first step toward meeting this need is the identification of the best suited solution from the
many conformance improvement technologies and operations.
Figure 1.1. U.S. Oil, Water, and Gas Production in 2007 and 2012 (Veil Environmental,
LLC, 2015)
Controlling water flow during oil production has always been the objective of the
oil and gas industry. It is considered that much of and probably the majority of produced
water results from conformance problems that existed because of reservoir heterogeneity
and unfavorable mobility ratio (Sydansk and Romero-Zeron, 2011). Excessive water
production usually leads to early abandonment for production wells and large bypassed
oil reserves. Polymer gels have been proven to be effective in addressing this problem
and in increasing oil recovery. They are increasingly applied to improve the volumetric
sweep efficiency of different improved oil recovery (IOR) or enhanced oil recovery
1.75
21 21.1
2.1
21.2
29.7
Oil (Bbbls) Water (Bbbls) Gas (TCF)
2007 2012Bbbls = billion barrels
TCF = trillion cubic feet

3
(EOR) flooding processes. Polymer gels effectively block the offending high conductive
zones and provide a sustainable diversion of the subsequent injected water toward
unswept low permeability zones. Such remediation would mitigate water production and
enable recovery of bypassed oil reserves in a cost-effective way and thus extend the
productive life of mature oilfields. Normally, it is preferable to address the problem at its
source, which in the case of IOR/EOR floodings is the injection well. This would provide
more efficient conformance improvement treatments that last longer and impact a larger
portion of the reservoir (Lantz and Muniz, 2014).
Remarkably, the selection of a proper polymer gel technology for a given
reservoir is a challenging task for oilfield operators and reservoir engineers. This is
fundamentally due to the existence of numerous types of conformance problems that may
exist anywhere from the wellbore to deeply in the reservoir. Polymer gels also have a
wide range of forms and chemistries that function by different mechanisms to improve
the sweep efficiency of IOR/EOR processes. The selection process is further complicated
by the fact that the treatment of a specific conformance issue requires a distinct gel
technology. Furthermore, conformance problem properties are qualitatively evaluated
using several diagnosing techniques along with the traditional geological and reservoir
characterization. The subjective nature of this evaluation imposes an intuitive judgment
on the selection of gel technologies. Finally, despite the large number of implemented gel
field projects, there is an obvious shortage in the number and quality of screening studies
for polymer gels, especially the advanced screening models.

4
1.2. RESEARCH OBJECTIVE AND WORK SCOPE
This study aims to develop an integrated systematic methodology that determines
the applicability of injection well polymer gel technologies. Specifically, the main
objective of this study is to develop comprehensive, updated, improved applicability
guidelines for three gel systems based on their field applications in injection wells. This
objective includes the following three sub-objectives:
a. Recognition of how polymer gels should be identified and what are the influential
parameters in their selection process.
b. Establishment of conventional screening criteria using quantitative screening
parameters.
c. Development of a generalized selection system using qualitative matching
parameters.
d. Development of advanced screening models using a machine learning technique.
This study provides a better understanding of a gel technology selection process
and indicates the role of each step or parameter in this process. This would help reservoir
engineers in the identification of the most appropriate treating agent using a standardized
selection system and advanced screening models. The ability to rate conformance
problems and gel technologies would considerably reduce the role of the costly
diagnosing techniques of conformance problems. It will also assist field engineers in
identifying a combination of treating agents in the case of reservoirs that exhibit various
heterogeneity forms. In such situations, advanced screening models will help in ranking
of gel systems by means of a score factor. Finally, providing new insights about how

5
polymer gels should be identified and designed will be very beneficial in increasing gel
treatments success rate.
A specialized database was constructed using the data of gel field applications
published in the public domain, especially SPE papers and U.S. Department of Energy
reports. Based on a comprehensive review of conformance engineering considerations,
technical specifications of gel technologies, and reviewed case histories, the steps and
parameters of the gel identification process were inferred. Statistical techniques were
utilized to estimate missing data, detect potential outliers, and summarize the
conventional screening criteria. Comprehensive comparative analyses of matching
parameters were performed to classify conformance problems and to identify their
parameter validity limits for each gel system. Machine learning techniques were used to
impute missing data points and develop advanced screening models.
The above tasks and the study results were described and presented in detail in
three published conference papers:
1. In the first paper, features of polymer gels data were indicated and data problems
such as missing and outlier data points were treated using several methods and
approaches. Parameters that are necessary to be considered in order to develop an
integrated selection system for conformance technologies were identified. In
addition, 13 quantitative parameters and three production-related aspects were
utilized to establish complete traditional screening criteria. Furthermore,
screening parameters were compared for different gel technologies to detect
differences and their relative importance for each particular treating agent.
Finally, some dual-treating agent case histories were verified to demonstrate the

6
ability of new screening criteria to nominate the most suitable gel technologies for
multiple heterogeneity reservoirs.
2. In the second paper, reservoir and fluids characteristics, diagnosis indicators used
in the evaluation of drive-fluid channeling strength, and gel treatment operational
parameters were summarized. Then, problem zone volumes were estimated using
a design rule of thumb and the problem development status was indicated using
some production-related parameters. Comprehensive review was performed to
recognize the steps of the gel selection process and the most influential problem
characteristics. Finally, all characteristics of conformance problems were
compared for different gel systems to facilitate the classification of conformance
problems and the identification of distinct validity limits for each gel technology.
3. In the third paper, a comprehensive review of machine learning and pattern
recognition techniques was first conducted. The goal of this review was to
identify the most suitable supervised classification technique that can handle the
variety of parameters utilized in the rating of polymer gels. After data processing,
treatment of potential outliers, and imputation of missing values some variables
were categorized in order to treat data gaps within independent variables. The
most discriminating variables were distinguished using several techniques and
considerations. To consider the regional tendencies in the application of polymer
gels, three probabilistic models were developed that include different numbers of
gel technologies. Furthermore, to meet the new developments in the application of
some gel systems, a variant model without the treatment timing indicator (water
cut) was constructed for each main classifier. The accuracy of the constructed

7
classification models were checked using three global predictivity measures. A
prediction profiler was also used to visually monitor performances of the
classifiers, and certain tendencies were identified by the investigation of the
mispredicted projects.

8
2. LITERATURE REVIEW
This section reviews oilfield conformance problems, conformance improvement
techniques, polymer gel technologies, and principles of EOR technical screening. A
critical review of previous polymer gels applicability evaluation studies will also be
presented to highlight the current gaps and limitations in the literature.
2.1. OIL RECOVERY AND RESERVOIR CONFORMANCE
Petroleum reservoirs produce hydrocarbons by means of a wide variety of drive
mechanisms. They are generally categorized into three types or stages: primary,
secondary, and tertiary or enhanced oil recovery methods (EOR). For conventional oil
reservoirs, reservoir natural energy (reservoir pressure) significantly reduces after the
primary recovery as a result of oil and gas production. Therefore, several materials are
injected to supply reservoir energy, displace oil toward production wells, and create
favorable conditions for oil recovery in the case of EOR methods as shown in Figure 2.1.
It is usually referred to such injection processes with displacement objectives as oil
recovery flooding or process and to the injected materials as drive-fluids.
If these materials already existed in the reservoir such as water and natural gas,
the flooding process is termed as secondary recovery such as waterflooding. Otherwise, if
injected materials are not normally presented in the reservoir such as steam, polymer, and
CO2, they are termed as tertiary or EOR processes or floodings. Improved oil recovery
(IOR) is used to describe any practice or process that increases oil production or recovery
including secondary and EOR floodings (Sydansk and Romero-Zeron, 2011). It also

9
includes other well-operational techniques like hydraulic fracturing, horizontal wells, and
infill drilling.
Figure 2.1. Ideally Swept Pattern with Stable Displacement and Even Injection Profiles
For any secondary or tertiary recovery method, the overall recovery efficiency
(RF) is a product of two efficiency factors as given by the following generalized
expression (Ahmed, 2006):
𝑅𝐹 = 𝐸𝐷 ∗ 𝐸𝐼 (1)

10
Where ED is the microscopic displacement efficiency and EI is the volumetric sweep
efficiency of a flooding process. This formula indicates that to increase oil recovery from
an oil reservoir, it is necessary to improve either one of these efficiencies or both in a
cost-effective way.
The microscopic displacement efficiency (ED) is the fraction of the moveable oil
that has been displaced from the swept zone at any given time or pore volume of injected
fluids (Ahmed, 2006). This efficiency is affected by the presence of surface tension and
interfacial tension, capillary forces, and rock wettability. Thus, it can be improved by
injecting some materials that target the above rocks and fluids physical properties such as
surfactants, CO2, alkaline, and many other materials (Green and Willhite, 1998).
The volumetric sweep efficiency (EI) is the fraction or percent of the pattern pore
volume that is swept by the displacing fluid. It is also a combination of two components:
areal (EA) and vertical (EV) efficiencies. In the oil and gas industry, conformance is used
as a measure of the volumetric sweep efficiency of IOR/EOR floodings being conducted
in a reservoir (Sydansk and Romero-Zeron, 2011). Specifically, reservoir conformance is
a measure of the areal and vertical uniformity of the flood front as it is being propagated
through a reservoir (PetroWiki, 2016).
Some physical and geological reasons that are related to reservoir rocks and fluids
significantly impair the volumetric sweep efficiency of reservoir floodings. From an
IOR/EOR prospect, they cause non-uniform areal flood fronts and disproportionate
vertical injection profiles for drive-fluids during the flooding process as shown in Figure
2.2. Consequently, they result in early water breakthroughs, low oil recoveries, large
bypassed oil reserves in the unswept zones, and undesired excessive water production

11
and cycling. Generally, issues that negatively impact the sweep efficiency of flooding
processes are called conformance problems and technologies that are used to address
them are termed as conformance solutions or treatments. In addition, the physical and
geological reasons are called roots of conformance problems and include reservoir
heterogeneity and unfavorable mobility ratio. Conformance problems broadly encompass
any issue that causes the injection water (or any drive-fluid) to avoid the displacement of
oil and to directly compete with and impair oil production from a reservoir (Sydansk and
Romero-Zeron, 2011). Thus, it is interchangeably referred to conformance problems as
excess water production problems. Furthermore, the term conformance is also used to
indicate the treatment of or as a measure of excessive water production for petroleum
reservoirs.
Figure 2.2. Poorly Swept Pattern with Non-Uniform Flood Front and Injection Profiles

12
2.2. EXCESSIVE WATER PRODUCTION
When an oilfield with poor conformance reservoir enters the mature stage after a
certain time of flooding process, oil production significantly decreases and water reaches
its ultimate production rates. This occurs because water flows from injection wells
toward production wells in separate flow lines or pathways from oil due to the presence
of substantial conformance problems. This would result in poor sweep efficient for the
flooding process and large left-behind oil quantities in the unswept zones. As the
injection process continues, water injection would not help in recovering any additional
oil and produced water is either re-injected or disposed.
In this stage, many production wells are abandoned as they reach the economic
limit. In addition, oil production expenses are significantly increased due to the
associated lifting, handling, treatment, environmental-related, and disposal costs.
Therefore, excessive water production considerably hinders not only the technical
feasibility, but also the economic feasibility of IOR/EOR processes. In such cases, the
mitigation of water production by improving the sweep efficiency of IOR/EOR floodings
would greatly help in increasing oil production, recovery of bypassed oil reserves, and
extend the productive life of mature oilfields. In addition, it would reduce oil production
expenses and environmental liabilities.
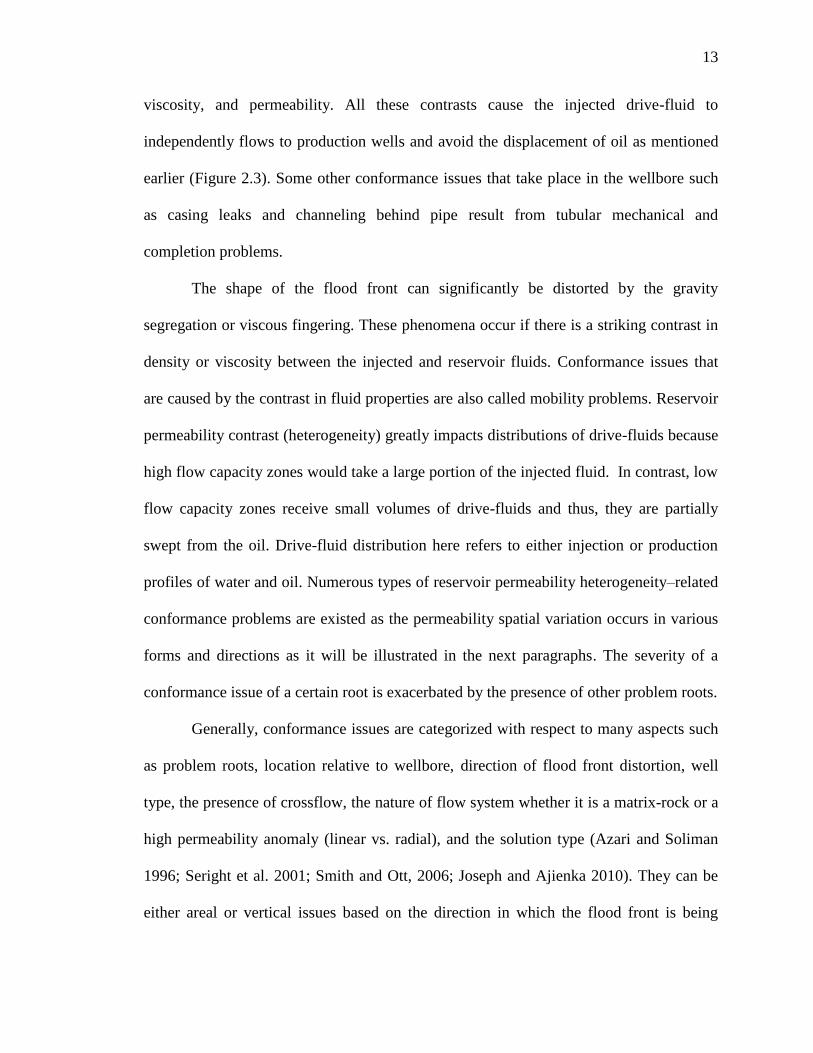
2.3. CONFORMANCE PROBLEM TYPES
Undesired water production is caused by a broad range of conformance issues that
have different roots and forms or configurations. The roots of most conformance
problems are principally the contrasts in three reservoir rock and fluid properties: density,
13
viscosity, and permeability. All these contrasts cause the injected drive-fluid to
independently flows to production wells and avoid the displacement of oil as mentioned
earlier (Figure 2.3). Some other conformance issues that take place in the wellbore such
as casing leaks and channeling behind pipe result from tubular mechanical and
completion problems.
The shape of the flood front can significantly be distorted by the gravity
segregation or viscous fingering. These phenomena occur if there is a striking contrast in
density or viscosity between the injected and reservoir fluids. Conformance issues that
are caused by the contrast in fluid properties are also called mobility problems. Reservoir
permeability contrast (heterogeneity) greatly impacts distributions of drive-fluids because
high flow capacity zones would take a large portion of the injected fluid. In contrast, low
flow capacity zones receive small volumes of drive-fluids and thus, they are partially
swept from the oil. Drive-fluid distribution here refers to either injection or production
profiles of water and oil. Numerous types of reservoir permeability heterogeneity–related
conformance problems are existed as the permeability spatial variation occurs in various
forms and directions as it will be illustrated in the next paragraphs. The severity of a
conformance issue of a certain root is exacerbated by the presence of other problem roots.
Generally, conformance issues are categorized with respect to many aspects such
as problem roots, location relative to wellbore, direction of flood front distortion, well
type, the presence of crossflow, the nature of flow system whether it is a matrix-rock or a
high permeability anomaly (linear vs. radial), and the solution type (Azari and Soliman
1996; Seright et al. 2001; Smith and Ott, 2006; Joseph and Ajienka 2010). They can be
either areal or vertical issues based on the direction in which the flood front is being

14
distorted (Figure 2.4). In addition, they are classified as wellbore, near-wellbore, and far-
wellbore problems according to where they affect flow profiles or where they can be
controlled as it will be illustrated later.
In the following sections, typical oilfield conformance issues will be presented
and briefly discussed. They are ordered in terms of their effect location and treatment
difficulty using currently available conformance improvement technologies that will be
presented later (Seright et al. 2001; Sydansk and Romero-Zeron, 2011; Bai, 2014).
Figure 2.3. Conformance Problems Roots and Examples

15
Figure 2.4. Vertical and Areal Conformance Problems (Sydansk and Romero-Zeron,
2011)
2.3.1. Wellbore Problems. As their names imply, these conformance issues exist
in wellbores of production wells and represent vertical conformance problems. They
result usually from tubular mechanical and completion problems. Generally, this type of
conformance problem includes the following two issues.
2.3.1.1. Water channeling behind pipe. Figure 2.5 (a) illustrates that the
unwanted water is flowing into the wellbore through a channel exists between wellbore
casing and the sand face of a water-bearing layer. The root of this conformance issue is
totally related to the quantity and quality of the placed cement behind the casing against
the water zones. Field experience shows that this issue can easily be treated using
polymer gel or cement squeeze depending on whether the flow aperture is less or greater
than 1 mm.

16
Figure 2.5. Wellbore and Near-Wellbore Conformance Problems (Sydansk and Romero-
Zero, 2011)
2.3.1.2. Casing leaks. In this case, corrosion or thread failures in the wellbore
casing body or coupling joints provide a pathway for water to flow from one layer into
the wellbore (Figure 2.5 (b)). Practically, this issue is challenging to be successfully

17
treated despite the variety of conformance solutions that can be applied such as tubing
patches, straddle packers, polymer gels, resins, and cement squeeze.
2.3.2. Near-Wellbore Problems. This type of conformance issue includes four
vertical problems that are treated in the near-wellbore region if possible.
2.3.2.1. High-permeability matrix-rock strata without crossflow. This issue
represents a vertical conformance problem in which the undesired water flows in a
separate high permeability matrix-rock strata or zones that are not in pressure
communication with oil zones (Figure 2.5 (c)). This refers to the presence of a continuous
impermeable shale barrier between water and oil zones that have substantial permeability
contrast. This problem is considered easy to be treated, and there is a wide range of
conformance solutions that can be applied such as well completion techniques,
mechanical techniques, and permeability-reducing agents.
2.3.2.2. Water coning through fractures. The presence of vertical fractures or
other high permeability anomalies in the near-wellbore region causes the water to cone
up the wellbore from an aquifer (Figure 2.5 (d)). Similarly, these permeability
heterogeneities can cause the gas to cone down the wellbore form a gas cap. Polymer gels
have been easily and successfully applied to treat fracture-type water coning and the
effectiveness of gel treatment greatly increases with increasing injected gel volumes.
2.3.2.3. Water coning through matrix rock. The configuration of this problem
is similar to the previous coning issue as shown in Figure 2.5 (e). The difference here is
that water flows from an underlying aquifer into a vertical well wellbore through a
matrix-rock reservoir. High fluid flow rates and substantial pressure drops in this region
considerably accelerate the problem occurrence rate. It has been provided that it is

18
difficult, if not impossible, to implement a long-term solution for this type of coning
problem (Sydansk and Romero-Zeron, 2011). The difficulty arises from the need to place
a disk-shaped permeability barrier radially away from the wellbore, which practically is
difficult to be performed especially using the injectable chemical conformance agents.
2.3.2.4. Water cusping through matrix rock. When water or gas flows through
an inclined matrix-rock reservoir strata (Figure 2.3), water and gas coning issues are
called cusping conformance problems. They are also difficult to treat that long-term
remedies are obtained and polymer gel treatments have a low probability of success if
applied. Seright (1988) provided that hydrocarbon productive zones must be protected
during gelant placement.
2.3.3. Far-Wellbore Problems. These issues are also called reservoir-related
conformance problems because they influence fluid flow pathways in a large portion of
or the whole reservoir extent.
2.3.3.1. Mobility-induced viscous fingering. This fluid mobility-related issue
represents an areal conformance problem that occurs when the drive-fluid displaces a
relatively high viscosity oil. In this situation, viscous fingering is triggered by the
considerable viscosity or mobility contrast exists between injected and reservoir fluids, as
shown in Figure 2.3 and Figure 2.6 (a). Mobility–induced viscous fingering problems are
usually aggravated by the permeability variation in heterogeneous reservoirs. They also
may occur in the vertical direction in the cases of bottom water drive and gas cap
expansion. The typical technology that has been extensively applied to overcome
mobility issues is the polymer flooding. In this EOR process, different types of polymer

19
are used for the purpose of increasing the viscosity of drive-fluid and thus, improving
mobility ratio.
Figure 2.6. Far-Wellbore Reservoir Conformance Problems (Sydansk and Romero-Zero,
2011)

20
2.3.3.2. Fracture channeling. Probably, this issue is the most encountered
conformance problem in oil and gas fields. It takes place when the drive-fluid flows in
natural, induced, and hydraulic fractures and its severity greatly depends on fracture
intensity and orientation (Figure 2.4 and Figure 2.6 (b)). This areal problem has been
successfully and economically treated using polymer gels; however, treatment volumes in
the range of several thousand barrels are required.
2.3.3.3. Solution channels and interconnected vuggy porosity. An areal and/or
vertical conformance problem that usually presents in carbonate reservoirs (Figure 2.6
(c)). The root of problem is either the interconnected vuggy porosity or solution channels
that are created during IOR/EOR floodings especially CO2 floodings. Both solution
channels and interconnected vuggy channels tend to have large diameters (0.5 mm).
However, connected vugs represent a large volume problem that usually treated by foam-
based technologies. As for fracture channeling, these issues are good candidates for
polymer gels; however, they cause extremely severe channeling when they are
exceptionally large volumes.
2.3.3.4. High-permeability matrix-rock strata with crossflow. The task of
reducing water production from heterogeneous multilayered matrix-rock reservoirs would
be further complicated by the presence of vertical pressure communication and fluid
crossflow (Figure 2.6 (d)). The solution of this vertical problem requires the application
of conformance technologies that can affect a large portion of the reservoir. Normally,
such remedies involve injection of large volumes of treating agents such as polymer or
in-depth-fluid diversion technologies (IFD) such as microgels. It has been provided that

21
the required treatment volumes and placement technique make this problem difficult to
remedy.
2.3.3.5. High-permeability matrix-rock directional trends. As shown in Figure
2.6 (e), an areally limited flood front is formed when there is a directional high matrix-
rock permeability trend in the pattern or reservoir. If the wells are already in place,
polymer flooding and IFD technologies are recommended if they can be deeply and
selectively placed in the reservoir. Otherwise, areal realignment of wells and utilization
of horizontal wells and advanced wellbore are more reliable to reduce water production.
2.3.3.6. Water production from a single layer. The production of water from a
single oil-producing zone is considered the hardest conformance problem to be treated
using currently available conformance improvement technologies (Bai, 2014). Any
solution proposed for this problem must be perfectly selective in the remediation. This
implies that the solution should be able to reduce water production and improve oil
production or at least keep it unchanged. Certain polymers and weak gel systems have
been found to reduce the relative permeability to water more than to oil and gas and thus,
they have the required treatment selectivity feature. Such conformance systems are
termed relative-permeability-modification (RPM) treatments and have been applied to
production wells of matrix-rock reservoirs. Although these conformance chemicals seem
to be a potential solution for this problem, Sydansk and Seright (2007) have provided that
it is not recommended that RPM treatments applied in such situations. They attributed
that to the reduction that might result in oil production after water saturation increases
behind the placed treatment materials, as shown in Figure 2.7.

22
Figure 2.7. RPM Treatment of a Single Formation (Sydansk and Seright, 2006)
2.4. DIAGNOSIS OF CONFORMANCE PROBLEMS
The precise identification and characterization of conformance problems represent
the first and most critical step in performing a successful water control remediation
(Soliman et al. 2000; Seright et al. 2001; Reynolds and Kiker, 2003; Smith and Ott, 2006;
Jaripatke and Dalrymple, 2010). Conformance Problem assessments are not essential
only for selecting a proper treating technology, but also for the designing and
implementing of conformance improvement treatments. The necessity of the sound
understanding of a water production problem is emphasized by the fact that each
conformance problem requires certain conformance improvement technologies. Field
evaluations of conformance problems mainly concentrated on the identification of the
water source and the characterization of the problem severity and extent.
A number of excellent references have addressed conformance issue diagnostic
evaluations and techniques (Azari and Soliman, 1996; Pappas et al. 1996; Love et al.
1998; Seright et al. 2001; Smith and Ott, 2006; Jaripatke and Dalrymple, 2010; Sydansk
and Romero-Zeron, 2011; Kim and Crespo, 2013).

23
The diagnosis of conformance problems often starts by the review of geological
and reservoir characterization information. In this stage, it is essential to indicate whether
a conformance problem is caused by spatial permeability heterogeneity or unfavorable
mobility ratio in the case of IOR/EOR floodings. Secondly, the following key
information sources are reviewed to recognize the nature (type) and severity of the water
production problem (Jaripatke and Dalrymple, 2010):
Reservoir characterization data
Permeability profile and core analysis data
Previous well logging analyses
Injection history and injection profiles
Production history and tests
Recent survey results
Well completion and integrity data
The above information sources are reviewed in a complementary way to
specifically make the following key distinctions (Chou et al. 1994; Sydansk and
Southwell, 2000; Seright et al. 2001):
Is the water production issue an areal or vertical conformance problem?
Is the water production issue a wellbore, near-wellbore, or reservoir related
problem?
Does the water issue involve matrix-rock or high-permeability anomaly? In other
words, is the fluid flow pattern around the wellbore linear or radial?
Does the water production issue involve pressure communication and vertical
fluid crossflow?

24
Several diagnosing techniques are used to evaluate conformance problems that
generally have different functions and objectives. Seright et al. (2001) have provided that
there are probably 30 different diagnosing methods that should be integrated for a correct
characterization of a conformance problem. Table 2.1 briefly reviews the most common
diagnostic methods and technologies for conformance problems. It is important to
mention that despite the extreme importance of the water problem diagnosis,
conformance issues are still qualitatively characterized in most situations, as will be
illustrated in the second paper. In addition, the geological complexity and reservoir
interferences continue to call for more robust diagnosing techniques and procedures.
In the following subsections, production plots and data analysis methods that used
to evaluate conformance issues are discussed in more details:
2.4.1. Chan Graphical Method. Chan (1995) proposed an easy and inexpensive
diagnosis method that can differentiate whether the water production issue is a coning or
a channeling problem. Chan illustrated based on the numerical simulation that different
water production mechanisms have different characteristic trends for the WOR or its
derivative with time on a log-log plot. This means that the method is based on the
graphical comparison of the behavior of WOR after breakthrough for both types of
conformance problems as shown in Figure 2.8. Several studies and diagnosis plots were
later developed based on the same principles of Chan’s method (Bondar and Balsingame,
2002; Yang and Ershaghi, 2005). Although this method continues to be used in the
diagnosis of production wells (Stanley et al. 1996; Mahgoup and Khair, 2015), Seright
(1997) demonstrated through the numerical simulation that multilayer channeling
problems can easily be mistaken as bottom-water coning, and vice versa.

25
Table 2.1. Summary of Conformance Problem Diagnostic Techniques and Methods
(After Sydansk and Romero-Zeron, 2011)
Diagnostic
Method Evaluation Techniques Information obtained
Well Testing
Methods
Vertical Interference “Tests”
Pulse tests
Formation testers
Multiple-well testing
Pressure-transient analyses
Reservoir properties, horizontal and
vertical permeability, crossflow
between strata
Information on reservoir nonidealities
that should be analyzed in
conjunction with geological data;
detection and characterization of
fractures (volume, permeability,
spacing between fractures,
orientation)
Proper reservoir description with
regard to static and dynamic
properties
Interwell Tracer
Tests
Tracer Surveys
Radioisotopes
Fluorescent dyes
Water-soluble alcohols
Water-soluble salts
Indicate directional flow trends
Identify rapid interwell
communication and reservoir
continuity
Estimate volumetric sweep
Delineate flow barriers
Compare flow and sweep patterns
Characterization of fractured
reservoirs: location and direction of
fracture channels, fracture volume,
fracture conductivity
Estimate the effectiveness of
remedial treatments
Well Logging
Tools
Logging Tool Services
Openhole logs: caliper, gamma,
spontaneous potential (SP), and
magnetic-resonance imaging (MRI)
Cement-evaluation logs: cement
bond logging (CBL) and ultrasonic
bond logs
Casing-evaluation logs: multiarm
caliper tool, casing-inspection tool
(CIT), flux-leakage/eddy –current
(FL/EC) tool, circumferential
acoustic scanning tool (CAST), and
pulse-echo tool (PET)
Pulsed-neutron logs
Production logs: fluid-density tool,
hydro tool, spinner tool, pressure
tool, and temperature tool
Seismic methods
Porosity, permeability, irreducible
water saturation, fluid quantification
(oil, water, and gas), water-cut
prediction by integrating MRI log
with resistivity logs. Reservoir
heterogeneities. Identification of
fractures or fracture-like features
Current condition of the cement
annulus and diagnosis of potential
fluid-flow paths
Integrity of the casing
Detection of channels outside the
casing, leaking tubular, and water
production
Crossflow between strata
Water influx, rate, and direction of
flow

26
Table 2.1. Summary of Conformance Problem Diagnostic Techniques and Methods
(After Sydansk and Romero-Zeron, 2011) (Cont’d)
Real-Time
Downhole
Video Services
Downhole high resolution cameras
that have the ability to work in
extremely low-light environments.
Identify wellbore problems, fluid
turbulence, and flow direction. This
information is useful to establish fluid
migrations through the wellbore and
into “thief” formations. Similarly, it
allows planning reservoir and well
treatments while in progress and
confirms post-treatment well
conditions
Reservoir
Monitoring
Analysis of production data
(recovery factors, WORs) assisted
by diagnostic plots to validate the
quality of the production data
(Anderson et al. 2006); examination
of well production profile (Lane
and Sanders 1995)
Analysis of well history ( e.g.,
recompletions, well stimulation,
major workovers) (Anderson et al.
2006)
Integration of reservoir description
and reservoir simulation with
multiple-reflection seismic surveys
Monitoring of current movement of
fluid saturations in a reservoir and
prediction of future fluid-saturations
movement, which provide vital
information for delaying or
preventing an early water or gas
breakthrough.
Data
Analysis
Methods
Chan graphical method
Seright et al. method
Interwell communication analysis
Pressure index technique (PI)
Well zoning procedures
Distinguish coning from channeling
problems
Determine fluid flow around the
wellbore whether it is linear or radial
Estimation of drive-fluid channeling
strength
Ranking of offending injectors based
on interwell connectivity
Reservoir
Simulation
Studies
3D, three-phase, four-component,
pseudo-compositional, and non-
isothermal coupled
reservoir/wellbore simulators
Identification and understanding of
the conformance problem
Prediction of the effect of
conformance-improvement treatments
on reservoir performance
Prediction of maximum water-free
production rates
Estimation of breakthrough time,
water-cut performance, and/or
economic production rate

27
Figure 2.8. Chan Diagnostic Plots for Conformance Problems (Chan, 1995)
Multilayer Channeling

28
Figure 2.8. Chan Diagnostic Plots for Conformance Problems (Chan, 1995) (Cont’d)
Therefore, it has been recommended that WOR diagnostic plots should not be used alone
to identify an excessive water production mechanism.
2.4.2. Seright Et Al. Method. As an indication for the drive-fluid channeling
strength, Seright et al. (2001) have illustrated that a key aspect in the diagnosing of
conformance problems is deciding whether fluid flow around the wellbore is radial or
linear. Consequently, they proposed a simple and inexpensive diagnostic method that can
determine the type of flow in a well. It is based on injectivity or productivity calculations
using Darcy equation for radial flow as shown in the following equations:
𝑞
∆𝑝≫ ∑
𝑘ℎ
141.2𝜇ln (𝑟𝑒𝑟𝑤
) (2)
𝑞
∆𝑝≤ ∑
𝑘ℎ
141.2𝜇ln (𝑟𝑒𝑟𝑤
) (3)
Bottom-Water Coning

29
They provided that if the actual injectivity for an injector is five or more times
greater than the calculated injectivity using the Darcy equation for radial flow, the issue
is linear flow problem. Alternatively, if the actual injectivity is less than or equal to
Darcy equation estimation, the flow pattern is more likely to be radial. They also
emphasized that in the practical application, uncertainty is the main reason that the above
equations do not satisfy other field observations about the type of flow pattern.
2.4.3. Interwell Communication Analysis. In an effort to characterize the drive-
fluid channeling strength in a systematic accurate manner, several analysis techniques
have been used to identify flow channeling relationship using injection and production
data. In a simplistic form, the analysis techniques try to correlate the changes in rates or
pressures at the producer with water injection rates or pressures (Love et al. 1998; Baker
et al. 2012). In these methodologies, the interwell connectivity is frequently represented
by correlation factors or weighting coefficients that ranging between 0 and 1.0.
For example, if water production rate strongly follows water injection rate, then
there is a strong channeling between the injector and producer as shown in Figure 2.9.
Based on these measures of interwell connectivity, communication maps are generated to
facilitate the ranking of injector-producer pairs as shown in Figure 2.10. Examples for
these methods are Spearman Rank Correlation (Heffer et al. 1997), Multivariate Linear
Regression (Albertoni and Lake, 2003), and Capacitance-Resistive Model (Yousef et al.
2005). Most recently, Yin et al. (2015) proposed a technique to estimate interwell
connectivity by correlating 4D seismic surveys and production data or tracer test data. It
is important to mention that these techniques and especially the Capacitance-Resistive

30
Model are receiving more attention in field application of conformance improvement
technologies (Baker et al. 2014).
2.4.4. Pressure Index Technique. In this method, a 90 minutes falloff tests are
performed for the suspected injection wells as shown in Figure 2.11 (Liu et al. 2006 and
2010). The pressure index (PI) is then calculated for each individual injector from the
real-time recoded wellhead pressures using the following equation:
𝑃𝐼 =∫ 𝑝(𝑡)
𝑇0
𝑇 (4)
Lower PIs are usually estimated for the offending injection wells than other
injectors in the field because higher pressure drawdown rates result from strong
channeling strengths in these well patters. Injectors with PIs less than the average field-
wide pressure index are considered as candidates for conformance improvement
treatments. While this technique provides a relative or field-specific measure of interwell
connectivity, it is mainly used to select well candidates for conformance improvement
treatments.
2.4.5. Well Zoning Procedures. In history case studies, the well zoning refers to
the nomination process of a well or well pattern from the many wells in a field for the
application of a specific conformance improvement technology based on the functionality
requirements of the desired technology. In this context, quantitative selection criteria are
used to identify well candidates for conformance improvement technologies. These
criteria enabled the identification and ranking of injectors and producers for the
conformance remediation based on the degree of interwell connectivity. Well zoning
parameters generally include the injection and production parameters such as water
injectivity, water entry percent, PI technique, and communication analysis.

31
Figure 2.9. Trends of Water Flow Rates for a Strong Channeling Problem (Baker et al.
2012)
Figure 2.10. Interwell Communication Map (Baker Hughes SweepScanTM
, 2012)
Time
Strong Communication
Water Injection Rate
Water Production Rate
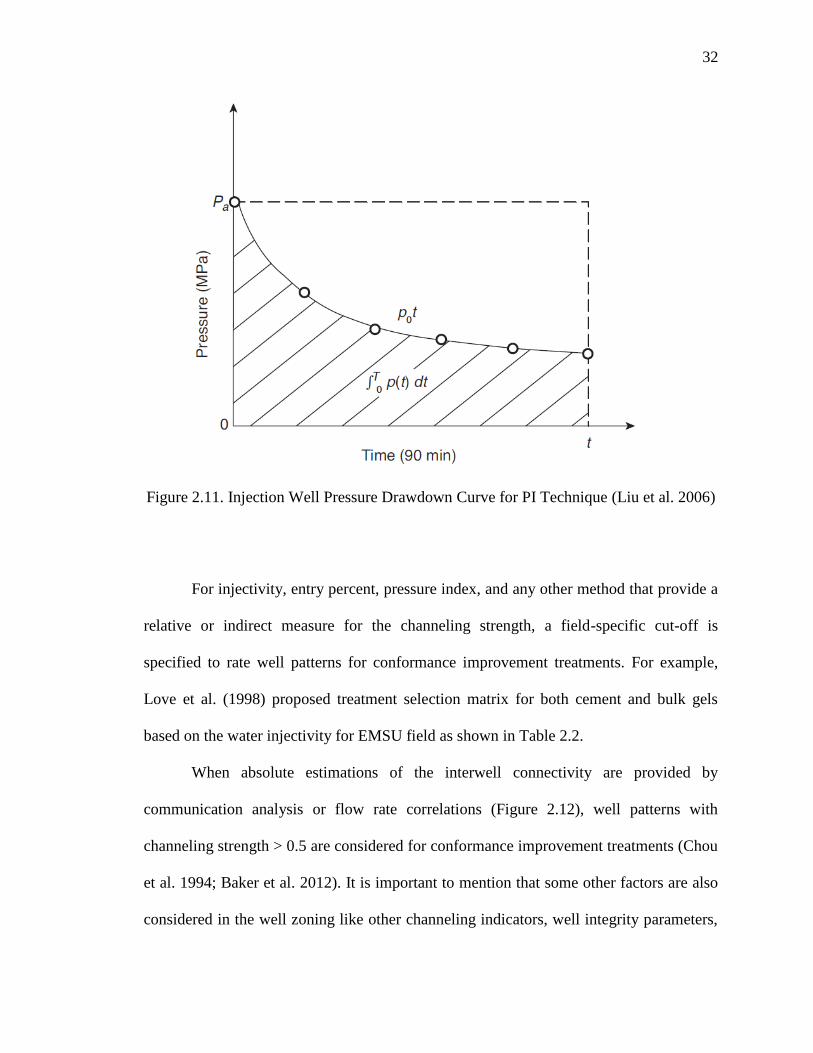
32
Figure 2.11. Injection Well Pressure Drawdown Curve for PI Technique (Liu et al. 2006)
For injectivity, entry percent, pressure index, and any other method that provide a
relative or indirect measure for the channeling strength, a field-specific cut-off is
specified to rate well patterns for conformance improvement treatments. For example,
Love et al. (1998) proposed treatment selection matrix for both cement and bulk gels
based on the water injectivity for EMSU field as shown in Table 2.2.
When absolute estimations of the interwell connectivity are provided by
communication analysis or flow rate correlations (Figure 2.12), well patterns with
channeling strength > 0.5 are considered for conformance improvement treatments (Chou
et al. 1994; Baker et al. 2012). It is important to mention that some other factors are also
considered in the well zoning like other channeling indicators, well integrity parameters,

33
selective injection installations, and injection and production facilities. An example for
the ranking of candidate injection wells in the Cerro Dragon filed for the thermally
activated particle technology (BrightWater®) is shown in Table 2.3 (Mustoni et al. 2012).
Table 2.2. EMSU Field Treatment Selection Matrix (Love et al. 1998)
Water Injectivity Cement Squeeze Bulk Gels
bpm psi With expanding
agent
Foamed
with N2
Intermediate
MW
High
MW
1 600-900 X
2 300-600 X X
3 100-300 X X
4 0-100 X X
5 0 X X
2.5. CONFORMANCE IMPROVEMENT TECHNOLOGIES
Numerous conformance improvement technologies are available to enhance
sweeping efficiency of IOR/EOR floodings and to mitigate water production in
conventional oil reservoirs. Generally, conformance solutions are classified into
conformance agents and conformance operations or practices as shown in Table 2.4
(Seright et al. 2001). The first category includes all chemical and physical materials that
are used as injectable plugging agents like polymer flooding, polymer gels, cement, and
resins. The term chemical conformance technology is frequently used to describe most of
these agents except cement and other solid materials. The second group includes

34
operational mechanical and well techniques such as packers, bridges, infilling drilling
and well abandonment.
Table 2.3. Ranking of Potential Well Candidate for BW Technology (Mustoni et al.
2012)
Factor Favorable Characteristics
for BW
Candidate Waterflood Well Patterns
CG-
IIIW
CD-
III ZII/VI O1A CGI
MC
III
Water oil ratio High and rapid increase 3 3 3 3 3 2
Evidence of
channeling
Variable production response to
water injection. high permeability
contrast
3 3 3 3 3 3
Injector-Producer
Transit Times > 30 days and <150 days See Tracer Time Tests
Downhole
installations Mechanically sound 2 3 2 2 2 1
Artificial lift
system flexibility Ability to adjust production rates 1 2 2 3 2 3
Stability of the
pattern operation
Six months without operational
changes 3 3 3 3 3 2
Geological model
understanding
Well defined model and well
correlation 3 3 3 3 3 2
Areal sweep
potential
Good areal connectivity with few
sealing faults 3 3 3 3 3 2
Scaling feasibility Relative high oil production and
large OIP target 3 3 3 3 3 3
Injection facilities
Flexibility to handle injection rate
changes. Stable water quality and
reliable monitoring and control
systems
3 2 3 1 2 2
Production
facilities
Capacity to test producers
monthly 3 3 3 3 3 3
Operational
history
Well documented production
history 3 2 2 3 2 2
Number of “3’s” 9 8 8 8 7 4
Sum 30 30 30 29 29 25

35
Table 2.4. Conformance Improvement Materials and Techniques (Seright et al. 2001)
Conformance Agents Conformance Operations
Foam, emulsion, particulates,
precipitates, microorganisms Packers, bridge plugs, patches
Polymer/mobility-control floods Well abandonment
Polymer gels Infill drilling
Resins Pattern flow control
Cement, sand, calcium carbonate Horizontal wells, advanced wellbores
Figure 2.12. Communication Map Used for Well Zoning (Kashirsagar, 2014)
Good Gel Treatment
Candidate
36
Conformance solutions are also categorized based on the objective of the
application of a conformance improvement technology. Technologies that try to
overcome some of the viscosity and density differences between the injected and
reservoir fluids are termed as mobility control. In this sense, mobility related
conformance issues are addressed by increasing the viscosity of the drive-fluid or by
some operational practices like water-alternating-gas process (WAG).
Secondly, technologies that improve injection and/or production profiles are
described as conformance control (Azari and Soliman, 1996). These technologies
enhance fluid flow profiles by correcting the reservoir permeability heterogeneity using
plugging agents, stimulation techniques, or by mechanical and well techniques. It is
important to mention that conformance control includes any technology that addresses
any type of heterogeneity in the oil and gas reservoirs. This means that mobility control is
just one type of conformance control; however, in literatures conformance control has
been connected to the remediation of permeability-related issues.
In short, conformance applications are either mobility control or conformance
control. In addition, they are either increase viscosity of the drive-fluid, reduce
permeability of high permeability zones, or increase permeability of low permeability
zones. A summary of the most common conformance improvement technologies is
presented in Table 2.5.
Matching a conformance issue to a conformance improvement technology
represents the most important step in the water management project (Sydansk and
Southwell, 2001, Seright et al. 2001, Kabir, 2001). This is mainly because that each
conformance improvement technology correctly functions for only a certain types of

37
conformance issues (Seright et al. 2001). Therefore, it is essential that a conformance
problem is correctly characterized to select the best suited conformance improvement
technology.
The incremental oil production and decremental water production represent the
major outcomes of conformance improvement applications with respect to the technical
prospect. The economic feasibility of IOR/EOR floodings would be improved by the
associated additional revenues from oil production and operating expense savings result
from water production reduction. The benefits of the application of conformance
improvement technologies are of extreme importance for the mature oilfields as they
extend their productive lives and reduce their environmental liabilities. In the next
section, polymer gels will be reviewed in details as they are the focus of this study.
2.6. GEL AND POLYMER GEL CONFORMANCE TECHNOLOGIES
Gels are elastic semi-solid materials that are basically used to reduce
permeabilities of the high flow capacity zones in the conventional oil reservoirs. Oilfield
gels have several chemistries, forms, mechanisms, and even additional objectives other
than permeability reduction as it will be illustrated later. Therefore, among the chemical
conformance improvement technologies, gel technologies have been proven to be an
effective solution for a wide spectrum of conformance issues. As seen in Section 2.3 and
will be further elaborated in Section 2.10, oilfield gels are applied to treat wellbore, near-
wellbore, and far-wellbore problems when they match the requirements of these
conformance issues.

38
Table 2.5. Representative Types of conformance Improvement Technologies (Sydansk
and Romero-Zeron, 2011)
Cement (Portland)
Squeeze cementing
Foamed cement
Microfine cement
Grey-water cement solutions
Cement containing specialty chemicals
Flooding with viscous fluids
Polymer flooding
Permeability-reducing treatments
Gels
Inorganic-based bulk gels
o Silicate gels
Organic-based polymer bulk gels
o Polymers
- Synthetic
- Biopolymers
o Crosslinking agents
- Inorganic
- Organic
Organic-monomer-based in-situ-polymerized gels
Preformed polymer-gel particles
o Microgel particles
o Delayed-swelling microgel particles
o Colloidal dispersion gels
o Preformed swelling gel particles
Resins
Specialty polymers alone for relative-permeability-modification
(RPM)
Foams and foam flooding Conventional foams
Polymer-enhanced foams
Foamed gels
Particulates

39
Table 2.5. Representative Types of conformance Improvement Technologies (Sydansk
and Romero-Zeron, 2011) (Cont’d)
Mechanical wellbore methods
Packers and bridge plugs
Straddle packers
Sliding sleeves
Tubing patches
Sand-back plugs
Wellbore drilling and completion methods
Selective completion and selective perforating
Use of horizontal and multilateral wellbores
Use of intelligent wells and well completions
Use of wells that can be selectively “snaked” through the reservoir
Well locating
Strategic and optimum areal placement of vertical wells
Strategic well pattern selection and placement
Strategic and optimum placement vertically and directionally of
horizontal wells
Infill drilling
Well abandonment and selective shut-ins
Pattern balancing, well realignment, and shut-ins
Comprehensive reservoir description
Increasing the permeability of low-permeability flow paths
Acidizing
Selective hydraulic fracturing
Deep perforating
Oilfield gels are generally classified based on their chemical compositions into
inorganic bulk gels and organic polymer gels as shown in Table 2.6. Inorganic gel
systems are formed by the polymerization and condensation of sodium or aluminum
silicates. Gelation process of silicates starts when the pH of the solution is reduced or

40
increased using some acids like HCL and H2SO4 (Krumrine and Boyce, 1985; Iler, 1979;
Lakatos et al. 1999; Stavland et al. 2011).
Polymer gels are formed by the chemical crosslinking of an aqueous water-
soluble polymer solution using a crosslinking agent. Polymer gels also involve several
forms and chemistries as many polymers and crosslinking agents have been used in their
formulations as shown in Table 2.6. They are classified according to their ingredients,
where the gelation process occurs, and the resulting gel structure. Synthetic
polyacrylamide-based gels are the most widely applied chemical conformance-
improvement system (Sydansk and Romero-Zeron, 201; Lantz and Muniz, 2014).
Polyacrylamides can be either organically (OCAP) or metallically (MCAP) crosslinked
depending on type of the crosslinking agent used to form the gel system.
Traditionally, polymer gels have been injected as a watery gelant solution
consisted of polymer, crosslinking agent, and additives that forms a semi-solid 3D
network structure in the reservoir as shown in Figure 2.13. These systems are called in-
situ gel technologies and they are the focus of this study. In this study, three partially
hydrolyzed polyacrylamide, in-situ gelling conformance systems are considered for
screening purposes. Alternatively, polymer gels can be formed at the surface facilities
and then injected into a reservoir as preformed particles gels (PPG) as shown in Figure
2.14 (Bai et al. 2007; Bai et al. 2008). Preformed particle gels overcome some of the in-
situ gelation process drawbacks that greatly affect gelation time, gel strength, and gel
placement. When polymers are crosslinked in the reservoir, reaction kinetics is affected
by the shear rates that polymers experienced when flow through the wellbore into the
reservoir. Changes in gelant ingredients amount are very likely due to rock adsorption,

41
Table 2.6. Oilfield Conformance Improvement Gel Technologies (Sydansk and Romero-
Zeron, 2011)
Inorganic Bulk Gels
Silicate gels
Aluminum-based gels
Organic Polymer Gels
Bulk gels
o Synthetic or biopolymers
Acrylamide polymers (most widely used polymer)
Xanthan biopolymer
o Organic crosslinkers
Aldehydes
Phenol-formaldehyde and derivatives
Polyethyleneimine
o Inorganic crosslinkers
Al(III) based
Zr(IV) based
Cr based
Cr(VI) redox
Cr(III) with inorganic anions
Cr(III) with organic carboxylate complex ions
Monomer gels (organic-monomer-based in-situ polymerization)
o Acrylamide monomer
o Acrylate monomer
o Phenolics
Lignosulfonate gels
Preformed particle gels
o Swelling organic-polymer “macroparticle” gels
Mixed silicate and acrylamide-polymer gels
Microgels
o Microgels with narrow particle-size distribution
o CDGs
Aluminum-citrate crosslinked
Chromic-triacetate crosslinked
o Delayed “popping”/swelling microgels (BrightWaterTM
)

42
Figure 2.13. Form and Structure of Bulk Gels (Zhao et al. 2013)
Figure 2.14. Dry and Swollen Preformed Gel Particles (Imqam et al. 2016)
reactions with minerals, and dilution by formation water. Extensive comparisons of
preformed particle gels and in-situ gels can be found in the work of Liu et al. (2006).
In a gel treatment, polymer gels are injected to effectively penetrate the offending
high conductive zones deep into the reservoir to block them off and provide a sustainable
diversion of the subsequent injected water toward unswept, low permeability zones as
shown in Figure 2.15. Such remediation would mitigate water production and enable
recovery of bypassed oil reserves in cost-effective way and thus, extend the productive

43
life of mature oilfields. Polymer gels can be applied to treat either production or injection
wells; however, it is always preferable to treat injection wells as it less risky and the
desire to address the water source in the IOR/EOR flood processes.
2.6.1. Bulk Gels. Bulk gels (BGs) are probably the most widely applied polymer
gel system for conformance improvement purposes (Sydansk and Southwell, 2000; Lantz
and Muniz, 2014). These gels can be formed using high molecular weight (8-13 million
daltons) partially hydrolyzed polyacrylamides with a crosslinker. The high polymer
concentrations result in a continuous semi-solid 3D network structure for the gel. Bulk
gels provide a wide range of strengths and a wide range of controllable gelation times;
thus, they can be applied to injection or production wells for profile control or water shut-
off purposes.
Figure 2.15. Illustration of Gel Treatment Function and Objective
Oil
Water
Water
Low permeability
High permeability
Oil
Water
Water
Gel

44
This gel system has two versions depending on the type of crosslinking agent. For
MARCITSM
gels developed by Marathon Oil Company, polyacrylamide polymers are
crosslinked using a trivalent metal ion which is usually Chromium (III) (Sydansk and
Smith, 1988). Chromium (III)-Carboxylate/Acrylamide-Polymer (CC/AP) gels are
characterized by having robust gel chemistry in water with a wide range of water
salinities, being highly insensitive to reservoir interferences. They are also resistance to
CO2 and H2S, easy to implement in field, and cost competiveness (Southwell, 1999).
CC/AP gels are applicable over a broad reservoir temperature range; however, extensive
laboratory and field cases confirmed that they should be used in a formation temperature
of less than 220°F (Sydansk and Southwell 2000). For high temperature applications,
medium molecular weight polyacrylamide polymers are crosslinked with an organic
agent and a stabilizer to delay the gelation process. In this study, these gels are depicted
as organically-crosslinked-polyacrylamides bulk gels (OCAP-BGs). An example of this
specialized chemistry is the UNOGEL technology developed by Union Oil Company of
California (UNOCAL) which can be applied at temperature ranges of 200 to 300 °F
(Norman et al. 2006).
Bulk gels are applied to treat strong drive-fluid channeling that typically occurs in
naturally fractured reservoirs and extremely high permeability matrix-rock reservoirs
(Smith and Larson 1997). Bulk gels are designed to reduce water production by totally or
partially blocking the high conductive zones by reducing their permeabilities. Typical
injected volumes of these agents range from a few hundred to tens of thousands of
barrels; therefore, offending zones that are small in volumes relative to the size of the
reservoir are good candidates. From their state-of-the-art, bulk gels are only considered as

45
plugging agents, or a conformance-control strategy that works solely by correcting the
formation permeability heterogeneity.
2.6.2. Colloidal Dispersion Gels. Colloidal Dispersion Gels (CDGs) are in-situ
microgel aggregates that are formed by crosslinking of low concentrations (150 to 1200
ppm) of high-molecular-weight (> 22 million daltons) hydrolyzed-polyacrylamide
polymer with aluminum citrate or chromic citrate to produce a weak gel. Such low
polymer concentrations are not enough to form a continuous network, and thus, they
produce a solution of separate gel bundles that are almost spherical particles with sizes in
the range of nanometers of 50 to 150 nm (Castro et al. 2013). These gels can flow under
differential pressures that are greater than their transition pressures, as was
experimentally demonstrated by Mack and Smith (1994).
The application of CDGs is limited to injection wells and involves injection of
large volumes that are comparable to those of polymer flooding and are expressed in
terms of pore volumes as well. Sweep efficiency improvement is achieved by providing
in-depth fluid diversion due to deep gel penetration and weak strength that result in
complete or partial blocking of high-conductive zones. Mack and Smith (1997)
mentioned that based on field results, CDGs work by flooding preferred water flow paths
between injectors and producers once-through, they restrict the flow to preferential water
paths and force it to tighter rocks. This conformance technology has been widely applied
to heterogeneous matrix-rock sandstone reservoirs produced by waterflooding with
adverse mobility ratios. It is important to note that CDGs are the precursor of some other
conformance agents or processes (Figure 2.16) that were previously attempted to achieve
the in-depth placement for the treating agents.

46
Figure 2.16. Development Stages of Colloidal Dispersion Gels (Lantz and North, 2014)
Many studies have recently displayed CDGs as a feasible technology
fundamentally for mobility control with additional benefits of reducing the permeability
of high conductive zones (Castro et al. 2013). They have also stated that this technology
is an alternative or a modified version of the polymer flooding like some other studies
(Manrique and Lantz, 2011). Others have given equal importance to both functions of
these agents as in-depth conformance improvement and mobility control strategy
(Manrique et al. 2014). However, both groups have referred to injection of CDGs as
“floods” rather than “treatments” due to the large volumes injected in the field
applications. Furthermore, they have stated and validated the possibility of displacement
of viscous oil s by CDGs by comparing the oil responses of the first and second
treatments of a retreated injection well. It is noteworthy that in this study, only CDG
historic cases that involved the co-injection of the polymer and crosslinker have been
considered where the early sequential gel applications were eliminated.

47
CDGs have uniquely gained many longstanding controversial issues based on
several laboratory evidences (Seright, 1994 and 2007; Ranganathan et al. 1998; Smith et
al. 2000; Lu et al. 2000; Chang et al. 2006; Wang et al. 2008; Al-Assi et al. 2009; Spildo
et al. 2009 and 2010, Castro et al. 2013; Diaz et al. 2015) and some critical reviews of
their field performances (Seright, 1994 and 2015; Chang et al. 2006; Manrique and Lantz,
2011; Manrique et al. 2014). Examples for debatable issues or questions about CDGs are:
do they really form gel aggregates as crosslinker is highly retained in reservoir
conditions? Do they propagate deeply into normal permeability matrix-rock sandstones?
Do they provide a greater resistance factor than uncrosslinked polymers? Can they be
injected in large volumes without reducing injectivity or causing face plugging in
injection wells? Are they technically or economically superior to the traditional polymer
floodings? Summaries and discussions about these issues can be found in work of El-
karsani et al. (2012) and Abdulbaki et al. (2014).
Spildo et al. (2010) and Diaz et al. (2015) have provided that comparisons of
results from different experimental investigations is made difficult by the variations in
one or more of the factors controlling the gelation process from one study to the other. In
addition, many researchers (not only CDG vendor’s researchers) mentioned that despite
the uncertainty around the mechanisms of different microgels systems, these technologies
are gaining popularity as a conformance control treatments (Abdulbaki et al. 2014). It is
important to mention that many of the technology vendor’s studies and other researchers
have clearly explained that CDG technology is not well understood and there are big
discrepancies between laboratory studies and field performances (Manrique and Lantz,

48
2011; Spildo et al. 2009). Manrique et al. (2014) have provided that a comprehensive
review of laboratory protocols needs to be revisited to better explain field observations.
2.6.3. Weak Gels. Weak gels (WGs) are a subdivision of the bulk gel systems
that have been terminologically separated to distinguish their objectives of application
from those of the original technology, i.e., BGs. Essentially, these agents are low to
intermediate polymer concentrations, weak strength bulk gels that can have the same or
different mechanisms for improving sweep efficiency depending on how and where they
are applied. They can be used for both profile modification remedies and in-depth fluid
diversion treatment based on the drive-fluid channeling degree and the injected gel
volumes. In literature, several criteria have been used to characterize this gel system as
illustrated by the following points:
1- In the bottle testing gel strength code system (A to J) proposed by Sydansk (1990),
weak gels have Code B which refers to a highly flowing gel.
2- Han et al. (2014) have categorized a gel system as a weak gel if it has a storage
modulus (G’) less than 1 dyne/cm
2.
3- Wang et al. (2002) experimentally have showed that in order to form a weak gel, the
storage modulus should be in the range of 0.1< G’ <10 dyne/cm
2. The authors have
also noted that the minimum polymer concentration required to form a weak gel is
2000 ppm, and the differences between storage modulus and the viscous modulus are
relatively small.
4- Liu et al. (2010) reported that weak gels have polymer concentrations between 800-
2000 ppm without further illustration about the resulted gel structure.

49
5- Some researchers have implied that any bulk gel system (regardless of its
concentration) is a weak gel if it forms a flowing gel in the reservoir conditions under
certain ranges of pressure gradients. Sheng (2011) mentioned that weak gels have a
high resistance to flow but are still able to flow so can be injected deep into the
reservoir. Han et al. (2014) provided similar ideas and referred to WGs and CDGs as
flowing gel processes. Furthermore, Song et al. (2002) and Lu et al. (2010) pointed
out that WGs are oil-displacement agents in addition to their function as blocking
agents.
Weak gels have been extensively applied in Chinese oilfields in heavy oil,
unconsolidated sandstone reservoirs as in-depth fluid diversion technology. It is
important to mention that both metallic and organic crosslinking agents were used to
form weak gels in these applications. However, organic crosslinkers were not used for the
purposes of high temperature applications as reservoirs temperatures in most of these
cases are from 109 to 163°F.
2.7. TYPES OF CHEMICAL CONFORMANCE CONTROL
Often, it is referred to chemical conformance control practices that address
permeability-related conformance issues as conformance improvement treatments. In
general, conformance improvement treatments are classified into a number of categories
according to some technical aspects such as the type of treated wells. In addition, a
number of terms are used to describe these categories that are important to know for the
sound reporting and communication within oil and gas industry.

50
First, conformance improvement treatments are categorized based on the remedy
objective whether it is to improve the volumetric sweep efficiency of IOR/EOR floodings
or to mitigate water production (Sydansk and Southwell, 2000). In other words, the
classification is based on whether the required mechanism for the treating agent is
displacement and diversion or plugging and diversion.
Secondly, some studies have classified the remediation of conformance problems
based on the implementation time whether it is before or after the channeling of the
drive-fluid. Conformance improvement treatments that are applied at early times are
described as proactive or preventive treatments while remedies that are implemented at
late stages in the flooding life are termed as reactive treatments. It has been indicated that
preventive treatments are less costly and more effective than reactive treatments (Soliman
et al. 2000; Pipes and Schoeling, 2014).
Finally, conformance improvement treatments are classified into the three
categories based on the type of the treated well whether it is injector or producer as
shown in Table 2.7. In addition, injection well treatments are subcategorized according
on the injected gelant volume or gel penetration depth. The next subsections present the
major types of chemical conformance improvement treatments.
2.7.1. Water Shutoff Treatment. This type of conformance improvement
treatments is applied to the production wells to correct the reservoir permeability
heterogeneity in the near wellbore region as shown in Figure 2.17 (a). Two treating
agents can be used to treat production wells depending on whether there is or not an
impermeable barrier separating the oil and water producing zones. For separated layer
reservoirs, strong plugging agents like polymer gels can be used and the treatment is

51
characterized as non-selective water shutoff treatment. In these treatments, conformance
agents block the high permeability zones and divert the subsequent injected fluids into
the low permeability zones. For single layer reservoirs, relative-permeability-
modification polymers and gels are applied and such treatments are termed as selective
water shutoff remedies. The placement technique represents a success key for non-
selective water shutoff treatments while RPM treatments can be bullheaded.
Table 2.7. Types of Chemical Conformance Improvement Treatments (Han et al. 2014)
Treatment
Type
Well
Type
Treatment
Diameter
Targeted
Problems Advantages Disadvantages
Water
Shutoff Producer 3-30 ft
Thief zones
Water
Coning
Immediate
Response
Low Success
Rate and High
Risky
Profile
Modification Injector 30-100 ft
High
Permeability
Zones
High Success
Rate
Short-Lived
Response
In-Depth
Fluid
Diversion
Injector 0.1-0.5 PV Crossflow
Problems
Far-wellbore
Effects
Large
Volumes
2.7.2. Profile Control Treatment. A near wellbore treatment that is applied to
injection wells to solve water channeling problems that are caused by the substantial
permeability variation as shown in Figure 2.17 (b). The total or partial plugging of high
permeability zones would increase the fluid admission or entry into the low permeability
zones and thus, oil production is increased. Often, small volumes of plugging agents are

52
enough to address the problem if there is no vertical pressure communication and
crossflow between reservoir layers. Usually strong plugging agents are used like bulk
gels, cement, or a combination of them. Again, the placement method plays an important
role in the performance and success of such treatments.
(a) Water Shut-off
(b) Profile Control
(c) In-Depth Fluid Diversion
Figure 2.17. Types of Gel Conformance Improvement Treatments
Low permeability
High permeability
Oil
Water
Water
Oil
Water
Water
Gel
Oil
Water
Water
Gel
Gel

53
2.7.3. In-Depth Fluid Diversion Treatment. When there is vertical fluid
crossflow between reservoir layers and near-wellbore treatments are applied, the injected
fluid returns to channel into the producers after bypassing the placed treatments.
Therefore, to obtain a long term fluid diversion for the subsequent injected drive-fluid,
large volumes of treating agents are placed in deeply the reservoir through the injection
wells as shown in Figure 2.17 (c). For in-depth fluid diversion (IFD) treatments, large
volumes of some agents like weak gels, preformed particle gels, and colloidal dispersion
gels are placed in the middle between the injection and production wells. IFD treatments
are often sized to fill more than 10% of the treated well pattern pore volume or about one
third of the distance between the injector and producer (Wang et al. 2001; Han et al.
2014).
2.8. PLACEMENT TECHNIQUES OF CONFORMANCE CHEMICALS
Placement technique refers to the way by which injectable conformance materials
are introduced into a reservoir. Depending on the used technique, treating agent can be
injected either into all reservoir layers or only into a specific zone. The objective of using
some improved techniques such as mechanical isolation instead of the traditional
bullhead method is to minimize the penetration of the treating agent into productive
zones. Therefore, selecting the right placement technique represents a key component for
a successful conformance improvement treatment when a vertical conformance problem
is being remedied (Miller and Chen, 1997; Bybee, 2004; Wassmuth et al. 2004; Ansah et
al. 2006; Jaripatke and Dalrymple, 2010). Seright and his colleagues have extensively
investigated this issue for different flow systems to identify the optimum placement

54
method (Seright, 1988; Seright, 1991; Sorbie and Seright, 1992; Liang and Seright, 1993;
Seright, 1995; Seright et al. 2001). These studies and others illustrate that for matrix-rock
radial-flow problem type, mechanical zone isolation must be used to secure low
permeability zones if vertical crossflow is not expected.
Jaripatke and Dalrymple (2010) have provided that placement procedures should
be selected on a well-to-well basis and similar to the method used for the injection of
dive-fluids. They reviewed and discussed features and drawbacks of main placement
techniques used in field as shown in the following subsections.
2.8.1. Bullhead Placement. The bullheading of treating agents is the most used
economic placement method in which agents are introduced into all open reservoir zones
or perforations as shown in Figure 2.18 (a). This means that conformance materials are
simply injected through existing tubulars and no workover operations are required. This
placement technique is considered risky and not preferable as it might result in plugging
of both water and oil zones.
2.8.2. Mechanical Isolation Placement. Mechanical packers, bridge plugs, other
downhole selective injection installations (mandrels) are used to guide plugging agents
only to high capacity layers while isolating oil bearing zones (Figure 2.18 (b)). Existing
of an impermeable barrier between oil and water zones represents an essential need for
this placement technique to provide the required isolation action. Costs of associated
workover operations that can consist about 60% of the whole treatment cost represent the
main disadvantage of this mechanical isolation placement.

55
2.8.3. Dual-Injection Placement. In this method, low permeability oil-bearing
zones are also isolated using a packer. Treating agents are pimped down the tubing into
high capacity zones while a compatible fluid (diesel for example) is pumped down the
annulus into low capacity zones. A key success factor for this placement is the
controlling of surface injection pressures in way that grantees a balanced fluids flow as
shown in Figure 2.18 (c). The practical difficulty of achieving balanced flow for injected
fluids and large associated expenses are most limiting factors for this technique.
(a) Bullhead Placement (b) Mechanical Isolation Placement
(c) Dual-Injection Placement (d) Isoflow Injection Placement
Figure 2.18. Conformance Agent Placement Techniques (Jaripatke and Dalrymple, 2010)

56
2.8.4. Isoflow Placement. As with dual-injection placement, Treating agents are
injected down the tubing and kept away from low capacity zones by injecting a
compatible fluid down the annulus, but without packer. In addition, a radioactive tracer is
added to the compatible fluid and a detection tool is placed in the tubing to assist in
balancing both fluid flow rates as shown in Figure 2.18 (d).
2.8.5. Transient Placement. In this method, the selective placement is achieved
by making a sharp reduction in injection pressure when the plugging agents reached the
target zone. Breston (1957) stated that such step would create a transient period during
which fluids in the reservoir could flow back into the wellbore as shown in Figure 2.19.
Obviously, this placement can only be used in the wells that experiencing significant
intra-wellbore crossflow during shut-in times. Seright (1998) discussed this method and
provided that the supporting evidence for the placement of enough plugging agents can
be placed was not provided.
Figure 2.19. Transient Placement Technique (Seright, 1998)

57
2.9. EOR SCREENING CRITERIA
As a first step, reservoir engineers usually refer to screening criteria to identify a
potential recovery process for a given reservoir out of the many available EOR methods.
Screening criteria determine the applicability of an EOR process by checking the
compatibility of injected fluids with reservoir rocks and fluids properties. These criteria
are established from real field applications of the EOR methods and summarized or
formulated in terms of reservoir and fluid properties. In other words, EOR criteria
represent the intervals of validity of each influential property based on successful field
tests, engineering considerations, and experts’ opinions (Alvarado and Manrique, 2010).
Reservoir permeability, depth, temperature, oil viscosity, oil saturation, and other
characteristics are usually considered in the analysis. Screening criteria are generally
classified into two classes depending on the form and driver of the method itself:
conventional and advanced. It is important to note that the term “applicability guidelines”
is interchangeably used for screening criteria in this study.
2.9.1. Conventional Screening Criteria. The traditional EOR guidelines are
represented by a table contains the ranges of the influential reservoir/fluids characteristics
as shown in Table 2.8. The descriptive statistical parameters like minimum, maximum,
mean, median, and standard deviation usually form the structure or shape of such EOR
screening rules. Scatter plots and histograms are also used sometimes to present data
ranges and project distributions. The driver of this type of EOR screening criteria is the
simple comparison of a given reservoir conditions with the prescribed application ranges.
Thus, they provide a “go / no-go” decision type criterion and are incapable of ranking the
candidate EOR solutions.

58
Table 2.8. Polymer Flooding Screening Criteria (Saleh et al. 2014)
Property/Statistic Mean Median St. Dev. Minimum Maximum
Oil Gravity, ᴼAPI
31.2 32 8.26 12 48
Oil Viscosity, cp 12.21 4 19.74 0.3 130 (special case
1000-5000)
Porosity, % 18.15 17.4 5.4 4.1 36.1
Oil Saturation (Start), % 55.85 53 15.5 21 94
Oil Saturation (End), % 46.57 47 13.37 20 80.9
Permeability, md 384.88 100 874.55 0.6 5500
Depth, ft 4004.21 3650 1925.8 550 9400
Temperature, ᴼF 118.1 110 30.06 65 210
Taber et al. (1997) introduced the first conventional screening criteria for all EOR
processes in both tubular and graphical (histograms and cross-plots) forms. Henceforth,
more than 100 guidelines have been developed (based on SPE papers until 2016) and
updating efforts are continuing. In addition, data from laboratory evaluations and
numerical simulation studies have been utilized to develop new guidelines and to be
compared with field-type criteria (Bang, 2013, Saleh et al. 2016).
2.9.2. Advanced Screening Criteria. In the second category of EOR screening
criteria, artificial intelligence and machine learning techniques are utilized to develop
screening algorithms or models. The EOR screening is considered as a classification
problem where historical EOR application data are used to train classifiers to create
classification rules. Classifiers identify the candidate EOR processes based on the
similarity of characteristics of a new incoming case and EOR application conditions.
Their outcomes are usually decision trees, clustering maps, or probabilities (score factor)

59
of the considered technologies; therefore, they can rank the proposed solutions and
indicate an analog for the field under evaluation. Alvarado et al. (2002) pioneered the
application of machine learning in this field and since then, many advanced models have
been developed to screen and rank EOR processes (40 studies based on the SPE papers).
Various techniques have been used to address EOR screening like clustering analysis
(Alvarado et al. 2002), expert systems (Guerillot, 1988; Gharbi, 2000), artificial neural
networks (Parada and Ertekin, 2012; Kamari et al. 2014), and Bayesian network (Zerafat
et al. 2011).
2.10. PREVIOUS POLYMER GEL APPLICABILITY GUIDELINES
The identification of the most appropriate gel technology for a given reservoir is a
key factor for a successful conformance improvement treatment. The associated
diagnosing costs make gel technology selection process crucial and extremely important
in the capital-sensitive water control projects. However, this process is quite complicated
and challenging for reservoir engineers due to several geological and technical reasons or
complexities. These reasons are related to both conformance issues and improvement
technologies and can be summarized by the following points:
1- As mentioned earlier, conformance problems encompass a broad range of issues
that may exist anywhere from the wellbore to deeply in the reservoir. In
particular, reservoir conformance issues have many types as their main root, the
permeability spatial variation occurs in various forms and directions (Section 2.5).
2- Polymer gels have a wide range of forms and chemistries that function by
different mechanisms to improve volumetric sweep efficiency of IOR/EOR

60
recovery processes. In addition, gel technologies are applied to treat a number of
conformance issues in either injection or production wells.
3- As a matter of fact, treating a specific conformance issue requires a distinct gel
technology that matches problem characteristics (Seright et al. 2001).
4- Characteristics of conformance problems are difficult to be assessed or measured
in the field with precision. Consequently, they have been qualitatively or
subjectively characterized using several diagnosing techniques along with the
traditional geological and reservoir characterization.
5- Two facts reveal that there is a need to efficient conformance agent selection
advisor which is not exists yet. First, for reservoirs that exhibit multiple forms of
heterogeneity, a combination of conformance agents is needed. Secondly, gel
systems are simultaneously screened for a conformance problem (multiple
screening). These facts call for a selection system that is not only able to identify,
but also to rank gel technologies for a certain reservoir.
The complexity of conformance solution selection process has resulted in the
development of three different types of studies to deal with the evaluation of polymer
gels applicability including:
1. Numerical screening criteria studies
2. Qualitative candidate selection criteria studies
3. Conformance problem classification studies
In the next subsections, the above studies will be reviewed and discussed in some details
to identify features and lacks.

61
2.10.1. Numerical Screening Criteria. Screening criteria in terms of reservoir
and fluid characteristics have been widely used to identify the potential EOR
technologies for a specific reservoir. Despite the large number of implemented gel field
projects, only few conventional screening criteria have been sporadically accomplished
for polymer gels that suffer from many lacks and drawbacks. This observation can easily
be verified by comparing the numbers of screening criteria of polymer gels and other
EOR methods as shown in Figure 2.20. The rear utilization of these criteria in history
case studies would also confirm the above observation.
In addition, many advanced models have been developed to screen and rank EOR
processes (40 studies based on the SPE papers). However, to the best of our knowledge,
no study has been accomplished for gel technologies. The evaluation of polymer gels is
basically a multiple screening problem in which all considered gel technologies are
simultaneously assessed for a given field. Recall that conventional guidelines lack
ranking functionality and might produce contradictory results in such situations (i.e.,
multiple screening).
The first polymer gel screening guidelines were provided for colloidal dispersion
gels by Mack (1978). They are based on three Minnelusa formation projects in Wyoming
when these gels were still being applied in their sequential forms. Mack (1978)
mentioned that if the sweep efficiency is poor (ultimate oil recovery < 33%), then the
water oil ratio is not a limiting factor in choosing a candidate for this technology.
Williams and Pitts (1997) accompanied their inventory of EOR projects in the Rocky
Mountain region by screening criteria for thermal, gas, and chemical methods including
polymer flooding, BGs, and CDGs. Their review was based on only two CDG projects

62
and includes only some experts’ opinions that were of polymer flooding except reservoir
permeability. The upper validity limit of oil viscosity was extended to 400 cp which is
not consistent with all other screening studies. Manrique et al. (2014) presented the most
updated screening criteria in the form of a field applications review for CDG projects in
the United States, Argentina, and Colombia since 2005. Their summary includes five
screening parameters, six treatment-operational aspects, and qualitative descriptions of
the frequently considered aspects in the evaluation of polymer gels in common. A
summary of the CDG screening criteria and project reviews is presented in Table 2.9.
Figure 2.20. Comparison of Numbers of Screening Criteria for EOR Methods
55
28
22
23
6
0
20
40
60
1970 1980 1990 2000 2010 2020
Cu
m.
Fre
qu
en
cy
Years
Multiple
Gas
Thermal
Chemical
Polymer gels
N=133

63
Table 2.9. Summary of Screening Criteria for Colloidal Dispersion Gels
Parameter Mack Williams and Pitts Manrique et al.
Min Max Min Max Min Max
Survey Years 1974 1978 1994 1996 2005 2014
# of Projects 3 2 31
Publishing year 1978 1997 2014
Lithology Sandstone Sandstone Sandstone
Formation type Matrix Matrix Matrix
Permeability, md 10 300 50 - 10 4200
DPc, fraction 0.6 - - - 0.55 0.7 *
Temperature, °F - 220 - 200 80 210
Average Net Pay, ft - - NC NC 20 200
Depth, ft - - - 9000 - -
Oil Sat. (start),% - - - - - -
Oil Viscosity, cp - - - 400 5 30
Oil Gravity, API - - 15 40 - -
Water Salinity, kppm - 100 Acceptable - -
Water Cut, % NC NC - - - -
Mobility Ratio - - - - - -
Oil Recover (start), % - 33 - - - -
* From Castro et al. (2013)
For bulk gels, Table 2.10 shows that only three screening criteria were developed
as well. Seright and Liang (1994) presented screening criteria for bulk gel applications in
production and injection wells based on the field trials survey from 1980 to 1992 and the
views of gel vendors and industry experts. In the DOE report form of this study, Seright
(1993) provided extensive comparisons of BG treatments with polymer floodings and

64
qualitative candidate selection criteria for both production and injection wells. It is
important to note that in this study and others (Taber et al. 1997), the early-sequentially-
injected CDG projects have been considered polymer floodings. Delgadillo (2010)
proposed screening criteria for BGs based on lab evaluations and field applications and
established a procedure for testing the technical feasibility of gel treatments. The author
mentioned that current oil saturation is the most important criterion and should be > 10%.
Williams and Pitts (1997) also considered BGs in their inventory of EOR projects in the
Rocky Mountain region as mentioned above. Four BG projects were summarized in their
study and some criteria were adopted from Taber et al. (1996). In addition, five
frequently considered parameters in EOR screening were reported as not critical for bulk
gels.
It has been identified that the previous polymer gels screening criteria suffer from
the following lacks and drawbacks:
1- Only MCAP-BGs and CDGs have been evaluated where few unspecialized,
limited parameters, single agent criteria or surveys have been published. This
eliminates the possibility of evaluating multiple agents at the same time which is
really important in reservoirs that exhibit different heterogeneity forms.
2- Only one study has presented conventional screening criteria in their complete
statistical structure necessary to deal with the considerable data variabilities.
3- Most studies considered few reservoir/fluids characteristics and some parameters
presented in form of expert’s opinions such as oil viscosity < 200 cp due to the
lacks of data.

65
Table 2.10. Summary of Screening Criteria for Metallically-Crosslinked Bulk Gels
Parameter Seright and Liang Williams and Pitts Delgadillo
Min Max Min Max Min Max
Survey Years 1980 1992 1990 1996 - -
# of Projects 114 4 -
Publishing year 1994 1997 2010
Formation type Carbonate
Sandstone
Carbonate
Sandston
Carbonate
Sandstone
Polymer type HPAM, Xanthan,
Others HPAM HPAM
Permeability, md 4.1 5000 NC NC 15 -
DPc, fraction - - - - 0.63 -
Temperature, °F 64 240
<250 - 208
Average Net Pay, ft - - NC NC - -
Depth, ft - - - 11000 - 8000
Oil Sat. (start),% - - - - 10 -
Oil Viscosity, cp - - NC NC - 200
Oil Gravity, API - - NC NC 18 -
Water Salinity, kppm - - Acceptable - 70
Water Cut, % 9 99.4 - - - -
Oil Recover (start), % 1.1 73 - - - -
4- Except two experts’ opinions for Dykstra-Parsons coefficient (DPc), permeability
variation and mobility ratio are not evaluated in these studies, despite the fact that
these properties represent the roots of reservoir conformance problems.
5- No distinction has been recognized in the previous criteria between BG and WG
gel systems despite the clear differences in their application objectives and
volumes.

66
6- Some studies are field application reviews that summarized few screening
parameters and sometimes no subsequent updates have been provided as with
other EOR methods.
7- Some studies considered different combinations of polymers and crosslinkers, i.e.
xanthan, polyacrylamide and other materials in one screening criteria.
8- Some criteria considered the same parameters commonly processed for other
EOR methods while screening of polymer gels requires the consideration of other
influential aspects like drive-fluid channeling characteristics.
9- Most criteria are generally biased to Wyoming oilfields and specifically to the
Rocky Mountain region and Big Horn basin fields as projects in these regions are
the sources of the data.
2.10.2. Qualitative Well Candidate Selection Criteria. This type of criteria
facilitates the nomination of a well in a field for the application of a gel technology based
on its functionality requirements. In other words, they represent qualitative well zoning
criteria discussed in Section 2.4.
Seright and Liang (1994), and Manrique et al. (2014) accompanied their
conventional screening criteria by qualitative candidate selection guidelines for BGs and
CDGs. In addition, Sydansk and Southwell (2000), Smith (1999), Ricks and Portwood
(2000), Wouterlood et al. (2002), and Romero et al. (2003) have provided several
fundamental candidate selection criteria for BGs based on their extensive field
experiences. Montoya Moreno et al. (2014) summarized the above bulk gels criteria in
the following six points:

67
1- Quantifiable mobile oil saturation: a primary and secondary oil recovery factor
less than 33% is sometimes used as a rule of thumb. This criterion is frequently
satisfied in naturally fractured reservoirs with injector-producer fracture
communication.
2- Rapid injection water breakthrough: water channeling can be identified using
production data and water injection profiles surveys.
3- Injector-producer connectivity: geological models, chemical tracers and
production data are examples for data sources that can be utilized to confirm
reservoir connectivity.
4- Reservoir heterogeneity: core studies, electric logs, development of a dynamic
geological model and, of course, fluid production data are some of the data
sources used to quantify heterogeneity.
5- High connectivity: high injection rates and low injection pressures are indicative
of water channeling. Gel treatments will normally increase injection pressure;
therefore, a pressure margin must be available before the gel treatment. The
injection pressure in the candidate well must also be significantly below the
maximum waterflood plant injection pressure.
6- Mechanical integrity: casing and cement in the candidate well should be evaluated
and confirmed to be in good condition. Cement bond logs are one common tool to
rule out water channeling behind pipe.
Manrique et al. (2014) mentioned that some of the variables that frequently
considered for evaluation of CDG technology are:

68
1. Maturity of the waterflood (evaluation of evidence for presence of remaining
moveable oil).
2. Waterfloods operating under adverse mobility ratios.
3. Low reservoir permeability with substantial heterogeneity.
4. Thin reservoirs (net pay thickness < 40 ft) injecting water with several wells.
5. Potential injectivity constraints due to narrow margin between maximum injection
and reservoir pressures (assumes injection below parting pressure).
6. Limited water handing capacities.
7. Requirements to minimize or delay polymer production.
It can be easily recognized that there is a considerable ambiguity in the above
criteria about several issues in addition to being quite general. For instance, where the
quantifiable mobile oil should be present in the reservoir so that polymer gels effectively
improve the sweep efficiency? Secondly, what is the role of the above qualitative criteria
in the selection process of gel technologies and how they are connected to the numerical
guidelines? A number of points are common for both gel systems like substantial
heterogeneity, waterfloodings, and adverse mobility ratio. Finally, from another prospect,
rating of gel technologies for a conformance problem seems impossible using such quite
general descriptive statements. To sum up, the above well candidate criteria look like a
check list by the requirements that should be verified for a gel system after selecting it.
2.10.3. Conformance Problems Classification. It has been remarkably indicated
that the conformance problem classifications are the most applied selection criteria for
the conformance improvement technologies in general (agents or operations). In addition,
well candidate selection criteria have been simultaneously utilized with the problem

69
classifications in some case histories to accelerate the selection process. Among well
candidate selection criteria, the point of existing of quantifiable oil reserves is the most
cited criterion. Before examining problem classification studies, it is very important to
know what issues have called for such type of qualitative approaches.
As illustrated in the previous sections, conformance problems comprise a wide
range of issues that have different mechanisms, locations, and forms. In such situations,
problem categorization would greatly facilitate the interpretation and identification of
conformance issues. In addition, the properties of conformance problems are qualitatively
evaluated using several costly diagnosing techniques. In this evaluation, several
qualitative descriptions are used like strong channeling problem or laterally extended
channel and so no. The subjective nature of this evaluation imposes an intuitive judgment
on conformance improvement technology selection process (i.e., to be performed
qualitatively also). Therefore, several studies have focused on the classification and
connection of conformance problems and conformance solutions to ease the selection
process (Borling et al. 1994; Wu et al. 1994; Azari and Soliman, 1996; Dalrymple, 1997;
Sydansk and Southwell, 2000; Creel et al. 2001; Seright et al. 2001; Kabir, 2001; Smith
and Ott, 2006; Liu et al. 2006; Joseph and Ajienka, 2010, Liu et al. 2010; Jaripatke and
Dalrymple, 2010; Kim and Crespo, 2013).
Three distinct development stages have been identified for the selection process
based on the categorization aspects of conformance problems presented in the above
studies. In each stage, an additional new aspect was used as a classification criterion for
the conformance issues as shown in Figure 2.21. This means that the conformance issues
are reviewed according to all these aspects in an integral way to facilitate the solution

70
identification. The trigger for this progressive development was mainly the
comprehensive experiences that were continuously gained as more water management
projects performed during each stage. In the following points, classification studies and
aspects are chronologically summarized as follows:
Figure 2.21. Development Stages of Conformance Agent Selection Process

71
1- Problem type: This stage started in 1970s when the water management practices
started to receive great attention in oil industry and some new promising conformance
technologies were developed. The type or nature of the problem was the criterion used to
match a conformance issue to a conformance improvement technology. For instance,
high permeability strata without crossflow problem can be treated by either mechanical
techniques or polymer gels. In other words, conformance problems have been categorized
and related to conformance improvement technologies based on their engineering
considerations of both. Problems considerations generally includes problem locations
(near vs. far wellbore), problem mechanisms (channeling vs. coning), and the presence of
adverse mobility ratio and crossflow. Conformance problem types presented in Section
2.3 are a genuine example for the problem-type classification studies. The overwhelming
usage of the term “problem identification” provides clear evidence that the problem type
was the selection criterion of conformance solutions.
Several conformance approach reviews (Azari and Soliman, 1996; Soliman, 1999;
Soliman et al. 2000; Creel et al. 2001; Kabir, 2001; Joseph and Ajienka, 2010, Liu et al.
2010; Jaripatke and Dalrymple, 2010; Kim and Crespo, 2013), selection process logic
chart (Borling et al. 1994), and expert systems (Wu et al. 1994; Dalrymple, 1997) were
established using problem type (Table 2.11, Figure 2.22 and Figure 2.23). During this
time period, the understanding of conformance problems has been significantly improved
and extensive experiences were gained as new conformance technologies and especially
polymer gels were tested for a variety of issues. The problem with this general
categorization was that some conformance improvement technologies like polymer gels
have been verified to be a solution for a number of conformance issues with quiet

72
different designs and practices. For example, both BGs and CDGs or polymer flooding
were applied in some case histories, the matter that called for more differentiating
classifications.
Table 2.11. General Conformance Decision Matrix (Dalrymple, 2010)
Conformance Problems Cement UF
Cement
Monomer
Gels
BGs
MCAP
BGs
OCAP RPM PPG
Plug-back X
Plugging well X
Bottom water shutoff X X
Casing leaks X X X
Channel behind pipe X X X
Seal high pressure zone X X
Potential acid into water X
Potential frac into water X
Coning/cresting X X X X
Channel from injector X X X X X
Water shutoff in a GP X X
High-permeability streaks X X X X X
Large void X X
No shale barrier X
UF: ultra-fine, BGs: bulk gels, MCAP: metallically crosslinked polyacrylamides, OCAP: organically
crosslinked polyacrylamides, RPM: relative-permeability-modifiers, PPG: preformed particle gels.
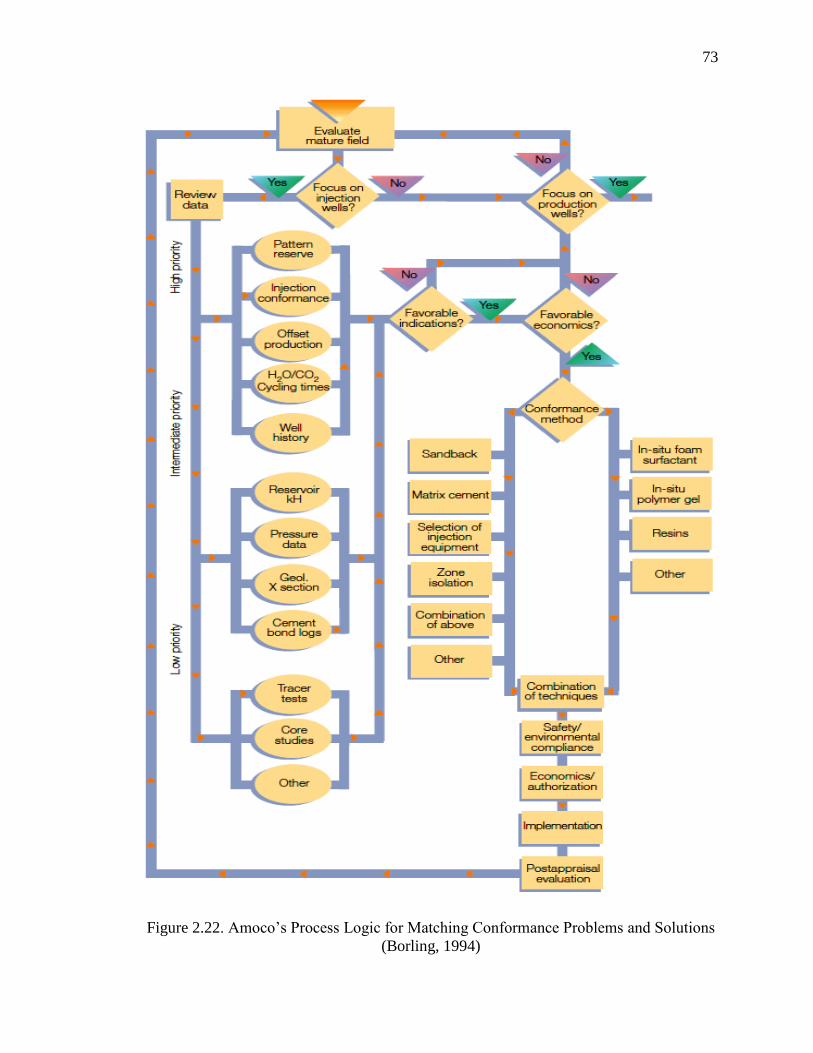
73
Figure 2.22. Amoco’s Process Logic for Matching Conformance Problems and Solutions
(Borling, 1994)

74
Figure 2.23. Problem Identification and Fluid Selection Screens of Water Control Expert
System (Wu et al. 1994)

75
2- Channeling statements: After the emergence and extensive testing of some new
promising conformance chemistries and agents, more comprehensive reviews of
conformance problems have been introduced (Sydansk and Southwell, 1998, Southwell,
1999, Creel et al. 2001, Seright et al. 2001, Kabir, 2001, Smith and Ott, 2006). In
addition to problem type, these studies have taken into considerations the problem
severity or drive-fluid channeling strength in terms of some statements. This problem
characteristic has been considered only for one purpose that is to assist in the designation
of well candidates with strong channeling to be treated by bulk gels. However, this
problem property (i.e., channeling strength) has been qualitatively treated as well due to
the absence of adequate characterization system for conformance problems. Furthermore,
one of these channeling statements has been modified later into a selection rule of thumb
specifically for polymer gels. In the following paragraphs, the above studies and
developments are presented in more details. Their limitations and consequences on
conformance improvement technology selection will be also discussed.
In 1998, Sydansk and Southwell provided a list of the conformance problems that
can be treated by Chromium (III)-Carboxylate/Acrylamide-Polymer (CC/AP) bulk gels
as shown in Table 2.12. They have also illustrated that there are two problem key
distinctions that must be made in order to identify the appropriate treatment. First, a
conformance problem should be differentiated whether it is a vertical or areal issue and
whether there is fluid crossflow between geological strata or not. The second key
distinction is whether the high conductive zone is simple high permeability unfractured
matrix rock (< 2000 md) or it is a high permeability anomaly such as fractures (> 2000
md). The second key was an attempt to assess the problem severity whether it involves

76
strong or weak channeling strength. This means that in addition to the problem type, they
categorized conformance problems according to the formation type as an indicator of
drive-fluid channeling strength. Based on these distinctions, BGs can successfully treat
vertical, no crossflow, and fracture type conformance problems because they are strong
gel systems.
Table 2.12. Conformance Problems That are Attractive to Treat With Bulk Gels (Sydansk
and Southwell, 2000)
Matrix Conformance Problems
Without crossflow
With crossflow
Yes
Challenging—must place very deeply
Fracture Conformance problems
Simple
Network—intermediate intensity
and directional trends
Network—highly intense
Hydraulic
Depends— case-by-case basis
Yes
Often not
Yes
Coning Problems
Water and gas via fractures
Water and gas via matrix reservoir rock
Yes
No
Behind Pipe Channeling Yes, for microflow channels
Casing Leaks Yes, for microflow channels
Seright et al. (2001) classified water production problems into four categories
based on the conformance treatment type and ranked them in term of the remediation

77
difficulty (Table 2.13). They also proposed a diagnostic strategy to decide whether the
fluid flow around the wellbore is radial or linear to be the second channeling statement
(Section 2.4.2). Smith and Ott (2006) presented a Comprehensive Conformance Problem
Matrix that classifies conformance issues with respect to two aspects. First, problems
were categorized into wellbore versus far-wellbore problems and secondly into high flow
conduit versus permeable rock problems based on the severity of the drive-fluid
channeling. In 2016, Smith updated his matrix by connecting conformance problems into
conformance improvement technologies as shown in Figure 2.24 (Mishra et al. 2016).
Table 2.13. Excessive Water Production and Treatment Categories (Seright et al. 2001)
Category A:"Conventional" Treatments Normally Are an Effective Choice
1. Casing leaks without flow restrictions.
2. Flow behind pipe without flow restrictions.
3. Unfractured wells (injectors or producers) with effective barriers to crossflow.
Category B: Treatment with Gelants Normally are an Effective Choice
4. Casing leaks with flow restrictions.
5. Flow behind pipe with flow restrictions.
6. "Two-dimensional coning” through a hydraulic fracture from an aquifer.
7. Natural fracture system leading to an aquifer.
Category C: Treatment with Preformed Gels Normally are an Effective Choice
8. Faults or fractures crossing a deviated or horizontal well.
9. Single fracture causing channeling between wells.
10. Natural fracture system allowing channeling between wells.
Category D: Difficult Problems Where Gel Treatment Should Not Be Used
11. Three-dimensional coning.
12. Cusping.
13. Channeling through strata (no fractures), with crossflow.

78
Figure 2.24. Comprehensive Conformance Problem and Solution Matrix (Mishra et al.
2016)
However, the above qualitative selection matrices have mainly considered bulk
gels and based on the Permian and Powder River Basins’ experiences. They have
ultimately concentrated on distinguishing of the suitable conditions to apply BGs and on
the sizing of the bulk gel treatments. The flood-size treating technologies (CDGs and
WGs) have been rarely taken into consideration in these studies where only Sydansk
(2007) pointed out to such conformance agents among above studies. He provided that
there are some reports in the literature mentioned that large volume CDG treatments were
applied to treat matrix-rock reservoirs with crossflow.
Later, some researchers have considered CDGs and some other gel systems in
addition to BGs and new channeling statement appeared in the term of permeability

79
variation. For example, Liu et al. (2006 and 2010) presented conformance problems in
Chinese oilfields, and connected them with a variety of treating agents based on the type
of the conformance treatment. They have considered BGs, CDGs, WGs and performed-
particle gels in their study, and provided a comprehensive decision-making strategy for
the candidate well selection. Reynolds and Kiker (2003) suggested the injection of CDGs
at the inception of waterflooding if analogous floods suggests a premature water
breakthrough or Dykstra-Parsons coefficient (DPc) is greater than 0.6. They proposed the
injection of BGs after waterflooding initiation if water channeling is through fractures or
high permeability streaks. The ICP (Instituto Colombiano del Petroleo) developed a
methodology to select the possible solutions for improving sweep efficiency in
Columbian oilfields that presented by Castro et al. (2013) and Maya et al. (2014). In this
methodology, DPc has been introduced as a key parameter to guide the selection process
where it suggests application of CDGs if 0.55 < DPc < 0.7 and application of BGs for
reservoirs with DPc values > 0.7.
2.1- Sydansk and Southwell rule of thumb: Among the above studies, the formation type–
based channeling statement introduced by Sydansk and Southwell (1998) was the most
acceptable criteria in the practical points of view for many gel service companies.
Therefore, this statement has been translated into the following well-known rule of thumb
for gel technology selection in history case studies. This rule states that bulk gels are
designed to reduce water channeling in extreme heterogeneities like naturally fractured
formations or in reservoirs with multi-Darcy permeability anomalies. For unfractured,
low permeability matrix-rock reservoirs, sweep efficiency can be improved by large
volume colloidal dispersion gel (CDG) treatments (Mack and Smith, 1997; Al-Dhafeeri

80
et al. 2005; Norman et al. 2006; Muruaga et al. 2008; Diaz et al. 2008). It is noteworthy
that they justified the utilization of the CDGs by the presence of crossflow between
reservoir layers.
2.2- Limitations: Despite the noticeable progress witnessed during this stage in the
selection of guidelines conformance improvement technologies, some limitations were
identified in the above studies. The most important limitation in these qualitative
statements that they do not allow to rate both conformance problems and improvement
technologies.
For gel field projects reviewed in the present study, the distribution of lithologies,
formation types, and reservoir permeability are shown in Figure 2.25 and Figure 2.26.
The first figure illustrates that BGs were applied in matrix-rock reservoirs more than in
naturally fractured systems (29 vs. 20). In addition, the second figure shows that CDGs
and WGs were applied in matrix-rock reservoirs that have higher average permeabilities
than BG matrix-rock trials. Thus, if it is stated that BG matrix-rock case histories have
high permeability anomalies, the above observation would imply that CDG projects have
higher permeability anomalies than BGs under the assumption of correlating average and
high permeability values for the reviewed reservoirs. This implies that formation-based
Sydansk and Southwell rule of thumb cannot be used anymore after the extensive
application of BGs in matrix-rock reservoirs.
Concerning Darcy law-based diagnosing method proposed by Seright et al.
(2001), the considerable uncertainties in reservoir properties result in conflicts with the
field observations in many situations (Romero et al. 2003; Norman et al. 2006). This
matter has limited the application of this method in history case studies to a great degree.

81
The problem matrix introduced by Smith and Ott (2006) does not go further than other
former studies because they used the problem type again as an indicator of channeling
strength. For gel selection methodologies that based on the permeability variation
(Reynolds and Kiker, 2003 and Castro et al. 2013), Figure 2.27 shows that DPc
application intervals for polymer gels are intersected over wide intervals and a large
number of CDG treatments were applied in formations with DPc > 0.7. This indicates a
clear conflict with ICP criteria that have preserved this range (DPc > 0.7) for bulk gel
applications; thus, these criteria are only regional-decision-making rule.
Figure 2.25. Distributions of gel projects according to reservoir types
3 14
26
6 8
39
5
4
6 3
14
69
11 14
Mat. NF. Mat. NF. Uncon.
Formation Type
WGs
CDGs
BGs
Carbonate Sandstone

82
Figure 2.26. Comparison of average permeability applicability ranges for gel systems
Figure 2.27. Permeability variation coefficient distributions for polymer gel projects
3-62
10-193
4-500
30-294
8-850
19-1407
500-1216
1325-2500
1230-2634
1 10 100 1000 10000
Average Reservoir Permeability, md
San
dsto
ne
C
arb
on
ate
Un
co
nso
lid
ate
d
Matr
ic-r
ock
N. fr
actu
red
1 6
15
6 1
9
20
8
3
1
4
1
1
11
30
23
10
0.5-0.6 0.6-0.7 0.7-0.8 0.8-0.9 0.9-1.0
Dykstra-Parsons Coefficient, fraction
WGs
CDGs
BGs

83
3- Communication analysis: In this stage, the communication analysis techniques started
to be used to characterize the channeling strength between injectors and producers in a
quantitative accurate manner. The interwell connectivity is frequently represented by
correlation factors or weighting coefficients of water injection and production rates. The
interwell connectivity is ranging between 0 and 1.0 with 1.0 means strong
communication and 0 no communication. The estimation of interwell communication
enables the identification and ranking of injectors and producers for conformance
treatments (well zoning). It is important to note that correlations of injection and
production cycles in the case of CO2 injection and of flow rates or pressures have been
previously observed (Borling, 1994, Love et al. 1994; Lantz and Muniz, 2014). However,
such observations have been qualitatively utilized to evaluate the channeling strength,
connected wells, and ranking of offending well patterns.
Chou et al. (1994) employed correlation coefficients between water injection and
production rates to identify the problematic injectors in the case of the Eunice Monument
South Unit (EMSU). The problem wells were ranked according to the estimated
correlation coefficients and the injectors with > 0.5 coefficients were selected for bulk gel
treatments as shown in Figure 2.28. They provided that results show that offset producers
having a high correlation coefficient with the pattern injector generally have positive
response after bulk gel treatments, and vice versa. In addition, they provided that
performances of gel treatments applied in injection wells nominated based on these
analyses are much better than previous remedies in the Eunice Monument South Unit.
Baker et al. (2012) examined 12 waterflooded oilfields with over 2000 injector-
producer pairs in Western Canada using SweepSCAN communication analysis program

84
(Baker Hughes SweepSCANTM
, 2012). The goal of this examination was to verify the
presence of induced fractures that cause the strong communication between injection and
production wells. They suggested bulk gel treatments as one of the good reservoir
management practices for small fracture volumes. Sandhu (2012) reported the utilization
of Epic Communication Analysis software to select gel treatment candidates the case of
in Weyburn Midale oilfield. It is important to mention that this history case has been
identified as one of three BGs gel projects that are considered as overperform treatments.
Figure 2.28. Schematic Map of Gel Treated Injectors in EMSU Field (Chou et al. 1994)

85
Once more, the development efforts were focused only on identifying strong
channeling problems that are suitable to be remedied by bulk gels. In addition, other
conformance problem characteristics have not been taken into considerations because
these studies focused on rating of well patterns for strong plugging agents like cement
and bulk gels.
In conclusion, the above review clearly illustrates that the selection process of
conformance improvement technologies and especially polymer gels has mostly been
nominally performed using the problem type or description according to some
classification aspects. In addition, the choice of the gel technologies has been solely
based on the drive-fluid channeling strength while it involves other important factors that
should be considered as well. While all studies have emphasized the importance of
existing producible oil quantities in problematic well patterns, no clarifications were
made about in which zones there quantities should be present. Furthermore, the
development of reservoir heterogeneities or channeling degree with time or injection
process has also not been indicated in these studies.
This judgmental channeling-based approach has resulted in the emergence of
many diverging opinions about the applicability of polymer gels as shown in Table 2.14
(Chou et al. 1994). There have been more qualitative problem descriptions and
terminologies than the conformance problems themselves. Furthermore, it has resulted in
a difficulty in the recognition of distinctive channeling severity limits for gel systems.
Consequently, conformance problems in all reviewed case histories were characterized as
strong channeling issues even issues that were treated by weak gel systems.

86
Table 2.14. Some Proposed Cut-offs for Diagnosis Parameters of Drive-fluid Channeling
Strength
Parameter Weak
Channeling
Strong
Channeling Reference
Problem Zone
Permeability
< 2000 md > 2000 md Sydansk & Southwell
(2000)
<10 Darcies > 10 Darcies
Sydansk (2007)
Permeability
Contrast
KStreak > (2-10) KMatrix KStreak > (50) KMatrix
Baker et al. (2012)
Khigh < 1000 KMatrix Khigh > 1000 KMatrix
Sydansk (2007)
Permeability
Variation
DPc > 0.6 - Reynolds and Kiker
(2003)
0.55 < DPc < 0.7 DPc > 0.7 Castro et al. (2013)
Drive-fluid
Injectivity
< 10 bpd/psi > 20 bpd/psi Pipes & Schoeling
(2014)
- > 5 Expected 1 Tweidt et al. (1997)
Recovery factor - < 33 % Montoya Moreno et al.
(2014)
Flow Regime Radial Linear Sydansk (2007)
Interwell
Communication2
< 0.5 > 0.5 Baker et al. (2012)
Formation Type - Naturally Fractured
Unconsolidated Current Study
Drive-fluid
Breakthrough Time Months to years Weeks to Months Current study
Tracer breakthrough
Time Weeks to Months Hours to Days Current study
Water Cut
Increment Rate < 0.5 per year > 0.5 per year Current Study
(1) Based on average reservoir parameters, (2) correlation coefficient of producer-injector
pressures or flow rates.
2.11. LITERATURE REVIEW DISCUSSION
The above literature review reveals that the subjective nature of conformance
problem evaluation imposes many difficulties toward rating and connecting of
conformance problems and conformance solutions. It caused emergence of three different

87
approach studies for solution selection and no clear explanations about the role of each
approach in the selection process have been provided. The review also illustrates that
these studies have separately handled gel systems, the matter that resulted in absence of
comprehensive comparative guidelines.
Consequently, a rule of thumb for gel technology selection was developed based
on conformance problems classifications established from field experiences. This resulted
in impediment of other proposed guidelines and criteria where they were rarely used in
gel field projects. In this rule, conformance solutions and specifically polymer gels are
chosen according to channeling-strength-based statements in terms of problem
description, formation type, or permeability variation. This judgmental approach has
resulted in the emergence of many diverging opinions about the applicability of polymer
gels (Chou et al. 1994). Furthermore, it has resulted in a difficulty in the recognition of
distinctive channeling severity limits for gel systems.
The identification of polymer gels is basically a multiple screening problem in
which all considered gel technologies are simultaneously assessed for a given field.
However, no applicability screening criteria have been established for OCAP-BGs and
weak gels. The available guidelines for MCAP-BGs and CDGs suffer from many
deficiencies like update data, expert opinions, and the inclusion of limited number of
screening parameters. Being the roots of conformance issues, permeability variation and
mobility ratio should be included in the applicability guidelines of gel systems. The
existence of several versions of gel technology applied over a wide range of application
conditions call for more sophisticated models to screen and selection them.

88
The evolution of three different approach studies that have an interrupted
appearance in history case studies indicate the sophistication of gel technology selection
and a lack of the sound understanding of this process. Also, the absence of the connection
between these studies indicates that the steps or components of identification process are
not fully understood. Furthermore, the evaluation of other conformance problem aspects
in history case studies highlights that these characteristics have influential roles in the
selection process just like channeling strength. The ambiguity existing in the descriptive
candidate selection criteria diminishes the distinctions between conformance problems
which in turn complicates gel technology identification routine.
89
PAPER
I. Comprehensive Guidelines for the Application of In-Situ Polymer Gels for
Injection Well Conformance Improvement Based on Field Projects
Munqith Aldhaheri, Mingzhen Wei, and Baojun Bai
Missouri University of Science and Technology
(SPE-179575-MS Published in SPE Improved Oil Recovery Conference, Tula,
Oklahoma, April 2016)
Abstract
Polymer gels are increasingly applied to improve sweep efficiency of different IOR/EOR
recovery processes. Three in-situ polymer gel systems including bulk gels, colloidal
dispersion gels, and weak gels are often used to mitigate water production caused by
reservoir heterogeneity and unfavorable mobility ratio of oil and injected fluids. Selecting
the most appropriate gel system is a key component for a successful conformance
improvement treatment. Screening criteria in terms of reservoir and fluid characteristics
have been widely used to identify potential technologies for a specific reservoir. Despite
the large number of polymer gel projects, only five, limited-parameters, single-agent
criteria or surveys have been sporadically accomplished that suffer from many
deficiencies and drawbacks.

90
This paper presents the first complete applicability guidelines for gel technologies
based on their field implementations in injection wells from 1978 to 2015. The data set
includes 111 cases histories compiled mainly from SPE papers and U.S. Department of
Energy reports. We extracted missing data from some public EOR databases and detected
potential outliers by two approaches to ensure data quality. Finally, for each parameter,
we evaluated project and treatment frequency distributions and applicability ranges based
on successful projects. Extensive comparisons of the developed applicability criteria with
the previous surveillance studies are provided and differences are discussed in details as
well.
In addition to the parameters that are considered for other EOR technologies, we
identified that the applicability evaluations of polymer gels should incorporate the
parameters that depict roots and characteristics of conformance issues. The present
applicability criteria comprise 16 quantitative parameters including permeability
variation, mobility ratio, and three production-related aspects. Application guidelines
were established for organically crosslinked bulk gels for the first time, and many
experts’ opinions in the previous criteria were replaced by detailed property evaluations.
In addition, we identified that the applicability criteria of some parameters are
considerably influenced by lithology and formation types, and thus, their data were
analyzed according to these characteristics. Besides their comprehensiveness of all
necessary screening parameters, the novelty of the new criteria lies in their ability to self-
check the established validity limits for the screening parameters which resulted from the
inclusion and simultaneous evaluation of the project and treatment frequencies.

91
Introduction
Excessive water production represents a major industry challenge because of its serious
economic and environmental impacts. The problem of producing and disposing of large
quantities of injection water is becoming more crucial due to the tightening economic
constraints caused by falling oil prices; hence, many operators reexamine their spending
rates. Among the conformance improvement technologies, polymer gels have been
proven to be effective in addressing this problem and in increasing oil recoveries.
However, selection of a proper gel technology is not an easy task for operators and
reservoir engineers fundamentally due to the existence of numerous types of the
conformance problems and gel technologies, and because of the fact that the treatment of
a specific conformance issue requires a distinct gel technology.
Reservoir engineers usually refer to screening criteria to identify potential EOR
processes for a given reservoir. These criteria are established from real field applications
of the EOR methods and summarized in terms of reservoir and fluid properties. In other
words, EOR criteria represent the intervals of validity of each influential property based
on successful field tests, engineering considerations, and experts’ opinions (Alvarado and
Manrique, 2010). Despite the large number of gel field projects, only five screening
criteria have been sporadically accomplished for polymer gels as shown by Figure 1,
which compares the number of screening criteria developed for some EOR techniques
based on SPE papers.
The first polymer gels screening guidelines were provided for colloidal dispersion
gels (CDGs) by Mack (1978) based on three Minnelusa formation projects in Wyoming
when these gels were still being applied in their sequential forms. He mentioned that if

92
the sweep efficiency is poor (ultimate oil recovery < 33%), then the water oil ratio is not
a limiting factor in choosing a candidate for this technology. Manrique et al. (2014)
presented the most updated screening criteria in the form of a field applications review
for CDG projects in the United States, Argentina, and Colombia since 2005. Their
summary includes five screening parameters, six treatment-operational aspects, and
qualitative descriptions of frequently considered aspects in the evaluation of polymer gels
in common.
Figure 1. Development of screening criteria of polymer gels and common EOR
methods
Seright and Liang (1994) presented screening criteria for bulk gel (BGs)
applications in production and injection wells based on the field trials survey from 1980
to 1992 and the views of gel vendors and industry experts. In the DOE report form of this
study, Seright (1993) provided extensive comparisons of BGs with polymer floodings,
55
28
22
23
6
0
20
40
60
1970 1980 1990 2000 2010 2020
Cu
m.
Fre
qu
en
cy
Years
Multiple
Gas
Thermal
Chemical
Polymer gels
N=133

93
and qualitative candidate selection criteria for both production and injection wells. It is
important to note that in this study and others (Taber et al. 1997), the early-sequentially-
injected CDG projects have been considered polymer floodings. Delgadillo (2010)
proposed screening criteria for BGs based on lab evaluations and field applications and
established a procedure for testing the technical feasibility of gel treatments. The author
mentioned that current oil saturation is the most important criterion and should be > 10%.
Williams and Pitts (1997) accompanied their inventory of EOR projects in the
Rocky Mountain region by screening criteria for thermal, gas, and chemical methods
including polymer flooding, BGs, and CDGs. They adopted some criteria from Taber et
al. (1996) and five frequently considered parameters in EOR screening were reported as
not critical for bulk gels. The aforementioned screening guidelines are elaborately
presented and compared with the developed criteria in the last section of this paper.
We have identified that the previous polymer gels screening criteria suffer from
the following lacks and drawbacks:
1. Few specialized screening studies have been produced and most of them were
limited to one gel technology. This eliminates the possibility of evaluating
multiple agents at the same time which is really important in reservoirs that
exhibit different heterogeneity forms.
2. Most studies included few reservoir/fluids characteristics and some parameters
presented with expert’s opinions such as oil viscosity < 200 cp due to the lack of
data.

94
3. Except two experts’ opinions for Dykstra-Parsons coefficient (DPc), permeability
variation and mobility ratio are not evaluated in these studies, despite the fact that
these properties represent the roots of reservoir conformance problems.
4. Some criteria considered the same parameters commonly processed for other
EOR methods while screening of polymer gels requires the consideration of other
influential aspects like drive-fluid channeling characteristics.
5. No distinction has been recognized in the previous criteria between BG and WG
systems even though the differences in their application objectives.
6. Some studies are field application reviews that summarize design aspects in
addition to few screening parameters, which lack updated information.
7. Some screening studies comprise different combinations of polymer and
crosslinking materials and consider then as one conformance system, i.e. xanthan,
polyacrylamide and other materials.
8. Most criteria are generally biased to Wyoming oilfields and specifically to the
Rocky Mountain region and Big Horn basin fields as projects in these regions are
the sources of the data.
Evidently, there is an obvious shortage in the number and quality of screening
studies for polymer gels in comparison with other EOR technologies. The objective of
this study is to provide improved and updated applicability guidelines for three injection-
well-treating-gel technologies based on their field trials published in SPE papers and
DOE reports from 1978 to 2015. Tasks of collecting data, extracting missing values, and
detecting outliers are briefly discussed. For each parameter, we will provide project and
treatment distributions, guidelines in terms of various statistical attributes, and the

95
favorable conditions that were determined through identifying the denser property range.
Features of the new criteria will also be illustrated through extensive comparisons with
the preceding studies.
Polymer Gel Conformance Technologies
Among the many other invented technologies, polymer gels have been proven to be an
effective solution for a variety of conformance issues, especially in injection wells. They
can effectively penetrate the offending high conductive zones deep into the reservoir and
provide a sustainable diversion to subsequent injected water toward unswept, low
permeability zones. Polymer gels are usually classified according to their ingredients,
where the gelation process occurs, and the resulting gel structure. Synthetic
polyacrylamide-based gels are the most widely applied chemical conformance-
improvement system for treating injection wells (Lantz and Muniz, 2014).
Polyacrylamides can be either organically (OCAP) or metallically (MCAP) crosslinked
depending on type of the crosslinking agent used. In this paper, three partially hydrolyzed
polyacrylamide, in-situ gelling conformance systems are considered for screening
purposes.
Bulk Gels. Bulk gels (BGs) are probably the most widely applied polymer gel system for
conformance improvement purposes (Sydansk and Southwell, 2000, Lantz and Muniz,
2014). These gels can be formed using high molecular weight (8-13 million Daltons)
partially hydrolyzed polyacrylamides with a crosslinker. The high polymer
concentrations result in a continuous semi-solid 3D network structure for the gel. Bulk

96
gels provide a wide range of strengths and a wide range of controllable gelation times;
thus, they can be applied to injection or production wells for profile control or water shut-
off purposes.
This gel system has two versions depending on the type of crosslinking agent. For
MARCIT gels developed by Marathon Oil Company, polyacrylamide polymers are
crosslinked using a trivalent metal ion which is usually Chromium (III) (Sydansk and
Smith, 1988). Chromium (III)-Carboxylate/Acrylamide-Polymer (CC/AP) gels are
characterized by having robust gel chemistry in water with a wide range of water
salinities, being highly insensitive to reservoir interferences. They are also resistance to
CO2 and H2S, easy to implement in field, and cost competiveness (Southwell, 1999).
CC/AP gels are applicable over a broad reservoir temperature range; however, extensive
laboratory and field cases confirmed that they should be used in a formation temperature
of less than 220°F (Sydansk and Southwell, 2000). For high temperature applications,
medium molecular weight polyacrylamide polymers are crosslinked with an organic
agent and a stabilizer to delay the gelation process. In this study, these gels are depicted
as organically-crosslinked-polyacrylamides bulk gels (OCAP-BGs). An example of this
specialized chemistry is the UNOGEL technology developed by Union Oil Company of
California (UNOCAL) which can be applied at temperature ranges of 200 to 300 °F
(Norman et al. 2006).
Bulk gels are applied to treat strong drive-fluid channeling that typically occurs in
naturally fractured reservoirs and extremely high permeability matrix-rock reservoirs
(Smith and Larson, 1997). Bulk gels are designed to reduce water production by totally or
partially blocking the high conductive zones by reducing their permeabilities. Typical

97
injected volumes of these agents range from a few hundred to tens of thousands of
barrels; therefore, offending zones that are small in volumes relative to the size of the
reservoir are good candidates. From their state-of-the-art, bulk gels are only considered as
plugging agents, or a conformance-control strategy that works solely by correcting the
formation permeability heterogeneity.
Colloidal Dispersion Gels. Colloidal Dispersion Gels are in-situ microgels aggregates
that are formed by crosslinking of low concentrations (150 to 1200 ppm) of high-
molecular-weight (> 22 million Daltons) hydrolyzed-polyacrylamide polymer with
aluminum citrate or chromic citrate to produce a weak gel. Such low polymer
concentrations are not enough to form a continuous network, and thus, they produce a
solution of separate gel bundles that are almost spherical particles with sizes in the range
of nanometers of 50 to 150 nm (Castro et al. 2013). These gels can flow under differential
pressures that are greater than their transition pressures, as was experimentally
demonstrated by Mack and Smith (1994).
The application of CDGs is limited to injection wells and involves injection of
large volumes that are comparable to those of polymer flooding and are expressed in
terms of pore volumes as well. Sweep efficiency improvement is achieved by providing
in-depth fluid diversion due to deep gel penetration and weak strength that result in
complete or partial blocking of high-conductive zones. Mack and Smith (1997)
mentioned that based on field results, CDGs work by flooding preferred water flow paths
between injectors and producers once-through, they restrict the flow to preferential water
paths and force it to tighter rocks. This conformance technology has been widely applied

98
to heterogeneous matrix-rock sandstone reservoirs produced by waterflooding with
adverse mobility ratios.
Many studies have recently displayed CDGs as a feasible technology
fundamentally for mobility control with additional benefits of reducing the permeability
of high conductive zones (Castro et al. 2013). They have also stated that this technology
is an alternative or a modified version of the polymer flooding like some other studies
(Manrique and Lantz, 2011). Others have given equal importance to both functions of
these agents as in-depth conformance improvement and mobility control strategy
(Manrique et al. 2014). However, both groups have referred to injection of CDGs as
“floods” rather than “treatments” due to the large volumes injected in the field
applications. Furthermore, they have stated and validated the possibility of displacement
of viscous oil s by CDGs by comparing the oil responses of the first and second
treatments of a retreated injection well. It is noteworthy that in this study, we have
considered only CDG historic cases that involved the co-injection of the polymer and
crosslinker where the early sequential gel applications were eliminated.
Weak Gels. Weak gels (WGs) are a subdivision of the bulk gel systems that have been
terminologically separated to distinguish their objectives of application from those of the
original technology, i.e., BGs. Essentially, these agents are low to intermediate polymer
concentrations, weak strength bulk gels that can have the same or different mechanisms
for improving sweep efficiency depending on how and where they are applied. In
literature, several criteria have been used to characterize this gel system as illustrated by
the following points:

99
1. In the bottle testing gel strength code system (A to J) proposed by Sydansk
(1990), weak gels have Code B which refers to a highly flowing gel.
2. Han et al. (2014) have categorized a gel system as a weak gel if it has a storage
modulus (G’) less than 1 dyne/cm
2.
3. Wang et al. (2002) experimentally have showed that in order to form a weak gel,
the storage modulus should be in the range of 0.1< G’ <10 dyne/cm
2. The authors
have also noted that the minimum polymer concentration required to form a weak
gel is 2000 ppm, and the differences between storage modulus and the viscous
modulus are relatively small.
4. Liu et al. (2010) reported that weak gels have polymer concentrations between
800-2000 ppm without further illustration about the resulted gel structure.
5. Some researchers have implied that any bulk gel system (regardless of its
concentration) is a weak gel if it forms a flowing gel in the reservoir conditions
under certain ranges of pressure gradients. Sheng (2011) mentioned that weak
gels have a high resistance to flow but are still able to flow so can be injected
deep into the reservoir. Han et al. (2014) provided similar ideas and referred to
WGs and CDGs as flowing gel processes. Furthermore, Song et al. (2002) and Lu
et al. (2010) pointed out that WGs are oil-displacement agents in addition to their
function as blocking agents.
In this study, all reviewed weak gels history cases are from China where this
conformance system has been extensively applied in heavy oil, unconsolidated sandstone
reservoirs as an in-depth fluid diversion technology. However, only SPE history cases
were included in this study due to translation issues and to avoid any bias to this

100
conformance technology. It is important to mention that both metallic and organic
crosslinking agents were used to form weak gels in these cases; however, organic
crosslinkers were not used for the purposes of high temperature applications as reservoirs
temperatures in most of these cases are from 109 to 163°F.
Polymer Gels Data: Features, Problems, and Analysis
We have constructed a specialized database using the data of gel field projects published
in SPE papers and U.S. DOE reports from 1978 to 2015. Other sources have been
reviewed for the purposes of following and updating some history cases. During this
stage, concentrated attention was paid to obtain a representative sample for the
population of field applications and to avoid any biases toward particular regions or
treating agents. At the present time, the data set includes 111 field trials for the
considered technologies with over 50 parameters that include main reservoir and fluids
properties, operating parameters, and performance parameters. It is important to note that
for the reservoir and fluids characteristics, the reported values are the averages properties
of the reviewed fields. Additionally, some parameters’ estimates are time-specified, and
the provided data are their values at the times of evaluations.
We think that each gel system and conformance problem type have “definitive”
influences on the designs and responses of the gel treatments. In other words, they have
certain “fingerprints” at different stages of the process and especially on the learned
lessons. Averaging or summing the design and evaluation parameters for different
reservoir conditions or blocking agents, which is the normal situation in the published
history cases, tends to vanish these imprints as it resulted in mixed values for these

101
parameters. Some examples of these mixed data are for carbonate and sandstone
formations, bulk and microgels systems, and different oilfields. Therefore, the following
definition for the project has been adopted in order to split a case history into two or more
projects that illustrate the real behavior or performance of different agents utilized to
remedy different conformance problems. A project is any number of jobs that were
performed in or with a different field, reservoir, lithology, plugging agent, and problem
type in an injector, and this injector continued to be used for the injection process after
the remediation with polymer gels.
Gel treatment is a pattern-based process in all its aspects and stages which means
that it has two different frequencies for the projects and treatments as shown in Table 1.
This data type, (i.e., dual-frequency) greatly helps in assuring the clarity of successful
application circumstances. For a given conformance agent, we think that the projects
number reflect the variation in application conditions, while the number of treatments
indicate the success of a project in comparison to another project. Normally, projects that
show positive results at early stages will continue longer with a larger number of
treatments when compared to projects that start with unsuccessful jobs. Since validity
limits of screening criteria are based on successful projects, considering treatment
frequencies gives current guidelines an additional feature in assuring the accuracy of the
established application conditions as will be illustrated later in this paper. Sometimes
these observations presented by mentioning the number of the treatments per project
(TPP). Parameters’ intervals that have large numbers for both frequencies are considered
preferable for conformance improvement treatment and have been referred to as the most
applied ranges (MAR).

102
Table 1. Statistics of Projects and Treatments in Injection-Well Gel Field Projects
Survey (1978-2015)
Gel Technology No. of
Projects
No. of
Treatments
Treatment per
Project (TPP)
Bulk Gels 57 607 10.6
Microgels (CDGs) 44 80 2
Weak Gels 10 110 11
Total 111 797 7.2
For reservoir and fluids properties, missing data were evaluated progressively
using three different approaches. First, the relevant information of the reservoir or well
pattern of interest has been extracted from other SPE papers that deal with application of
other IOR processes for that field. Other sources also utilized for data filling purposes
like National Petroleum Council Public Database (1995), Wyoming Oil Reservoir EOR
Database (2010), Oil and Gas Journal Data Book (2006), and Oil and Gas Journal EOR
Surveys (2008). Secondly, we have examined some imputation methods such as
multivariate imputation by chained equations (MICE) package in R software (Van
Buuren and Groothius, 2009) to estimate the missing values. However, these methods
produced imputed values that are always within ranges of the observed data and have the
same gaps as shown by Figure 2 for the DPc data set. This implies that screening limits
will remain unchanged; however, imputation will increase the frequencies in certain
ranges of property values, the matter that would falsify the most applied ranges (MAR)
interval for that property. Thus, these completed data sets have been saved for further
analyses, but not for screening purposes.

103
Figure 2. Original Dykstra-Parsons coefficient (blue) and five imputed (red) data
sets using MICE package in R
Finally, we tested the possibility of using correlation methods to predict the
missing values. For some properties, good association powers were obtained such as
permeability vs. porosity (Figure 3), viscosity vs. API gravity, and mobility vs. viscosity.
However, for properties that really have low number of data points such as DPc and
water salinity, we did not obtain good association trends. Again, the predicted values did
not change screening limits for almost all desired properties; therefore, the original data
set remained unchanged to emphasize that SPE papers are a good data source.
To ensure data quality, outliers have been detected using the scatterplots as shown
in Figure 3, the interquartile range method (IQR), and the three standard deviation rules

104
(Figure 4). Scatterplots with the help of the human eye define a data point as an outlier if
it separates far away from a cloud of the points for a particular data set. The interquartile
range and standard deviation consider a point as an outlier if it lies outside the calculated
upper and lower limits explained by Figure 4.
Figure 3. Porosity and permeability crossplot for different formation types
The IQR method indicated that most data sets have potential outlier points, as
shown by Table 2. In this study, data sets were collected through careful review of each
individual history case for a long period of time, and usually using more than one
information source and reference. This allowed the authors to check the data at least two
times, the matter that built a personal confidence that the summarized data have high
quality. For the above reasons, reservoir engineering viewpoints have been adopted in
y = 0.001x4.0071 R² = 0.614
1
10
100
1000
10000
5 10 15 20 25 30 35 40
Perm
eab
ilit
y,
md
Porosity, %
Uncon. Fm
NF. Fm
Mat. Fm
IQR upper limit

105
parallel with statistician standpoints to judge possible outlier points as illustrated by the
following example.
Figure 4. Illustration of three standard deviations rule and interquartile range
method
According to the IQR method, 15 points above the upper limit line were identified
as potential outliers in the permeability data set as shown by Figure 3. After processing
the data per formation type, we found that 13 points are of unconsolidated sandstones,
which normally have higher permeability values than other formation types. Due to the
low number of data points for this formation type (14), the IQR interval was not wide
enough to include these data points. If there was enough data for unconsolidated
reservoirs, then it may have formed cloud of points around current points and extended

106
the IQR upper limit so they would have not been outliers anymore. We can easily see that
these points are on the general association trend, and their corresponding porosities are
within reservoir engineering considerations (< 48%). Several such examples were
recognized for the effects of the formation type, ongoing IOR process (steam injection),
and the applied agent in addition to the drawbacks of the detecting methods themselves.
Consequently, no data points were ruled out in this study.
Table 2. Descriptive Statistic Summary of Screening Parameters for Polymer Gel
Projects
Parameter ϕ k DPC T h D
Units % md fraction °F ft ft
Points Count 111 106 77 111 98 111
Missing Points 0 5 34 0 13 0
Mean 18.7 338.3 0.77 153.6 87.3 5891
Median 17.5 109.5 0.77 145.4 37.4 5628
St. Dev 6 539 0.09 48 120 2582
CV 0.35 1.59 0.11 0.31 1.38 0.44
Minimum 7.6 2.7 0.50 72 5 300
Maximum 36 2634 0.97 350.3 670 12500
1st quartile 15 34 0.71 122 23 4010
3rd
quartile 22 341 0.82 177 80 7875
IQR 7 307 0.11 55 57 3866
Lower Limit 3 -427 0.55 40 -63 -1789
Upper Limit 33 802 0.99 258 166 13673
# of Outliers 5 15 1 5 16 0
MAR 10-20 10-500 0.6-0.9 100-200 10-40 3000-9000

107
Table 2. Descriptive Statistic Summary of Screening Parameters for Polymer Gel
Projects (Cont’d)
Parameter μ API Salinity Mobility WC RF
Units cp degree ppm ratio % %
Points Count 101 104 61 32 78 76
Missing Points 10 7 50 39 33 35
Mean 92.8 27.2 37206 8.6 62.2 19.4
Median 11.0 25 15781 4.7 83.3 15.7
St. Dev 488 8 43965 14 39 12
CV 5.26 0.28 1.18 1.66 0.63 0.64
Minimum 0.3 11.5 150.0 0.6 0 1.6
Maximum 4800 42.5 173207 80 100 49.4
1st quartile 4 21 5496 2 12 9
3rd
quartile 28 34 67382 9 95 25
IQR 24 13 61886 8 83 16
Lower Limit -33 1 -87333 -10 -112 -16
Upper Limit 65 54 160211 21 219 49
# of Outliers 16 0 2 2 0 0
MAR 0.1-100 20-35 - 1-10 60-100 1-10
Initially, each parameter data set has been holistically analyzed (regardless of the
treating agent) using descriptive statistics to show the central and dispersion tendencies of
the data. Fifteen different statistical parameters have been evaluated for the objectives
mentioned above as shown in Table 2. In this study, the coefficient of variation (CV) has
been utilized to show data heterogeneity along with the standard deviation since the latter
is highly affected by units of the analyzed parameter. Secondly, frequency distributions
have been presented using stacked histograms, which summarize the number of projects

108
or treatments according to a particular aspect or property range as shown in Figure 5
through 18. It is important to note that all above analyses contain all data set points
regardless of the technical and economic feasibility of the projects whether they were
successful or not. Finally, based on successful field trials, technical screening criteria
limits were extracted for each gel system and presented using eight statistical parameters
to describe the validity limits of each reservoir or fluids property. It is important to note
that the project and treatment percent presented in the next sections are based on the
available data for each property not the total numbers (111and 797).
Evaluation of Polymer Gels Applicability Guidelines
Screening criteria offer a way to test the appropriateness of the proposed IOR/EOR
recovery process for a given field. They check the compatibility of injected fluids with
the reservoir rocks and fluids properties, permeability, depth, temperature, oil viscosity,
and oil saturation are usually included in the analyses. For EOR processes that target the
microscopic displacement efficiency, the above parameters are sufficient to build an
initial screening system simply because the limiting factor or the problem is the rocks
and/or fluids properties themselves. These properties are extensively measured or
estimated during different stages of the field life, and thus, they have good representative
values to be used in the screening analyses.
As a matter of fact, reservoir conformance problems have various roots and forms
that can occur everywhere in the reservoir. Linking the problem to an effective solution
requires taking into consideration all relevant factors that may affect the solution type,
design, and performance. This implies that, in addition to the parameters that have been

109
considered for other EOR technologies, evaluations of polymer gels applicability should
incorporate all parameters that depict conformance issues roots and characteristics. In this
context, Shevelev et al. (2012) have pointed out that the applicability of polymer gels,
polymer flooding, and colloidal dispersion gels depends on the problem, i.e., water
channeling and adverse mobility, and their compatibility with given reservoir conditions
like temperature, salinity, and lithology.
However, characteristics of the reservoir conformance problems are difficult to be
assessed or measured in the field with precision, and several diagnostic techniques have
been used to evaluate these characteristics along with traditional geological and reservoir
characterizations. As a consequence, evaluation of these aspects has been historically
performed qualitatively or subjectively using some related reservoir properties,
operational and testing measurements, and engineering considerations of the
conformance problems and gel technologies. Thus, for polymer gels, numeral screening
studies are not able to consider all the influential characteristics of conformance problems
due to the qualitative nature of their evaluations, which were obtained using various
diagnostic techniques.
Based on the above considerations, we have identified that 13 quantitative
parameters, 3 categorical variables, and 4 qualitative aspects of conformance problems
are required to develop an integrated selection system for conformance technologies as
shown in Table 3. In this paper, only screening parameters (quantitative and categorical)
are presented Table 6 due to the limited space. The formation type (along with lithology),
ongoing IOR/EOR process, permeability variation, mobility ratio, water cut, and recovery
factor were included in the applicability guidelines for the purpose of developing

110
comprehensive guidelines. In the next sections, we will briefly discuss important
observations about some parameters and comparisons with previous screening studies.
Furthermore, to facilitate utilization of the developed guidelines, Excel spreadsheets were
constructed that can be downloaded from the author’s Researchgate account with title of
“Polymer Gels Quick Screening Tool”.
Table 3. Summary of Screening and Matching Parameters Required for Selection of
Polymer Gel Technologies
Quantitative Parameters Qualitative Parameters
1- Reservoir properties: 1- Drive-fluid channeling:
- Reservoir Lithology - Channeling strength
- Formation type - Channeling pattern
- Porosity
- Formation permeability 2- Offending zone
- Permeability variation - Volume of channel
- Temperature - Oil saturation
- Thickness
- Depth 3- Conformance problem status
2- Fluids properties: - Undeveloped
- API oil gravity - Developed
- Oil viscosity
- Mobility ratio 4- Existence of cross-flow
- Water salinity
- Oil saturation
3- Operational aspects:
- IOR process
- Water cut
- Recovery factor

111
Reservoir Lithology and Formation Type. Figure 5 shows distributions of the project
and treatment frequencies according reservoir lithology and formation type aspects. This
figure illustrates the following valuable points:
1- Only bulk gels are applied to carbonate reservoirs, whether they are matrix-rock
formations or naturally fractured reservoirs.
2- Bulk gels were applied to all types of reservoirs and formations, more in
sandstones (40) than carbonates (17), and more in matrix-rock formations (29)
than in fractured reservoirs (20), and unconsolidated sandstones (8).
3- CDGs have been applied only in sandstone reservoirs, mainly in matrix-rock
formations, a few times in fractured reservoirs (micro-fractures), but not in
unconsolidated sandstones.
4- Weak gels have been applied only in sandstone reservoirs, mainly in
unconsolidated and matrix-rock formations, and not in fractured sandstones.
5- It is clear that CDGs and WGs exhibit fair preferences toward matrix-rock and
unconsolidated sandstones, respectively.
6- Although projects statistics show that BGs have been applied less frequently in
naturally fractured reservoirs than matrix-rock reservoirs, treatment frequencies
show that BGs have a comparable number of jobs for naturally fractured
reservoirs (276) and matrix-rock formations (273). Furthermore, BGs projects
have higher TPP in naturally fractured reservoirs (14) than in matrix-rock
formations (9). Extracting the right inference is of extreme importance in such
situations.

112
Figure 5. Distributions of (a) polymer gel projects and (b) treatments per
reservoir lithology and formation type
IOR/EOR Recovery Process. For different gel technologies, Figure 6 compares the gel
projects and treatments distributions according to the IOR/EOR recovery process, which
illustrates the following points:
3
14
26
6 8
39
5
4
6 3
14
69
11 14
Mat. NF. Mat. NF. Uncon.
Formation Type
(a) Projects
WGs
CDGs
BGs
Carbonate Sandstone
13
196
260
80 58
69
11
47
63
13
196
376
91
121
Mat. NF. Mat. NF. Uncon.
Formation Type
(b) Treatments
WGs
CDGs
BGs
Carbonate Sandstone

113
1- Polymer gels treated the channeling of only four IOR/EOR drive-fluids and more
frequently of injection water in oilfield produced by waterflooding.
2- BGs have been utilized in fields that experienced all four IOR/EOR methods, and
only OCAP-BGs have been used in fields recovered by steam injection. Also, for
CO2 floodings, only BGs have been applied.
3- Both CDGs and WGs have been applied only in reservoirs being exploited either
by waterflooding or polymer flooding.
4- Again, while projects allocations in Figure 6-a show that BGs have exhibited
more preferences towards waterfloodings than carbon dioxide floodings, the
treatment frequencies shown in Figure 6-b illustrate that a higher number of jobs
were performed in a gel project that carried out in carbon dioxide flooding than in
waterflooding where the TPPs are 17.5 and 10, respectively. This is a good
example of how the treatment statistics can correct false first impressions based
soon project distributions.
Average Reservoir Permeability. Because of data availability, the average matrix rock
permeabilities have been reported for all history cases; however, for dual porosity
reservoirs, the target of the gel treatments is the natural fractures not the matrix block of
the rocks. Therefore, the reported values are not representative in these cases. Also, Table
4 verifies that the lithology and formation types have significant effects in determining
average permeability values. Furthermore, Figure 3 shows that the porosity and
permeability applicability intervals are significantly affected by the formation type,
especially for BGs and WGs where their intervals are greatly influenced by permeability
114
values of naturally fractured and unconsolidated formations. As a result, we have
identified that utilizing different permeability data types (mixed) simultaneously would
Figure 6. Distributions of (a) polymer gel projects and (b) treatments according
to IOR/EOR process
40
4 11
2
17
27
7
3
64
34
11
2
WF PF CO2 Steam
IOR/EOR Recovery Process
(a) Projects WGs
CDGs
BGs
391
16
192
8
39
41
61
49
491
106
192
8
WF PF CO2 Steam
IOR/EOR Recovery Process
(b) Treatments WGs
CDGs
BGs

115
falsify the conditions where polymer gels were really applied and it is necessary to
analyze permeability data according to lithology and formation types. Figure 7 and
Figure 8 compare distributions of gel projects and treatment according to reservoir
matrix-rock porosity and permeability.
Table 4. Ranges of Average Permeability for Different Lithologies and Formation
Types in Gel Projects Database
Reservoir
Lithology Formation Type
Permeability, md
Minimum Maximum
Carbonate Naturally Fractured 3 62
Matrix-Rock 2.7 100
Sandstone
Naturally Fractured 10 342
Matrix-Rock 3.8 1407
Unconsolidated 500 2634
To illustrate the above observation, Table 6 and Figure 9-a compare the
composite-established-permeability criteria for gel technologies where data of all the
reservoir lithologies and formation types were analyzed together. This figure implies that
MCAP-BGs were applied in matrix-rock sandstone reservoir with an average
permeability of 1000 md. Actually, this is not correct because for this particular
combination of chemical system and reservoir formation, the maximum applied
permeability is 500 md based on the reviewed projects. However, permeability ranges are
affected by the high permeability values of unconsolidated sandstone formations which
mean that this property has a mixed data set. Thus, as mentioned earlier, reservoir

116
lithology and formation type should be considered when applicability conditions are
evaluated as shown by Figure 9-b and Table 5.
Figure 7. Porosity distributions for (a) polymer gel projects and (b) treatments
3
17 19
6 7 2 3
9
27
6 2
4
1
5 3
26
46
16
10 7
3
1-10 10-15 15-20 20-25 25-30 30-35 35-40
Porosity, %
(a) Projects WGs
CDGs
BGs
121 127
160
75 89
12 23
12
40
11
17 24
35
51
121
139
200
110
141
63
23
1-10 10-15 15-20 20-25 25-30 30-35 35-40
Porosity, %
(b) Treatments WGs
CDGs
BGs

117
Figure 8. Average permeability distributions for (a) polymer gel projects and (b)
treatments
9
21 17
3 6
1
15 20
4
1
1 7
10
37 38
8
13
1-10 10-100 100-500 500-1000 1000-3000
Average Reservoir Permeability, md
(a) Projects WGs
CDGs
BGs
161
219
164
25 37
24
41
9
4
6
98
162
247
207
40
135
1-10 10-100 100-500 500-1000 1000-3000
Average Reservoir Permeability, md
(b) Treatments WGs
CDGs
BGs

118
Figure 9. Comparison of permeability applicability ranges for polymer gels: (a)
composite systems and (b) according to reservoir lithology and formation type
3-1216
30-2500
8-850
19-2634
1 10 100 1000 10000
BG
s(M
CA
P)
BG
s(O
CA
P)
CD
Gs
WG
s
Average reservoir Permeability, md
(a)
3-62
10-193
4-500
30-294
8-850
19-1407
500-1216
1325-2500
1230-2634
1 10 100 1000 10000
Average Reservoir Permeability, md
San
dsto
ne
C
arb
on
ate
Un
co
nso
lid
ate
d
Matr
ic-r
ock
N. fr
actu
red

119
Table 5. Application Permeability Ranges of Polymer Gels Analyzed According to
Reservoir Lithology and Formation Type
Lithology Technology Formation Average Permeability, md
Min Max
Carbonate BGs Matrix-rock
2.7 100
Nat. Fractured 3 62
Sandstone
BGs
Matrix-rock
3.8 500
Nat. Fractured 10 193
Unconsolidated 500 2500
CDGs Matrix-rock
7.8 850
Nat. Fractured 23.7 342
WGs Matrix-rock 19 1407
Unconsolidated 1230 2634
* For naturally fractured reservoirs, matrix block permeabilities are provided
Permeability is probably the screening parameter that has been most affected by
experts’ opinions. Table 6 shows that BGs and CDGs have minimum averages of 3 md
and 7.8 md; however, previous EOR screening studies indicated a minimum permeability
value of 10 md or 50 md (Mack, 1978; Seright and Liang, 1994; Williams and Pitts,
1997) because some laboratory studies indicate that high-molecular-weight polymers do
not propagate very readily in less than 10 md permeability rocks to avoid the internal
pore-plugging (Zaitoun and Kohler, 1987; Seright et al. 2011). It is important to note that
the average reservoir permeability is a summary representative value that has been
evaluated using many different values over wide extensions (vertical and areal).
Therefore, the gelant had not necessarily been injected into permeabilities equal to the
average values and of course, it was injected into higher permeabilities of the highest

120
flow capacity zones. Consequently, these values were not replaced in the applicability
criteria as in the previous studies. Seright and Liang (1994) mentioned in their DOE
report that 18% of the polymer floodings were applied in less than 10 md average
permeability reservoirs.
Permeability Variation. In this study, the permeability variation has been considered in
the terms of the Dykstra-Parsons coefficient, which it is the first time in EOR screening
that this property has been evaluated in details rather than in the form of an expert
opinion such as DPc >0.6. However, this property suffers from lack of data which is clear
based on the number of missing data points (34). Interestingly, Figure 10 shows that gel
field trials are distributed over only the upper half of the DPc values range (0.5-1.0),
which implies that the permeability heterogeneity was the main cause for selecting
polymer gels to improve sweep efficiency, even for systems that address the other root of
drive-fluid channeling, (i.e., the mobility ratio). It is noteworthy that no effects have been
indicated for the reservoir lithology or formation type on the data of this property.
The ICP (Instituto Colombiano del Petroleo) developed a methodology to select
the possible solutions for improving sweep efficiency in Columbian oilfields that
presented by Castro et al. (2013) and Maya et al. (2014). In this methodology, DPc has
been introduced as a key parameter to guide the selection process where it suggests
application of CDGs if 0.55 < DPc < 0.7 and application of BGs for reservoirs with DPc
values > 0.7. Table 6 illustrates that DPc application intervals are intersected with each
other over wide intervals. This matter verifies that the selection of the appropriate treating

121
agent should not be based solely on the permeability contrast as it stated in the
aforementioned studies. The main problem with the previous statements is the existence
Figure 10. Permeability variation distributions for (a) polymer gel projects and (b)
treatments
1
6
15
6
1
9
20
8
3
1
4
1
1
11
30
23
10
0.5-0.6 0.6-0.7 0.7-0.8 0.8-0.9 0.9-1.0
Dykstra-Parsons Coefficient, fraction
(a) Projects WGs
CDGs
BGs
24
286
100
13
33
22
3
1
64 12
1 15
121
308
115
0.5-0.6 0.6-0.7 0.7-0.8 0.8-0.9 0.9-1.0
Dykstra-Parsons Coefficient, fraction
(b) Treatments WGs
CDGs
BGs

122
of a large number of CDG treatments in the range of 0.7 to 0.9 while these studies have
preserved this extent for BG applications. This generally indicates that this methodology
is a regional decision making rule that cannot be extended for other oilfields. It is
important to note that CDGs lower limit (0.5) belongs to the Big Mac field; Lantz and
North (2014) mentioned that this value is underestimated because water breakthrough
occurred in 24 months instead of 30 months as predicted by the SRAM program.
Reservoir Temperature. The temperature statistics presented in Table 2 show that gel
systems have been applied over a wide temperature range of 72-350°F with a median of
145°F. BGs have been applied over the entire temperature range through the utilization of
organic crosslinking agents. However, the project and treatment distributions shown in
Figure 11 have higher frequencies in the temperature interval of 100-200°F where 78% of
the projects and 83% of the treatments are within this interval. In comparison, high
temperature applications consist of less than 7% of the total number of gel projects.
For MCAP polymer gels, 88% of their projects have been applied in reservoir
temperatures lower than 200°F, and only nine BGs and CDGs were applied in
temperatures greater than 200°F and up to 220°F. Three of these trials are unsuccessful
treatments. These statistics may confirm a general concern reported by Seright and Liang
(1994) that most polymers may not be sufficiently stable at high temperatures. However,
in the case of unsuccessful remediation of Sooner Unit, the authors reported that in this
high temperature reservoir (220°F), bulk gels provided a reduction in injection rate and
an increment in injection pressure for the entire evaluation period of one year.

123
Figure 11. Reservoir temperature distributions for (a) polymer gel projects and (b)
treatments
Based on the successful applications, temperature ranges of BGs and CDGs are
fairly identical while WGs were applied in a narrower range that lies within BGs and
1 3 3
5
18
6 8 7 6
3
5
16 10
7
3
3 5
2
8
26 27
20
14
9
1
3 3
60-100 100-125 125-150 150-175 175-200 200-225 225-250 250-300 300-400
Temperature, °F
(a) Projects WGs
CDGs
MCAP-BGs
OCAP-BGs
1 11 14
86 106
131
87
157
14
3
17
23
15
17
5
53
34
23 89
176 188
125
174
19
1 11 14
60-100 100-125 125-150 150-175 175-200 200-225 225-250 250-300 300-400
Temperature, °F
(b) Treatments WGs
CDGs
MCAP-BGs
OCAP-BGs

124
CDGs extents. This matching is attributed to the utilization of the same base polymer in
these chemical systems, (i.e., polyacrylamides). On the other hand, employment of the
organic crosslinkers has extended application temperature of the polyacrylamide-base
bulk gels up to 350°F. It is extremely important to note that OCAP-BGs have a narrow
temperature window of 275-350°F and all unsuccessful applications are in the range of
240-265°F. This indicates a distinct, wide gap in polymer gels application temperatures
ranging from 210 to 275°F.
The discrepancies in the distributions of the gel projects and treatments in the
temperature range of 200-225°F provide another example that further illustrates the self-
checking feature of the developed guidelines. Out of 104 MCAP gels field
implementations, 9 projects were implemented in this interval, the matter that reveals a
high degree of applicability for the polymer gels in this region. However, considering that
these nine projects involved only 19 jobs out of 771 treatments indicates that this
temperature range is a critical region for polymer gels. Again, treatment frequencies
corrected the seemingly obvious indicators from the project allocations.
Average Reservoir Depth. Polymer gels are injected at pressures below the formation
parting pressures to avoid fracturing of the targeted formations. Parting pressure increases
with the reservoir depth which means that maximum injection pressure also increases. On
the other hand, injection time during a gel treatment is restricted by the gelation time;
therefore, reservoir depth affects polymer gels injectivity and injected volumes for given
gelation time, not only affects formation porosity and temperature. However, most
previous screening and surveillance studies have not included this property in their

125
evaluations of polymer gels. Again, gels projects have corresponding application ranges
for the reservoir depth; moreover, for BGs, organic crosslinkers have enabled these
agents to work in deeper formations where high temperatures are expected.
Figure 12. Reservoir depth distributions for (a) polymer gel projects and (b)
treatments
2
9
17
12 8 7
2 2
2
5 12 19
4
9 1
4
11
31
24
28
11
2
0.2-1 1-3 3-5 5-7 7-9 9-11 11-13
Depth, thousands ft
(a) Projects WGs
CDGs
BGs
62 62
116
242
100
18 7
2 8
11
29
24
6
104
6
64 70
231
271
130
24 7
0.2-1 1-3 3-5 5-7 7-9 9-11 11-13
Depth, thousands ft
(b) Treatments WGs
CDGs
BGs

126
Average Reservoir Thickness. Depending on the placement technology whether it is
bullhead or mechanically isolated, conformance agents are introduced either into the
entire reservoir net pay or only into particular zones that are a part of the reservoir
thickness. The average net pay thickness data has been reported for all case histories,
regardless of the placement method, because of data availability. For this property,
project and treatment distributions (Figure 13) show a wide range of 5-670 ft with a
median of 35 ft, and 56% of these trials are in a thickness interval of 10-50 ft. As for
previous properties, BGs projects are extended over the entire net pay ranges while CDGs
projects occupy the left side of the histogram where 92% of these frequencies are within
5 to 60 ft. This indicates that CDGs have generally been applied in thin formations
despite their large injected volumes. Manrique et al. (2014) have showed that CDGs have
been applied in average net pay ranges of 20-200 ft in their review; however; they
recommended applying CDGs in thin reservoirs with net pay thicknesses less than 40 ft.
For WGs, net pay ranges are more spread out than CDGs, yet they are still in thin
formation ranges where 86% of them are within 20 to70 ft.
Oil Viscosity. For injection wells remedies, Williams and Pitts (1997) have considered
oil viscosity as uninfluential in the performances of BGs. This is probably because these
gels are injected into the oil-swept-zones where no oil displacement by the gelant is
expected. Seright and Liang (1994) considered the oil-water viscosity ratio and assumed
endpoint permeabilities to conclude that channeling was caused more by the reservoir
heterogeneity than the mobility ratio. In contrast, CDGs and WGs evaluation studies have
given a special prominence to oil viscosity because these flood-size treating technologies

127
function as improved-permeability-reduction mobility control strategies (Castro et al.
2013; Manrique et al. 2014; Song et al. 2002; Lu et al. 2010).
Figure 13. Reservoir net pay thickness distributions for (a) polymer gel projects and
(b) treatments
10 8
12
4
10
4 3
19
13 3
3
1
3
3
1
1
30
24
18
5
14
4 3
1-25 25-50 50-75 75-100 100-300 300-500 500-700
Average Net Pay, ft
(a) Projects WGs
CDGs
BGs
30 45
167
23
185
23
105 31
21
13 5
15
43
37
8
6
76
109
217
31
196
23
105
1-25 25-50 50-75 75-100 100-300 300-500 500-700
Average Net Pay, ft
(b) Treatments WGs
CDGs
BGs

128
In this study, oil viscosity has been considered for BGs as a screening parameter
for the following possibilities: subsequent water injection will surely affect the placed
gels in the high permeability zones (load pressure). In turn, it will be influenced by oil
viscosity (fluid resistance) as it is injected into the oil saturated, low permeability zones.
Therefore, it is possible that oil viscosity somehow has some effect on how subsequent
water flooding interacts with gels in high permeability zones. We think that the effect of
the load pressure on gel pack permeability is a function of oil viscosity in the unswept,
low permeability zones.
Polymer gels projects have wide application ranges of 0.3-4800 cp with a median
of 11 cp and have mainly been injected into light oil reservoirs where 83% of the projects
and 81% of the treatment were in oil viscosity intervals of 0.3-50 cp. However, BGs have
also been applied to heavy oil reservoirs where steam flooding and CO2 flooding were
implemented to address oil viscosities. In heavy oil regions (>100 cp), BGs were the
dominant agents, then WGs with two projects, and no trials for CDGs where they were
entirely applied to light oil reservoirs 1-40 cp with median 12 cp. It is important to note
that viscosity limits are also affected by the formation type especially unconsolidated
sandstones.
Mobility Ratio. Recall that bulk gels function only as permeability-reducing materials
(plugging agents), and the other two systems function as in-depth fluid diversion
technologies. This reveals that the mobility ratio is an important screening criterion for
CDGs and WGs systems but not for BGs. However, bulk gels data were processed only
for comparison purposes. In this study, the provided values by cases histories are the

129
mobility ratios during waterflooding stages. The data set of this property (and water
salinity (Figure 16) as well) has a low number of data points where only 72 history cases
have provided this ratio as shown in Table 2. However, in 37 of these 72 field trials,
mobility ratio was qualitatively described as favorable and unfavorable.
Figure 14. Oil viscosity distributions for (a) polymer gel projects and (b) treatments
4
18 12
5 7 1
1
18 25
2 3
3 2 5
38 40
8 9
1
0.1-1 1-10 10-50 50-100 100-1000 1000-5000
Oil Viscosity, cp
(a) Projects WGs
CDGs
BGs
114
211
159
38 49
2
6
30
44
8 45
48 9
120
249 248
86
58
2
0.1-1 1-10 10-50 50-100 100-1000 1000-5000
Oil Viscosity, cp
(b) Treatments WGs
CDGs
BGs

130
Figure 15. Oil API gravity distributions for polymer gel (a) projects and (b)
treatments
Therefore, a data filling attempt has been performed by taking advantage of the
good correlation power between the mobility ratio and viscosity (R2 = 0.66); however,
the extracted application limits remain unchanged except for the lower bound of the WGs
3 5
14
6
16
7 4
1
19
9
2
6
4 3
2
3
3
9
35
15
18 16
8
10-15 15-20 20-25 25-30 30-35 35-40 40-45
API Gravity, Degree
(a) Projects WGs
CDGs
BGs
15 25
135
14
255
40
108
1
35
12
7
12
10
24
27
45
15
50
197
26
262
97
118
10-15 15-20 20-25 25-30 30-35 35-40 40-45
API Gravity, Degree
(b) Treatments WGs
CDGs
BGs

131
which reduced from 9.4 to 4. Consequently, the original data set has been not updated
with the estimated values.
Mobility ratio data are distributed over a wide range of 0.6-80 with a median of 4
and MAR of 1-5. Figure 17 indicates that all agents have been primarily applied in
adverse mobility conditions. Only four cases have mobility ratios of less than one, and
weak gels have been applied in more adverse mobility conditions than CDGs. It is
important to note that the cases in which CDGs have been applied in favorable mobility
conditions are naturally fractured reservoirs like Townsend Newcastle and East Burke
Ranch units.
Pretreatment Water Cut. We noticed that the gel systems of interest have been utilized
at different stages of the flood life. This introduces the possibility that treatment timing
affects the designs and responses of the remediation. Normally, values of the
pretreatment water cut of the offset producers are utilized to represent treatment timing in
the pattern life. For the summarized field trials, the provided water cuts are either the
composite values of all affected wells and/or patterns, or that of a representative
treatment and/or producer. The analyses shown by Figure 18 illustrate that polymer gels
have been applied over the entire WC range from zero to one, yet half of the projects for
which this parameter is provided have been performed at WC > 84% as indicated by the
median of the data set. Interestingly, BG projects are distributed only over the upper half
of the water cut range. It is obvious that the primary purpose was to reduce water
production by blocking the high conductive zones. Also, CDG and WG projects are

132
distributed over the whole parameter range which implies that these systems have been
used for multiple purposes, as preventive and reactive treatments.
Figure 16. Formation water salinity distributions for (a) polymer gel projects and
(b) treatments
1
5 5 4
3 3 4
3 3
1
3 2
6
3 2
1
1 2
1
1
7
1
9
14
10
6
5 5
4
5
2
<1 1-5 5-10 10-20 20-40 40-60 60-80 80-100 100-150 150-200
Formation Water Salinity, kppm
(a) Projects WGs
CDGs
BGs
4
77
35 37
7 7 17
58
86
4
5
17 6
3 2 1
1
3
1
12 86
4
94
138
43
10 9 18
59
89
5
<1 1-5 5-10 10-20 20-40 40-60 60-80 80-100 100-150 150-200
Formation Water Salinity, kppm
(b) Treatments WGs
CDGs
BGs

133
Figure 17. Mobility ratio distributions for (a) polymer gel projects and (b)
treatments
It is important to note that CDGs have higher projects frequencies 56% in a 0-
10% water cut interval and 19% in the 90-100% water cut interval; however, WGs have
low frequency 10% in the first interval and higher frequencies 50% in the second
1
8 4 2
12
2 1
8
4
2
18
1
2
7
3 1
16
9
6
37
Fav. 0.1-1 1-5 5-10 >10 Unfav.
Mobility Ratio, M
(a) Projects
WGs
CDGs
BGs
1
175 174
2 2
16 21
3
35
68
3 2
191
230
35
119
Fav. 0.1-1 1-5 5-10 >10 Unfav.
Mobility Ratio, M
(b) Treatments
WGs
CDGs
BGs

134
interval. It is important to note that some history cases have emphasized that the sooner
the remediation is applied, the better responses to be obtained (Manrique and Lantz,
2011; Lantz and North, 2014; Pipes and Schoeling 2014).
Flood Maturity. This criterion is used to guarantee the existence of quantifiable amounts
of the producible fluids (bypassed reserves) to be targeted by gel treatments, which are
necessary to establish the economic feasibility of gel projects. In other words, it refers to
the evaluation of the evidences of presence of moveable oil in problematic patterns to
ensure the projects’ economics. In literature, current oil saturation, recovery factor, and
the present OOIP percent (remaining reserves) have been used to infer flood maturity. In
terms of these factors, many studies have emphasized that this aspects, (i.e., flood
maturity) is the most important screening criterion (Smith and Larson, 1997; Delgadillo,
2010; Manrique et al, 2014). It is important to note that the provided values for these
parameters are the average estimates for the fields not for the targeted patterns.
Many studies have utilized the low recovery efficiency of the IOR/EOR recovery
processes as an indicator for the existence of severe heterogeneities and large amounts of
mobile oil to be targeted by gel treatments. Perez et al. (2012) mentioned that recovery
factors (primary and secondary) of less than 33% is sometimes used as a rule of thumb to
verify the availability of quantifiable mobile oil saturation. Montoya Moreno et al. (2014)
added that this criterion is frequently satisfied in the case of fracture communication
between injection and production wells.

135
Figure 18. Pre-treatment water cut distributions for (a) polymer gel projects and (b)
treatments
Regarding oil saturation, only five historic cases have estimated this property.
Studies of Lagomar (Romero et al. 2003), Dina Cretaceous (Lobo et al. 2013), and the
Loma Alta Sur (Diaz et al. 2015) fields provide good detailed presentations of the oil
2 3 3
8
20 18
2 1
2 1
2
6
1
1 1
1
1
5
19
2 2 3
6 4
11
31
0-10 10-20 20-30 30-40 40-50 50-60 60-70 70-80 80-90 90-100
Pre-Treatment Water Cut, %
(b) Treatments BGs CDGs WGs
2 3 8
116
226
24 4 1 3 1
3
31
6 8 1 4
15
76
30
4 9 3 10 9
134
333
0-10 10-20 20-30 30-40 40-50 50-60 60-70 70-80 80-90 90-100
Pre-Treatment Water Cut, %
(b) Treatments BGs CDGs WGs

136
saturation in targeted patterns using material-balance calculations and reservoir
simulation. Based on these estimations, oil saturations are in range of 0.53-0.73 for BGs
and CDGs where no data are reported for WGs. However, there is no clear distinction of
whether these saturations are in the swept zones or in the less conductive layers.
In contrast, many gel field projects 76 supplied the recovery factor for different
objectives. Figure 19 shows that polymer gels have generally been applied in floods with
less than 49% recovery factors. Although the gel projects are distributed over a wide
range of 1.6-49%, a large portion 71% of the trials is in the 5-30% interval with a median
of 15.7%. While 10% of the projects are in the recovery factor extent >40%, treatments
allocation of 22% show a high degree of applicability with a TPP of 13 and comparable
frequencies to other regions. This implies the existence of severe heterogeneities in these
cases that resulted in bypassing of large quantities of moveable oil. It highlights also the
importance of using the treatment frequencies in drawing sound inferences about the
application of gel technologies.
Individually, BG data are skewed to the right and this technology was uniquely
applied in >40% recovery factor ranges. CDG data are skewed to the left where 83% of
the trials are in less than 20% recovery intervals, the matter which reflects the early
application of this technology. WGs have few data and are distributed in the middle
recovery factor intervals.
Recognizing that subsequent injection operations will cause oil displacement and
production after gel treatment (especially for BGs and cyclic fashion of CDG and WG
applications) reveals that the applied IOR/EOR recovery process requirements should be
met to achieve the feasibility of gel projects. Also, these recovery methods have different
137
working limits for oil saturations; for example, Taber et al. (1997) showed that CO2
flooding (>20 %) can be applied at much less saturations than polymer flooding (>50%).
Figure 19. Oil recovery factor distributions for polymer gel (a) projects and (b)
treatments
2
6 9
5 8
5
14
16
5
2
1
1
2 5
16
23
15
9 8
1-5 5-10 10-20 20-30 30-40 40-50
Oil Recovery Factor, %
(a) Projects WGs
CDGs
BGs
8
106 103
29
100
6
20
22 15
8
15
12
8
6
28
143
130
45
100
1-5 5-10 10-20 20-30 30-40 40-50
Oil Recovery Factor, %
(b) Treatments WGs
CDGs
BGs

138
Therefore, we have processed recovery factor data according to the ongoing
recovery processes in the targeted fields to ensure projects economics as shown by Figure
20. Lantz (2010), Sandoval et al. (2010), Mack and Lantz (2013), and the ICP
methodology presented by Castro et al. (2013) and Maya et al. (2014) showed in their
basic decision making scheme for chemical flooding that in case of mature water floods
with high recovery factors, there is low probability of success for conformance
technologies and there is a need for a combination of sweep improvement and residual oil
saturation reduction technologies. They pointed out that in these cases; the surfactant-
based technologies (ASP/ SP) are the candidates.
Figure 20. Ranges of recovery factor at startup of gel projects categorized according
to IOR/EOR process
BGs (5-49)
BGs (8-40)
CDGs (5-32)
WGs (15-33)
CDGs(4-22)
BGs (14-25)
WGs (24-39)
0 10 20 30 40 50 60
CO
2W
FP
F
Oil Recovery Factor, %

139
Comparisons of Polymer Gels Applicability Guidelines
Generally, the most prominent feature of our screening guidelines is their
comprehensiveness of the most widely applied injection well remediation technologies,
with all the essential parameters (16) for their technical screening. Thus, they provide an
integrated identification system of the potential treating agent for the candidate injection
wells. In addition to improving the established guidelines for MCAP-BGs, CDGs, and
WGs, screening criteria for organically crosslinked bulk gels were established in this
research for the first time. We have included the permeability variability and mobility
ratio to illustrate the roots of the conformance issues; formation types and ongoing EOR
process to show differences in the application conditions and compatibility with the
drive-fluids. Water cut data were also used to point out the differences in treatment
timing among conformance agents of interest.
Additionally, as dual-frequency guidelines, the proposed criteria provide a way to
verify the appropriateness of the drawn validity limits for different properties through
examining treatment frequencies in addition to project statistics. Differences between
both statistics are of extreme importance as they correct the false indicators seen in single
distribution histograms. Also, the most favorable conditions for applying gel techniques
have been determined through identifying the denser property ranges and introducing
them as the most applied ranges to distinguish them from other ranges.
Moreover, this study has overcome some of the cons found in the preceding
studies like the biases to a certain region or gel system, considering different polymer
types, and utilization of mixed data for some parameters. This accomplished through
considering all polyacrylamide polymer-based gel projects available in the public domain

140
and processing of mixed data according to the influential aspects like formation type. The
present project review includes gels field trials from 1978 to 2015 which resulted in
updated criteria. Many experience-based limits were replaced with detailed validity
ranges of different parameters for different treating agents as it shown in the next
paragraph.
Individually, Table 7 compares present and former screening criteria of different
gel technologies. For CDGs, the present criteria have extended limits of DPc (0.9 vs. 0.7),
oil viscosity (40 vs. 30 cp), and water salinity (131 vs. 100 kppm); however, they have
lower permeability (850 vs. 4200 md) and temperature (202 vs. 210°F). While all studies
reported the same lithology, the present work indicates the application of CDGs in
naturally fractured sandstones (five cases) in addition to matrix-rock formations
(primary). Also, it is important to note that we have identified application of CDGs in
some unconsolidated sandstones in Chinese oilfields; however, they are not included in
this study. To examine if CDGs are really alternatives for polymer flooding as stated by
some studies (Castro et al. 2013), we compared the developed CDGs guidelines with
polymer flooding criteria recently published by Saleh et al. (2014) in Figure 21.
Interestingly, this figure shows that CDG guidelines are completely within polymer
flooding application conditions; this would imply that CDGs have been used instead of
polymer flooding to sweep reservoirs in which the adverse mobility ratio is accompanied
by high permeability variation. However, this comparison was not sufficient to draw a
satisfactory conclusion about these technologies because of the absence of the most
discriminant parameter in polymer flooding criteria, the reservoir heterogeneity.

1616162
141
Table 6. Summary of Quantitative Screening Parameters for Application of Polymer Gels in Injection Wells
Property ϕ k DPc T h D μ API Sal M WC RF Lithology
Formation
IOR/EOR
Process Unit % md fraction °F ft ft cp degree kppm ratio % %
MCAP-Bulk Gels
Points Count 46 45 25 46 42 46 39 44 26 10 31 26
Carbonate
Matrix-rock
Nat. Fractured
WF
PF
CO2
Mean 17.8 209 0.82 139 122 5292 53 27 36.9 11 88 27
Median 17 68 0.82 125 67 4742 10 28 20 3 94 25
St. Dev. 7 318 0.06 37 143 2471 110 7 33.5 24 14 13
CV 0.38 1.5 0.08 0.27 1.17 0.47 2.09 0.26 0.91 2.13 0.15 0.47 Sandstone
Matrix-rocks
Nat. Fractured
Unconsolidated
Min 8 3 0.65 72 8 975 1 12 0.15 1 52 5
Max 35 1216 0.91 208 670 10000 600 42 100 80 100 49.4
MAR 0.1-0.3 10-500 0.8-0.9 100-200 - - 1-260 20-35 - 1-5 70-100 20-30
OCAP-Bulk Gels
Points Count 4 4 2 4 3 4 4 4 2 2 3 2
Carbonate
Matrix-rock
WF
CO2
Steam
Mean 24.6 1037 0.81 306 247 5866 1383 20 3.8 12 84 32
Median 26 810 0.81 300 300 5027 364 19 3.8 12 83 32
St. Dev. 13 1124 0.01 32 185 5546 2301 9 1.13 3 5 9
CV 0.52 1.08 0.02 0.10 0.75 0.95 1.66 0.44 0.30 0.29 0.06 0.29
Sandstone
Matrix-rock
Unconsolidated
Min 10 30 0.80 275 42 910 3 12 3 9 80 25
Max 36 2500 0.82 350.3 400 12500 4800 31 4.6 14 90 38
MAR - - - 250-350 - - - 35-40 - - - 20-40

1616162
142
Table 6. Summary of Quantitative Screening Parameters for Application of Polymer Gels in Injection Wells (Cont’d)
Property ϕ k DPc T h D μ API Sal M WC RF Lithology
Formation
IOR/EOR
Process Unit % md fraction °F ft ft cp degree kppm ratio % %
Colloidal Dispersion Gels
Points Count 37 33 35 37 32 37 37 34 19 14 29 35
Sandstone
Matrix-rock
Nat. Fractured
WF
PF
Mean 17.4 201.23 0.74 147 39 6405 13.7 26 34.4 6 29 13
Median 16.5 142 0.74 143 26 6900 12 24 18.4 4 0.4 11
St. Dev. 3.5 204 0.09 31 42 2345 11 7 37.5 5 39 7
CV 0.20 1.01 0.12 0.21 1.06 0.37 0.78 0.26 1.09 0.85 1.31 0.59
Min 10.4 7.8 0.50 72 5 300 1 18.5 3.03 0.6 0 3.6
Max 26 850 0.90 202 200 9791 40 42.5 131.1 17 96 32
MAR 0.1-0.25 10-500 0.6-0.9 100-200 - - 1-40 20-25 - 1-10 - 5-20
Weak Gels
Points Count 10 10 6 10 9 10 10 8 8 3 10 4
Sandstone
Matrix-rock
Unconsolidated
WF
PF
Mean 27.6 1377 0.75 139 67 4497 120 25 5.6 16.5 71 28
Median 29 1439 1 147 50 4037 42 21 5.9 13 88 28
St. Dev. 5.2 819 0 20 58 1637 215 9 1.5 9 31 10
CV 0.19 0.59 0.14 0.14 0.87 0.36 1.79 0.37 0.28 0.56 0.43 0.38
Min 20 19 0.60 109 18 3051 7.8 15.4 2.12 9.4 0 15
Max 34 2634 0.91 163 213 8727 706 37.4 7 27 97.3 39
MAR - - 0.7-0.8 100-150 - - 12-75 - 5-7 - 60-100 -

1616162
143
With respect to metallic crosslinked bulk gels, detailed evaluations for
permeability variation (DPc), net thickness, depth, oil gravity, water salinity, and oil
viscosity included or replaced the experts’ opinions in the previous studies. In
comparison with the Seright and Liang projects survey, present criteria have less number
of projects (56 vs. 114), lower permeability (1216 vs. 5000 md), and narrower
temperature ranges (208 vs. 240 °F). However, their survey included 48 polyacrylamide,
29 xanthan, 10 other materials, and 27 unknown compositions gel projects. Also, no
information was provided regarding types of crosslinking agents used for projects in this
study.
Table 7. Extensive Comparison of Applicability Criteria of Two Gel Technologies
Colloidal Dispersion Gels (CDGs)
Parameter Mack
Williams &
Pitts Manrique et al. Current Study
Min Max Min Max Min Max Min Max
Survey Years 1974 1978 1994 1996 2005 2014 1976 2015
# of Projects 3 2 31 44
Publishing year 1978 1997 2014 2016
Lithology Sandstone Sandstone Sandstone Sandstone
Formation type Matrix Matrix Matrix Matrix and
Nat. Fractured
Permeability, md 10 300 50 - 10 4200 7.8 850
DPc, fraction 0.6 - - - 0.55 0.7 * 0.5 0.9
Temperature, °F - 220 - 200 80 210 72 202
Average Net Pay, ft - - NC NC 20 200 5 200
Depth, ft - - - 9000 - - 300 9791
Oil Sat. (start),% - - - - - - 53 73
Oil Viscosity, cp - - - 400 5 30 1 40
Oil Gravity, API - - 15 40 - - 18.5 42.5
Water Salinity, kppm - 100 Acceptable - - 3 131
Water Cut, % NC NC - - - - 0 96
Mobility Ratio - - - - - - 0.6 17
Oil Recover (start), % - 33 - - - - 3.6 32

144
Table 7. Extensive Comparison of Applicability Criteria of Two Gel Technologies
(Cont’d)
Metallic Crosslinked Bulk Gels (MCAP-BGs)
Parameter
Seright &
Liang
Williams &
Pitts Delgadillo
Current Study
Min Max Min Max Min Max Min Max
Survey Years 1980 1992 1990 1996 - - 1978 2015
# of Projects 114 4 - 57
Publishing year 1994 1997 2010 2016
Formation type Carbonate
Sandstone
Carbonate
Sandston
Sandstone
Carbonate
Carbonate
Sandstone
Polymer type
HPAM,
Xanthan,
Others
HPAM HPAM HPAM
Permeability, md 4.1 5000 NC NC 15 - 3 1216
DPc, fraction - - - - 0.63 - 0.65 0.91
Temperature, °F 64 240
<250 - 208 72 208
Average Net Pay, ft - - NC NC - - 8 670
Depth, ft - - - 11000 - 8000 975 10000
Oil Sat. (start),% - - - - 10 - 53 70
Oil Viscosity, cp - - NC NC - 200 1 600
Oil Gravity, API - - NC NC 18 - 12 42
Water Salinity, kppm - - Acceptable - 70 0.15 100
Water Cut, % 9 99.4 - - - - 52 100
Oil Recover (start), % 1.1 73 - - - - 5 49
* From Castro et al. (2013).
Remarkably, Figure 22 shows that the applicability criteria of gel systems are
quite different and frequently intersected with each other over wide intervals. This
implies that these systems provide solutions for a wide variety of conformance problems,
and for a given situation, there is a possibility that more than one treating agent is the
potential technology. To demonstrate that, we have considered three dual-agent history
cases of Ash Minnelusa, El Tordillo, and North Rainbow fields. For example, in El
Tordillo field two injection patterns were successively treated with BGs and CDGs to
obtain more uniform distribution of injection water. Interestingly, the new guidelines

145
have correctly predicted the applicable gel systems for three dual-agent history cases as
shown by Figure 23 for the Ash Minnelusa unit. It is noteworthy that Muruaga et al.
(2008) have pointed out that El Tordillo field and many waterfloods exhibit two types of
heterogeneities.
Figure 21. Comparison of applicability guidelines of CDGs and polymer flooding
(Saleh et al. 2014)
unappreciated
0-99
0.5-175
12-48
0.3-130
550-9400
65-210
0.6-5500
4-36
Carb & Sand
0-96
3-131
18-42
1-40
300-9791
72-202
0.5-0.9
8-850
10-26
Sandstone
0.1 1 10 100 1000 10000
Water Cut, %
Salinity, kppm
API Gravity
Oil Viscosity, cp
Depth, ft
Temperature, F
DPc, fraction
Permeability, md
Porosity, %
Formation Type
Polymer Flooding
CDGs
146
Figure 22. Comparison of developed screening criteria for gel technologies
15-39
0-97
9-27
2-7
15-37
8-706
3050-8700
18-213
109-163
0.6-0.91
19-2600
20-34
4-32
0-96
0.6-17
3-131
18-42
1-40
300-9700
5-200
72-202
0.5-0.9
8-850
10-26
25-38
80-90
9-14
3-4.6
12-31
3-4800
910-12500
42-400
275-350
0.8-0.82
30-2500
10-36
5-49
52-100
1-80
0.1-100
12-42
1-600
975-10000
8-670
72-208
0.65-0.91
3-1216
8-35
0.1 1 10 100 1000 10000
%Recovery Factor
Water cut, %
Mobility Ratio
Salinity, kppm
API Gravity
cpOil Viscosity
Depth, ft
Net Pay, ft
Temperature, F.
DPc, fraction
mdPermeability
Porosity, %
WGs
CDGs
OCAP-BGs
MCAP-BGs
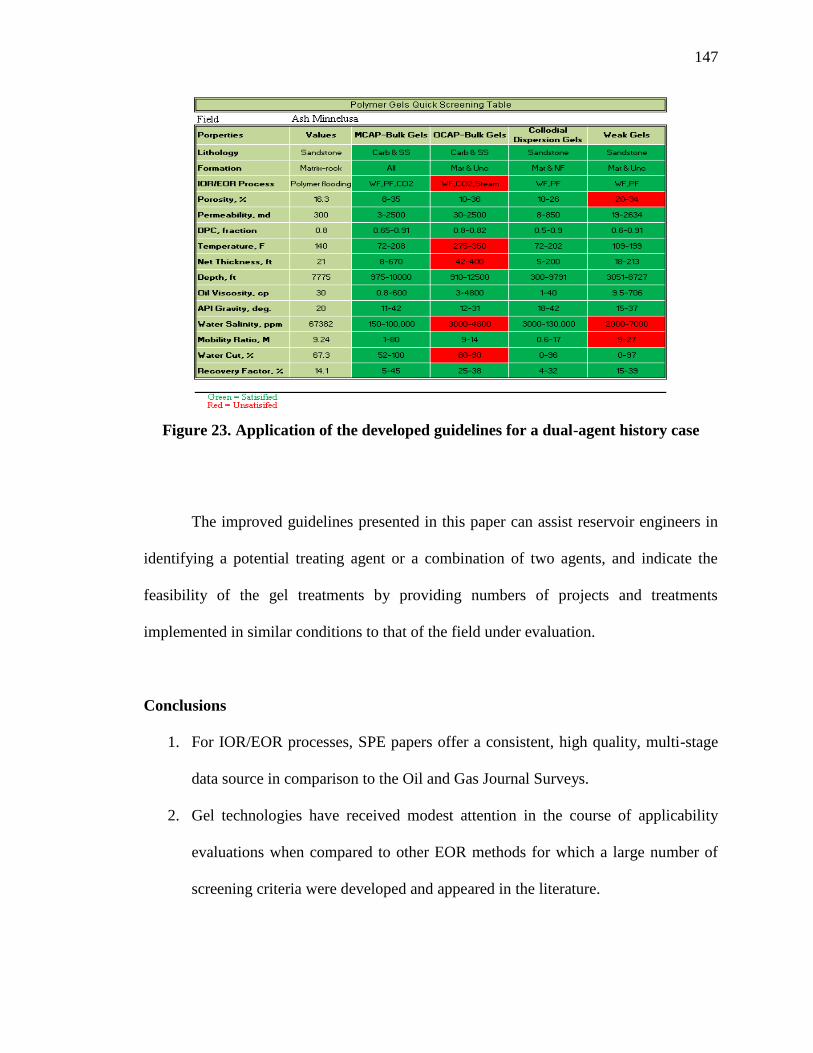
147
Figure 23. Application of the developed guidelines for a dual-agent history case
The improved guidelines presented in this paper can assist reservoir engineers in
identifying a potential treating agent or a combination of two agents, and indicate the
feasibility of the gel treatments by providing numbers of projects and treatments
implemented in similar conditions to that of the field under evaluation.
Conclusions
1. For IOR/EOR processes, SPE papers offer a consistent, high quality, multi-stage
data source in comparison to the Oil and Gas Journal Surveys.
2. Gel technologies have received modest attention in the course of applicability
evaluations when compared to other EOR methods for which a large number of
screening criteria were developed and appeared in the literature.

148
3. In IOR/EOR world, data cleaning process should strengthen the statistical
approaches by the reservoir engineering viewpoints and the possibility of the
existence of special cases. This is extremely important as there are many factors
that may affect these data such as the formation type and the ongoing EOR
process.
4. Imputation methods that maintain the original variability of the incomplete data
sets do not influence the validity limits of the technical guidelines; however, they
should be avoided if MAR statistics are favorable.
5. The screening parameters considered for common EOR processes are not enough
to capture the whole picture of the conformance problems and to develop a
consolidated evaluation scheme for polymer gels.
6. The lithology and formation type have significant effects on the applicability
limits of some reservoir properties such as porosity, permeability, depth, and oil
viscosity.
7. For naturally fractured systems, it is extremely important to recognize whether the
reported permeability values are for the matrix-rock block or the natural fractures.
If there are of matrix-rock, then these values are mixed data.
8. For screening purposes, mixed data sets should be analyzed according to the
affecting aspects such as formation type and IOR/EOR process. Otherwise, they
will falsify where polymer gels have actually been applied.
9. Permeability variation is the main cause of selecting polymer gels despite the fact
that some systems have the ability to address other water production problem

149
root. Also, selecting the appropriate treating agent should not depend solely on
one property, such as permeability variation.
10. Improved, updated applicability guidelines were developed for polymer gels that
are extended in terms of screening parameters and statistical attributes. They also
include three operational aspects in addition to reservoir and fluids characteristics.
11. In the present guidelines, for the first time, permeability variation and mobility
ratio have been considered and elaborately evaluated rather than introduced as
experts’ opinions.
12. The developed guidelines facilitate multiple screening of different treating agents
which is crucial when reservoirs have different heterogeneities.
13. The novelty of the developed guidelines is in their ability to self-checking the
established application conditions as a result of inclusion and simultaneous
assessment of the project and treatment frequencies.
14. Gels systems provide solutions for a wide variety of conformance problems. For a
given situation, there is a possibility that more than one agent is the candidate, and
the selection depends on the objectives and purposes of the remediation among
other factors.
Nomenclature
BGs = Bulk Gels
CDGs = Colloidal Dispersion Gels
CO2 = Carbon-dioxide flooding
CV = Coefficient of variation
D = Reservoir depth, ft
150
DPc = Dykstra-Parsons coefficient, fraction
h = Average net pay thickness, ft
k = Permeability, md
MAR = Most applied range
Mat. = Matrix-rock
NC = Not critical
NF. = Naturally fractured reservoirs
St. Dev = Standard Deviation
Q1 = First quartile
Q3 = Third quartile
IQR = Interquartile range
PF = Polymer flooding
Steam = Steam injection
T = Temperature, °F
TPP = Treatment per project
Uncon. = Unconsolidated formation
WC = Water cut, %
WF = Waterflooding
WGs = Weak Gels
ϕ = Porosity, %
μ = Oil viscosity, cp
Acknowledgement
The author would like to thank the Higher Committee for Educational Development
(HCED) in Iraq for granting him a PhD scholarship and financial support.
References
Alvarado, V., and Manrique, E. 2010. Enhanced Oil Recovery: Field Planning and
Development Strategies, Elsevier Inc., Oxford.

151
Cammon, Terry J.: “Polymer Treatments for D Sand Water Injection Wells, Weld
County, Colorado,” Final Report (U.S. DOE report DOE/PC/91008-11), U.S. DOE
Contract DE-AC22-94PC91008, (Oct. 1998).
Castro, R., Maya, G., Sandoval, J. et al. 2013. Colloidal Dispersion Gels (CDG) to
Improve Volumetric Sweep Efficiency in Waterflooding Processes. CT&F - Ciencia,
Tecnología y Futuro, 5 (3): 61-78.
Crespo, F., Reddy, B. R., Eoff, L., Lewis, C., & Pascarella, N. (2014, January 19).
Development of a Polymer Gel System for Improved Sweep Efficiency and Injection
Profile Modification of IOR/EOR Treatments. International Petroleum Technology
Conference. http://dx.doi.org/10.2523/IPTC-17226-MS.
Delgadillo, C., 2010. Evaluación de la viabilidad técnica de implementación de procesos
de inyección de geles, Master Thesis, Universidad Industrial de Santander, Colombia.
Diaz, D., Saez, N., Cabrera, M., Manrique, E., Romero, J., Kazempour, M., & Aye, N.
(2015, August 11). CDG in a Heterogeneous Fluvial Reservoir in Argentina: Pilot and
Field Expansion Evaluation. Society of Petroleum Engineers.
http://dx.doi.org/10.2118/174704-MS.
El-karsani, K. S. M., Al-Muntasheri, G. A., & Hussein, I. A. (2014, February 1). Polymer
Systems for Water Shutoff and Profile Modification: A Review Over the Last
Decade. Society of Petroleum Engineers. http://dx.doi.org/10.2118/163100-PA.
Han, M., Alshehri, A. J., Krinis, D., & Lyngra, S. (2014, April 21). State-of-the-Art of In-
Depth Fluid Diversion Technology: Enhancing Reservoir Oil Recovery by Gel
Treatments. Society of Petroleum Engineers. http://dx.doi.org/10.2118/172186-MS.
Jaripatke, O. A., & Dalrymple, E. D. (2010, January 1). Water-Control Management
Technologies: A Review of Successful Chemical Technologies in the Last Two
Decades. Society of Petroleum Engineers. http://dx.doi.org/10.2118/127806-MS.
Lantz, M. (September, 2010). Improved Oil Recovery Technologies for the Illinois Basin,
September 2010. http://www.inoga.org/archive/2010/OilRecovery-MikeLantz.pdf.
Lantz, M., & Muniz, G. (2014, April 12). Conformance Improvement Using Polymer
Gels: A Case Study Approach. Society of Petroleum Engineers.
http://dx.doi.org/10.2118/169072-MS.
Lantz, M., and North, W. (2014). Polymer Flooding in the Minnelusa, 2014 Minnelusa
Workshop, University of Wyoming, Gillette, WY.
Liu, Y., Bai, B., & Shuler, P. J. (2006, January 1). Application and Development of
Chemical-Based Conformance Control Treatments in China Oilfields. Society of
Petroleum Engineers. http://dx.doi.org/10.2118/99641-MS.

152
Liu, Y., Bai, B., & Wang, Y. (2010). Applied Technologies and Prospects of
Conformance Control Treatments in China. Oil & Gas Science and Technology –
Rev, IFP Energies nouvelles, 65(6), 859-878. http://dx.doi.org/10.2516/ogst/2009057.
Lobo, A., Romero, J. L., Leon Hinestrosa, J. M., Perdomo, L. C., Sandoval, J., Cabrera,
F. A., … Villadiego, D. O. (2013, July 2). Colloidal Dispersion Gels (CDG) in Dina
Cretaceos Field: From Pilot Design to Field Implementation and Performance.
Society of Petroleum Engineers. http://dx.doi.org/10.2118/165273-MS.
Lu, X., Wang, W., Wang, R., Liu, Y., & Shan, J. (2010, January 1). The Performance
Characteristics of Cr3+ Polymer Gel and Its Application Analysis in Bohai Oilfield.
Society of Petroleum Engineers. http://dx.doi.org/10.2118/130382-MS.
Mack, J. C. (1978, January 1). Improved Oil Recovery - Product To Process. Society of
Petroleum Engineers. http://dx.doi.org/10.2118/7179-MS.
Mack, J. C., and Lantz, M. (2013). Historic IOR/EOR practices in the Minnelusa. EORI
Minnelusa Workshop, Gillette, WY.
Mack, J. C., & Smith, J. E. (1994, January 1). In-Depth Colloidal Dispersion Gels
Improve Oil Recovery Efficiency. Society of Petroleum Engineers.
http://dx.doi.org/10.2118/27780-MS.
Mack, J. C., & Smith, J. E. 1997. Colloidal Dispersion Gel for Improving Volumetric
Sweep in Waterfloods-Case Histories, Innovative Applications of Petroleum
Technology Guidebook-1997, Rocky Mountain Association of Geologists, P241-248,
Denver, CO.
Manrique, E., and Lantz, M. (2011). Colloidal Dispersion Gels (CDG) and Their
Application in Wyoming and Elsewhere. The 3rd Annual Wyoming IOR/EOR
Conference, Jackson Hole, WY.
Manrique, E., Reyes, S., Romero, J., Aye, N., Kiani, M., North, W., Norman, C. (2014,
March 31). Colloidal Dispersion Gels (CDG): Field Projects Review. Society of
Petroleum Engineers. http://dx.doi.org/10.2118/169705-MS.
Maya, G. A., Castro, R. H., Sandoval, J., Pachon, Z., Jimenez, R., Pinto, K. T., and
Munoz, S. F. (2014, May 21). Successful Polymer Gels Application in a Highly
Channeled Peripheral Injection Well: Tello Field Pilot. Society of Petroleum
Engineers. http://dx.doi.org/10.2118/169478-MS.
Montoya Moreno, J. M., Sandoval, R., Vargas, A., Cabrera, F. C., Romero, J. L., &
Muniz, G. (2014, April 12). Improving Sweep Efficiency In An Underpressured
Naturally Fractured Reservoir. Society of Petroleum Engineers.
http://dx.doi.org/10.2118/169091-MS.

153
Muruaga, E., Flores, M. V., Norman, C., & Romero, J. L. (2008, January 1). Combining
Bulk Gels and Colloidal Dispersion Gels for Improved Volumetric Sweep Efficiency
in a Mature Waterflood. Society of Petroleum Engineers.
http://dx.doi.org/10.2118/113334-MS.
National Energy Technology Laboratory (NETL), U.S. Department of Energy. 1995.
National Petroleum Council (NPC) Public Database,
http://www.netl.doe.gov/research/oil-and-gas/software/databases.
Norman, C., Turner, B. O., Romero, J. L., Centeno, G. A., & Muruaga, E. (2006, January
1). A Review Of Over 100 Polymer Gel Injection Well Conformance Treatments In
Argentina And Venezuela: Design, Field Implementation and Evaluation. Society of
Petroleum Engineers. http://dx.doi.org/10.2118/101781-MS.
Perez, D. M., Munoz, L. F., Acosta, W., Falla, J., Martinez, J., Vidal, G., Norman, C.
(2012, January 1). Improving Sweep Efficiency In A Mature Waterflood; Balcon
Field, Colombia. Society of Petroleum Engineers. http://dx.doi.org/10.2118/150955-
MS.
Pipes, J. W., & Schoeling, L. G. (2014, April 12). Performance Review of Gel Polymer
Treatments in a Miscible CO2 Enhanced Recovery Project, SACROC Unit Kelly-
Snyder Field. Society of Petroleum Engineers. http://dx.doi.org/10.2118/169176-MS.
Reynolds, R. R., and Kiker, R. D. (2003). Produced Water and Associated Issues. A
manual for independent operator. Petroleum Technology Transfer Council, Tulsa.
Romero, C., Marin, A. B., Candiales, L. E., Mejias, O. J., Romero, E. J., Angulo, R. J.,
Norman, C. (2003, January 1). Non-Selective Placement of a Polymer Gel Treatment
to Improve Water Injection Profile and Sweep Efficiency in the Lagomar Field,
Venezuela. Society of Petroleum Engineers. http://dx.doi.org/10.2118/80201-MS.
Saleh, L. D., Wei, M., & Bai, B. (2014, February 1). Data Analysis and Updated
Screening Criteria for Polymer Flooding Based on Oilfield Data. Society of
Petroleum Engineers. http://dx.doi.org/10.2118/168220-PA.
Sandoval, J. R., Manrique, E. J., Perez, H. H., Maya, G. A., Romero, J. L., Castro Garcia,
R. H., … Villadiego, D. (2010, January 1). Dina Cretaceo Field Chemical EOR: From
Screening to Pilot Design. Society of Petroleum Engineers.
http://dx.doi.org/10.2118/139200-MS.
Seright, R.S. (1993). Improved Techniques for Fluid Diversion in Oil Recovery, first
annual report, DOE/BC/14880-5, U.S. DOE.
Seright, R. S., 2007. Are Colloidal Dispersion Gels Really a Viable Technology? New
Mexico Petroleum Recovery Research Center, http://baervan.nmt.edu/randy.
Seright, R. S., 2015. Colloidal Dispersion Gels—A Literature Review. New Mexico
Petroleum Recovery Research Center, http://baervan.nmt.edu/groups/res-sweep/.

154
Seright, R. S., Lane, R. H., & Sydansk, R. D. (2001, January 1). A Strategy for Attacking
Excess Water Production. Society of Petroleum Engineers.
http://dx.doi.org/10.2118/70067-MS.
Seright, R.S. and Liang, J. 1994. A Survey of Field Applications of Gel Treatments for
Water Shutoff. Presented at the SPE III Latin American & Caribbean Petroleum
Engineering Conference, Buenos Aires, Argentina, April 27-29. SPE 26991-MS.
http://dx.doi.org/10.2118/26991-MS.
Seright, R. S., Fan, T., Wavrik, K., & Balaban, R. de C. (2011, March 1). New Insights
Into Polymer Rheology in Porous Media. Society of Petroleum Engineers.
http://dx.doi.org/10.2118/129200-PA.
Sheng, J.J. 2011. Modern Chemical Enhanced Oil Recovery: Theory and Practice,
Elsevier, Burlington, MA.
Shevelev, P., Manrique, E. J., Aye, N. M., Romero, J. L., Salehi, M., & Garmeh, G.
(2012, January 1). In-depth Sweep Efficiency Improvement: Screening Criteria and
Engineering Approach for Pattern Evaluation and Potential Field Implementation.
Society of Petroleum Engineers. http://dx.doi.org/10.2118/160749-MS.
Smith, J. and Larson, D. 1997. Bulk Gel Treatments for Water Control, Innovative
Applications of Petroleum Technology Guidebook-1997, Rocky Mountain
Association of Geologists, P249-258, Denver, CO.
Soliman, M. Y., Rester, S., Sigal, R., Everett, D., & Johnson, M. H. (2000, January 1).
Integration of Technology Supports Preventive Conformance Reservoir Techniques.
Society of Petroleum Engineers. http://dx.doi.org/10.2118/62553-MS.
Song, W., Zeng, X., Yao, H., Li, J., Lv, X., Tian, Y., & Guo, Y. (2002, January 1).
Application of a New Crosslinked Polymer Displacement Technology at Bo-19 Block
in Gudao Oilfield. Society of Petroleum Engineers. http://dx.doi.org/10.2118/77797-
MS.
Southwell, G.P. 1999. Marathon Oil Company’s Experience with Produced Water
Control and Conformance Improvement Using Polymer Gels. Proc., In Forty-Sixth
Annual Southwestern Petroleum Short Course, Texas Tech U., Lubbock, Texas,
April, 353–365.
Sydansk, R. D., & Smith, T. B. (1988, January 1). Field Testing of a New Conformance-
Improvement-Treatment Chromium (III) Gel Technology. Society of Petroleum
Engineers. http://dx.doi.org/10.2118/17383-MS.
Sydansk, R.D. and Southwell, G.P. 2000. More Than 12 Years of Experience with a
Successful Conformance-Control Polymer Gel Technology. SPE Prod & Fac. 15 (4):
270. SPE-66558-PA. http://dx.doi.org/10.2118/66558-PA.

155
Taber, J. J., Martin, F. D., & Seright, R. S. (1997, August 1). EOR Screening Criteria
Revisited - Part 1: Introduction to Screening Criteria and Enhanced Recovery Field
Projects. Society of Petroleum Engineers. http://dx.doi.org/10.2118/35385-PA.
Tomado de Delgadillo, C., et al. (2010). Evaluacion de la Viabilidad Tecnica de
Implementacion de Procesos de Inyeccion de Geles. Universidad Industrial de
Santander, Colombia.
Van Buuren, S., and Groothius-Oudshoorn, K. 2009, MICE: Multiple Imputation by
Chained Equations in R. Journal of Statistical Software vol. 45, issue 3.
Wang, W., Gu, Y., & Liu, Y. (2002, January 1). Applications of Weak Gel for In-Depth
Profile Modification and Oil Displacement. Petroleum Society of Canada.
http://dx.doi.org/10.2118/2002-168.
Williams, E. T., and Pitts, M. 1997. Applications of Enhanced Oil Recovery in the Rocky
Mountain Region, Innovative Applications of Petroleum Technology Guidebook-
1997, Rocky Mountain Association of Geologists, P225-240, Denver, CO.
Wyoming EOR Reservoir Database. 2010. University of Wyoming, Enhanced Oil
Recovery Institute, accessed 1/19/2011, at
http://www.uwyo.edu/eori/_files/eori_database/wyoming EOR Database
_100215v2.1.xls.
Zaitoun, A., & Kohler, N. (1987, January 1). The Role of Adsorption in Polymer
Propagation Through Reservoir Rocks. Society of Petroleum Engineers.
http://dx.doi.org/10.2118/16274-MS.

156
II. A Roadmap to Successfully Select a Proper Gel Treatment Technology
Munqith Aldhaheri, Mingzhen Wei, Baojun Bai, and Mortadha Alsaba
Missouri University of Science and Technology
(SPE-182795-MS Published in SPE Kingdom of Saudi Arabia Technical Symposium and
Exhibition, Dammam, Saudi Arabia, April 2016)
Abstract
Polymer gels have been effectively applied to extend the productive life of mature
oilfields by mitigating water production and enabling the recovery of bypassed oil
reserves. A key component for a successful conformance improvement treatment is the
identification of the most appropriate gel technology for a targeted reservoir. Gel projects
are capital sensitive and involve high degree of risk; therefore, it is crucial to select a
proper gel technology and provide an optimized design project.
This paper presents the first generalized comprehensive selection system for
injection well gel technologies based on the comparative analyses of the characteristics of
conformance problems in gel field projects. 111 field trials of three in-situ gel systems
including bulk gels, colloidal dispersion gels, and weak gels were summarized from 1978
to 2015. First, reservoir/fluids characteristics, diagnosis indicators used in the evaluation
of drive-fluid channeling strength, and treatment operational parameters were
summarized. Then, problem zone volumes were estimated using a design rule of thumb
and the problem development status was indicated using some production-related

157
parameters. Finally, all characteristics of conformance problems were compared for
different gel systems to identify factors implicitly used in the nomination of gel
technologies in the field projects.
We recognized that gel selection process starts by matching characteristics of
conformance problems with technical specifications and mechanisms of the gel systems.
Then, the initial candidate technology is confirmed by screening criteria to ensure gel
system compatibilities with reservoir and injected fluids. We identified that the most
influential characteristics in the selection process are drive-fluid channeling strength,
volume of problem zone, problem development status, existence of cross-flow, and the
nature of the required solution whether it depends on gel strength or volume. It was
recognized that the existence of crossflow or high oil saturation in the offending zones
turns a limited conformance problem into a large volume issue that needs the application
of the flood-size treating technologies. For these situations, current oil saturation in the
problem zones is the key factor rather than oil saturation in the less conductive zones
because it is guaranteed by the high reservoir permeability heterogeneities. In addition,
the problem development status does not only affect the selection of a gel system, but
also its design parameters such as polymer concentration. The novelty of the new gel
selection system is in its utilization of standardized general parameters and provision of
distinct parameter cut-offs for each gel technology.
Introduction
Excessive water production represents a major industry challenge because of its serious
economic and environmental impacts. The problem of producing and disposing of large

158
quantities of injection water is becoming more crucial due to the tightening economic
constraints caused by the falling oil prices. Gel technologies have been proven to be
effective in addressing this problem and in increasing oil recovery. However, selecting a
proper gel technology is not an easy task for the oilfield engineers due to many reasons.
The costly diagnosis techniques required to evaluate conformance issues make gel
selection process extremely important in these capital sensitive gel projects.
Conformance problems encompass a broad range of issues that may exist
anywhere from the wellbore to deeply in the reservoir. In particular, reservoir
conformance issues have many types as their main root (permeability spatial variation)
occurs in various forms and directions. Polymer gels also have a wide range of forms and
chemistries that function by different mechanisms to improve the sweep efficiency of an
enhanced oil recovery (EOR) process. Moreover, the selection process is further
complicated by the fact that the treatment of a specific conformance issue requires a
distinct gel technology.
Additionally, characteristics of conformance issues are qualitatively evaluated
using several diagnosing techniques along with the traditional geological and reservoir
characterization. The nature of this evaluation has made the selection process to be
nominally performed using the problem type or description. This judgmental approach
has resulted in the emergence of many diverging opinions about the applicability of
polymer gels (Chou et al. 1994). There have been more qualitative problem descriptions
and terminologies than the conformance problems themselves. In addition, this evaluation
has resulted in a difficulty in the recognition of distinctive channeling severity limits for
gel systems. Consequently, conformance problems in all reviewed case histories were

159
characterized as strong channeling issues. On the other hand, the choice of the gel
technologies has been solely based on the drive-fluid channeling strength in field
applications while it involves other important factors as will illustrate in the next sections.
Several studies have focused on the classification and connection of conformance
problems and solutions in general (Azari and Soliman, 1996; Seright et al. 2001; Smith,
2006; Joseph and Ajienka, 2010). For gel technologies, a number of qualitative selection
matrices or candidate selection criteria have been published mainly for bulk gels based on
the Permian and Powder River Basins’ experiences. These studies have ultimately
concentrated on distinguishing of the channeling strength whether it is fracture-type or
matrix-type using numerous problem descriptions and on the sizing of the bulk gel
treatments. In addition, flood-size treating technologies have been rarely taken into
consideration in these studies where only Sydansk (2007) pointed out to such
conformance agents.
Sydansk and Southwell (2000) provided a list of the conformance problems that
can be treated by Chromium (III)-Carboxylate/Acrylamide-Polymer (CC/AP) gels. They
have illustrated that there are two problem key distinctions that must be made in order to
identify the appropriate gel system. First, a conformance problem should be differentiated
whether it is a vertical or an areal issue and whether there is fluid crossflow between
geological strata or not. The second key distinction is whether the high conductive zone
is simple high permeability unfractured matrix rock or it is a high permeability anomaly
such as fractures. Later, their work has been translated into the following well-known
rule of thumb for gel technology selection. This rule states that bulk gels are designed to
reduce water channeling in extreme heterogeneities like naturally fractured formations or

160
in reservoirs with multi-Darcy permeability anomalies. For unfractured, low permeability
matrix-rock reservoirs, sweep efficiency can be improved by large volume colloidal
dispersion gel (CDG) treatments (Al-Dhafeeri et al. 2005; Norman et al. 2006; Muruaga
et al. 2008; Diaz et al. 2008). It is noteworthy that they justified the utilization of the
CDGs by the presence of crossflow between reservoir layers.
Seright et al. (2001) classified water production problems into four categories
based on the conformance treatment type and ranked them in term of the remediation
difficulty. They also proposed a diagnostic strategy to decide whether the flow around the
wellbore is radial or linear; however, only treatment-size technologies have been
considered in this study with respect to polymer gels. Reynolds and Kiker (2003)
suggested the injection of CDGs at the inception of waterflooding if analogous floods
suggests a premature water breakthrough or Dykstra-Parsons coefficient is greater than
0.6. They proposed the injection of BGs after waterflooding initiation if water channeling
is through fractures or high permeability streaks. Liu et al. (2006) presented conformance
problems in Chinese oilfields, and connected them with a variety of treating agents based
on the type of the conformance treatment. They have considered BGs, CDGs, WGs and
performed-particle gels in their study, and provided a comprehensive decision-making
strategy for the candidate well selection. Smith (2006) presented a Comprehensive
Conformance Problem Matrix that classifies issues into wellbore versus far-wellbore
problems and high flow conduit versus permeable rock problems based on the severity of
the drive-fluid channeling as shown in Figure 1. Most recently, Lantz and Muniz (2014)
developed a Polymer Gel Injection Wells Conformance Improvements Matrix with

161
horizontal and vertical axes that display polymer concentrations and gel volumes as a
designing tool.
Figure 1. Comprehensive Conformance Problem Matrix (after Smith and Ott, 2006)
This study focuses on identifying the influential parameters in the gel technology
identification process and the relationships between these parameters. It aims to develop
a holistic selection scheme that is based on generalized parameters rather than subjective
descriptions using the field applications of bulk gels, colloidal dispersion gels, and weak
gels in injection wells. In this paper, field evaluation results of drive-fluid channeling and
the estimations of two characteristics of conformance issues are presented. For each

162
characteristic, the comparative analyses performed to identify key distinctions between
gels technologies will briefly discussed. A new problem classification is presented and
the characteristics of conformance issues that are treatable by each gel technology are
provided and visualized by a roadmap and a selection matrix.
Polymer Gel Conformance Technologies
Polymer gels have been proven to be effective solutions for a variety of conformance
issues, especially in injection wells. They can effectively penetrate the offending high
conductive zones deep into the reservoir and provide a sustainable diversion to
subsequent injected water toward the low permeability zones. Polymer gels are usually
classified based on their ingredients, where the gelation process occurs, and the resulting
gel structure. Synthetic polyacrylamide-based gels are the most widely applied chemical
conformance-improvement system for treating injection wells (Lantz and Muniz, 2014).
Polyacrylamides can be either organically (OCAP) or metallically (MCAP) crosslinked
depending on type of the crosslinking agent used. In this paper, three partially hydrolyzed
polyacrylamide, in-situ gelling conformance systems are considered for screening
purposes.
Bulk Gels. Bulk gels (BGs) are probably the most widely applied polymer gel system for
conformance improvement purposes (Sydansk and Southwell, 2000, Lantz and Muniz,
2014). These gels can be formed using high molecular weight (8-13 million daltons)
partially hydrolyzed polyacrylamides with a crosslinker. The high polymer
concentrations result in a continuous semi-solid 3D network structure for the gel. Bulk
163
gels provide a wide range of strengths and a wide range of controllable gelation times;
thus, they can be applied to injection or production wells for profile control or water shut-
off purposes.
This gel system has two versions depending on the type of crosslinking agent. For
MARCITSM
gels developed by Marathon Oil Company, polyacrylamide polymers are
crosslinked using a trivalent metal ion which is usually Chromium (III) (Sydansk and
Smith 1988). Chromium (III)-Carboxylate/Acrylamide-Polymer (CC/AP) gels are
characterized by having robust gel chemistry in water with a wide range of water
salinities, being highly insensitive to reservoir interferences. They are resistance to CO2
and H2S, easy to implement in field, and cost competiveness (Southwell, 1999). CC/AP
gels are applicable over a broad reservoir temperature range; however, extensive
laboratory and field cases confirmed that they should be used in a formation temperature
of less than 220°F (Sydansk and Southwell 2000). For high temperature applications,
medium molecular weight polyacrylamide polymers are crosslinked with an organic
agent and a stabilizer to delay the gelation process. In this study, these gels are depicted
as organically-crosslinked-polyacrylamides bulk gels (OCAP-BGs). An example of this
specialized chemistry is the UNOGEL technology developed by Union Oil Company of
California (UNOCAL) which can be applied at temperature ranges of 200 to 300 °F
(Norman et al. 2006).
Bulk gels are applied to treat strong drive-fluid channeling that typically occurs in
naturally fractured reservoirs and extremely high permeability matrix-rock reservoirs
(Smith and Larson 1997). Bulk gels are designed to reduce water production by totally or
partially blocking the high conductive zones by reducing their permeabilities. Typical

164
injected volumes of these agents range from a few hundred to tens of thousands of
barrels; therefore, offending zones that are small in volumes relative to the size of the
reservoir are good candidates. From their state-of-the-art, bulk gels are only considered as
plugging agents, or a conformance-control strategy that works solely by correcting the
formation permeability heterogeneity.
Colloidal Dispersion Gels. Colloidal Dispersion Gels are in-situ microgels aggregates
that are formed by crosslinking of low concentrations (150 to 1200 ppm) of high-
molecular-weight (> 22 million daltons) hydrolyzed-polyacrylamide polymer with
aluminum citrate or chromic citrate to produce a weak gel. Such low polymer
concentrations are not enough to form a continuous network, and thus, they produce a
solution of separate gel bundles that are almost spherical particles with sizes in the range
of nanometers of 50 to 150 nm (Castro et al. 2013). These gels can flow under differential
pressures that are greater than their transition pressures, as was experimentally
demonstrated by Mack and Smith (1994).
Application of CDGs is limited to injection wells and involves injection of large
volumes that are comparable to those of polymer flooding and are expressed in terms of
pore volumes as well. Sweep efficiency improvement is achieved by providing in-depth
fluid diversion due to deep gel penetration and weak strength that result in complete or
partial blocking of high-conductive zones. Mack and Smith (1997) mentioned that based
on field results, CDGs work by flooding preferred water flow paths between injectors and
producers once-through, they restrict the flow to preferential water paths and force it to

165
tighter rocks. This conformance technology has been widely applied to heterogeneous
matrix-rock sandstone reservoirs produced by waterflooding with adverse mobility ratios.
Many studies have recently displayed CDGs as a feasible technology
fundamentally for mobility control with additional benefits of reducing the permeability
of high conductive zones (Castro et al. 2013). They have also stated that this technology
is an alternative or a modified version of the polymer flooding like some other studies
(Manrique and Lantz, 2011). Others have given equal importance to both functions of
these agents as in-depth conformance improvement and mobility control strategy
(Manrique et al. 2014). However, both groups have referred to injection of CDGs as
“floods” rather than “treatments” due to the large volumes injected in the field
applications. Furthermore, they have stated and validated the possibility of displacement
of viscous oils by CDGs by comparing the oil responses of the first and second
treatments of a retreated injection well. It is noteworthy that in this study, only CDG
historic cases that involve the co-injection of the polymer and crosslinker have been
considered and the early sequential gel applications were eliminated.
Weak Gels. Weak gels (WGs) are a subdivision of the bulk gel systems that have been
terminologically separated to distinguish their objectives of application from those of the
original technology, i.e., BGs. Essentially, these agents are low to intermediate polymer
concentrations, weak strength bulk gels that can have the same or different mechanisms
for improving sweep efficiency depending on how and where they are applied. In
literature, several criteria have been used to characterize this gel system as illustrated by
the following points:

166
1. In the bottle testing gel strength code system (A to J) proposed by Sydansk
(1990), weak gels have Code B which refers to a highly flowing gel.
2. Han et al. (2014) have categorized a gel system as a weak gel if it has a storage
modulus (G’) less than 1 dyne/cm
2.
3. Wang et al. (2002) experimentally have showed that in order to form a weak gel,
the storage modulus should be in the range of 0.1< G’ <10 dyne/cm
2. The authors
have also noted that the minimum polymer concentration required to form a weak
gel is 2000 ppm, and the differences between storage modulus and the viscous
modulus are relatively small.
4. Liu et al. (2010) reported that weak gels have polymer concentrations between
800-2000 ppm without further illustration about the resulted gel structure.
5. Some researchers have implied that any bulk gel system (regardless of its
concentration) is a weak gel if it forms a flowing gel in the reservoir conditions
under certain ranges of pressure gradients. Sheng (2011) mentioned that weak
gels have a high resistance to flow but are still able to flow so can be injected
deep into the reservoir. Han et al. (2014) provided similar ideas and referred to
WGs and CDGs as flowing gel processes. Furthermore, Song et al. (2002) and Lu
et al. (2010) pointed out that WGs are oil-displacement agents in addition to their
function as blocking agents.
In this study, all reviewed weak gels history cases are Chinses oilfields where this
conformance system has been extensively applied in heavy oil, unconsolidated sandstone
reservoirs as an in-depth fluid diversion technology. However, only SPE history cases
were included in this study due to translation issues and to avoid any bias to this

167
conformance technology. It is important to mention that both metallic and organic
crosslinking agents were used to form weak gels in these cases; however, organic
crosslinkers were not used for the purposes of high temperature applications as reservoirs
temperatures in most of these cases are from 109 to 163°F.
Components of Gel Technology Selection Process
This section focuses on what surveillance studies should consider for the rating and
nomination of polymer gels. Furthermore, it illustrates the role of the conventional
screening guidelines in this process.
In EOR science, screening criteria offer a way to test the appropriateness of the
proposed recovery process for a given field. They check the compatibilities of the
injected fluids with the reservoir rocks and fluids properties, where permeability, depth,
temperature, oil viscosity, and oil saturation are usually included in the analyses. For
EOR processes that target the microscopic displacement efficiency, the above parameters
are sufficient to build an initial screening system simply because the limiting factor or the
problem is the rocks and/or fluids properties themselves.
As a matter of fact, reservoir conformance problems have various roots and forms
that can occur everywhere in the reservoir. Fundamentally, linking the problem to an
effective solution requires taking into consideration all relevant factors that may affect
the solution type, design, and performance. Polymer gels are injected in designed
volumes and concentrations into the reservoir to modify rocks permeability and to divert
subsequent injected drive-fluids into low permeability zones. This implies that the
appropriate gel technology should be consistent with the characteristics of the

168
conformance problem, reservoir rocks, reservoir fluids, and subsequently injected drive-
fluids. This illustrates that, in addition to the parameters that have been considered for
other EOR technologies, evaluations of polymer gels applicability should incorporate all
parameters that depict conformance issues roots and characteristics. In this context,
Shevelev et al. (2012) have pointed out that the applicability of polymer gels, polymer
flooding, and colloidal dispersion gels depends on the problem, i.e., water channeling and
adverse mobility, and their compatibility with given reservoir conditions like
temperature, salinity, and lithology.
Unfortunately, characteristics of the reservoir conformance problems are difficult
to be assessed or measured in the field with a precision. Thus, several diagnostic
techniques have been used to evaluate these characteristics along with traditional
geological and reservoir characterizations. As a consequence, the evaluation of these
aspects has been historically performed qualitatively or subjectively using some related
reservoir properties, operational and testing measurements, and engineering
considerations of the conformance problems and gel technologies. Thus, for polymer
gels, numeral screening studies are not able to consider all the influential characteristics
of conformance problems due to the qualitative nature of their evaluations.
Based on the above considerations, it was identified that 13 quantitative
parameters, 3 categorical variables, and 4 qualitative characteristics of conformance
issues are required to develop an integrated selection system for conformance
technologies as shown in Table 1. Furthermore, the appropriate gel technology is
identified by a two steps process in order to ensure the consistency between the problem
and the solution (effective linking) as shown in Figure 2. First, the four conformance

169
problems characteristics in terms of their diagnosing parameters are incorporated in an
initial selection system to match these characteristics with the conformance agents’
technical specifications and mechanisms. This implies that conformance problems
aspects are the elements of the gel technologies selection process. Secondly, quantitative
parameters are processed in screening criteria to check compatibilities with reservoir
rocks/fluids and injected fluids. The Loma Alta Sur case provides a good example for the
above approach, where CDGs were selected based on the diagnosing of the problem
using permeability contrast, pay zone heterogeneities, and adverse mobility ratio. Then,
reservoir and fluid properties were checked using CDG screening criteria presented by
Manrique et al. (2014). In this paper, only analyses of the matching (qualitative)
parameters are presented due to limited space where the screening criteria can be found in
work of Aldhaheri et al. (2016).
Figure 2. Components and stages required for matching conformance problems and
polymer gels

170
Table 1. Summary of Screening and Matching Parameters Required for Selection of
Polymer Gel Technologies
Quantitative Parameters Qualitative Parameters
1- Reservoir Properties: 1- Drive-Fluid Channeling:
- Reservoir Lithology - Channeling strength
- Formation type - Channeling pattern
- Porosity
- Formation permeability 2- Offending Zone
- Permeability variation - Volume of channel
- Temperature - Oil saturation
- Thickness
- Depth 3- Conformance Problem Status
2- Fluids Properties: - Undeveloped
- API oil gravity - Developed
- Oil viscosity
- Mobility ratio 4- Existence of Crossflow
- Water salinity
- Oil saturation 5- Solution Type
3- Operational Aspects: - Gel-volume dependent
- IOR process - Gel-strength dependent
- Water cut
- Recovery factor
Review of Gel Field Projects
This section explains how polymer gels were selected on the light of their field
applications in injection well patterns. A specialized database was built using the case
histories published in SPE papers and U.S. Department of Energy reports from 1978 to

171
2015. Currently, the database includes 111 gel field trials and 50 parameters that include
reservoir and fluids properties, diagnosis results, treatment operating parameters, and
performance indicators.
For most case histories, the choice of polymer gels was apparently made
according to Sydansk’s and Southwell’s rule of thumb even if it was not mentioned (Al-
Dhafeeri et al. 2005; Norman et al. 2006; Muruaga et al. 2008; Diaz et al. 2008). This
indicates that the selection of polymer gels was exclusively based only on one
characteristic of the conformance problems that is drive-fluid channeling strength. In
addition, this characteristic was qualitatively described mainly using the problem type in
terms of reservoir lithology and formation type. Furthermore, it was indicated that other
influential characteristics suffer from the lack of evaluation and they were reported (few
cases) for purposes other than the selection of the treating agent. For example, volumes of
problem zones were evaluated in few gel projects (17) and were used in design of the
required gelant volumes. Moreover, these problem characteristics were mostly
qualitatively described such as large or small problem zones volumes or there is
quantifiable mobile oil saturation in place. More observations about the reviewed field
projects will be illustrated in the last sections after the discussion of other selection
parameters.
In contrast, Chou et al. (1994) and Love et al. (1998) exceptionally utilized
quantitative screening criteria to identify the problematic injectors in the case of the
Eunice Monument South Unit (EMSU). They assessed the degree of communication
between an injector and its offset producers by the correlation coefficient of water
injection and production rates. Then, the problem wells were ranked according to the

172
estimated correlation coefficients and the injectors with > 0.5 coefficients were selected
for bulk gel treatments. They have pointed out that the highly correlated wells generally
have positive responses after gel treatments, and vice versa.
In this project review, it was indicated that the following 13 different reservoir,
operational, and diagnosing indicators were utilized in the characterization of drive-fluid
communication:
1. Conformance problem type such as naturally fractures network, wormholes,
multi-layer reservoir, and high permeable channel
2. Reservoir lithology and formation type
3. Reservoir permeabilities (maximum, average, and minimum)
4. Offending zone permeability
5. Permeability variation parameters (Dykstra-Parsons coefficient (DPc) and
permeability contrast)
6. Mobility ratio of oil and injected fluids
7. Flow regimes
8. Drive-fluid injectivity (vacuum injection pressure)
9. Water cut increasing rate
10. Injection profiles
11. Breakthrough time of injection water
12. Chemical tracers breakthrough time and number of broke through producers
13. Producer-injector correlations in term of water injection and production rates or
pressures

173
Some of the above indicators will be discussed in the comparative analyses
section. It is important to note that some of the aforementioned channeling indicators are
numerical measures; however, they were not sufficient to establish distinctive application
intervals for gel technologies. It was indicated that the diagnostic tests that produce
numerical evaluations suffer from three problems especially data availability. Some
channeling indicators have large number of the data points, but they are insufficient to
describe drive-fluid channeling. Other indicators such as drive-fluid injectivity or thief
zone permeability are direct; however, they were evaluated in few cases or they were
qualitatively evaluated.
To sum up, in the overwhelming majority of field trials, conformance problems
characterization was performed qualitatively, concentrated on the drive-fluid channeling
strength, and the choice of gel technologies was solely based on this aspect. Furthermore,
qualitative descriptions such as formation or problem types have been utilized for the
evaluation of drive-fluid channeling despite the availability of some diagnosing results.
Although there are numerical indicators, drive-fluid channeling was not clear and not
comparable for different situations because these indicators were either used
qualitatively, not evaluated, or they have indirect relation to the drive-fluid channeling.
New Classification of Conformance Problems
The nomination of the suitable conformance technology involves interpretations of the
water production problems that have an inherent degree of uncertainty regarding some of
their aspects. Therefore, the classification of these problems would enhance the
comparisons between different problem types and improve the selection process.

174
Historically, conformance problems have been categorized with respect to many aspects
such as problems roots, location relative to wellbore, permeability heterogeneity
direction, presence of crossflow, and the flow system whether it fractured or matrix-rock
reservoir.
In this study, conformance issues were classified according to four aspects as
illustrated in Table 2 in order to compile the whole picture of the problems and their
corresponding solutions. Most importantly, to be able to compare these aspects for
different situations or conditions and establish distinctive applicability ranges for the
treating technologies. It is important to note that this classification framework was
established based on the comprehensive comparative analyses presented in next section;
however, for better understanding, it is presented separately and in advance.
Communication Strength and Pattern. The overwhelming majority of polymer gel
studies have emphasized that the drive-fluid channeling strength is a key parameter in the
selection of the conformance agent is if it is compatible with reservoir and fluids
properties (Sydansk and Southwell, 2000; Baker et al. 2012).
Direct Channeling Problems. This type of conformance problems refers to what
just their name implies, a strong or sever communication of drive-fluid between the
injector and the producer. More precisely, water channeling is strong if the water
production rate of the producer strongly follows the water injection rate at the injection
well (Baker et al. 2012) as it is shown in Figure 3.
This problem type is encountered when the injection fluid flows in high
conductive reservoir features directly from injection well to producer well and extremely

175
rapid breakthrough is expected even for viscous-fluids like polymers not only the
conventional drive-fluids and tracers. These features may include naturally/hydraulically
fractured formations, high permeability streaks, vugy porosity, conduit channels, solution
channels, and wormholes due to sand production.
Table 2. Generalized Classification Framework for the Injection Well Reservoir-
Related Conformance Problems and Their Associated Symptoms
Property Conformance Problem Types
Degree of
Communication
Strength
Indirect-Channeling Direct-Channeling
Weak to moderate connectivity
< 0.5
Moderate to strong connectivity
> 0.5
Communication
Pattern
Bounded Extensive
Limited areal extension offending
zones Lateral extended offending zones
Small problem zones Large problem zones
Problem Current
Development Status
Undeveloped Developed
Early in flooding life
Low Water cut
High Oil Saturation
Late in flooding life
High Water cut
High/Low Sox
Water cut increases after the remedy Water cut decreases after the remedy
Improving oil sweep efficiency Reduce excessive fluid production
Required Solution
Type
Gel-Volume Dependent Gel-Strength Dependent
Far-wellbore Far/Near-wellbore
Flooding Size Treatment Size
Sox = remaining oil saturation

176
Figure 3. Typical association trends of water injection and production rates for
different channeling strengths (Baker et al. 2012)
Some studies have referred to the aforementioned characteristics as high
permeability anomalies (Sydansk and Southwell, 2000), fracture-like features, short
circuits (Portwood et al. 2010), or they have used the “fracture-dominated flow” term to
specify drive-fluid flow in these zones (Wassmuth et al. 2005; Lantz and Muniz, 2014).
Time
Strong Communication
Water Injection Rate
Water Production Rate
Time
Moderate Communication
Time
Poor Communication
177
Indirect Channeling Problems. When the conformance problems involve poor
communication of the injected fluid between the injection and production wells, they
rank as indirect channeling problems. Practically, such problems are identified when the
general trend of water production rate of the producer is different from the injector rate
behavior (i.e. uncorrelated wells). This problem type denotes to the flow of the injected
fluid in low permeability reservoir feature; however; higher than permeabilities of the
adjusting zones. Some studies have utilized the “matrix-dominated flow” term to describe
the flow of the injected fluid in such zones.
Concerning communication pattern, conformance issues are classified according
to the volume of the problem zones into small and large. It is important to note that the
existence of crossflow and presence of high oil saturations in the offending zone plays a
vital in determining communication pattern of a given situation as illustrated in next
sections.
Conformance Problem Status. In this sense, conformance problems are classified
according to their development status based on the drive-fluid channeling whether it has
not, partially, or completely expanded through the problematic zones of the reservoir.
Some researchers have referred to this problem characteristic as “flood maturity”
(Manrique et al. 2014; Li et al. 2014) or zonal processing (Love et al. 1998). Some
studies have classified the remediation of conformance problems based on their status
into proactive and reactive treatments (Soliman et al. 2000).

178
Undeveloped Conformance Problems. If the channeling-incitation zones are not
or partially swept with the drive-fluid, then a conformance issue is an undeveloped
problem. This situation can be encountered in immature oilfield at early stages of flood
life (new floods); the matter that implies that water production has not reached serious
levels at offset producers. However, initial project assessments show serious channeling
indicators as the field matures due to viscous fingering or permeability variation. This
implies that the conformance issue is an oil recovery sweep efficiency problem (not
excessive water production) and conformance remedies are applied in these cases in order
to obtain an improved flooding.
In case of low concentration polymer gels, the objective of remediation in the case
of the undeveloped problems is to displace oil by an improved flooding that has better
injection profiles than other drive-fluids like water. This would leads to delay or mitigate
channeling of the drive-fluid (breakthrough and production) in the offending zone, the
matter that allows a higher hydrocarbon production at a considerably economic cost. This
type of problems is characterized by low water cuts, high oil saturation in all zones
(swept and unswept if flood started already), and increasing post-treatment water cuts.
Recently, Kuiqian et al. (2015) have pointed out that for the early stage gel treatments,
the characteristics of the responses on the producers were different from those in high
water cut gel treatments. They indicated that water production continues to increase after
the conformance control; however, it is lower than reservoir simulation predictions.

179
Developed Conformance Problems. Normally at the late stages of the flood life
in mature oilfields, the high-capacity zones are completely swept by the drive-fluid and
they have already caused the communication between the injector and producer. In this
context, Love et al. (1988) have referred to the zones that had more than 100% of the
hydrocarbon pore volume swept by water as over-processed zones. This type of problems
is marked by high water cuts, low oil saturations in the channeling zones, and decreasing
post-treatment water cuts. This indicates that the conformance issue is an excessive water
production problem and conformance remedies are applied to improve the injection fluid
profiles. For this problem type, offending zones may have high or quantifiable remaining
oil saturations due to the adverse mobility ratios or permeability microscopic
heterogeneities within the problematic zones themselves.
Comprehensive Comparative Analysis of Conformance Problem Characteristics
In this section, gel technologies are compared with each other in term of the
characteristics of conformance problems treated by these systems. The ultimate goal is to
identify the influential parameters in the identification process and their corresponding
values for each gel technology. In this study, the comparisons were performed on the
basis of the conformance engineering considerations, technical specifications of polymer
gels, and field experiences summarized in this project review. In the next sections, the
identified parameters and their differences among gel technologies will be presented and
briefly discussed.

180
Drive-Fluid Channeling Strength. Because of the absence of a rigorous characterization
system and a distinct measuring scale, this aspect has been subjectively evaluated using
13 different reservoir properties, operational parameters, and diagnosis indicators in the
reviewed projects. Some researchers provided general discriminating cut-offs, ranges,
and categories for some channeling indicators based on their extensive field experiences
as shown in Table 3. For example, Baker et al. (2014) attributed the utilization of bulk
gels for fractures or small volume streaks if their permeabilities are fifty times greater
than matrix rock permeability in referring to severe drive-fluid channeling.
Data availability greatly affected the comparisons of gel technologies with respect
to the 13 channeling strength indicators mentioned in the gel project review section.
While there is a reasonable amount of data for reservoir properties, few case histories
provided information for the diagnosis and operational indicators like tracer break
through times (14) and drive-fluid injectivity (12). In many instances, the desired
indicators were qualitatively described like high injectivity, poor injection profiles, and
rapid water breakthrough. Comparatively, few indicators were identified as distinctive
aspects such as reservoir lithology (carbonate), problem type (wormholes), and water
flow rates correlations (> 0.5). However, most indicators are shared between different gel
systems and sometimes they are intersected or overlapped over wide ranges as shown in
Figure 4 and Figure 5 for permeability and chemical tracer breakthrough time.
It is important to note that except the correlational analyses, none of these aspects
can individually provide a comprehensive evaluation of the drive-fluid channeling, and
this evaluation requires the employment of all available relevant information in a
complementary manner. The comparisons are not presented in this paper due to the

181
limited space and the lengthy accompanied discussions. We plan to summarize these
analyses in a separate publication.
From reservoir engineering considerations, it is thought that each
lithology/formation type has a distinct “signature” on the drive-fluid channeling. It is
expected that channeling is more severe in fractured and unconsolidated formations than
in matrix rocks reservoirs; however, this is a highly general statement. Current projects
Table 3. Some Proposed Cut-offs for Diagnosis Parameters of Drive-fluid
Channeling Strength
Parameter Weak
Channeling
Strong
Channeling References
Problem Zone
Permeability
< 2000 md > 2000 md
Sydansk & Southwell (2000)
<10 Darcies > 10 Darcies
Sydansk (2007)
Permeability
Contrast
KStreak > (2-10) KMatrix KStreak > (50) KMatrix
Baker et al. (2012)
Khigh < 1000 KMatrix Khigh > 1000 KMatrix
Sydansk (2007)
Permeability
Variation
DPc > 0.6 - Reynolds and Kiker (2003)
0.55 < DPc < 0.7 DPc > 0.7 Castro et al. (2013)
Drive-fluid
Injectivity
< 10 bpd/psi > 20 bpd/psi Pipes & Schoeling (2014)
- > 5 Expected 1 Tweidt et al. (1997)
Recovery factor - < 33 % Montoya Moreno et al. (2014)
Flow Regime Radial Linear Sydansk (2007)
Interwell
Communication2
< 0.5 > 0.5 Baker et al. (2012)
Formation Type - Naturally Fractured
Unconsolidated Current Study
Drive-fluid
Breakthrough Time Months to years Weeks to Months Current study
Tracer breakthrough
Time Weeks to Months Hours to Days Current study
Water Cut
Increment Rate < 0.5 per year > 0.5 per year Current Study
(1) Based on average reservoir parameters, (2) correlation coefficient of producer-injector pressures or flow
rates.

182
Figure 4. Comparison of the average permeability applicability ranges for different
gel technologies
Figure 5. Comparison of interwell tracer breakthrough times in gel project
summary
3-62
10-193
4-500
30-294
8-850
19-1407
500-1216
1325-2500
1230-2634
1 10 100 1000 10000
Average Reservoir Permeability, md
San
dsto
ne
C
arb
on
ate
Un
co
ns
oli
date
d
Matr
ic-r
oc
k
N. fr
actu
red
0.06-41
27-60
4-41
0 10 20 30 40 50 60
BG
sC
DG
sW
Gs
Interwell Tracer Breakthrough Time, days

183
Figure 6. Distributions of polymer gel projects according to reservoir type
review illustrates that BGs were applied in matrix rock reservoirs more than in naturally
fractured systems (29 vs. 20) as shown in Figure 6. Figure 4 shows that CDGs and WGs
were applied in matrix rock reservoirs that have higher average permeabilities than BG
matrix rock trials. Thus, if it is stated that BG matrix rock case histories have high
permeability anomalies, the above observation would imply that CDG projects have
higher permeability anomalies than BGs under the assumption of correlating average and
high permeability values for the reviewed reservoirs.
The ICP (Colombian Petroleum Institute) proposed a gel selection methodology
in which Dykstra-Parsons coefficient (DPc) has been introduced as a key parameter to
guide the process (Castro et al. 2013; Maya et al. 2014). This rule suggests the
application of CDGs if 0.55 < DPc < 0.7 and the application of BGs for reservoirs with
DPc values > 0.7. Figure 7 shows that DPc application intervals for polymer gels are
intersected over wide intervals and a large number of CDG treatments were applied in
3 14
26
6 8
39
5
4
6 3
14
69
11 14
Mat. NF. Mat. NF. Uncon.
Formation Type
WGs
CDGs
BGs
Carbonate Sandstone

184
formations with DPc > 0.7. This indicates a clear conflict with ICP criteria that have
preserved this range (> 0.7) for bulk gel applications; thus, these criteria are only
regional-decision-making rule.
Figure 7. Permeability variation coefficient distributions for polymer gel projects
The above observations point out that the aforementioned channeling strength-
based gel selection statements that employ formation type or permeability variation are
inadequate to describe the degree of the interwell connectivity and they cannot provide an
efficient selection system for chemical agents particularly for sandstone formations. It
can be easily recognized that CDGs and WGs were applied in moderate to strong
channeling conditions that are good candidates for BGs based on the above statements. If
that is true, it then implies that there are many objectives for the gel treatment and the
1
6
15
6
1
9
20
8
3
1
4
1
1
11
30
23
10
0.5-0.6 0.6-0.7 0.7-0.8 0.8-0.9 0.9-1.0
Dykstra-Parsons Coefficient, fraction
WGs
CDGs
BGs

185
selection of a conformance agent does not depend solely on the severity of the drive-fluid
channeling.
On the basis of the reviewed indicators and technical specifications of polymer
gels, we inferred the channeling strength ranges shown in Figure 8 for the gel
technologies under evaluation. In this figure, four severity intervals were assigned to the
channeling strength, where for each interval there are at least two applicable chemical
systems. The interferences or overlaps in the channeling strength ranges of gel systems
are explained by the intersections over wide intervals of all reviewed indicators
(lithologies, formations, permeability, DPc, tracer breakthrough time, etc.) as mentioned
earlier.
Generally, the proposed extents are consistent with the previous studies (Sydansk
and Southwell, 2000; Smith and Larson, 1997) that BGs and CDGs are applied in strong
and weak fluid communications, respectively. However, the extension of BG and CDG
ranges over the weak and strong regions would need consolidated justifications that are
illustrated in the following paragraph.
Additionally, comparisons of the mispredicted projects by the main logistic
models and by their variants (with no water cut) illustrate some important points. First,
the low water cut (early stages) CDG projects were probably applied in moderate to
strong channeling strength extents; therefore, they were mispredicted as BGs. These
comparisons also showed that high water cut BG projects had probably weak to moderate
channeling strengths at early stages, and thus, they were misclassified as CDGs.
However, these strengths were exacerbated by the long time water injection to enter into
the strong regions and justify the utilization of bulk gels at late stages. These two

186
observations indicate the importance of knowing the problem development status and
treatment timing in the selection of polymer gels. It is important to mention that BGs and
CDGs were mainly applied and high and low water cuts, respectively.
Figure 8. Drive-fluid Channeling Strength Applicability Ranges of Polymer Gels
Problem Zone Volume. Generally, this criterion has been implicitly considered in the
previous gel applicability evaluation studies and only to explain the impacts of the
crossflow on the type of the required treating agent. For injection wells, bulk gels are
typically applied in moderate volume treatments ranging from 300 to 60000 bbl. based on
the summarized field trials. CDG and WG treatments involve injection of large volumes
that are usually in a scale of several 100,000 barrels (Sydansk and Romero-Zeron, 2011).
For the reviewed CDG and WG case histories, the injected volumes are in the ranges of
4200-117000 bbl. and 12600-505000 bbl., respectively. This implies that BGs are used to
No to Weak Weak to Moderate Moderate to Strong Strong to Pipe-like
Weak Gels
Bulk Gels
Polymer
Drive-Fluid Channeling Strength
0.0 1.0 0.5
Colloidal Dispersion Gels

187
restrict water flow into small problem zones while CDGs and WGs target large problem
zones that are in reservoir scale. However, this quiet general statement does not help in
the rating of the treating agents for a particular problem zone. Thus, establishing statistics
for the problem zone volume aspect that can tell us how small or big are these zones are
of extreme importance.
In this project summary, moveable-pore-volumes (MPV) were estimated only for
BG projects despite the existence of different evaluation techniques. Out of 50 bulk gel
field trials, only 17 case histories reported evaluations for this characteristic that were
estimated using the production plots (WOR versus NP). The MPV statistics shown in
Figure 9-a illustrate that BGs were applied over a wide range from 30 to 1036000 bbl.
with a median of 80000 bbl. and about 82% of projects are in a range of 10000-600000
bbl. It is clear that with this small amount of data it is not possible to perform
comparative analyses for all considered conformance control agents.
In an effort to make the comparative analyses possible, problem zone volumes for
bulk gel projects were estimated using the widely used gelant volume design rule of
thumb and the actually injected gel volumes. In the gel treatment design stage, gelant
volumes are evaluated as a percent of the estimated MPV and usually this percent is from
5 to 50 % (Smith, 1999). In this study, the injected volumes have been considered to
represent 5% of the MPV in a conservative approach to calculate the problem zone
volumes. Figure 9-b presents estimated problem zone volume distributions and Table 4
compares them in terms of different statistical parameters with the reported values
discussed above. Interestingly, both volume values provide approximately identical
statistical attributes where projects frequencies are distributed almost over the same range

188
6000-1,200,000 bbl. with a median of 120000 bbl. and about 84 % of projects are in a
range of 10000-500000 bbl. In other words, they have the same statistical central and
variation tendencies.
Figure 9. Distributions of (a) reported and (b) estimated problem zone volumes for
bulk gel projects
1 1
7 7
1
6 12
53
94 100
<1 1-10 10-100 100-1000 1000-1100
Reported Problem Zone Volume, thousands bbl.
(a)
Cum. Freq.
5
10 9
32
1
9
26
42
98 100
1-10 10-50 50-100 100-1000 1000-1500
Estimated Problem Zone Volume, thousands bbl.
(b)
Cum. Freq.

189
Table 4. Statistical Comparison of the Reported and the Estimated Problem Zone
Volumes for Bulk Gel Projects
Property Problem Zone Volume, bbl.
Reported Estimated
Points Count 17 57
Mean 201831 196747
Median 80000 119960
St. Deviation 266774 233202
Coff. of Variation 1.3 1.2
Minimum 30 6000
Maximum 1036000 1200000
As mentioned above, no problem zone volume estimations were provided for
CDG and WG projects. Therefore, the injection pattern pore volumes were estimated
using the injected gel volumes as they provided in barrels and pore volumes. Then, the
offending zone volumes were considered to represent 50% of the pore volumes by
assuming that the reservoir consists only of two equal thickness layers as illustrated in
Figure 10. The distributions of the estimated volumes for CDG projects presented in
Figure 11 illustrate that these polymer gels were applied over a broad range from 106 to
500 x 106 bbl. with a median of 3358867 bbl., and about 97 % of projects were applied in
problem zone volumes less than 50 x 106
bbl.
For the three gel systems of interest, the estimated problem zone volumes were
summarized in Table 5 and compared in Figure 12. These analyses show that each gel
technology was applied in a wide range of problem zone volumes and this range is almost

190
separated from those of the other gel systems. The problem zone volume ranges of gel
systems appear as one completes the other to cover the whole application ranges.
Figure 10. Estimation of problem zone volume in case of flood-size gel treatments
Figure 11. Distributions of the estimated problem zone volume for CDG projects
5
11
4 4
8
4
1
14
43
54
65
86 97 100
1-2 2-3 3-4 4-5 5-10 10-50 400-500
Estimated Problem Zone Volume, millions bbl.
Cum. Freq.
Problem Zone Volume
Low permeability
PZV = 0.5 * (Gel volume in bbls/Gel Volume in PV %)

191
Table 5. Descriptive Summary of Problem Zone Volume Estimations in Gel Projects
Property/Gel Type Problem Zone Volume, bbl.
BGs CDGs WGs
Points Count 57 37 3
Mean 196747 1.90E+07 1.69E+09
Median 119960 3200000 1181425750
St. Dev 233202 80334313 1649409798
CV 1.2 4.2 1.0
Minimum 6000 1.05E+06 3.57E+08
Maximum 1.20E+06 4.93E+08 3.54E+09
Figure 12. Comparison of the estimated problem zone volumes in gel field projects
However, it is important to note that WGs have only 3 estimations for this aspect.
In this study, a one million barrel problem zone volume has been considered as a cut-off
to distinguish between the problems that are treated by the treatment-size systems and the
6000 - 1.2E6
1.05E6 - 4.9E8
3.6E8 - 3.5E9
1.E+03 1.E+04 1.E+05 1.E+06 1.E+07 1.E+08 1.E+09 1.E+10
BG
sC
DG
sW
Gs
Estimated Problem Zone Volume, bbl.

192
flood-size gel technologies. This cut-off is consistent with the largest estimated MPV for
BG projects that is 1036000 bbl. in the Raven Creek field (Smith, 1999). It is important
to mention that this characteristic of conformance issues is affected by two considerations
as it will illustrate in the next sections.
Problem Development Status. In this study, reservoir conformance problems have
generally been classified based on their development status and some associated
symptoms were explained as well. To illustrate this problem characteristic in the
summarized field applications, the pre-treatment water cut and the time-lapse between the
recovery flood initiation and the gel treatment implementation were employed.
Figure 13-a illustrates that 66% of CDG projects were applied to treat
undeveloped problems at water cuts less than 50% and 15 treatments were implemented
at the very beginning of the flood life, i.e. water-free production. Although CDG projects
are distributed over the whole water cut ranges 0-96%, this data set has a median of
0.002% as shown in Table 6. Project frequencies are concentrated at the 0-10% and 90-
100% intervals where 58 % and 19 % of projects are in these ranges, respectively. This
indicates that CDGs are applied for both problem types with a clear tendency towards
undeveloped problems and there is a recent interest in testing this technology in very
developed problems (Diaz et al. 2008).
For weak gels, Figure 13-b shows that 60% of their trials treated well developed
problems with high water cuts 80-100%, and only 20% of their applications are at water
cuts less than 50%. This data set has a median of 71% and only one history case was
treated at very early times with zero water cut. This indicates that WGs were applied for

193
both problems types, but mainly in developed circumstances. In contrast, BGs were
applied only for the developed conformance problems and considerably for very high
water cuts situations where 79% of the trials are in 80-100% as shown by Figure 13-c.
Table 6 shows that these projects have a median of 93.5 % and very homogeneous data
with a coefficient of variation of 0.15. This indicates that the primary concern for BGs
projects was reducing water production rates by blocking the high conductive zones.
The project distributions and the descriptive summary of the treatment time-lapse
confirm the preceding observations as shown in Figure 14 and Table 7. CDGs were
frequently applied at early times where 74 % of projects were performed in less than 5
years after the flood initiation, 10 projects were performed in the same year, and few field
cases were treated after more than 5 years. The median (2 years) clearly signalizes the
early application tendency of this gel system. Weak gels have the narrowest time lapse
distribution among gel systems, 60% of their trials were performed after 5 years, the
median is 6.5 years, and only one treatment in the same year of flood inception. Bulk gel
trials are distributed over the whole time range; however, this data set has a high median
of 13 and about 80% of projects were carried out after 5 years. This obviously implies the
late time application of this treating system for well-developed conformance problems.
Furthermore, the behavior or trend of water production during and after treatment
was illustrated by plotting the pre and post-treatment water cuts values. The undeveloped
and developed conformance problems have been characterized by having increasing and
decreasing post-treatment water cuts, respectively. Figure 15 compares the pre and post-
remediation water cut values for the successful projects of different polymer gel systems.
For undeveloped problems (WC < 50%), it is clear that water production increases during

194
Figure 13. Comparison of the pre-treatment water cut frequencies in gel Projects
18
2 1 2 1 2
6
56 56 63 63
66 66 72
75 81
100
0-10 10-20 20-30 30-40 40-50 50-60 60-70 70-80 80-90 90-100
Pre-Treatment Water Cut, %
(a) CDG Projects Cum. Freq
1 1 1 1 1
5
10 10 10 10
20
30
40 40
50
100
0-10 10-20 20-30 30-40 40-50 50-60 60-70 70-80 80-90 90-100
Pre-Treatment Water Cut, %
(b) WG Projects Cum. Freq
2 3 3
8
20
0 0 0 0 0 6
14
22
44
100
0-10 10-20 20-30 30-40 40-50 50-60 60-70 70-80 80-90 90-100
Pre-Treatment Water Cut, %
(c) BG Porjects Cum. Freq
Developed Undevelope
195
Table 6. Statistical Summary of Pre-Treatment Water Cut in Polymer Gel Projects
Property/Gel Type Pre-treatment water cut, %
BGs CDGs WGs
Points Count 34 29 10
Mean 87.3 29 71.3
Median 91.8 0.4 87.7
St. Dev 13 38 30.9
CV 0.1 1.3 0.4
Minimum 52 0 0
Maximum 100 96 97.3
Most applied range 70-100 0-50 60-100
Table 7. Statistical Summary of Treatment Time-Lapse in Polymer Gel Project
Survey
Property/Gel Type Treatment Time-Lapse, year.
BGs CDGs WGs
Points Count 52 36 10
Mean 16.9 5.6 9.5
Median 12.5 2 6.5
St. Dev 13.8 9.4 8.0
CV 0.82 1.6 0.84
Minimum 2 0 1
Maximum 53 44 23
and after the treatment as all data points are above the unit-slope line in this figure, and
uniquely CDGs and WGs were applied in this region. In contrast, water production

196
decreases after the treatment of most developed conformance problems which their data
points are below the line, and all gel systems are presented in this region. It is important
to note that there are some applications that their post-treatment water cut has increased
over the pre-treatment values and still considered as successful projects because the
actual post-treatment water production rates are lower than the pre-treatment projections.
Figure 14. Treatment time-lapse distributions for polymer gel projects
In sum, BGs are applied only in high water cut patterns while other the two
treating agents are employed to remedy both problem types. This would call for further
investigation of the problem properties in the case of developed channeling issues as all
conformance technologies are applicable.
9 11
14
7 7
2 2
10
16
4 2
3
1
4
2 3
1
<1 1-5 5-10 10-20 20-30 30-40 40-50 50-60
Treatment Time-Lapse, years
WGs
CDGs
BGs

197
Figure 15. Scatter plot for the pre and post-treatment water cut shows trends of
water production during and after conformance remediation for different gel
technologies
Remaining Oil Saturation. An important issue that has been approximately
mentioned in all candidate selection studies and case histories is the presence of
quantifiable oil saturations in the targeted patterns. However, for gel technologies under
question, no study has made a clear distinction about where these quantifiable oil
saturations should be presented. In literature, researchers often used “within well pattern”
or “in place” expressions in their descriptions of this fluid property. Presumably, BG
studies have referred to the bypassed oil reserves in the partially-swept, low permeability
zones of the treated formations. Liu et al. (2006 and 2010) listed the remaining oil
distribution among the reservoir characteristics that are required to evaluate conformance
control technologies.
0
20
40
60
80
100
0 20 40 60 80 100
Po
st-
Tre
atm
en
tt W
ate
r C
ut,
%
Pre-Treatment Water Cut, %
BGs
CDGs
WGs

198
We think that the presence of high oil saturations in low permeability zones is
guaranteed by the substantial permeability contrasts that exist between different flow
units of the treated formations. It is noteworthy to mention that permeability contrast
ranging between 20 and 40000 for the gel projects reviewed in this study. Furthermore,
taking into consideration the significant increase in oil production caused by BG
treatments in some longtime flooded formations (>20 years) reveals that there were
quantifiable oil saturations in the low permeability zones even after such long injection
times. Seright and Liang (1994) illustrated that there are gel projects that were
implemented after more than 50% of the original oil in placed had been recovered in
these fields. These high permeability contrasts and oil production increments would
probably confirm the above statement about the amounts of oil quantities in the less
conductive layers.
There is no doubt that in the case of the undeveloped conformance problems, both
offending and low permeability zones have high oil saturations simply because of the
short injection times as formerly indicated by water cuts and time lapses statistics. In
most cases, the implementation was almost directly after the primary production stage or
after very short times of waterflooding as in case of CDG applications in the Rocky
Mountain region. Diaz et al. (2008), Alvarado et al. (2008), and Lantz and North (2014)
mentioned that the majority of the initial CDGs applications were applied immediately
after primary production or shortly (usually one month) after waterflooding inception. In
the case of Luda LD-10 field, water injection started in September, 2005 and weak gels
were applied in March, 2006 that is only six months after the primary production which
in turn began in January, 2005 (Lu et al. 2010; Kuiqian et al. 2015).

199
As illustrated before, BGs have targeted small problem zones that were flooded
for long time (average 16.9 years) by several pore volumes of the injected fluids.
Therefore, in these fully developed conformance problems, it is expected that at the
implementation time of the remediation, these zones were completely swept and possibly
at residual oil saturation. Ricks and Portwood (2000) mentioned in their justification of
gel treatments in McElroy field that the highly permeable rock in this reservoir has
probably been swept of secondary oil. Therefore continued cycling of water through
these areas would not be effective in sweeping the tighter rock that contains the bulk of
the remaining secondary reserves. Portwood et al. (2010) mentioned in the case study of
Healdton field that the thief intervals were likely swept to the absolute residual oil
saturation. Consequently, they used the residual oil saturation value in their volumetric
calculations of the MPV of the direct flow channels. In this case history, waterflooding
was initiated in 1960 while conformance treatments started in 2006.
For CDG and WG applications in developed problems, the rapid increases in oil
production rates (jumps) during the agent injection time which is usually very long
(years), suggest the existence of high oil saturations within the problematic zones.
Muruaga et al. (2008) illustrated that a large portion of the injected gelant entered the
high conductive layers in the CDG pilot in El Tordillo oilfield. This indicates that the
large oil quantities produced in some case histories immediately after gel treatments were
from the high conductive zones. Manrique, et al., (2014) have pointed out that such oil
responses observed during the treatment would validate the possibility of CDG displacing
viscous oils that previously reported by Diaz et al. (2008) and Castro et al. (2013). In
addition, during their numerical simulation studies to predict CDGs performance, Diaz et

200
al. (2015) performed a history matching for the two Loma Alta Sur staged treatments
(separated by one year waterflooding) in the LAS-58 injection pattern. Their results
showed that average oil saturations were 0.618 and 0.615 at the start of first and second
treatments respectively. Recognizing that simulation history matching was based on the
observed injection profiles and the initial oil saturation in Grupo Neuquen formation is
0.67, would confirm the presence of producible oil quantities in the high conductive
zones of this reservoir.
To explain the above point, some researchers attribute the existence of
quantifiable oil saturations in the offending zones to the highly unfavorable mobility
and/or local heterogeneities within problematic zone themselves (Muruaga et al. 2008;
Diaz et al. 2008). Others have accredited these oil responses to the ability of CDGs to
improve the microscopic sweep efficiency by blocking the larger pore throats and
diverting the flow to the smaller pore throats (Bjorsvik et al. 2007; Splido et al. 2009 and
2010; Rousseau et al. 2005; Cozic et al. 2009). This feature has been termed as flow
microdiversion efficiency or flow diversion on pore scale by some researchers (Shi et al.
2011; Karlsen, 2010).
To sum up, the producible oil reserves by the subsequent fluid injection should be
present only in the low conductive zones to ensure BG project economic feasibility.
Otherwise, gel treatment will cause a delay in the oil production from the high flow
capacity layers. For in-depth fluid diversion technologies, other than the existence of the
crossflow, such oil saturations must present in both offending and low conductive zones.
This implies that oil saturations in problematic zones is the key factor in the gel
technology selection rather than oil saturations in low permeability zones that are

201
guaranteed by high reservoir heterogeneities. Karlsen (2010) pointed out that one of the
key elements to know before utilization of deep flow diversion agents is the remaining oil
saturation in swept areas.
Integrated Comprehensive Selection System
According to the preceding sections, bulk gels are solutions for the problems that have
the following characteristic:
1- Direct drive-fluid communication (severity > 0.5)
2- Small volume offending zones (Vchannel < 106 bbl.)
3- Large volume problem zones that require treatment-size remedy (< 60000 bbl.)
4- Undeveloped and developed conformance problems
5- High remaining oil saturations in less capacity zones of the reservoir
6- Problems that need blockage of the high conductive zones and fluid flow
diversion to the low capacity zones.
7- Problems that need gel-strength-dependent treatments
In addition, CDG gels are applicable for injection patterns characterized by:
1- Indirect drive-fluid communication (severity < 0.5)
2- Large volume offending zones (Vchannel > 106 bbl.) that treated by flood-size
remediation (> 0.1 PV)
3- High oil saturations in swept and less capacity zones (adverse mobility ratio)
4- Undeveloped and developed sweep problems
5- Oil displacement and flow diversion mechanisms are simultaneously required
6- Problems that need gel-volume-dependent treatments

202
Weak gels are best suited for the situations that are similar to those of BGs but
with indirect channeling strengths or similar to CDG conditions but with direct
channeling as they are used in two application forms or objectives depending on the type
of the action required. It is important to mention that CDGs were applied in direct
channeling issues instead of WGs in some case histories with naturally fractured
formations.
On the basis of the proposed parameters and their variations, eight possible
combinations or types for the reservoir conformance problems were indicated as shown
in Table 8. For each combination of the parameters, the most suitable gel technology was
identified by matching its aspects with the above technical specifications for the gel
systems. It is important to note that in case of undeveloped problems, it is recommended
that BGs or WGs applied only if the volumes of the offending zones are extremely small
as the production from these zones might be lost or delayed by the treatment.
Furthermore, for the application of CDGs for undeveloped problems; it is not necessary
that these problems have adverse mobility ratios as the offending zones have high oil
saturations. This situation was encountered in the case of naturally fractured sandstone
formations where CDGs were applied to obtain an improved flooding in term of injection
profiles.
To facilitate the ranking of the selection parameters in term of their importance in
the process and to help in the visualization of the interactions among these parameters,
Table 8 was reproduced in a flow chart or roadmap form as shown in Figure 16. It was
identified that for small volume problematic zones, the selection is controlled only by the
channeling strength.

203
Table 8. Eight Possible Situations for Reservoir Conformance Problems and Their
Corresponding Solutions
Channeling
Strength
Problem
Zone
Volume
Current
Development
Status
Crossflow
Or
High Sox
Remediation
Size
Proposed
Agent
Weak
To
Moderate
Small
Undeveloped - T WGs *
Developed - T WGs *
Large
Undeveloped - F CDGs
Developed Yes/No F/T CDGS/WGs
Moderate
To
Strong
Small
Undeveloped - T BGs
Developed - T BGs
Large
Undeveloped - T WGs
Developed Yes/No F/T WGs/BGs
* Weak BGs are applicable as well; Sox = remaining oil saturation; T = Treatment; F =
Flooding
For large volume offending zones, the selection is also governed only by the
channeling strength except in the case of developed problems with no crossflow or high
oil saturation in the high conductive layers. Furthermore, the absence of crossflow or
high oil saturation affects the offending zone volume and changes it (not physically) from

204
large to small measures that can be treated by treatment-size remedies. These three
observations reveal that channeling strength and offending zone volume are the main
selection parameters and the effects of other aspects are translating into changes in the
offending zone volume. Thus, Table 8 and Figure 16 were reduced into the simple
generalized selection matrix shown in Figure 17.
One can notice that the development status aspect of the conformance issues can
be eliminated as it does not affect the treating agent selection and since the crossflow and
remaining oil saturation are already considered. It has been identified that this aspect dose
not only provide a better understanding of the conformance issues, but also it indicates
the development of the channeling strength. In addition, it illustrates the influences of this
channeling strength development on the gel treatment designs as explained by following
observations. Normally, the long term fluid injection exacerbates reservoir heterogeneity
and makes drive-fluid channeling more and more severe with time. This observation was
identified in several individual injection patters of different case histories as water
injection and production rates become more following each other (Lu et al. 2010).
Figure 18 shows the water injection and production history of the Big Mac Unit
starting from the initial field development stage (Lantz and North, 2014). Recall that the
channeling strength is quantified by measuring how strongly injection and production
rates are following each other and expressed as their correlation coefficient. One can
easily recognizes the substantial progress or increase in channeling strength with the
continuation of the injection process over time in this field. The undeveloped, weak
channeling problem at early stages (separate curves) turned to very strong
communication (matched curves) when the problem became well developed as indicated

1616162
205
Figure 16. Integrated Roadmap for Gel Technology Selection for Injection Well Conformance Improvement

206
Figure 17. Generalized Polymer Gel Selection Matrix for Injection Well
Conformance Improvement
by high water cut values. In this unit, the injection started in one injector and four
producers; later, three producers were converted to injectors. However, since September,
1995 there are two active producers and two active injectors.
Furthermore, in the case of Little Missouri Unit, CDGs were applied in 1989 after
few months of polymer flooding (undeveloped) and then in July, 2012 (developed).
Interestingly, polymer concentrations were increased from 245 ppm in the first treatment
to 450-600 ppm in the second treatment. This signals the effects of the development of
the drive-fluid channeling strength on the gel treatment design considerations. Finally,

207
comparisons of the mispredicted projects by the main advanced screening models and
their variants (with no water cut) have indicated the development of drive-fluid
channeling during the flood life (Aldhaheri et al. 2016). In one BG case history with DPc
of 0.76, permeability 50 md, net thickness 10 ft, and 93% water cut, variant models
predicted CDGs for this case. This implies that the initial moderate water channeling
strengths exist when the problem still considered undeveloped had been exacerbated by
the longer than usual water injection in this field (Smith and Larson, 1997). Afterwards,
the problem had become well-developed with strong water channeling, and hence, BGs
were applied to improve distribution of injection water. For this case, channel volume
was estimated to be large (> 106 bbl) and moderate results with delayed responses were
observed for the large volume gel treatment of 46700 bbl. (Smith 1999).
Figure 18. Water injection and production history of Big Mac Unit
0
1
2
3
100
1000
10000
100000
1985 1990 1995 2000 2005 2010
Wate
r Cu
t, fractio
n
Wate
r R
ate
s,
bb
l/m
on
th
Time
Injection Rate Production Rate Water Cut
CDG injection

208
Apart from the channeling strength, it was indicated that previous studies
(Sydansk and Southwell, 2000; Liu et al. 2010) linked the utilization of large volume
CDGs or WGs treatment in developed problems by the existence of fluid crossflow.
However, only two case histories for these conformance agents mentioned this aspect
(Smith and Mack, 1997; Smith et al. 2000). It is obvious that this justification involves an
implicit assumption of uniform permeability and oil saturation distributions in the
offending zones. Alternatively, it has been illustrated that the adverse mobility ratio and
local heterogeneities within the problematic zones themselves cause a non-uniform
sweeping that leads to the existence of high oil saturation unswept regions within these
high conductive layers (Muruaga et al. 2008; Diaz et al. 2008; Shi et al. 2011; Karlsen
2010). The emergence of this rationalization has leaded us to conclude that the premise of
the uniformity of the problematic zone characteristics is limiting reservoir engineers’
imagination of the conformance problems and the analysis of the treatment
implementation and performance.
The existence of a pair of gel technologies in each channeling strength region
(weak vs. strong) implies that the investigated gel systems provide together an integrated
solution system for the most injection well reservoir-related conformance problems. The
developed selection scheme facilitates the recognition of the proper agent whether the
purpose of the remediation is to improve oil sweep efficiency or to reduce water
production as it considers all treating agents and selection parameters. The novelty of the
proposed scheme is in its utilization of standardized general parameters for the selection
which makes the process clearer and easier. It provides distinct cut-offs for conformance
problems characteristics and presents technical insights about which diagnosis indicators

209
can effectively quantify these properties. The purpose of this paper is to increase the
knowledge about the criteria that should be used to select a conformance improvement
technology that will help in picking the right agent and avoid making bad selection
decisions. As with other (Smith 2006), we hope that the thoughts and measures presented
in this study will be a catalyst for further discussion within the industry about the
standardization of polymer gel selection process.
Conclusions
1. Conformance problems are often qualitatively characterized using different
problem descriptions in terms of reservoir lithology and formation type. This
evaluation nature has imposed several problems in the context of rating problems
and solutions.
2. Gel technologies have been exclusively chosen based on the drive-fluid
channeling strength and 13 different reservoir properties and operational and
diagnosing indicators were utilized in the evaluation of this characteristic.
3. Particularly for clastic reservoirs, gel selection statements that employed reservoir
lithology, formation type, or permeability variation are inadequate to describe the
strength of the drive-fluid connectivity or to use as efficient system for chemical
agent selection. They should be used only as starting point in the matching of
conformance problems and gel systems.
4. Gel technology selection is a two-step process that starts by matching the
qualitative properties of problems and solutions and then confirmed by the
numerical screening criteria.

210
5. A new classification was proposed for the conformance problems to improve the
comparisons between different problem and solution types and to enhance their
matching process.
6. Using field implementations, a generalized comprehensive system was developed
to facilitate the selection of gel technologies. The new scheme utilizes
standardized parameters and provides distinguishing cut-offs for gel technologies.
7. Drive-fluid channeling, volume of offending zones, problem development status,
existence of cross-flow, and nature of the required solution are the most
influential aspects in the process of selection a conformance agent.
8. In addition to crossflow, the presence of high oil saturations or unswept regions in
the offending zones requires the application of the flood-size treating technologies
that combine displacement and diversions mechanisms.
9. The selection and design of chemical systems for a certain conformance problem
greatly depend on the timing of the conformance treatment in the flood life.
10. There is an urgent need to develop an integrated numerical characterization
system for drive-fluid channeling that has the ability to rate conformance
problems and polymer gels. The easiness of the practical implementation is the
ruling feature of any suggested methodology.
Acknowledgement
The author would like to thank the Higher Committee for Educational Development
(HCED) in Iraq for granting him a PhD scholarship and financial support.

211
References
Al-Dhafeeri, A. M., Nasr-El-Din, H. A., Seright, R. S., & Sydansk, R. D. (2005, January
1). High-Permeability Carbonate Zones (Super-K) in Ghawar Field (Saudi Arabia):
Identified, Characterized, and Evaluated for Gel Treatments. Society of Petroleum
Engineers. http://dx.doi.org/10.2118/97542-MS.
Aldhaheri, M., Wei, M., & Bai, B. (2016, April 12). Comprehensive Guidelines for the
Application of In-Situ Polymer Gels for Injection Well Conformance Improvement
Based on Field Projects. Society of Petroleum Engineers.
http://dx.doi.org/:10.2118/179575-MS.
Aldhaheri, M. N., Wei, M., Bai, B., & Alsaba, M. (2016, April 25). An Advanced
Selection Tool for the Application of In-Situ Polymer Gels for Undiagnosed Injection
Wells. Society of Petroleum Engineers. http://dx.doi.org/10.2118/182813-MS.
Alvarado, V., Thyne, G., & Murrell, G. (2008, January 1). Screening Strategy for
Chemical Enhanced Oil Recovery in Wyoming Basins. Society of Petroleum
Engineers. http://dx.doi.org/10.2118/115940-MS.
Azari, M., & Soliman, M. (1996, January 1). Review of Reservoir Engineering Aspects
of Conformance Control Technology. Society of Petroleum Engineers.
http://dx.doi.org/10.2118/35171-MS.
Baker, R. O., Stephenson, T., Lok, C., Radovic, P., Jobling, R., & McBurney, C. (2012,
January 1). Analysis of Flow and the Presence of Fractures and Hot Streaks in
Waterflood Field Cases. Society of Petroleum Engineers.
http://dx.doi.org/10.2118/161177-MS.
Bjorsvik, M.; Hoiland, H.; Skauge, A. Formation of Colloidal Dispersion Gels from
Aqueous Polyacrylamide Solutions. Colloids Surf., A 2007, 317, 504–511.
Castro, R., Maya, G., Sandoval, J. et al. 2013. Colloidal Dispersion Gels (CDG) to
Improve Volumetric Sweep Efficiency in Waterflooding Processes. CT&F - Ciencia,
Tecnología y Futuro, 5 (3): 61-78.
Chou, S. I., Bae, J. H., Friedmann, F., & Dolan, J. D. (1994, January 1). Development of
Optimal Water Control Strategies. Society of Petroleum Engineers.
http://dx.doi.org/10.2118/28571-MS.
Cozic, C., Rousseau, D., & Tabary, R. (2009, November 1). Novel Insights Into Microgel
Systems for Water Control. Society of Petroleum Engineers.
http://dx.doi.org/10.2118/115974-PA.
Diaz, D., Somaruga, C., Norman, C., & Romero, J. L. (2008, January 1). Colloidal
Dispersion Gels Improve Oil Recovery in a Heterogeneous Argentina Waterflood.
Society of Petroleum Engineers. http://dx.doi.org/10.2118/113320-MS.

212
Diaz, D., Saez, N., Cabrera, M., Manrique, E., Romero, J., Kazempour, M., & Aye, N.
(2015, August 11). CDG in a Heterogeneous Fluvial Reservoir in Argentina: Pilot and
Field Expansion Evaluation. Society of Petroleum Engineers.
http://dx.doi.org/10.2118/174704-MS.
El-karsani, K. S. M., Al-Muntasheri, G. A., & Hussein, I. A. (2014, February 1). Polymer
Systems for Water Shutoff and Profile Modification: A Review Over the Last
Decade. Society of Petroleum Engineers. doi:10.2118/163100-PA.
Han, M., Alshehri, A. J., Krinis, D., & Lyngra, S. (2014, April 21). State-of-the-Art of In-
Depth Fluid Diversion Technology: Enhancing Reservoir Oil Recovery by Gel
Treatments. Society of Petroleum Engineers. http://dx.doi.org/10.2118/172186-MS.
Joseph, A., & Ajienka, J. A. (2010, January 1). A Review of Water Shutoff Treatment
Strategies in Oil Fields. Society of Petroleum Engineers.
http://dx.doi.org/10.2118/136969-MS.
Kuiqian, M., Yanlai, L., Lilei, W., & Xiaolin, Z. (2015, August 11). Practice of the
Early Stage Polymer Flooding on LD Offshore Oilfield in Bohai Bay of China.
Society of Petroleum Engineers. http://dx.doi.org/10.2118/174578-MS.
Lantz, M., & Muniz, G. (2014, April 12). Conformance Improvement Using Polymer
Gels: A Case Study Approach. Society of Petroleum Engineers.
http://dx.doi.org/10.2118/169072-MS.
Lantz, M., and North, W. (2014). Polymer Flooding in the Minnelusa, 2014 Minnelusa
Workshop, University of Wyoming, Gillette, WY.
Li, Q., Wu, Y., & Carroll, J. J. (2014). Advances in natural gas engineering: Gas
injection for disposal and enhanced recovery. Salem, Massachusetts: Scrivener
Publishing. http://dx.doi.org/10.1002/9781118938607.
Liu, Y., Bai, B., & Shuler, P. J. (2006, January 1). Application and Development of
Chemical-Based Conformance Control Treatments in China Oilfields. Society of
Petroleum Engineers. http://dx.doi.org/10.2118/99641-MS.
Liu, Yuzhang, Baojun Bai, and Yefei Wang. 2010. Applied technologies and prospects of
conformance control treatments in China. Oil & Gas Science and Technology–Revue
d’IFP Energies nouvelles 65.6 (2010): 859-878.
Love, T., McCarty, A., Miller, M. J., & Semmelbeck, M. (1998, January 1). Problem
Diagnosis, Treatment Design, and Implementation Process Improves Waterflood
Conformance. Society of Petroleum Engineers. http://dx.doi.org/10.2118/49201-MS.
Lu, X., Song, K., Niu, J., & Chen, F. (2000, January 1). Performance and Evaluation
Methods of Colloidal Dispersion Gels In the Daqing Oil Field. Society of Petroleum
Engineers. http://dx.doi.org/10.2118/59466-MS.

213
Lu, X., Wang, W., Wang, R., Liu, Y., & Shan, J. (2010, January 1). The Performance
Characteristics of Cr3+ Polymer Gel and Its Application Analysis in Bohai Oilfield.
Society of Petroleum Engineers. http://dx.doi.org/10.2118/130382-MS
Mack, J. C., & Smith, J. E. (1994, January 1). In-Depth Colloidal Dispersion Gels
Improve Oil Recovery Efficiency. Society of Petroleum Engineers.
http://dx.doi.org/10.2118/27780-MS.
Manrique, E., and Lantz, M. (2011). Colloidal Dispersion Gels (CDG) and Their
Application in Wyoming and Elsewhere. The 3rd Annual Wyoming IOR/EOR
Conference, Jackson Hole, WY.
Manrique, E., Reyes, S., Romero, J., Aye, N., Kiani, M., North, W., Norman, C. (2014,
March 31). Colloidal Dispersion Gels (CDG): Field Projects Review. Society of
Petroleum Engineers. http://dx.doi.org/10.2118/169705-MS.
Maya, G. A., Castro, R. H., Sandoval, J., Pachon, Z., Jimenez, R., Pinto, K. T., and
Munoz, S. F. (2014, May 21). Successful Polymer Gels Application in a Highly
Channeled Peripheral Injection Well: Tello Field Pilot. Society of Petroleum
Engineers. http://dx.doi.org/10.2118/169478-MS.
Montoya Moreno, J. M., Sandoval, R., Vargas, A., Cabrera, F. C., Romero, J. L., &
Muniz, G. (2014, April 12). Improving Sweep Efficiency In An Underpressured
Naturally Fractured Reservoir. Society of Petroleum Engineers.
http://dx.doi.org/10.2118/169091-MS.
Muruaga, E., Flores, M. V., Norman, C., & Romero, J. L. (2008, January 1). Combining
Bulk Gels and Colloidal Dispersion Gels for Improved Volumetric Sweep Efficiency
in a Mature Waterflood. Society of Petroleum Engineers.
http://dx.doi.org/10.2118/113334-MS.
Norman, C., Turner, B. O., Romero, J. L., Centeno, G. A., & Muruaga, E. (2006, January
1). A Review Of Over 100 Polymer Gel Injection Well Conformance Treatments In
Argentina And Venezuela: Design, Field Implementation and Evaluation. Society of
Petroleum Engineers. http://dx.doi.org/10.2118/101781-MS.
Pipes, J. W., & Schoeling, L. G. (2014, April 12). Performance Review of Gel Polymer
Treatments in a Miscible CO2 Enhanced Recovery Project, SACROC Unit Kelly-
Snyder Field. Society of Petroleum Engineers. http://dx.doi.org/10.2118/169176-MS.
Portwood, J. T., Lackey, S. H., & Abel, S. (2010, January 1). Selective Polymer
Treatments Improve Oil Recovery in Five Mature Southern Oklahoma Waterfloods.
Society of Petroleum Engineers. http://dx.doi.org/10.2118/129796-MS.
Reynolds, R. R., and Kiker, R. D. (2003). Produced Water and Associated Issues. A
manual for independent operator. Petroleum Technology Transfer Council, Tulsa.

214
Ricks, G. V., & Portwood, J. T. (2000, January 1). Injection-side Application of
MARCIT Polymer Gel Improves Waterflood Sweep Efficiency, Decreases Water-Oil
Ratio, and Enhances Oil Recovery in the McElroy Field, Upton County, Texas.
Society of Petroleum Engineers. http://dx.doi.org/10.2118/59528-MS.
Rousseau, D., Chauveteau, G., Renard, M., Tabary, R., Zaitoun, A., Mallo, P., Omari, A.
(2005, January 1). Rheology and Transport in Porous Media of New Water Shutoff /
Conformance Control Microgels. Society of Petroleum Engineers.
http://dx.doi.org/10.2118/93254-MS.
Seright, R. S. 1994. Propagation of an Aluminum Citrate—HPAM Colloidal Dispersion
Gel through Berea Sandstone. In Seright, R. S. 1995. Improved Techniques for Fluid
Diversion in Oil Recovery Processes. Annual Report. Report No. DOE/BC/14880-10.
U.S. DOE, Office of Fossil Energy, Washington, D.C. (September 1994 and March
1995). 51-64.
Seright, R. S., 2007. Are Colloidal Dispersion Gels Really a Viable Technology? New
Mexico Petroleum Recovery Research Center, http://baervan.nmt.edu/randy.
Seright, R. S., 2015. Colloidal Dispersion Gels—A Literature Review. New Mexico
Petroleum Recovery Research Center, http://baervan.nmt.edu/groups/res-sweep/.
Seright, R. S., Lane, R. H., & Sydansk, R. D. (2001, January 1). A Strategy for Attacking
Excess Water Production. Society of Petroleum Engineers.
http://dx.doi.org/10.2118/70067-MS.
Seright, R. S. and Liang, J. 1994. A Survey of Field Applications of Gel Treatments for
Water Shutoff. Presented at the SPE III Latin American & Caribbean Petroleum
Engineering Conference, Buenos Aires, Argentina, April 27-29. SPE 26991-MS.
http://dx.doi.org/10.2118/26991-MS.
Shevelev, P., Manrique, E. J., Aye, N. M., Romero, J. L., Salehi, M., & Garmeh, G.
(2012, January 1). In-depth Sweep Efficiency Improvement: Screening Criteria and
Engineering Approach for Pattern Evaluation and Potential Field Implementation.
Society of Petroleum Engineers. http://dx.doi.org/10.2118/160749-MS.
Sheng, J.J. 2011. Modern Chemical Enhanced Oil Recovery: Theory and Practice,
Elsevier, Burlington, MA.
Shi, Juntai, et al. Transport Model Implementation and Simulation of Microgel Processes
for Conformance and Mobility Control Purposes." Energy & Fuels 25.11 (2011):
5063-5075.
Smith, J. E. (1999, January 1). Practical Issues With Field Injection Well Gel Treatments.
Society of Petroleum Engineers. http://dx.doi.org/:10.2118/55631-MS.

215
Smith, J. and Larson, D. 1997. Bulk Gel Treatments for Water Control, Innovative
Applications of Petroleum Technology Guidebook-1997, Rocky Mountain
Association of Geologists, P249-258, Denver, CO.
Smith, D. and Ott, B. 2006b. Conformance Engineering: A Comprehensive Review. Part
2: Connecting the Problem to an Effective Solution. World Oil, June, p 95-98.
Soliman, M. Y., Rester, S., Sigal, R., Everett, D., & Johnson, M. H. (2000, January 1).
Integration of Technology Supports Preventive Conformance Reservoir Techniques.
Society of Petroleum Engineers. http://dx.doi.org/10.2118/62553-MS.
Song, W., Zeng, X., Yao, H., Li, J., Lv, X., Tian, Y., & Guo, Y. (2002, January 1).
Application of a New Crosslinked Polymer Displacement Technology at Bo-19 Block
in Gudao Oilfield. Society of Petroleum Engineers. http://dx.doi.org/10.2118/77797-
MS.
Southwell, G.P. 1999. Marathon Oil Company’s Experience with Produced Water
Control and Conformance Improvement Using Polymer Gels. Proc., In Forty-Sixth
Annual Southwestern Petroleum Short Course, Texas Tech U., Lubbock, Texas,
April, 353–365.
Sydansk, R. D. (2007). Polymers, gels, foams, and resins. Petroleum Engineering
Handbook, 5, 1219-1224.
Sydansk, R.D., & Romero-Zeron, L. 2011. Reservoir Conformance Improvement. Society
of Petroleum Engineers, Richardson, TX.
Sydansk, R. D., & Smith, T. B. (1988, January 1). Field Testing of a New Conformance-
Improvement-Treatment Chromium (III) Gel Technology. Society of Petroleum
Engineers. http://dx.doi.org/10.2118/17383-MS.
Sydansk, R. D., & Southwell, G. P. (2000, November 1). More Than 12 Years’
Experience With a Successful Conformance-Control Polymer-Gel Technology.
Society of Petroleum Engineers. http://dx.doi.org/10.2118/66558-PA.
Tor Karlsen. (2010). Introduction to flow diversion technologies, Force Workshop,
Statoil, Stavanger, Norway.
Wang, W., Gu, Y., & Liu, Y. (2002, January 1). Applications of Weak Gel for In-Depth
Profile Modification and Oil Displacement. Petroleum Society of Canada.
http://dx.doi.org/10.2118/2002-168.
Wassmuth, F. R., Green, K., & Hodgins, L. (2005, January 1). Conformance Control for
Miscible CO Floods in Fractured Carbonates. Petroleum Society of Canada.
http://dx.doi.org/10.2118/2005-243.

216
Zhidong, G., Chang, H. L., Fan, C., Li, J., Hou, W., & Dianguo, S. (2011, January 1).
Comparison of Oil Displacement Characteristics Between CDG and Polymer
Flooding in the Daqing Oilfield. Society of Petroleum Engineers.
http://dx.doi.org/10.2118/144119-MS.

217
III. An Advanced Selection Tool for the Application of In-Situ Polymer Gels for
Undiagnosed Injection Wells
Munqith Aldhaheri, Mingzhen Wei, Baojun Bai, and Mortadha Alsaba
Missouri University of Science and Technology
(SPE-182813-MS Published in SPE Kingdom of Saudi Arabia Technical Symposium and
Exhibition, Dammam, Saudi Arabia, April 2016)
Abstract
Conformance improvement by polymer gels continues to gain momentum in the field of
water management in mature oilfields. A key component for a successful treatment is the
identification of the most appropriate gel technology for a targeted reservoir. Advanced
approaches provide efficient screening and ranking tools; however, to the best of our
knowledge, no such approaches have been developed for polymer gels so far.
In this study, we utilized a machine-learning technique to develop an advanced
selection methodology for the application of polymer gels in injection wells. Historical
data of four in-situ gel systems including bulk gels, high temperature bulk gels, colloidal
dispersion gels, and weak gels were used to train logistic regression models. Data sets of
19 property or parameter were tested for potential outliers, missing values were imputed,
and some variables were categorized in order to treat data gaps. To identify the most
discriminating variables, the univariate entropy R2, stepwise regression, and area under
ROC curve (AUC) heuristic technique were employed. The candidate variables were then

218
modified according to some considerations like the match of univariate logistic
probability to conformance engineering considerations. To consider the regional
tendencies in application of polymer gels, we developed three probabilistic models that
include different number of treating technologies. Furthermore, to meet the new
developments in the application of some gel systems, we constructed a variant model
without the treatment timing indicator (water cut) for each main logistic classifier.
Results show that logistic classification models and their variants correctly predict
the proper gel technology in more than 85% of projects in the training and validation
samples with a minimum AUC of 0.9375. We also used a prediction profiler to visually
monitor performances of the classifiers and certain tendencies were identified by the
investigation of the mispredicted projects. The novelty of the new methodology is its
capability to predict the most applicable gel technology for undiagnosed injection wells.
Introduction
Among conformance improvement technologies, polymer gels have been proven to be
effective in addressing water production problem and in increasing oil recoveries in
mature oilfields. However, the recognition of the best suited gel technology is not an easy
task for operators and reservoir engineers. This largely is due to existence of numerous
types of the conformance problems and gel technologies, and the fact that treatment of a
specific problem requires a distinct gel technology. Also, characteristics of conformance
issues which are the selection parameters are evaluated using several reservoir properties
and diagnostic techniques. Consequently, many diverging and sometimes qualitatively
motivated opinions have been proposed on the applicability of polymer gels as shown in

219
Table 1. Furthermore, costly diagnosis techniques make the preliminary assessment of
the potential gel system extremely important in these capital sensitive gel projects.
Table 1. Some Expert Opinions for Drive-fluid Channeling Strength Used in
Evaluation of Polymer Gels Applicability
Parameter Weak
Channeling
Strong
Channeling Reference
Problem Zone
Permeability
< 2000 md > 2000 md Sydansk & Southwell
(2000)
<10 Darcies > 10 Darcies
Sydansk (2007)
Permeability
Contrast
KStreak > (2-10) KMatrix KStreak > (50) KMatrix
Baker et al. (2012)
Khigh < 1000 KMatrix Khigh > 1000 KMatrix
Sydansk (2007)
Permeability
Variation
DPc > 0.6 - Reynolds and Kiker
(2003)
0.55 < DPc < 0.7 DPc > 0.7 Castro et al. (2013)
Drive-fluid
Injectivity
< 10 bpd/psi > 20 bpd/psi Pipes & Schoeling
(2014)
- > 5 Expected 1 Tweidt et al. (1997)
Recovery factor - < 33 % Montoya Moreno et al.
(2014)
Flow Regime Radial Linear Sydansk (2007)
Interwell
Communication2
< 0.5 > 0.5 Baker et al. (2012)
Formation Type - Naturally Fractured
Unconsolidated Current Study
Drive-fluid
Breakthrough Time Months to years Weeks to Months Current study
Tracer breakthrough
Time Weeks to Months Hours to Days Current study
Water Cut
Increment Rate < 0.5 per year > 0.5 per year Current Study
(1) Based on average reservoir parameters, (2) correlation coefficient of producer-injector
pressures or flow rates.

220
Reservoir engineers usually refer to screening criteria to identify the potential
enhanced oil recovery (EOR) processes for a given reservoir. EOR screening criteria
represent the intervals of validity of each influential reservoir and fluid property based on
the successful field tests, engineering considerations, and experts’ opinions (Alvarado
and Manrique 2010). Screening criteria are generally classified into two classes
depending on the form and driver of the method itself: conventional and advanced. For
traditional guidelines, screening criteria are represented by the ranges of the influential
reservoir/fluids characteristics that were extracted from successful field trials. The driver
of this type of EOR screening criteria is the simple comparison of a given reservoir
conditions with the prescribed ranges. Thus, they provide “go / no-go” decision type
criteria and are incapable of ranking the candidate solutions. Advanced screening criteria
use artificial intelligence and machine learning techniques where historical field data are
used to train classifiers that identify the candidate EOR processes based on the similarity.
Their outcomes are usually the probabilities of the considered technologies; therefore,
they can rank the proposed solutions and indicate an analog for the field under
evaluation.
Artificial intelligence and machine learning techniques have been widely and
successfully applied in screening and ranking of different EOR techniques. Alvarado et
al. (2002) pioneered the application of machine learning in this field and since then, many
advanced models have been developed to screen and rank EOR processes (40 studies
based on the SPE papers). However, to the best of our knowledge, no study has been
accomplished for gel technologies. The evaluation of polymer gels is basically a multiple
screening problem in which all considered gel technologies are simultaneously assessed

221
for a given field. Recall that conventional guidelines lack ranking functionality and might
produce contradictory results in such situations (i.e., multiple screening).
Furthermore, for sandstone reservoirs that exploited by waterflooding, the
traditional screening criteria have poor discriminating powers as their validity limits
(application ranges) are intersected over wide intervals as shown in Figure 1 (Aldhaheri
et al. 2016a). To demonstrate the weak selectivity of the conventional guidelines, an
illustrative case that has common parameter values was evaluated using polymer gels
screening excel spreadsheet (Aldhaheri et al. 2016a). Figure 2 obviously shows that for
these common reservoir conditions, three gel technologies are applicable (green cells).
Here, a question might rise that a reservoir may exhibit multiple forms of permeability
heterogeneity, so then it is normal that more than one gel technology is applicable.
However, it is still favorable to rank these potential agents. Finally, Aldhaheri et al.
(2016b) illustrated that 13 different parameters have been used to characterize drive-fluid
channeling, the most important parameter in polymer gel applicability evaluation process.
Interestingly, eight of these parameters are considered in the traditional screening
guidelines; the matter that implies that there are large knowledge potentials in the data of
the screening parameters that can be extracted if the right tools applied.
Evidently, there is a persistent need for efficient screening tools for polymer gels
that combines both robust statistical methods and reservoir engineering best practices.
This paper aims to extend the research on the screening of polymer gels by specifically
investigating why machine-learning techniques should be adopted for the distinguishing
of gel technologies. We utilized logistic regression technique to create classification rules
based on the historical field trials of four in-situ gel systems.

222
Figure 1. Conventional screening criteria for polymer gel technologies
In the next sections, gel systems, logistic regression principles, and data
compilation and exploration are illustrated. The observations and application tendencies
that called for the development of multiple probabilistic models with variants will be
discussed. Then, the tasks of data processing, variable treatment and selection, and model
15-39
0-97
9-27
2-7
15-37
8-706
3050-8700
18-213
109-163
0.6-0.91
19-2600
20-34
4-32
0-96
0.6-17
3-131
18-42
1-40
300-9700
5-200
72-202
0.5-0.9
8-850
10-26
25-38
80-90
9-14
3-4.6
12-31
3-4800
910-12500
42-400
275-350
0.8-0.82
30-2500
10-36
5-49
52-100
1-80
0.1-100
12-42
1-600
975-10000
8-670
72-208
0.65-0.91
3-1216
8-35
0.1 1 10 100 1000 10000
%Recovery Factor
Water cut, %
Mobility Ratio
Salinity, kppm
API Gravity
cpOil Viscosity
Depth, ft
Net Pay, ft
Temperature, F.
DPc, fraction
mdPermeability
Porosity, %
WGs
CDGs
OCAP-BGs
MCAP-BGs

223
construction and validation are discussed in details. Some observations about the
performances of the logistic models and the misclassified projects are presented as well.
Polymer Gel Conformance Improvement Technologies
Polymer gels have been proven to be an effective solution for a variety of conformance
issues, especially in injection wells. For this well type, synthetic polyacrylamide-based
gels are the most widely applied chemical system (Lantz and Muniz 2014). In this paper,
four partially hydrolyzed polyacrylamide, in-situ gelling conformance systems are
considered for screening purposes. The following is a brief description of these systems
and more details can be found in the work of Aldhaheri et al. (2016a).
Figure 2. Polymer gel screening results for an illustrative sandstone reservoir field
produces by waterflooding

224
Bulk Gels. Bulk gels (BGs) can be formed using high molecular weight (8-13 million
daltons) partially hydrolyzed polyacrylamides with a crosslinker. Depending on the type
of the crosslinking agent, two systems have been developed. For MARCITSM
gels
developed by Marathon Oil Company, polyacrylamides are crosslinked using a trivalent
metal ion, which is usually Chromium (III) (Sydansk and Smith 1988) and applied in a
formation temperature less than 220°F (Sydansk and Southwell 2000).
For high temperature applications, medium molecular weight polyacrylamide
polymers are crosslinked with an organic agent and a stabilizer to delay the gelation
process. An example of this specialized chemistry is the UNOGEL technology developed
by Union Oil Company of California (UNOCAL) which can be applied in temperature
ranges of 200 to 300°F (Norman et al. 2006). In this study, these gels are depicted as
organically-crosslinked-polyacrylamides bulk gels (OCAP-BGs) to discriminate them
from the metallically-crosslinked-polyacrylamide systems described above (BGs).
Colloidal Dispersion Gels. Colloidal dispersion gels (CDGs) are in-situ microgel
aggregates that are formed by crosslinking of low concentrations (150 to 1200 ppm) of
high-molecular-weight (> 22 million daltons) hydrolyzed-polyacrylamide polymer with
aluminum citrate or chromic citrate and produce weak gels. Such low polymer
concentrations are not enough to form a continuous network, and thus, they produce a
solution of separate gel bundles that are almost spherical particles with sizes in the range
of nanometers of 50 to 150 nm (Castro et al. 2013). These gels can flow under differential
pressures that are greater than their transition pressures, as it was experimentally
demonstrated by Mack and Smith (1994). It is noteworthy that in this study, we have

225
considered only CDG historic cases that involved the co-injection of the polymer and
crosslinker where the early sequential gel applications were precluded.
Weak Gels. Weak gels (WGs) are a subdivision of bulk gels that terminologically have
been separated to distinguish their objectives of application from those of the original
technology (i.e. BGs). Essentially, these agents are low to intermediate polymer
concentrations, weak strength bulk gels. They can have the same or different mechanisms
of BGs for improving sweep efficiency depending on how and where they are applied.
Some researchers have implied that any bulk gel system (regardless of its concentration)
is a weak gel if it forms a flowing gel in the reservoir conditions under certain ranges of
pressure gradients. Sheng (2011) mentioned that weak gels have high resistance to flow
but are still able to flow so they can be injected deep into the reservoir. Han et al. (2014)
provided similar ideas and referred to WGs and CDGs as flowing gel processes.
Furthermore, Song et al. (2002) and Lu et al. (2010) pointed out that WGs are oil-
displacement agents in addition to their function as blocking agents. In this study, all
reviewed weak gel history cases are from Chinese oilfields where this conformance
system has been extensively applied in heavy oil, unconsolidated sandstone reservoirs as
an in-depth fluid diversion technology.
Logistic Regression Principles and Performance Measures
Logistic regression is considered one of the most reliable classification techniques and
has become a regularly used tool by most statisticians. Its S-shaped distribution function
is encountered in many fields including banking, demographics, epidemiology,

226
psychology, and marketing. Due to its many qualities, this technique has taken the place
of its rival in many supervised classification problems, especially scoring problems
(Tuffery, 2011).
In statistics, logistic regression is used to model categorical dependent variables
that have discrete qualitative outcomes. It can handle qualitative variables with two or
more responses, and independent variables can be quantitative or qualitative. It is
classified as binary, multinomial, and ordinal logistic regression when the response
variable has 2, ≥3 nominal, ≥3 ordered categories, respectively. Logistic regression
measures the relationship between these categorical responses that have S-shaped
distribution as shown in Figure 3 with the predictors and produces a probability of a
response Prob(Y =1 /X=x) that is ranging from 0 to 1. For this S-curve, we can write this
probability π(x) = Prob(Y =1 /X=x) using the sigmoid function:
Figure 3. Illustration of the sigmoid S-shaped logistic distribution function
0
0.2
0.4
0.6
0.8
1
-10 -5 0 5 10
Pro
bab
ilit
y o
f D
ep
en
den
t V
ari
ab
le
Independent Variable
Y= Event occurrence
Y= Non-event

227
𝜋(𝑥) =𝑒
𝛽0+∑ 𝛽𝑗𝑥𝑗𝑗
1+𝑒𝛽0+∑ 𝛽𝑗𝑥𝑗𝑗
(1)
The ratio of the probability of an event occurring π(x) to the probability of non-event (1-
π(x)) is called the odds. In logit version, the log of the odds is modeled as a linear
combination of regressors Xs as shown below:
log (𝜋(𝑥)
1−𝜋(𝑥)) = 𝛽0 + 𝛽1𝑋1 + ⋯ + 𝛽1𝑝𝑋𝑝 (2)
When Xi changes from x to x + 1, the variation in the ratio of the probability of the event
occurring Y=1 against the probability of non-event Y=0, is presented as odds ratio:
𝑂𝑅 =𝜋(𝑥+1)/[1−𝜋(𝑥+1)]
𝜋(𝑥)/[1−𝜋(𝑥)]= 𝑒𝛽𝑖 (3)
In this case, logit (π(x)) increases by the coefficient βi of Xi and the odds are
multiplied by exp(βi) as illustrated in the above equation. Logistic regression employs
maximum likelihood method to estimate the coefficient βi of the model and its models are
not constrained by the assumption of normally distributed data (Sharma, 1996). In this
supervised classification technique, historical data are used to train a model to build a
classification rule that is then utilized to classify new candidates into one of the
considered responses. Logistic regression reliability is easy to monitor using a number of
statistical measures (Tuffery, 2011). In this study the following comprehensive
performance indicators were used to evaluate the goodness-of-fit of the developed
probabilistic models:
1- Entropy R2 (U): the ratio of the difference to the reduced negative log-likelihood
values. It is sometimes referred to as U, the uncertainty coefficient, or as McFadden’s
pseudo R2. This measure ranges from zero for no improvement to 1 for a perfect fit.

228
2- Correct Classification Rate (CCR): is a measure to assess predictivity of a scoring
model that ranges between 0 and 1. It is represents the fraction (or percentage) of the
correctly classified observations and expressed as:
𝐶𝑜𝑟𝑟𝑒𝑐𝑡 𝐶𝑙𝑎𝑠𝑠𝑖𝑓𝑖𝑐𝑎𝑡𝑖𝑜𝑛 𝑅𝑎𝑡𝑒 =(𝑇𝑃+𝑇𝑁)
𝑇𝑃+𝐹𝑁+𝐹𝑃+𝑇𝑁 (4)
Where TP stands for True positives (events predicted as events), TN for the True
negatives (non-events predicted as non-event), FP for the False positives (events
predicted as non-events), and FN for the False negatives (non-events predicted as events).
In other words, this criterion is the ratio (0-1) of the number of correctly classified cases
to the total number of observations used in construction or testing of a model.
3- Area Under ROC Curve: AUC is a global performance measure of logistic regression
models that assesses the area under the Receiver Operating Characteristics Curve shown
in Figure 4. The ROC curve was originated in signal detection and processing field and
represents a graphical representation of the discriminatory power of a binary
classification system and it is created by plotting the true positive rate known as
sensitivity (SENS) against the false positive rate or (1-specificity) where specificity
(SPEC) indicates the proportion of correctly predicted non-events. AUC values range
from 0 to 1 where 1 represents a perfect model and an area of 0.5 indicates a worthless
model (Tuffery, 2011).
𝑆𝑒𝑛𝑠𝑖𝑡𝑖𝑣𝑖𝑡𝑦 =𝑇𝑃
𝑇𝑃+𝐹𝑁 (5)
𝑆𝑝𝑒𝑐𝑖𝑓𝑖𝑐𝑖𝑡𝑦 =𝑇𝑁
𝐹𝑃+𝑇𝑁 (6)
𝐴𝑈𝐶 = ∫ 𝑆𝐸𝑁𝑆(1 − 𝑆𝑃𝐸𝐶). 𝑑(1 − 𝑆𝑃𝐸𝐶)1
0 (7)

229
Figure 4. Illustrative Receiver Operation Characteristic Curve (ROC) plot shows
typical curves for a classification model
On the basis of the strengths and weaknesses of the above measures, many
authors have referred to AUC as the most comprehensive measures to assess the
discriminatory power of the logistic models especially in banking scoring studies (Van
Gool et al. 2009).
It is important to know why logistic regression has been adopted in favor of other
supervised classification techniques. We identified that reservoir lithology and formation
type considerably influence the applicability criteria of some influential parameters such
as porosity, permeability, depth, and oil viscosity as shown in Figure 5 for the reservoir
permeability. If validity limits of properties were established without considering these
affecting aspects, then the results of processing such mixed data will falsify where
polymer gels have actually been applied (Aldhaheri et al. 2016a). Therefore, for adequate
0
0.2
0.4
0.6
0.8
1
0 0.2 0.4 0.6 0.8 1
Sen
sit
ivit
y (
tru
e p
osit
ive r
ate
)
1-Specifcity (false positive rate)
Excellent
Good
Fail

230
screening, analyses should be performed according to the affecting aspects such as
lithology, formation type, and IOR/EOR process. This means that there is a classification
rule (secondary) for every category of the above aspects that is required to individually
taken into considerations. Logistic regression creates an odd ratio for each category of the
qualitative variables, which allow us to have sub classification rules that account for these
categories as it illustrated in the next sections (Tuffery, 2011).
Figure 5. Comparison of permeability applicability ranges for polymer gels
according to reservoir lithology and formation type
Database Compilation and Data Processing
The data preparation step deals with the choice of the desired variables, the compilation
of data sets, and the treatment of missing values and outliers. A specialized database was
3-62
10-193
4-500
30-294
8-850
19-1407
500-1216
1325-2500
1230-2634
1 10 100 1000 10000
Average Reservoir Permeability, md
San
dsto
ne
C
arb
on
ate
Un
co
nso
lid
ate
d
Matr
ic-r
ock
N. fr
actu
red

231
built from gel treatment case histories published in SPE papers and U.S. Department of
Energy reports from 1978 to 2015. Currently, the database includes 111 field trials for the
considered technologies and over 50 parameters that include reservoir and fluids
properties, treatment operating parameters, and performance indicators. Table 2 shows a
summary of project and treatment frequencies in the current survey of injection well gel
field applications. For reservoir and fluids characteristics, the reported values are the
averages from the properties of the reviewed fields. Additionally, some parameters’
estimates are time-specified, and the provided data are their values at the times of
evaluations.
Table 2. Statistics of Projects and Treatments in Injection-Well Gel Field Project
Survey
Gel Technology No. of
Projects
No. of
Treatments
Treatment per
Project (TPP)
Bulk Gels 57 607 10.6
Microgels (CDGs) 44 80 2
Weak Gels 10 110 11
Total 111 797 7.2
Property Selection. In total, 19 variables have been considered in this study, where
several of these parameters are included in the conventional screening criteria for
polymer gels (Aldhaheri et al. 2016a). The variables include 15 reservoir rock and fluids
properties and four production-related parameters such as water cut and recovery factor.
Table 3 presents a descriptive statistical summary for the continuous explanatory

232
variables and Figure 6 shows distributions of gel systems according to the categories of
the three qualitative aspects that are reservoir lithology, formation type, and IOR/EOR
process.
Figure 6. Distributions of polymer gel projects according to reservoir
lithology/formation type (left) and IOR/EOR process (right)
3 14
26
6 8
39
5
4
6 3
14
69
11 14
Mat. NF. Mat. NF. Uncon.
Formation Type
WGs
CDGs
BGs
Carbonate Sandstone
40
4 11
2
17
27
7
3
64
34
11
2
WF PF CO2 Steam
IOR/EOR Recovery Process
WGs
CDGs
BGs

233
In this study, the variable “flood life” represents the time period from the
beginning of injection operations in the targeted wells to date of the treatment. This
parameter and water cut were used to represent the timing of the gel treatments in the
field development stages. It is noteworthy that for OCAP-BGs, all available field trials
(seven projects) were used in the development of first model regardless their technical or
economic feasibility due to the low number of the available projects for this technology.
Generally, field projects were divided based on the type of gel system into a 75% training
set and a 25% test set that were utilized in the out-of-sample validation to demonstrate
the statistical accuracy of the developed models.
Missing Data Treatment. For reservoir and fluids properties, missing data were
progressively evaluated using three different approaches. First, the required information
for the reservoirs of interest was extracted from other SPE papers that deal with
application of IOR/EOR processes for the field. Other sources also were utilized for data
filling purposes like National Petroleum Council Public Database (1995), Wyoming Oil
Reservoir EOR Database (2010), Oil and Gas Journal Data Book (2006), and Oil and Gas
Journal EOR Surveys (2008). Secondly, we have taken the advantage of existence of
good correlations for some properties to predict the missing values. Good association
powers were obtained for permeability vs. porosity, and viscosity vs. API gravity.
However, for properties that really have low number of data points such as DPc,
mobility, and water salinity, we did not obtain good association trends. Therefore, for
these properties and other operational parameters, the multivariate imputation by chained
equations (MICE) package in R software (Van Buuren and Groothius, 2009) was used to
estimate missing values. The distinctive feature of this imputation method lies in its

234
Table 3. Descriptive Statistical Summary of Screening Parameters in Gel Project
Database
Parameter ϕ Kmin Kavg Kmax DPc Contrast T h
Units % md md md fraction ratio °F ft
Points Count 111 93 106 95 77 92 111 98
Missing Points 0 18 5 16 34 19 0 13
Mean 18.7 72.4 338.3 1936.6 0.77 7372 153.6 87.3
Median 17.5 10 109.5 1000 0.77 100 145.4 37.4
St. Dev 6 182 539 3341 0.09 52420 48 120
CV 0.35 2.5 1.59 1.7 0.11 7.1 0.31 1.38
Minimum 7.6 0.01 2.7 5 0.50 1.94 72 5
Maximum 36 1035 2634 29511 0.97 500000 350.3 670
1st quartile 15 1 34 290 0.71 17.3 122 23
3rd
quartile 22 60 341 2992 0.82 600 177 80
IQR 7 59 307 2702 0.11 582.7 55 57
Lower Limit 3 -87.5 -427 -3763 0.55 -857 40 -63
Upper Limit 33 148.5 802 7046 0.99 1474 258 166
# of Outliers 5 10 15 2 1 14 5 16
Parameter D μ API Sal M WC FL RF
Units ft cp deg. ppm ratio % year %
Points Count 111 101 104 61 32 78 98 76
Missing Points 0 10 7 50 39 33 13 35
Mean 5891 92.8 27.2 37206 8.6 62.2 11.5 19.4
Median 5628 11.0 25 15781 4.7 83.3 6.5 15.7
St. Dev 2582 488 8 43965 14 39 12.7 12
CV 0.44 5.26 0.28 1.18 1.66 0.63 1.1 0.64
Minimum 300 0.3 11.5 150.0 0.6 0 0 1.6
Maximum 12500 4800 42.5 173207 80 100 53 49.4
1st quartile 4010 4 21 5496 2 12 2 9
3rd
quartile 7875 28 34 67382 9 95 18 25
IQR 3866 24 13 61886 8 83 16 16
Lower Limit -1789 -33 1 -87333 -10 -112 -22 -16
Upper Limit 13673 65 54 160211 21 219 43 49
# of Outliers 0 16 0 2 2 0 5 0

235
maintaining of the original variability of the incomplete data sets, so imputed values do
not influence the validity limits of screening guidelines.
This method randomly estimates five values for missing data points that are
within the validation limits (minimum, maximum, and gaps) of the subject parameter. In
addition, this method uses the predictive mean matching technique to estimate the
missing values. These two features of MICE package enabled us to minimize the bias
(toward gel systems that have large number of projects) that was observed when other
imputation techniques used. Finally, from the five imputed data sets for each parameter,
we selected one that maintains the original univariate discriminating power (between gel
systems) for the parameter under evaluation using logistic Entropy R2.
Outliers Identification and Treatment. To ensure data quality, outliers were detected
using the scatterplots, the interquartile range method (IQR), and the three standard
deviation rules. The IQR method indicated that some data sets have large number of
potential outlier points as shown in Table 3. In this study, reservoir engineering
viewpoints have been adopted in parallel with statistician standpoints to judge possible
outlier points, and thus, no data points were ruled out in this study. Further illustration of
this step can be found in Aldhaheri et al. (2016a). Finally Normality test was performed
to check the data using Shapiro-Wilk W test in JMP® where DPc and depth data sets
were identified as having normal distributions. A logarithm transformation was taken for
both data sets; however, no improvements were obtained in terms of separating powers of
the constructed models.

236
Collinearity of Independent Variables. For multiple regression techniques, linear links
between independent variables represent an important statistical issue. This potential
issue is highly expected in analysis of EOR data sets because some reservoir rocks and
fluids properties are physically related. For example, porosity and permeability,
temperature and depth, and oil viscosity and API gravity are physically linked based on
reservoir engineering principles. In addition, some EOR processes function based on
certain values for reservoir characteristics such steam injection with respect to as oil
viscosity; thus, reservoir properties might be associated with EOR methods. The
existence of strong correlations between independent variables causes the problems of
collinearity and multicollinearity that reduce the predictive powers of the developed
models especially for validation samples.
The collinearity is assessed by the mean of the Pearson correlation coefficient for
numerical predictors and by the Chi-Square test for qualitative variables. For quantitative
predictors, an empirical rule is used that states that the correlation is unacceptable when
the correlation coefficient exceeds 0.9, very risky when the coefficient exceeds 0.8, and
needs to be treated with caution when it exceeds 0.7 (Tuffery, 2011). The
multicollinearity between both types of independent variables is frequently checked by
mean of the variance inflation factor (VIF) and as a rule of thumb it should be less than 5
or at least 10 (Tuffery, 2011).
In this study, we indicated that compiled data has generally weak to moderate
associations based on the aforementioned rules. This simply is because that the data was
collected for different gel systems in terms of mechanisms and specifications. For
variable pairs, the correlation matrix presented in Table 4 below shows a weak

237
association for the majority of properties and a moderate association for few properties
with a maximum correlation coefficient 0.71. Chi-Square test shows a strong association
for categorical variables; however, there were cells with a frequency of less than 5; the
matter that make this test not useful. Most importantly, variance inflation factors were
estimated for both quantitative and qualitative predictors that considered in the final
models and were less than 5 for all variables and all models with a maximum of 4.69 as
shown in Table 5 for G4 Model which will be discussed in the next sections. The above
results indicate that there is no damage in the predictive powers of logistic models that
may result from the collinearity and multicollinearity issues. It is important to note that
qualitative predictors were transformed into dummy variables to facilitate the estimation
of variance inflation factors.
Selection and Treatment of Independent Variables
Discriminatory power is an important consideration in performance and selection of a
supervised classification model. The statistical accuracy or the goodness-of-fit of a
predictive model always increases by including more independent variables. However,
including large number of variables would make the model unnecessarily large and deter
the candidate injectors when confronted with the required number of properties and
parameters. Therefore, the authors typically adopt explanatory variable selection
techniques to identify the most discriminating predictors.
Several variable selection methods have been proposed for logistic regression
based on different logic principles (Bursac et al. 2008). Some methodologists (especially
in Epidemiologic) suggest the inclusion of all clinical and other relevant variables in the

238
Table 4. Pearson Correlation Matrix for all Quantitative Independent Variables
ϕ Kmin Kavg Kmax DPc Con T h
ϕ 1.00 0.45 0.71 0.42 0.27 0.22 0.17 0.13
Kmin 0.45 1.00 0.58 0.10 0.10 0.05 0.19 0.12
Kavg 0.71 0.58 1.00 0.66 0.20 0.15 0.13 0.07
Kmax 0.42 0.10 0.66 1.00 0.23 0.11 0.01 0.12
DPc 0.27 0.10 0.20 0.23 1.00 0.17 0.10 0.19
Con 0.22 0.05 0.15 0.11 0.17 1.00 0.02 0.07
T 0.17 0.19 0.13 0.01 0.10 0.02 1.00 0.06
h 0.13 0.12 0.07 0.12 0.19 0.07 0.06 1.00
D 0.35 0.19 0.29 0.15 0.29 0.07 0.46 0.10
μ 0.36 0.47 0.50 0.10 0.23 0.01 0.33 0.15
API 0.43 0.24 0.42 0.27 0.09 0.13 0.10 0.21
Sal 0.16 0.15 0.21 0.08 0.01 0.07 0.06 0.19
M 0.55 0.36 0.51 0.32 0.26 0.01 0.14 0.01
WC 0.24 0.10 0.08 0.12 0.37 0.07 0.01 0.25
FL 0.08 0.01 0.04 0.00 0.18 0.03 0.02 0.35
RF 0.11 0.02 0.04 0.02 0.15 0.04 0.06 0.12
D μ API Sal M WC FL RF
ϕ 0.35 0.36 0.43 0.16 0.55 0.24 0.08 0.11
Kmin 0.19 0.47 0.24 0.15 0.36 0.10 0.01 0.02
Kavg 0.29 0.50 0.42 0.21 0.51 0.08 0.04 0.04
Kmax 0.15 0.10 0.27 0.08 0.32 0.12 0.00 0.02
DPc 0.29 0.23 0.09 0.01 0.26 0.37 0.18 0.15
Con 0.07 0.01 0.13 0.07 0.01 0.07 0.03 0.04
T 0.46 0.33 0.10 0.06 0.14 0.01 0.02 0.06
h 0.10 0.15 0.21 0.19 0.01 0.25 0.35 0.12
D 1.00 0.22 0.06 0.18 0.33 0.41 0.17 0.06
μ 0.22 1.00 0.31 0.10 0.66 0.07 0.02 0.14
API 0.06 0.31 1.00 0.07 0.46 0.14 0.34 0.33
Sal 0.18 0.10 0.07 1.00 0.13 0.10 0.19 0.04
M 0.33 0.66 0.46 0.13 1.00 0.15 0.03 0.15
WC 0.41 0.07 0.14 0.10 0.15 1.00 0.41 0.46
FL 0.17 0.02 0.34 0.19 0.03 0.41 1.00 0.51
RF 0.06 0.14 0.33 0.04 0.15 0.46 0.51 1.00

239
Table 5. Values of Variance Inflation Factor for Independent Variables Considered
in G4 Model
Term Variance Inflation Factor (VIF)
Intercept -
Dummy Lithology [0] 1.98
Dummy Formation [0] 2.82
Dummy Formation [1] 3.36
Dummy IOR2 [0] 4.69
Dummy IOR2 [1] 3.45
ϕ 3.22
Kavg 3.98
DPc 1.43
T 3.73
h 1.33
D 3.67
μ 3.12
WC 2.37
RF 1.82
model regardless of their significance in order to control for the confounding. This
approach, however, can lead to numerically unstable estimates and large standard errors
(Hosmer and Lemeshow 2013). More common, predictors’ selection is based on the
statistical significance as in the stepwise regression methods; however, this strategy may
results in omitting of some surely relevant variables. Statistical significance has been
combined with change-in-estimate criteria to develop what so called the purposeful
selection algorithm by Hosmer and Lemeshow (2013). For EOR screening, we noticed

240
that most previous advanced methodologies have utilized all available variables, which
means that the selection of the predictors has typically relied on intuitive reasoning and
historical precedent.
For logistic regression, Hand and Henley (1997) describe three approaches to
select the right predictors in a classification problem including expert knowledge,
stepwise regression, and AUC heuristic procedure. Initially, the most discriminating
variables are nominated based on the intuitions of the experts and the previous studies
(Hosmer et al. 2013). Tuffery (2011) mentioned in his book that variable selection is
crucial and it essential to have a thorough knowledge of the data and their functional
significant. He has also suggested the use of variable clustering for ensuring that at least
one representative has been selected for each class of variables. In this study, our first
goal is to develop models that are simultaneously able to select and screen gel systems of
interest. A model that includes only the discriminating variables regardless their
relevance to the gel treatment applicability will select a gel technology for given injector.
However, this model serves only as a classifier and it does not have the ability to check
whether that the other gel technical guidelines have been satisfied or not. On the other
hand, investigating applicability of polymer gels requires considering all technically
relevant variables, so the resulted models can nominate one technology in favor of others
and ensure its compatibilities with reservoir properties and injected fluids (EOR advisor).
Therefore, we have given the priority to the discriminating parameters that appeared in
the conventional screening guidelines which are listed in the first column of Table 6.
Secondly, we detected and ordered the most predictive variables based on the
univariate entropy R2
and the statistical significance as shown in the second column of

241
Table 6. Then stepwise regression based on the Bayesian information criterion (BIC)
was used to provide an initial combination of the variables, which indicated the 13
variables (or categories) marked in the third column of Table 6. As a third approach, we
utilized AUC heuristic technique to achieving a balance (trade-off) between the number
of variables in the model and a comprehensive measure of model goodness-of-fit.
Baesens et al. (2009) proposed this procedure in the credit scoring, which removes in
each consecutive step the variable which causes the smallest increase in AUC. A perfect
predictive model can be obtained by inclusion of 17 variables out of the 19 available
properties based on both R2 and AUC as shown in Figure 7. However, such model may
tend to over-fit as mentioned earlier; therefore, we have taken the following five
perspectives into considerations to find the right number of variables:
Figure 7. AUC heuristic variable selection approach for logistic model bias-variance
trade-off
0.11
0.22
0.43
0.48
0.65
0.80 0.84
0.90
1.00
0.7035
0.7786
0.8738 0.8949 0.9551 0.9863 0.9917 0.9961 1 1
0
0.2
0.4
0.6
0.8
1
0 2 4 6 8 10 12 14 16 18
Number of Independent Variables in Model
Entropy RSquare
Average AUC
Point chosen as trade-off between
maximizing AUC/R2 and minimizing # of
variables

242
Table 6. Summary of Independent Variables Selection Criteria for Logistic
Classification Models
Variable Conventional
Guidelines
Entropy
R2
Stepwise
Regression
Data
Availability
IOR/EOR process 0.2221
Temperature 0.2208
Water cut 0.1891 XX
Recovery Factor 0.1777 XX
Formation Type 0.1674
Permeability 0.1463 X
Porosity 0.1112
Net thickness 0.0998
Min. permeability 0.0974 XX
Max. permeability 0.0869 XX
Oil viscosity 0.0813 X
Flood life 0.0810 X
Lithology 0.0751
Dykstra-Parsons coefficient 0.0689 XX
Permeability contrast 0.0448 XX
Depth 0.0361
Mobility ratio 0.0319 XXX
Water salinity 0.0300 XXX
API gravity 0.0004 X
: considered or suggested parameter, XXX: data set has few data points
Data Availability and Quality. Table 3 shows that some data sets suffer from low
number of compiled data points even after several data filling campaigns. This indicates
that the operators of these fields have a problem regarding the availability of data for
these properties. Examples for these parameters are mobility ratio and water salinity

243
where only 27 and 56 data points were provided in a set of 111 records. It is important to
note that water salinity values might change due to injection processes conducted in the
oilfields; however, most studies do not illustrate whether the provided values are updated
or not. To less extent, minimum permeability, maximum permeability, DPc, and water
cut are also plagued by this issue. Based on these aspects (i.e. availability and quality),
we decided to rule out mobility ratio and water salinity if they approved to be
insignificant by other statistical measures.
Discriminatory Powers. Variables that were identified as having good ability to
differentiate responses were considered strong or important predictors. Entropy R2, a
univariate performance measure was used to evaluate this ability and to order variables as
shown in Table 6. This table shows that most traditional screening variables have high R2
and IOR/EOR process and temperature have the highest degree of selectivity. Also, it
indicates that API, water salinity, mobility ratio, and depth have the weakest predictive
powers. It was recognized that missing value imputation has reduced the discriminatory
powers of some variables like DPc, water cut, net thickness, and recovery factor, where
this reduction is dependent on the amount of missing data.
Logistic Probability Plots. In this study, we utilized the univariate logistic probability
plots to examine probability distributions among response for all independent variables.
The logistic probability plot gives a complete picture of what the logistic model is fitting.
At each x value, the probability scale in the y direction is divided up (partitioned) into
probabilities for each response category. The probabilities are measured as the vertical

244
distance between the curves, with the total across all Y category probabilities summing to
1 (JMP 2015). Thus the separating curves or lines between partitions represent
probability trends of the response outcomes based on the values of an independent
variable.
In this stage, variables that were approved to be discriminating by the
aforementioned steps and have probability patterns that match the engineering
considerations and/or the well-known application trends were confirmed to be considered
in model construction stage. For example, from conformance engineering principles,
drive-fluid channeling strength increases with reservoir heterogeneity and BGs and CDGs
are applied to treat strong and weak channeling strengths, respectively. It can be easily
recognized in Figure 8-a that chances of BGs, OCAP-BGs, and WGs increase and
probabilities of CDGs decrease as reservoir heterogeneity represented by DPc increases.
Furthermore, Aldhaheri et al. (2016b) illustrated that BGs have been extensively applied
in well-developed conformance issues that characterized by high oil recoveries. On the
other hand, CDGs have been mainly applied in undeveloped problems with low recovery
factors. This indicates that with increasing recovery factor, chances of BGs increase and
probability of CDGs decrease. Not surprisingly, recovery factor probability plot shown in
Figure 8-b adequately follows this application trends and confirm the predictive power of
this parameter. Other examples for these matchings are shown in Figure 8-c and Figure 8-
d for water cut and net thickness.
Alternatively, independent variables that have weak predictive powers and have
complex, intersected probability patterns or have a similar pattern of a related parameter
were confirmed not to be considered in the next step. Figure 9 shows that permeability

245
contrast and minimum permeability have complicated probability distributions and
mobility ratio has almost identical pattern to that of oil viscosity. It is important to note
that in case of permeability contrast, the separating curve of CDGs is drawn in the middle
of their cloud of points and chances of this gel system increase as contrast (heterogeneity)
increases. Based on these observations, water salinity, mobility ratio, minimum and
maximum permeabilities, and permeability contrast were omitted.
Data Gaps. For small populations, it is essential to examine distributions of continuous
independent variables to detect possible data gaps as they substantially affect the logistic
probability patterns of the response categories. In this study, a data gap in temperature
data was identified that extends the maximum application limit for the metallically
crosslinked systems (BGs, CDGs, and WGs) from 210 to 233°F (lower limit of OCAP-
BGs) and has expanded the lower value of OCAP-BGs from 240 to 233°F as shown in
Figure 10. It is important to note that the temperature range of 210 to 240°F is considered
as critical interval for MCAP gel and some unsuccessful case histories are within this
interval; therefore, it is essential to tackle this data gap.
Because logistic regression estimates a coefficient (odds ratio) for each category
of the qualitative independent variables present in the database, a sub classification rule
will be implicitly created for these categories. Distributions of continuous variables for
these sub rules will be different from the main classification rules of the dependent
variable if data gaps exist. While the general prediction rule is to move toward OCAP-
BGs at T > 210°F, Figure 11 illustrates that naturally fractured and unconsolidated
formations have their own rules as a result of the data gaps in temperature distributions.

246
Figure 8. Distributions of logistic probabilities of gel systems for some screening
parameters that match conformance considerations and/or field application trends
a
b
Pro
bab
ilit
y o
f C
DG
s

247
Figure 8. Distributions of logistic probabilities of gel systems for some screening
parameters that match conformance considerations and/or field application trends
(Cont’d)
d
c

248
Figure 9. Logistic probability plots for some independent variables that have
complex or similar distributions

249
Figure 9. Logistic probability plots for some independent variables that have
complex or similar distributions (Cont’d)

250
Figure 10. Logistic probability plot for reservoir temperature shows the
approximations of the validity limits of MCAP and OCAP gels
This figure shows that is movement happens at 170°F and 165°F for naturally fractured
and unconsolidated formations, respectively. This restriction in temperature intervals for
these formation types is attributed to the wide gap in the data for unconsolidated
formations and absence of applications of OCAP-BGs in naturally fractured reservoirs.
The problem was solved by treating temperature as a binary categorical variable with
classes LT and HT depending on whether the value of temperature is less or greater than
210°F.
Logistic Regression Stability and Separation. Because of the existence of small
population (111 projects) and 13 candidate predictors, a special attention was paid to two
logistic regression issues. First, inclusion of a large number of independent variables
results in over-fitted models that have numerically unstable estimates for the coefficients.

251
Secondly, there is a potential of complete or quasi separation of logistic regression as
some gel technologies have zero counts for some categories of lithology, formation, and
IOR/EOR process (Figure 6).
The problem of existence of separable data (no overlap in distributions) is that
coefficients of these categories will be as large as it can be infinity and the maximum
likelihood estimates fail to converge. Examples for these zero counts categories are
absence of CDGs projects in carbonate reservoir, CDGs in CO2 flooding, and WGs in
naturally fractured reservoirs.
Treatment of Independent Variables. In addition to discretization of temperature, we
recategorized IOR/EOR process based on the following explanation. This aspect has been
adopted in the conventional screening guidelines to ensure compatibility of polymer gels
with the drive-fluids of different EOR methods. For example, for oilfields that produce
by means of CO2 flooding, conformance problems have been treated only by BGs. This
implies that in-depth fluid diversion technologies like CDGs and WGs are not candidates
for these reservoirs. Another example is that in case of steam injection, only OCAP-BGs
can be used due to temperature limitations of other gel systems. However, there are no
preferences showed by polymer gels toward water flooding in favor of polymer flooding
and vice versa. In other words, these two recovery processes have equal chances in term
of applicability of gel technology. This point was illustrated by one BG history case
where the developed models correctly predicted gel technology (IOR/EOR process is
waterflooding); however, changing IOR/EOR process to polymer flooding resulted in bad
prediction (CDGs) as shown by Figure 12. Therefore, we modified data of this

252
categorical variable by combining water and polymer floodings into one class to solve
this problem.
Figure 11. Prediction profiler plots and logistic probability plot for reservoir
temperature

253
Figure 12. Profiler plots show prediction results of one BG history case before the
treatment of IOR/EOR independent variable
Model Construction and Estimation
JMP® software was utilized to develop three logistic classification models with a variant
for each model to meet certain application trends. Initially, the data of all treating agents
were used to build a general classification model for gel technologies. However,
considering the presence of only seven case histories for OCAP-BGs in the database, it
was expected that this model would have some cons as there are few data points for this
gel system to train the classifier. Despite the extensive model monitoring and treatment of
the expected issues, there were concerns about potentially undiscovered or hidden issues
relate to the scope of training data. Also, in order to allow a constructed model to catch as

254
much as possible of the informative content of the data, we eliminated OCAP-BGs to
build another multinomial logistic model.
Finally, WGs are exclusively applied in Chinese oilfields due to availability and
extensive experience with polymer floodings. Hence, a third binary model was
constructed using the data of BGs and CDGs to alleviate this regional trend of application
and to obtain specialized model for these systems. In this study, it has been referred to
these three models as G4, G3, G2, where the digits indicate the number of the considered
gel technologies in each model.
We noticed some trends in the application of some gel technologies that need to
be considered in the development of the advanced criteria. These trends are related to gel
treatments timing (early vs. late) or objective (proactive vs. reactive), which in this study
were indicated by three variables that are pre-treatment water cut, flood life time, and to
less degree oil recovery factor. While CDGs had been extensively applied at early stages
of the flood life in many oilfields (Diaz et al. 2008; Lantz and North 2014), their recent
applications in El Tordillo, Dina Cretaceous, Loma Alta Sur, Daqing, and others were at
quite high water cuts and long injection durations (Aldhaheri et al. 2016a). Contrarily,
BGs and WGs started to be applied at very early stages of EOR floodings as in case of
SACROC unit (Pipes and Schoeling, 2014) and Luda LD10-1 (Lu et al. 2010; Kuiqian et
al. 2015) oilfields for example. To meet these new trends, a variant model was
constructed for each of the aforementioned classifiers (G4, G3, and G2) in which the gel
treatment timing parameters were eliminated during the construction phase. These variant
models have been termed as G4.1, G3.1, and G2.1 to distinguish them from the main
models.

255
On the basis of the criteria discussed above and in the previous section, 11
predictors were generally selected to construct the three classification models. Lithology,
formation type, IOR/EOR process, porosity, average permeability, DPc, net thickness,
depth, oil viscosity, water cut, and recovery factor were included in all models. Reservoir
temperature was statistically significant and has been considered only in the first model
(G4); thus, this model involved 12 regressors. Screening results of these multinomial and
binary logistic regression models are the probabilities of the considered gel technologies
estimated based on the historical field data and are expressed as percentages. To facilitate
the utilization of the developed models, Excel spreadsheets were constructed that
attached to this paper and can be also downloaded from the authors’ Researchgate
account with title of “Advanced Polymer Gels Selection Tools”.
JMP® offers an effect-summary report that examines the variable importance
across multiple responses based on what so-called LogWorth (-log (p-value)) at 1%
significance level. In this study, a variable with a LogWorth value of 1.3 that is
corresponding to 5% significance has been considered as influential predictor. Figure 13
compares the effect-summary reports of the three developed models and illustrates the
following general tendencies:
1- Five variables (porosity, net thickness, oil viscosity, water cut, and recovery
factor) are significant according to all variable selection criteria and in all
developed models.
2- Average permeability significance decreases as the number of considered systems
is reduced, where it is very discriminating in G4 and G3 models; however, it has
very weak predictivity in the G2 model. Contrarily, depth has exactly the opposite

256
trends of permeability where its importance increases with the reduction in
number of gel technologies. It is important to note that depth has weak univariate
discriminating powers according to R2.
3- Reservoir temperature and IOR/EOR process appeared important only in the G4
model due to presence of the OCAP-BGs technology. In other two models, it
expected that these variables have weak selectivity as the considered gel
technologies in these models are applied approximately at same temperature
ranges and in same IOR/EOR floods. Furthermore, recategorization (combining
water and polymer floodings) and zero counts for CO2 floodings with respect to
CDGs and WGs substantially reduce predictive power of this reservoir
operational parameter.
4- Lithology, formation type, and DPc are never significant for any of the developed
models despite the strong univariate predictive powers of first two properties.
Further discussion of this trend is presented in the next paragraphs.
5- While it is expected that DPc has a role in capturing the strengths of the drive-
fluid channeling, and thus, in the selection of gel systems. It seems that porosity
and permeability have indicated this characteristic according to their significance
levels.
JMP® also offers a variable-importance report which calculates indices that
measure the importance of factors in a model in a way that is independent of the model
type and fitting method. The fitted model is used only in calculating predicted values.
The method estimates the variability in the predicted response based on a range of

257
Effect Summary: Model (G4)
Variable LogWorth
Permeability 45.438
IOR/EOR2 37.572
WC 3.890
Thickness 3.756
RF 3.419
Porosity 3.032
Viscosity 2.682
Depth 2.456
Formation 0.928
DPc 0.530
Lithology 0.000
TempCode 0.000
Effect Summary: Model (G3)
Variable LogWorth
Permeability 3.907
WC 3.228
RF 2.585
Thickness 1.895
Viscosity 1.842
Porosity 1.677
Depth 1.376
IOR/EOR2 0.880
Formation 0.862
DPc 0.718
Lithology 0.171
Effect Summary: Model (G2)
Variable LogWorth
WC 3.079
Depth 2.356
Viscosity 2.265
Thickness 1.799
RF 1.545
Porosity 1.376
DPc 0.857
IOR/EOR2 0.689
Lithology 0.403
Permeability 0.356
Formation 0.137
Variable Importance: Model (G4)
Variable Total Effect
Lithology 0.181
IOR/EOR2 0.18
Formation 0.179
WC 0.163
RF 0.094
Temperature 0.058
Porosity 0.057
Permeability 0.056
Depth 0.056
Thickness 0.046
DPc 0.04
Viscosity 0.038
Variable Importance: Model (G3)
Variable Total Effect
Lithology 0.288
WC 0.269
Formation 0.237
RF 0.172
Viscosity 0.165
Porosity 0.165
IOR/EOR2 0.161
Thickness 0.082
DPc 0.06
Depth 0.059
Permeability 0.05
Variable Importance: Model (G2)
Variable Total Effect
WC 0.34
Lithology 0.311
IOR/EOR2 0.179
Viscosity 0.161
Porosity 0.15
Formation 0.116
RF 0.094
Depth 0.089
Thickness 0.052
DPc 0.046
Permeability 0.026
Figure 13. Comparisons of variable effect (left) and importance (right) summaries
for the logistic classification models

258
variation for each factor. If variation in the factor causes high variability in the response,
then that effect is important relative to the model (JMP 2015).
In this study, the independent resampled inputs approach was selected to evaluate
the importance of independent variables. In this method, for each factor, Monte Carlo
samples are obtained by resampling its set of observed values. Variable-importance
reports shown in Figure 13 confirm the importance of some variables that considered
influential based on the statistical significance tests. On the other hand, these reports
reveal that the never or rare significant predictors such as lithology, formation type and
IOR/EOR process based on the effect-summary reports have substantial contributions to
the predicted gel technology. Further discussion of this trend is presented in the next
paragraphs.
Model Validation and Results Discussion
A logistic classifier should meet three main requirements during the validation phase:
stability, readability, and predictivity. The stability of a logistic model can be inferred by
two ways: (a) stable models have p-values below 5% for all estimated coefficients
included in the final models; (b) a model is judged as stable if a comprehensive
performance measure such as AUC has comparable values for the training and validation
samples. During models construction stage, it was noticed that if only continuous
predictors are considered, the p-values of the all estimated coefficients in a model are less
than 5% for both Wald Chi-square and likelihood ratio tests. However, the inclusion of
even only one of the three qualitative aspects (lithology, formation, and IOR/EOR) leads
to high standard errors and p-values for Wald test. Yet, likelihood ratio test still shows

259
very low p-values for most regressors except again the aforementioned three aspects as
shown in Table 7. This is attributed to the zero counts for some categories of these
qualitative variables for certain gel systems. Remarkably, based on the second stability
inference way, all developed models and their variants were found to have numerically
stable estimates as explained in the next paragraph.
Table 7. Results of likelihood ratio test for the G4 model and a variant (G4.2)
without categorical regressors
Effect Likelihood Tests: Model (G4) Effect Likelihood Tests: Model (G4.2)
Variable L-R ChiSquare Prob>ChiSq Variable L-R ChiSquare Prob>ChiSq
Lithology 0.0005 1.0000 Porosity 14.06424 0.0028
Formation 10.16009 0.1181 Permeability 19.05327 0.0003
IOR/EOR2 189.8965 <.0001 DPc 8.676877 0.0339
Porosity 13.96228 0.0009 TempCode 2.071617 0.5577
Permeability 214.176 <.0001 Thickness 19.34103 0.0002
DPc 2.442033 0.2949 Depth 12.71527 0.0053
TempCode 0.000488 1.0000 Viscosity 24.69815 <.0001
Thickness 19.93061 0.0002 WC 15.23990 0.0016
Depth 13.60337 0.0035 RF 23.16629 <.0001
Viscosity 14.7131 0.0021
WC 20.57639 0.0001
RF 18.30010 0.0004
For discriminating powers, screening results of the main and variant logistic
models are in good agreement with the field observations based on all considered

260
performance indicators as shown in Table 8. The proposed approaches correctly predict
the proper gel technology in more than 85% (the lowest percent for all models) of the
field projects. Also, the comparable values of performance measures for training and
validation samples (75% vs. 25%) indicate a high stability for the logistic models in
addition to the predictive accuracy. In practice, logistic classification models that have an
AUC value in the range of 0.9-1.0 are considered highly accurate. In this study, the
minimum AUC obtained is 0.9375 for CDGs in the variant of the G4 model.
Table 8. Performances of Logistic Classification Models for Training and Validation
Samples Using Three Global Predictivity Measures
Model Entropy R2 Area Under ROC
Curve1
Correct
Classification Rate2
Training Validation Training Validation Training Validation
G4 0.8952 0.7726 0.9957 0.9715 0.9605 0.9200
G4.1 0.7765 0.4814 0.9825 0.9783 0.9342 0.8800
G3 0.7465 0.7306 0.9776 0.9716 0.8857 0.9130
G3.1 0.6619 0.7156 0.9651 0.9769 0.9000 0.8696
G2 0.7273 0.7686 0.9827 0.9722 0.9524 0.9048
G2.1 0.6431 0.6316 0.9643 0.9722 0.8889 0.8571
1-The average of the considered gel technologies in a model, 2-The fraction of correctly predicted projects.
In this study, unsuccessful pilots were also evaluated because it is thought that
screening results of these pilots are of special importance as they integrate the depiction
of performances of developed models. While G4 model correctly predict the gel system
for all 11 unproductive trials, G3 and G2 model correctly classified only 73% of them as

261
shown in the confusion table below which is identical for both models. It is important to
note that feasibility of get treatments depends on the correct design and implementation
of the remediation in addition to the selection of the best suited treating agent. For
example, for some unsuccessful CDG projects, it has been provided that out of the zone
injection has determined the success of these pilots which refers to an implementation
issue (Mack and Smith, 1994).
Table 9. Confusion Matrix for Results of G3 and G2 Models for Unsuccessful Gel
Pilots
Actual Gel
Agent
Predicted Gel Agent
BGs CDGs
BGs 2 2
CDGs 1 6
JMP® prediction profiler was used to measure the readability of the models and
to monitor how well they follow the conventional screening guidelines. The readability
performance of the models is inferred by comparing the expected and estimated variables
signs or prediction trends of the responses. Generally, most variables are completely in
line with our intuitive expectations as shown in Figure 14; for example, as DPc increases,
probabilities of BGs increase while CDG chances decrease.
For monitoring purposes, some rules from the conventional criteria were the basis
for the checking of the probabilistic models. For example, only BGs are applicable for
carbonate reservoirs and CO2 floodings, only OCAP-BGs are applicable for steam

262
injection. In this context, it was identified that the G3 and G2 logistic models and their
variants completely follow the conventional guidelines as shown in Figure 15.
Figure 14. Prediction profiler plot for G2 model shows correct prediction trends for
some influential variables
For example, when carbonate selected for the lithology, or CO2 selected for the
IOR/EOR process, these classifiers correctly predict BGs and changing the values of any
predictor will not affect this result (horizontal lines). It is important to note that if the
probability curve of a variable appears as a horizontal line in this profiler, this means that
changing values of this property will not affect screening results for the used values of
the predictors. However, for the G4 model, it was indicated that very low water cuts
(<6%) reduce the chances of BGs and activate other properties for carbonate reservoirs
because these reservoirs were mainly treated at very high water cuts. It important to note
that this model still correctly predicts BGs, this trend is observed over very narrow
interval (0-6%), and for this model, a variant without water cut was developed.
Probability
263
Figure 15. Prediction profiler plots used to monitor performances of logistic models
in screening of polymer gels
Furthermore, the profiler was used to check if a model has created a sub rule for a
category of the three qualitative predictors (lithology, formation, IOR/EOR process) as a
result of the uneven data distribution between their classes. Because classifiers predict
what they were trained about, for steam injection method, G4 model incorrectly predicts
G4
G3
G2

264
CDGs if oil viscosity is less than 700 cp as shown in Figure 16. This sub rule was created
because there are only two case histories for steam injection process where OCAP-BGs
applied to improve steam sweep in a heavy oil reservoir (700 and 4800 cp), so the
classifier tries to stick to these viscosity values. This model tendency was corrected by
using the IF/Then rule.
Finally, comparisons of the performances of G4 model and its variant model
indicate that variant models estimate lower probabilities for gel technologies than main
classifiers. Figure 16 illustrates this observation using a bulk gel history case for which
G4 models perfectly predicts the proper gel technology (100%) while its variant (G4.1)
estimates a lower probability of 83%.
The investigation of projects that were not correctly classified reveals some
important observations about the performances of the models:
38% of the mispredicted trials are dual-agent projects where BGs and CDGs or
CDGs and WGs were applied to treat injection wells.
Almost the same projects are misclassified by the models and their variants. Also,
models have certain misclassification trend where BGs predicted as CDGs, CDGs
as BGs, and WGs as BGs or CDGs when improperly discriminated.
The most affected gel systems by omitting water cut in the variant models are
BGs and CDGs and especially for dual agent projects.
All misclassified CDG projects had high water cuts in common.
As mentioned earlier, the application of BGs and CDGs is greatly influenced by
the timing of gel treatments. G2 model and its variant G2.1 determine applicability of
only these two systems; therefore, they are the most suitable classifiers that can be

265
utilized to investigate the effect of treatment timing on the selection of gel technologies.
It has been recognized that the variant model G2.1 misclassified some field projects in
addition to the same projects that were misidentified by the main model G2. Specifically,
G2 model misclassified two BG projects as CDG trials while its variant mispredicted six
BG projects. Obviously, the additional four projects (correctly indicated by the main
model) were mispredicted by the variant model due to the absence of treatment timing
indicator (WC). The situation is same with the CDG projects that were misclassified as
BG trials by the variant model G2.1. These observations imply that treatment timing has
considerable effects on the selection of gel systems.
Figure 16. A snapshot for the Excel spreadsheet of the G4 logistic model shows
screening results for a bulk gel history case

266
Recall that BGs and CDGs are applied to address strong and weak channeling
problems, respectively. This means that above comparisons of mispredicted projects by
the main models and by their variants have depicted the development of the drive-fluid
channeling (increase) during the flooding life as it illustrated in the following example.
For one BG history case with DPc of 0.76, permeability 50 md, net thickness 10 ft, and
93% water cut, the variant model predicted CDGs for this case. This implies that the
initial moderate water channeling strengths exist when the problem still considered
undeveloped had been exacerbated by the longer than usual water injection in this field
(Smith and Larson, 1997). Afterwards, the problem had become well-developed with
strong water channeling, and hence, BGs were applied to improve the distribution of
injection water. It is important to mention that in this case, channel volume was estimated
to be large (> 106 bbl) and moderate results with delayed responses were observed for
this large volume gel treatment (46700 bbl). This reveals that this model misclassification
(CDGs) is definitely correct and it should have been implemented at early stages of the
flood life.
It is important to note that treatment timing (not necessarily in term of WC) is just
another description of the conformance problem status at the time of remediation.
Therefore, the above point was used in another study ((Aldhaheri et al. 2016b) to support
other observations used to verify that the problem development status (whether it
undeveloped or developed) is one of the influential parameters in gel selection process.

267
Conclusions
For injection well gel technologies, a machine-learning-based screening approach was
developed by using the logistic regression technique and the worldwide field projects. A
comprehensive research was performed to identify the most suitable supervised
classification technique that can handle the variety of parameters utilized in the rating of
polymer gels. These parameters were undergone an exhaustive testing to provide better
understanding and to select the most discriminating variables using several strategies and
criteria. Three probabilistic models with three variants were constructed to meet the
regional and recent application trends of gel systems. The predictivity of the proposed
classifiers was demonstrated using three global performance measures and visually
monitored using the prediction profiler. Some tendencies were identified by comparing
results of the main and variant models, and by investigation of the misclassified projects.
Analyses indicate that data gaps plays a vital role in determining how well the
developed models stick to the screening rules and provide correct predictions. For logistic
regression, it is important to examine data distributions against all classes of the
qualitative variable to identify any deviation from the application guidelines. The zero
counts of gel technologies for some categories of the qualitative variable made these
predictors seem insignificant according to some statistical test. However, variable-
importance reports showed substantial contributions for these qualitative variables in the
prediction of gel systems. Five variables appeared to be very discriminating features
including porosity, net thickness, oil viscosity, water cut and recovery factor.
Probabilities of BGs and WGs increase in favor of CDGs as DPc, net thickness, oil
viscosity, water cut, and oil recovery factor increase. Comparisons of the results of the

268
classification models and their variants signalized the increasing nature of the severity of
drive-fluid channeling with the continuation of injection operations. They also indicated
the importance of identifying the development status of the conformance problem in the
gel selection process. Finally, the developed methodology proved that the logistic
regression is an efficient technique to handle EOR screening that characterized by
complex data patterns and large number of the influential parameters.
In addition to being the first advanced screening criteria for polymer gels, the
most distinctive features of the developed methodology are (a) its capability to predict the
most technically applicable gel technology for undiagnosed injection patterns, (b) it can
rank the potential treating agents for a specified injection pattern via the predicted
probability, (c) it manipulates the regional tendencies and new developments in the
application polymer gels, (d) it the first logistic regression-based EOR screening criteria,
and (e) it is available in the public domain. The proposed logistic probability models can
assist reservoir engineers in preliminary assessment of the potential treating agent for
specific injection patterns. However, selection should be confirmed by the adequate
characterization of the conformance problems.
Nomenclature
AUC = Area Under ROC Curve
BGs = Bulk Gels
CDGs = Colloidal Dispersion Gels
CO2 = Carbon-dioxide flooding
CV = Coefficient of variation
D = Reservoir depth, ft
FL = Flood life, year

269
DPc = Dykstra-Parsons coefficient,
fraction
G4, 3, 2 = Main logistic classification
models
G4.1, 3.1, 2.1 = Variant models
h = Average net pay thickness, ft
k = Permeability, md
M = Mobility ratio
Mat. = Matrix-rock
NF. = Naturally fractured reservoirs
IQR = Interquartile range
PF = Polymer flooding
RF = Recovery factor, %
ROC = Receiver Operating
Characteristics Curve
Sal. = Salinity, ppm
St. Dev = Standard Deviation
Steam = Steam injection
T = Temperature, °F
Uncon. = Unconsolidated formation
WC = Water cut, %
WF = Waterflooding
WGs = Weak Gels
Φ = Porosity, %
μ = Oil viscosity, cp
min = Minimum
max = Maximum
Acknowledgement
The author would like to thank the Higher Committee for Educational Development
(HCED) in Iraq for granting him a PhD scholarship and financial support. The authors

270
would also thank SAS institute for granting the right to use JMP® Pro 12 software to
develop out approaches.
References
Agresti, A. (2002) Categorical Data Analysis, Second Edition. Hoboken, New Jersey:
John Wiley & Sons, Inc.
Aldhaheri, M., Wei, M., & Bai, B. (2016a). Comprehensive Guidelines for the
Application of In-Situ Polymer Gels for Injection Well Conformance Improvement
Based on Field Projects. Society of Petroleum Engineers.
http://dx.doi.org/10.2118/179575-MS.
Aldhaheri, M., Wei, M., Bai, B., & Alsaba, M. (2016b). Development of a Roadmap to a
Successful Selection of the Proper Gel Technology: a Field Application Approach.
Society of Petroleum Engineers. http://dx.doi.org/:10.2118/182795-MS.
Alvarado, V., Ranson, A., Hernandez, K., Manrique, E., Matheus, J., Liscano, T., &
Prosperi, N. (2002, January 1). Selection of EOR/IOR Opportunities Based on
Machine Learning. Society of Petroleum Engineers. http://dx.doi.org/10.2118/78332-
MS.
Alvarado, V., and Manrique, E. 2010. Enhanced Oil Recovery: Field Planning and
Development Strategies, Elsevier Inc., Oxford.
Baker, R. O., Stephenson, T., Lok, C., Radovic, P., Jobling, R., & McBurney, C. (2012,
January 1). Analysis of Flow and the Presence of Fractures and Hot Streaks in
Waterflood Field Cases. Society of Petroleum Engineers.
http://dx.doi.org/10.2118/161177-MS.
Bursac, Z., Gauss, C. H., Williams, D. K., & Hosmer, D. W. (2008). Purposeful selection
of variables in logistic regression. Source code for biology and medicine, 3(1), 1.
Castro, R., Maya, G., Sandoval, J. et al. 2013. Colloidal Dispersion Gels (CDG) to
Improve Volumetric Sweep Efficiency in Waterflooding Processes. CT&F - Ciencia,
Tecnología y Futuro, 5 (3): 61-78.
Crespo, F., Reddy, B. R., Eoff, L., Lewis, C., & Pascarella, N. (2014, January 19).
Development of a Polymer Gel System for Improved Sweep Efficiency and Injection
Profile Modification of IOR/EOR Treatments. International Petroleum Technology
Conference. http://dx.doi.org/10.2523/IPTC-17226-MS.
Guerillot, D. R. (1988, January 1). EOR Screening With an Expert System. Society of
Petroleum Engineers. http://dx.doi.org/10.2118/17791-MS.

271
Han, M., Alshehri, A. J., Krinis, D., & Lyngra, S. (2014, April 21). State-of-the-Art of In-
Depth Fluid Diversion Technology: Enhancing Reservoir Oil Recovery by Gel
Treatments. Society of Petroleum Engineers. http://dx.doi.org/10.2118/172186-MS.
Hand, D. & Henley, W. (1997). Statistical Classification Methods in Consumer Credit
Scoring: A Review. Journal of the Royal Statistical Society series A,160(30), pp523-
541.
Hosmer, David W., Lemeshow, Stanley, and Sturdivant, Rodney X. (2013). Wiley Series
in Probability and Statistics: Applied Logistic Regression (3rd Edition). New York,
NY, USA: John Wiley & Sons.
Ibatullin, R. R., Ibragimov, N. G., Khisamov, R. S., Podymov, E. D., & Shutov, A. A.
(2002, January 1). Application And Method Based On Artificial Intelligence For
Selection Of Structures And Screening Of Technologies For Enhanced Oil Recovery.
Society of Petroleum Engineers. http://dx.doi.org/10.2118/75175-MS.
Kuiqian, M., Yanlai, L., Lilei, W., & Xiaolin, Z. (2015, August 11). Practice of the Early
Stage Polymer Flooding on LD Offshore Oilfield in Bohai Bay of China. Society of
Petroleum Engineers. http://dx.doi.org/10.2118/174578-MS.
Lantz, M., & Muniz, G. (2014, April 12). Conformance Improvement Using Polymer
Gels: A Case Study Approach. Society of Petroleum Engineers.
http://dx.doi.org/10.2118/169072-MS.
Liu, Y., Bai, B., & Shuler, P. J. (2006, January 1). Application and Development of
Chemical-Based Conformance Control Treatments in China Oilfields. Society of
Petroleum Engineers. http://dx.doi.org/10.2118/99641-MS.
Liu, Y., Bai, B., & Wang, Y. (2010). Applied Technologies and Prospects of
Conformance Control Treatments in China. Oil & Gas Science and Technology –
Rev, IFP Energies nouvelles, 65(6), 859-878. http://dx.doi.org/10.2516/ogst/2009057.
Lu, X., Wang, W., Wang, R., Liu, Y., & Shan, J. (2010, January 1). The Performance
Characteristics of Cr3+ Polymer Gel and Its Application Analysis in Bohai Oilfield.
Society of Petroleum Engineers. http://dx.doi.org/10.2118/130382-MS.
Mack, J. C., & Smith, J. E. (1994, January 1). In-Depth Colloidal Dispersion Gels
Improve Oil Recovery Efficiency. Society of Petroleum Engineers.
http://dx.doi.org/10.2118/27780-MS.
Mack, J. C., & Smith, J. E. 1997. Colloidal Dispersion Gel for Improving Volumetric
Sweep in Waterfloods-Case Histories, Innovative Applications of Petroleum
Technology Guidebook-1997, Rocky Mountain Association of Geologists, P241-248,
Denver, CO.

272
Manrique, E., and Lantz, M. (2011). Colloidal Dispersion Gels (CDG) and Their
Application in Wyoming and Elsewhere. The 3rd Annual Wyoming IOR/EOR
Conference, Jackson Hole, WY.
Manrique, E., Reyes, S., Romero, J., Aye, N., Kiani, M., North, W., Norman, C. (2014,
March 31). Colloidal Dispersion Gels (CDG): Field Projects Review. Society of
Petroleum Engineers. http://dx.doi.org/10.2118/169705-MS.
Montoya Moreno, J. M., Sandoval, R., Vargas, A., Cabrera, F. C., Romero, J. L., &
Muniz, G. (2014, April 12). Improving Sweep Efficiency In An Underpressured
Naturally Fractured Reservoir. Society of Petroleum Engineers.
http://dx.doi.org/10.2118/169091-MS.
Norman, C., Turner, B. O., Romero, J. L., Centeno, G. A., & Muruaga, E. (2006, January
1). A Review Of Over 100 Polymer Gel Injection Well Conformance Treatments In
Argentina And Venezuela: Design, Field Implementation and Evaluation. Society of
Petroleum Engineers. http://dx.doi.org/10.2118/101781-MS.
Pipes, J. W., & Schoeling, L. G. (2014, April 12). Performance Review of Gel Polymer
Treatments in a Miscible CO2 Enhanced Recovery Project, SACROC Unit Kelly-
Snyder Field. Society of Petroleum Engineers. http://dx.doi.org/10.2118/169176-MS.
Reynolds, R. R., and Kiker, R. D. (2003). Produced Water and Associated Issues. A
manual for independent operator. Petroleum Technology Transfer Council, Tulsa.
SAS Institute Inc. 2015. JMP® 12 Basic Analysis. Cary, NC: SAS Institute Inc.
Sharma, S. (1996). Applied Multivariate Techniques. New York, NY. John Wiley Sons.
Sheng, J.J. 2011. Modern Chemical Enhanced Oil Recovery: Theory and Practice,
Elsevier, Burlington, MA.
Siena, M., Milano, P. di, Guadagnini, A., Rossa, E. D., Lamberti, A., Masserano, F., &
Rotondi, M. (2015, June 1). A New Bayesian Approach for Analogs Evaluation in
Advanced EOR Screening. Society of Petroleum Engineers.
http://dx.doi.org/10.2118/174315-MS.
Smith, J. and Larson, D. 1997. Bulk Gel Treatments for Water Control, Innovative
Applications of Petroleum Technology Guidebook-1997, Rocky Mountain
Association of Geologists, P249-258, Denver, CO.
Song, W., Zeng, X., Yao, H., Li, J., Lv, X., Tian, Y., & Guo, Y. (2002, January 1).
Application of a New Crosslinked Polymer Displacement Technology at Bo-19 Block
in Gudao Oilfield. Society of Petroleum Engineers. http://dx.doi.org/10.2118/77797-
MS.

273
Southwell, G.P. 1999. Marathon Oil Company’s Experience with Produced Water
Control and Conformance Improvement Using Polymer Gels. Proc., In Forty-Sixth
Annual Southwestern Petroleum Short Course, Texas Tech U., Lubbock, Texas,
April, 353–365.
Sydansk, R. D., & Smith, T. B. (1988, January 1). Field Testing of a New Conformance-
Improvement-Treatment Chromium (III) Gel Technology. Society of Petroleum
Engineers. http://dx.doi.org/10.2118/17383-MS.
Sydansk, R.D. and Southwell, G.P. 2000. More Than 12 Years of Experience with a
Successful Conformance-Control Polymer Gel Technology. SPE Prod & Fac. 15 (4):
270. SPE-66558-PA. http://dx.doi.org/10.2118/66558-PA.
Sydansk, R.D.2007. Polymers, Gels, Foams, and Resins. In Petroleum Engineering
Handbook, ed. L. W. Lake, Vol V(B), Chap. 13, 1149-1260. Richardson, Texas, SPE.
Tufféry, S. (2011). Data mining and statistics for decision making. John Wiley & Sons.
Trujillo Portillo, M. L., Mercado Sierra, D. P., Maya, G. A., Castro Garcia, R. H., Soto,
C. P., Perez, H. H., & Gomez, V. (2010, January 1). Selection Methodology for
Screening Evaluation of Enhanced-Oil-Recovery Methods. Society of Petroleum
Engineers. http://dx.doi.org/10.2118/139222-MS.
Tweidt, L. I., Chase, W. D., Holowatuk, C. R., Lane, R. H., & Mitchell, C. M. (1997,
January 1). Improving Sweep Efficiency in the Norman Wells Naturally Fractured
Reservoir Through the Use of Polymer Gels: A Field Case History. Society of
Petroleum Engineers. http://dx.doi.org/10.2118/38901-MS.
Van Buuren, S., and Groothius-Oudshoorn, K. 2009, MICE: Multiple Imputation by
Chained Equations in R. Journal of Statistical Software vol. 45, issue 3.
Van Gool, J., Baesens, B., Sercu, P., & Verbeke, W. (2009). An analysis of the
applicability of credit scoring for microfinance. Katholieke Universiteit Leuven
Leuven, Belgium. University of Southampton, Southampton, United Kingdom.
Wang, W., Gu, Y., & Liu, Y. (2002, January 1). Applications of Weak Gel for In-Depth
Profile Modification and Oil Displacement. Petroleum Society of Canada.
http://dx.doi.org/10.2118/2002-168.
Zerafat, M. M., Ayatollahi, S., Mehranbod, N., & Barzegari, D. (2011, January 1).
Bayesian Network Analysis as a Tool for Efficient EOR Screening. Society of
Petroleum Engineers. http://dx.doi.org/10.2118/143282-MS.

274
SECTION
3. CONCLUSIONS AND RECOMMENDATIONS
Conformance improvement by polymer gels continues to gain momentum in the
field of water management in mature oilfields. Polymer gels can effectively mitigate
water production and enhance the sweep efficiency of IOR/EOR floodings. Thus, they
extend the productive lives of mature oilfields by recovering the previously bypassed oil
reserves. The selection process of gel technologies involves a high degree of
sophistication due to many geological and technical reasons. Remarkably, the qualitative
nature of conformance problem characterization and the independent evaluations of gel
systems are the main contributors in this complexity.
In this dissertation, a comprehensive review for gel field projects was conducted
to establish complete applicability guidelines for gel technologies based on their field
applications in injection wells. An integrated systematic methodology was developed to
determine the applicability of three injection well gel technologies including bulk gels,
colloidal dispersion gels, and weak gels. Comparative analysis, univariate statistical
analysis, and logistic regression technique were utilized to develop a standardized
selection system, conventional screening criteria, and advanced screening models for the
gel systems under evaluation.
The overall conclusions can be summarized as follows:
1. Conformance problems are often qualitatively characterized using different
problem descriptions in terms of reservoir lithology and formation type. This

275
evaluation nature has imposed several problems in the context of rating problems
and solutions.
2. Gel technologies have been exclusively chosen based on the drive-fluid
channeling strength and 13 different reservoir properties and operational and
diagnosing indicators were utilized in the evaluation of this characteristic.
3. Particularly for clastic reservoirs, gel selection statements that employed reservoir
lithology, formation type, or permeability variation are inadequate to describe the
strength of the drive-fluid connectivity or to use as efficient system for chemical
agent selection. They should be used only as starting point in the matching of
conformance problems and gel systems.
4. Gel technology selection is a two-step process that starts by matching the four
qualitative properties of problems and solutions technical specifications. The
initial candidate gel technology is then confirmed by the numerical screening
criteria to ensure compatibilities with reservoir and injected fluids.
5. The drive-fluid channeling, volume of offending zones, problem development
status, existence of cross-flow, and nature of the required solution are the most
influential aspects in the matching step of the selection process of a conformance
agent.
6. In addition to crossflow, the presence of high oil saturations or unswept regions in
the offending zones requires the application of the flood-size treating technologies
that combine displacement and diversion mechanisms.
7. The selection and design of chemical systems for a certain conformance problem
greatly depend on the timing of the conformance treatment in the flood life.

276
8. BGs are solutions for conformance problems that are direct communication
(>0.5), small volume (< 106 barrels), and involve high oil saturations only in the
low capacity zones of a reservoir.
9. CDGs are applicable for conformance issues that have weak communication
(<0.5), reservoir scale offending zones, and high oil saturations in both high and
low permeability zones.
10. Weak gels are best suited for the situations that are similar to those of BGs when
they treat indirect channeling strengths for profile modification purpose. Or
similar to CDG conditions when they treat direct channeling as in-depth fluid
diversion agents.
11. The Lithology, formation type, and EOR process have great effects on the data of
some reservoir properties. For screening purposes, mixed data sets should be
analyzed according to these affecting aspects. Otherwise, they would falsify
where polymer gels have actually been applied.
12. Based on logistic regression technique, five variables appeared to be very
discriminating features between gel systems including porosity, net thickness, oil
viscosity, water cut and recovery factor.
13. The Probabilities of BGs and WGs increase in favor of CDGs as DPc, net
thickness, oil viscosity, water cut, and oil recovery factor increase.
14. Comparisons of the results of the classification models and their variants
signalized the increasing nature of the severity of drive-fluid channeling with the
continuation of injection operations. They also indicated the importance of

277
identifying the development status of the conformance problem in the gel
selection process.
Further research is needed to develop an integrated numerical characterization
system for drive-fluid channeling that has the ability to rate conformance problems and
polymer gels. The easiness of the practical implementation is the ruling feature of any
suggested methodology. Such system should also take into considerations all aspects of
offending zones like net thickness, permeability contrast, and channel shape or
configuration. In addition, there is an urgent need to develop accurate estimation
methodologies for offending zone volumes especially in the cases of naturally fractured
formations. Furthermore, it is advisable to include the polymer gels applications in the
Oil and Gas Journal survey of EOR methods.

278
REFERENCES
Ahmed, T. (2006). Reservoir engineering handbook. Gulf Professional Publishing.
Abdulbaki, M., Chun H., Sepehrnoori, K., Delshad, M., Varavei, A. 2014. “A critical
review on use of polymer microgels for conformance control purposes, “J. Petrol.
Sci. Eng. 122: 741-753. http://dx.doi.org/10.1016/j.petrol.2014.06.034.
Al-Dhafeeri, A. M., Nasr-El-Din, H. A., Seright, R. S., & Sydansk, R. D. (2005, January
1). High-Permeability Carbonate Zones (Super-K) in Ghawar Field (Saudi Arabia):
Identified, Characterized, and Evaluated for Gel Treatments. Society of Petroleum
Engineers. http://dx.doi.org/10.2118/97542-MS.
Al-Assi, A. A., Willhite, G. P., Green, D. W., & McCool, C. S. (2009, September 1).
Formation and Propagation of Gel Aggregates Using Partially Hydrolyzed
Polyacrylamide and Aluminum Citrate. Society of Petroleum Engineers.
http://dx.doi.org/10.2118/100049-PA.
Albertoni, A., & Lake, L. W. (2003). Inferring interwell connectivity only from well-rate
fluctuations in waterfloods. SPE Reservoir Evaluation & Engineering, 6(01), 6-16.
Alvarado, V., and Manrique, E. 2010. Enhanced Oil Recovery: Field Planning and
Development Strategies, Elsevier Inc., Oxford.
Alvarado, V., Ranson, A., Hernandez, K., Manrique, E., Matheus, J., Liscano, T., &
Prosperi, N. (2002, January 1). Selection of EOR/IOR Opportunities Based on
Machine Learning. Society of Petroleum Engineers. doi:10.2118/78332-MS.
Ansah, J., Soliman, M. Y., Ali, S. A., Moreno, C., Jorquera, R. A., & Warren, J. M.
(2006, January 1). Optimization of Conformance Decisions Using a New Well-
Intervention Simulator. Society of Petroleum Engineers. doi:10.2118/99697-MS.
Azari, M., & Soliman, M. (1996, January 1). Review of Reservoir Engineering Aspects
of Conformance Control Technology. Society of Petroleum Engineers.
http://dx.doi.org/10.2118/35171-MS.
Bai, B. (2014). Conformance Problems [Class handout]. Missouri, USA: Department of
Geoscience and Geological and Petroleum Engineering, University of Missouri
University of Science and Technology.
Bai, B., Liu, Y., Coste, J. P., & Li, L. (2007). Preformed particle gel for conformance
control: transport mechanism through porous media. SPE Reservoir Evaluation &
Engineering, 10(02), 176-184.

279
Bai, B., Huang, F., Liu, Y., Seright, R. S., & Wang, Y. (2008, January). Case study on
prefromed particle gel for in-depth fluid diversion. In SPE Symposium on Improved
Oil Recovery. Society of Petroleum Engineers.
Baker, R. O., Stephenson, T., Lok, C., Radovic, P., Jobling, R., & McBurney, C. (2012,
January 1). Analysis of Flow and the Presence of Fractures and Hot Streaks in
Waterflood Field Cases. Society of Petroleum Engineers.
http://dx.doi.org/10.2118/161177-MS.
Baker Hughes [SweepScan]. (2012). Retrieved from
https://www.google.com/?gws_rd=ssl#q=sweepscan.
Baker, R., Lok, C., Stephenson, T., & Weghorn, S. (2014, April 12). Combining
Conformance Treatment With Mobility Control Increases Enhanced Recovery Factor.
Society of Petroleum Engineers. doi:10.2118/169046-MS.
Bang, V. (2013, July 2). A New Screening Model for Gas and Water Based EOR
Processes. Society of Petroleum Engineers. doi:10.2118/165217-MS.
Bondar, V. V., & Blasingame, T. A. (2002, September). Analysis and interpretation of
water-oil-ratio performance. In SPE Annual Technical Conference and Exhibition,
San Antonio, TX.
Borling, D., Chan, K., Hughes, T., & Sydansk, R. (1994). Pushing out the oil with
conformance control. Oilfield Review, 6(2), 44-58.
Breston, J. N. (1957). Selective Plugging of Waterflood Input Wells Theory, Methods
and Results. Journal of Petroleum Technology, 9(03), 26-31.
Bybee, K. (2004, September 1). Gel Placement Key to Success for Water Shutoff in Gas
Wells. Society of Petroleum Engineers. doi:10.2118/0904-0087-JPT.
Castro, R., Maya, G., Sandoval, J. et al. 2013. Colloidal Dispersion Gels (CDG) to
Improve Volumetric Sweep Efficiency in Waterflooding Processes. CT&F - Ciencia,
Tecnología y Futuro, 5 (3): 61-78.
Chan, K.S.: “Water Control Diagnostic Plots,” paper SPE 30775 presented at the 1995
SPE Annual Technical Conference and Exhibition, Dallas, Oct. 22-25.
Chang, H. L., Sui, X., Xiao, L., Guo, Z., Yao, Y., Xiao, Y., Chen, G., Song, K., & Mack,
J. C. (2006, December 1). Successful Field Pilot of In-Depth Colloidal Dispersion Gel
(CDG) Technology in Daqing Oilfield. Society of Petroleum Engineers.
http://dx.doi.org/10.2118/89460-PA.
Chou, S. I., Bae, J. H., Friedmann, F., & Dolan, J. D. (1994, January). Development of
optimal water control strategies. In SPE Annual Technical Conference and
Exhibition. Society of Petroleum Engineers.

280
Creel, P., Vavrek, G., Honnert, M., Kelley, R., Tate, R., & Dalrymple, E. D. (2001,
January). Conformance Water-Management Team Developments and Solutions on
Projects in the Permian Basin. In SPE Permian Basin Oil and Gas Recovery
Conference. Society of Petroleum Engineers.
Dalrymple, E. D. (1997, August). Expert System for Water-Control Treatment Design. In
International Conference on Reservoir Conformance, Profile Control, and Water and
Gas Shutoff, Houston, August (pp. 6-8).
Diaz, D., Saez, N., Cabrera, M., Manrique, E., Romero, J., Kazempour, M., & Aye, N.
(2015, August 11). CDG in a Heterogeneous Fluvial Reservoir in Argentina: Pilot and
Field Expansion Evaluation. Society of Petroleum Engineers.
http://dx.doi.org/10.2118/174704-MS.
Diaz, D., Somaruga, C., Norman, C., & Romero, J. L. (2008, January 1). Colloidal
Dispersion Gels Improve Oil Recovery in a Heterogeneous Argentina Waterflood.
Society of Petroleum Engineers. http://dx.doi.org/10.2118/113320-MS.
Gharbi, R. B. (2000). An expert system for selecting and designing EOR processes.
Journal of Petroleum Science and Engineering, 27(1), 33-47.
Green, D. W., & Willhite, G. P. (1998). Enhanced oil recovery. Richardson, Tex.: Henry
L. Doherty Memorial Fund of AIME, Society of Petroleum Engineers.
Guerillot, D. R. (1988, January). EOR screening with an expert system. In Petroleum
Computer Conference. Society of Petroleum Engineers.
Han, M., Alshehri, A. J., Krinis, D., & Lyngra, S. (2014, April 21). State-of-the-Art of In-
Depth Fluid Diversion Technology: Enhancing Reservoir Oil Recovery by Gel
Treatments. Society of Petroleum Engineers. http://dx.doi.org/10.2118/172186-MS.
Heffer, K. J., Fox, R. J., McGill, C. A., & Koutsabeloulis, N. C. (1997, June 1). Novel
Techniques Show Links between Reservoir Flow Directionality, Earth Stress, Fault
Structure and Geomechanical Changes in Mature Waterfloods. Society of Petroleum
Engineers. doi:10.2118/30711-PA.
Iler, R. K., 1979. The Chemistry of Silica, Solubility, Polymerization, Colloid and Surface
Properties and Biochemistry. New York, NY: John Wiley-InterScience Publisher.
Imqam, A., Aldalfag, A., Wang, Y., & Bai, B. (2016, September). Evaluation of
Preformed Particle Gels Penetration into Matrix for a Conformance Control
Treatment in Partially Open Conduits. In SPE Annual Technical Conference and
Exhibition. Society of Petroleum Engineers.
Joseph, A., & Ajienka, J. A. (2010, January 1). A Review of Water Shutoff Treatment
Strategies in Oil Fields. Society of Petroleum Engineers.
http://dx.doi.org/10.2118/136969-MS.
281
Kabir, A. H. (2001, January). Chemical water & gas shutoff technology-An overview. In
SPE Asia Pacific Improved Oil Recovery Conference. Society of Petroleum
Engineers.
Kamari, A., Nikookar, M., Sahranavard, L., & Mohammadi, A. H. (2014). Efficient
screening of enhanced oil recovery methods and predictive economic analysis. Neural
Computing and Applications, 25(3-4), 815-824.
Kim, A., and Crespo, F. (2013). Excessive Water Production: Causes and Diagnostics.
Retrieved from http://halliburtonblog.com/excessive-water-production-causes-
diagnostics.
Krumrine, P. H. and S. D. Boyce. 1985. Profile Modification and Water Control with
Silica Gel-Based Systems. Paper SPE13578 presented at the International Symposium
on Oilfield and Geothermal Chemistry, Phenoix, Arizona, 9-11 April.
http://dx.doi.org/10.2118/13578-MS.
Kshirsagar, A. (2014). Waterflood Evaluation using Communication. In Devex
Conference held in Aberdeen, Scotland.
Lakatos, I., Lakatos-Szabo, J., Tiszai, G., Palasthy, G., Kosztin, B., Trömböczky, S.,
Patterman-Farkas, G. (1999, January 1). Application of Silicate-Based Well
Treatment Techniques at the Hungarian Oil Fields. Society of Petroleum Engineers.
doi:10.2118/56739-MS.
Lantz, M., & Muniz, G. (2014, April 12). Conformance Improvement Using Polymer
Gels: A Case Study Approach. Society of Petroleum Engineers.
http://dx.doi.org/10.2118/169072-MS.
Lantz, M., and North, W. (2014). Polymer Flooding in the Minnelusa, 2014 Minnelusa
Workshop, University of Wyoming, Gillette, WY.
Liang, J.-T., Lee, R. L., & Seright, R. S. (1993, November 1). Gel Placement in
Production Wells. Society of Petroleum Engineers. doi:10.2118/20211-PA.
Liu, Y., Bai, B., & Shuler, P. J. (2006, January 1). Application and Development of
Chemical-Based Conformance Control Treatments in China Oilfields. Society of
Petroleum Engineers. http://dx.doi.org/10.2118/99641-MS.
Liu, Y., Bai, B., & Wang, Y. (2010). Applied Technologies and Prospects of
Conformance Control Treatments in China. Oil & Gas Science and Technology –
Rev, IFP Energies nouvelles, 65(6), 859-878. http://dx.doi.org/10.2516/ogst/2009057.
Love, T., McCarty, A., Miller, M. J., & Semmelbeck, M. (1998, January). Problem
diagnosis, treatment design, and implementation process improves waterflood
conformance. In SPE Annual Technical Conference and Exhibition. Society of
Petroleum Engineers.

282
Lu, X., Song, K., Niu, J., & Chen, F. (2000, January). Performance and evaluation
methods of colloidal dispersion gels in the Daqing oil field. In SPE Asia Pacific
Conference on Integrated Modelling for Asset Management. Society of Petroleum
Engineers.
Mack, J. C. (1978, January 1). Improved Oil Recovery - Product To Process. Society of
Petroleum Engineers. http://dx.doi.org/10.2118/7179-MS.
Mack, J. C., & Smith, J. E. (1994, January 1). In-Depth Colloidal Dispersion Gels
Improve Oil Recovery Efficiency. Society of Petroleum Engineers.
http://dx.doi.org/10.2118/27780-MS.
Mack, J. C., & Smith, J. E. 1997. Colloidal Dispersion Gel for Improving Volumetric
Sweep in Waterfloods-Case Histories, Innovative Applications of Petroleum
Technology Guidebook-1997, Rocky Mountain Association of Geologists, P241-248,
Denver, CO.
Mahgoup, M., & Khair, E. Excessive Water Production Diagnostic and Control-Case
Study Jake Oil Field-Sudan.
Manrique, E., and Lantz, M. (2011). Colloidal Dispersion Gels (CDG) and Their
Application in Wyoming and Elsewhere. The 3rd Annual Wyoming IOR/EOR
Conference, Jackson Hole, WY.
Manrique, E., Reyes, S., Romero, J., Aye, N., Kiani, M., North, W., Norman, C. (2014,
March 31). Colloidal Dispersion Gels (CDG): Field Projects Review. Society of
Petroleum Engineers. http://dx.doi.org/10.2118/169705-MS.
Maya, G. A., Castro, R. H., Sandoval, J., Pachon, Z., Jimenez, R., Pinto, K. T., and
Munoz, S. F. (2014, May 21). Successful Polymer Gels Application in a Highly
Channeled Peripheral Injection Well: Tello Field Pilot. Society of Petroleum
Engineers. http://dx.doi.org/10.2118/169478-MS.
McCurdy, R. (2011). Underground injection wells for produced water disposal. In
USEPA Technical Workshops for the Hydraulic Fracturing Study: Water Resource
Management. United States Environmental Protection Agency, Office of Research
and Development.
Miller, M. J., & Chen, K. S. (1997, January 1). Water and Gas Control Gel Placement.
Society of Petroleum Engineers. doi:10.2118/38325-MS.
Mishra, A., Abbas, S., Braden, J., Hazen, M., Li, G., Peirce, J., Smith, D., and Lantz, M.
(2016, April 11). Comprehensive Review of Fracture Control for Conformance
Improvement in the Kuparuk River Unit - Alaska. Society of Petroleum Engineers.
doi:10.2118/179649-MS.

283
Montoya Moreno, J. M., Sandoval, R., Vargas, A., Cabrera, F. C., Romero, J. L., &
Muniz, G. (2014, April 12). Improving Sweep Efficiency In An Underpressured
Naturally Fractured Reservoir. Society of Petroleum Engineers.
http://dx.doi.org/10.2118/169091-MS.
Muruaga, E., Flores, M. V., Norman, C., & Romero, J. L. (2008, January 1). Combining
Bulk Gels and Colloidal Dispersion Gels for Improved Volumetric Sweep Efficiency
in a Mature Waterflood. Society of Petroleum Engineers.
http://dx.doi.org/10.2118/113334-MS.
Mustoni, J. L., Cabrera, F. A., Manrique, E. J., & Norman, C. (2012, January 1).
Application of a Thermally Activated Particle System for Improved Sweep Efficiency
in a Multilayer, Geologically Complex Waterflood. Society of Petroleum Engineers.
doi:10.2118/153331-MS.
Norman, C., De Lucia, J. P., & Turner, B. O. (2006, January 1). Improving Volumetric
Sweep Efficiency With Polymer Gels in the Cuyo Basin of Argentina. Society of
Petroleum Engineers. doi:10.2118/99379-MS.
Pappas, J., Creel, P., & Crook, R. (1996, January). Problem identification and solution
method for water flow problems. In Permian Basin Oil and Gas Recovery
Conference. Society of Petroleum Engineers.
Parada, C. H., & Ertekin, T. (2012, January). A new screening tool for improved oil
recovery methods using artificial neural networks. In SPE Western Regional Meeting.
Society of Petroleum Engineers.
PetroWiki. 2016. Conformance Improvement.
http://petrowiki.org/index.php?title=Conformance_improvement&oldid=47253
(accessed 20 December 2016).
Pipes, J. W., & Schoeling, L. G. (2014, April 12). Performance Review of Gel Polymer
Treatments in a Miscible CO2 Enhanced Recovery Project, SACROC Unit Kelly-
Snyder Field. Society of Petroleum Engineers. http://dx.doi.org/10.2118/169176-MS.
Ranganathan, R., Lewis, R., McCool, C. S., Green, D. W., & Willhite, G. P. (1998,
December 1). Experimental Study of the Gelation Behavior of a
Polyacrylamide/Aluminum Citrate Colloidal-Dispersion Gel System. Society of
Petroleum Engineers. doi:10.2118/52503-PA.
Reynolds, R. R., and Kiker, R. D. (2003). Produced Water and Associated Issues. A
manual for independent operator. Petroleum Technology Transfer Council, Tulsa.
Romero, C., Marin, A. B., Candiales, L. E., Mejias, O. J., Romero, E. J., Angulo, R. J., …
Norman, C. (2003, January 1). Non-Selective Placement of a Polymer Gel Treatment
to Improve Water Injection Profile and Sweep Efficiency in the Lagomar Field,
Venezuela. Society of Petroleum Engineers. doi:10.2118/80201-MS.

284
Saleh, L., Wei, M., Zhang, Y., & Bai, B. (2016, November 1). Data Analysis for Polymer
Flooding That Is Based on a Comprehensive Database. Society of Petroleum
Engineers. doi:10.2118/169093-PA.
Sandhu, K. (2012). Improving Injection Efficiency by Using Polymer Gels. Permian
Basin CCUS Centre.
Seright, R. S. (1988, January 1). Placement of Gels To Modify Injection Profiles. Society
of Petroleum Engineers. doi:10.2118/17332-MS.
Seright, R. S. (1991, May 1). Effect of Rheology on Gel Placement. Society of Petroleum
Engineers. doi:10.2118/18502-PA.
Seright, R. S. (1995, November 1). Gel Placement in Fractured Systems. Society of
Petroleum Engineers. doi:10.2118/27740-PA.
Seright, R. S. (1996 and 1997). Improved methods for water shutoff. Final Technical
Progress Report (US DOE Report DOE/PC/91008-14), US DOE Contract DE-AC22-
94PC91008, BDM-Oklahoma Subcontract G4S60330 (Oct. 1998), 21-54.
Seright, R. S., Lane, R. H., & Sydansk, R. D. (2001, January 1). A Strategy for Attacking
Excess Water Production. Society of Petroleum Engineers.
http://dx.doi.org/10.2118/70067-MS.
Seright, R.S. and Liang, J. 1994. A Survey of Field Applications of Gel Treatments for
Water Shutoff. Presented at the SPE III Latin American & Caribbean Petroleum
Engineering Conference, Buenos Aires, Argentina, April 27-29. SPE 26991-MS.
http://dx.doi.org/10.2118/26991-MS.
Sheng, J.J. 2011. Modern Chemical Enhanced Oil Recovery: Theory and Practice,
Elsevier, Burlington, MA.
Smith, J. E., Liu, H., & Guo, Z. D. (2000, January 1). Laboratory Studies of In-Depth
Colloidal Dispersion Gel Technology for Daqing Oil Field. Society of Petroleum
Engineers. doi:10.2118/62610-MS.
Smith, D. and Ott, B. 2006b. Conformance Engineering: A Comprehensive Review. Part
2: Connecting the Problem to an Effective Solution. World Oil, June, p 95-98.
Soliman, M. Y., East, L., & Gorell, S. (1999, January 1). Reservoir Conformance
Approach and Management Practices for Improved Recovery Opportunities: Process
and Case History. Society of Petroleum Engineers. doi:10.2118/53918-MS.
Soliman, M. Y., Rester, S., Sigal, R., Everett, D., & Johnson, M. H. (2000, January 1).
Integration of Technology Supports Preventive Conformance Reservoir Techniques.
Society of Petroleum Engineers. http://dx.doi.org/10.2118/62553-MS.

285
Song, W., Zeng, X., Yao, H., Li, J., Lv, X., Tian, Y., & Guo, Y. (2002, January 1).
Application of a New Crosslinked Polymer Displacement Technology at Bo-19 Block
in Gudao Oilfield. Society of Petroleum Engineers. http://dx.doi.org/10.2118/77797-
MS.
Sorbie, K. S., & Seright, R. S. (1992, January 1). Gel Placement in Heterogeneous
Systems With Crossflow. Society of Petroleum Engineers. doi:10.2118/24192-MS.
Southwell, G.P. 1999. Marathon Oil Company’s Experience with Produced Water
Control and Conformance Improvement Using Polymer Gels. Proc., In Forty-Sixth
Annual Southwestern Petroleum Short Course, Texas Tech U., Lubbock, Texas,
April, 353–365.
Spildo, K., Skauge, A., Aarra, M. G., & Tweheyo, M. T. (2009, June 1). A New Polymer
Application for North Sea Reservoirs. Society of Petroleum Engineers.
http://dx.doi.org/10.2118/113460-PA.
Spildo, K., Skauge, A., & Skauge, T. (2010, January 1). Propagation of Colloidal
Dispersion Gels (CDG) in Laboratory Corefloods. Society of Petroleum Engineers.
http://dx.doi.org/10.2118/129927-MS.
Stanley, F. O., Hardianto, _, Marnoch, E., & Tanggu, P. S. (1996, January 1). Improving
Hydrocarbon/Water Ratios in Producing Wells - An Indonesian Case History Study.
Society of Petroleum Engineers. doi:10.2118/36615-MS.
Stavland, A., Jonsbraten, H. C., Vikane, O., Skrettingland, K., and Fischer, H. 2011. In-
Depth Water Diversion Using Sodium Silicate on Snorre – Factor Controlling In-
Depth Placement. Paper SPE 143836 presented at the SPE European Formation
Damage Conference, Noordwijk, The Netherlands, 7-10 June.
http://dx.doi.org/10.2118/169727-MS.
Sydansk, R. D. (1990, August 1). A Newly Developed Chromium(III) Gel Technology.
Society of Petroleum Engineers. doi:10.2118/19308-PA.
Sydansk, R. D. (2007). Polymers, gels, foams, and resins. Petroleum Engineering
Handbook, 5, 1219-1224.
Sydansk, R. D., and Romero-Zeron, L. (2011). Reservoir conformance improvement.
Society of Petroleum Engineers.
Sydansk, R. D., & Seright, R. S. (2007, May 1). When and Where Relative Permeability
Modification Water-Shutoff Treatments Can Be Successfully Applied. Society of
Petroleum Engineers. doi:10.2118/99371-PA.
Sydansk, R. D., & Southwell, G. P. (1998, January). More Than 12 Years of Experience
with a Successful Conformance-Control Polymer Gel Technology. In SPE Annual
Technical Conference and Exhibition. Society of Petroleum Engineers.

286
Sydansk, R. D., & Southwell, G. P. (2000, January). More than 12 years of experience
with a successful conformance-control polymer gel technology. In SPE/AAPG
Western Regional Meeting. Society of Petroleum Engineers.
Taber, J. J., Martin, F. D., & Seright, R. S. (1997, August 1). EOR Screening Criteria
Revisited - Part 1: Introduction to Screening Criteria and Enhanced Recovery Field
Projects. Society of Petroleum Engineers. http://dx.doi.org/10.2118/35385-PA.
Tweidt, L. I., Chase, W. D., Holowatuk, C. R., Lane, R. H., & Mitchell, C. M. (1997,
January 1). Improving Sweep Efficiency in the Norman Wells Naturally Fractured
Reservoir Through the Use of Polymer Gels: A Field Case History. Society of
Petroleum Engineers. http://dx.doi.org/10.2118/38901-MS.
Veil, J., April 2015. U.S. Produced Water Volumes And Management Practices In 2012.
A report prepared for the Groundwater Protection Council by Veil Environmental,
LLC.
Wang, H., Guo, W., & Jiang, H. (2001, January 1). Study and Application of Weak Gel
System Prepared by Complex Polymer Used for Depth Profile Modification. Society
of Petroleum Engineers. doi:10.2118/65379-MS.
Wang, W., Gu, Y., & Liu, Y. (2002, January 1). Applications of Weak Gel for In-Depth
Profile Modification and Oil Displacement. Petroleum Society of Canada.
http://dx.doi.org/10.2118/2002-168.
Wang, D., Han, P., Shao, Z., Hou, W., & Seright, R. S. (2008, February 1). Sweep-
Improvement Options for the Daqing Oil Field. Society of Petroleum Engineers.
http://dx.doi.org/10.2118/99441-PA.
Wassmuth, F. R., Green, K., & Hodgins, L. (2004, November 1). Water Shutoff in Gas
Wells: Proper Gel Placement Is the Key to Success. Society of Petroleum Engineers.
doi:10.2118/89403-PA.
Wu, F. H., Chiu, T. J., Dalrymple, D., Dahl, J., & Rahimi, A. B. (1994, January).
Development of an expert system for water control applications. In European
Petroleum Computer Conference. Society of Petroleum Engineers.
Yang, Z., & Ershaghi, I. (2005, January 1). A Method for Pattern Recognition of WOR
Plots in Waterflood Management. Society of Petroleum Engineers.
doi:10.2118/93870-MS.
Yin, Z., MacBeth, C., & Chassagne, R. (2015, June). Joint Interpretation of Interwell
Connectivity by Integrating 4D Seismic with Injection and Production Fluctuations.
In EUROPEC 2015. Society of Petroleum Engineers.

287
Yousef, A. A., Gentil, P. H., Jensen, J. L., & Lake, L. W. (2005, January). A capacitance
model to infer interwell connectivity from production and injection rate fluctuations.
In SPE Annual Technical Conference and Exhibition. Society of Petroleum
Engineers.
Zerafat, M. M., Ayatollahi, S., Mehranbod, N., & Barzegari, D. (2011, January 1).
Bayesian Network Analysis as a Tool for Efficient EOR Screening. Society of
Petroleum Engineers. http://dx.doi.org/10.2118/143282-MS.
Zhao G, Dai C, Zhao M, You Q, Chen A. (2013) Investigation of Preparation and
Mechanisms of a Dispersed Particle Gel Formed from a Polymer Gel at Room
Temperature. PLoS ONE 8(12): e82651. doi:10.1371/journal.pone.0082651.

288
VITA
Munqith Aldhaheri was born the 1st of January 1980, in Missan, Iraq. He received
BSc and MSc degrees in Petroleum Engineering from University of Baghdad, Baghdad,
Iraq in 2001 and 2006. He served as a petroleum engineer in Missan Oil Company for
seven years. He was granted a PhD scholarship by the Higher Committee for Education
Development in Iraq in 2009. He received a PhD in Petroleum Engineering from
Missouri University of Science and Technology, Rolla, MO, in May, 2017.
Aldhaheri has been a member of Iraqi Engineers Union and Society of Petroleum
Engineers (SPE) since 2001. In 2009, he helped in establishing the first SPE Section in
Iraq and served as program chair for two years.
His research interests encompassed the prediction of petroleum fluids phase
behavior by equations of state, screening of EOR methods, reservoir conformance
engineering, and applications of machine learning and artificial intelligence techniques in
petroleum engineering. He published some conference and journal papers in these
research areas.