s.d. standard drilling p
TRANSCRIPT
S.D. STANDARD DRILLING PLC
SECOND QUARTER REPORT 2019
S.D. Standard Drilling Plc – Second Quarter Report 2019 1
CONTENTS
STATEMENT OF THE MEMBERS OF THE BOARD OF DIRECTORS AND OTHER RESPONSIBLE PERSONS OF THE COMPANY FOR THE INTERIM CONDENSED FINANCIAL STATEMENTS 2
SECOND QUARTER MANAGEMENT REPORT 3
INTERIM CONDENSED STATEMENT OF COMPREHENSIVE INCOME 6 INTERIM CONDENSED STATEMENT OF FINANCIAL POSITION 7
INTERIM CONDENSED STATEMENT OF CHANGES IN EQUITY 8
INTERIM CONDENSED STATEMENT OF CASH FLOWS 9
NOTES TO THE FINANCIAL INFORMATION 10

S.D. Standard Drilling Plc – Second Quarter Report 2019 2
STATEMENT OF THE MEMBERS OF THE BOARD OF DIRECTORS AND OTHER
RESPONSIBLE PERSONS OF THE COMPANY FOR THE INTERIM CONDENSED FINANCIAL STATEMENTS
In accordance with Article 10 sections (3) (c) and (7) of the Transparency Requirements (Securities for Trading on Regulated Markets) Law of 2007 and 2009 (‘’Law’’) we, the members of the Board of Directors and other responsible persons for the drafting of the interim condensed financial statements of S.D. Standard Drilling Plc (the “Company”), for the six months ended 30 June 2019 we confirm that, to the best of our knowledge: a) The interim condensed financial statements of the Company for the six months ended 30 June 2019 which are presented on
pages 6 to 17: (i) were prepared in accordance with International Financial Reporting Standards IAS 34 “Interim Financial Reporting”, as
adopted by the European Union in accordance with provisions of Article 10, section (4) of the Law, and (ii) give a true and fair view of the assets and liabilities, the financial position and the profit or losses of the Company, and
the business that are included in the financial statements as a total, and b) The Interim Management Report provides a fair overview of the information required as per section 6 of article 10 of Law
190(I)/2007.
Limassol, 26 August 2019
Martin Nes Chairman
Konstantinos Pantelidis Independent Director
George Crystallis Independent Director
Christos Neocleous Evangelia Panagide Chief Financial Officer General Manager

S.D. Standard Drilling Plc – Second Quarter Report 2019 3
Second Quarter Management Report 2019
Selected Financial Information Three Months Ended Six Months Ended
(Amounts in USD 000)
2019 Q2
Unaudited
2018 Q2
Unaudited
2019 Q2
Unaudited
2018 Q2
Unaudited
Operating profit/(loss) 4 564 (2 703) 7 550 (2 553)
Profit/(loss) for the period before tax 4 563 (2 703) 7 547 (2 558)
Total comprehensive income/(loss) for the period 4 563 (2 703) 7 547 (2 558)
Presentation of Interim Condensed Financial Statements
These interim condensed financial statements for the second quarter of the year 2019 are prepared and presented on a
standalone basis, since the Company is an investment entity and shall not consolidate its subsidiary. The Company measures its
investment in subsidiary and associates at fair value through profit or loss. Consequently, the Company’s investment in Platform
Supply Vessels (PSVs) is valued based on estimates made by reputable independent valuers and prices generated by market
transactions involving identical or comparable (similar) PSV vessels. Revenue and EBITDA from chartering out the vessels are not
consolidated into nor directly reflected in these Financial Statements. More information is available in the Q2 19 presentation,
which is released together with this interim report.
Highlights Second Quarter
1. On 12 April 2019, New World Supply Ltd (“NWS”), where the Company owned 34,4% of the share capital, completed the sale of its four remaining medium sized platform supply vessels (PSVs). The transaction was done at a level that reflect higher vessel value compared to Company’s book value and significantly higher than the acquisition price of the shares in NWS purchased by the Company. Following the above-mentioned transaction, NWS and its subsidiaries remained dormant holding only cash and no vessels.
2. On 24 April 2019, the Company acquired through its wholly owned subsidiary Wanax AS, one large size Norwegian built PSV for a total consideration of USD 8,1 million. After the transaction the Company has 100% ownership through its subsidiary of six large-size modern PSVs, in addition to the 9 mid-sized PSVs the Company already has invested in, including one vessel on a bare-boat contract.
3. On 3 May 2019, the Company through its wholly owned subsidiary Wanax AS contributed USD 566 thousands in the form
of a shareholders’ loan, to its associate Northern Supply AS.
4. In Q2 19, the Company recognized an unrealized profit of USD 4,7 million from the revaluation of its financial assets at fair
value whereas for the six months ended 30 June 2019 an unrealized profit of USD 7,6 million was recognised. The fair value
of the investments as of 30 June 2019 was USD 112 million.
5. Positive EBITDA (adj.) of USD 2,2 million, excluding start-up cost, dry dock, special survey and maintenance (Q2 18 USD 400
thousands) from chartering out the 6 large –sized PSV’s. Including the ownership in Northern Supply AS (25.53%) the group
netted a positive EBITDA (adj.) excluding start-up cost, dry dock, special survey and maintenance of USD 2,7 million (Q2 18
USD 200 thousands).
6. Utilisation of the Company’s vessels of 93% (Q2 18 95%) for the six large PSV Standard vessels and 90% (Q2 18 88%) for the
Northern Supply AS vessels (excluding those in lay-up).
7. At the Annual General Meeting of the Company which was held on 5 June 2019, the Board of Directors were authorized by
the shareholders to purchase the Company’s own shares as prescribed by the relevant provision of article 57A of the
Companies Law, within a time period of twelve months from the date of passing of the resolution. As of today, no such
purchase has taken place.

S.D. Standard Drilling Plc – Second Quarter Report 2019 4
Second Quarter Management Report 2019 (Continued)
Selected Financial Information
Subsequent Events
The following events took place between the Balance Sheet date and the date of approval of these interim condensed financial statements: 1) In July 2019, through the execution of a written consent and resolution by the shareholders of New World Supply Ltd
(“NWS”), it has been resolved that NWS will proceed with the repurchase of 98,86% of the issued ordinary shares from each shareholder for a purchase price of USD 1,35 per share. As a result, the Company has received the amount of USD 14,9 million and its ownership in NWS has been reduced to 0,39% of the issued share capital. It has also been resolved that the remaining shares will be repurchased in the future at such a price and in such a manner to be determined by the board of directors of NWS.
There have been no other material subsequent events that have an impact on these interim condensed financial statements.
S.D. Standard Drilling Plc – Second Quarter Report 2019 5
SECOND QUARTER MANAGEMENT
REPORT 2019 (CONTINUED)
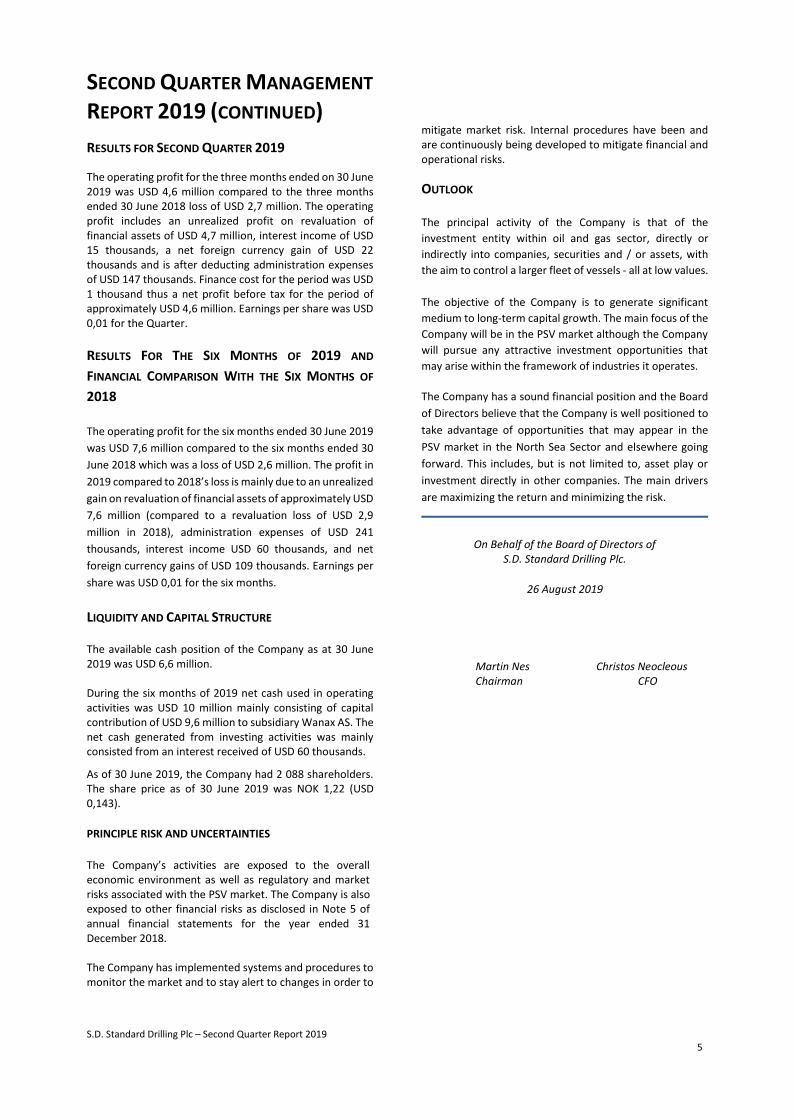
RESULTS FOR SECOND QUARTER 2019
The operating profit for the three months ended on 30 June 2019 was USD 4,6 million compared to the three months ended 30 June 2018 loss of USD 2,7 million. The operating profit includes an unrealized profit on revaluation of financial assets of USD 4,7 million, interest income of USD 15 thousands, a net foreign currency gain of USD 22 thousands and is after deducting administration expenses of USD 147 thousands. Finance cost for the period was USD 1 thousand thus a net profit before tax for the period of approximately USD 4,6 million. Earnings per share was USD 0,01 for the Quarter.
RESULTS FOR THE SIX MONTHS OF 2019 AND
FINANCIAL COMPARISON WITH THE SIX MONTHS OF
2018
The operating profit for the six months ended 30 June 2019
was USD 7,6 million compared to the six months ended 30
June 2018 which was a loss of USD 2,6 million. The profit in
2019 compared to 2018’s loss is mainly due to an unrealized
gain on revaluation of financial assets of approximately USD
7,6 million (compared to a revaluation loss of USD 2,9
million in 2018), administration expenses of USD 241
thousands, interest income USD 60 thousands, and net
foreign currency gains of USD 109 thousands. Earnings per
share was USD 0,01 for the six months.
LIQUIDITY AND CAPITAL STRUCTURE
The available cash position of the Company as at 30 June 2019 was USD 6,6 million. During the six months of 2019 net cash used in operating activities was USD 10 million mainly consisting of capital contribution of USD 9,6 million to subsidiary Wanax AS. The net cash generated from investing activities was mainly consisted from an interest received of USD 60 thousands.
As of 30 June 2019, the Company had 2 088 shareholders. The share price as of 30 June 2019 was NOK 1,22 (USD 0,143).
PRINCIPLE RISK AND UNCERTAINTIES
The Company’s activities are exposed to the overall economic environment as well as regulatory and market risks associated with the PSV market. The Company is also exposed to other financial risks as disclosed in Note 5 of annual financial statements for the year ended 31 December 2018. The Company has implemented systems and procedures to monitor the market and to stay alert to changes in order to
mitigate market risk. Internal procedures have been and are continuously being developed to mitigate financial and operational risks.
OUTLOOK
The principal activity of the Company is that of the
investment entity within oil and gas sector, directly or
indirectly into companies, securities and / or assets, with
the aim to control a larger fleet of vessels - all at low values.
The objective of the Company is to generate significant
medium to long-term capital growth. The main focus of the
Company will be in the PSV market although the Company
will pursue any attractive investment opportunities that
may arise within the framework of industries it operates.
The Company has a sound financial position and the Board
of Directors believe that the Company is well positioned to
take advantage of opportunities that may appear in the
PSV market in the North Sea Sector and elsewhere going
forward. This includes, but is not limited to, asset play or
investment directly in other companies. The main drivers
are maximizing the return and minimizing the risk.
On Behalf of the Board of Directors of S.D. Standard Drilling Plc.
26 August 2019
Martin Nes Christos Neocleous Chairman CFO
S.D. Standard Drilling Plc – Second Quarter Report 2019 6
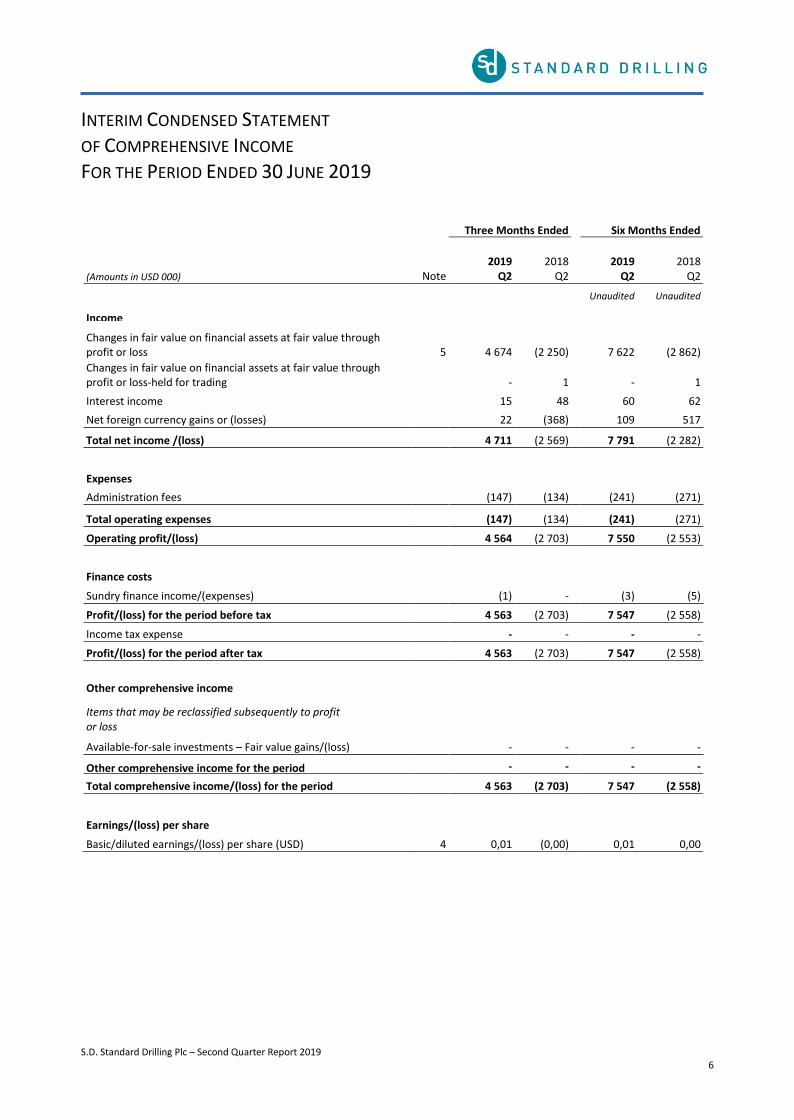
INTERIM CONDENSED STATEMENT OF COMPREHENSIVE INCOME FOR THE PERIOD ENDED 30 JUNE 2019
Three Months Ended Six Months Ended
(Amounts in USD 000) Note 2019
Q2 2018
Q2
2019
Q2 2018
Q2
Unaudited Unaudited
Income
Changes in fair value on financial assets at fair value through profit or loss 5 4 674 (2 250)
7 622 (2 862)
Changes in fair value on financial assets at fair value through profit or loss-held for trading - 1
- 1
Interest income 15 48 60 62
Net foreign currency gains or (losses) 22 (368) 109 517
Total net income /(loss) 4 711 (2 569) 7 791 (2 282)
Expenses
Administration fees (147) (134) (241) (271)
Total operating expenses (147) (134)
(241) (271)
Operating profit/(loss) 4 564 (2 703) 7 550 (2 553)
Finance costs
Sundry finance income/(expenses) (1) - (3) (5)
Profit/(loss) for the period before tax 4 563 (2 703) 7 547 (2 558)
Income tax expense - - - -
Profit/(loss) for the period after tax 4 563 (2 703) 7 547 (2 558)
Other comprehensive income
Items that may be reclassified subsequently to profit or loss
Available-for-sale investments – Fair value gains/(loss) - - - -
Other comprehensive income for the period - - - -
Total comprehensive income/(loss) for the period 4 563 (2 703) 7 547 (2 558)
Earnings/(loss) per share
Basic/diluted earnings/(loss) per share (USD) 4 0,01 (0,00) 0,01 0,00

S.D. Standard Drilling Plc – Second Quarter Report 2019 7
INTERIM CONDENSED STATEMENT
OF FINANCIAL POSITION AT 30 JUNE 2019
(Amounts in USD 000) Note 30.06.2019 31.12.2018
ASSETS Unaudited Audited Equipment and machinery 2 1
Financial assets at fair value through profit or loss 5 112 206 94 966
Total non-current assets 112 208 94 967
Trade and other receivables 35 25
Current tax asset 1 1
Cash and bank balances 6 590 16 382
Total current assets 6 626 16 408
Total Assets 118 834 111 375
EQUITY AND LIABILITIES
Ordinary shares 6 17 281 17 281
Share premium 6 96 861 96 861
Accumulated profits/(losses) 4 683 (2 864)
Total equity 118 825 111 278
Trade and other payables 9 97
Total current liabilities 9 97
Total Equity and Liabilities 118 834 111 375
On Behalf of the Board of Directors of S.D. Standard Drilling Plc.
Martin Nes Christos Neocleous Chairman CFO
S.D. Standard Drilling Plc – Second Quarter Report 2019 8
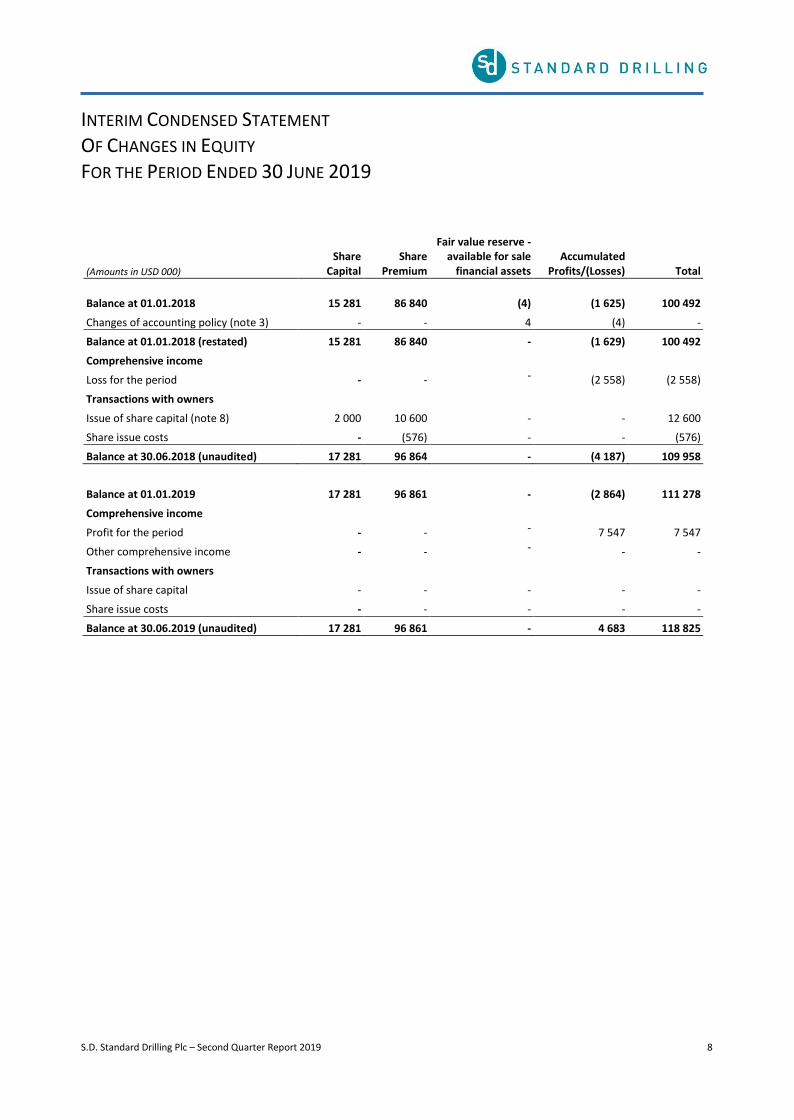
INTERIM CONDENSED STATEMENT OF CHANGES IN EQUITY FOR THE PERIOD ENDED 30 JUNE 2019
(Amounts in USD 000)
Share Capital
Share
Premium
Fair value reserve - available for sale
financial assets Accumulated
Profits/(Losses) Total
Balance at 01.01.2018 15 281 86 840 (4) (1 625) 100 492
Changes of accounting policy (note 3) - - 4 (4) -
Balance at 01.01.2018 (restated) 15 281 86 840 - (1 629) 100 492
Comprehensive income
Loss for the period - - - (2 558) (2 558)
Transactions with owners
Issue of share capital (note 8) 2 000 10 600 - - 12 600
Share issue costs - (576) - - (576)
Balance at 30.06.2018 (unaudited) 17 281 96 864 - (4 187) 109 958
Balance at 01.01.2019 17 281 96 861 - (2 864) 111 278
Comprehensive income
Profit for the period - - - 7 547 7 547
Other comprehensive income - - - - -
Transactions with owners
Issue of share capital - - - - -
Share issue costs - - - - -
Balance at 30.06.2019 (unaudited) 17 281 96 861 - 4 683 118 825
S.D. Standard Drilling Plc – Second Quarter Report 2019 9
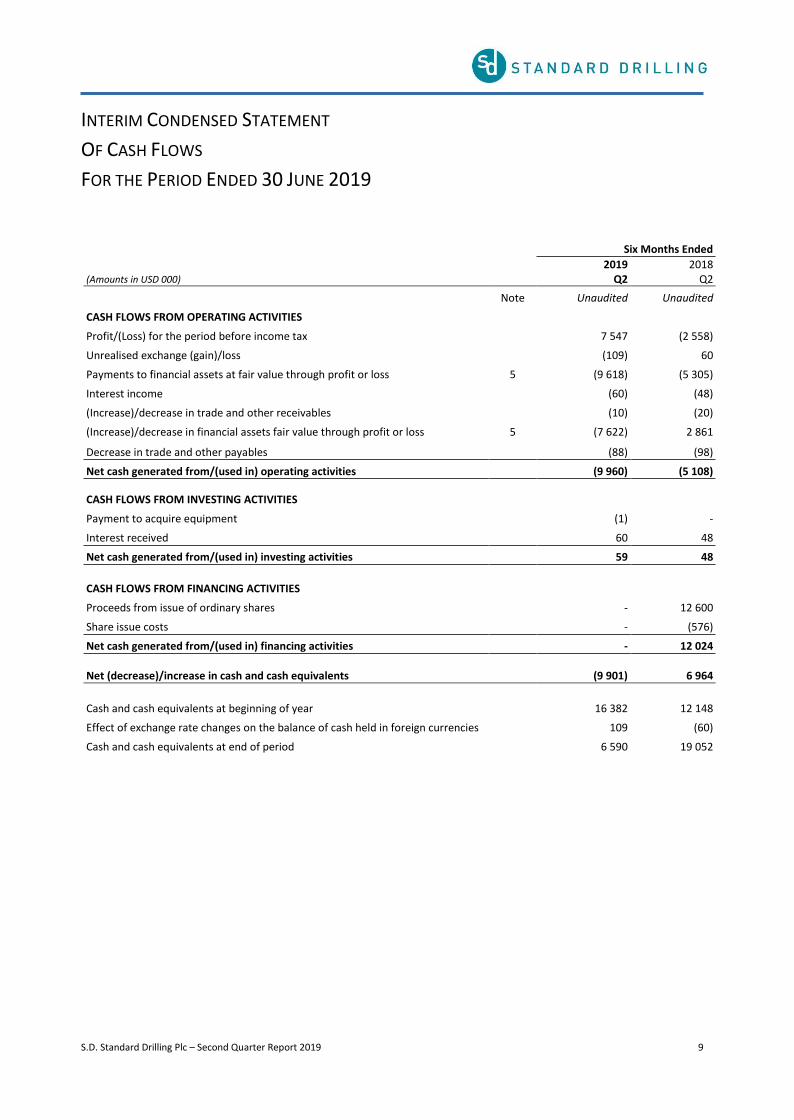
INTERIM CONDENSED STATEMENT
OF CASH FLOWS
FOR THE PERIOD ENDED 30 JUNE 2019
Six Months Ended
(Amounts in USD 000)
2019 Q2
2018 Q2
Note Unaudited Unaudited
CASH FLOWS FROM OPERATING ACTIVITIES
Profit/(Loss) for the period before income tax 7 547 (2 558)
Unrealised exchange (gain)/loss (109) 60
Payments to financial assets at fair value through profit or loss 5 (9 618) (5 305)
Interest income (60) (48)
(Increase)/decrease in trade and other receivables (10) (20)
(Increase)/decrease in financial assets fair value through profit or loss 5 (7 622) 2 861
Decrease in trade and other payables (88) (98)
Net cash generated from/(used in) operating activities (9 960) (5 108)
CASH FLOWS FROM INVESTING ACTIVITIES
Payment to acquire equipment (1) -
Interest received 60 48
Net cash generated from/(used in) investing activities 59 48
CASH FLOWS FROM FINANCING ACTIVITIES
Proceeds from issue of ordinary shares - 12 600
Share issue costs - (576)
Net cash generated from/(used in) financing activities - 12 024
Net (decrease)/increase in cash and cash equivalents (9 901) 6 964
Cash and cash equivalents at beginning of year 16 382 12 148
Effect of exchange rate changes on the balance of cash held in foreign currencies 109 (60)
Cash and cash equivalents at end of period 6 590 19 052

S.D. Standard Drilling Plc – Second Quarter Report 2019 10
NOTES TO THE FINANCIAL INFORMATION
NOTE 1 – INCORPORATION AND PRINCIPAL ACTIVITIES
Country of Incorporation
S.D. Standard Drilling Plc. (the “Company”) is a limited liability Company incorporated and domiciled in Cyprus on 2 December 2010 in accordance with the provisions of the Cyprus Companies Law, Cap. 113. The Company was converted into a public company on 23 December 2010. On 25 March 2011 the Company’s shares were listed on Oslo Axess and on 31 May 2017 on Oslo Bors. The address of the Company’s registered office is Chrysanthou Mylona 1, Panayides Building, 2nd floor, Office 3, 3030, Limassol, Cyprus.
Principal Activities
The principal activity of the Company is to operate as an investment entity within oil and gas sector. The Company invest directly or indirectly into companies, securities and/or assets, with the aim to control a larger fleet of assets- acquired at low values. The objective of the Company is to generate significant medium to long term capital growth. The main focus of the Company will be in the PSV market although the Company will pursue any attractive investment opportunities that may arise within the framework of industries it operates.
The Company’s strategy is to invest into high risk investments in distressed asset acquisition held by unquoted companies where the Company takes active role in helping to build and develop these companies with the aim to make its returns through medium to long term capital gains appreciation as opposed to invest for strategic purposes (i.e. for income return).
NOTE 2 – SIGNIFICANT ACCOUNTING POLICIES
Basis of Preparation
The interim condensed financial statements for the six months ended 30 June 2019, have been prepared in accordance with International Accounting Standard 34 “Interim Financial Reporting”. The interim condensed financial statements should be read in conjunction with the audited financial statements for the year ended 31 December 2018. The accounting policies applied are consistent with those of the annual financial statements for the year ended 31 December 2018 which have been prepared in accordance with IFRS as adopted in the (EU) and the requirements of the Cyprus Companies Law, Cap. 113.
In the current period the Company has adopted all of the new and revised standards and Interpretations issued by the International Accounting Standards Board (the IASB) and the International Financial Reporting Interpretations Committee (the IFRIC) of the IASB that are relevant to its operations and effective for annual periods beginning on 1 January 2019.
At the date of approval of these interim condensed financial statements, a number of accounting standards and interpretations were issued by the International Accounting Standards Board but were not yet effective. The effect and impact of those standards is not expected to be material to the Company.
NOTE 3 – CHANGE OF ACCOUNTING POLICY
IFRS 9 Financial Instruments – Impact of adoption IFRS 9 replaces the provisions of IAS 39 that relate to the recognition, classification and measurement of financial assets and financial liabilities, derecognition of financial instruments, impairment of financial assets and hedge accounting. The adoption of IFRS 9 Financial Instruments from 1 January 2018 resulted in changes in accounting policy and an adjustment to the amounts recognized in the financial statements. The new accounting policies are set out in note 2 of the annual financial statements for the year ended 31 December 2018. Reclassification of equity investments from available to sale to FVPL The Company reclassified as of 31 December 2018 its equity investments previously held as available for sale to fair value through profit or loss since the management’s intention was to dispose them within a short-term period. As a result, related fair value losses of USD 4 thousands were transferred from the available for sale financial assets reserve to retained earnings at the statement of changes in equity for the period.

S.D. Standard Drilling Plc – Second Quarter Report 2019 11
NOTES TO THE FINANCIAL INFORMATION
NOTE 4 – EARNINGS/(LOSS) PER SHARE
Basic earnings per share is calculated by dividing the profit/(loss) attributable to equity holders of the Company by the weighted
average number of ordinary shares in issue during the period.
Three Months Ended Six Months Ended
(Amounts in USD 000) 30.06.2019 30.06.2018 30.06.2019 30.06.2018
Basic/diluted EPS
Profit/(Loss) attributable to equity holders of the Company 4 563 (2 703) 7 547 (2 558)
Weighted average number of ordinary shares in issue (thousands) 576 026 576 026 576 026 553 559
Basic/diluted earnings/(loss) per share (USD) 0,01 (0,00) 0,01 0,00
NOTE 5 – FINANCIAL ASSETS AT FAIR VALUE THROUGH PROFIT AND LOSS
(Amounts in USD 000) 30.06.2019 31.12.2018
Balance at 1 January 94 966 88 379
Additions 9 618 7 281
Change in fair value 7 622 (694)
Balance at the end of the period/year (note 7.1)
112 206 94 966
Investments designated at fair value through profit or loss are analysed as follows:
Name of Investment Principal activity
Place of establishment and principal place of
business
Proportion of ownership/ interest held
30.06.2019 31.12.2018
Wanax AS Investment holding Norway 100% 100% New World Supply Ltd Investment holding Cayman Islands 34,4% 34,4%
During the six months of the year 2019, the Company has contributed USD 9,6 million to its subsidiary Wanax AS to support the working capital needs of its investments, as well as the acquisition of additional investments in PSVs.
The above investments are measured at fair value.
(Amounts in USD 000) 30.06.2019 31.12.2018
Other net changes in fair value on financial assets at fair value through profit or loss
Realised - -
Unrealised change 7 622 (694)
Total net gains/(losses)
7 622 (694)
Other net changes in fair values on assets designated at fair value through profit or loss 7 622 (694)
Total net gains/(losses) 7 622 (694)

S.D. Standard Drilling Plc – Second Quarter Report 2019 12
NOTES TO THE FINANCIAL INFORMATION
NOTE 6 – SHARE CAPITAL AND PREMIUM Authorised (Amounts in USD 000)
Number of shares
(thousands) Ordinary
shares Total
2019 Balance at the beginning of the period 865 000 25 950 25 950 Increase of share capital - - -
Balance at the end of the period 865 000 25 950 25 950
2018 Balance at the beginning of the year 516 667 15 500 15 500 Increase of share capital 348 333 10 450 10 450
Balance at the end of the year 865 000 25 950 25 950
Issued and fully paid (Amounts in USD 000)
Number of shares
(thousands) Ordinary
shares Share
premium Total
2019 Balance at the beginning of the period 576 026 17 281 96 861 114 142 Issue of shares - - - - Share issue costs - - - -
Balance at the end of the period 576 026 17 281 96 861 114 142
2018 Balance at the beginning of the year 509 360 15 281 86 840 102 121 Issue of shares 66 666 2 000 10 600 12 600 Share issue costs - - (579) (579)
Balance at the end of the year 576 026 17 281 96 861 114 142
There have been no movement in shares during the period.
All shares issued have the same rights and are of nominal value of USD 0,03 each.

S.D. Standard Drilling Plc – Second Quarter Report 2019 13
NOTES TO THE FINANCIAL INFORMATION
NOTE 7 – FAIR VALUE MEASUREMENTS
7.1 The table below analyses financial instruments carried at fair value by valuation method. The different levels have been
defined as follows:
• Quoted prices (unadjusted) in active markets for identical assets or liabilities (Level 1).
• Inputs other than quoted prices included within Level 1 that are observable for the asset or liability, either directly
(that is, as prices) or indirectly (that is, derived from prices) (Level 2).
• Inputs for the asset or liability that are not based on observable market data (that is, unobservable inputs) (Level 3).
The following tables present the Company's fair value hierarchy of the financial assets that are measured at fair value:
(Amounts in USD 000) Level 1 Level 2 Level 3 Total
At 30 June 2019 Assets Financial Assets through profit or Loss - Financials asset at fair value through profit or loss (note 5)
14 939
97 267
112 206
Total financial assets measured at fair value - 14 939 97 267 112 206
At 31 December 2018 Assets Financial Assets through profit or Loss - Financials asset at fair value through profit or loss (note 5)
-
14 606
80 360
94 966
Total financial assets measured at fair value - 14 606 80 360 94 966
7.2 Valuation processes
a) Valuation processes (Level 3)
The management of the Company obtained fair value estimates from two independent Valuers (“Valuer A” and “Valuer B”). Both Valuers have provided a value range based on a willing buyer and willing seller market scenario. Valuer A has also provided a value range based on distressed values. Valuer B has not provided a distressed value range, however, a distressed value range has been derived by the management by applying the same discount rate to Valuer B’s willing buyer and willing seller range as the implied discount rate between Valuer A‘s willing buyer and willing seller value range and Valuer A’s distressed value range. The applied fair value for the assets in the Company’s financial statements is then set to the average of these two distressed ranges as the Company decided to apply a more conservative approach due to current market conditions and the frequency of such transactions in the market. Should the Company used the average fair values based on a willing buyer and willing seller market scenario of both Valuers, the total financial assets measured fair value would have been USD 132 million rather than USD 97,3 million.
b) Valuation processes (Level 2)
The fair values of securities that are not quoted in an active market are determined by using valuation techniques and recent comparable transactions. The models used to determine fair values are validated and periodically reviewed by the management of the Company. The inputs in the valuation techniques used include observable data, such as vessel’s sale prices and other relevant information generated by recent market transactions involving identical or comparable (similar) PSV Vessels. The data used as of 30 June 2019 is the net asset value of the underlying SPVs representing cash at bank.

S.D. Standard Drilling Plc – Second Quarter Report 2019 14
NOTES TO THE FINANCIAL INFORMATION
NOTE 7 – FAIR VALUE MEASUREMENTS (CONTINUED) 7.3 Reconciliation of Level 3 fair value measurements The following table presents the changes in Level 3 investments for the six months ended 30 June 2019: (Amount in USD 000)
Financial assets designated at fair
value through profit or
loss
Total
30 June 2019 Opening balance 80 360 80 360 Total gains or losses: - In profit or loss 7 289 7 289
Purchases 9 618 9 618
Issues - -
Disposals/settlements - -
Transfers into level 3 from level 2 - -
Transfers out of level 3 - -
Closing balance 97 267 97 267
The following table presents the changes in Level 3 investments for the year ended 31 December 2018: (Amount in USD 000)
Financial assets at fair value
through profit or loss
Total
31 December 2018 Opening balance 88 379 88 379 Total gains or losses: - In profit or loss (694) (694)
Purchases 7 281 7 281
Issues - -
Disposals/settlements - -
Transfers into level 3 from level 2 - -
Transfers out of level 3 (1) (14 606) (14 606)
Closing balance 80 360 80 360
(1) During Q4 2018, financial assets at fair value through profit or loss amounted to USD 14 606 thousands have been reclassified
from Level 3 to Level 2 as the valuation technique uses prices and other relevant information generated by market transactions involving identical or comparable (similar) PSV Vessels. The data used is based on observable input. The Company’s policy is to recognize transfers into and transfers out of fair value hierarchy levels at the end of each quarter.
Unrealised gains or (losses) recognized in profit and loss attributable to assets held at the end of the reporting period (included in gains/losses) disclosed above:
30 June 2019 7 289 7 289
31 December 2018 (694) (694)
S.D. Standard Drilling Plc – Second Quarter Report 2019 15
NOTES TO THE FINANCIAL INFORMATION
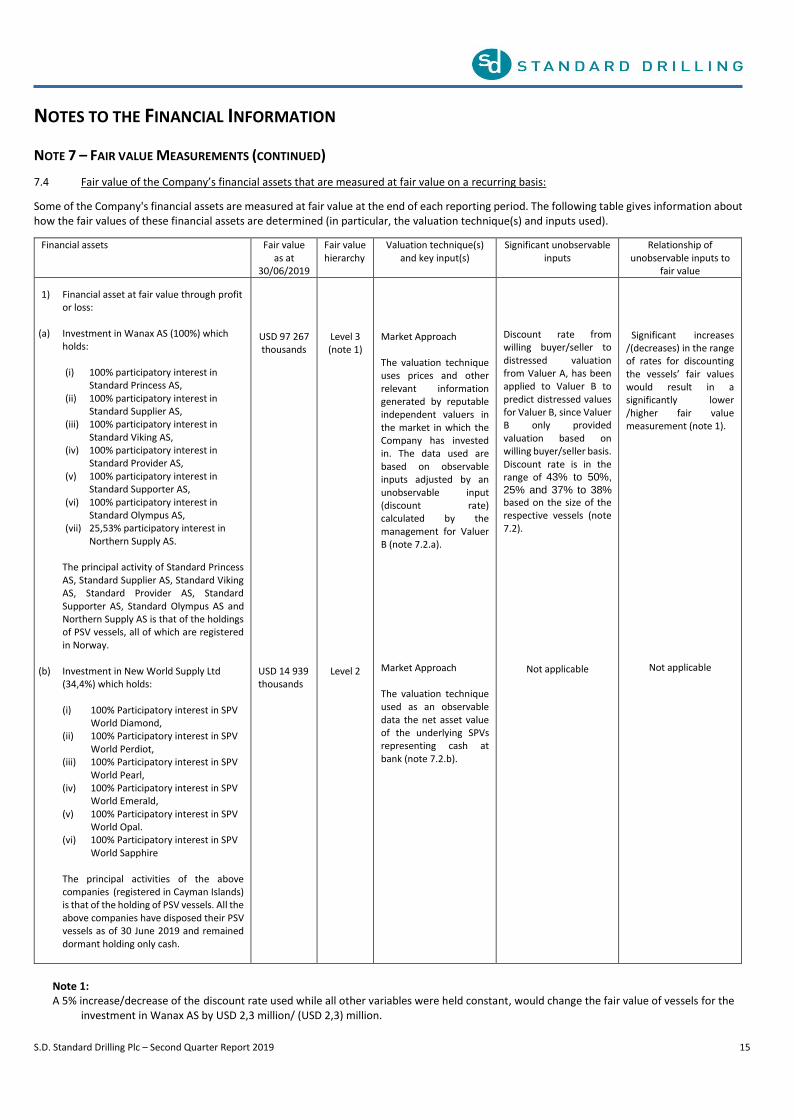
NOTE 7 – FAIR VALUE MEASUREMENTS (CONTINUED)
7.4 Fair value of the Company’s financial assets that are measured at fair value on a recurring basis:
Some of the Company's financial assets are measured at fair value at the end of each reporting period. The following table gives information about how the fair values of these financial assets are determined (in particular, the valuation technique(s) and inputs used).
Financial assets Fair value as at
30/06/2019
Fair value hierarchy
Valuation technique(s) and key input(s)
Significant unobservable inputs
Relationship of unobservable inputs to
fair value
1) Financial asset at fair value through profit or loss:
(a) Investment in Wanax AS (100%) which
holds:
(i) 100% participatory interest in Standard Princess AS,
(ii) 100% participatory interest in Standard Supplier AS,
(iii) 100% participatory interest in Standard Viking AS,
(iv) 100% participatory interest in Standard Provider AS,
(v) 100% participatory interest in Standard Supporter AS,
(vi) 100% participatory interest in Standard Olympus AS,
(vii) 25,53% participatory interest in Northern Supply AS.
The principal activity of Standard Princess AS, Standard Supplier AS, Standard Viking AS, Standard Provider AS, Standard Supporter AS, Standard Olympus AS and Northern Supply AS is that of the holdings of PSV vessels, all of which are registered in Norway.
(b) Investment in New World Supply Ltd
(34,4%) which holds:
(i) 100% Participatory interest in SPV World Diamond,
(ii) 100% Participatory interest in SPV World Perdiot,
(iii) 100% Participatory interest in SPV World Pearl,
(iv) 100% Participatory interest in SPV World Emerald,
(v) 100% Participatory interest in SPV World Opal.
(vi) 100% Participatory interest in SPV World Sapphire
The principal activities of the above companies (registered in Cayman Islands) is that of the holding of PSV vessels. All the above companies have disposed their PSV vessels as of 30 June 2019 and remained dormant holding only cash.
USD 97 267 thousands
USD 14 939 thousands
Level 3 (note 1)
Level 2
Market Approach The valuation technique uses prices and other relevant information generated by reputable independent valuers in the market in which the Company has invested in. The data used are based on observable inputs adjusted by an unobservable input (discount rate) calculated by the management for Valuer B (note 7.2.a).
Market Approach The valuation technique used as an observable data the net asset value of the underlying SPVs representing cash at bank (note 7.2.b).
Discount rate from willing buyer/seller to distressed valuation from Valuer A, has been applied to Valuer B to predict distressed values for Valuer B, since Valuer B only provided valuation based on willing buyer/seller basis. Discount rate is in the range of 43% to 50%,
25% and 37% to 38% based on the size of the respective vessels (note 7.2).
Not applicable
Significant increases /(decreases) in the range of rates for discounting the vessels’ fair values would result in a significantly lower /higher fair value measurement (note 1).
Not applicable
Note 1: A 5% increase/decrease of the discount rate used while all other variables were held constant, would change the fair value of vessels for the
investment in Wanax AS by USD 2,3 million/ (USD 2,3) million.

S.D. Standard Drilling Plc – Second Quarter Report 2019 16
NOTES TO THE FINANCIAL INFORMATION
NOTE 7 – FAIR VALUE MEASUREMENTS (CONTINUED)
7.4 Fair value of the Company’s financial assets that are measured at fair value on a recurring basis:
Some of the Company's financial assets are measured at fair value at the end of each reporting period. The following table gives information about how the fair values of these financial assets are determined (in particular, the valuation technique(s) and inputs used).
Financial assets Fair value as at
31/12/2018
Fair value hierarchy
Valuation technique(s) and key input(s)
Significant unobservable inputs
Relationship of unobservable inputs to
fair value
2) Financial asset at fair value through profit or loss:
(c) Investment in Wanax AS (100%) which
holds:
(viii) 100% participatory interest in Standard Princess AS,
(ix) 100% participatory interest in Standard Supplier AS,
(x) 100% participatory interest in Standard Viking AS,
(xi) 100% participatory interest in Standard Provider AS,
(xii) 100% participatory interest in Standard Supporter AS,
(xiii) 25,53% participatory interest in Northern Supply AS.
The principal activity of Standard Princess AS, Standard Supplier AS, Standard Viking AS, Standard Provider AS, Standard Supporter AS and Northern Supply AS is that of the holdings of PSV vessels, all of which are registered in Norway.
(d) Investment in New World Supply Ltd
(34,4%) which holds:
(vii) 100% Participatory interest in SPV World Diamond,
(viii) 100% Participatory interest in SPV World Perdiot,
(ix) 100% Participatory interest in SPV World Pearl,
(x) 100% Participatory interest in SPV World Emerald,
(xi) 100% Participatory interest in SPV World Opal.
(xii) 100% Participatory interest in SPV World Sapphire
The principal activities of the above companies (registered in Cayman Islands) is that of the holding of PSV vessels. PSV World Emerald and PSV Sapphire disposed the PSV vessels during the year 2018 and remained dormant.
USD 80 360 thousands
USD 14 606 thousands
Level 3 (note 1)
Level 2
Market Approach The valuation technique uses prices and other relevant information generated by reputable independent valuers in the market in which the Company has invested in. The data used are based on observable inputs adjusted by an unobservable input (discount rate) calculated by the management for Valuer B. (note 7.2.a).
Market Approach The valuation technique uses prices and other relevant information generated by market transactions involving identical or comparable (similar) PSV Vessels. The data used is based on observable input (note 7.2.b).
Discount rate from willing buyer/seller to distressed valuation from Valuer A, has been applied to Valuer B to predict distressed values for Valuer B, since Valuer B only provided valuation based on willing buyer/seller basis. Discount rate is in the range of 44% to 50% and 24% to 29% based on the size of the respective vessels (note 7.2).
Not applicable
Significant increases /(decreases) in the range of rates for discounting the vessels’ fair values would result in a significantly lower /higher fair value measurement (note 1).
Not applicable
Note 1: A 5% increase/decrease of the discount rate used while all other variables were held constant, would change the fair value of vessels for the investment in Wanax AS by USD 2,1 million/ (USD 2,1) million.

S.D. Standard Drilling Plc – Second Quarter Report 2019 17
NOTES TO THE FINANCIAL INFORMATION
NOTE 8 – APPROVAL OF INTERIM CONDENSED FINANCIAL STATEMENTS
These interim condensed financial statements have been approved by the Board of Directors of the Company on 26 August 2019.
S.D. Standard Drilling
Financial Calendar (Release of Financial Reports)
Q2 2019 27 August 2019
Q3 2019 11 November 2019
S.D. Standard Drilling Plc
Chrysanthou Mylona 1,
Panayides Building,
2nd Floor, Office 3
CY 3030
Limassol, Cyprus
Tel: +357 25875474
www.standard-drilling.com