sdf
DESCRIPTION
sdfs dfsd fsdfsTRANSCRIPT

1
Information Visualization
What and when to use it
Examples
11/30/2008 Comp 3020 - HCI 1 (PPI) 2
Information Age
11/30/2008 Comp 3020 - HCI 1 (PPI) 3
Some Definitions
• What exactly is visualization?
– Is it something a computer does?
– Is it something humans do?
– Or is it something humans do with computers?
• The idea of visualization is a bit fuzzy
11/30/2008 Comp 3020 - HCI 1 (PPI) 4
What is Visualization?
• Two possible definitions:
visualize: (vb) to form a mental image or vision of�
visualize: (vb) to imagine or remember as if actually seeing�

2
11/30/2008 Comp 3020 - HCI 1 (PPI) 5
What is Visualization?
• Two possible definitions:
– Visualization is a cognitive activity that humans engage in
– Visualization goes on in the mind and is thus an internal
representation which is difficult to study
visualize: (vb) to form a mental image of vision of�
visualize: (vb) to imagine or remember as if actually seeing�
visualize: (vb) to form a mental image of vision of�
visualize: (vb) to imagine or remember as if actually seeing�
11/30/2008 Comp 3020 - HCI 1 (PPI) 6
What is Visualization?
• So far no mention of the use of computers
• In fact, computers are modern tools that can be used to facilitate the visualization process
• Thus define information visualization as the use of computer-supported, interactive, visual representations of data to amplify cognition
• In other words, information visualization uses computational tools to help us to think about data in different ways
11/30/2008 Comp 3020 - HCI 1 (PPI) 7
An Example
• In many situations, data is available in large quantities, and some human insight is required
• An example of such a
situation is traveling via the bus: we have to understand how to get from A to B
11/30/2008 Comp 3020 - HCI 1 (PPI) 8
An Example
• Suppose we want to travel from A to B. We focus our attention on departure and destination stations and the route between them
• We do not memorize the entire map. Rather we visualize the relevant portion(s) of the real map internally (i.e. ‘take 62 on the blue line then 78 on the green line’)
• This internal model of the real map is referred to as a cognitive map, which is available to mental inspection as the real map is to real inspection
• Thus, the printed version of the bus schedule is a visualizationtool that allows us to easily form an appropriate cognitive map

3
11/30/2008 Comp 3020 - HCI 1 (PPI) 9
Iran 3 yrs
India 3 yrs
Niamey, Niger 9 yrs
F’ton, NB 11 yrs
Ottawa, ON 1 yr
Rabat, Morocco 1 yr
Wpg, MB 5 yrs
Professor’s travels
11/30/2008 Comp 3020 - HCI 1 (PPI) 10
11/30/2008 Comp 3020 - HCI 1 (PPI) 11
Some Classic Examples
• The idea of using graphical abstractions to represent data in different ways seems almost intuitive today
• However, this notion is a relatively recent event historically speaking
• A well known pioneer in this area is William Playfair(1759-1823) who sought to replace tables of numbers with systematic visual representations
• The result of his work were some simple and powerful ways to describe, explore and summarize sets of numbers
11/30/2008 Comp 3020 - HCI 1 (PPI) 12
Playfair’s Circles
area of
country
population
taxes
collected
Graphic from E.R. Tufte, The Visual Display of Quantitative Information, 1983

4
11/30/2008 Comp 3020 - HCI 1 (PPI) 13
Playfair’s Circles
sign of slope:
is the country
burdened with taxes?
Britain suffers
from excessive taxation
Issues
Does the slope ‘catch our
attention’? How can we
encode more information
here? Color?
Issues
Does the slope ‘catch our
attention’? How can we
encode more information
here? Color?11/30/2008 Comp 3020 - HCI 1 (PPI) 14
The Terrible Fate of Napoleon’s Army in Russia (C. J. Minard)
Graphic from E.R. Tufte, The Visual Display of Quantitative Information, 1983
11/30/2008 Comp 3020 - HCI 1 (PPI) 15Graphic from E.R. Tufte, The Visual Display of Quantitative Information, 1983
A good example of increasing density of data using a graphical tool.
Six variables are plotted in this two dimensional graphic!
1. time 2. temperature/day 3. longitude
4. latitude 5. army size/day 6. army position/day (color indicates
direction of travel)
time
Lat
Long
size/day
temp.
position/day
temp/day
11/30/2008 Comp 3020 - HCI 1 (PPI) 16
The Terrible Fate of Napoleon’s Army in Russia (C. J. Minard)
Graphic from E.R. Tufte, The Visual Display of Quantitative Information, 1983
Issues
Faced with huge data sets, how does one strike a
balance between simplicity and complexity?
Can additional information be included in the
graphics?
Are there any areas where more information is
beneficial?
How can we develop computational tools that
address these issues?
Issues
Faced with huge data sets, how does one strike a
balance between simplicity and complexity?
Can additional information be included in the
graphics?
Are there any areas where more information is
beneficial?
How can we develop computational tools that
address these issues?

5
11/30/2008 Comp 3020 - HCI 1 (PPI) 17
Dr. John Snow’s use of
graphical tool to locate
source of cholera
outbreak (Soho, 1845)
cholera victim
water pump
11/30/2008 Comp 3020 - HCI 1 (PPI) 18
Dr. John Snow’s use of
graphical tool to locate
source of cholera
outbreak (Soho, 1845)
cholera victim
water pump
contaminated water source
11/30/2008 Comp 3020 - HCI 1 (PPI) 19
Dr. John Snow’s use of
graphical tool to locate
source of cholera
outbreak (Soho, 1845)
cholera victim
water pump
Issues
Could the link between the Broad Street
pump and the cholera epidemic have been
found without the use of graphics?
How could modern interactive computer
graphics have helped Dr. Snow isolate the
source of the outbreak?
Issues
Could the link between the Broad Street
pump and the cholera epidemic have been
found without the use of graphics?
How could modern interactive computer
graphics have helped Dr. Snow isolate the
source of the outbreak?
11/30/2008 Comp 3020 - HCI 1 (PPI) 20Source: Simon Clark http://www.simonclarke.org/lul/maps/lul.gif
The tale of The tale of The tale of The tale of ‘‘‘‘The TubeThe TubeThe TubeThe Tube’’’’

6
11/30/2008 Comp 3020 - HCI 1 (PPI) 21Source: R. Gardiner http://www.nyclondon.com/blog/images/tube_geo.jpg
Tube map superimposed over London
11/30/2008 Comp 3020 - HCI 1 (PPI) 22
Is There a Simpler Way?
• The map of the Tube is accurate yet very complex
• How can graphical techniques help?
• Harry Beck (1931) realized ‘when you’re underground it really doesn’t matter where you are!’
• As long as the stations are presented in sequence and interchanges are clearly delineated, scale can be distorted
• The result … a truly brilliant idea!
11/30/2008 Comp 3020 - HCI 1 (PPI) 23
Lines are drawn horizontally, vertically or at
45 degree angles.
Scale is distorted but sequences of stations
and information about location of
interchanges is preserved.
The map aids cognition by eliminating the
unnecessary spatial elements
The idea has been put to use worldwide
Lines are drawn horizontally, vertically or at
45 degree angles.
Scale is distorted but sequences of stations
and information about location of
interchanges is preserved.
The map aids cognition by eliminating the
unnecessary spatial elements
The idea has been put to use worldwide11/30/2008 Comp 3020 - HCI 1 (PPI) 24
Visualizing Linear Structures
SeeSoft view of fifty-two files containing 15, 255 lines of code
7
11/30/2008 Comp 3020 - HCI 1 (PPI) 25
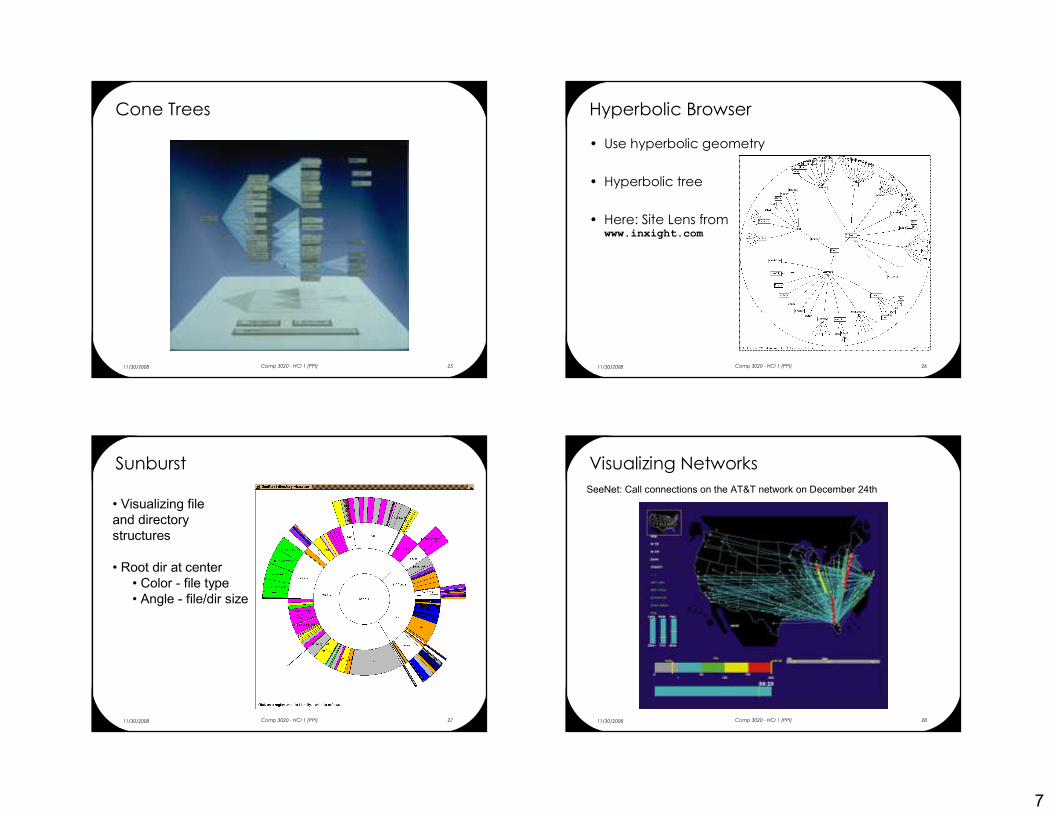
Cone Trees
11/30/2008 Comp 3020 - HCI 1 (PPI) 26
Hyperbolic Browser
• Use hyperbolic geometry
• Hyperbolic tree
• Here: Site Lens fromwww.inxight.com
11/30/2008 Comp 3020 - HCI 1 (PPI) 27
Sunburst
• Visualizing file
and directory
structures
• Root dir at center
• Color - file type
• Angle - file/dir size
11/30/2008 Comp 3020 - HCI 1 (PPI) 28
Visualizing Networks
SeeNet: Call connections on the AT&T network on December 24th

8
11/30/2008 Comp 3020 - HCI 1 (PPI) 29
Visualizing Networks
NV3D: 6 Millions line of code
11/30/2008 Comp 3020 - HCI 1 (PPI) 30
Visualizing Entity-Relationships
11/30/2008 Comp 3020 - HCI 1 (PPI) 31
Visualizing Entity-Relationships
The Geon Diagram
[Irani & Ware, 2002]
11/30/2008 Comp 3020 - HCI 1 (PPI) 32
Illusionary Effects
Be aware of illusions

9
11/30/2008 Comp 3020 - HCI 1 (PPI) 33
11/30/2008 Comp 3020 - HCI 1 (PPI) 35 11/30/2008 Comp 3020 - HCI 1 (PPI) 36

10
11/30/2008 Comp 3020 - HCI 1 (PPI) 37
What did we cover
• Good visual design can lead to insight
• Visualization should amplify cognition, but also targeted at tasks
• Need empirical support to determine which representations are best for a given task