sdgs readiness report - kam.co.ke · % 0.9 0.8 0.7 0.7 0.7 b)tourism direct gdp in growth rate %...
TRANSCRIPT

1
Fact Sheet : SDGs Readiness Report, February 2020
Fact SheetSDGs Readiness ReportA Policy, legislative and Institutional Review of the 17 SDGs in Kenya
February, 2020

2
Fact Sheet : SDGs Readiness Report, February 2020
This publication was developed by the Kenya Association of Manufacturers in partnership with the Office of the Deputy President of Kenya, State Department of Planning, Global Compact Network Kenya, SDGs Kenya Forum and the Parliamentary SDG and Business Caucus.

3
Fact Sheet : SDGs Readiness Report, February 2020
1.2.1 Proportion of population living below the national poverty line, by sex and age
Per cent 46.6 (Total); 49.7 (Rural); 34.4 (Urban)
36.1 (Total); 40.1 (Rural); 29.4 (Urban)
.. ..
1.3.1 Proportion of population covered by social protection floors/systems, by sex, distinguishing children, unemployed persons, older persons, persons with disabilities, pregnant women, newborns, work-injury victims and the poor and the vulnerable
Number .. 352,000 (OVC) 46,917 (PWSDs)
349,778 (OVC) 43,884 (PWSDs)
353,000 (OVC) 47,000 (PWSDs)
Older Persons (%)
.. .. 34.4 ( Total) 28.0 (Male), 39.9 (Female),
34.4 ( Total) 28.0 (Male), 39.9 (Female)
1.5.1 Number of deaths, missing persons and directly affected persons attributed to disasters per 100,000 population
Number per 100,000
1 1 1 1
1.a.1 Proportion of domestically generated resources allocated by the government directly to poverty reduction programmes
Per cent 2.5 (NG-CDF); 20 (Counties)
2.5 (NG-CDF); 20 (Counties)
2.5 (NG-CDF); 24.2 (Counties)
2.5 (NG-CDF); 22.2 (Counties)
1.a.2 Proportion of total government spending on essential services (education, health and social protection)
Per cent 21.2 (Total); 15.6 (Education); 2.5(health); 2.9 (Social protection);
20.4 (Total); 14.3 (Education); 2.5 (Health); 3.7 (Social protection);
22.3 (Total); 16.0 (Education); 2.4 (Health); 3.8 (Social protection);
22.2 (Total); 14.5 (Education); 3.2 (Health); 4.5 (Social protection);
A Policy Gaps
1. Kenya lacks data on the vulnerable persons who are facing extreme poverty and maybe left behind
2. Even with the existence of a policy, national rollout of the cash transfer programme has not been fully implemented
3. The majority of the Kenyans working in the private sector are not actively encouraged to enroll in pension programs. This owes to the fact that there are no attracting alternatives to enroll
4. There exist gaps in implementation of the existing policies.
Indicator Indicator Description UnitBaseline Data (2009-2014) 2016 2017 2018
This goal targets improvement of the economic status of the 1 in every 5 human beings globally, who are currently living in extreme poverty, under $1.250 per day. In Kenya’s case, poverty has been decreasing at a slow pace from 46% in 2012 to 36.1% in 2018 although the population has also increased meaning the number of poor in absolute numbers has NOT changed over time. Poverty, in this respect, is considered as more than just the lack of income but encompasses lack of access to healthcare, education, decent shelter and other basic services.
Key Statistics on Goal 1 are as shown below.

4
Fact Sheet : SDGs Readiness Report, February 2020
B Legal Gaps
1. Weak alignment of legislations towards SDGs attainment.
2. Slow enactment of Senior Citizens and Protection Bill, Food Security Bill, The Livestock and Livestock Products, Marketing Board Bill, 2019, Crops Amendment No.2 Bill 2019, National Drought Management Authority Bill and Natural Resources Public Sharing Bill
3. Need to amend the Pensions Act to expand its effects on the economy and retired persons.
4. The Income Tax Act should explicitly remove people living below poverty line from direct taxation
5. There is no provision for regulating mechanization to protect job losses in the AFA Act
C Institutional Gaps
1. Inadequate establishment of national coordinating mechanisms (National Steering Committee)
2. Disaggregated institutional framework
3. Capacity gap
4. Silo approach
5. Inadequate data desegregation
6. Inadequate mapping and engagement of stakeholders
7. Lack of a stakeholder engagement framework
D Recommendations
1. Undertake a deeper analysis of those that are likely to be left behind and prepare policy frameworks targeting such groups
2. Provide disaggregated data for planning and policy management.
3. Provide mechanisms for full participation of private sector in the pensions sector
4. Sensitization and awareness creation on the existing policy framework
5. Alignment of Policies, Legislations and Institutions towards the 2030 Agenda
6. Full implementation of the existing policies on poverty eradication
7. Strengthen and harness linkages between the various actors on the 2030 Agenda
8. Strengthen National Social Economic council (NESC)
9. Formulate import reduction strategy along with export promotion policy
10. Review of all Acts and regulation older than 5 years. This in line with the 5 years of MTP III
11. The following Laws should be Enacted
1. Senior Citizens and Protection Bill
2. Food Security Bill
3. The Livestock and Livestock Products Marketing Board Bill, 2019
4. Crops Amendment No.2 Bill 2019
5. National Drought Management Authority Bill
6. Natural Resources Public Sharing Bill
12. Proposed Amendments
1. Pensions Act - should also be amended to allow for attractive private pension schemes and also make it possible for beneficiaries to access their savings before retirement. These two changes will safeguard the aging population from poverty in their old age
2. Income Tax Act - should be amended to include an exemption from paying income tax for those earning below the minimum wage. Expand tax bracket and increase personal relief
13. Proposed Legislations
3. Formulation and implementation of data protection laws

5
Fact Sheet : SDGs Readiness Report, February 2020
The goal targets to ensure the providence of nutritious food to members of the society, especially to the young children of disadvantaged families. It is also specific in the nutritional needs of pregnant and lactating mothers. The target is to double the capacity of food production in the domestic levels in states by allowing equal access to land and other resources by women, indigenous communities, and pastoralists. The goal is specific on the need to educate people on advancing technological aids in the agricultural sector and easing the means of accessing financial aid, markets and other relevant opportunities for farmers. The goal also targets to sensitize communities on the diversification of agricultural means through the advancement in plants and animal genetics. This includes the utilization and information sharing of genetic knowledge and traditional knowledge that is proved relevant to securing food security throughout the world.
2.1.1 Prevalence of undernourishment % .. .. 24.2 .. ..
2.1.2 Prevalence of moderate or severe food insecurity in the population, based on the Food Insecurity Experience Scale (FIES)
% 33.4 .. 56.5 (Moderate or severe) 19.1 (Severe)
.. ..
2.2.1 Prevalence of stunting (height for age <-2 standard deviation from the median of the World Health Organization (WHO) Child Growth Standards) among children under 5 years of age
% 26.0 (Total); 29.7 (Male); 22.3 (Female)
.. 29.9 (Total); 32.8 (Male); 26.9 (Female)
.. ..
2.2.2 a)Prevalence of malnutrition (weight for height <-2 standard deviation from the median of the WHO Child Growth Standards) among children under 5 years of age, by type (wasting)
% 4.0 (Total); 4.4 (Male); 3.7 (Female)
.. 6.7 (Total); 7.2 (Male); 6.1 (Female)
.. ..
b)Prevalence of malnutrition (weight for height >+2 standard deviation from the median of the WHO Child Growth Standards) among children under 5 years of age, by type (overweight)
% 4.1 (Total); 4.7 (Male); 3.5 (Female)
.. 4.9 (Total); 4.7 (Male); 6.5 (Female)
.. ..
2.a.1 The agriculture orientation index for government expenditures
Index 0.09 0.05 0.06 0.06 0.06
2.c.1 Indicator of food price anomalies % 8.7 11.4 10.1 13.4 1.37
Indicator Indicator Description UnitBaseline Data (2009-2014) 2015 2016 20182017
Key Statistics on Goal 2 are as shown below.

6
Fact Sheet : SDGs Readiness Report, February 2020
100 percent food and nutrition security by 2030 strategy is an aggressive one especially taking into consideration the proportion of the population living below food poverty line of 36.1 percent.
A Policy Gaps
1. Inadequate access to affordable inputs and credit, technology and technical support/extension services, water for irrigation, and the continued fragmentation of agricultural land into small uneconomical and unproductive sizes
2. Although KALRO maintains gene banks for both plant and animal species, but the effectiveness of this function may be undermined by weak policy and legal framework
3. Agricultural Reseach and Development is under funded
4. Most of the county governments have not developed a comprehensive policy on food security
5. Post-harvest loses still rob the society at least 30 per cent of all foods produced.
6. Overconcentration on non-food cash export crops at the expense of feeding the nation.
7. Neglect of Livestock production in favour of crops by Ministry of Agriculture.
B Legal Gaps
1. Lack of food security law
2. Lack of corresponding county legislation on Agriculture as a devolved function.
3. The Agriculture and Food Authority (AFA) Act and Crops Act are inadequate and prohibitive for the improvement of small holder farmer’s production and productivity
4. Crops Act doesn’t provide for producer and processor agreements that would support contract farming
5. KALRO may conflict with the Biosafety Council established under the Biosafety Act in regulating research in biotechnology in Kenya
6. The Fertilizers and Animal Foodstuffs Act does not provide mandates to regulate their safe disposal
C Institutional Gaps
1. Lack of intensive and commercial farming approach to food production in the country
2. Inadequate establishment of national coordinating mechanisms (National Steering Committee)
3. Disaggregated institutional framework
4. Silo approach
5. Inadequate data desegregation
6. Lack of a stakeholder engagement framework
D Recommendations
1. Promote manufacturing value addition
2. Expand opportunities for small scale producers and increase value addition and sell high quality products in reliable markets
3. Promote agricultural mechanization
4. Promote new food formulation
5. County governments should develop corresponding and localized policies to deal with food insecurity
6. Better support for livestock production in the country
7. Enact/amend legislations to support the implementation of Goal 2
8. Environment and climate change be mainstreamed in all agriculture and food legislations

7
Fact Sheet : SDGs Readiness Report, February 2020
This Goal focuses on ensuring good health and well-being for all by 2030. Although Kenya continues to put in efforts to promote the well-being of society, infant mortality, New HIV and AIDS infections, and, maternal health continue to roll back on the gains of heavy public investment into the health sector.
3.1.1 Maternal mortality ratio
Deaths per 100,000 live births
362 .. .. .. ..
3.1.2 Proportion of births attended by skilled health personnel
Per cent 61.8 .. 70.2 .. ..
3.2.1 Under-five mortality rate
Deaths per ‘000 live births
52 .. .. .. ..
3.2.2 Neonatal mortality rate
Deaths per ‘000 live births
22 .. .. .. ..
3.3.2 Tuberculosis incidence per 100,000 population
Number per 100,000 population
.. .. .. 181 ..
3.3.3 Malaria incidence per 1,000 population
New infections per ‘000 population
225 173 182 62 ..
3.3.4 Hepatitis B incidence per 100,000 population
Number per 100,000 population
27 11 14 9 ..
3.4.2 Suicide Mortality Rate
Number per 1,000,000 population
7 5 7 9 2
3.6.1 Death rate due to road traffic injuries
Deaths per 100,000 population
11 12 11 13 13
3.c.1 Health worker density and distribution
Number per 100,000 population
21 (Doctors); 165 (Nurses) 3 (Dentists); 5 (Pharmacists)
22 (Doctors); 217 (Nurses) 2 (Dentists); 7 (Pharmacists)
23 (Doctors); 230 (Nurses) 3 (Dentists); 7 (Pharmacists)
24 (Doctors); 230 (Nurses) 3 (Dentists); 7(Pharmacists)
24 (Doctors); 260 (Nurses) 3 (Dentists); 7 (Pharmacists)
Indicator Indicator Description
Unit Baseline Data (2009-2014) 2015 2016 20182017
Key Statistics on Goal 3 are as shown below.

8
Fact Sheet : SDGs Readiness Report, February 2020
A Policy Gaps
1. Kenya Health Policy 2014 – 2030 Maternal Mortality Rate (MMR) target of 113 per 100,000 live births by 2030 is inconsistent with SDG target of achieving less than 70 by 2030
2. Universal access to healthcare is still a major challenge for the country
3. Inadequate development/localization of county policies on health
4. The Kenyan health sector has suffered huge blows as a result of industrial action by health workers.
5. No mobile emergency response in times of accidents
6. Community involvement in preventive health care is inadequate
7. Other than the cancer strategy, there is no policy on Non-Communicable Diseases (NCDs)
8. The reduction of hazardous chemicals and air, water and soil pollution and contamination has the potential to substantially reduce the number of deaths and illnesses from these sources. However, enforcement has been the challenge
B Legal Gaps
1. Inadequate implementation of the existing laws on health, nutrition and pollution.
2. Slow enactment of the law on universal access to healthcare
3. Slow enactment of pending bills - The Narcotic Drugs and Psychotropic Substances Control Amendment Bill 2019, Mental health bill; and Reproductive healthcare bill
4. Development of county laws on health
5. Weak enforcement of the existing laws on road safety
C Institutional Gaps
1. Devolved capacity of counties to handle components of health care services.
2. Weak coordination among counties on trans-county health matters.
3. Disaggregated institutional framework
4. Silo approach
5. Weak data desegregation
6. Lack of Stakeholder engagement framework
D Recommendations
1. Encourage local manufacturing of pharmaceutical products and value chain
2. Strengthen regulatory capacity for the sector to promote self-regulation consistent with Kenya’s health goals and objectives
3. Develop internal dispute resolving mechanisms to ensure that industrial action does not disrupt the provision of health services
4. The government and other stakeholders should support the full implementation of the Community Health Strategy
5. Re-orient and refocus health services towards primary health. Involving communities by effectively implementing appropriate strategies will be more effective and ultimately cheaper for the country to achieve the health outcomes
6. The Reproductive Health Policy 2007 needs to be reviewed to be consistent with Kenya Vision 2030 and the Constitution 2010 and include targets consistent with the relevant SDG targets
7. Promote and incentivize private sector investment in health care
8. Develop county cooperation guidelines on health care
9. Recommend Minimum Retail Price for pharmaceuticals in packaging
10. Enactment of Pending Bills
1. The Narcotic Drugs and Psychotropic Substances Control Amendment Bill 2019
2. Mental health bill
3. Reproductive healthcare bill

9
Fact Sheet : SDGs Readiness Report, February 2020
4. Legislation on access to emergency medical treatment
5. Legislation on health insurance subsidy for the senior citizen and physically challenged
6. Legislation on primary healthcare/ universal healthcare coverage in Kenya
7. Legislation on free maternity
11. Proposed Amendments
1. Malaria Prevention Act - should be reviewed to expand its scope for instance a provision making it mandatory for the school administrations both in public and private schools to provide mosquito nets to the students in boarding schools
2. Tobacco Control Act 2007 - should be amended to incorporate the sale and distribution of e-cigarettes which are becoming popular in the developing world

10
Fact Sheet : SDGs Readiness Report, February 2020
4.2.2 Participation rate in organized learning (one year before the official primary entry age), by sex
% 71.8 74.6 74.9 76.9 77.2
4.3.1 a)Technical and Vocational Educational Training (TVET) Enrolment
Number 147,821 (Total); 75,105 (Male); 49,454 (Female);
153,314 (Total); 79,846 (Male); 52,927 (Female);
202,556 (Total); 91,209 (Male); 74,432(Female);
275,139 (Total); 154,581 (Male); 120,558(Female);
363,884 (Total); 205,142 (Male); 158,712(Female);
b) Adult education
Number 330,340 (Total); 113,552 (Male); 216,788 (Female);
306,228 (Total); 102,076 (Male); 204,152(Female)
271,769 (Total); 85,575 (Male); 186,194(Female);
206,224 (Total); 63,588 (Male); 142,636(Female);
212,441 (Total); 65,642 (Male); 146,799(Female);
4.5.1 Parity indices (female/male, rural/urban, bottom/top wealth quintile and others such as disability status, indigenous peoples and conflict-affected, as data become available) for all education indicators on this list that can be disaggregated
Ratio 1.05 (Pre-primary) 0.97 (Primary) 0.92 (Secondary) 0.65 (Tertiary), 0.71 (University)
0.97 (Pre-primary) 0.97 (Primary) 0.90 (Secondary) 0.66 (Tertiary), 0.71 (University)
0.96 (Pre-primary) 0.97 (Primary) 0.95 (Secondary) 0.78 (Tertiary), 0.71 (University)
0.96 (Pre-primary) 0.97 (Primary) 0.95 (Secondary) 0.78 (Tertiary), 0.70 (University)
0.96 (Pre-primary) 1.00 (Primary) 0.91 (Secondary) 0.77 (Tertiary) 0.70 (University)
Indicator Indicator Description Unit Baseline Data
(2009-2014) 2015 2016 20182017
Key Statistics on Goal 4 are as shown below.
Access to quality basic education has been realized as one of the most effective means of alleviating poverty. While the MDGs targets in education were almost met, they contributed substantially to enhancing means of providing free education to millions of school-going children who would have been locked out on account of traditions and cultural practices or poverty and the ignorance of their guardians.

11
Fact Sheet : SDGs Readiness Report, February 2020
4.6.1 Proportion of population in a given age group achieving at least a fixed level of proficiency in functional (a) literacy and (b) numeracy skills, by sex
% 89.1 (Total); 87.8 (Female); 92.4 (Male)
.. .. .. ..
4.a.1 Proportion of schools with access to: (a) electricity; (b) the Internet for pedagogical purposes; (c) computers for pedagogical purposes; (d) adapted infrastructure and materials for students with disabilities; (e) basic drinking water; (f) single-sex basic sanitation facilities; and (g) basic hand washing facilities (as per the WASH indicator definitions)
% 43.8 (Primary); 75.3 (Secondary);
.. ..
4.c.1 Proportion of teachers in: (a) pre- primary; (b) primary; (c) lower secondary; and (d) upper secondary education who have received at least the minimum organized teacher training (e.g. pedagogical training) pre-service or in- service required for teaching at the relevant level in a given country
% 84.1 (Pre-primary); 100 (Primary); 100 (Secondary)
86.7 (Pre-primary); 100 (Primary); 99.8 (Secondary)
88.2 (Pre- primary); 100 (Primary); 99.8 (Secondary)
90.4 (Pre-primary); 100 (Primary); 99.8 (Secondary)
91.5 (Pre-primary) 100 (Primary) 99.8 (Secondary)
Indicator Indicator Description Unit Baseline Data
(2009-2014) 2015 2016 20182017

12
Fact Sheet : SDGs Readiness Report, February 2020
A Policy Gaps
1. Competency based education is being reviewed. Initial policies were on literacy
2. The existing policy framework in education adequately support the achievement of Goal 4. However, Inadequate implementation of existing policies on education is a challenge
3. Youth policy is outdated (2006) and has been in the process of review for several years
4. Mismatch between skills and labour market demands
5. Internship and apprenticeship programs are yet to root as part of the technical training ecosystem.
B Legal Gaps
1. Inadequate implementation of existing laws on education
2. Slow enactment of pending bills and amendment of existing laws to conform to the SDGs
3. Basic Education Acts doesn’t outline sanctions for parents, guardians or community members who fail to take children to school
C Institutional Gaps
1. Inadequate establishment of national coordinating mechanisms (National Steering Committee)
2. Disaggregated institutional framework
3. Silo approach
4. Weak data desegregation
5. Lack of Stakeholder engagement framework
D Recommendations
1. Strengthen the link between government, industry and academia
2. Amend the Basic Education Act to incorporate emerging issues
3. Strengthen TVET education
4. Decentralize the education sector to ensure efficient access
5. Make Internships and Apprenticeship part of Training culture for all technical courses including at Artisan Level
6. Implementation of existing policies on education
Enactment of Pending Bills
1. Kenya Institute of Curriculum Development Amendment Bill 2019
Proposed Amendments
2. Basic Education Act 2013 - should be amended to ensure that school committees get approval from County Education Board before charging any levies to the students.
3. Higher Education Loans Education Board Act 1995 - should be amended to provide loans to both self-sponsored and government sponsored university students
4. Technical vocational training and education Act, 2013 - A review of this Act is necessary to ensure a substantial increase in the number of youth and adults with relevant technical and vocational skills for employment, decent jobs and entrepreneurship

13
Fact Sheet : SDGs Readiness Report, February 2020
This goal is about ending all forms of discrimination against all women and girls everywhere; elimination of all forms of violence against all women and girls in the public and private spheres, including trafficking and sexual and other types of exploitation; and elimination of all harmful practices, such as child, early and forced marriage and female genital mutilation.
5.1.1 Whether or not legal frameworks are in place to promote, enforce and monitor equality and non-discrimination on the basis of sex
No. 1 1 1 1 1
5.2.1 a). Proportion of ever-partnered women and girls aged 15 years and older subjected to physical, sexual or psychological violence by a current or former intimate partner in the previous 12 months, by form of violence and by age (Physical Violence)
% 36.9 .. .. .. ..
b).Proportion of ever-partnered women and girls aged 15 years and older subjected to physical, sexual or psychological violence by a current or former intimate partner in the previous 12 months, by form of violence and by age (Sexual Violence)
% 13.3 .. .. .. ..
c).Proportion of ever-partnered women and girls aged 15 years and older subjected to physical, sexual or psychological violence by a current or former intimate partner in the previous 12 months, by form of violence and by age (Emotional/Psychological Violence)
% 32.4 .. .. .. ..
d).Proportion of ever-partnered women and girls aged 15 years and older subjected to physical, sexual or psychological violence by a current or former intimate partner in the previous 12 months, by form of violence and by age (Physical or Sexual or Emotional/Psychological Violence)
% 47.1 .. .. .. ..
Indicator Indicator Description UnitBaseline Data (2009-2014) 2015 2016 20182017
Key Statistics on Goal 5 are as shown below.

14
Fact Sheet : SDGs Readiness Report, February 2020
e).Proportion of ever-partnered women and girls aged 15 years and older subjected to physical, sexual or psychological violence by a current or former intimate partner in the previous 12 months, by form of violence and by age (Physical and Sexual and Emotional/Psychological Violence)
% 8.5 .. .. .. ..
5.2.2 Proportion of women and girls aged 15 years and older subjected to sexual violence by persons other than an intimate partner in the previous 12 months, by age and place of occurrence
% 22.7 .. .. .. ..
5.3.1 Proportion of women aged 20-24 years who were married or in a union before age 15 and before age 18
% 22.9 .. .. .. ..
5.3.2 Proportion of girls and women aged 15-49 years who have undergone female genital mutilation/cutting, by age
% 21 .. .. .. ..
5.5.2 Proportion of women in managerial positions
% 22.2 (Total) 19.4 (Public sector) 22.6 (Private sector)
.. .. .. ..
5.6.2 Number of countries with laws and regulations that guarantee full and equal access to women and men aged 15 years and older to sexual and reproductive health care, information and education
Number 1 1 1 1 1
5.a.2 Proportion of countries where the legal framework (including customary law) guarantees women’s equal rights to land ownership and/or control
Number 1 1 1 1 1
5.b.1 Proportion of individuals who own a mobile telephone, by sex
% 33.0 (Total); 35.7 (Male); 30.2 (Female)
44.4 (Total); 45.5 (Male); 43.2 (Female) .. ..
5.c.1 Proportion of countries with systems to track and make public allocations for gender equality and women’s empowerment
KSh Million
1,736.20 (WEF); 70.0 (Uwezo Fund), 17,687.2 (AGPO)
1,604.8 (WEF) ; 874.7 (Uwezo Fund), 15,675.0 (AGPO)
2,285.6 (WEF) ; 439.5(Uwezo Fund) 23,774.8 (AGPO)
2,212.4 (WEF) ; 500.0 (Uwezo Fund), 23,691.1 (AGPO)
2,166.3 (WEF) ; 300.0 (Uwezo Fund), 26,114.3 (AGPO)
Indicator Indicator Description UnitBaseline Data (2009-2014) 2015 2016 20182017

15
Fact Sheet : SDGs Readiness Report, February 2020
A Policy Gaps
1. National Policy on Gender and Development and the Sessional Paper No 2 of 2006 on Gender equality and Development came into effect before the Vision 2030 and the Constitution 2010 and have been in the process of review for several years
2. Inadequate implementation of existing policies
B Legal Gaps
1. Slow enactment of pending bills and amendment of existing laws to conform to SDG 5
2. Non-compliance with the two-thirds gender rule in public and private sector
3. Inadequate engendering of Budget and allocation of public resources
4. Weak enforcement of International Conventions
C Institutional Gaps
1. Weak law enforcement by institutions
2. Inadequate data disaggregation
3. Inadequate mapping and engagement of stakeholders
D Recommendations
1. Develop and implement equal pay policy for men and women for equal work and value generation
2. Review existing policies to be in tandem with V2030 and the 2030 Agenda
3. Implement policies on gender discrimination
4. The two thirds gender rule should be enforced gradually. Tracking of progress should be done and publicized annually
5. Enactment of Pending Bills
1. Reproductive Health Bill
2. The Kenya Uwezo Fund Bill, 2019
6. Proposed Amendments
1. Land Act and Land Registration Act - should be reviewed to give married women the ability to use land that is in their husband’s name as collateral in taking loans and use it in all matters pertaining to land use and property
2. National Gender and Equality Commission Act - should be amended to give the commission supervisory powers over entities in the public and private sector to ensure strict compliance with the constitutional and legislative threshold
3. Companies Act - should be reviewed to ensure that there is gender equality in the hiring of employees and the composition of Board of Directors in publicly listed companies
4. Employment Act - should be reviewed to make it mandatory for all companies and private entities to hire men and women in strict adherence to the Constitutional threshold.
5. Prohibition of FGM Act - should be reviewed to tighten its enforcement mechanisms of the prevention of FGM so as to eliminate the harmful practice of FGM
6. Enforcement of International Conventions - All Conventions relating to gender based inequality and violence that have been ratified by Kenya should be implemented as provided for in the Constitution

16
Fact Sheet : SDGs Readiness Report, February 2020
Goal 6 is all about achieving universal and equitable access to safe and affordable drinking water for all, ensuring adequate and equitable sanitation and hygiene for all and ending open defecation, paying special attention to the needs of women and girls and those in vulnerable situations; and improving water quality by reducing pollution, eliminating dumping and minimizing release of hazardous chemicals and materials by 2030.
6.1.1 Proportion of population using safely managed drinking water services
% 66.9 (Households)
.. 72.6 (Households) 68.8 (Individuals)
.. ..
6.2.1 a)Proportion of population using safely managed sanitation services
% 24.7 (Households)
.. 65.7 (Households) 59.3 (individuals)
.. ..
b) Proportion of population with hand-washing facility with soap and water
% 16.7 (Households)
.. 19.4 (Households) 29.7 Urban 11.4 (rural)
.. ..
% .. .. 17.4 (Individuals) 29.5 Urban 10.6 (rural)
.. ..
6.b.1 Proportion of local administrative units with established and operational policies and procedures for participation of local communities in water and sanitation management
% 100 100 100 100 100
Indicator Indicator Description UnitBaseline Data (2009-2014) 2015 2016 20182017
A Policy Gaps
1. Inadequate implementation of policies on reducing pollution, eliminating dumping and minimizing release of hazardous chemicals and materials
2. Community involvement in sanitation is inadequate. Sanitation is a key factor in achieving the health outcomes under Goal 3
3. Most of the fresh water for drinking in public reservoirs is lost through leakages and evaporation
4. Access to water for all and the protection
and rehabilitation of water ecosystems is a challenge
5. Counties are yet to develop/localize water policies
6. No policy to support Community Led Total Sanitation (CLTS)
7. The country has water harvesting and storage gaps that need addressing
8. No policy of borehole recharging
9. Lack of urban sanitation and fecal waste management policies
Key Statistics on Goal 6 are as shown below.

17
Fact Sheet : SDGs Readiness Report, February 2020
10. Lack of financing mechanisms/budget for on-site and Non- Sewered sanitation
11. Inadequate structures on how to partner with Government (PPPs) in the sanitation sector
12. Promote use of treated waste water – both sewage and effluent
13. Decentralize onsite waste treatment systems
14. Promote technology on waste treatment and desalination
B Legal Gaps
1. Water Act fails to shift fresh water usage at the domestic and industry to a sustainable level
2. No law establishes ‘reserve water’ to be maintained at all times
3. Slow enactment of pending bills and amendment of existing laws to conform to Goal 6 – such as the National Environmental Health and Sanitation Bill, The National Sustainable Waste Management Bill
4. Lack of county legislation on Water and sanitation services, Storm water management systems inbuilt up areas, Soil and water conservation and Legislation on Open Defecation Free (ODF) policy
C Institutional Gaps
1. Slow operationalization of Water Act 2016
2. Uneven Distribution of Water resources
3. Inadequate mapping and engagement of stakeholders
4. Lack of clear regulatory/institutional framework for sanitation matters
D Recommendations
1. Improved water resources management and improved water supply and sanitation contribute significantly to increased production and productivity within economic sectors
2. Kenya needs a comprehensive policy on water infrastructure and storage that minimizes wastage
3. Protection of the water eco-systems including water towers should be pursued at the highest political levels to ensure progress is not impeded by narrow political interests
4. Undertake water audit, with a focus on productive sectors
5. Develop water regulations on conservation and use
6. Create an enabling environment for adoption of PPPs in sanitation sector
7. Proposed Amendments
1. Water Act of 2002 - should be reviewed to make it an offence to intentionally pollute water sources. It should also be made an offense for water companies to allow wastage by failing to fix broken pipes within reasonable time
2. Physical Planning Act - should be reviewed to require that all new buildings should be constructed with water harvesting and storage systems especially in the residential areas – dual plumping in each building system for fresh and treated water
3. The Public Health Act of 2012 - should be amended to give more control to the county governments in the management of the local water resources and supply. Section 130 should be reviewed to make bathing, washing of clothes in water resources and draining of water resources to attract criminal sanctions
4. Mining Act 2016 – should be amended to give the Cabinet secretary the power to revoke a mining license in the event that it is proved that mining activities are interfering with the water basin. Hazardous mining activities should also be prohibited in the water catchment areas, unless appropriate measures have been used to contain its effects

18
Fact Sheet : SDGs Readiness Report, February 2020
A Policy Gaps
1. The cost of energy is higher compared to our neighbouring countries. This further undermines the country’s efforts in sustaining this target and achieving the desired industrialization
2. Lack of financing for off-grid entrepreneurs
3. Inadequate policy on renewable energy
4. The current policy is 14 years old (dated 2004) while the Energy Act is 12 years old (dated 2006). Both came into force before the Kenya Vision 2030 and the Constitution 2010
5. The market structure has only one distributor, KPLC which exercises monopoly with limited market driven incentives for cost and operational efficiency
B Legal Gaps
1. Slow enactment of pending bills and amendment of existing laws to conform to Goal 7
2. Various acts haven’t dealt with affordability of electricity and gas
3. Lack of county legislation on electricity and gas reticulation and energy regulation, and Laws and regulations on clean energy
C Institutional Gaps
1. High production costs
2. Regular break downs
3. Low research on alternative sources of energy
4. Inadequate mapping and engagement of stakeholders
Energy continues to play a fundamental role in the realization of all other SDGs. In the recent years, there have been notable strides in ensuring the providence of electricity and clean energy to people through the world. At a global level, the percentage of people with access to electricity has been steadily increasing over the last few decades.
Key Statistics on Goal 7 are as shown below.
2018
7.1.1 Proportion of population with access to electricity
% 36.0 (Households)
.. 41.5 (Households) 33.8 (individuals)
46.0 (Households)
7.1.2 Proportion of population with primary reliance on clean fuels and technology
% 11.9 (Households)
.. 14.6 (Households) 10.7 (Individuals)
19.8 (Households)
7.2.1 Renewable energy share in the total final energy consumption
% 54.8 56.7 56.6 52.8 57.7
7.3.1 Energy intensity measured in terms of primary energy and GDP
Tonnes of Oil equivalent per USD
0.00001995 0.00002096 0.00002049 0.00001846 0.00001762
Indicator Indicator Description Unit Baseline Data
(2009-2014) 2015 2016 2017 2018

19
Fact Sheet : SDGs Readiness Report, February 2020
D Recommendations
1. Kenya needs a policy framework on sustainable energy
2. Promote bio-energy
3. Review the current energy policy with a view to eliminate KPLC monopoly for shared benefits among other Independent Power Producers
4. Need for robust implementation of the Energy Act and subsequent legislations
5. Proposed Amendments
1. Energy Act 2015 - should be amended to establish a commission that will oversee the transition of Kenya from petroleum fuels to clean energy and natural gas
2. Customs and Excise Act/ EAC customs and
management Act - should be amended to make all the clean energy imports such as solar panels, biogas and natural gas to be tax free or attract favorable tax levies
3. Petroleum (Exploration and Production) Act - should be amended to reduce the capital gains tax on foreign investments in the energy sector in order to curb delays in development
6. Others Legislations
1. Transition towards gas pipelines to further reduce distribution costs for gas and increase affordability
2. Promotion of off grid solutions for rural and expansive areas
3. Alignment of all the Laws on energy towards SDGs attainment
4. Explore national economic incentive Act
20
Fact Sheet : SDGs Readiness Report, February 2020
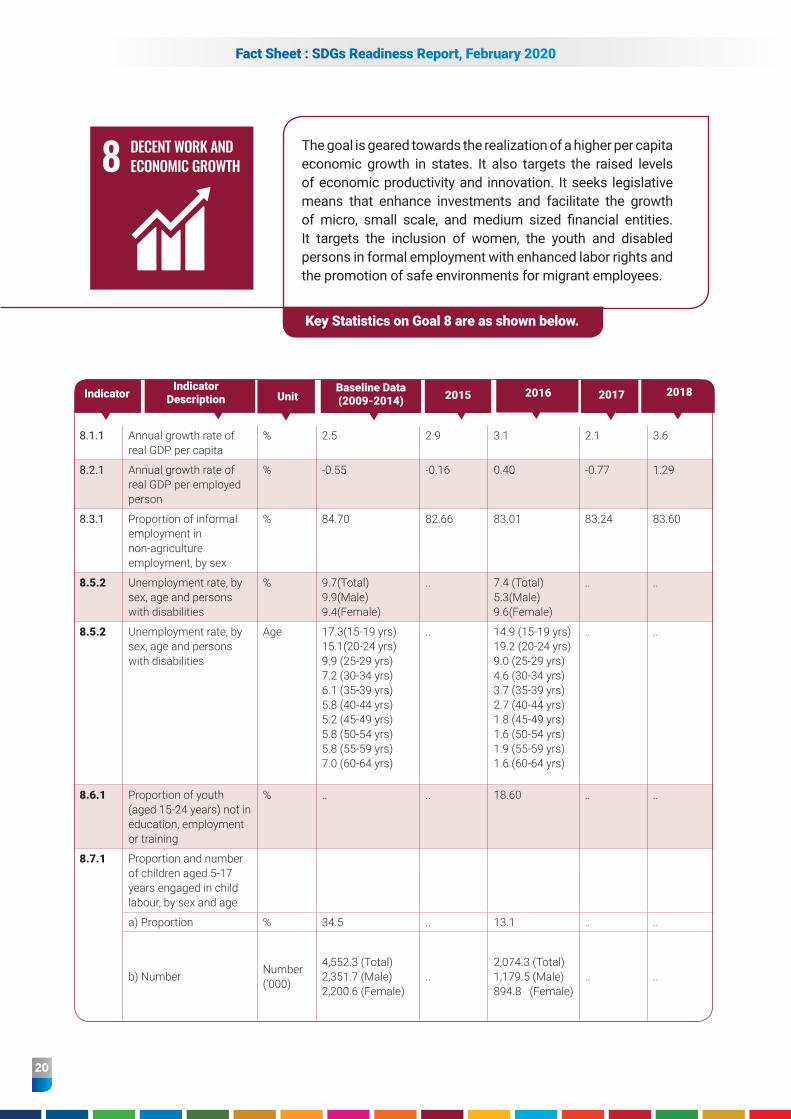
8.1.1 Annual growth rate of real GDP per capita
% 2.5 2.9 3.1 2.1 3.6
8.2.1 Annual growth rate of real GDP per employed person
% -0.55 -0.16 0.40 -0.77 1.29
8.3.1 Proportion of informal employment in non-agriculture employment, by sex
% 84.70 82.66 83.01 83.24 83.60
8.5.2 Unemployment rate, by sex, age and persons with disabilities
% 9.7(Total) 9.9(Male) 9.4(Female)
.. 7.4 (Total) 5.3(Male) 9.6(Female)
.. ..
8.5.2 Unemployment rate, by sex, age and persons with disabilities
Age 17.3(15-19 yrs) 15.1(20-24 yrs) 9.9 (25-29 yrs) 7.2 (30-34 yrs) 6.1 (35-39 yrs) 5.8 (40-44 yrs) 5.2 (45-49 yrs) 5.8 (50-54 yrs) 5.8 (55-59 yrs) 7.0 (60-64 yrs)
.. 14.9 (15-19 yrs) 19.2 (20-24 yrs) 9.0 (25-29 yrs) 4.6 (30-34 yrs) 3.7 (35-39 yrs) 2.7 (40-44 yrs) 1.8 (45-49 yrs) 1.6 (50-54 yrs) 1.9 (55-59 yrs) 1.6 (60-64 yrs)
.. ..
8.6.1 Proportion of youth (aged 15-24 years) not in education, employment or training
% .. .. 18.60 .. ..
8.7.1 Proportion and number of children aged 5-17 years engaged in child labour, by sex and age
a) Proportion % 34.5 .. 13.1 .. ..
b) Number Number (‘000)
4,552.3 (Total) 2,351.7 (Male) 2,200.6 (Female)
..2,074.3 (Total) 1,179.5 (Male) 894.8 (Female)
.. ..
IndicatorIndicator
Description UnitBaseline Data (2009-2014) 2015 2016 20182017
The goal is geared towards the realization of a higher per capita economic growth in states. It also targets the raised levels of economic productivity and innovation. It seeks legislative means that enhance investments and facilitate the growth of micro, small scale, and medium sized financial entities. It targets the inclusion of women, the youth and disabled persons in formal employment with enhanced labor rights and the promotion of safe environments for migrant employees.
Key Statistics on Goal 8 are as shown below.

21
Fact Sheet : SDGs Readiness Report, February 2020
8.8.2 Level of national compliance of labour rights (freedom of association and collective bargaining) based on International Labour Organization (ILO) textual sources and national legislation, by sex and migrant status
Number 328 (CBAs registered)
230 (CBAs registered)
298 (CBAs registered)
386 (CBAs registered)
313 (CBAs registered)
8.9.1 a)Tourism direct GDP as a proportion of total GDP
% 0.9 0.8 0.7 0.7 0.7
b)Tourism direct GDP in growth rate
% -16.7 -1.3 13.3 14.3 16.6
8.9.2 Proportion of jobs in sustainable tourism industries out of total jobs
% 3.09 3.03 2.99 2.96 2.95
8.10.1 (a)Number of commercial bank branches per 100,000 adults and
Number per 100,000 Adults
5 7 7 6 6
(b) number of automated teller machines (ATMs) per 100,000 adults
Number per 100,000 Adults
12 12 11 12 11
8.10.2 Proportion of adults (15 years and older) with an account at a bank or other financial institution or with a mobile-money-service provider
Per cent .. .. 73 .. 81
IndicatorIndicator
Description UnitBaseline Data (2009-2014) 2015 2016 20182017
A Policy Gaps
1. Limited access to insurance policies
2. No specific policies providing clear guidance on this sector particularly in regard to enhancing financial access to MSMEs sector
3. There are no policy on protection of Kenyan workers in other countries
4. Influx of sub-standard goods in the Kenyan market, killing local industries and rendering Kenyans jobless
5. Recognition of the importance of SMEs in creating jobs, economic productivity and in the growth of the key economic sectors. Supportive policy framework is essential.
6. Inadequate implementation of existing policies
7. Kenya does not have raw materials such as quality fabrics, knit and woven products hence, inadequate benefits from Africa Growth Opportunity Act (AGOA)
B Legal Gaps
1. Inadequate implementation of the existing laws
2. Slow enactment of pending bills and amendment of existing laws to conform to Goal 8. These include: the Livestock and livestock Products Development and Marketing Bill 2016
22
Fact Sheet : SDGs Readiness Report, February 2020
3. The County Governments’ Retirement Scheme Bill, 2019
C Institutional Gaps
1. Inability to create adequate formal jobs
2. Poor management of Cooperatives
3. Inadequate Triple Helix among business, government and academia.
D Recommendations
1. Re-Activate the National Economic and Social Council (NESC)
2. Kenyan farmers should have adequate access to crop, livestock and insurance
policies to protect them from potential loss
3. Kenyan farmers should be incentivized to produce the staple foods in large scale to combat food insecurity in the country
4. Formulate/review and implement relevant policies on productive sectors to spur growth
5. Sustained enforcement of importation of substandard goods to protect Kenyan industries
6. Demystify the AGOA initiative through a sensitization campaign targeting SMEs
7. Enactment
1. The County Governments’ Retirement Scheme Bill, 2019
2. The Livestock and Livestock Products Marketing Board Bill, 2019

23
Fact Sheet : SDGs Readiness Report, February 2020
9.1.1 Proportion of the rural population who live within 2 km of an all-season road
% .. .. 61.4 69.0 69.0
9.1.2 Passenger and freight volumes, by mode of transport
000 Passenger
3,715 (Railway) 8,882.0 (Air)
2,288 (Railway) 8,993.2 (Air)
2,793 (Railway) 9,791.9 (Air)
3,096 (Railway) 10,118.2 (Air)
4,490 (Railway) 11,751.9 (Air)
000 tonnes Rail-1,509 Air-279.4 Water- 24,875
Rail-1,542 Air-263.0 Water- 26,732
Rail-1,380 Air-249.5 Water- 27,384
Rail-1,147 Air-290.8 Water- 30,245
Rail - 3,544 Air - 358.7 Water- 30,923
9.2.1 Manufacturing value added as a proportion of GDP and per capita
% 10.0 9.4 9.3 8.0 7.7
KSh/Person 12,511.60 13,323.40 14,415.33 14,062.91 14,421.37
9.2.2 Manufacturing employment as a proportion of total employment
% 12.13 11.76 11.60 11.24 11.12
9.5.1 Research and development expenditure as a proportion of GDP
% 0.48 .. .. .. ..
9.5.2 Researchers (in full-time equivalent) per million inhabitants
Per million inhabitants
100 .. .. .. ..
9.c.1 Proportion of population covered by a mobile network, by technology
% 91 (2G) ; 61 (3G)
.. 95 (2G) ; 78 (3G)
95 (2G); 85 (3G) ; 25 (4G)
95 (2G); 86 (3G) ; 35 (4G)
IndicatorIndicator
Description UnitBaseline Data (2009-2014) 2015 2016 20182017
A Policy Gaps
1. Slow operationalization of Special Economic Zones and industrial parks
2. Inadequate policy framework on commercialization of innovation ideas
3. The National Integrated Transport Policy, the 50 year Transport Master Plan and recently the 20 year Transport Master Plan have been in the process of formulation for long
4. Lack of a policy on research and innovation funding
The targets of this goal were to increase the quality and number of trans-border business and trade to support human well-being and economic development. They also included the promotion of access to small-scale business enterprises, especially in developing countries, by enabling them to access credit and other fundamental financial aid and marketing. Overly, the goal is geared toward the development of infrastructure that is environmentally conscious and resource-use-efficient at the same time.
Key Statistics on Goal 9 are as shown below.
24
Fact Sheet : SDGs Readiness Report, February 2020
5. Government continued borrowing locally crowds out SMEs
6. No policy framework to the provision of SMEs with access to affordable capital, training and skills enhancement, access to markets
B Legal Gaps
1. The Public Private Partnership Act hasn’t been effective to attract private capital for public investments
2. The PPP Act also tends to focus on large projects and ignores small community based projects that would be useful to citizens
3. The Science and Technology and Innovations Act has not attracted adequate private sector involvement
4. Enactment of law establishing Nairobi Metropolitan Area Transport and Authority
5. Lack of counties legislations on county transport including county roads, public road transport, ferries and harbours, traffic parking and street lighting
C Institutional Gaps
1. Lack of a centralized database of contractors
2. Poor disbursements to contractors and service providers
3. Inadequate financing for infrastructure
4. Slow implementation of projects
5. Poor coordination among related agencies/duplication
D Recommendations
1. Focus on reducing the cost of doing business
2. Formulate policies that promote innovation and commercialization in the private sector to create jobs
3. Provide mechanisms for commercialization of innovative ideas
4. Re-align existing policies to the 2030 Agenda
5. Fast-track the development of SEZs and industrial parks
6. Enhance financing for infrastructure and be properly targeted
7. Strict adherence to contract time frames
8. Improve sector-wide planning and execution of projects
9. Enactment
1. The Labour Relations (Amendment) Bill, 2019
2. The Public Service Commission (Amendment) Bill, 2019
3. The Kenya Information And Communications (Amendment) Bill, 2019
10. Proposed Amendments
1. Science, Technology and Innovation Act - should be amended to make it a responsibility for the government of Kenya to provide funding for technological startups
2. Intellectual Property Act - should be amended to protect traditional cultural expressions from infringement. Kenya is losing billions of shillings as a result of pilferage of traditional cultural expressions
3. Micro and Small Enterprises Act - should be amended to remove restrictions in the formation of small enterprises. The process should be fast tracked to ensure that a small business entity can be registered within a day
25
Fact Sheet : SDGs Readiness Report, February 2020
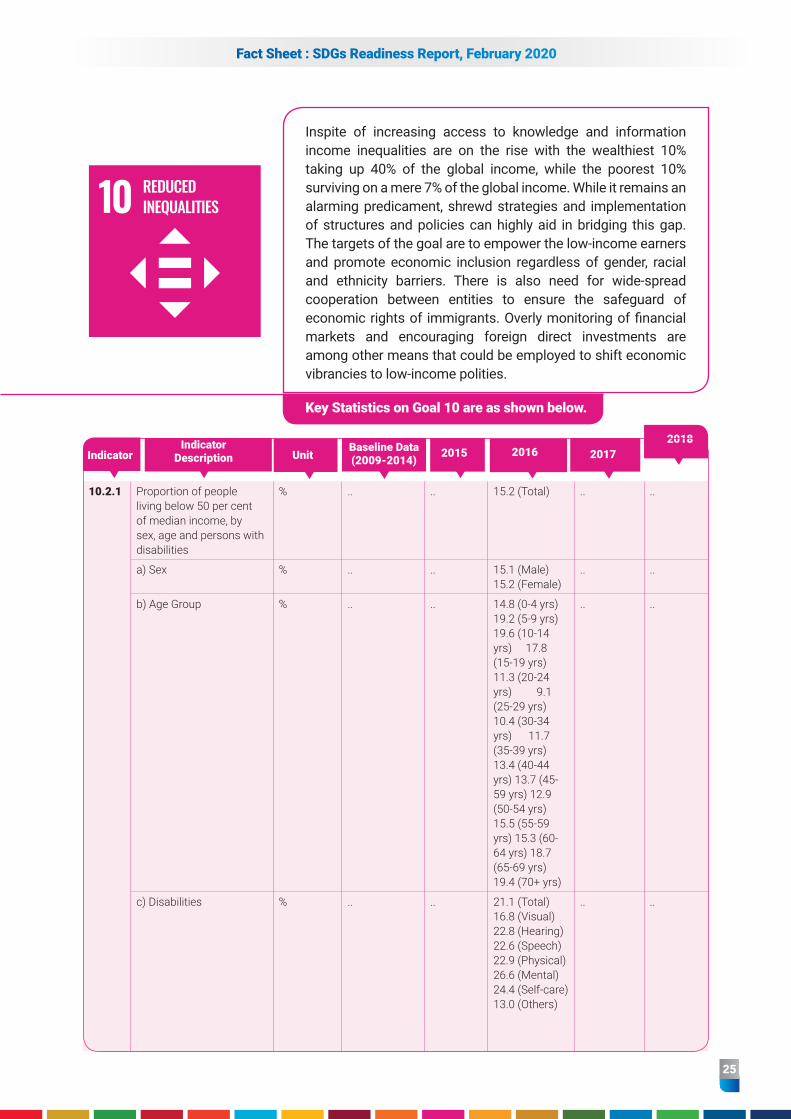
10.2.1 Proportion of people living below 50 per cent of median income, by sex, age and persons with disabilities
% .. .. 15.2 (Total) .. ..
a) Sex % .. .. 15.1 (Male) 15.2 (Female)
.. ..
b) Age Group % .. .. 14.8 (0-4 yrs) 19.2 (5-9 yrs) 19.6 (10-14 yrs) 17.8 (15-19 yrs) 11.3 (20-24 yrs) 9.1 (25-29 yrs) 10.4 (30-34 yrs) 11.7 (35-39 yrs) 13.4 (40-44 yrs) 13.7 (45-59 yrs) 12.9 (50-54 yrs) 15.5 (55-59 yrs) 15.3 (60-64 yrs) 18.7 (65-69 yrs) 19.4 (70+ yrs)
.. ..
c) Disabilities % .. .. 21.1 (Total) 16.8 (Visual) 22.8 (Hearing) 22.6 (Speech) 22.9 (Physical) 26.6 (Mental) 24.4 (Self-care) 13.0 (Others)
.. ..
IndicatorIndicator
Description UnitBaseline Data (2009-2014)
2015 20162018
2017
Inspite of increasing access to knowledge and information income inequalities are on the rise with the wealthiest 10% taking up 40% of the global income, while the poorest 10% surviving on a mere 7% of the global income. While it remains an alarming predicament, shrewd strategies and implementation of structures and policies can highly aid in bridging this gap. The targets of the goal are to empower the low-income earners and promote economic inclusion regardless of gender, racial and ethnicity barriers. There is also need for wide-spread cooperation between entities to ensure the safeguard of economic rights of immigrants. Overly monitoring of financial markets and encouraging foreign direct investments are among other means that could be employed to shift economic vibrancies to low-income polities.
Key Statistics on Goal 10 are as shown below.

26
Fact Sheet : SDGs Readiness Report, February 2020
A Policy Gaps
1. Inadequate implementation of the two thirds gender rule
2. No policy on management of migrant remittances
3. Slow implementation of Equal pay for Equal work policy
B Legal Gaps
1. Slow enactment of pending bills and amendment of existing laws to conform to Goal 10.
2. Central Bank Act doesn’t allow the institution to negotiate host country agreements to enable easier and cheaper transfer of Money to and from Kenya
3. Inadequate implementation of existing laws
4. Non-compliance to Equal pay for Equal work
5. The Refugees Act doesn’t allow Kenya to tap into the competence of Refuges may be commercial, entrepreneurial or professional
10.4.1 Labour share of GDP, comprising wages and social protection transfers
% 30.1 30.0 28.7 29.1 29.2
10.6.1 Proportion of members and voting rights of developing countries in international organizations
a) Membership Number 6 6 6 6 6
b) voting rights Number 6 6 6 6 6
10.b.1 Total resource flows for development, by recipient and donor countries and type of flow (e.g. official development assistance, foreign direct investment and other flows)
KSh Million 28,117.50 29,596.70 25,903.99 27,600.14 47,483.00
10.c.1 Remittance costs as a proportion of the amount remitted
% .. .. 8.47 .. ..
IndicatorIndicator
Description UnitBaseline Data (2009-2014)
2015 2016 20182017
C Institutional Gaps
1. Inadequate establishment of national coordinating mechanisms (National Steering Committee)
2. Disaggregated institutional framework
3. Silo approach
4. Weak data dessegregation
5. Lack of a stakeholder engagement framework
6. Unfavorable tax policies that hurt the poor and discourage production.
7. Weak Enforcement of Laws
D Recommendations
1. Sustainable implementation of the two thirds gender rule
2. Develop/Review and implement policies to ensure equal opportunity and reduce inequalities of outcome, including by eliminating discriminatory laws, policies and practices and promoting appropriate legislation, policies and action in this regard

27
Fact Sheet : SDGs Readiness Report, February 2020
3. Enhance a tax regime that supports private sector
4. Operationalize the equality funds and expected disbursements.
5. Enactment
1. The Equalization Fund Bill, 2019
2. The National Youth Council(Amendment) Bill, 2019
3. The Higher Education Loans Board (Amendment) Bill, 2019
6. Proposed Amendment
1. Community Land Act - The common tenancy of the land provided under the community land act should be used in securing a loan from the bank.
2. Alignment of the laws towards SDGs attainment
3. Review the Act to facilitate easier and preferential transfers to Kenya for remittance destinations such USA, UAE, South Africa among others
4. Refugees Act should be reviewed to accommodate positive contribution by migrants

28
Fact Sheet : SDGs Readiness Report, February 2020
11.1.1 Proportion of urban population living in slums, informal settlements or inadequate housing
% 7.9 .. .. .. ..
11.4.1 Total expenditure (public and private) per capita spent on the preservation, protection and conservation of all cultural and natural heritage, by type of heritage (cultural, natural, mixed and World Heritage Centre designation), level of government (national, regional and local/municipal), type of expenditure (operating expenditure/investment) and type of private funding (donations in kind, private non-profit sector and sponsorship)
KSh/person 274.62 296.62 338.79 284.77 310.92
11.5.1 Number of deaths, missing persons and persons affected by disaster per 100,000 people
Number per 100,000
1 2 1 1 1
11.6.1 Proportion of urban solid waste regularly collected and with adequate final discharge out of total urban solid waste generated, by cities
$ 44.0 .. 56.6 53.6 57.4
IndicatorIndicator
Description UnitBaseline Data (2009-2014)
2015 2016 20182017
As the society changes, more and more people are preferring life in the urban centres. It is estimated that over 50% of the world population resides in or within an urban centre. The figure is estimated to increase to over 67.7% by 2050. The advent of rural-urban migration, therefore, necessitates conducive structuring of the centres in a manner that is safe and sustainable. The targets of this goal are to enhance inclusive and sustainable urbanization with the optimal capacity to ensure the providence of safe and affordable housing, transportation and amenities to members of the society. It also targets to reduce the numbers of deaths and destruction of property occasioned by natural calamities through the application of technological aids to developing good housing and infrastructure in disaster-prone areas.
Key Statistics on Goal 11 are as shown below.

29
Fact Sheet : SDGs Readiness Report, February 2020
11.b.2 Proportion of local governments that adopt and implement local disaster risk reduction strategies in line with national risk reduction strategies
Per cent 100 100 100 100 100
IndicatorIndicator
Description UnitBaseline Data (2009-2014)
2015 2016 20182017
A Policy Gaps
1. Most of policies in support of Goal 11 were developed before Kenya Vision 2030 and 2030 agenda and need review
2. National Urban Development Policy for 50 years and the National Integrated Transport Policy, National Transport Master Plan for 20 years are not in place
3. No e-Waste management policy
4. Policy framework for floods, epidemics and fires not formulated
5. Uncontrolled development and subdivision of land into small plots without providing for public and green spaces
6. Sector policies at national and county levels on the disposal of solid waste and air pollution control are lacking
7. Continued unregulated and uncontrolled development of urban areas that are now extending into the surrounding rural areas.
B Legal Gaps
1. Slow enactment of pending bills and amendment of existing laws to conform to Goal 11
2. The enforcement of the Physical Planning Act has been weak leading to development of informal settlements
3. Approval fees for development have been a hindrance to development
4. Inadequate implementation of the existing Laws
5. Lack of county legislation on county transport including county roads, public road transport, ferries and harbours, traffic and parking and street lighting
C Institutional Gaps
1. Poor Enforcement of Urban Planning Codes
2. Slow improvement of informal settlements
3. Poor solid Waste Management
D Recommendations
1. Actualization of National Spatial Plan, 2015 -2045.
2. Continuous and sustained slum upgrading
3. Partner with private sector to address solid waste management.
4. Prepare and implement national action plans to actualize existing strategies on climate related aspects
5. Develop/Review and implement policies such as e-waste
6. Proposed Amendments
1. Physical planning Act should be reviewed to offer flexibility in the development of urban area. It can for example allow for phased development of supportive infrastructure
2. National Land Commission Act - should be amended to require the commission to update their records to digital copies giving priority to communally owned land. This would ensure transparency and peaceful coexistence of communities
3. National Disaster Management Act - should be amended to establish emergency centres in residential areas in order to increase disaster preparedness of the country.
4. Review and alignment of the Laws towards SDGs attainment
30
Fact Sheet : SDGs Readiness Report, February 2020
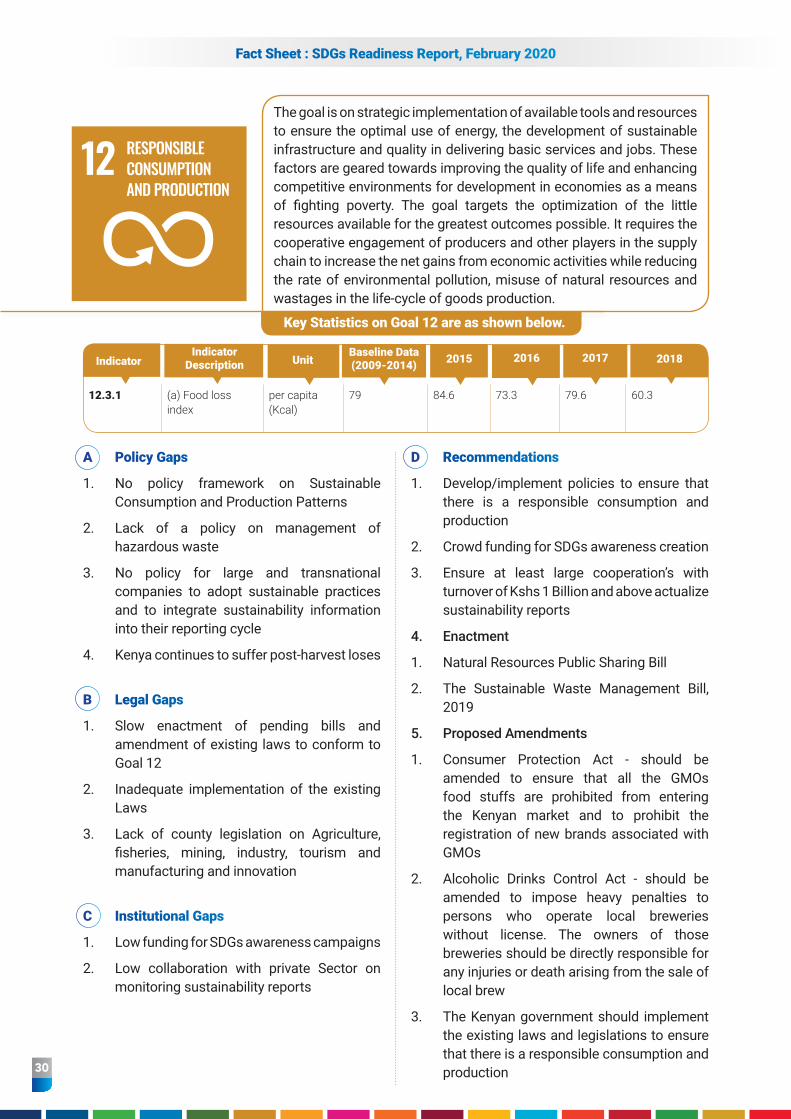
12.3.1 (a) Food loss index
per capita (Kcal)
79 84.6 73.3 79.6 60.3
IndicatorIndicator
Description UnitBaseline Data (2009-2014) 2015 2016 20182017
A Policy Gaps
1. No policy framework on Sustainable Consumption and Production Patterns
2. Lack of a policy on management of hazardous waste
3. No policy for large and transnational companies to adopt sustainable practices and to integrate sustainability information into their reporting cycle
4. Kenya continues to suffer post-harvest loses
B Legal Gaps
1. Slow enactment of pending bills and amendment of existing laws to conform to Goal 12
2. Inadequate implementation of the existing Laws
3. Lack of county legislation on Agriculture, fisheries, mining, industry, tourism and manufacturing and innovation
C Institutional Gaps
1. Low funding for SDGs awareness campaigns
2. Low collaboration with private Sector on monitoring sustainability reports
D Recommendations
1. Develop/implement policies to ensure that there is a responsible consumption and production
2. Crowd funding for SDGs awareness creation
3. Ensure at least large cooperation’s with turnover of Kshs 1 Billion and above actualize sustainability reports
4. Enactment
1. Natural Resources Public Sharing Bill
2. The Sustainable Waste Management Bill, 2019
5. Proposed Amendments
1. Consumer Protection Act - should be amended to ensure that all the GMOs food stuffs are prohibited from entering the Kenyan market and to prohibit the registration of new brands associated with GMOs
2. Alcoholic Drinks Control Act - should be amended to impose heavy penalties to persons who operate local breweries without license. The owners of those breweries should be directly responsible for any injuries or death arising from the sale of local brew
3. The Kenyan government should implement the existing laws and legislations to ensure that there is a responsible consumption and production
The goal is on strategic implementation of available tools and resources to ensure the optimal use of energy, the development of sustainable infrastructure and quality in delivering basic services and jobs. These factors are geared towards improving the quality of life and enhancing competitive environments for development in economies as a means of fighting poverty. The goal targets the optimization of the little resources available for the greatest outcomes possible. It requires the cooperative engagement of producers and other players in the supply chain to increase the net gains from economic activities while reducing the rate of environmental pollution, misuse of natural resources and wastages in the life-cycle of goods production.
Key Statistics on Goal 12 are as shown below.

31
Fact Sheet : SDGs Readiness Report, February 2020
13.1.1 Number of deaths, missing persons and persons affected by disaster per 100,000 people
Number per 100,000
1 2 1 1 1
13.1.2 Number of countries that adopt and implement national disaster risk reduction strategies in line with the Sendai Framework for Disaster Risk Reduction 2015-2030
Policy 1 1 1 1 1
13.1.3 Proportion of local governments that adopt and implement local disaster risk reduction strategies in line with national risk reduction strategies
% 100 100 100 100 100
Indicator Indicator Description Unit Baseline Data
(2009-2014) 2015 2016 20182017
Goal 13 champions strengthening resilience and adaptive capacity to climate-related hazards and natural disasters in all countries; and integration of climate change measures into national policies, strategies and planning. This draws from the fact that climate change currently presents the biggest challenge to development. The heaviest burden of the predicament is borne by the poor states which contribute least to the environmental degradation. The goal targets the implementation of scalable and affordable means of fighting the causation of climate change. The Paris agreement of 2015 is among the notable strides that states have committed to implementing as a means of combating the menace.
Key Statistics on Goal 13 are as shown below.

32
Fact Sheet : SDGs Readiness Report, February 2020
A Policy Gaps
1. Lack of publicly available data on the government’s international commitments on environment
2. Inadequate implementation existing policies
3. Poor preparedness by key sectors, tourism and agro exports on the effects of climate change
B Legal Gaps
1. Slow enactment of pending bills and amendment of existing laws to conform to Goal 13
2. Lack of green fund Legislation to promote climate smart technologies
3. No legislation regulates production in urban areas
4. The Forests Act is silent on promotion of multi-purpose trees and the prevention of introduction of unsuitable exotic plants
13.2.1 Number of countries that have communicated the establishment or operationalization of an integrated policy/strategy/plan which increases their ability to adapt to the adverse impacts of climate change, and foster climate resilience and low greenhouse gas emissions development in a manner that does not threaten food production (including a national adaptation plan, nationally determined contribution, national communication, biennial update report or other)
Strategies National Climate Change Response Strategy 2010; National Climate Change Action Plan 2013-2017;
National Climate Change Response Strategy 2010; National Climate Change Action Plan 2013-2017; Kenya Independent Nationally Determined Contribution(INDC) 2015; Kenya National Adaptation Plan 2015-2030.
National Climate Change Response Strategy 2010; National Climate Change Action Plan 2013-2017; Kenya Independent Nationally Determined Contribution(INDC) 2015; The Climate Change Act 2016; National Climate Change Framework policy 2016; Kenya National Adaptation Plan 2015-2030.
National Climate Change Response Strategy 2010; National Climate Change Action Plan 2013-2017; Kenya Independent Nationally Determined Contribution(INDC) 2015; The Climate Change Act 2016; National Climate Change Framework policy 2016; Kenya National Adaptation Plan 2015-2030.
National Climate Change Response Strategy 2010; National Climate Change Action Plan 2013-2017; Kenya Independent Nationally Determined Contribution(INDC) 2015; The Climate Change Act 2016; National Climate Change Framework policy 2016; Kenya National Adaptation Plan 2015-2030.
Indicator Indicator Description Unit Baseline Data
(2009-2014) 2015 2016 20182017
5. Lack of counties legislations on implementation of national government policies on natural resources and environmental conservation
6. Lack of specific legislation on green fund
C Institutional Gaps
1. Inadequate financing for climate resilient production especially in agriculture.
2. Low shift towards low carbon society
3. Slow operationalization of climate-related institutional framework
D Recommendations
1. Companies should be required to make mandatory reports on reducing the emission of greenhouse gases
2. Mobilize basket funding for climate related resilience and shift forwards low carbon emissions by industries

33
Fact Sheet : SDGs Readiness Report, February 2020
3. Enactment
1. The National Drought Management Authority (Amendment) Bill, 2019
4. Proposed Amendments
1. Climate Change Act 2016 - should be amended to include a provision that grants tax breaks to manufacturing industries that take initiatives to reduce CO2 emissions and use clean energy. This measure will motivate manufacturing industries and factories to adopt sustainable energy sources
2. Public Procurement and Disposal Act - The disposal of industrial waste is the greatest threat to the natural environment. Improper disposal of industrial waste has led to accidents on both humans and animals. The Industrial Procurement and Protection Act should be amended to prohibit those entities that are releasing toxic wastes to the environment from participating in the government procurement process
3. Environmental Management and coordination Act - should be amended to give NEMA the power to close down industrial plants that are carrying out operations in a manner that is detrimental to the environment and injurious to the health of the people living around the plant
5. New Legislations
1. Promotion of Green growth policies and practice
2. Need for legislation to promote safe urban and Peri Urban farming
3. Control of introduction of exotic species to protect local demands and variation of environment and social life
4. Review and alignment of Laws towards SDGs implementation
34
Fact Sheet : SDGs Readiness Report, February 2020
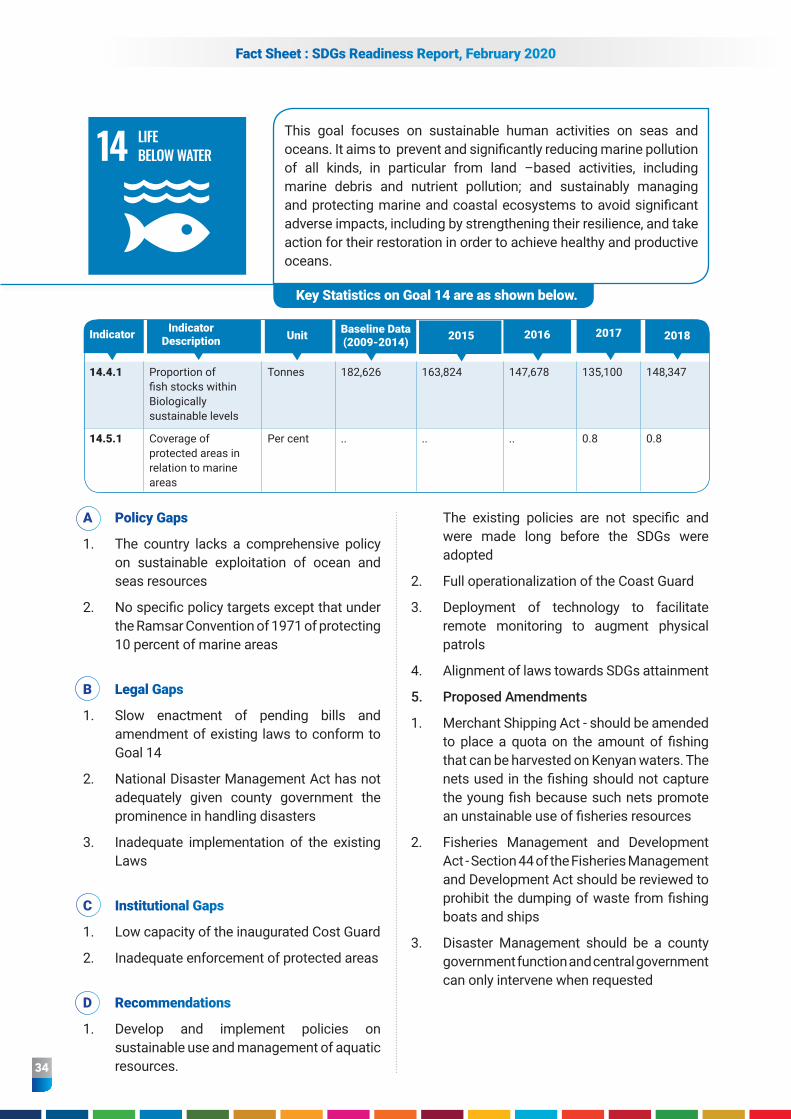
14.4.1 Proportion of fish stocks within Biologically sustainable levels
Tonnes 182,626 163,824 147,678 135,100 148,347
14.5.1 Coverage of protected areas in relation to marine areas
Per cent .. .. .. 0.8 0.8
Indicator Indicator Description Unit Baseline Data
(2009-2014) 2015 2016 20182017
A Policy Gaps
1. The country lacks a comprehensive policy on sustainable exploitation of ocean and seas resources
2. No specific policy targets except that under the Ramsar Convention of 1971 of protecting 10 percent of marine areas
B Legal Gaps
1. Slow enactment of pending bills and amendment of existing laws to conform to Goal 14
2. National Disaster Management Act has not adequately given county government the prominence in handling disasters
3. Inadequate implementation of the existing Laws
C Institutional Gaps
1. Low capacity of the inaugurated Cost Guard
2. Inadequate enforcement of protected areas
D Recommendations
1. Develop and implement policies on sustainable use and management of aquatic resources.
The existing policies are not specific and were made long before the SDGs were adopted
2. Full operationalization of the Coast Guard
3. Deployment of technology to facilitate remote monitoring to augment physical patrols
4. Alignment of laws towards SDGs attainment
5. Proposed Amendments
1. Merchant Shipping Act - should be amended to place a quota on the amount of fishing that can be harvested on Kenyan waters. The nets used in the fishing should not capture the young fish because such nets promote an unstainable use of fisheries resources
2. Fisheries Management and Development Act - Section 44 of the Fisheries Management and Development Act should be reviewed to prohibit the dumping of waste from fishing boats and ships
3. Disaster Management should be a county government function and central government can only intervene when requested
This goal focuses on sustainable human activities on seas and oceans. It aims to prevent and significantly reducing marine pollution of all kinds, in particular from land –based activities, including marine debris and nutrient pollution; and sustainably managing and protecting marine and coastal ecosystems to avoid significant adverse impacts, including by strengthening their resilience, and take action for their restoration in order to achieve healthy and productive oceans.
Key Statistics on Goal 14 are as shown below.

35
Fact Sheet : SDGs Readiness Report, February 2020
15.1.1 Forest area as a proportion of total land area
Per cent 7.07 7.16 7.21 7.28 7.28
15.3.1 Proportion of land that is degraded over total land area
Per cent .. .. .. 11.4 11.4
IndicatorIndicator
Description Unit Baseline Data (2009-2014) 2015 2016 20182017
A Policy Gaps
1. No policy on sharing of forest benefits with local communities’ needs to incentivize them to conserve
2. Inadequate implementation of existing policies
B Legal Gaps
1. Slow enactment of pending bills and amendment of existing laws to conform to Goal 15
2. Forest Act doesn’t encourage indigenous afforestation
3. Wildlife Management and Conservation Act has failed to attract adequate private sector participation
4. Inadequate implementation of the existing Laws
C Institutional Gaps
1. Inability to commercialize forest resources
2. Efficiency challenges to stamp out poaching
D Recommendations
1. The existing policies should be fully implemented
2. Develop/review policy on sharing of forest benefits with local communities
3. Promote commercialization of forest resources
4. Increase the technological and enforcement capabilities for wildlife protection
5. Proposed Amendments
1. Forests Act - The majority of the terrestrial life resides in the forests. In order to protect and preserve terrestrial life, the Forests Act should be reviewed to reflect the changes outlined in the Constitution of Kenya 2010 for instance Article 69 sets out the obligations of the state to work to achieve and maintain a tree cover of at least 10% of the land in Kenya. The conservation of forests should be placed under the management of the county government
The goal has a target of protecting, restoring and promoting sustainable use of terrestrial ecosystems. It includes the management of forests through combating acts such as deforestation and desertification.
Key Statistics on Goal 15 are as shown below.

36
Fact Sheet : SDGs Readiness Report, February 2020
2. Wildlife management and Conservation Act - Section 31(1) of the Wildlife and Conservation Management Act should be reviewed to give county legislative assemblies the power to make a declaration of a particular land to be a protected area. Section 32(1) should also be reviewed to give the county assembly power to declare a particular area to be a National Park. The County Assembly should make consultations with the National Land Commission in declaring a protected area a national park.
6. Other Legislations
1. Legislation to reverse use of exotic trees for afforestation. They should be planted alongside indigenous trees and harvested to give way for indigenous trees
2. Review the Forest Act to disaggregate closed canopy forests from open woodlands and grassland
3. Review legislation to promote commercial conservancies and animal protection zones
4. Alignment of Laws towards SDGs implementation
37
Fact Sheet : SDGs Readiness Report, February 2020
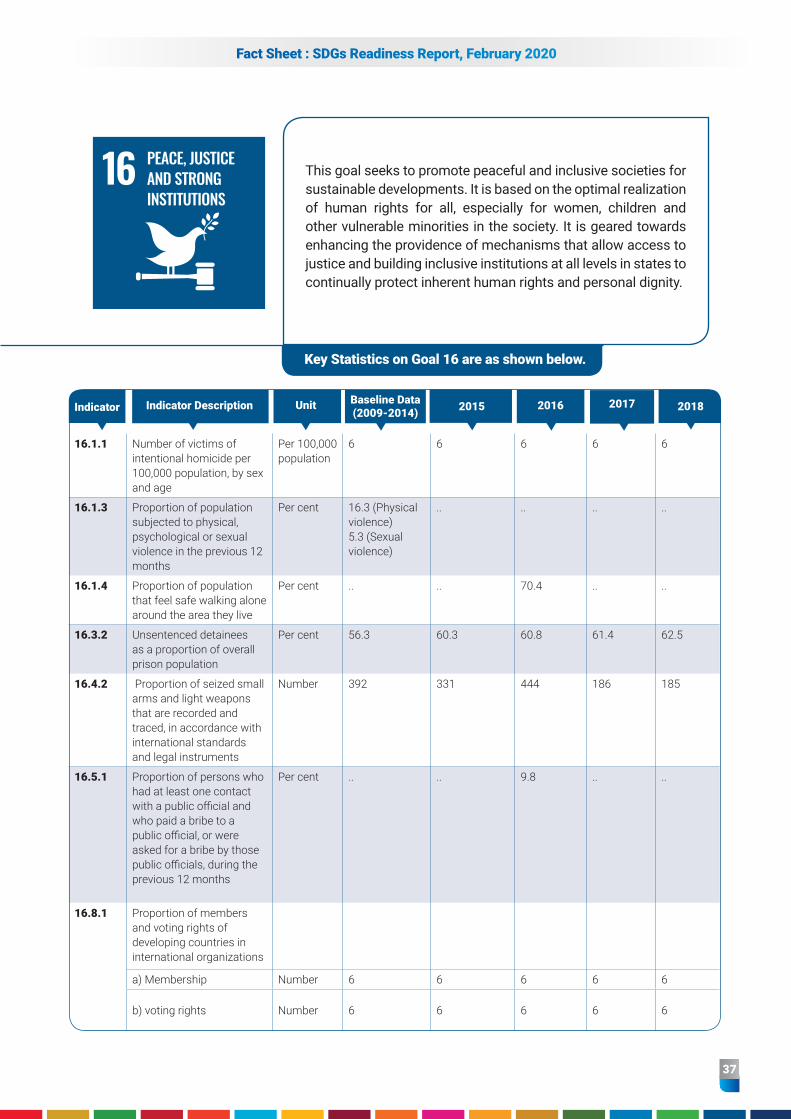
16.1.1 Number of victims of intentional homicide per 100,000 population, by sex and age
Per 100,000 population
6 6 6 6 6
16.1.3 Proportion of population subjected to physical, psychological or sexual violence in the previous 12 months
Per cent 16.3 (Physical violence) 5.3 (Sexual violence)
.. .. .. ..
16.1.4 Proportion of population that feel safe walking alone around the area they live
Per cent .. .. 70.4 .. ..
16.3.2 Unsentenced detainees as a proportion of overall prison population
Per cent 56.3 60.3 60.8 61.4 62.5
16.4.2 Proportion of seized small arms and light weapons that are recorded and traced, in accordance with international standards and legal instruments
Number 392 331 444 186 185
16.5.1 Proportion of persons who had at least one contact with a public official and who paid a bribe to a public official, or were asked for a bribe by those public officials, during the previous 12 months
Per cent .. .. 9.8 .. ..
16.8.1 Proportion of members and voting rights of developing countries in international organizations
a) Membership Number 6 6 6 6 6
b) voting rights Number 6 6 6 6 6
Indicator Indicator Description Unit Baseline Data (2009-2014) 2015 2016 20182017
This goal seeks to promote peaceful and inclusive societies for sustainable developments. It is based on the optimal realization of human rights for all, especially for women, children and other vulnerable minorities in the society. It is geared towards enhancing the providence of mechanisms that allow access to justice and building inclusive institutions at all levels in states to continually protect inherent human rights and personal dignity.
Key Statistics on Goal 16 are as shown below.

38
Fact Sheet : SDGs Readiness Report, February 2020
16.9.1 Proportion of children under 5 years of age whose births have been registered with a civil authority, by age
Per cent 66.9 (Total); 68.0 (< 2 yrs); 66.2 (2-4 yrs)
.. .. .. ..
16.10.2 Number of countries that adopt and implement constitutional, statutory and/or policy guarantees for public access to information
Number 1 1 1 1 1
16.a.1 Existence of independent national human rights institutions in compliance with the Paris Principles
Number Kenya adopted this and formed Kenya National Commission for Human Rights in 2010
7 7 7 7
Indicator Indicator Description Unit Baseline Data (2009-2014) 2015 2016 20182017
A Policy Gaps
1. Inadequate implementation of existing policies
2. Slow automation of Justice, Law and Order systems
3. Lack of cross-sectoral linkages on data relating to SGBV
B Legal Gaps
1. Slow enactment of pending bills and amendment of existing laws to conform to Goal 16
2. The National Police Act gives too much discretion to Officer Commanding Station (OCS) on prosecution of crimes and offences
3. The Police Act also fails to limited too much human intervention/interaction
4. Inadequate implementation of the existing Laws
C Institutional Gaps
1. Poor crime reporting and documentation
2. Low automation of criminal justice system to reduce opportunities for rent seeking and interference
D Recommendations
1. The existing policies and regulations should be fully implemented
2. Stronger enforcement of laws and prosecution of offenders to act as a deterrent
3. Increase digitalization and automation to reduce human interface and possibilities in reporting and documentation of serious crimes
4. Enactment
1. The National Cohesion And Integration (Amendment) Bill, 2019
2. The Public Order (Amendment) Bill, 2019
5. Proposed Amendments
1. Witness Protection Act - Access to justice is one of the principles of Goal 16. In order to foster justice and fairness to the victims of crime, the Witness Protection Act should be amended to make it an offense to threaten, intimidate or obstruct any person who is in the witness protection programme with the intention of obstructing justice. The Witness Protection Act should also be reviewed to enhance reciprocal protection arrangements between Kenya and foreign countries
2. The Police Act should be reviewed to adopt automation (such as the Occurrence Book) to eliminate human intervention

39
Fact Sheet : SDGs Readiness Report, February 2020
17.1.1 Total government revenue as a proportion of GDP, by source
Per cent 19.5 19.0 18.9 18.3 21.2
17.1.2 Proportion of domestic budget funded by domestic taxes
Per cent 56.9 55.5 55.9 52.1 53.5
17.3.1 Foreign direct investments (FDI), official development assistance and South-South Cooperation as a proportion of total domestic budget
Per cent .. 3.0 3.0 5.1 5.4
17.3.2 Volume of remittances (in United States dollars) as a proportion of total GDP
Per cent 2.34 2.45 2.52 2.49 3.09
17.4.1 Debt service as a proportion of exports of goods and services
Per cent 10.3 10.8 7.8 9.9 20.0
17.6.2 Fixed internet broadband subscription per 100 inhabitants, by speed
Internet subscribers per 100 inhabitants
0.03 (256 kbps - < 1Mbps) 0.17 (>=2 Mbps)
0.05 (256 kbps - < 1Mbps) 0.17 (>=2 Mbps)
0.06 (256 kbps - < 1Mbps) 0.27 (>=2 Mbps)
0.04 (256 kbps - < 1Mbps) 0.58 (>=2 Mbps)
0.02 (256 kbps - < 1Mbps) 0.76 (>=2 Mbps)
17.8.1 Proportion of individuals using the Internet
Per cent 6.3 .. 16.6 .. ..
IndicatorIndicator
Description Unit Baseline Data (2009-2014)
2015 2016 20182017
The purpose of this goal is to strengthen the means of implementation and to revitalize the global partnership for sustainable development. It requires a partnership between the government, private entities, and civil societies. The arms are to be governed by principles and values that unite them under the mandate of realizing a shared vision and shared goals. Overly, the goal is centered on mobilizing, redirecting and utilizing the transformative power of unity in realizing the objectives of the sustainable development goals.
Key Statistics on Goal 17 are as shown below.

40
Fact Sheet : SDGs Readiness Report, February 2020
17.11.1 Developing countries’ and least developed countries’ share of global exports
KSh Million 537,236 581,045 578,067 594,128 612,929
17.13.1 Macroeconomic Dashboard
External
Merchandise trade (% of GDP)
Per cent 39.90 34.35 28.62 28.48 26.65
Personal transfers, received (% of GDP)
Per cent 2.34 2.45 2.52 2.49 3.09
Current account balance (% of GDP)
Per cent -10.38 -6.70 -4.89 -6.18 -4.96
Foreign direct investment, net inflows (% of GDP)
Per cent 1.34 0.97 0.98 1.62 1.85
Portfolio investment, net (BoP, current US$)
USD -3,716.86 155.05 349.00 788.87 -624.66
Total reserves in months of imports
5.0 4.8 5.0 5.0 5.3
Debt service on external debt, total (% exports and primary income)
Per cent 15.2 5.9 7.8 10.8 18.0
Total external debt (% of GNI)
Per cent 10.3 7.3 6.2 7.3 9.6
Official exchange rate (LCU per US$, period average annual)
KSh to USD 87.92 98.18 101.50 103.41 101.30
Commodity Prices (Export/import)
73.10 76.00 78.80 75.50 68.00
Financial Sector
Broad money growth (annual %) 16.1 14.1 4 9.6 10.1
Broad money to total reserves ratio
IndicatorIndicator
Description Unit Baseline Data (2009-2014)
2015 2016 20182017

41
Fact Sheet : SDGs Readiness Report, February 2020
Bank nonperforming loans to total gross loans (%)
Bank capital to assets ratio (%)
Fiscal Sector
Tax revenue (% of GDP) Per cent 18.9 18.1 18.2 16.5 18.2
Overall Fiscal Balance (% of GDP):
Per cent
-4.1 -5.2 -5.5 -5.6 -4.9
17.18.2
D2 gross government and public sector debt (% of GDP): Per cent 41 41.4 45.6 48.8 51
Real Sector and Prices
GDP (annual % growth)
Per cent5.4 5.7 5.9 4.9 6.3
Gross capital formation (annual % growth)
Per cent
14.2 6.6 -9.2 6.4 4.6
Household final consumption expenditure, etc. (annual % growth)
Per cent
4.3 5.2 4.8 7.6 5.9
General government final consumption expenditure (annual % growth)
Per cent
1.7 11.5 5.6 5.1 1.0
Exports of goods and services (annual % growth)
Per cent
5.8 6.2 -2.2 -6.8 4
Imports of goods and services (annual % growth)
Per cent
10.4 1.2 -3.4 8.7 2.6
Consumer Price Index Index 149.74 159.6 169.68 183.23 191.82
Commodity Prices (Export/import) 73.1 76 78.8 75.5 68
Unemployment
Unemployment rate
Per cent 9.7 .. 7.4 .. ..
IndicatorIndicator
Description Unit Baseline Data (2009-2014)
2015 2016 20182017
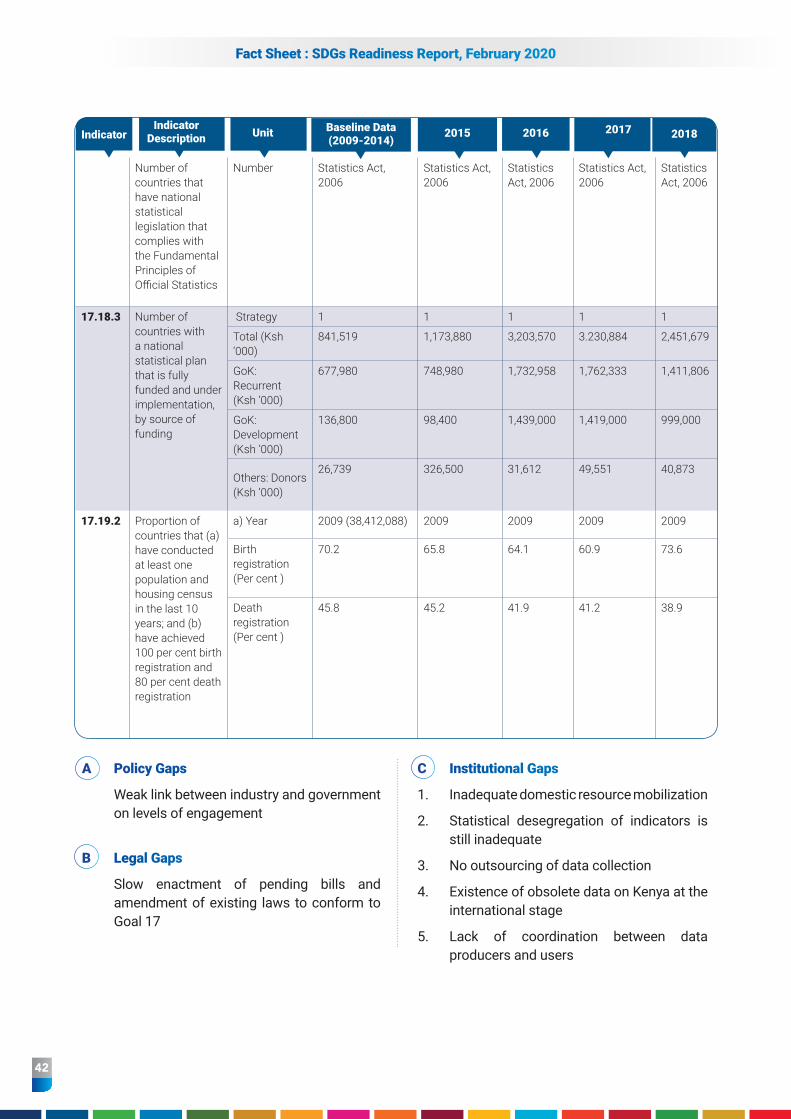
42
Fact Sheet : SDGs Readiness Report, February 2020
Number of countries that have national statistical legislation that complies with the Fundamental Principles of Official Statistics
Number Statistics Act, 2006
Statistics Act, 2006
Statistics Act, 2006
Statistics Act, 2006
Statistics Act, 2006
17.18.3 Number of countries with a national statistical plan that is fully funded and under implementation, by source of funding
Strategy 1 1 1 1 1
Total (Ksh ‘000)
841,519 1,173,880 3,203,570 3.230,884 2,451,679
GoK: Recurrent (Ksh ‘000)
677,980 748,980 1,732,958 1,762,333 1,411,806
GoK: Development (Ksh ‘000)
136,800 98,400 1,439,000 1,419,000 999,000
Others: Donors (Ksh ‘000)
26,739 326,500 31,612 49,551 40,873
17.19.2 Proportion of countries that (a) have conducted at least one population and housing census in the last 10 years; and (b) have achieved 100 per cent birth registration and 80 per cent death registration
a) Year 2009 (38,412,088) 2009 2009 2009 2009
Birth registration (Per cent )
70.2 65.8 64.1 60.9 73.6
Death registration (Per cent )
45.8 45.2 41.9 41.2 38.9
IndicatorIndicator
Description Unit Baseline Data (2009-2014)
2015 2016 20182017
A Policy Gaps
Weak link between industry and government on levels of engagement
B Legal Gaps
Slow enactment of pending bills and amendment of existing laws to conform to Goal 17
C Institutional Gaps
1. Inadequate domestic resource mobilization
2. Statistical desegregation of indicators is still inadequate
3. No outsourcing of data collection
4. Existence of obsolete data on Kenya at the international stage
5. Lack of coordination between data producers and users
43
Fact Sheet : SDGs Readiness Report, February 2020
D Recommendations
1. Implement the existing laws and legislations and seek to further public private partnerships
2. Strengthen the link between industry and government on implementation, monitoring and reporting on the 2030 Agenda
3. Increase domestic resource mobilization to reduce vulnerability to international debt.
4. Enhanced statistical desegregation
5. Creation of SDGS Statistical reporting unit within the Kenya Bureau of Statistics
6. Enactment
The Anti-Corruption and Economic Crimes (Amendment) Bill, 2019
7. Proposed Amendments
1. County Governments Act - should be reviewed in order to make it mandatory for County governments to give annual reports on the implementation of SDGs.
The role of implementing the SDGs should not be confined to the national government alone but it should be a partnership with county governments, NGOs and other non-state agencies including academia.
2. National Government and Constituency Development Act - should be reviewed to reflect the Sustainable Development Goals.
The 2030 Agenda on sustainable development is a comprehensive policy that is crucial for developing countries in setting out the implementation policy framework. The NG-CDF funds should be employed for furthering these goals since most of the functions that were covered by the NG-CDF are now under county governments.
3. Review Public Benefit Organizations (PBO) Act to remove unnecessary restrictions on partnerships for development
4. The government should implement the existing laws and legislations and seek to further public private partnerships
5. Review and alignment of Laws

44
Fact Sheet : SDGs Readiness Report, February 2020
This publication was developed by the Kenya Association of Manufacturers in partnership with the Office of the Deputy President of Kenya, State Department of Planning, Global Compact Network
Kenya, SDGs Kenya Forum and the Parliamentary SDGs and Business Caucus.