se4all status report
TRANSCRIPT

SE4ALL Status Report for Asia-Pacific
Marianne Joy VitalAccess to Energy Expert (Consultant)
Asian Development Bank
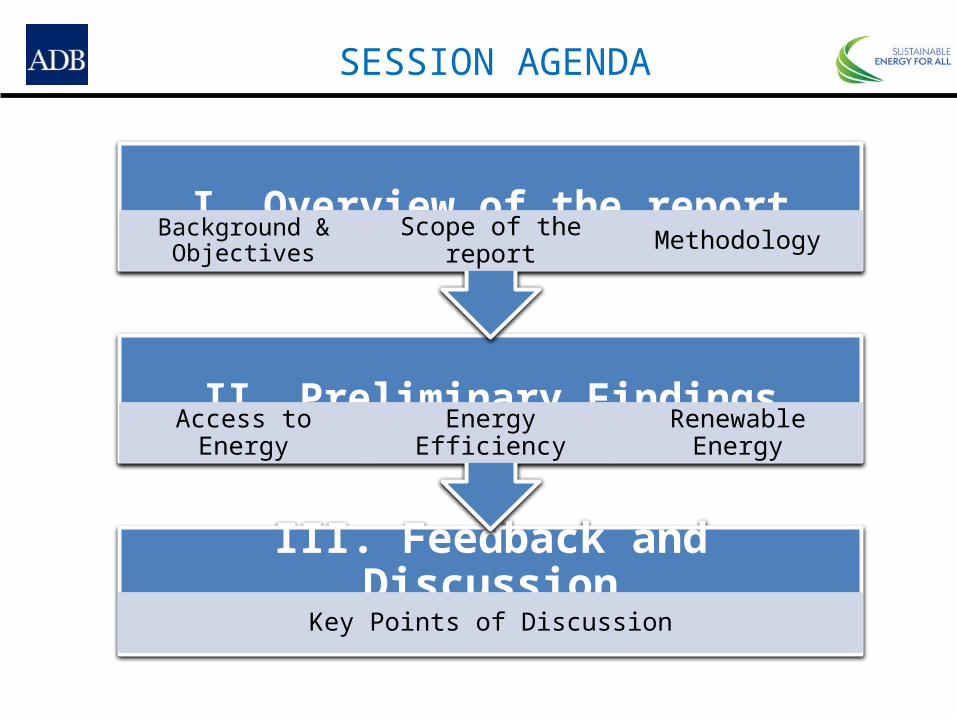
SESSION AGENDA
III. Feedback and DiscussionKey Points of Discussion
II. Preliminary FindingsAccess to Energy Energy Efficiency Renewable Energy
I. Overview of the reportBackground &
Objectives Scope of the report Methodology

I. OVERVIEW OF REPORT

Objectives by 2030:
SE4ALL Goals
Ensuring universal access to modern energy services
Doubling the global rate of improvement in energy efficiency
Doubling the share of renewable energy in the global energy mix

Monitor Asia-Pacific’s performance in reaching the SE4ALL goals• Regional performance and country-level
accomplishments• Innovative practices, projects, and synergistic
initiatives
OUTPUT: status report every two years, each report centering on a particular theme.
Background

Decade of Sustainable Energy for All: 2014–2024• Raising awareness about the benefits of modern
energy to women, children, and health as focus of 2014 and 2015
Partners:
Background
First Asia Pacific Status Report: energy-women-children-health nexus

Objectives of Report
• Raise awareness on the SE4ALL goals1• Monitor and assess achievements based on the
SE4ALL targets2• Present case studies on energy-women-children-
health nexus3• Provide analysis and recommendations to improve
the enabling environments4• Document issues, challenges, and opportunities,
and provide for the next steps5
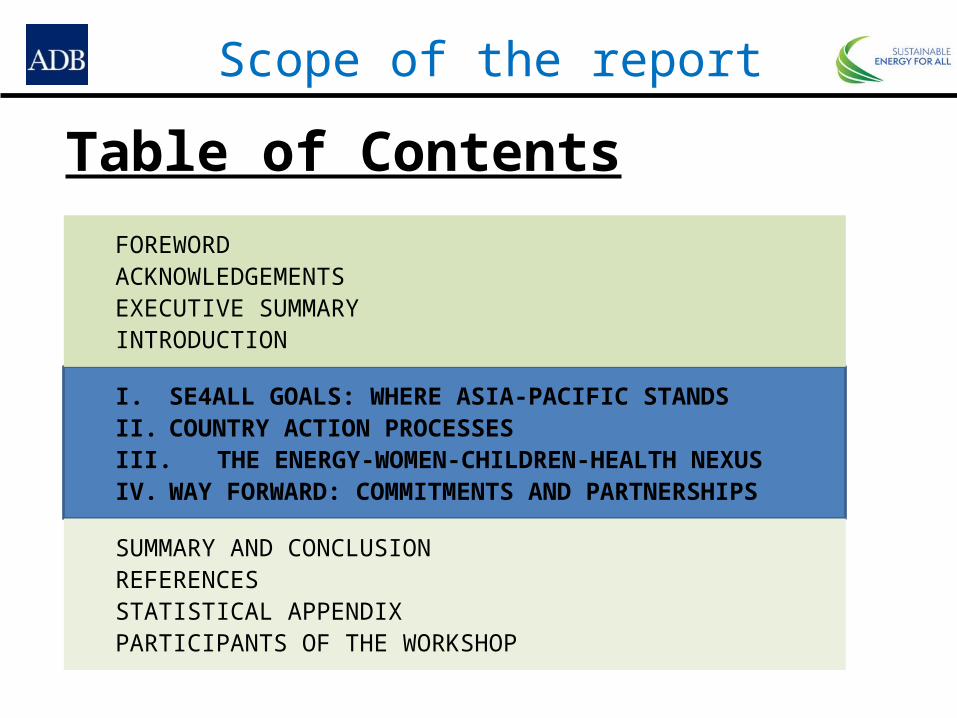
Scope of the report
I. SE4ALL GOALS: WHERE ASIA-PACIFIC STANDSII. COUNTRY ACTION PROCESSESIII. THE ENERGY-WOMEN-CHILDREN-HEALTH NEXUSIV. WAY FORWARD: COMMITMENTS AND PARTNERSHIPS
FOREWORDACKNOWLEDGEMENTSEXECUTIVE SUMMARYINTRODUCTION
SUMMARY AND CONCLUSIONREFERENCESSTATISTICAL APPENDIXPARTICIPANTS OF THE WORKSHOP
Table of Contents

I. SE4ALL GOALS: WHERE ASIA-PACIFIC STANDS• Snapshot of the status of Asia-Pacific given targets
and its most recent performance• Country-level discussions that provide the context
of the performance as well as issues faced and best practices adopted
Scope of the report

II. COUNTRY ACTION PROCESSES• Country experiences in the SE4ALL Country Action
Processes
Scope of the report

III. THE ENERGY-WOMEN-CHILDREN-HEALTH NEXUS• Two-fold discussion:
o Disproportionate impact of energy on women and youth, particularly on their health
o Opportunities for empowerment of women and children: what role they can play to improve the energy landscape?
• Case studies: possible models for scale-up and replication in the region
Scope of the report

IV. WAY FORWARD: COMMITMENTS AND PARTNERSHIPS
Scope of the report
SE4ALL Country Action
Processes
Map out various efforts
Identify gaps and
challenges
Prioritize action areas

• Method of analysis• Trend analysis: from baseline period (1990-2010) to recent
data (2012)• Compare performance with specific targets given SE4ALL goals
Methodology
• Data source• Primary:
o Global Tracking Framework o World Bank World Development Indicatorso World Health Organizationo UNESCAP Statistical Yearbooks
• Other data sources:o IEA’s World Energy Outlooko SE4ALL country RA/GAo Journals, articles, and other reference books related to SE4ALL goals
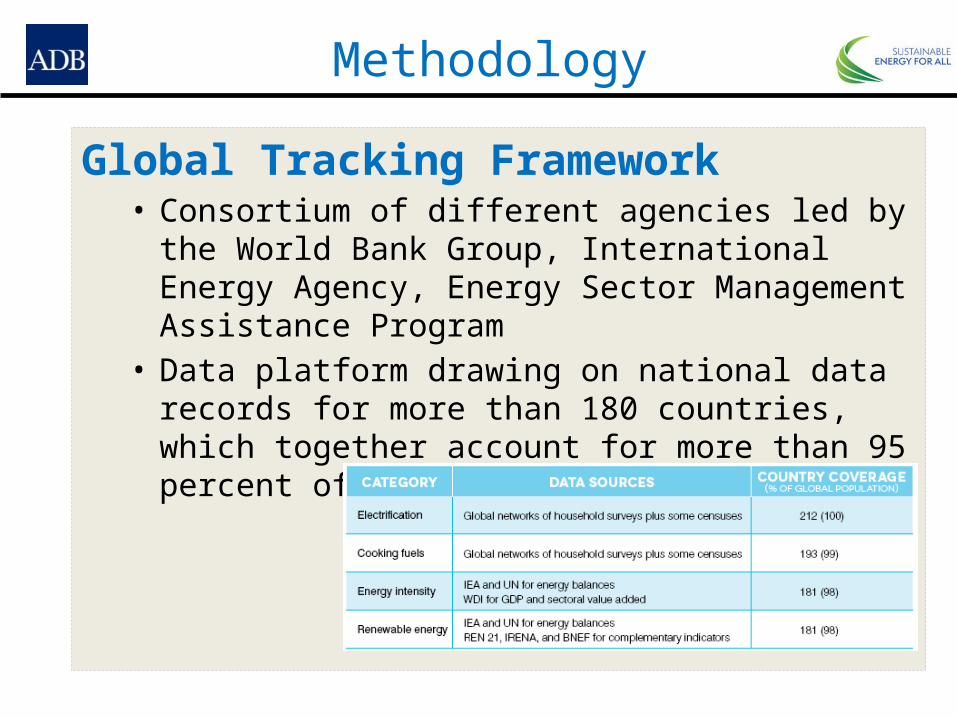
Global Tracking Framework• Consortium of different agencies led by the World Bank
Group, International Energy Agency, Energy Sector Management Assistance Program
• Data platform drawing on national data records for more than 180 countries, which together account for more than 95 percent of the global population
Methodology

• Other sources of information• SE4ALL Consultation Workshop (Manila, 14 June 2015)
o Solicit feedback from stakeholders as well as experts o Discussion on case studies of projects or initiatives on
women, children, and health for scale-up and replication across the region
• Contribution of partners• Circulation of draft for comments
Methodology

Key Milestones and Estimated Completion Date
Timelines
14 June 2015
• Consultation Workshop
3rd week July 2015
• Circulation of final draft for consultation
28–30 September 2015
• Launching of report

WHERE DOES ASIA-PACIFIC STAND?
II. PRELIMINARY FINDINGS

SE4ALL - Objective 1
Ensuring universal access to modern energy services

4.2 Billion Population in Asia
1.8 BillionPeople without access to
clean cooking
620 Million People without access to electricity
ENERGY SITUATION IN ASIA-PACIFIC

Measuring energy access
I. Energy Access
1. Access to electricity
• Availability of electricity connection OR use of electricity as primary source for lighting
• Computed as percentage (%) of population
2. Access to non-solid fuels
• Signifies access to modern cooking solutions
• Computed as percentage (%) of population that use non-traditional sources of energy

Source: World Bank. 2015. Global Tracking Framework 2015: Progress Toward Sustainable Energy. Summary Report.
Some have already hit the 100% mark.
* National average
Economies that have reached 100% electrification, 2012* CWA Armenia EA China, People's Rep. ofCWA Azerbaijan EA Hong Kong, ChinaCWA Georgia EA Japan CWA Kazakhstan EA Korea, Rep. of CWA Kyrgyz Republic Pac SamoaCWA Tajikistan SA MaldivesCWA Turkmenistan SEA Malaysia CWA Uzbekistan SEA Singapore SEA Thailand
I. Energy Access
A good number of countries are performing above target.

Source: World Bank. 2015. Global Tracking Framework 2015: Progress Toward Sustainable Energy. Summary Report.
More push to meet the target and grow faster in the coming years.
I. Energy Access
Improvements in high-impact countries are critical.
Electrification rate must be higher than population growth rate.
* Absolute number of people added to the count of people that gained access to electricity. Doesn’t take into account the population growth effect.

Adding up the numbers, a substantial number of people in the region have no access to electricity.
Source: International Energy Agency. Energy Access Database. World Economic Outlook. Accessed 13 May 2015. http://www.worldenergyoutlook.org/resources/energydevelopment/energyaccessdatabase/
I. Energy Access

Source: World Bank. 2015. Global Tracking Framework 2015: Progress Toward Sustainable Energy. Summary Report.
Solid fuels remain primary use of fuel for cooking. Only five countries are fully using non-solid fuel for cooking.
* National average
Table 2. Countries that have 100% * access to non-solid fuel
CWA Turkmenistan SEA Malaysia
EA Japan SEA Singapore
EA Korea, Rep. of
I. Energy Access
For those dependent on solid fuels, uptake of non-solid fuel is slow.

Source: World Health Organization. Global Health Observatory Data Repository. Accessed 13 May 2015. http://apps.who.int/gho/data/node.imr
Asia-Pacific
accounts for 85% of the deaths attributed to
household air pollution.
I. Energy Access
Why modernize fuel use for cooking and heating in households?

Findings
I. Energy Access
Significant improvements but more can be done
• 16/43 of the countries are on target in expanding access to electricity
• 5/43 are on track in adopting non-solid fuels
Asia-Pacific’s contribution to global energy poverty is significant• Almost 50% of global energy poverty come from Asia• 85% of the deaths attributed to household air pollution.

SE4ALL – Objective 2
Doubling the global rate of improvement in energy efficiency

Measuring energy efficiency
II. Energy Efficiency
1. Primary energy intensity – (energy supply) / (GDP,
PPP)
• Captures supply-side efficiency, and also overall energy system efficiency
• Important for developing countries as it captures traditional sources of energy such as biomass
2. Final energy intensity – (final energy
consumption) / (GDP, PPP or value-added, by sector)
• Captures end-use efficiency
• Better to use with disaggregated value added data by sector

From 2010, majority of countries in East Asia and South Asia were able to decrease their energy intensity levels.
Source: World Bank. 2015. Global Tracking Framework 2015: Progress Toward Sustainable Energy. Summary Report.
II. Energy Efficiency

Central & West Asia, Southeast Asia, and Pacific are showing mixed results from 2010.
Source: World Bank. 2015. Global Tracking Framework 2015: Progress Toward Sustainable Energy. Summary Report.
II. Energy Efficiency
*2000-2010 instead of 1990-2010

II. Energy Efficiency
Mixed results: on the whole, Asia-Pacific* is mostly improving energy intensity levels.• More than 60% of the countries have decreased primary energy intensity
level from 2010
With incomplete data, the source of change in energy intensity is not clear. Some factors could have played a role:• Slowdown or decline in GDP growth during the financial/ economic crisis in
the late 2000s• Structural shifts in economy such as decreasing or increasing share of
energy-intensive industries
Findings
*Where data is available

SE4ALL - Objective 3
Doubling the share of renewable energy in the global energy mix

Measuring Renewable Energy share
III. Renewable Energy
1. Renewable energy (RE) consumption
• Includes renewable energy consumption of all technologies: hydro, modern and traditional biomass, wind, solar, liquid biofuels, biogas, geothermal, marine and waste
2. Total final energy consumption (TFEC)
• The sum of consumption by the different end-use sectors.
3. RE share in TFEC
• RE consumption/TFEC (%)

Declining share of RE in total final energy consumption in Asia-Pacific.
Source: author’s estimates based on Global Tracking Framework 2015: Progress Toward Sustainable Energy. Summary Report.
III. Renewable Energy
Majority of RE consumption comes from South Asia and East Asia, primarily due to India and PRC, respectively.

Source: author’s estimates based on Global Tracking Framework 2015: Progress Toward Sustainable Energy. Summary Report.
Traditional biofuel accounts for the largest share in Asia-Pacific’s RE consumption.
III. Renewable Energy
Indeed, countries dependent on RE mainly use traditional biomass (except for Tajikistan). Next popular are solar and hydro.

While on track, these countries have very low RE share, i.e., less than 10%.
Source: author’s estimates based on Global Tracking Framework 2015: Progress Toward Sustainable Energy. Summary Report.
III. Renewable Energy

III. Renewable Energy
Overall decline of RE share in Asia-Pacific from 1990 to 2012.• RE cannot keep up with the energy appetite of emerging
economies
Traditional biomass is predominant RE source
Limited number of countries are on track
Findings

Conclusion
• Asia-Pacific’s contribution to global energy poverty is significant
• Almost 40% of countries in Asia-Pacific are on track in expanding electricity access
Energy Access
• Mixed results but Asia-Pacific is mostly improving energy intensity levels.
• More than 60% of the countries have decreased primary energy intensity level from 2010
Energy Efficiency
• Overall decline of RE share in Asia-Pacific from 1990 to 2012.
• Traditional biomass is predominant RE source.• Limited number of countries are on track.
Renewable Energy

III. FEEDBACK & DISCUSSION

Key Points of Discussion
I. Scope of the report
II. MethodologyoData oMethod of analysis
III. Preliminary findings

MORE INFORMATION
About the SE4ALL Asia-Pacific Hub
The Asia-Pacific hub is part of the global network to facilitate and coordinate the implementation of the SE4ALL Initiative at the regional level.
It is led by the Asian Development Bank (ADB), the United Nations Development Programme (UNDP), and the United Nations Economic and Social Commission for Asia and the Pacific (UN ESCAP).
SE4ALL Website and Social Mediawww.se4all.org
FB: Sustainable Energy for AllTwitter: @SE4ALL_AsiaPac
FOCAL PERSONS
Jiwan Acharya (ADB)Senior Climate Change Specialist (Clean Energy)[email protected]
Manoj Kumar Khadka (UNDP)Technical Consultant for Energy Access [email protected]
Hongpeng Liu (UN ESCAP)Chief, Energy Security and Water Resources SectionEnvironment and Development [email protected]

Appendix A: List of Countries and Regional Classification in Asia-Pacific
CENTRAL AND WEST ASIA• Afghanistan • Armenia • Azerbaijan • Georgia • Kazakhstan • the Kyrgyz Republic • Pakistan • Tajikistan • Turkmenistan • Uzbekistan EAST ASIA• the People’s Republic of China• Hong Kong, China • Japan • the Republic of Korea • Mongolia
SOUTH ASIA• Bangladesh • Bhutan • India • the Maldives • Nepal • Sri Lanka
PACIFIC• Cook Islands• Fiji • Kiribati • the Marshall Islands • the Federated States of Micronesia • Nauru • Papua New Guinea • Samoa• Solomon Islands • Timor-Leste• Tonga • Palau • Vanuatu
SOUTHEAST ASIA• Brunei Darussalam• Cambodia • Indonesia • the Lao People’s Democratic Republic• Malaysia • Myanmar • the Philippines • Singapore • Thailand • Viet Nam