sea das image research
TRANSCRIPT
8/3/2019 Sea Das Image Research
http://slidepdf.com/reader/full/sea-das-image-research 1/17
Image display procedures using SeaDAS
Northwest Pacific Region Environmental Cooperation Center
version 0.9

8/3/2019 Sea Das Image Research
http://slidepdf.com/reader/full/sea-das-image-research 2/17
i
Contents
1 . Ima ge Display by SeaDAS ..................... ..................... ..................... ..................... ....... 1
1 . 1 Starting the SeaDAS software..........................................................................2
1 . 2 Star tin g th e "sead isp" genera l displa y progra m .............................................. 2
1 . 3 Selection of ima ge da ta (for disp laying ra st er da ta )........................................ 3
1 . 4 Display of the image dat a .................................................................................8
2 . Displa y of color ima ges by Sea DAS.............................................................................9
2 . 1 Display of an ima ge da ta ...................................................................................9
2 . 2 Set t ing of th e color t ab le .................................................................................10
2 . 3 Edit ing the color tab le ..................................................................................... 11
2 . 4 Coun t va lues dis pla y ....................................................................................... 13
2 . 5 Longitu des an d lat itu des displa y ...................................................................14
2 . 6 Addin g coas t lines............................................................................................ 15
8/3/2019 Sea Das Image Research
http://slidepdf.com/reader/full/sea-das-image-research 3/17
1
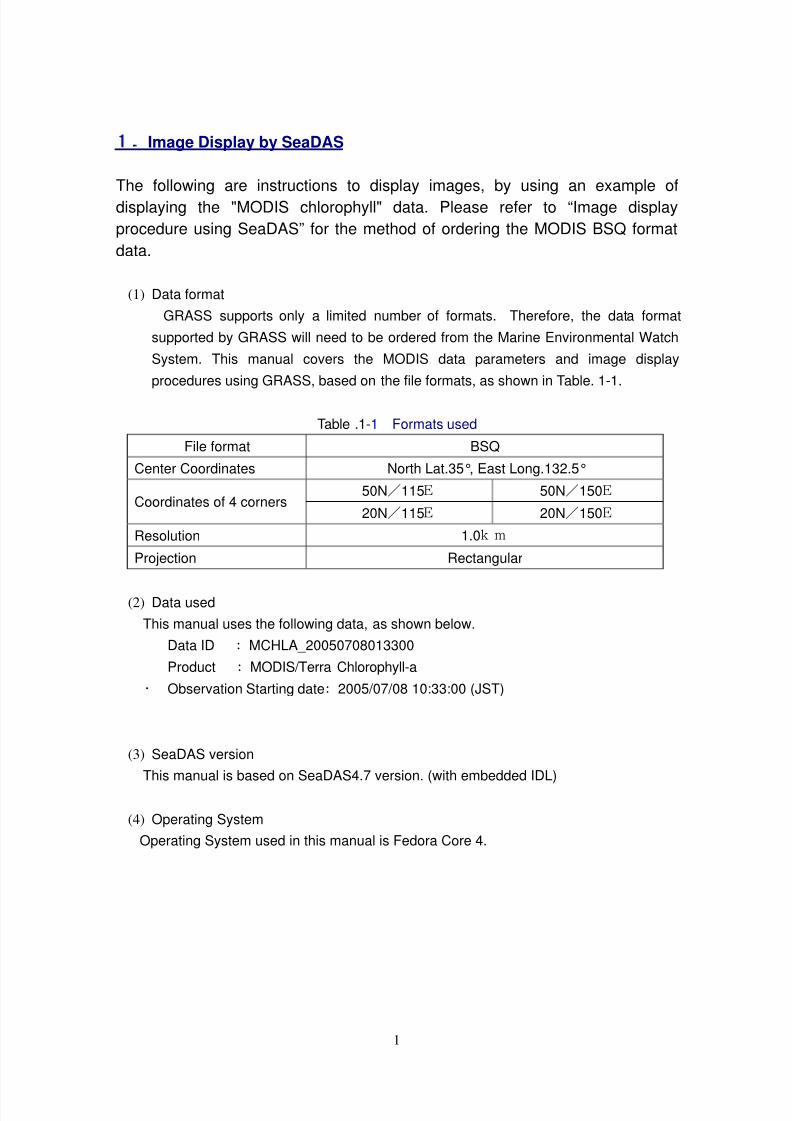
1.Image Display by SeaDAS
The following are instructions to display images, by using an example of
displaying the "MODIS chlorophyll" data. Please refer to “Image display
procedure using SeaDAS” for the method of ordering the MODIS BSQ format
data.
(1) Data format
GRASS supports only a limited number of formats. Therefore, the data format
supported by GRASS will need to be ordered from the Marine Environmental Watch
System. This manual covers the MODIS data parameters and image display
procedures using GRASS, based on the file formats, as shown in Table. 1-1.
Table .1-1 Formats used
File format BSQ
Center Coordinates North Lat.35°, East Long.132.5°
50N/115E 50N/150E Coordinates of 4 corners
20N/115E 20N/150E
Resolution 1.0k m
Projection Rectangular
(2) Data used
This manual uses the following data, as shown below.
Data ID : MCHLA_20050708013300
Product : MODIS/Terra Chlorophyll-a
・ Observation Starting date: 2005/07/08 10:33:00 (JST)
(3) SeaDAS version
This manual is based on SeaDAS4.7 version. (with embedded IDL)
(4) Operating System
Operating System used in this manual is Fedora Core 4.
8/3/2019 Sea Das Image Research
http://slidepdf.com/reader/full/sea-das-image-research 4/17
2
1.1 Starting the SeaDAS software
First, enter the following command, as shown below, on the command line
% seadas -em
The "SeaDAS Main Menu" will appear on the screen.
(Refer to Fig1.1-1 Starting SeaDAS)
Fig.1.1-1 Starting SeaDAS
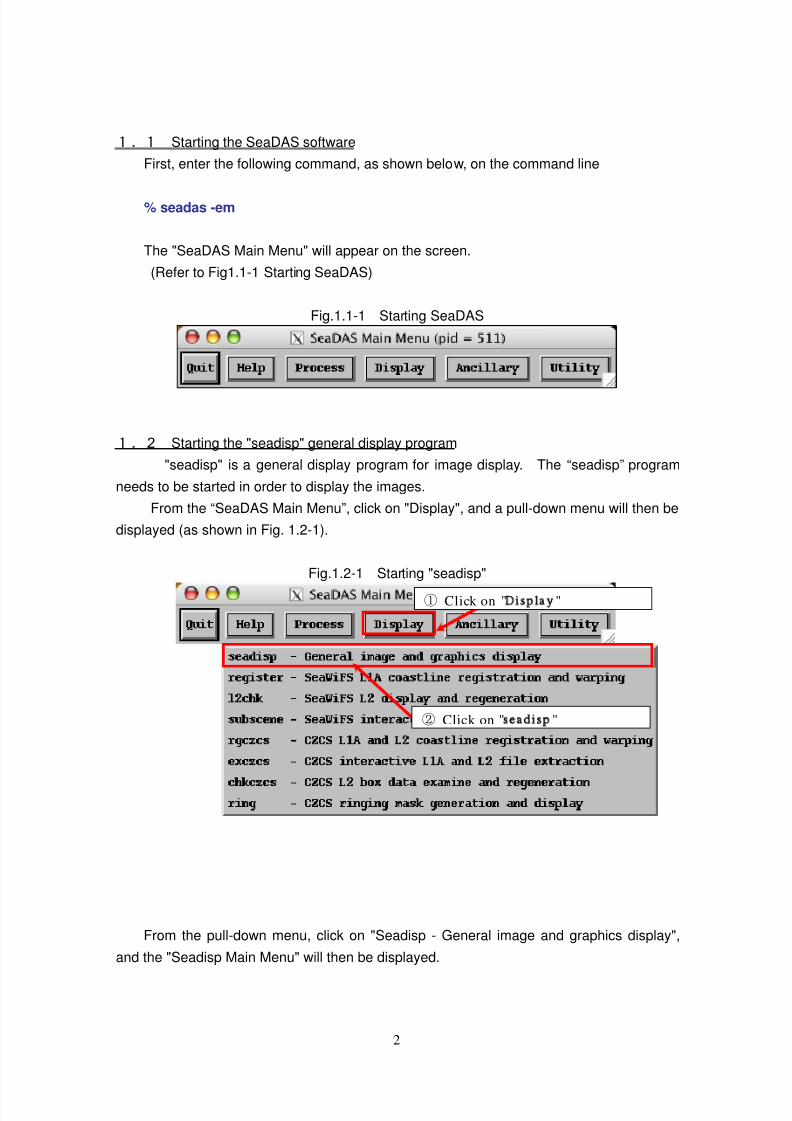
1.2 Starting the "seadisp" general display program
"seadisp" is a general display program for image display. The “seadisp” program
needs to be started in order to display the images.
From the “SeaDAS Main Menu”, click on "Display", and a pull-down menu will then be
displayed (as shown in Fig. 1.2-1).
Fig.1.2-1 Starting "seadisp"
From the pull-down menu, click on "Seadisp - General image and graphics display",
and the "Seadisp Main Menu" will then be displayed.
① Click on "Display"
② Click on "seadisp"

8/3/2019 Sea Das Image Research
http://slidepdf.com/reader/full/sea-das-image-research 5/17
3
Fig 1.2-2 Seadisp Main menu
1.3 Selection of image data (for displaying raster data)
First, select the satellite data to be displayed. Select the type of data file from the
product list.
From the “Seadisp Main Menu”, click on "Load," and a pull-down menu will then be
displayed.
Select and click on "Flat File."
Fig.1.3-1 File type selection
The "Selection For Flat Data File" screen will then be displayed.
Click on "Select" to open the file you wish to access.
Click on "Load."
Click on "Flat F ile"

8/3/2019 Sea Das Image Research
http://slidepdf.com/reader/full/sea-das-image-research 6/17
4
Fig. 1.3-2 Flat File Entry screen
The "Please Select Flat Data File for Reading" screen will be displayed.
Data to be selected and accessed is done here.
First, select the appropriate directory from the "Subdirectories" window. A list of files
included in the directory will then be displayed. From the “Files” window, the list of files
Click on "Select"
8/3/2019 Sea Das Image Research
http://slidepdf.com/reader/full/sea-das-image-research 7/17
5
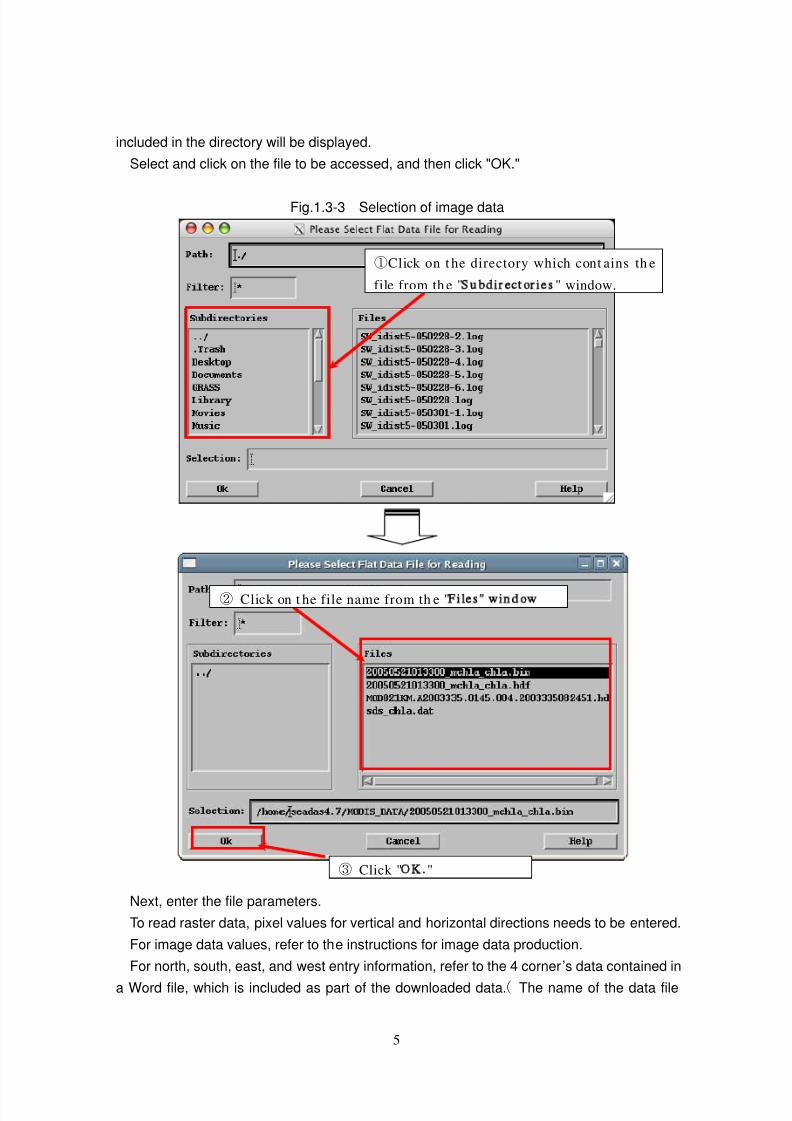
included in the directory will be displayed.
Select and click on the file to be accessed, and then click "OK."
Fig.1.3-3 Selection of image data
Next, enter the file parameters.
To read raster data, pixel values for vertical and horizontal directions needs to be entered.
For image data values, refer to the instructions for image data production.
For north, south, east, and west entry information, refer to the 4 corner’s data contained in
a Word file, which is included as part of the downloaded data.( The name of the data file
①Click on t he directory which cont ains th e
file from th e "Subdirectories" window.
② Click on t he file name from th e "Files" window
③ Click "OK."

8/3/2019 Sea Das Image Research
http://slidepdf.com/reader/full/sea-das-image-research 8/17
6
(Word format) is "20050708013300_mchla_chla.doc")
Fig.1.3-4 Entry of parameter values
Next, "Band List Selection" will be displayed on the screen.
Confirm that the file name you have selected is listed in the "Loaded Bands" windows.
If the file name is correct, then click on "Display."
① Enter the vertical and horizontal
directions values.
② Designate the data type
( 8bit/16bit, etc.)
③ Ent er the latitu de and longitude values.
④ After ent ering t he values, click "Load ."

8/3/2019 Sea Das Image Research
http://slidepdf.com/reader/full/sea-das-image-research 9/17
7
Fig.1.3-5 Selection of Band
① Confirm that the file name you have
selected is displayed h ere.
② If correct, click on "Display."

8/3/2019 Sea Das Image Research
http://slidepdf.com/reader/full/sea-das-image-research 10/17
8
1.4 Display of the image data
The band selected is displayed. Next, the image data needs to be visualized
(display the image data on the screen).
MODIS data displayed in gray-scale, as shown in Fig. 1.4-1
Fig.1.4-1 Display of image data

8/3/2019 Sea Das Image Research
http://slidepdf.com/reader/full/sea-das-image-research 11/17
9
2.Display of color images by SeaDAS
When satellite data is initially opened, the images are displayed in a gray-scale
(black and white tone). The image colors can be adjusted by using the
SeaDAS functions. The following procedures are explained here using as an
example, the MODIS chlorophyll data.
2.1 Display of an image data
Fig.2.1-1 Display of an image data
① Click on "Functions."
②Click on "Color LUT." From the
pull-down menu t hat appears on th e
righ t s ide, click on "Load Color".
8/3/2019 Sea Das Image Research
http://slidepdf.com/reader/full/sea-das-image-research 12/17
10
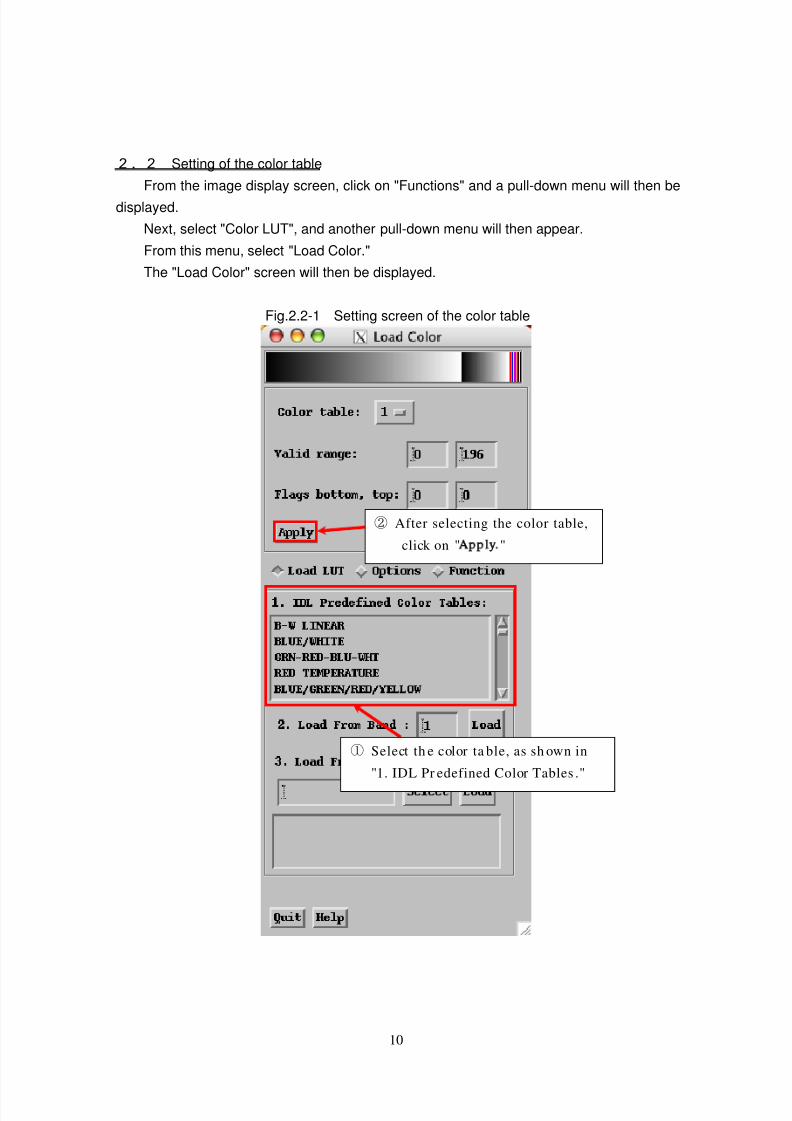
2.2 Setting of the color table
From the image display screen, click on "Functions" and a pull-down menu will then be
displayed.
Next, select "Color LUT", and another pull-down menu will then appear.
From this menu, select "Load Color."
The "Load Color" screen will then be displayed.
Fig.2.2-1 Setting screen of the color table
① Select th e color ta ble, as sh own in
"1. IDL Pr edefined Color Tables ."
② After selecting the color table,
click on "Apply."

8/3/2019 Sea Das Image Research
http://slidepdf.com/reader/full/sea-das-image-research 13/17
11
2.3 Editing the color table
You can manually edit the selected color pallet.
Fig.2.3-1 Color Table Editing screen
① Click on "Option ."
③After changing th e para meters,
click on "Apply."
② Adjust t he slider to cha nge
the parameters.

8/3/2019 Sea Das Image Research
http://slidepdf.com/reader/full/sea-das-image-research 14/17
12
Example of color image

8/3/2019 Sea Das Image Research
http://slidepdf.com/reader/full/sea-das-image-research 15/17
13
2.4 Count values display
To display the count values of a pixel that corresponds to the longitude and latitude for
the data shown, from the image display screen, click on "Functions".
From the pull-down menu, select "Cursor Position."
Fig.2.4-1 Count values display
Move the cursor to the desired location. The count values of the pixel will then be
displayed at the "Cursor Position."
Longitude and latitude values are also displayed - "Lat/Lon."
8/3/2019 Sea Das Image Research
http://slidepdf.com/reader/full/sea-das-image-research 16/17
14
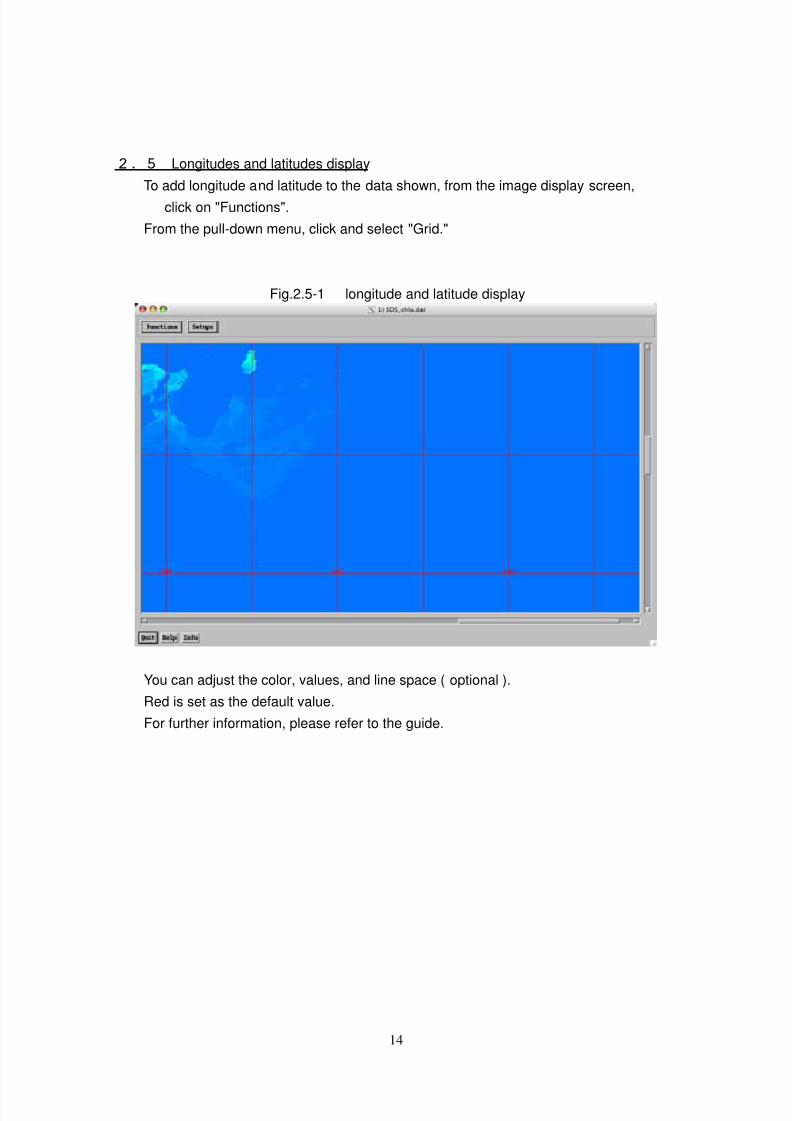
2.5 Longitudes and latitudes display
To add longitude and latitude to the data shown, from the image display screen,
click on "Functions".
From the pull-down menu, click and select "Grid."
Fig.2.5-1 longitude and latitude display
You can adjust the color, values, and line space ( optional ).
Red is set as the default value.
For further information, please refer to the guide.
8/3/2019 Sea Das Image Research
http://slidepdf.com/reader/full/sea-das-image-research 17/17
15
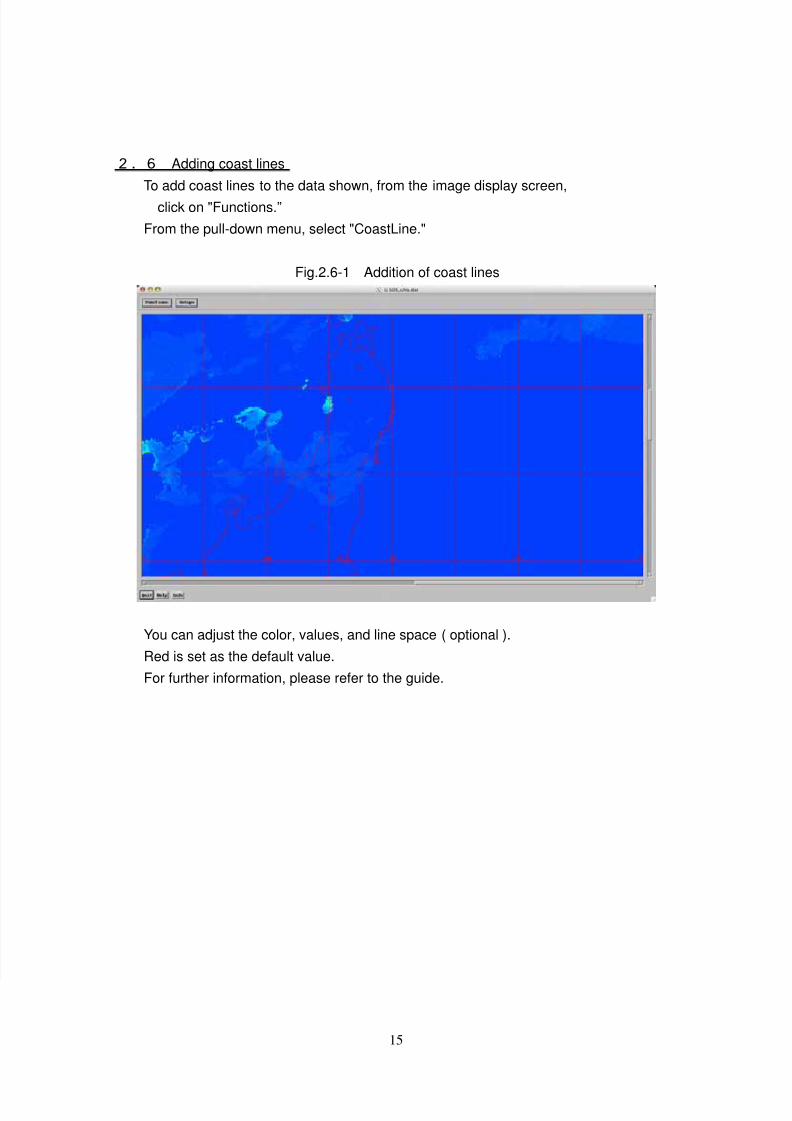
2.6 Adding coast lines
To add coast lines to the data shown, from the image display screen,
click on "Functions.”
From the pull-down menu, select "CoastLine."
Fig.2.6-1 Addition of coast lines
You can adjust the color, values, and line space ( optional ).
Red is set as the default value.
For further information, please refer to the guide.