sea level rise and storm surge tools and datasets supporting municipal resiliency - gsmsummit...
TRANSCRIPT
Peter A. Slovinsky, Marine Geologist
Maine Geological Survey
Bureau of Resource Information and Land Use Planning
Department of Agriculture, Conservation and Forestry
Sea level rise and storm surge tools and datasets supporting Municipal Resiliency
GrowSmart Maine Summit October 21, 2014
I’ll cover….
Setting the stage: very quickly summarize the latest sea level rise predictions and historical storm surge data in Maine
Federal and NGO Mapping Tools
Statewide datasets supporting municipal resiliency Potential Hurricane Inundation Mapping
Highest Annual Tide Mapping
A few transferable local efforts on municipal resiliency
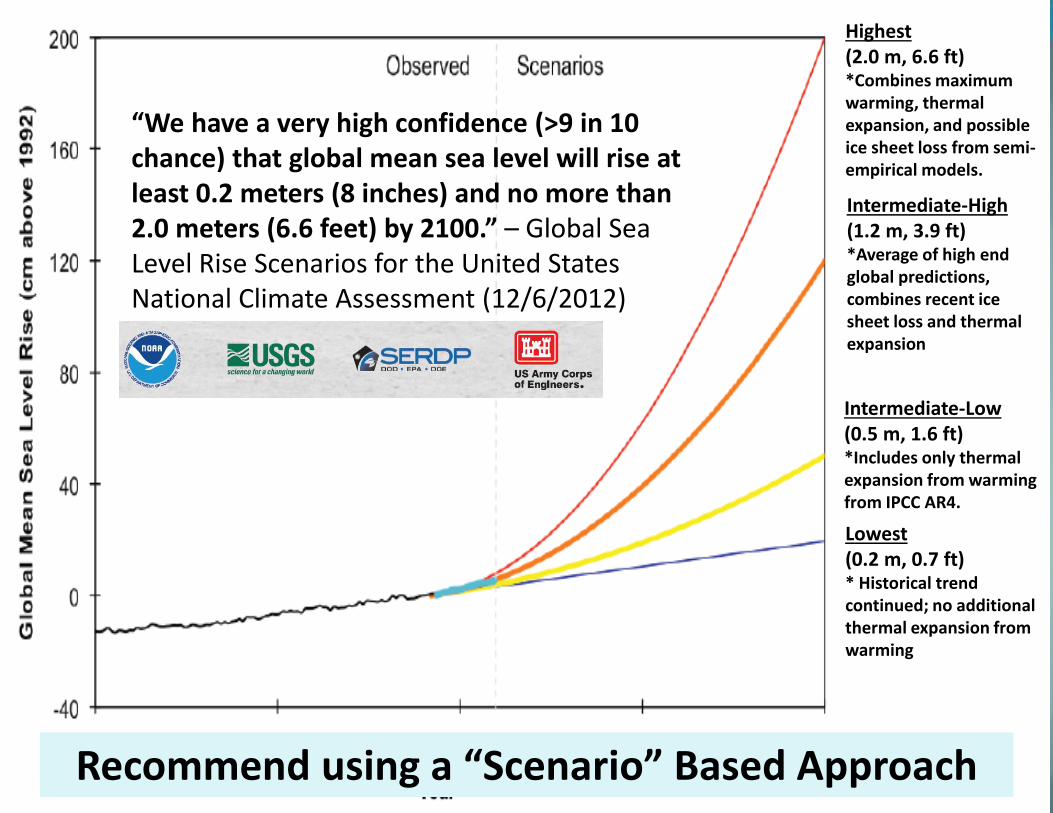
Highest (2.0 m, 6.6 ft) *Combines maximum warming, thermal expansion, and possible ice sheet loss from semi-empirical models.
Intermediate-High (1.2 m, 3.9 ft) *Average of high end global predictions, combines recent ice sheet loss and thermal expansion
Intermediate-Low (0.5 m, 1.6 ft) *Includes only thermal expansion from warming from IPCC AR4.
Lowest (0.2 m, 0.7 ft) * Historical trend continued; no additional thermal expansion from warming
“We have a very high confidence (>9 in 10 chance) that global mean sea level will rise at least 0.2 meters (8 inches) and no more than 2.0 meters (6.6 feet) by 2100.” – Global Sea Level Rise Scenarios for the United States National Climate Assessment (12/6/2012)
GSLRS USNCA, 12/6/2012 Recommend using a “Scenario” Based Approach
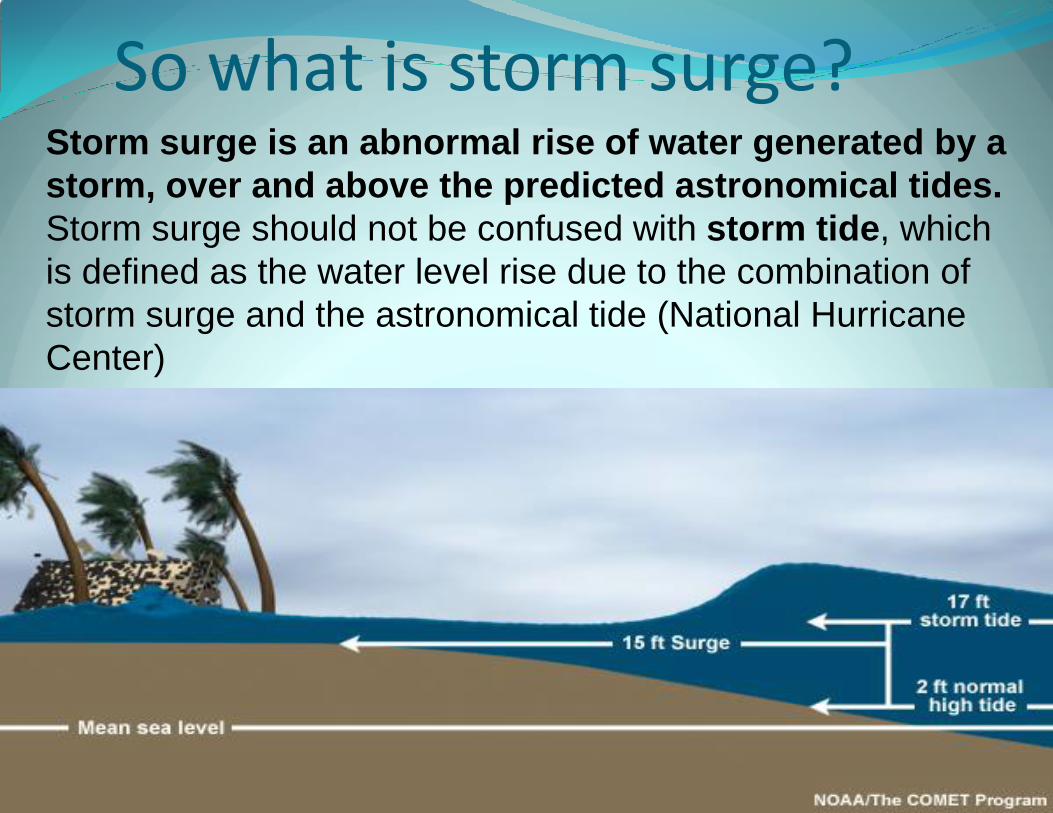
So what is storm surge? Storm surge is an abnormal rise of water generated by a
storm, over and above the predicted astronomical tides.
Storm surge should not be confused with storm tide, which
is defined as the water level rise due to the combination of
storm surge and the astronomical tide (National Hurricane
Center)
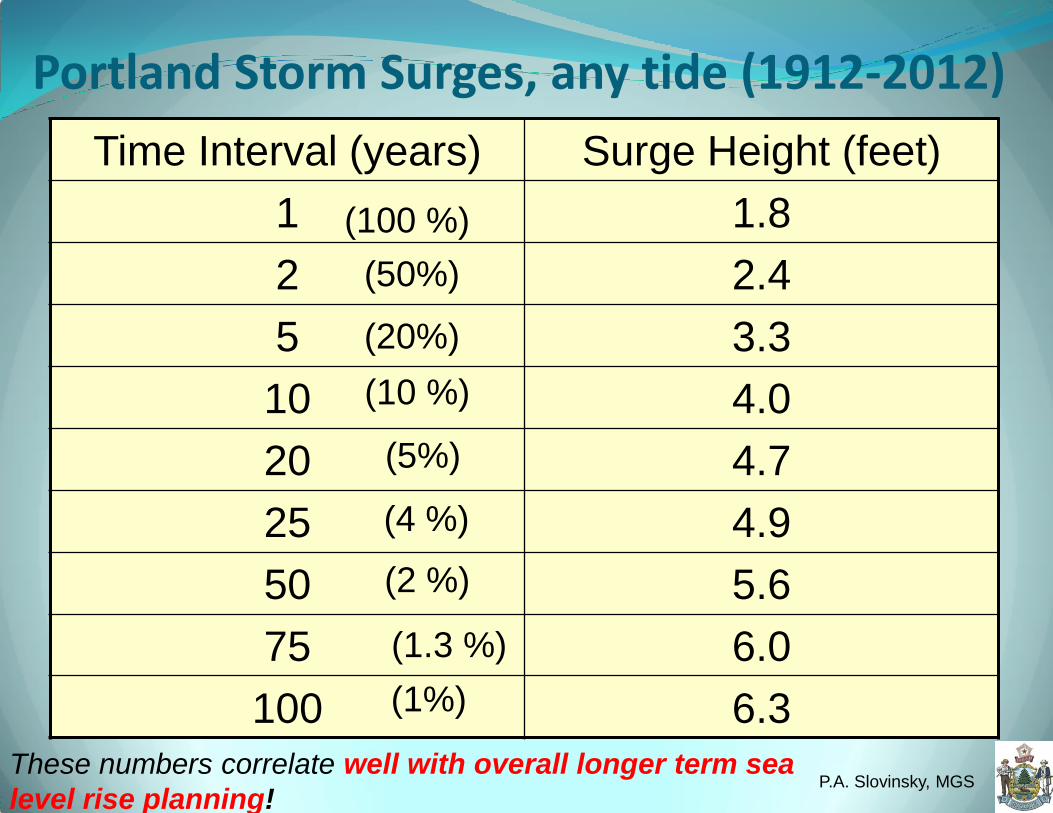
Portland Storm Surges, any tide (1912-2012)
Time Interval (years) Surge Height (feet)
1 1.8
2 2.4
5 3.3
10 4.0
20 4.7
25 4.9
50 5.6
75 6.0
100 6.3
P.A. Slovinsky, MGS
(1%)
(10 %)
(100 %)
(2 %)
(4 %)
(50%)
(5%)
(20%)
(1.3 %)
These numbers correlate well with overall longer term sea
level rise planning!
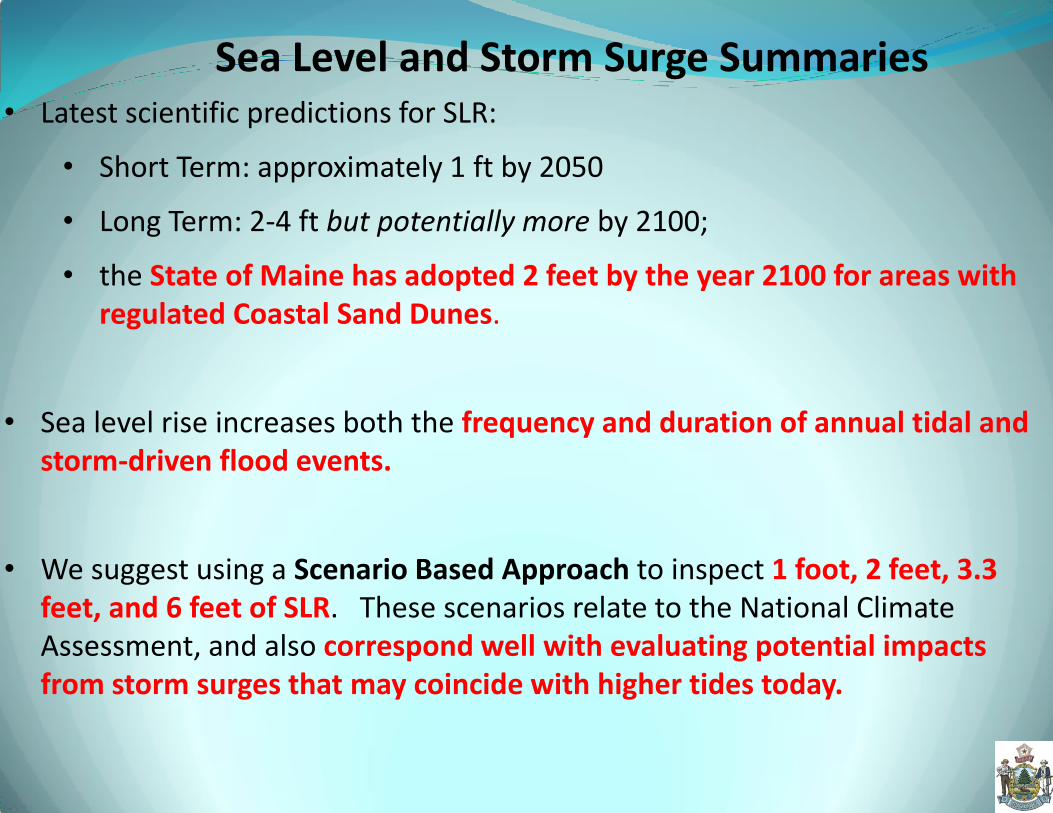
Sea Level and Storm Surge Summaries • Latest scientific predictions for SLR:
• Short Term: approximately 1 ft by 2050
• Long Term: 2-4 ft but potentially more by 2100;
• the State of Maine has adopted 2 feet by the year 2100 for areas with regulated Coastal Sand Dunes.
• Sea level rise increases both the frequency and duration of annual tidal and storm-driven flood events.
• We suggest using a Scenario Based Approach to inspect 1 foot, 2 feet, 3.3 feet, and 6 feet of SLR. These scenarios relate to the National Climate Assessment, and also correspond well with evaluating potential impacts from storm surges that may coincide with higher tides today.
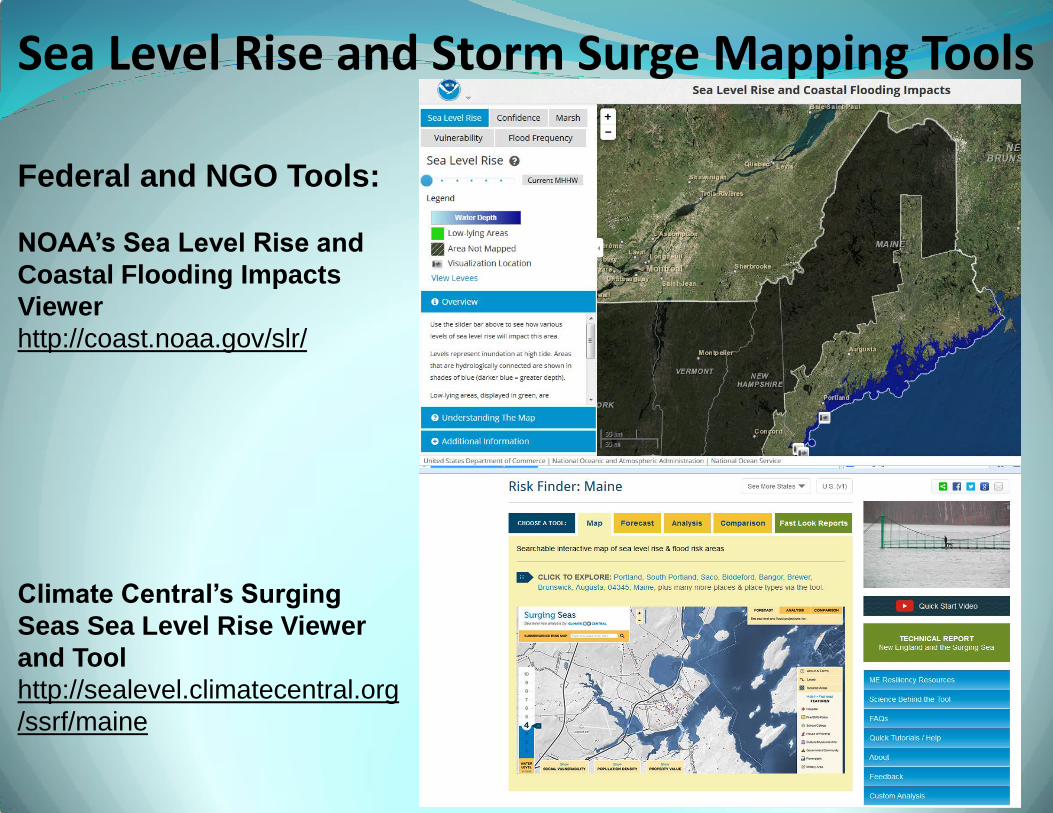
Sea Level Rise and Storm Surge Mapping Tools
Federal and NGO Tools:
NOAA’s Sea Level Rise and
Coastal Flooding Impacts
Viewer
http://coast.noaa.gov/slr/
Climate Central’s Surging
Seas Sea Level Rise Viewer
and Tool
http://sealevel.climatecentral.org
/ssrf/maine
Datasets created by the State to support Municipal Resiliency
Maine’s Potential Hurricane Inundation
Mapping
Maine’s Highest Annual Tide Mapping
Potential uses of the dataset
Potential Hurricane Inundation Mapping • emergency preparedness, management, and
evacuation planning purposes only.
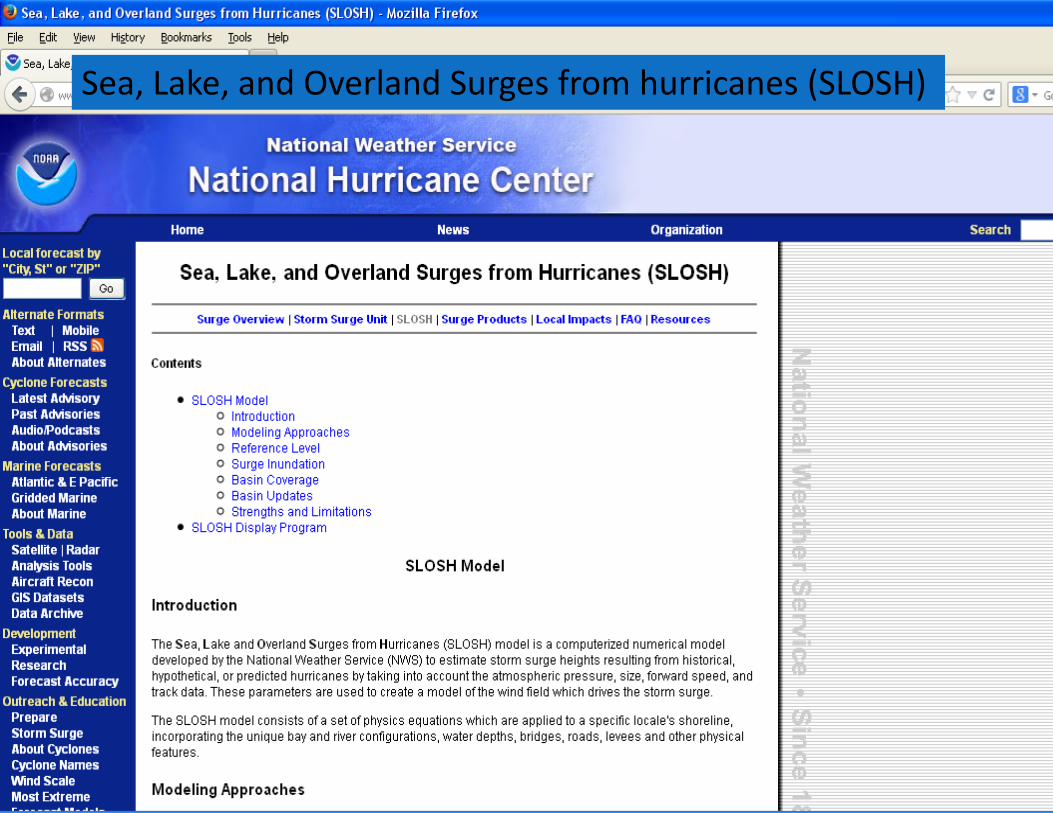
Sea, Lake, and Overland Surges from hurricanes (SLOSH)
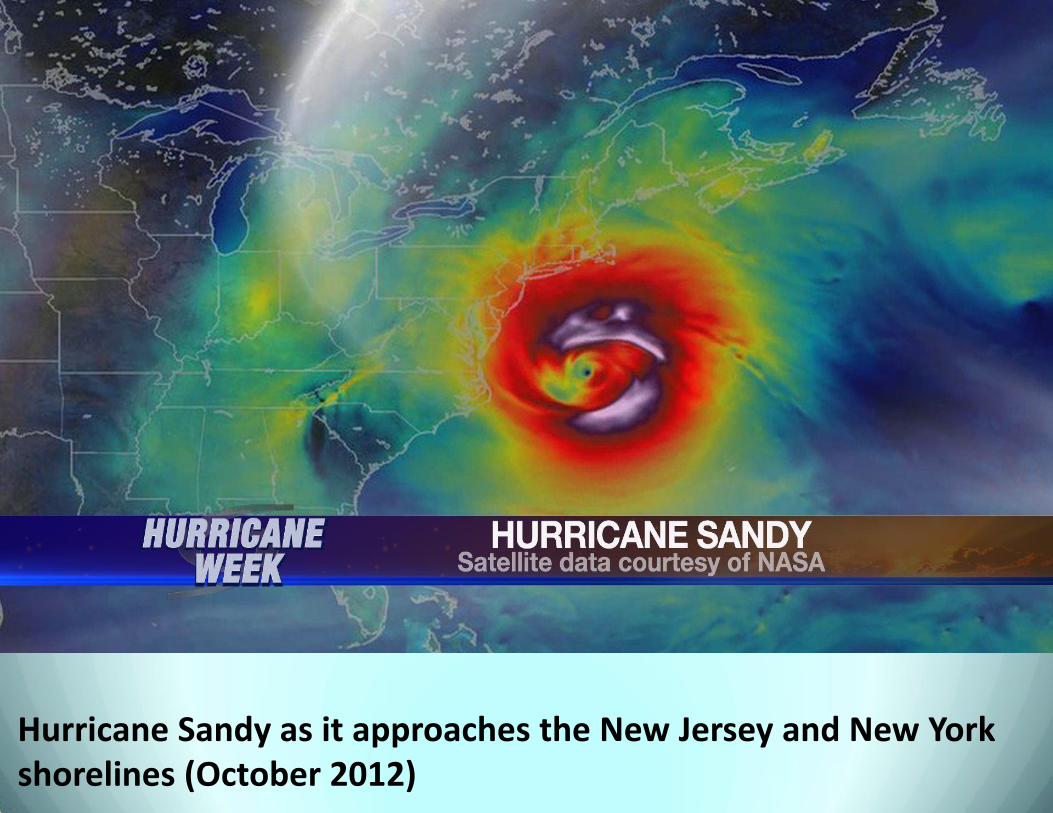
Hurricane Sandy as it approaches the New Jersey and New York shorelines (October 2012)
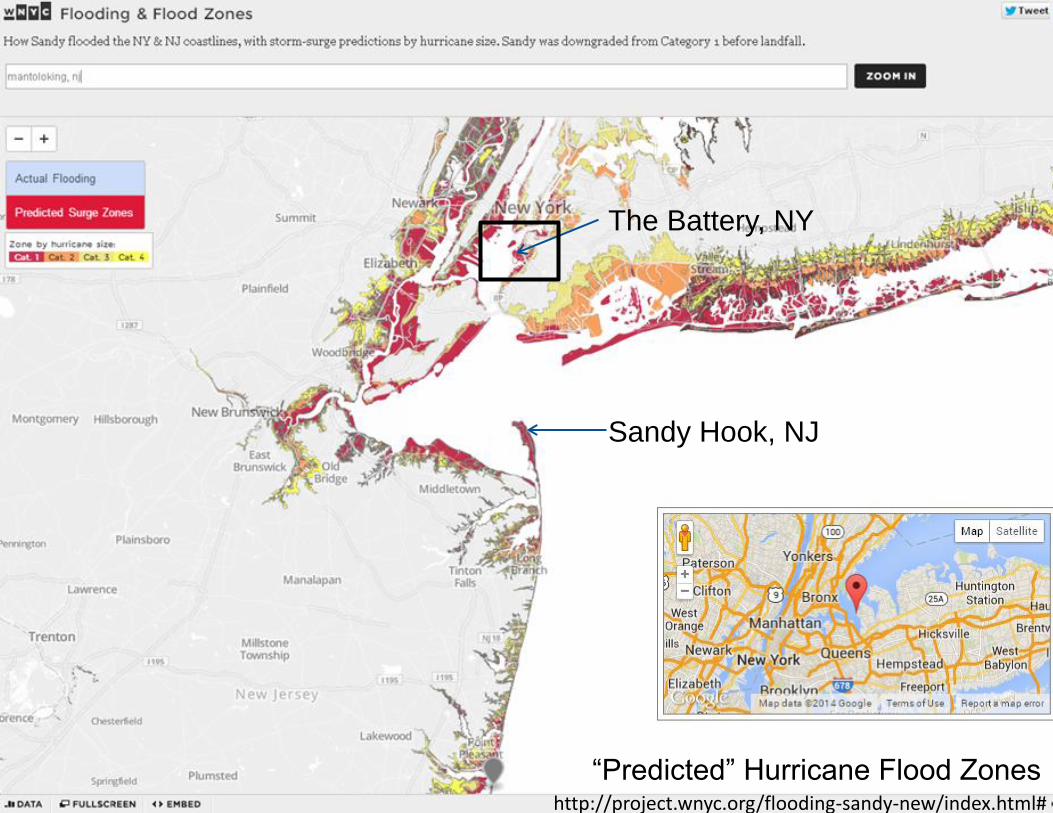
“Predicted” Hurricane Flood Zones http://project.wnyc.org/flooding-sandy-new/index.html#
Sandy Hook, NJ
The Battery, NY
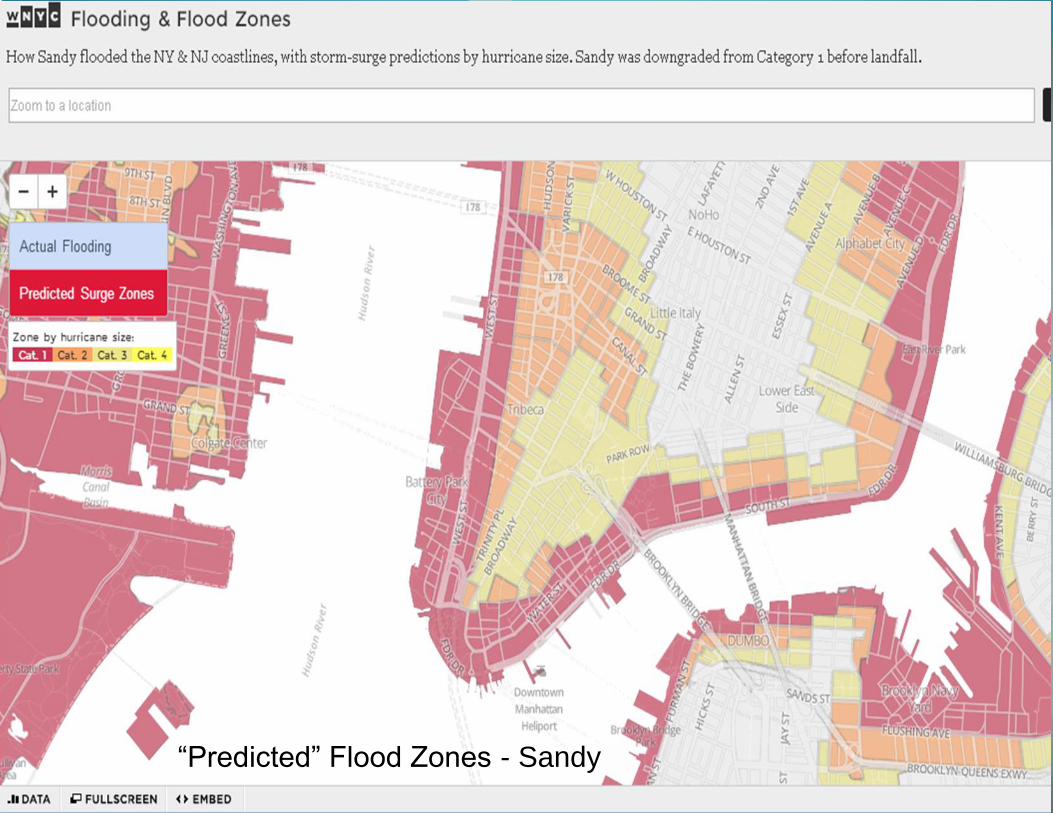
“Predicted” Flood Zones - Sandy
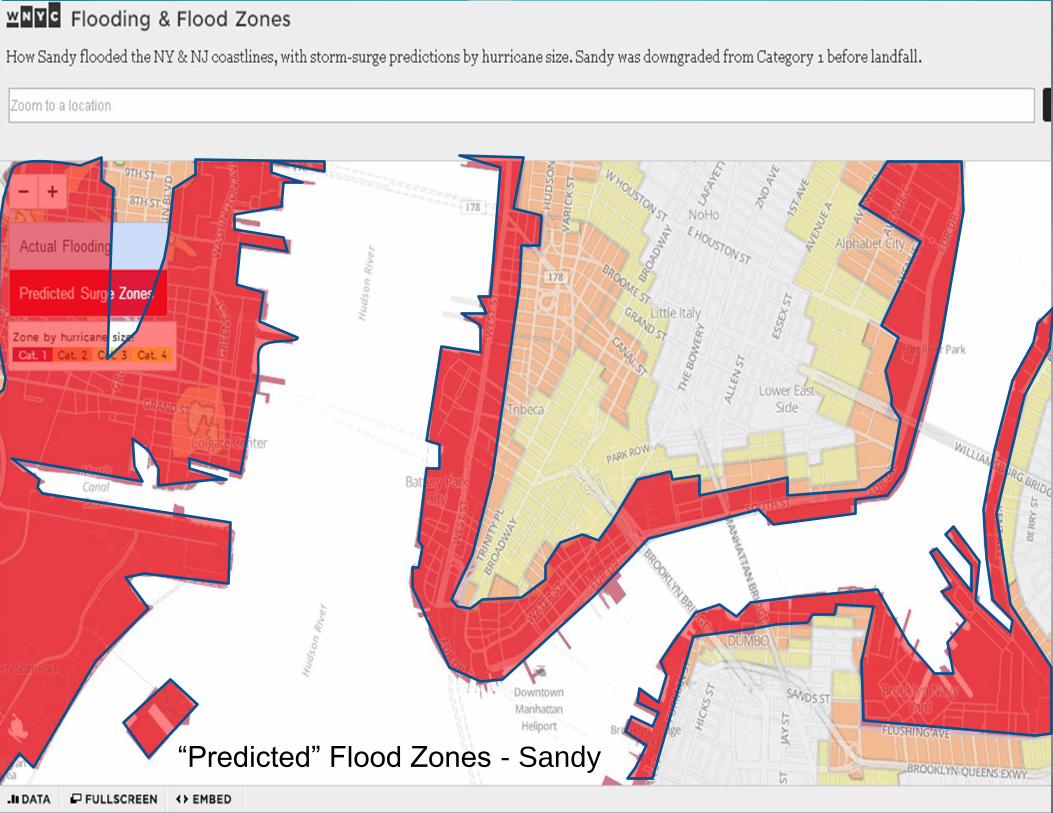
“Predicted” Flood Zones - Sandy
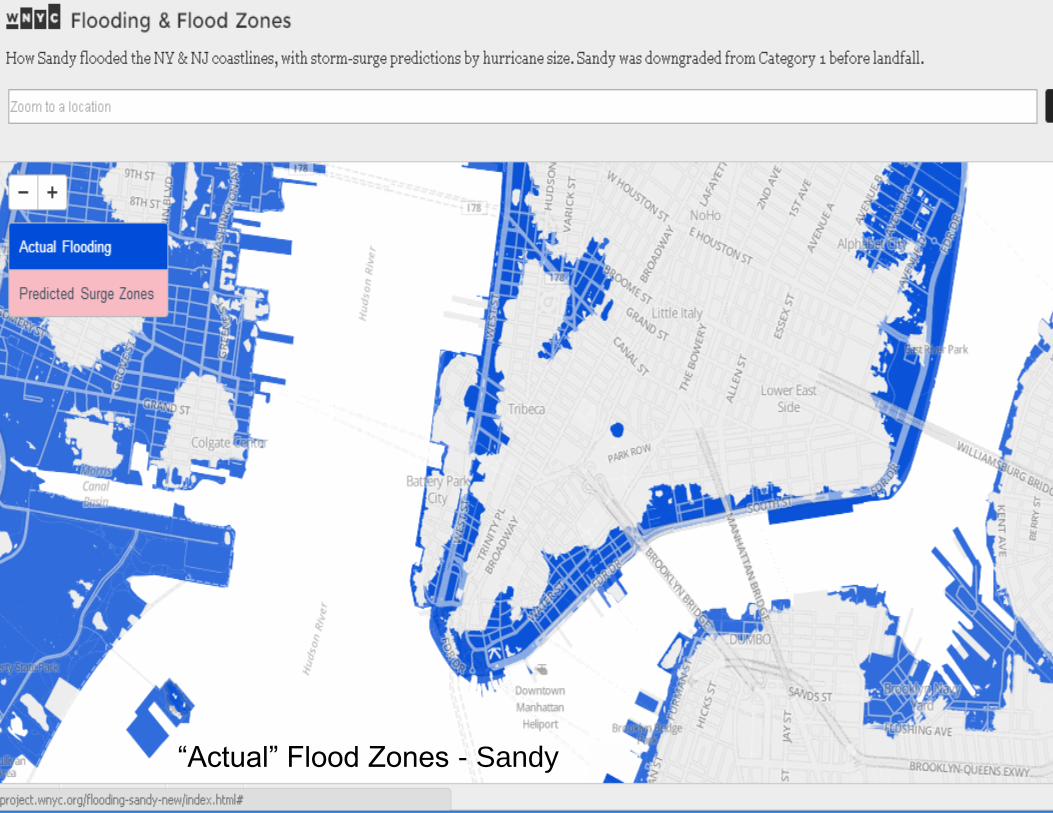
“Actual” Flood Zones - Sandy
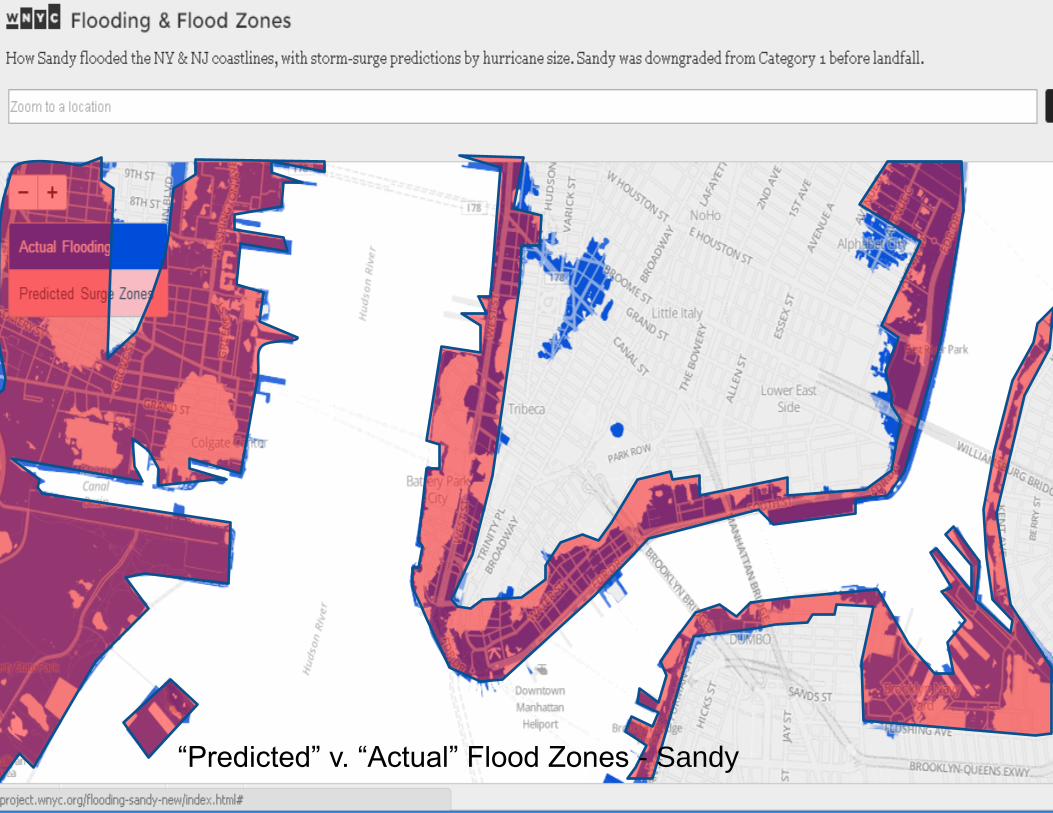
“Predicted” v. “Actual” Flood Zones - Sandy
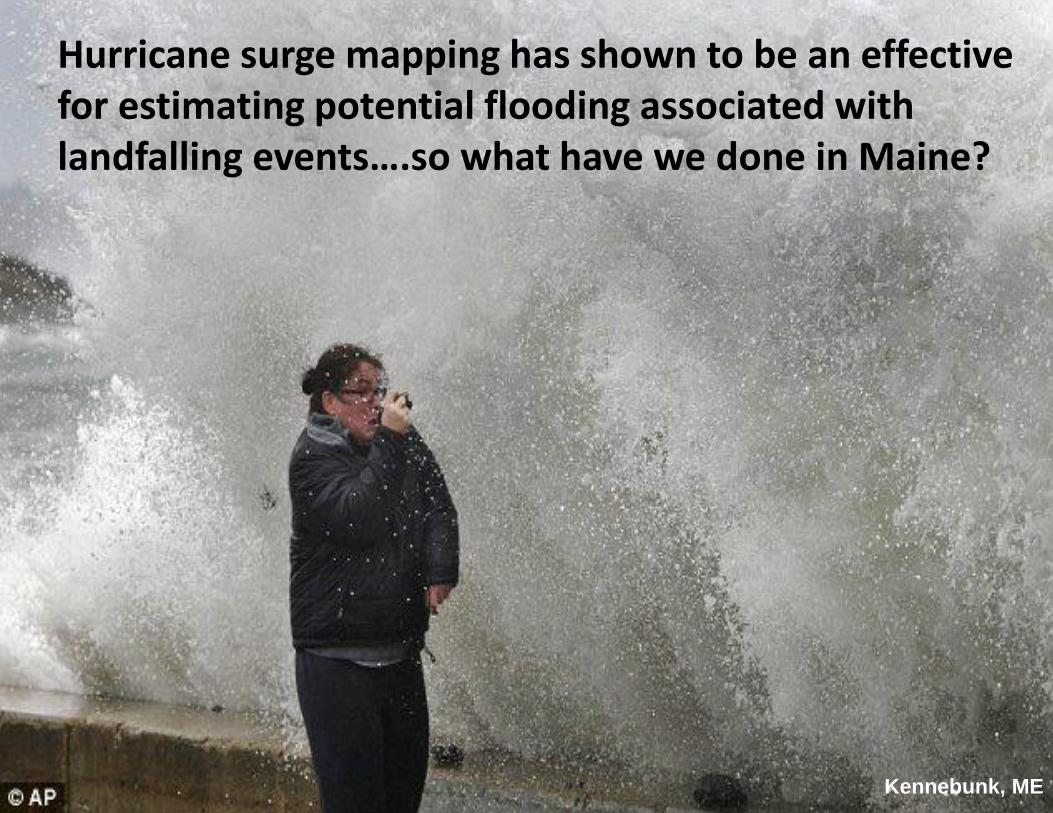
Hurricane surge mapping has shown to be an effective for estimating potential flooding associated with landfalling events….so what have we done in Maine?
Kennebunk, ME
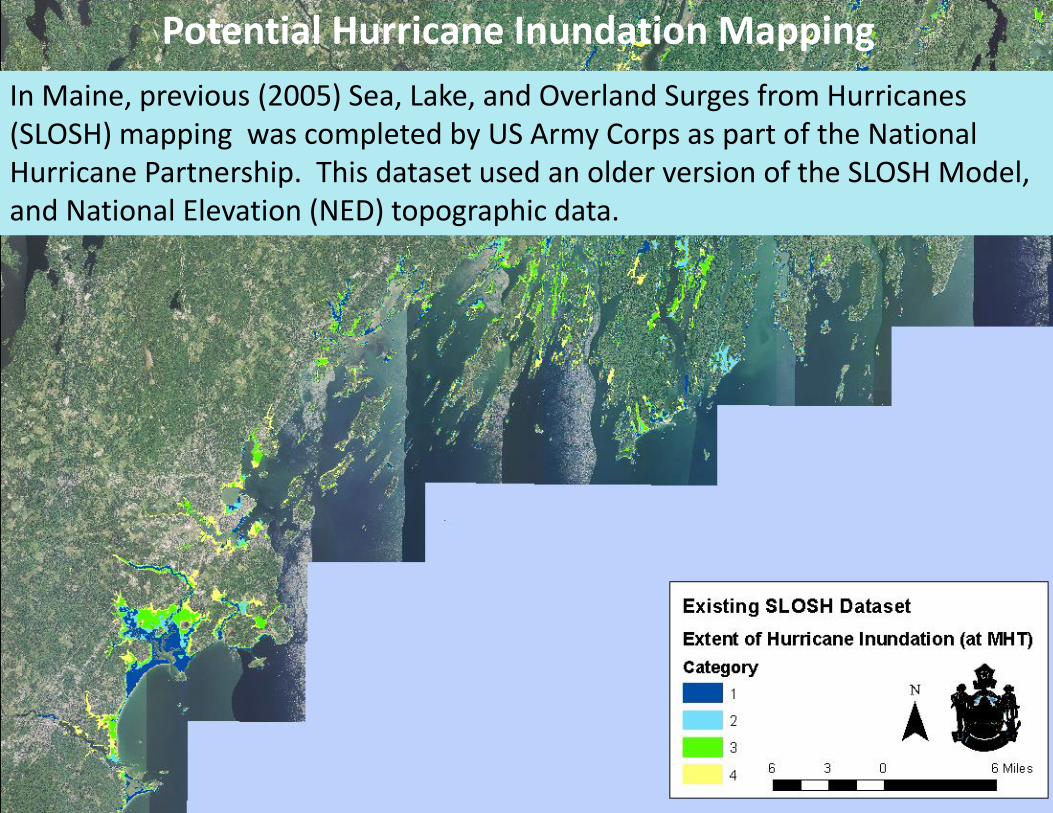
Potential Hurricane Inundation Mapping
In Maine, previous (2005) Sea, Lake, and Overland Surges from Hurricanes (SLOSH) mapping was completed by US Army Corps as part of the National Hurricane Partnership. This dataset used an older version of the SLOSH Model, and National Elevation (NED) topographic data.
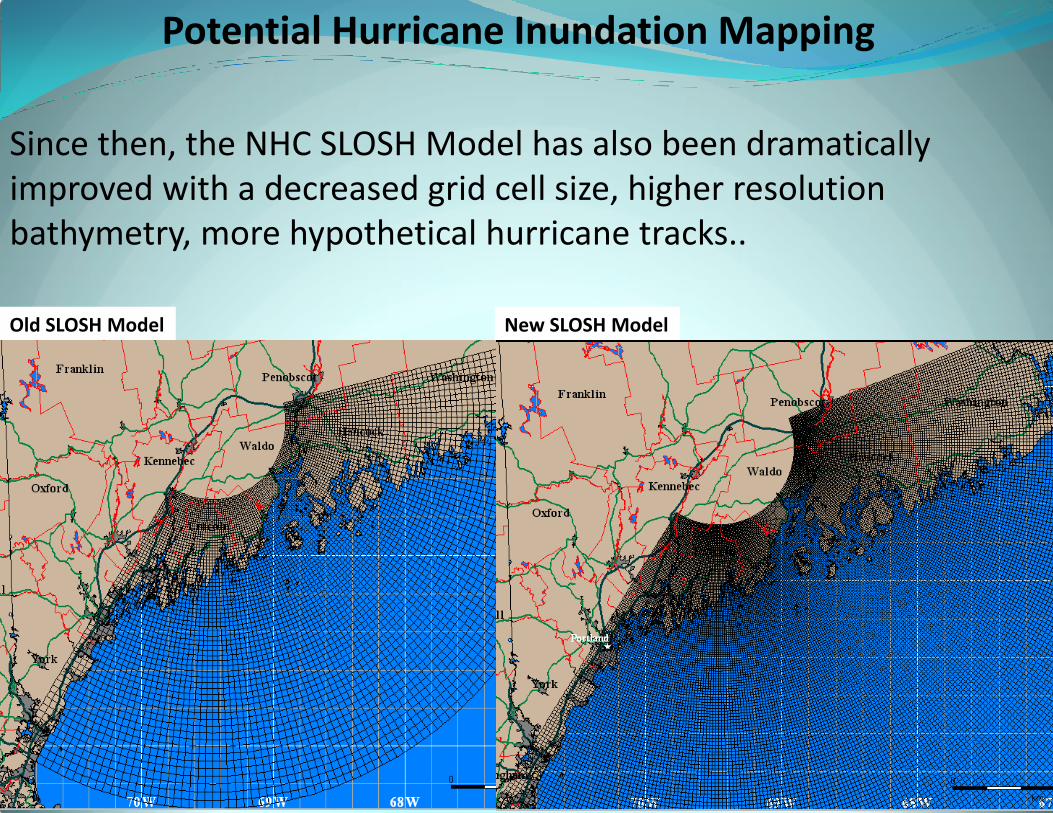
Since then, the NHC SLOSH Model has also been dramatically improved with a decreased grid cell size, higher resolution bathymetry, more hypothetical hurricane tracks..
Old SLOSH Model New SLOSH Model
Potential Hurricane Inundation Mapping
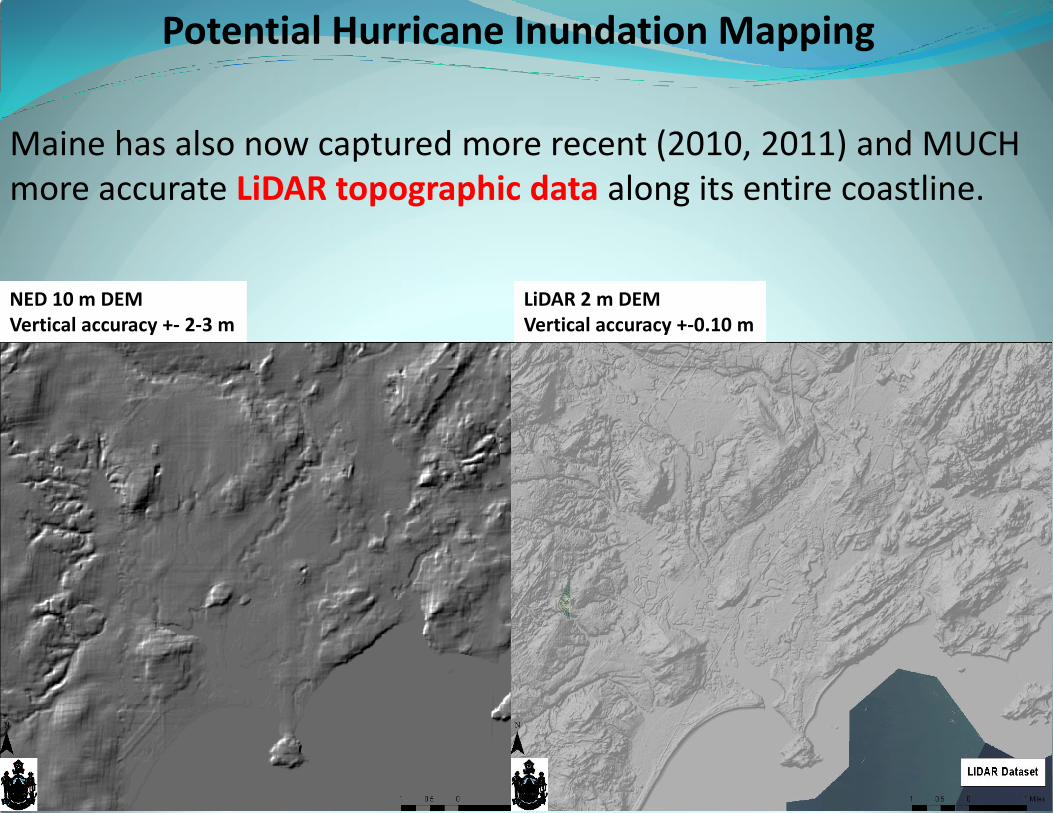
Maine has also now captured more recent (2010, 2011) and MUCH more accurate LiDAR topographic data along its entire coastline.
NED 10 m DEM Vertical accuracy +- 2-3 m
LiDAR 2 m DEM Vertical accuracy +-0.10 m
Potential Hurricane Inundation Mapping
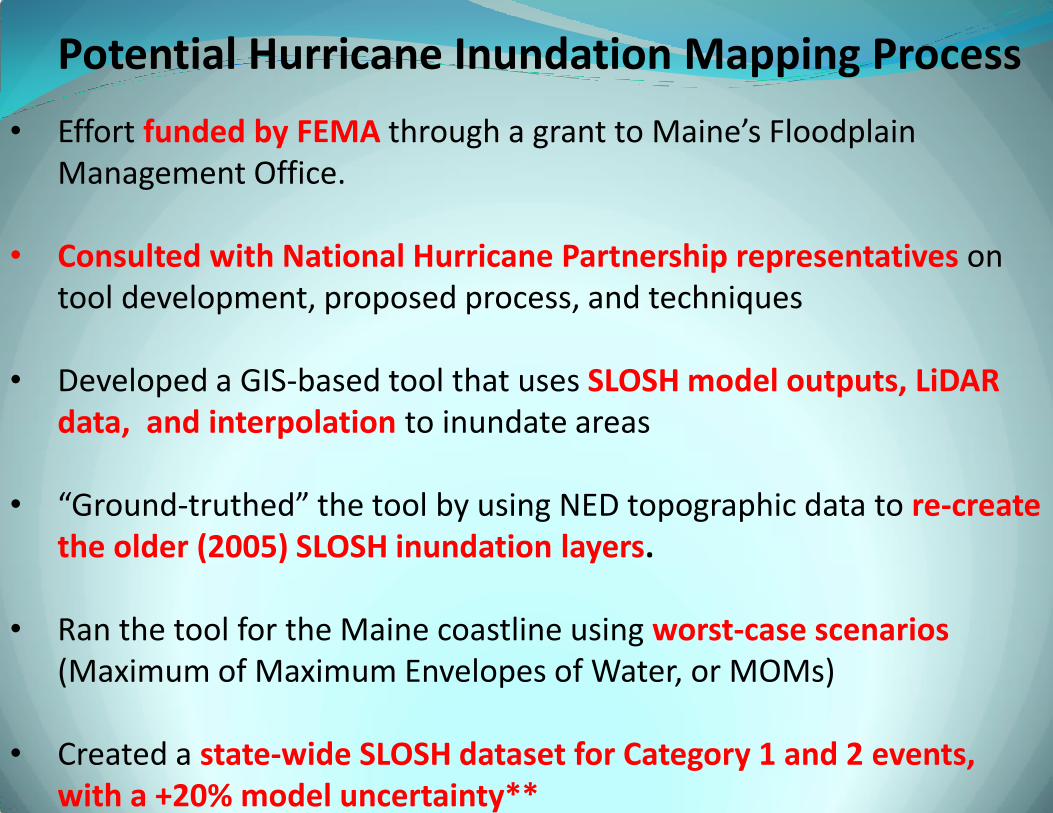
Potential Hurricane Inundation Mapping Process
• Effort funded by FEMA through a grant to Maine’s Floodplain Management Office.
• Consulted with National Hurricane Partnership representatives on tool development, proposed process, and techniques
• Developed a GIS-based tool that uses SLOSH model outputs, LiDAR data, and interpolation to inundate areas
• “Ground-truthed” the tool by using NED topographic data to re-create the older (2005) SLOSH inundation layers.
• Ran the tool for the Maine coastline using worst-case scenarios (Maximum of Maximum Envelopes of Water, or MOMs)
• Created a state-wide SLOSH dataset for Category 1 and 2 events, with a +20% model uncertainty**
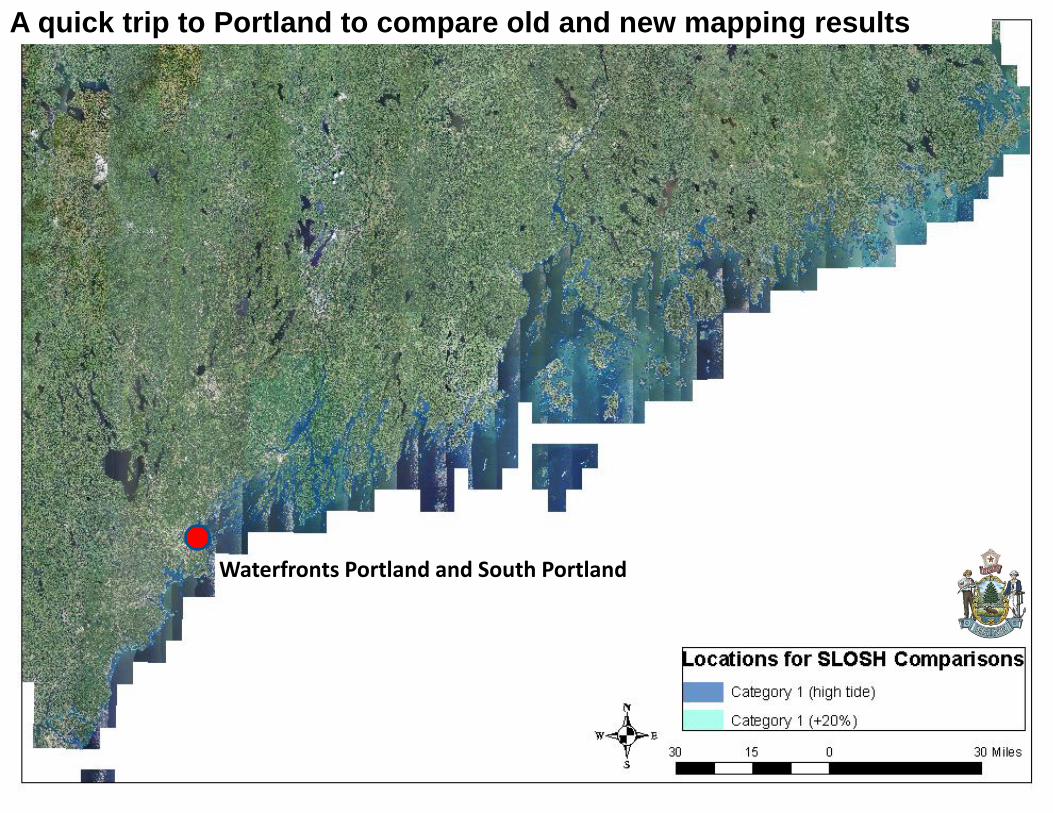
Waterfronts Portland and South Portland
A quick trip to Portland to compare old and new mapping results

Commercial St
Front St
HighSt
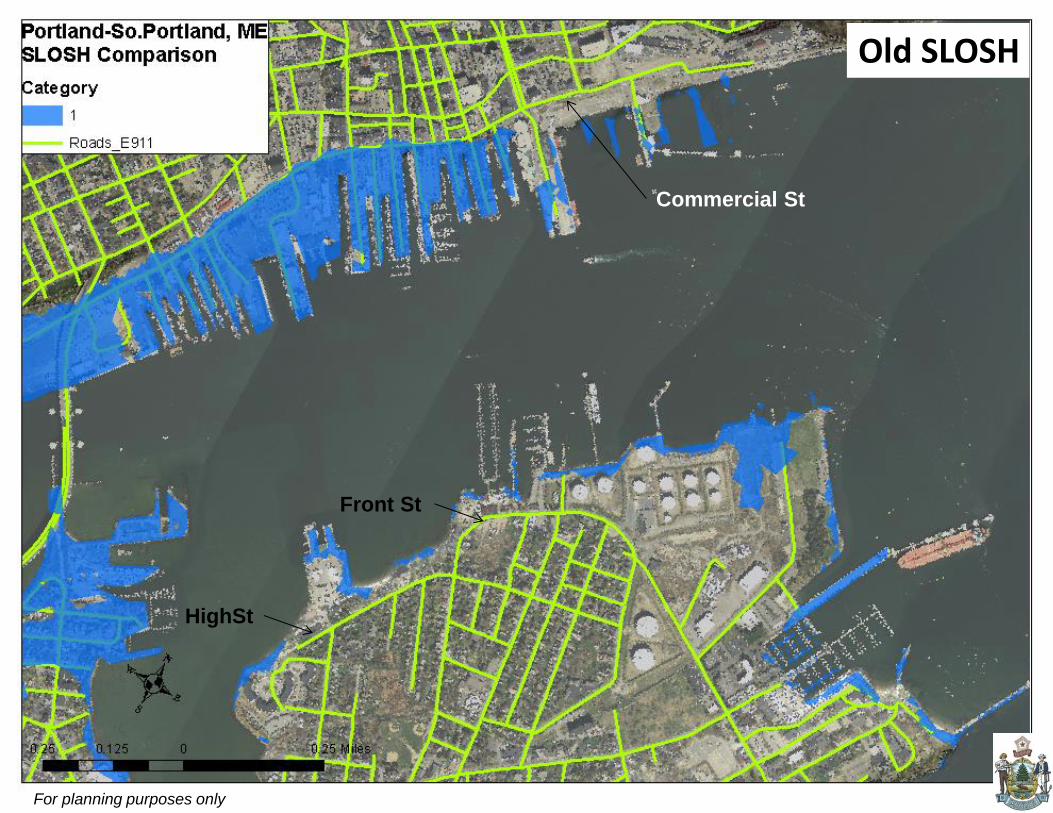
Old SLOSH
For planning purposes only
Commercial St
Front St
HighSt
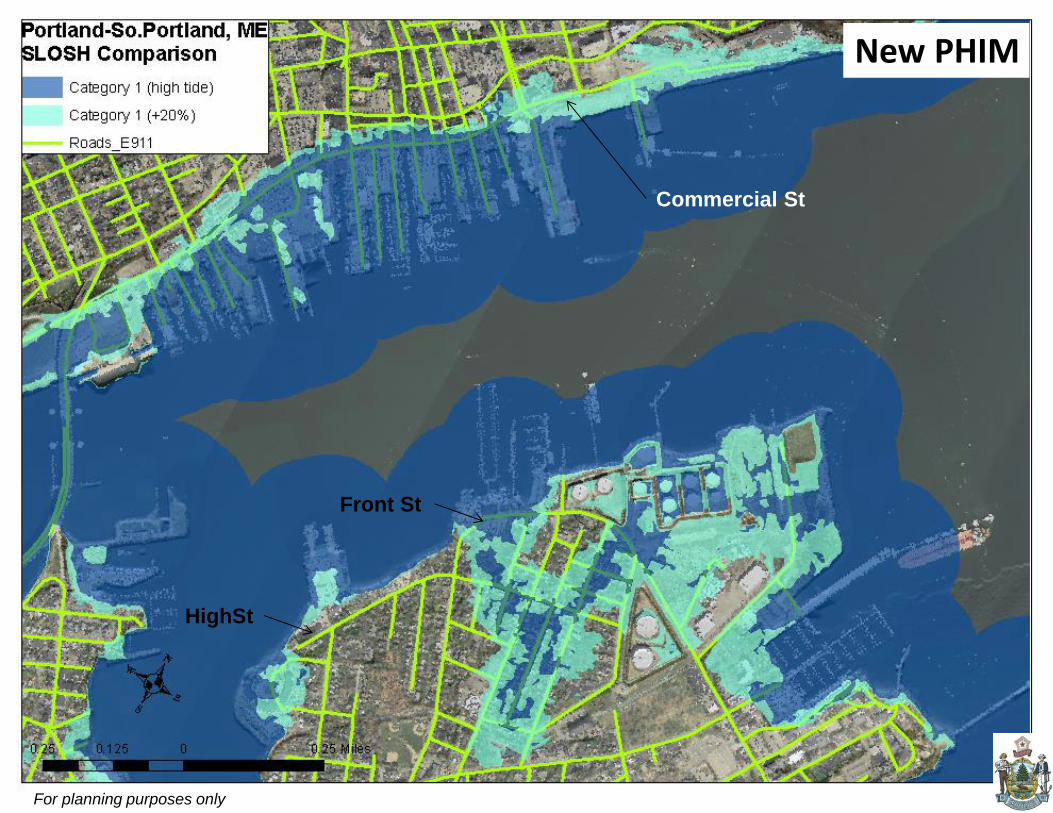
New PHIM
For planning purposes only
Commercial St
Front St
HighSt
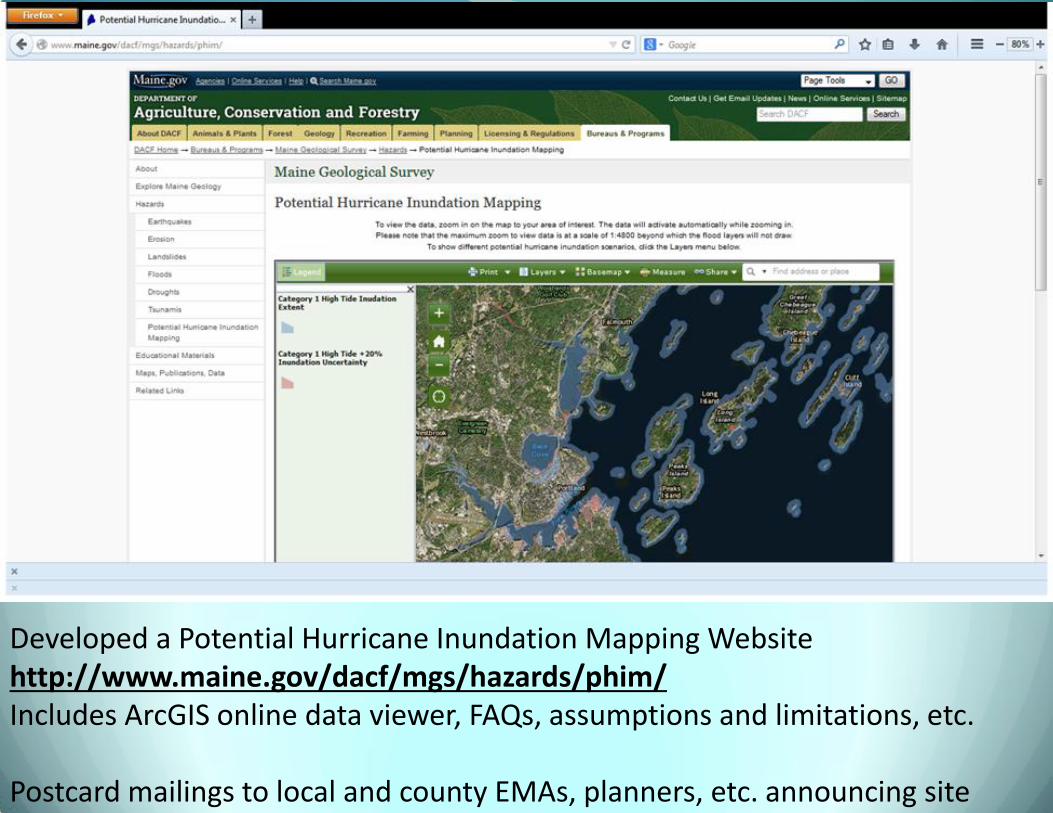
Developed a Potential Hurricane Inundation Mapping Website http://www.maine.gov/dacf/mgs/hazards/phim/ Includes ArcGIS online data viewer, FAQs, assumptions and limitations, etc. Postcard mailings to local and county EMAs, planners, etc. announcing site
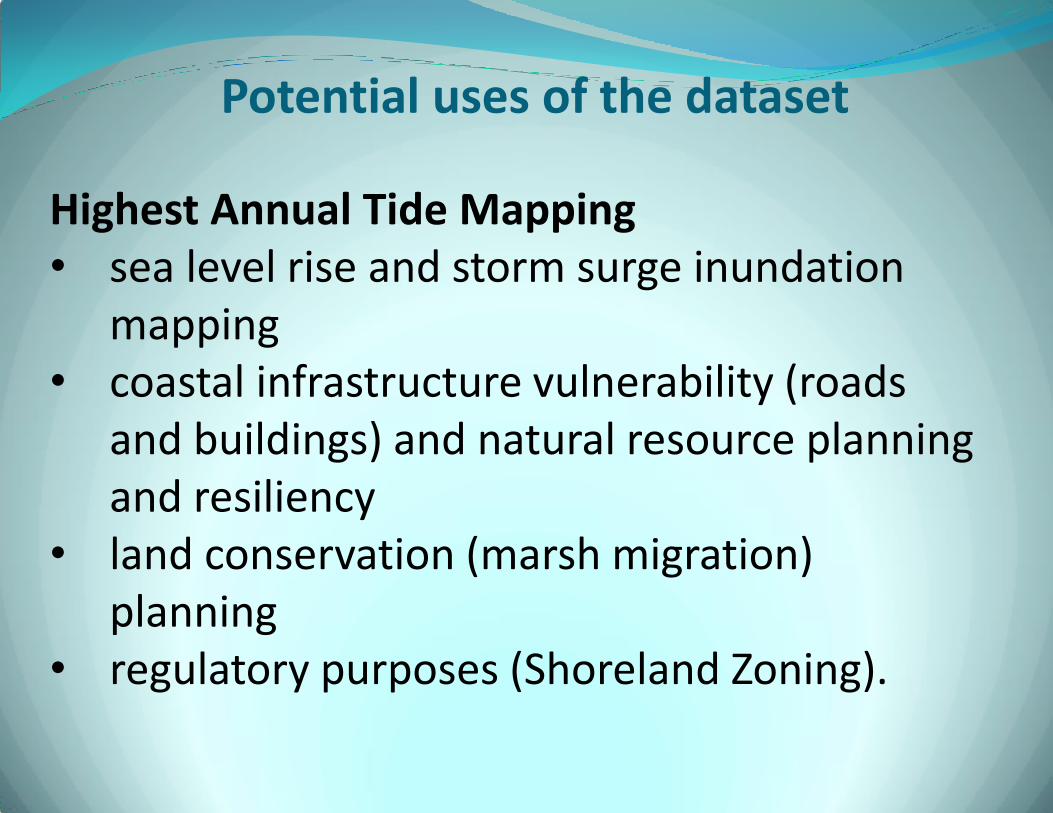
Potential uses of the dataset
Highest Annual Tide Mapping • sea level rise and storm surge inundation
mapping • coastal infrastructure vulnerability (roads
and buildings) and natural resource planning and resiliency
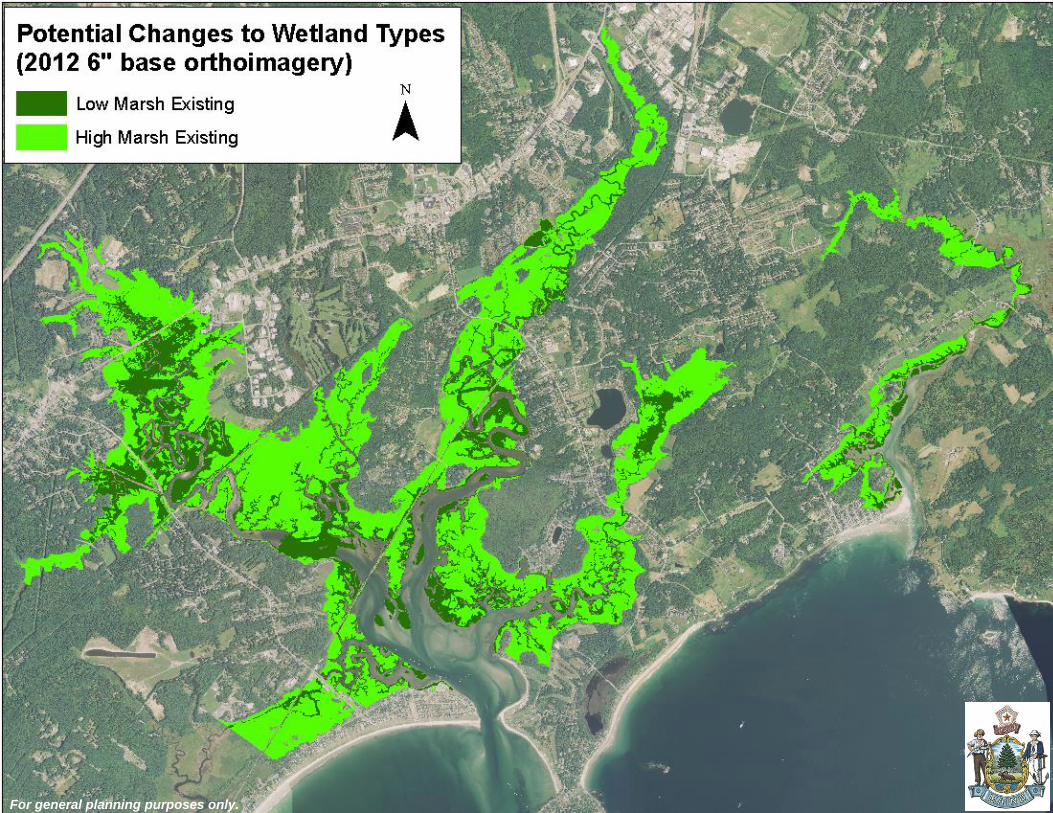
• land conservation (marsh migration) planning
• regulatory purposes (Shoreland Zoning).
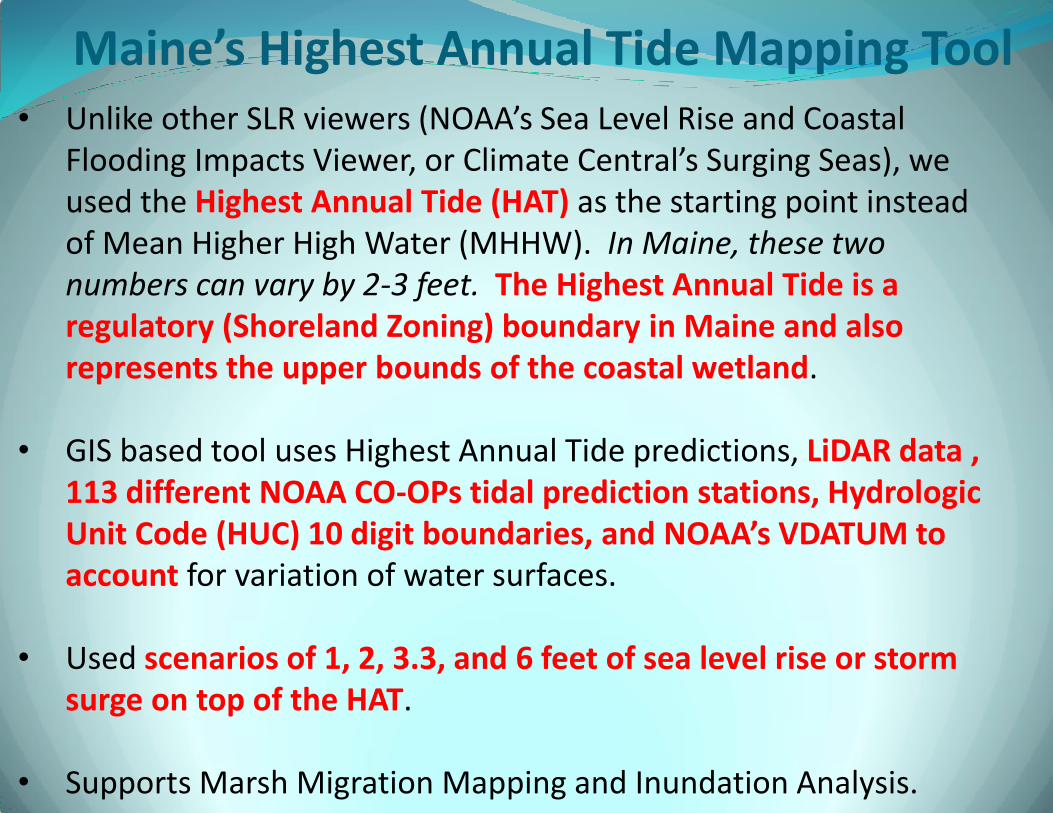
Maine’s Highest Annual Tide Mapping Tool • Unlike other SLR viewers (NOAA’s Sea Level Rise and Coastal
Flooding Impacts Viewer, or Climate Central’s Surging Seas), we used the Highest Annual Tide (HAT) as the starting point instead of Mean Higher High Water (MHHW). In Maine, these two numbers can vary by 2-3 feet. The Highest Annual Tide is a regulatory (Shoreland Zoning) boundary in Maine and also represents the upper bounds of the coastal wetland.
• GIS based tool uses Highest Annual Tide predictions, LiDAR data , 113 different NOAA CO-OPs tidal prediction stations, Hydrologic Unit Code (HUC) 10 digit boundaries, and NOAA’s VDATUM to account for variation of water surfaces.
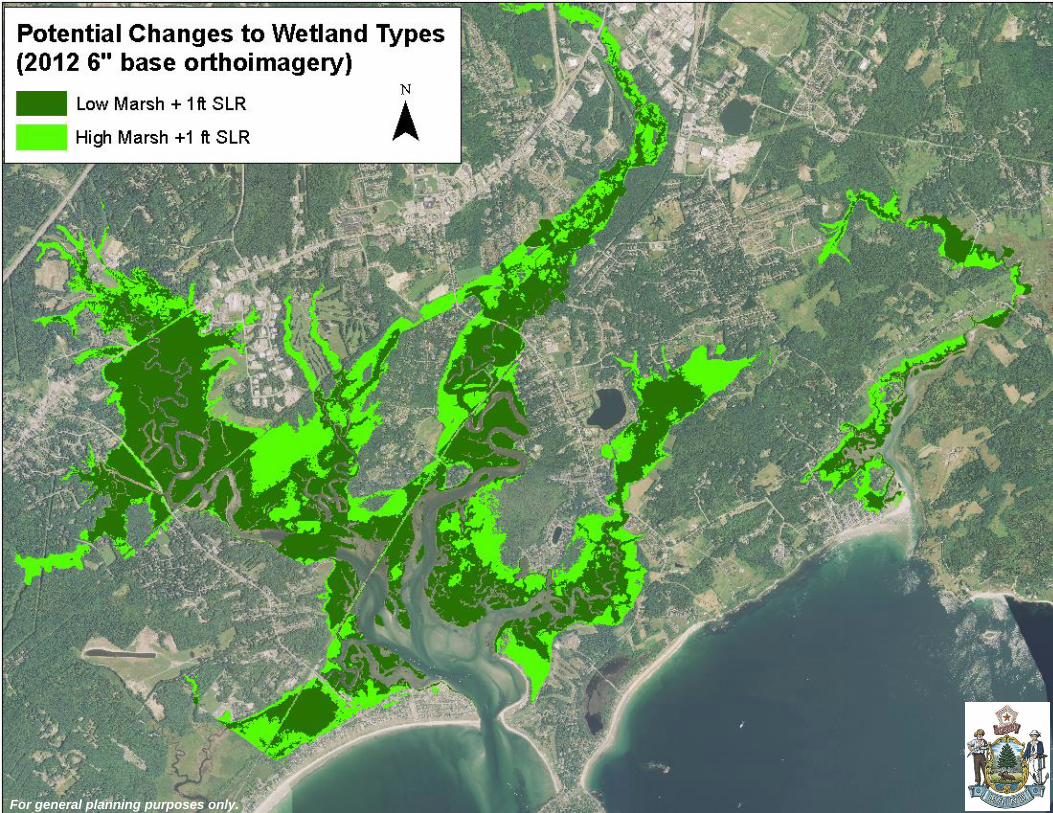
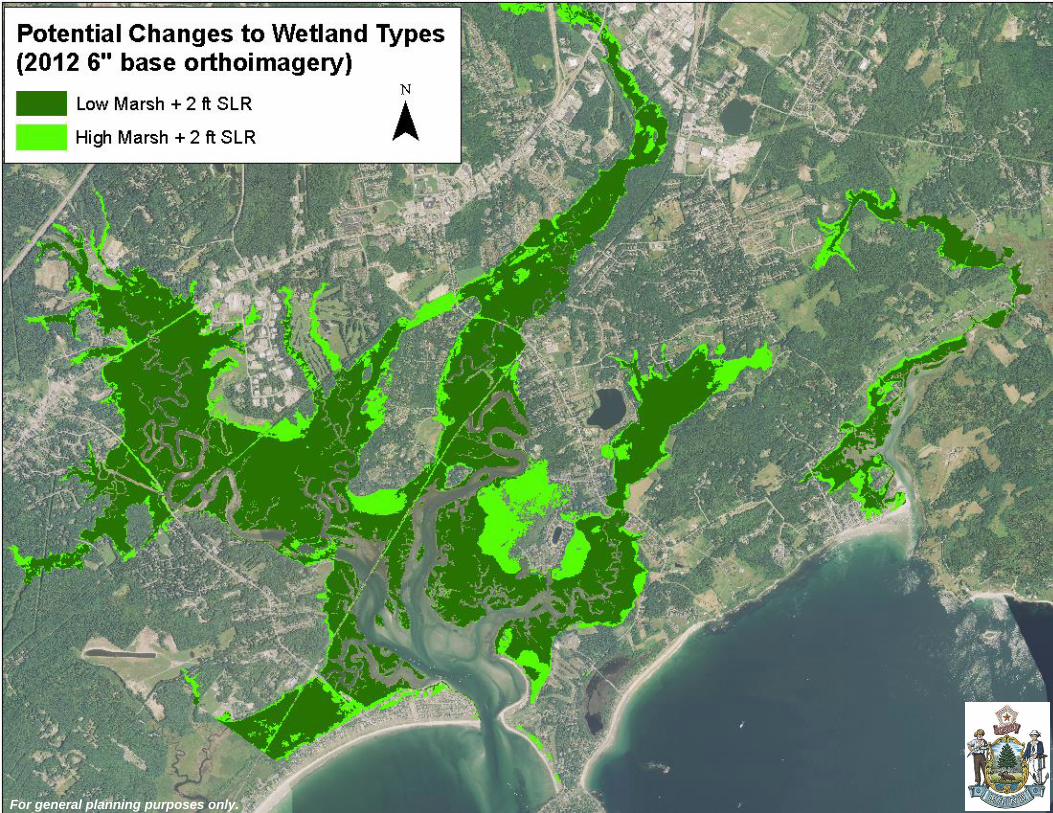
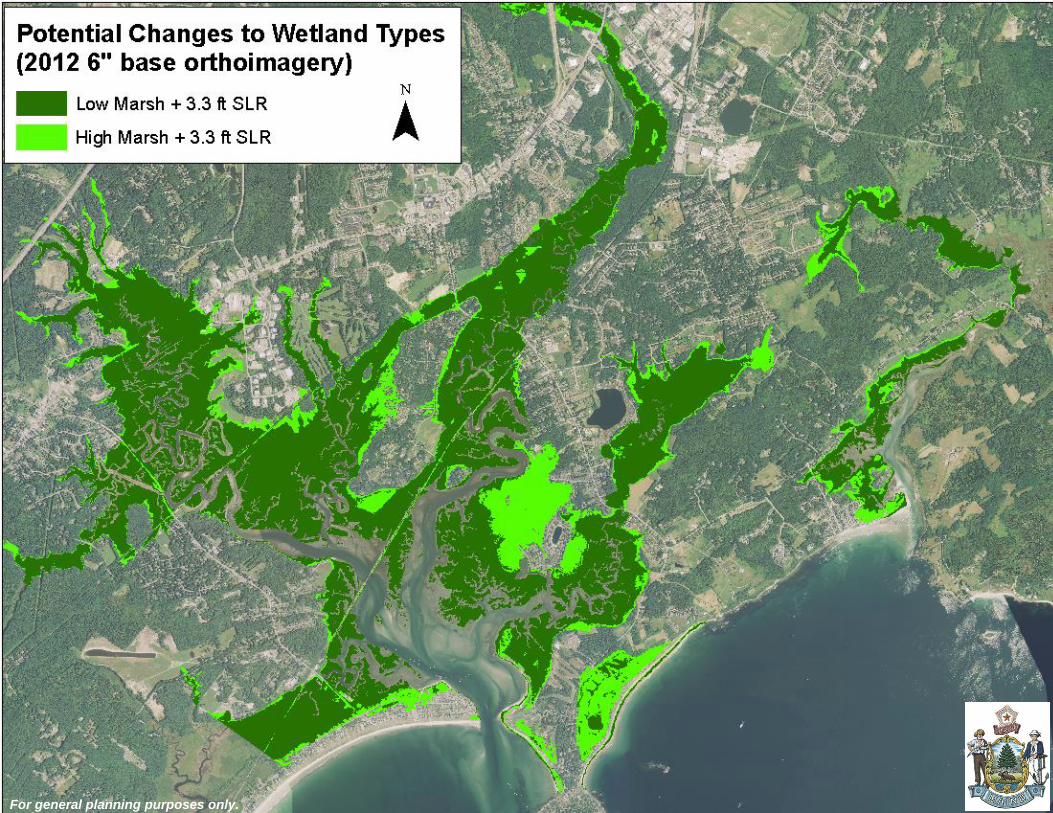
• Used scenarios of 1, 2, 3.3, and 6 feet of sea level rise or storm surge on top of the HAT.
• Supports Marsh Migration Mapping and Inundation Analysis.
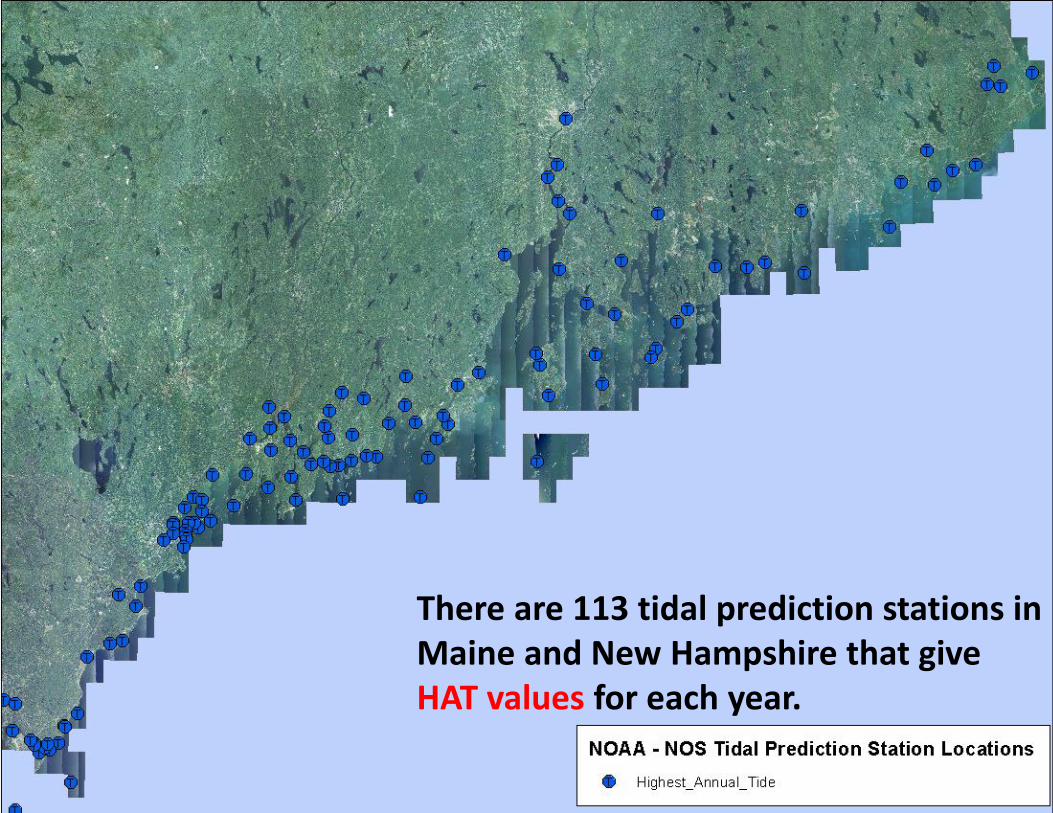
There are 113 tidal prediction stations in Maine and New Hampshire that give HAT values for each year.
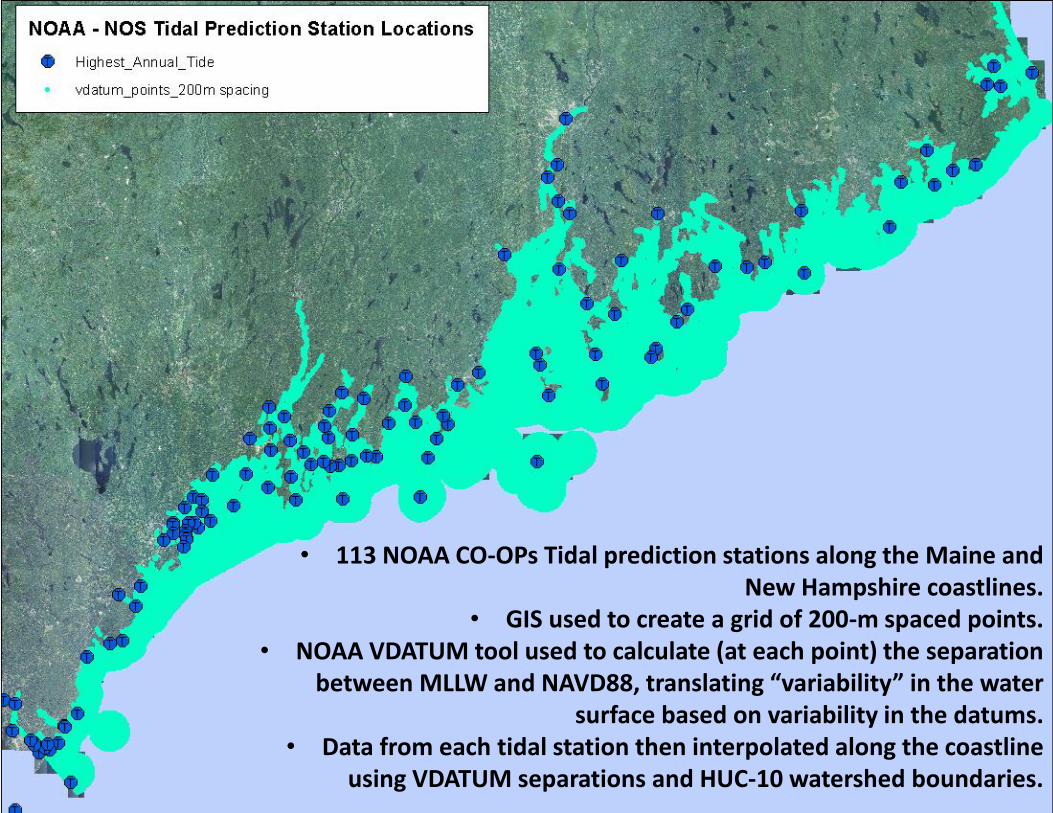
• 113 NOAA CO-OPs Tidal prediction stations along the Maine and New Hampshire coastlines.
• GIS used to create a grid of 200-m spaced points. • NOAA VDATUM tool used to calculate (at each point) the separation
between MLLW and NAVD88, translating “variability” in the water surface based on variability in the datums.
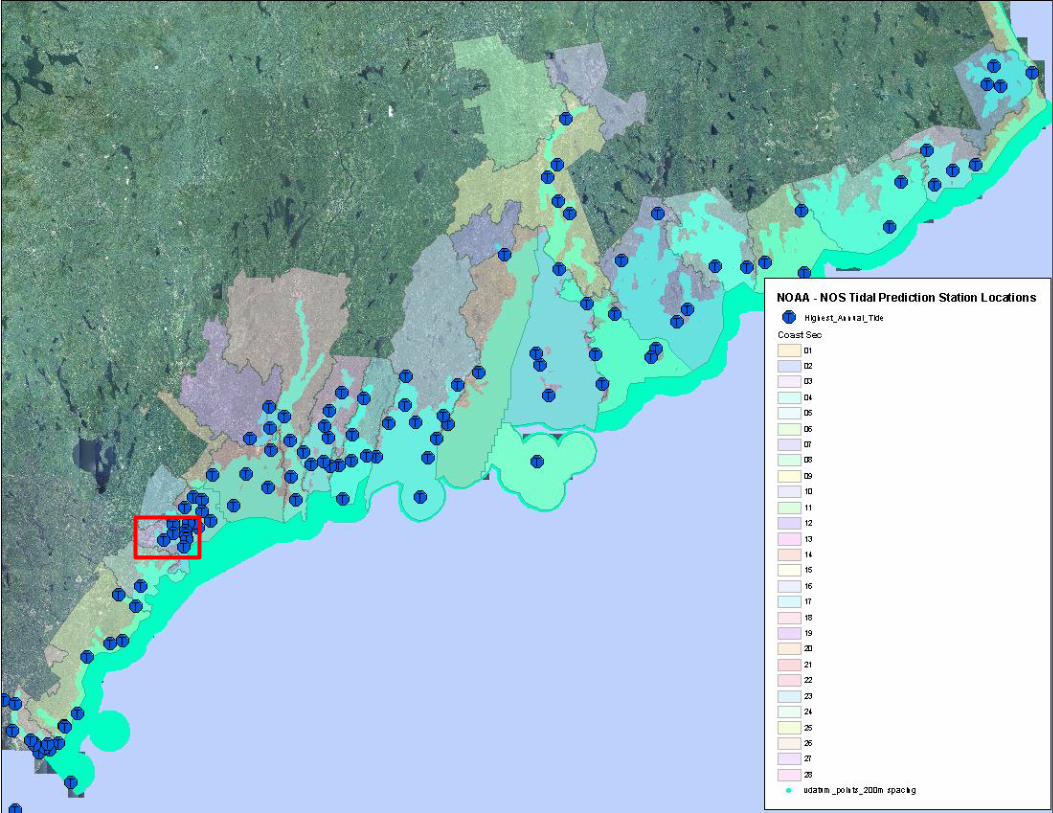
• Data from each tidal station then interpolated along the coastline using VDATUM separations and HUC-10 watershed boundaries.
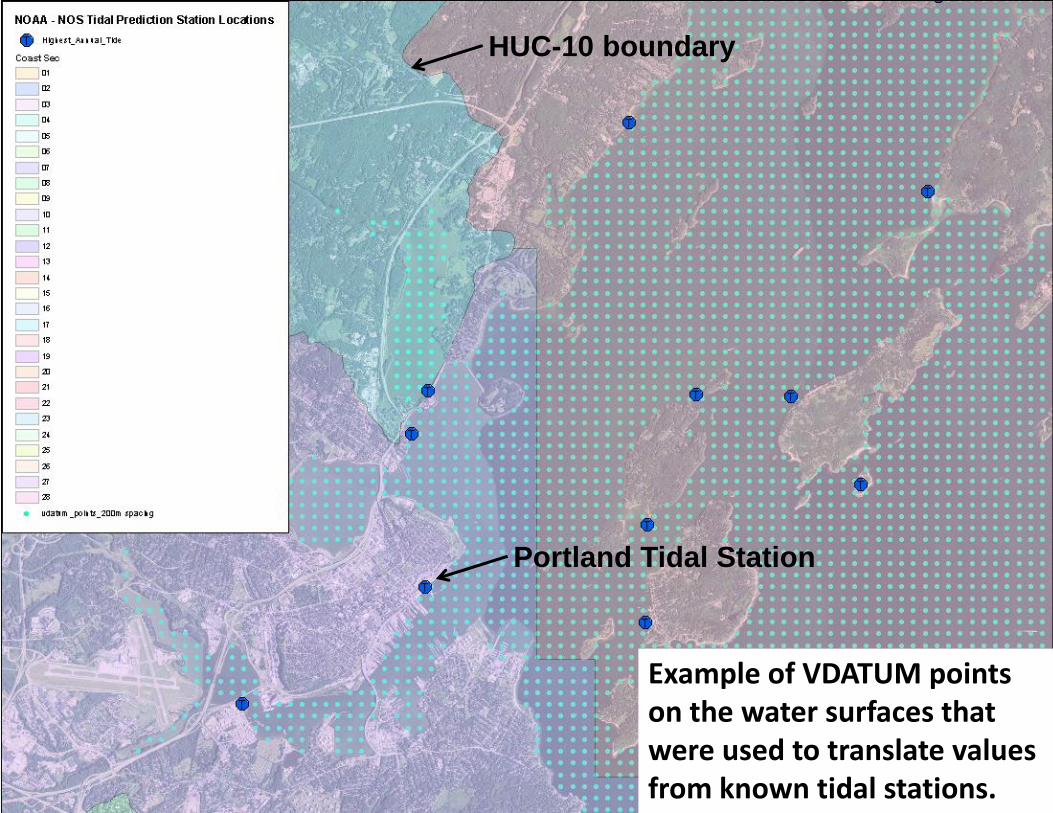
Example of VDATUM points on the water surfaces that were used to translate values from known tidal stations.
HUC-10 boundary
Portland Tidal Station
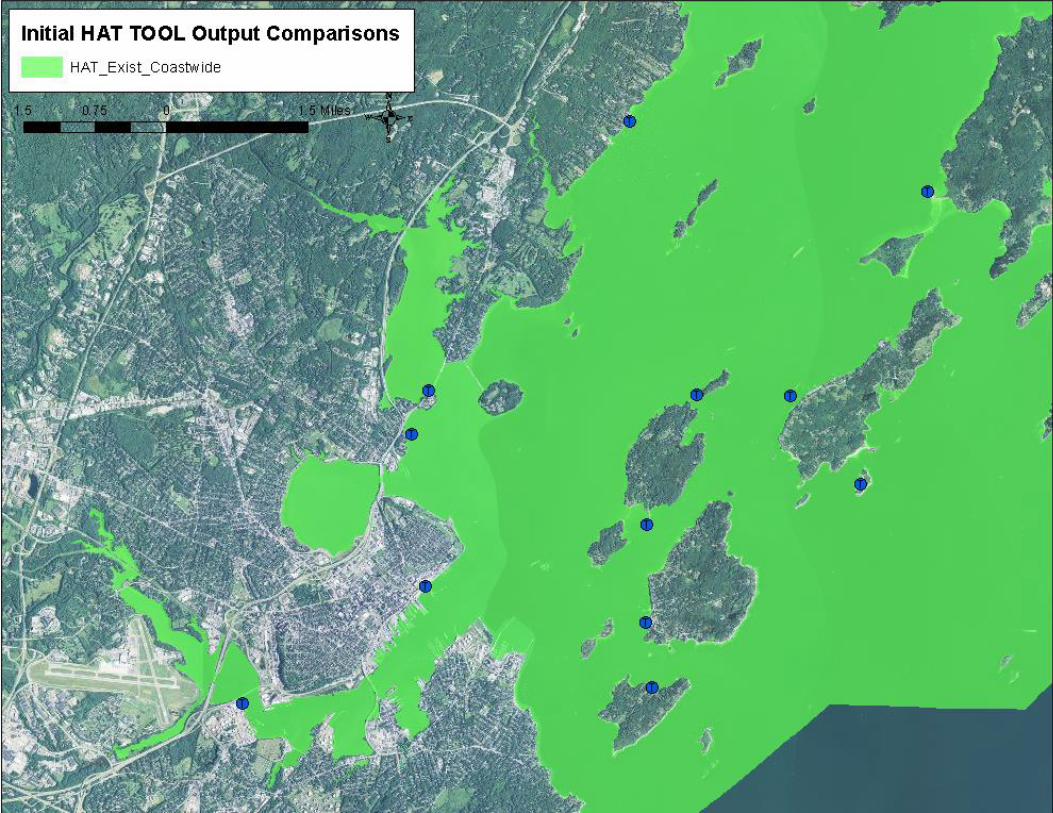
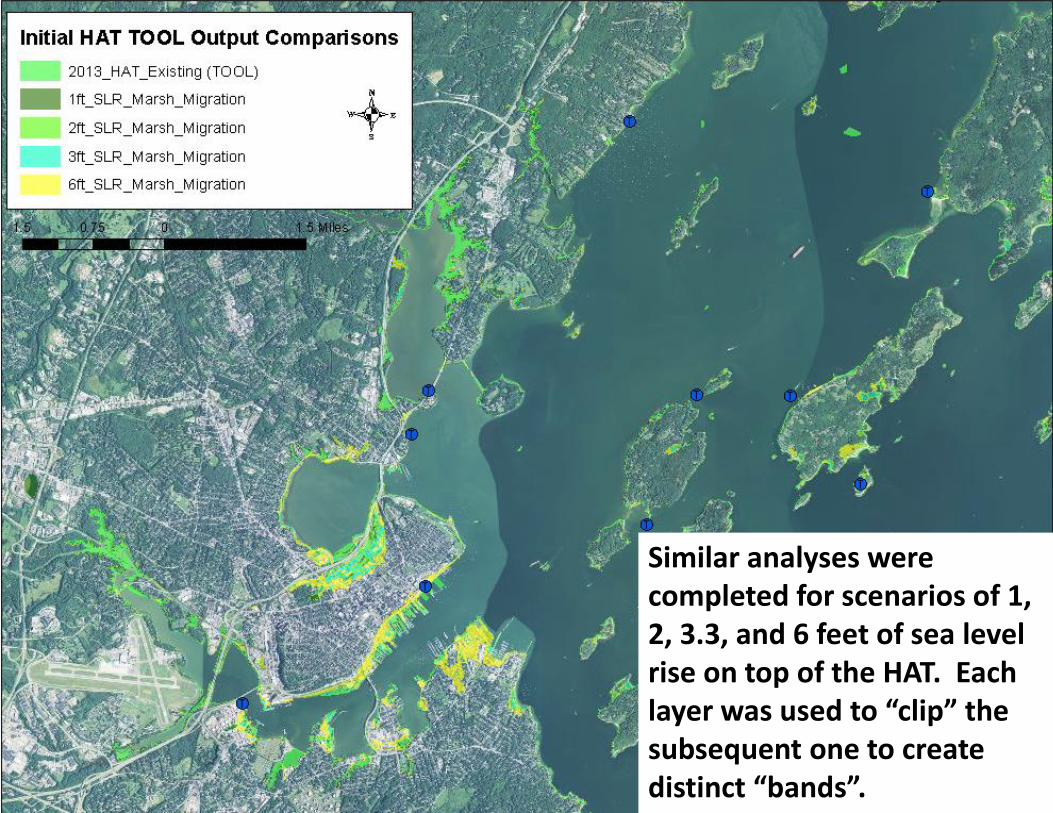
Similar analyses were completed for scenarios of 1, 2, 3.3, and 6 feet of sea level rise on top of the HAT. Each layer was used to “clip” the subsequent one to create distinct “bands”.
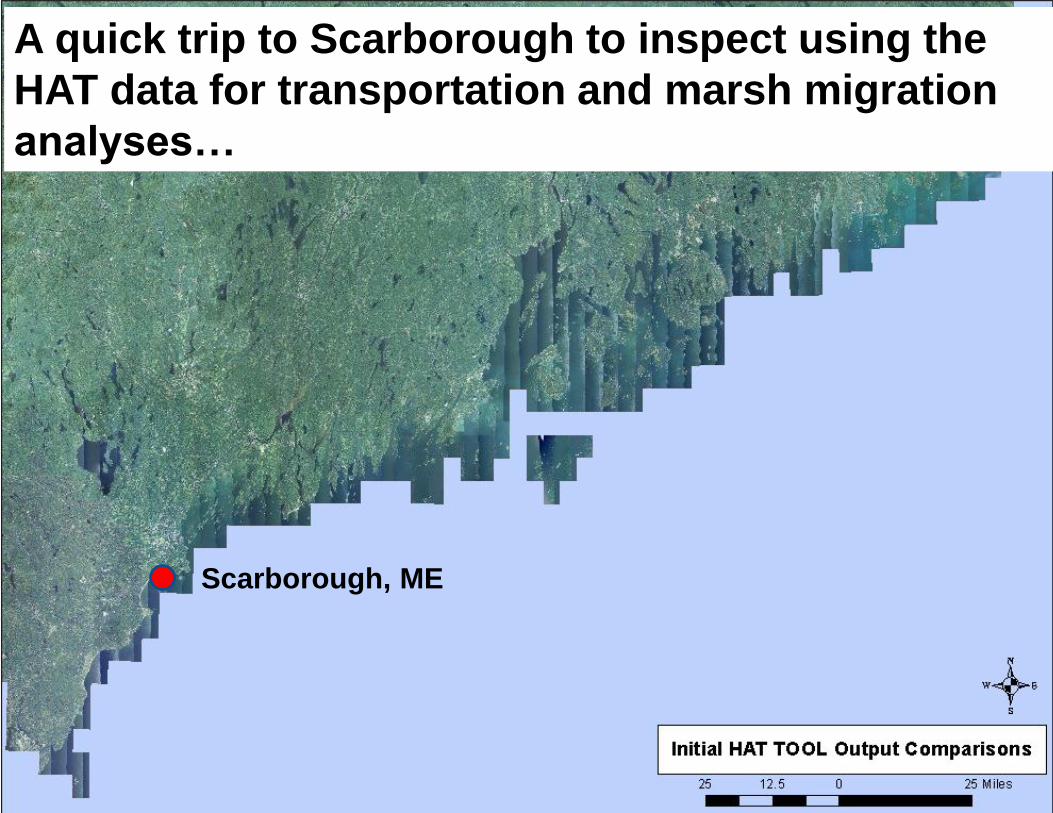
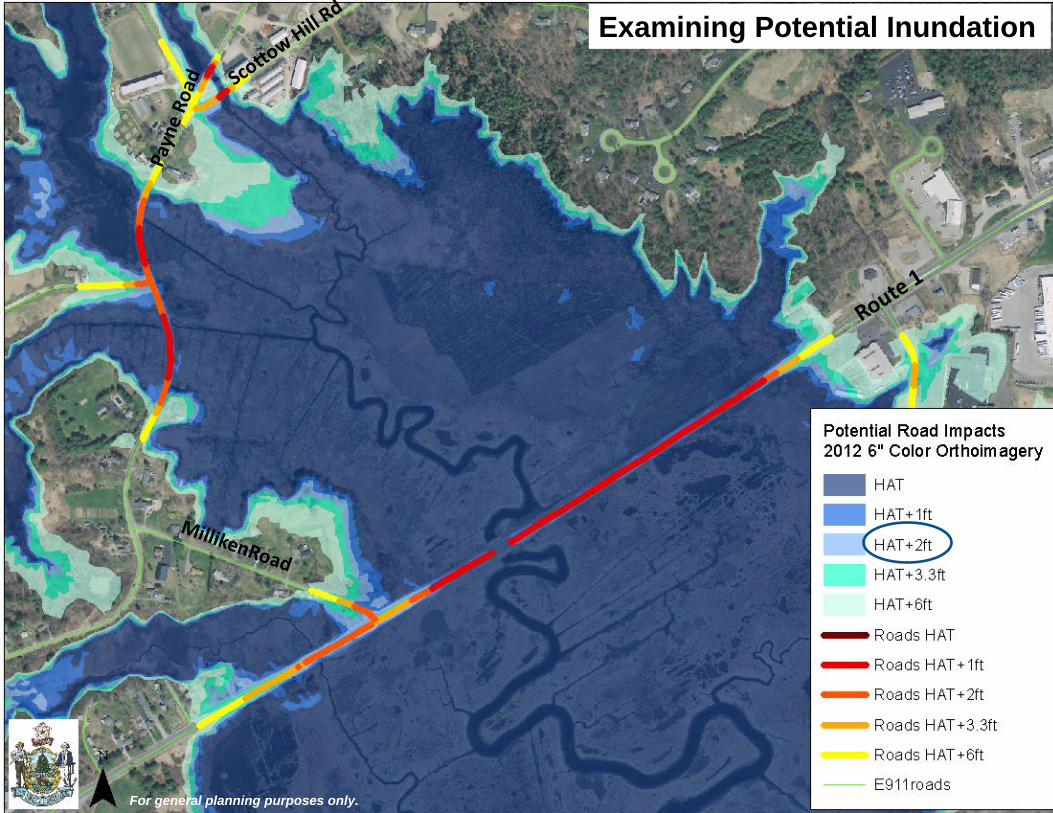
Scarborough, ME
A quick trip to Scarborough to inspect using the
HAT data for transportation and marsh migration
analyses…
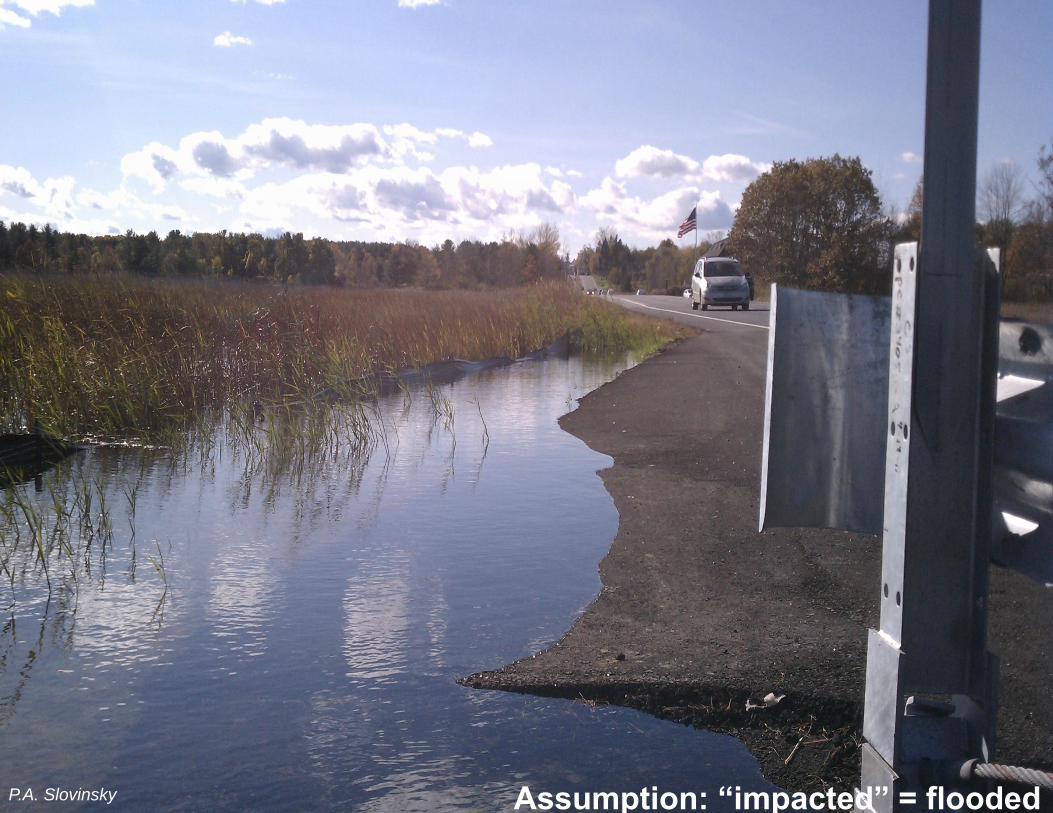
Assumption: “impacted” = flooded P.A. Slovinsky
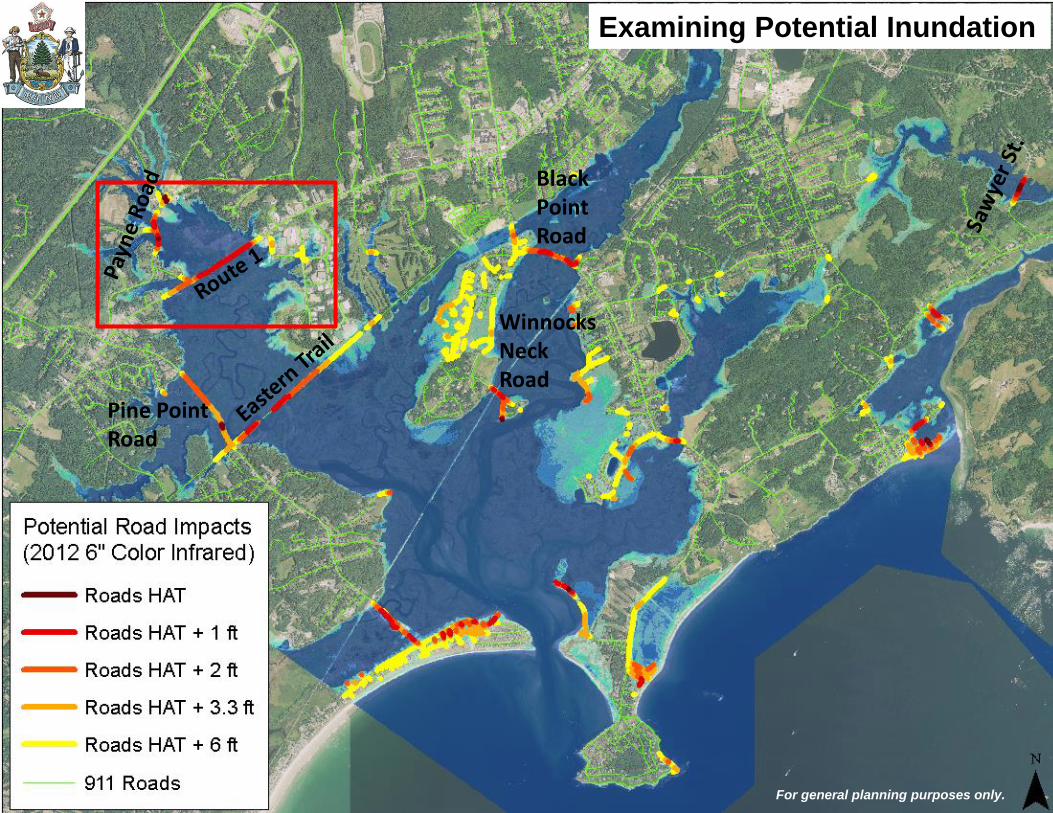
Black Point Road
Pine Point Road
Winnocks Neck Road
For general planning purposes only.
Examining Potential Inundation
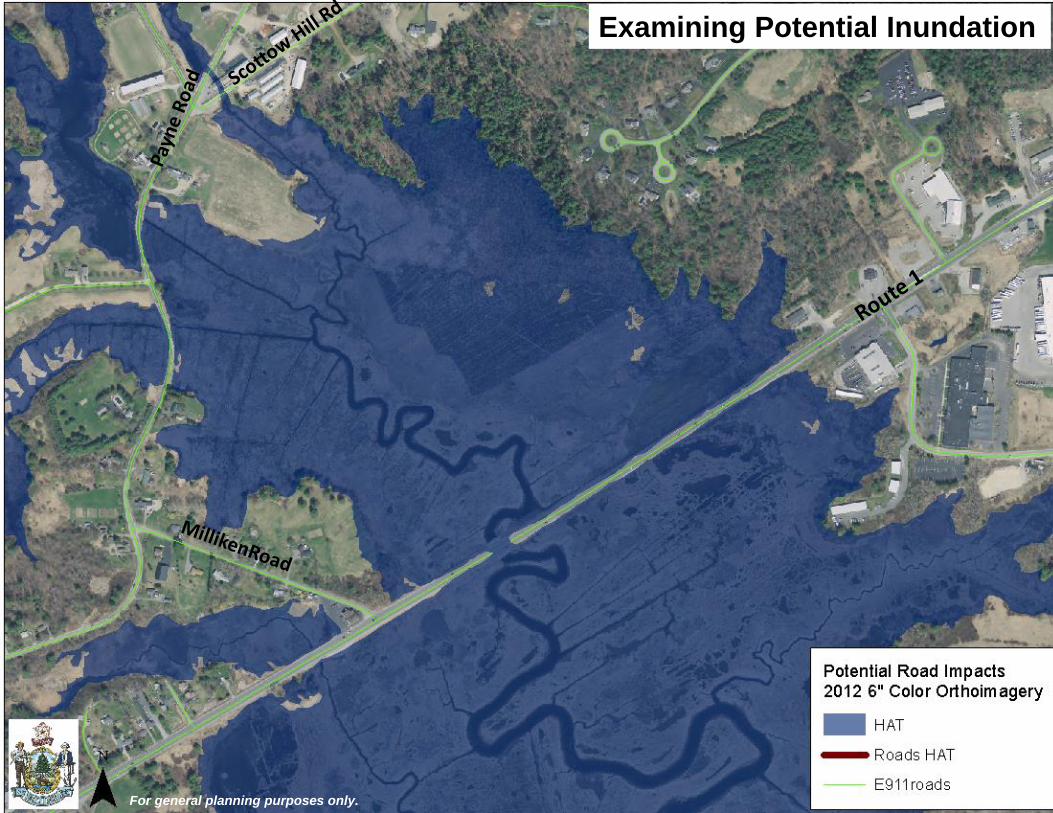
Examining Potential Inundation
For general planning purposes only.
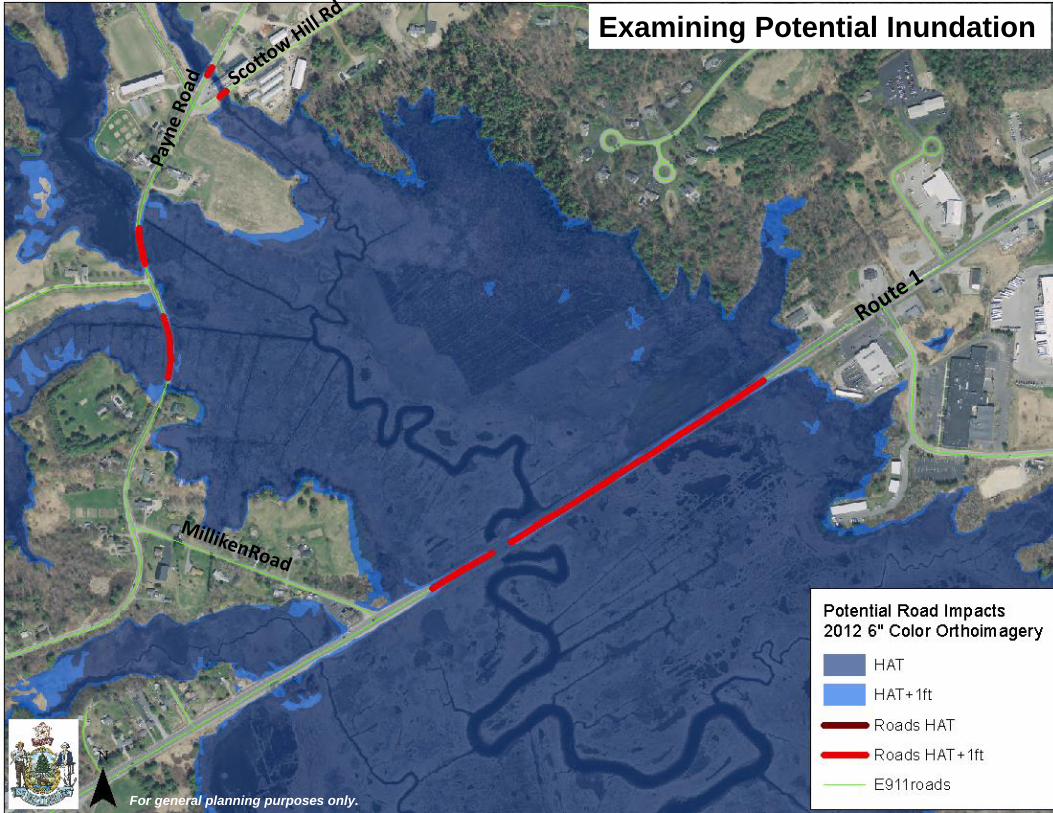
Examining Potential Inundation
For general planning purposes only.
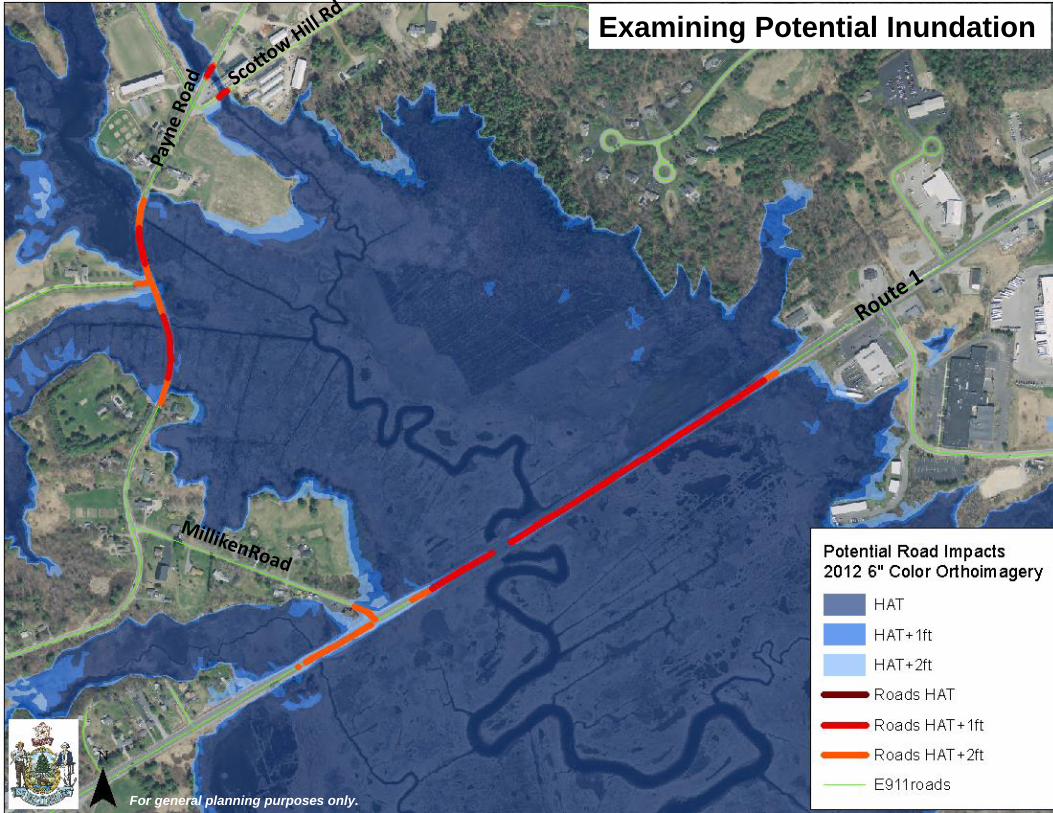
Examining Potential Inundation
For general planning purposes only.
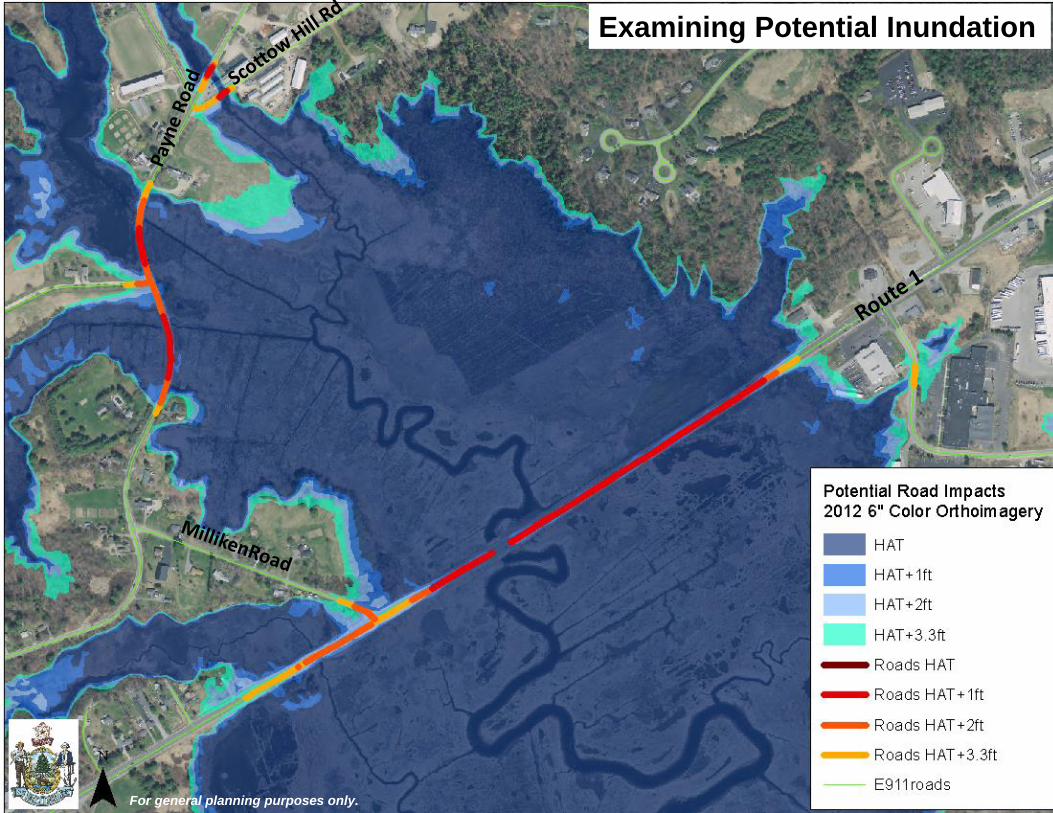
Examining Potential Inundation
For general planning purposes only.
Examining Potential Inundation
For general planning purposes only.
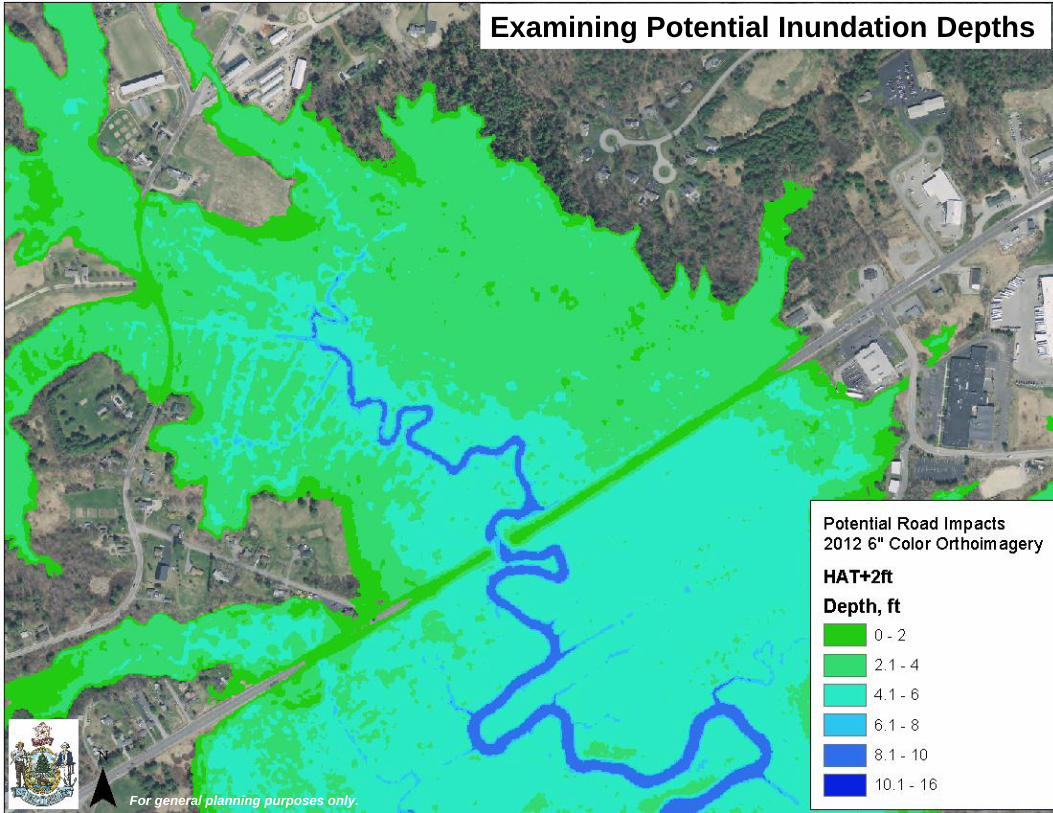
Examining Potential Inundation Depths
For general planning purposes only.

Distance along Transect (m
)
900
800
700
600
500
400
300
200
100
0
Pote
ntial D
epth
(ft)
8
7.5
7
6.5
6
5.5
5
4.5
4
3.5
3
2.5
2
1.5
1
0.5
0
Examining Potential Inundation Depths
For general planning purposes only.
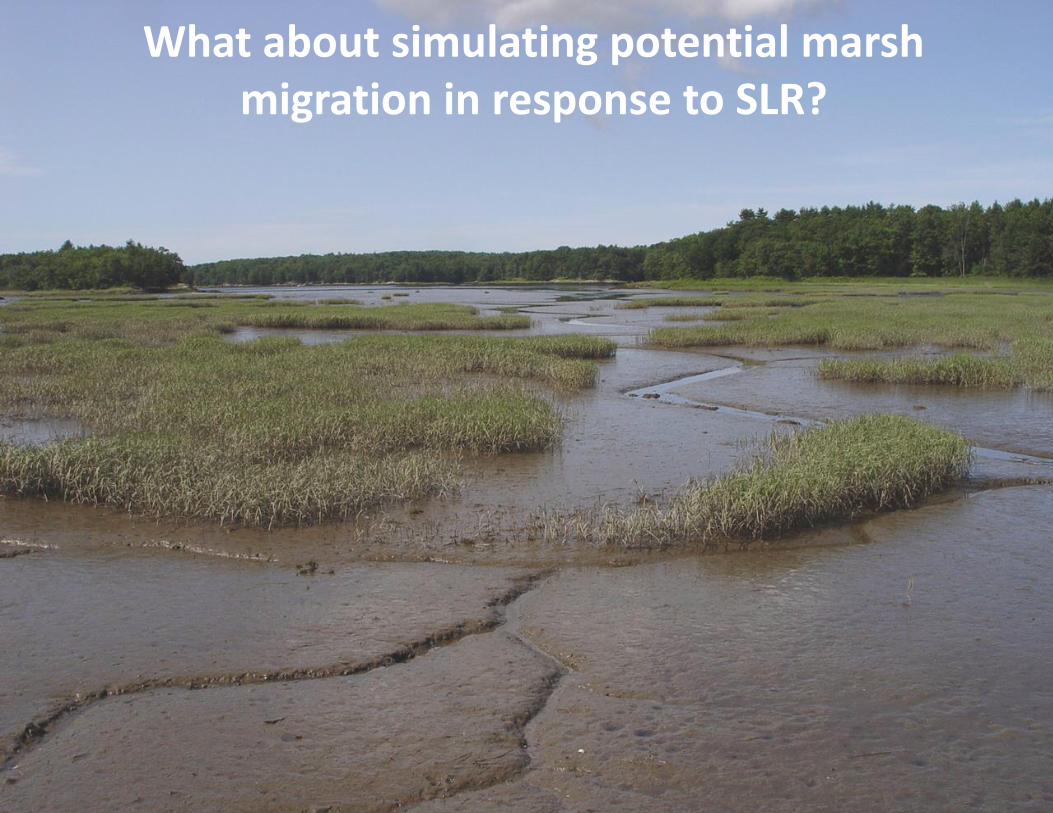
What about simulating potential marsh migration in response to SLR?
For general planning purposes only.
For general planning purposes only.
For general planning purposes only.
For general planning purposes only.
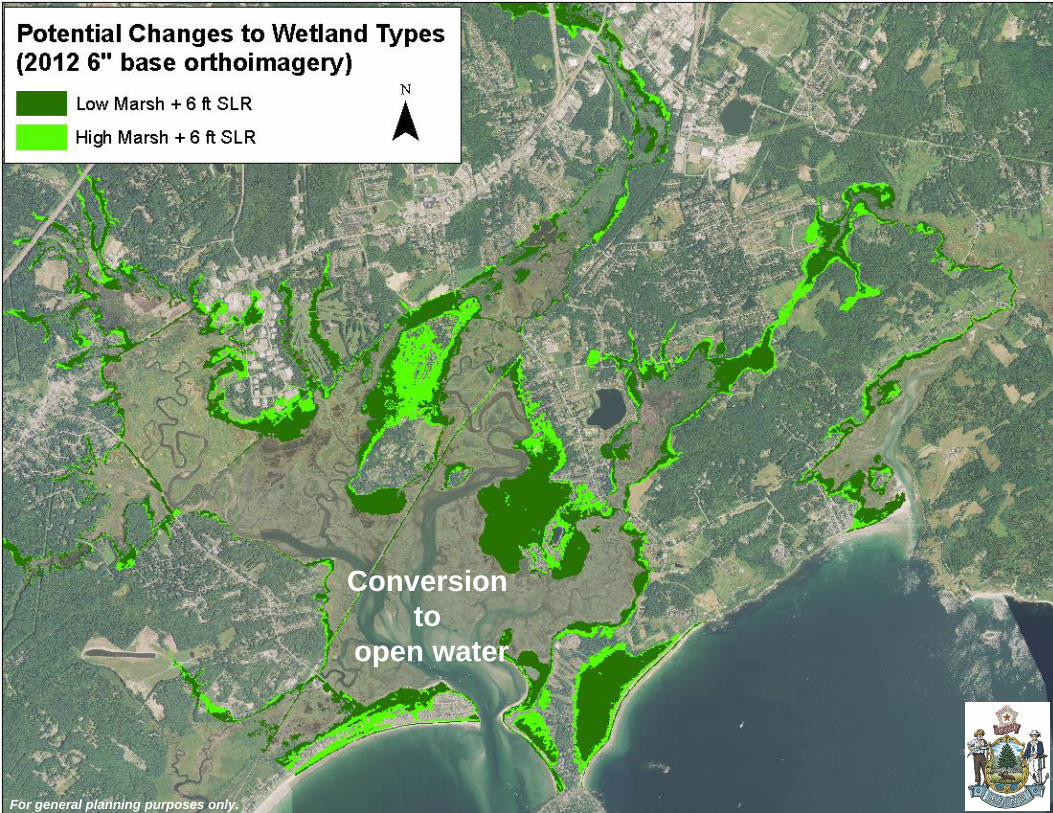
Conversion
to
open water
For general planning purposes only.
Highest Annual Tide Mapping…next steps
• Currently field verifying predicted adjusted tidal elevations at a variety of locations along the Maine coastline using RTK-GPS (for Shoreland Zoning purposes).
• Final QA/QC of the sea level rise/marsh migration/storm surge inundation layers.
• Release of a website and online mapping tool similar to the PHIM data with statewide data (existing conditions, 1, 2, 3.3 and 6 feet of SLR) layers in next few weeks.
What have communities done with these datasets?
38 coastal municipalities in 4 different counties have been engaged through either municipal or regional resiliency approaches using data created by the State.
Implementation of locally-derived and driven adaptation strategies:
Using LiDAR to derive Shoreland Zoning (Saco, OOB; soon all)
Changing Shoreland Zoning (3 ft above HAT, Cape Elizabeth)
Climate Change Adaptation Plan (Georgetown)
Hurricane Planning (Lincoln County)
Adapting critical infrastructure (Ogunquit)
Adapting historic infrastructure (Damariscotta)
Road infrastructure vulnerability (Saco Bay communities)
Increasing floodplain ordinance (Saco)
Comprehensive Plans (York, Bowdoinham, South Portland; underway in Biddeford, Old Orchard Beach)
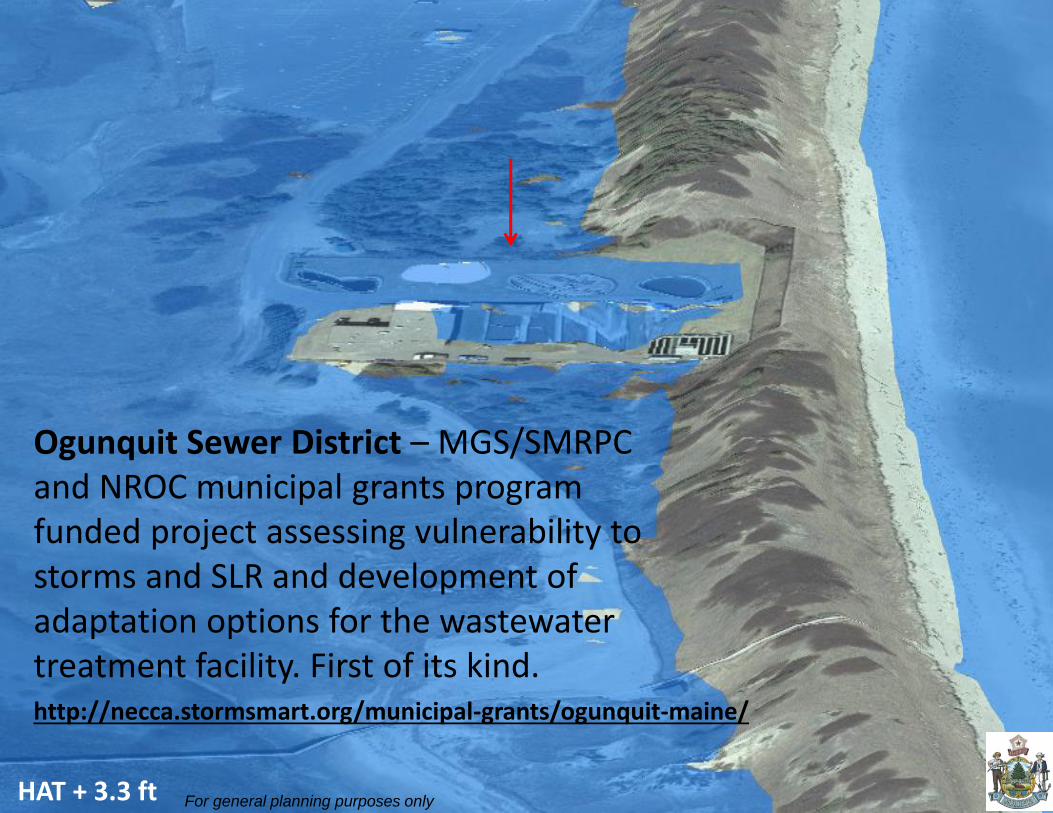
Ogunquit Sewer District – MGS/SMRPC and NROC municipal grants program funded project assessing vulnerability to storms and SLR and development of adaptation options for the wastewater treatment facility. First of its kind. http://necca.stormsmart.org/municipal-grants/ogunquit-maine/
HAT + 3.3 ft For general planning purposes only

Town of Damariscotta – MGS/LCRPC project led to a DACF funded project Adaptation Options to Protect Downtown Damariscotta, Maine Against Floods, Storm Surges, and Sea Level Rise. Under way.
For general planning purposes only HAT + 3.3 ft
For general planning purposes only
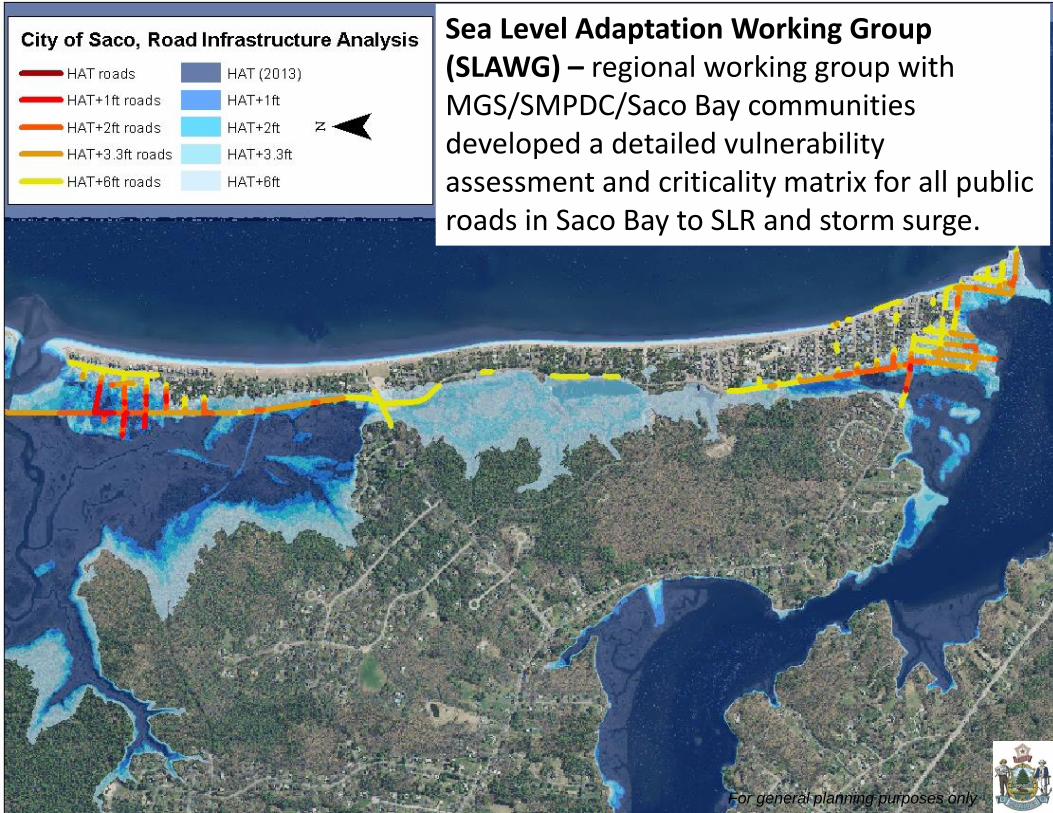
Sea Level Adaptation Working Group (SLAWG) – regional working group with MGS/SMPDC/Saco Bay communities developed a detailed vulnerability assessment and criticality matrix for all public roads in Saco Bay to SLR and storm surge.
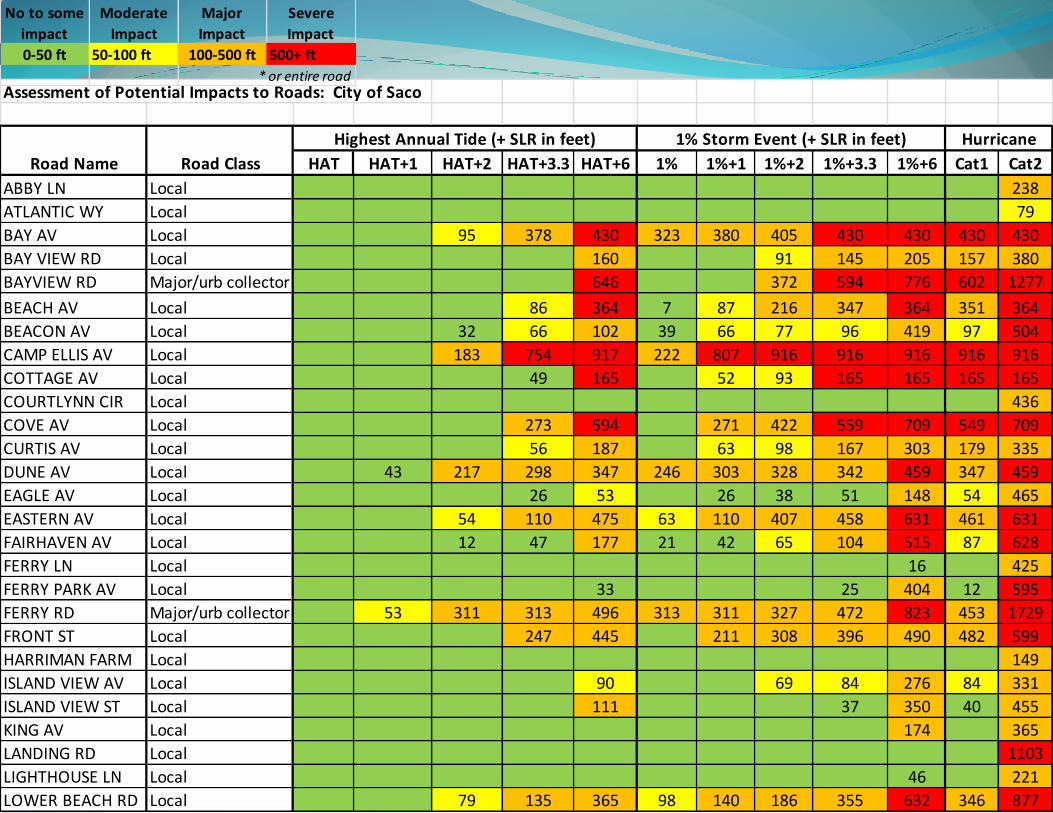
Assessment of Potential Impacts to Roads: City of Saco
HAT HAT+1 HAT+2 HAT+3.3 HAT+6 1% 1%+1 1%+2 1%+3.3 1%+6 Cat1 Cat2
ABBY LN Local 238
ATLANTIC WY Local 79
BAY AV Local 95 378 430 323 380 405 430 430 430 430
BAY VIEW RD Local 160 91 145 205 157 380
BAYVIEW RD Major/urb collector 646 372 594 776 602 1277
BEACH AV Local 86 364 7 87 216 347 364 351 364
BEACON AV Local 32 66 102 39 66 77 96 419 97 504
CAMP ELLIS AV Local 183 754 917 222 807 916 916 916 916 916
COTTAGE AV Local 49 165 52 93 165 165 165 165
COURTLYNN CIR Local 436
COVE AV Local 273 594 271 422 559 709 549 709
CURTIS AV Local 56 187 63 98 167 303 179 335
DUNE AV Local 43 217 298 347 246 303 328 342 459 347 459
EAGLE AV Local 26 53 26 38 51 148 54 465
EASTERN AV Local 54 110 475 63 110 407 458 631 461 631
FAIRHAVEN AV Local 12 47 177 21 42 65 104 515 87 628
FERRY LN Local 16 425
FERRY PARK AV Local 33 25 404 12 595
FERRY RD Major/urb collector 53 311 313 496 313 311 327 472 823 453 1729
FRONT ST Local 247 445 211 308 396 490 482 599
HARRIMAN FARM Local 149
ISLAND VIEW AV Local 90 69 84 276 84 331
ISLAND VIEW ST Local 111 37 350 40 455
KING AV Local 174 365
LANDING RD Local 1103
LIGHTHOUSE LN Local 46 221
LOWER BEACH RD Local 79 135 365 98 140 186 355 632 346 877
Road Name Road Class
Highest Annual Tide (+ SLR in feet) 1% Storm Event (+ SLR in feet) Hurricane
0-50 ft 50-100 ft 100-500 ft 500+ ft
* or entire road
No to some
impact
Major
Impact
Moderate
Impact
Severe
Impact
P.A. Slovinsky, MGS
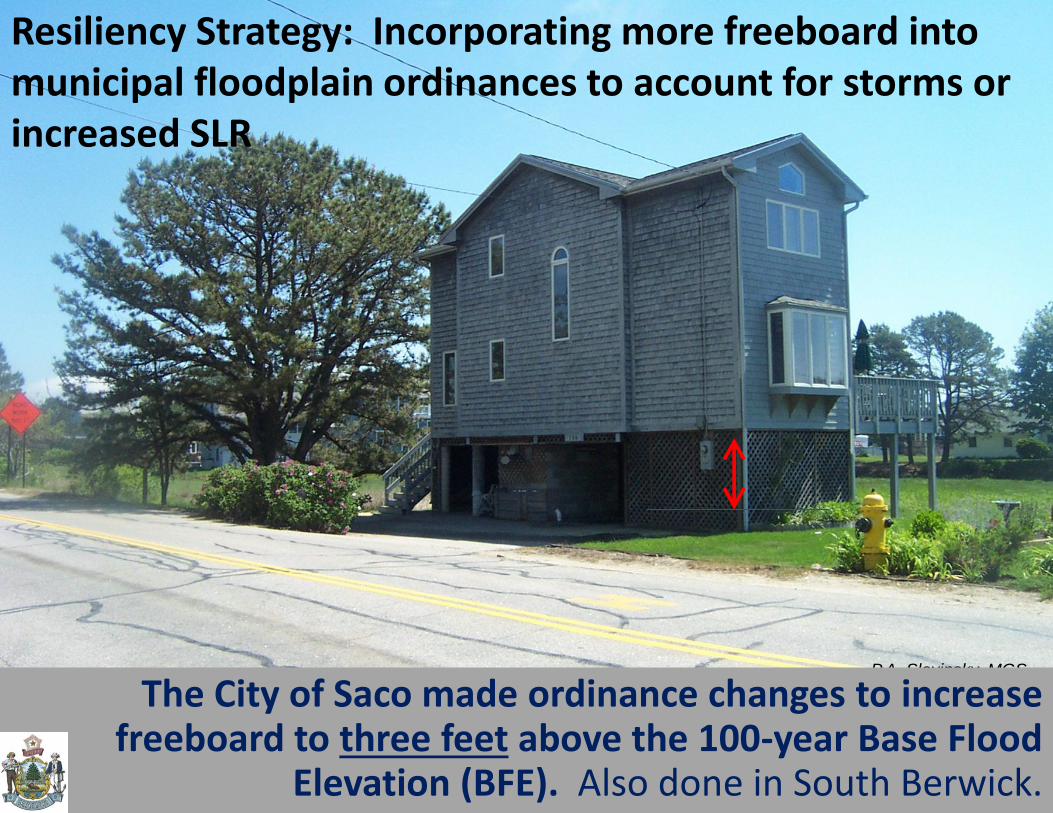
The City of Saco made ordinance changes to increase freeboard to three feet above the 100-year Base Flood
Elevation (BFE). Also done in South Berwick.
Resiliency Strategy: Incorporating more freeboard into municipal floodplain ordinances to account for storms or increased SLR
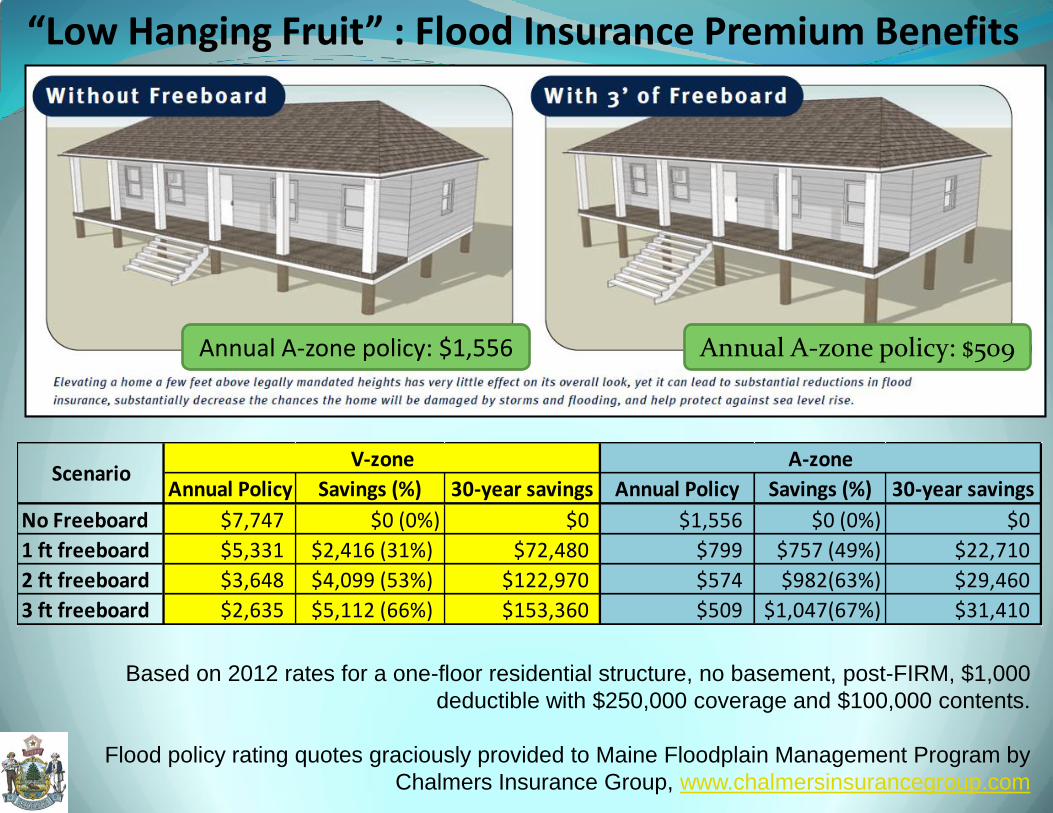
“Low Hanging Fruit” : Flood Insurance Premium Benefits
Based on 2012 rates for a one-floor residential structure, no basement, post-FIRM, $1,000
deductible with $250,000 coverage and $100,000 contents.
Flood policy rating quotes graciously provided to Maine Floodplain Management Program by
Chalmers Insurance Group, www.chalmersinsurancegroup.com
Annual Policy Savings (%) 30-year savings Annual Policy Savings (%) 30-year savings
No Freeboard $7,747 $0 (0%) $0 $1,556 $0 (0%) $0
1 ft freeboard $5,331 $2,416 (31%) $72,480 $799 $757 (49%) $22,710
2 ft freeboard $3,648 $4,099 (53%) $122,970 $574 $982(63%) $29,460
3 ft freeboard $2,635 $5,112 (66%) $153,360 $509 $1,047(67%) $31,410
ScenarioA-zoneV-zone
Annual A-zone policy: $1,556 Annual A-zone policy: $509
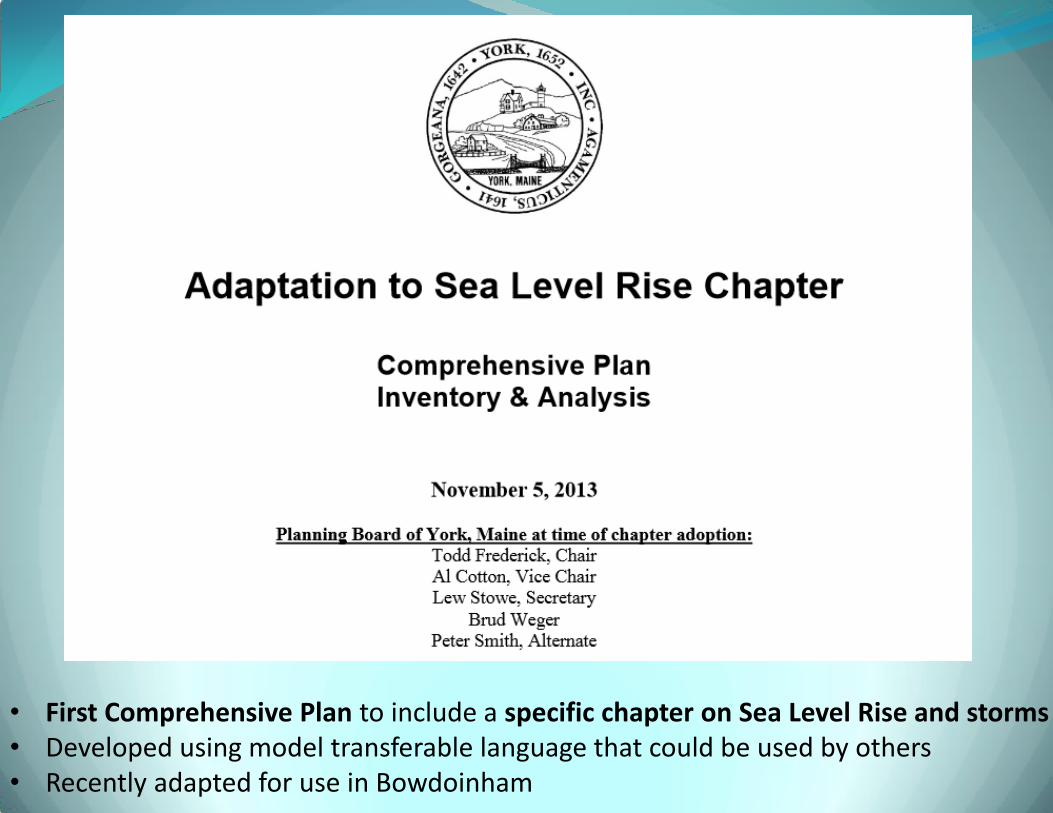
• First Comprehensive Plan to include a specific chapter on Sea Level Rise and storms • Developed using model transferable language that could be used by others • Recently adapted for use in Bowdoinham
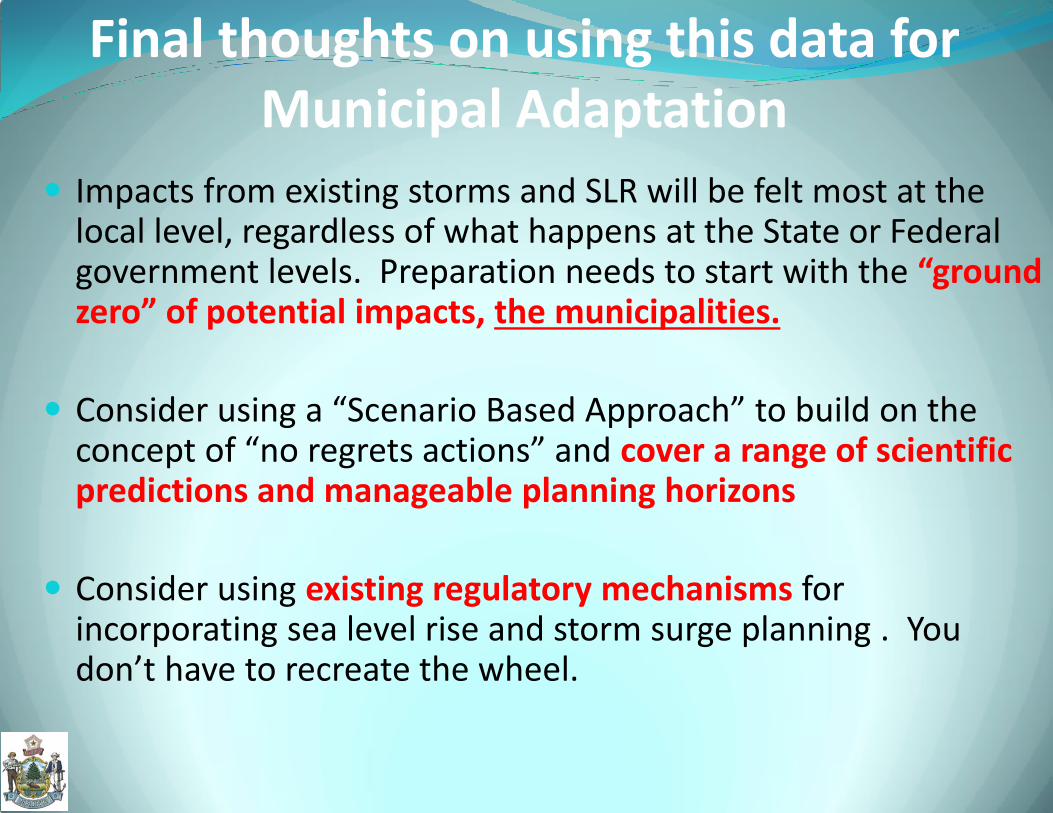
Final thoughts on using this data for Municipal Adaptation
Impacts from existing storms and SLR will be felt most at the local level, regardless of what happens at the State or Federal government levels. Preparation needs to start with the “ground zero” of potential impacts, the municipalities.
Consider using a “Scenario Based Approach” to build on the concept of “no regrets actions” and cover a range of scientific predictions and manageable planning horizons
Consider using existing regulatory mechanisms for incorporating sea level rise and storm surge planning . You don’t have to recreate the wheel.
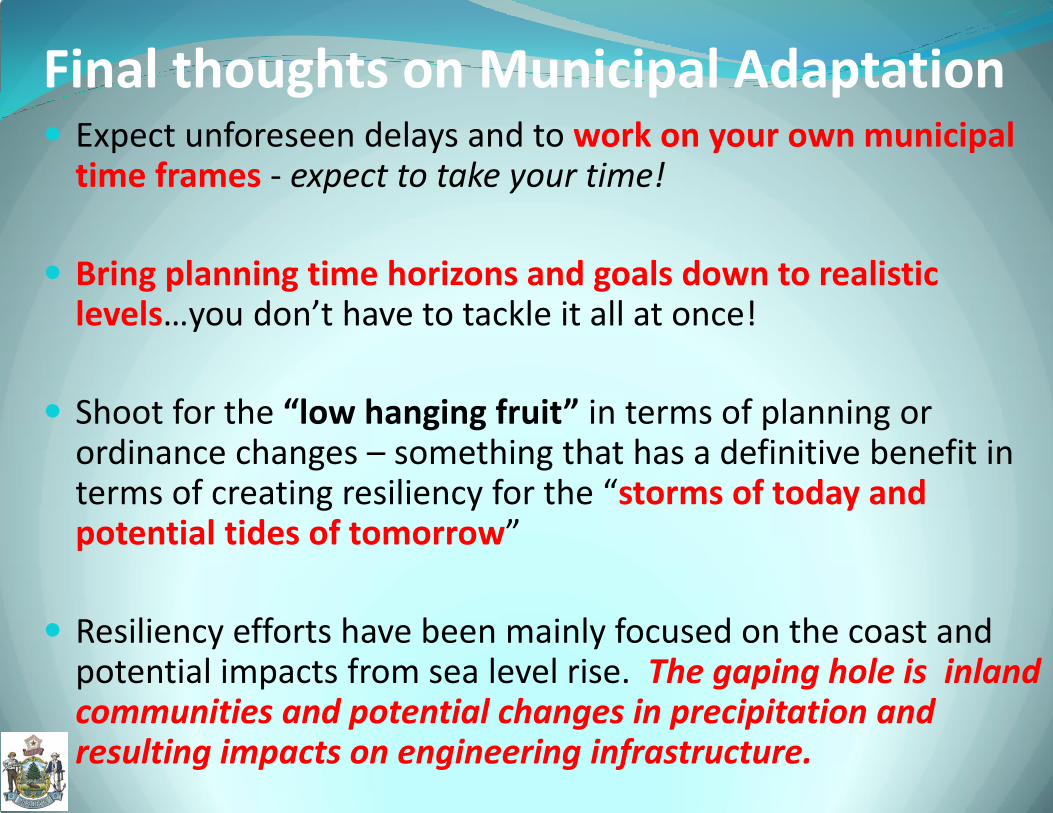
Expect unforeseen delays and to work on your own municipal time frames - expect to take your time!
Bring planning time horizons and goals down to realistic levels…you don’t have to tackle it all at once!
Shoot for the “low hanging fruit” in terms of planning or ordinance changes – something that has a definitive benefit in terms of creating resiliency for the “storms of today and potential tides of tomorrow”
Resiliency efforts have been mainly focused on the coast and potential impacts from sea level rise. The gaping hole is inland communities and potential changes in precipitation and resulting impacts on engineering infrastructure.
Final thoughts on Municipal Adaptation
Sea level rise and storm surge tools
and datasets supporting Municipal
Resiliency Peter Slovinsky, Marine Geologist Maine Geological Survey Department of Agriculture, Conservation and Forestry [email protected] (207) 287-7173