sea ranching trials for commercial production of …
TRANSCRIPT
FRDC FISHERIES RESEARCH & DEVELOPMENT CORPORATION
SEA RANCHING TRIALS FOR COMMERCIAL PRODUCTION
OF GREENLIP (HAL/OTIS LAEVIGATA) ABALONE IN
WESTERN A USTRALIA - PROJECT No. 2012/220 AN OUTLINE OF RESULTS FROM TRIALS CONDUCTED BY OCEAN GROWN ABALONE P TY LTD
Roy Melville-Smith, Brad Adams, Nicola J. Wilson & Louis Caccetta
University of Technology
Final Report
', ~:•":_-.>;_-'.<·i::···i;•_.,._;~,.. ... , .. ~,_.-}:,~ ,:_, <'· -~~·-.'. ... _~~--.., n __ t-,r.,i,'.)~~\ "~\!,· __ ,,}·_· .•. _::_·_:;',:-_~: ?:.,._·· . ' . ..~J·;'l~:;;~tt_~~~'-'?r;,.··/;~i:i,·~-'--,~J~.;.;_,,. .. ,,,,_~·.~·'?,.c" ··:·.':·/ >'°·:·: _·r:·:::·
Sei:r~n., .11 hg ·tr:i,1scfc:,·f.<cornme~cial;: r,tQ.(l~ct.iom·. ···· . e>f ~·r;~nlip (Hcllioti$ laevigat;) ;balon~ in
. ,:~ -- .·. .. . .
Western Australia ·•··' : .. , . ' :. -,".:,_ .... '
Project No. 2012/220
An outline of results from trials conducted by Ocean Grown Abalone Pty Ltd
Roy Melville-Smith, Brad Adams, Nicola J. Wilson & Louis Caccetta
University ofTechnology
June 2013
FRDC FISHERIES RESEARCH & DEVELOPMENT CORPORATlON
© June 2013; Fisheries Research and Development Corporation, Ocean Grown Abalone Pty Ltd and Curtin University.
This work is copyright. Except as permitted under the Copyright Act 1968 (Cth), no part of this publication may be reproduced by any process, electronic or otherwise, without the specific written permission of the copyright owners. Neither may information be stored electronically in any form whatsoever without such permission.
National Library of Australia Cataloguing-in-Publication entry
Authors: Melville-Smith, R. (Roy)1, author.
Roy Melville-Smith 1, Brad Adams, Nicola J. Wilson & Louis Caccetta.
Title: Sea ranching trials for commercial production of greenlip (Haliotis laevigata) abalone in Western Australia : an outline of results from trials conducted by Ocean Grown Abalone Pty Ltd / by Roy Melville-Smith, Brad Adams, Nicola J. Wilson & Louis Caccetta.
ISBN: 9780980333787 (paperback)
Subjects: Greenlip abalone--Western Australia. Mariculture--Western Australia Abalone fisheries--Western Australia--Management Fishery management--Western Australia
Other Authors/Contributors: Adams, Brad2, author. Wilson, Nicola J.3, author. Caccetta, Louis3, author. Ocean Grown Abalone Pty Ltd.
Dewey Number: 639.483209941
Disclaimer
The authors do not warrant that the information in this document is free from errors or omissions. The authors do not accept any form of liability, be it contractual, tortious, or otherwise, for the contents of this document or for any consequences arising from its use or any reliance placed upon it. The information, opinions and advice contained in this document may not relate, or be relevant, to a reader's particular circumstances. Opinions expressed by the authors are the individual opinions expressed by those persons and are not necessarily those of the publisher, research provider or the FRDC.
The Fisheries Research and Development Corporation plans, invests in, and manages fisheries research and development throughout Australia. It is a federal statutory authority jointly funded by the Australian Government and the fishing industry.
Produced and Printed entirely in Australia.
Cape to Cape Publishing, 50 Harvest Road, North Fremantle WA 6159, Australia http:// capetocape. 8m.com & [email protected]
Prepress and Printing in Western Australia by Print Front Cover: An eagle ray looks at the camera lens through one of the hollow block units on the abalone sea ranch in Flinders Bay, Augusta, Western Australia. The base of the block is covered with stocked greenlip abalone (photo: Simon Longbottom)
1 Curtin University, Department of Environment and Agriculture, GPO Box U1987, Perth WA6845 2 Ocean Grown Abalone Pty Ltd, PO Box 231 , Augusta WA6290 3 Curtin University, Department of Mathematics and Statistics, GPO Box U1987, Perth WA6845
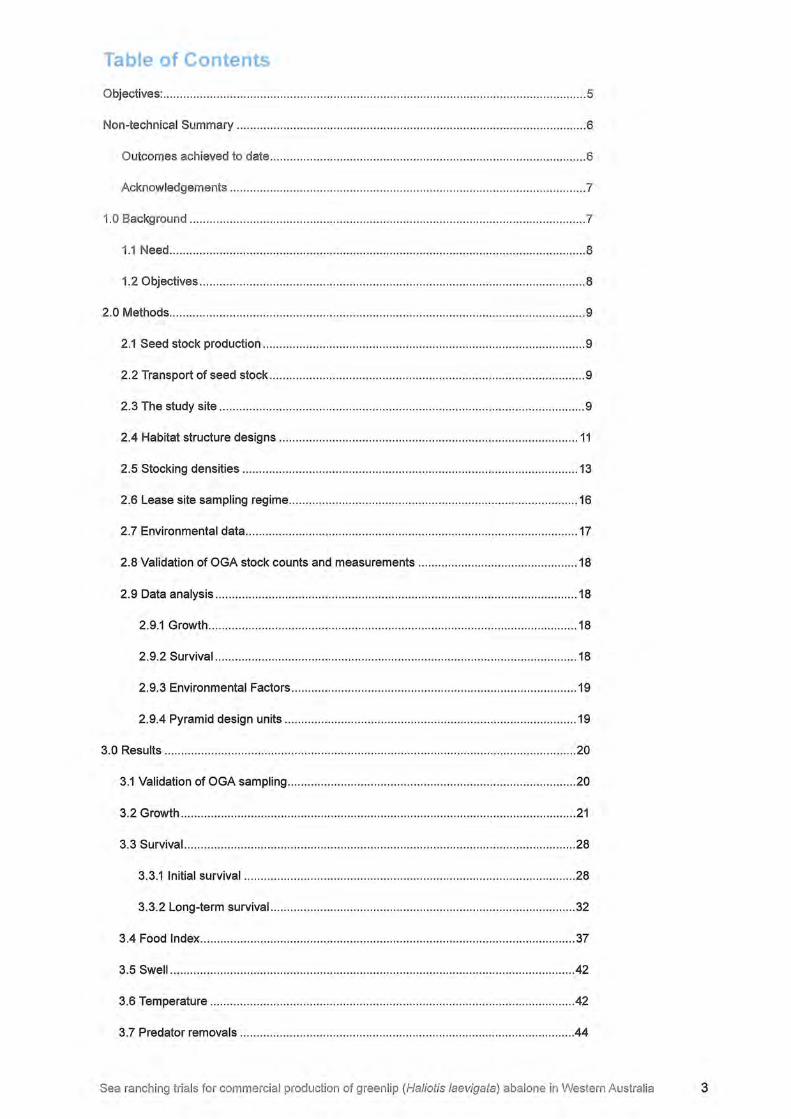
Table of Contents
Objectives: ...... ...... .. ... ...... .. ... ...... .. .... ........ .......... ........... .... ... ...... ... .... ...... ... .... ...... ...... .. ........ ... 5
Non-technical Summary ..... .. ..... ......................... ..... ... .. ........ ... ..... .. ....... .......... .... .. ... ............. . 6
Outcomes achieved to date ............. ....... ... .... .. .... ... ..... .......... ..... ...... .... ....... .............. .. .. .... 6
Acknowledgements ...... .. ...... ... .. ...... .......... ... ..... ......... ..... ........... ... ............. ...... ...... ........... 7
1.0 Background .... .... ... .... ...... ... ............. ......... ............ ... ... ... .... .. ......... ... ..... ..... ......... .... ....... .... 7
1.1 Need ..... ........... .... ... ... ...... ..... ...... .................... .... .......... ..... ... .. .. .... .... ........ ...... .... ...... ... . 8
1.2 Objectives .. ... .... ...................... ...... ............. ......... ...... ... .. .. .. ... .... ....... .. ..... ... ..... ...... .. .... . 8
2.0 Methods ........ ... ..... ........ ....... ... ...... .... ... ... ..... ...... ..... ..... ......... .. ... .. ... .. .... ...... .. ..... .. ...... .. ...... 9
2.1 Seed stock production ...... .. .............................. ...... .. ...... ... .. ....... ............. .. .......... ..... ... 9
2.2 Transport of seed stock .......... ....... ............... ..... .................. .. ...... ......... .. ........ ..... .... .... 9
2.3 The study site ... .. .. ... .. ... ............. ... ... .......... ........... ....... ............. .. ..... .... ..... .. .... ...... ....... 9
2.4 Habitat structure designs .... ............................... .... .. ... .. .... ..... ................................... 11
2.5 Stocking densities ........ ... ...... ....... .. ... .. ... .... .. ... .. ................. ... ................. .. ........ .. .... ... 13
2.6 Lease site sampling regime .. .......... ....... .. ....................... ... ....... .. ...... .......... ..... .......... 16
2.7 Environmental data .. ....... .. .... .. ...... ...................... ............ ... ........... ...... .. ................... .. 17
2.8 Validation of OGA stock counts and measurements ....... ....... .... ................ .. ... ......... 18
2.9 Data analysis ............. ..... .... .... .. ......... .... .. ......... ..... ... ............ ............. ......... .. ............. 18
2.9.1 Growth ... ....... ..... .. ....... ......... ....... ........... .... ........ .. ............................ .. ................ 18
2.9.2 Survival ....... .. .... ..... ............ ......... ... .. ......................... ......... .......... .. .... .... .... ....... 18
2.9.3 Environmental Factors .. ........... ......... ... ........... .. .................. .......................... .... 19
2.9.4 Pyramid design units ....... ....... ..... ..... .. ..... .... ................ .......... .. ... .. .................... 19
3.0 Results ....... ........ ...... ... .... ..... .......... .. ....... ........ ..... ....... ...... .. ........ ........ .. .... ..... ..... ..... ....... 20
3.1 Validation of OGA sampling ..... ... ................ ....... .. .. .. ..... ..... ..... .... ...... ..... .. ........ .. ........ 20
3.2 Growth ............ ....... ............ ...... .. ..... ... ... .... ..... .. .. .. ... .. .............. ..... .... ... ....... ..... ..... ..... . 21
3.3 Survival .... ........ ....... ... .... ............ .. ........ .. ....... ..... ... .... .. .... ... .... ... ... ....... ....................... 28
3.3.1 Initial survival .... ............... ......... ........... ....... ...... ...... .......... ... ............ ............... .. 28
3.3.2 Long-term survival ...... ..... ...... ......... .. ....... ....................... ........ .......... .. ........... ... 32
3.4 Food lndex ........ ... .. ..... .... ... ... .. ... .... .. .... ...... ... .. .... .... ....... .. .... .............. ........... .... ... ...... 37
3.5 Swell ..... ..... .. ...... ................. ....... .... .. .......... ......... ...... ... ...... ... ..... ..... ... ..... .. ............ .... . 42
3.6 Temperature ........ .. .... ..... .... ........... ... ....... ... .. ... .. ........ ... ........ ................ .............. ....... 42
3.7 Predator removals ........ .. ................... ... .. .... .. .... ...... ... ............ ... ...... ..... .............. ....... .44
Sea ranching trials for commercial production of greenlip (Haliotis /aevigata) abalone in Western Australia 3
3.8 Pyramid design units ................................................................................................. 45
3.8.1 Growth .............................................................................................................. .45
3.8.2 Survival ............................................................................................................ .46
4.0 Discussion ....................................................................................................................... 50
4.1 Validation ................................................................................................................... 50
4.2 Survival ...................................................................................................................... 50
4.3 Growth ....................................................................................................................... 52
4.4 Environmental data .................................................................................................... 54
4.5 Comparisons with other abalone enhancement and ranching studies ..................... 54
4.6 Using survival and growth rates from this study to estimate potential production .... 55
4.7 How applicable are these results to migrating from pilot to commercial scale? ....... 55
4.8 How applicable are these results to other study sites? ............................................. 56
5.0 Benefits and adoption ..................................................................................................... 56
6.0 Further Development ...................................................................................................... 57
7.0 Planned outcomes ........................................................................................................... 57
8.0 Conclusion ...................................................................................................................... 57
9.0 References ...................................................................................................................... 58
Appendix 1: Intellectual Property .......................................................................................... 60
Appendix 2: Staff ................................................................................................................... 60
4
2012/220 Sea ranching trials for commercial production of greenlip (Haliotis laevigata) abalone in Western Australia. An outline of results from trials conducted by Ocean Grown Abalone Pty Ltd
Principal Investigator: Brad Adams
Address:
Objectives:
Ocean Grown Abalone Pty Ltd P.O. Box 231 Augusta WA 6290
Telephone:041791 0023
1 To have sampling methods used in the enhancement trial independently validated
2 For data collected by the trial to be analysed and presented in a report suitable for peer review
Sea ranching trials for commercial production of greenlip (Haliotis /aevigata) abalone in Western Australia 5
Non-technical Summary
Outcomes achieved to date
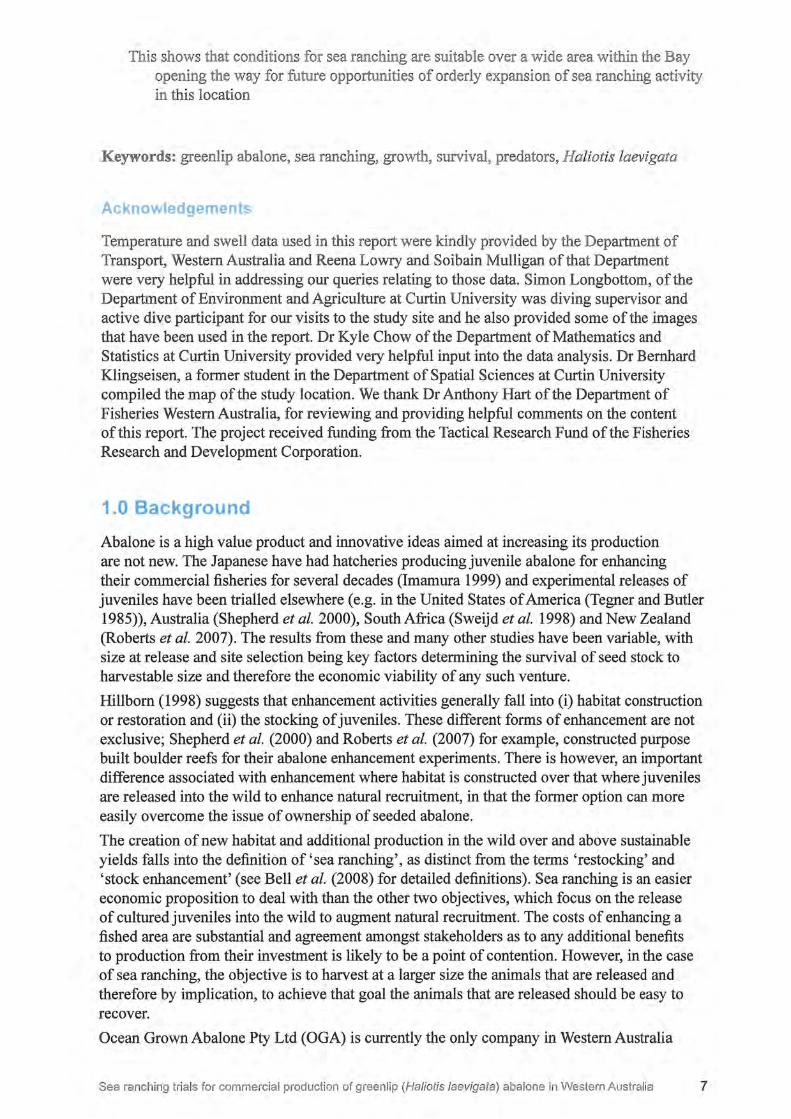
This project has provided information on the growth and survival of three different year classes of aquaculture-reared greenlip abalone seeded onto artificial reef structures. The results have revealed the commercial possibilities for sea ranching of abalone in Flinders Bay, Augusta, Western Australia.
The sea ranching trials reported here took place in Flinders Bay, Augusta, Western Australia, between late September 2011 and early January 2013.
Aquacultured greenlip abalone seed stock of three different year-classes and sizes [year-2 (-40 mm), year-3 (-70 mm) and year-4 (-90 mm)] were placed on ten different artificial habitat designs on lease sites spaced one to two kilometres apart in depths of 15 to 19 m. Stocking densities were not consistent on all habitat types. However, in general year-2 animals were stocked at -30 m-2, year-3 at -9 m-2 and year-4 at -3 m-2•
Growth increments were similar on all artificial habitat types and for the three R&D leases. When growth for the three year classes was integrated into a modelled growth curve, the projected growth was very similar to growth recorded by a different study for aquacultured greenlip abalone seeded in the wild fishery off Augusta in less intensively stocked numbers. For 2 to 5 year-old year classes, the age classes considered in this study, growih was -32 mm per year.
Survival characteristics were considered as initial survival (within weeks of seeding) and longterm survival ( over one year after seeding). Initial survival in this study was related to the age of the seed stock, to the habitat type and to the lease site. The 3 and 4-year old seed stock had an initial survival of 80-98% and 2-year olds 50-85%, depending on the lease site. One lease site had substantially lower initial survival rates compared to the other two leases, which would indicate that the stock seeded on this site may have been stressed in transit prior to release. Two habitat types had disproportionately low initial survival rates of 2-year old seed stock, which was attributable to their having been seeded by hand rather than with release units.
Long-term survival ranged from 80-95% for 2-year old, 85-95% for 3-year old and 75-95% for 4-year old seed stock depending on lease site. There were differences in the long-term survival rates for the three year classes on different habitat types on the three leases. However, these differences were clouded by the movement of seed stock between neighbouring habitat types.
Perhaps the most useful survival data in terms of using sea ranching trials to project the survival of seeded abalone from seeding as 2-year olds to 5+year olds, is the integrated survival data for the three year classes. That shows the survival after initial stocking and three subsequent years (i.e. 37 months) to be around 40 to 55%.
Overall, this sea ranching trial has produced very promising outcomes in terms of the potential for commercial scale production of greenlip abalone in Flinders Bay, Augusta. The key findings from this research were that:
• after an initial mortality phase, that with good management (including predator removal) mortality rates of 2 to 4-year old seed stock can be limited to as little as 5 to 10% a year
• that growth rates comparable with abalone in the wild environment can be achieved at relatively high stocking densities and the densities of 20-60 m-2 used in this study appear to be within the bounds of what can be supported by the habitat
• that growth and survival rates are similar in different lease sites within Flinders Bay.
6 Sea ranching trials for commercial production of greenl ip (Haliotis /aevigata) abalone in Western Australia
This shows that conditions for sea ranching are suitable over a wide area within the Bay opening the way for future opportunities of orderly expansion of sea ranching activity in this location
Keywords: greenlip abalone, sea ranching, growth, survival, predators, Haliotis laevigata
Acknowledgements
Temperature and swell data used in this report were kindly provided by the Department of Transport, Western Australia and Reena Lowry and Soibain Mulligan of that Department were very helpful in addressing our queries relating to those data. Simon Longbottom, of the Department of Environment and Agriculture at Curtin University was diving supervisor and active dive participant for our visits to the study site and he also provided some of the images that have been used in the report. Dr Kyle Chow of the Department of Mathematics and Statistics at Curtin University provided very helpful input into the data analysis. Dr Bernhard Klingseisen, a former student in the Department of Spatial Sciences at Curtin University compiled the map of the study location. We thank Dr Anthony Hart of the Department of Fisheries Western Australia, for reviewing and providing helpful comments on the content of this report. The project received funding from the Tactical Research Fund of the Fisheries Research and Development Corporation.
1.0 Background
Abalone is a high value product and innovative ideas aimed at increasing its production are not new. The Japanese have had hatcheries producing juvenile abalone for enhancing their commercial fisheries for several decades (Imamura 1999) and experimental releases of juveniles have been trialled elsewhere ( e.g. in the United States of America (Tegner and Butler 1985)), Australia (Shepherd et al. 2000), South Africa (Sweijd et al. 1998) and New Zealand (Roberts et al. 2007). The results from these and many other studies have been variable, with size at release and site selection being key factors determining the survival of seed stock to harvestable size and therefore the economic viability of any such venture.
Hillborn (1998) suggests that enhancement activities generally fall into (i) habitat construction or restoration and (ii) the stocking of juveniles. These different forms of enhancement are not exclusive; Shepherd et al. (2000) and Roberts et al. (2007) for example, constructed purpose built boulder reefs for their abalone enhancement experiments. There is however, an important difference associated with enhancement where habitat is constructed over that where juveniles are released into the wild to enhance natural recruitment, in that the former option can more easily overcome the issue of ownership of seeded abalone.
The creation of new habitat and additional production in the wild over and above sustainable yields falls into the definition of 'sea ranching', as distinct from the terms 'restocking' and 'stock enhancement' (see Bell et al. (2008) for detailed definitions). Sea ranching is an easier economic proposition to deal with than the other two objectives, which focus on the release of cultured juveniles into the wild to augment natural recruitment. The costs of enhancing a fished area are substantial and agreement amongst stakeholders as to any additional benefits to production from their investment is likely to be a point of contention. However, in the case of sea ranching, the objective is to harvest at a larger size the animals that are released and therefore by implication, to achieve that goal the animals that are released should be easy to recover.
Ocean Grown Abalone Pty Ltd (OGA) is currently the only company in Western Australia
Sea ranching trials for commercial production of greenlip (Haliotis laevigata) abalone in Western Australia 7
with an approved aquaculture licence for the purpose of commercial ranching of abalone. The licence has been granted by the Department of Fisheries Western Australia under Section 2 of the Fish Resources Management Act of 1994 and is for a 40.02 ha area in Flinders Bay, Augusta (Figure 1 ). Application has been made for a further two similar sized areas to the north west of the Main Lease (Figure 1). This application is currently being considered by the Department of Fisheries.
This report outlines the results from a one-year proof of concept trial that was undertaken between late 2011 to the start of 2013. As part of that trial, juvenile hatchery reared stock were placed into the marine environment on purposely designed concrete habitat modules in a location that was specifically selected as having the required biological and ecological requirements to optimise the natural growth of greenlip abalone.
OGA has been responsible for the deployment, seeding and regular monitoring of the habitat structures over the duration of the experiment. Curtin University has been responsible for validating the experimental sampling results, for the analysis of the data and for writing this report.
1.1 Need
Ocean Grown Abalone Pty Ltd is at the point of commercialising abalone ranching at the company's aquaculture lease site in Augusta, Western Australia. An important part of the commercialisation process is a commercial trial, currently underway, to determine:
• optimal type of habitat structure
• optimal size at release
• optimal density
• location (3 experimental sites within Flinders Bay at different depth & habitat profiles)
• compare & assess mortality % as related to above variables.
• compare & assess growth rates as related to the above variables.
The project is needed so that data collected during the duration of the survey can be analysed and collated in report suitable for peer review. The Company considers the peer review process as being a key step in upholding scientific rigor of the company's internal research activities. Third party validation (by Curtin University) of the company's data will assist in satisfying investor confidence in the way we are approaching our activities.
This project may revolutionise greenlip abalone aquaculture in Australia - there are no power costs, no feed costs, product quality is the same as 'wild-caught', capital costs are significantly lower and has comparatively lower operational costs compared with traditional land-based abalone aquaculture
1.2 Objectives
1 To have sampling methods used in the enhancement trial independently validated
2 For data collected by the trial to be analysed and presented in a report suitable for peer review
8 Sea ranching trials for commercial production of greenlip (Haliotis /aevigata) abalone in Western Australia
2.0 Methods
2.1 Seed stock production
Hatchery reared seed stock abalone were sourced from 888 Abalone Pty Ltd in Bremer Bay. These F l juveniles were the progeny of brood stock that had been collected as adults from Flinders Bay, close to the aquaculture site. Three different size classes (cohorts) of juvenile abalone were used in this grow-out trial: 2-year (- 40 mm shell length), 3-year (- 60 mm shell length) and 4-year (- 90 mm shell length). In the case of each cohort, the spawnings were from different parent brood stock.
Seed stock were held in tanks with the water supply pumped directly from the ocean and supplied at ambient temperature. The juveniles were held on cultured diatom nursery plates for approximately nine months, before being weaned onto commercial formulated feeds at approximately 15 mm shell length.
2.2 Transport of seed stock
Seed stock were transported on several different occasions from the hatchery at Bremer Bay to the Augusta study site. Stocking occurred over a prolonged period from 30 September through 16 December 2011.
On the day of transporting, the juvenile abalone were encouraged to detach from the substrate to which they were clinging by spraying surfaces with a strong salt solution. The detached abalone were then randomly placed into onion bags according to numbers allocated by the experimental design to be seeded to each habitat structure. Each bag was labelled with the type of habitat structure to which they were to be attached. The labelled onion bags were placed inside plastic oyster baskets stacked inside an insulated container that had recirculated chilled seawater spraying over the contents.
The journey from Bremer Bay to the study site at Augusta is approximately five hours. On arrival at Augusta, oyster baskets with the juvenile abalone were transported to the study site by boat for placement by divers onto the habitat structures.
The content of each onion bag was attached to the structure to which it had been allocated. In the case of the 2-year old year classes, the contents were emptied into different types of release modules similar in concept to those used by (McCormick et al. 1994) and the exits of the release modules were shut with shade cloth netting. The shade cloth was removed after two days to allow the abalone to move freely on the habit structure. Two habitat types (kerb and besser blocks, see below for description) had shapes which were not suitable for the attachment of release modules and in these cases the two year-old year juveniles were attached by hand.
Because of the size of release module necessary to contain year-3 and year-4 abalone, this type of release mechanism was found to be unsuitable. These year classes were therefore individually placed on the habitat structures by hand.
2.3 The study site
The aquaculture lease sites which are the focus of the sea ranching reported on in this study are located in Flinders Bay outside the town of Augusta (Figure 1). Greenlip abalone are generally distributed shallower than 40 m and southwards of Cape Naturaliste and given that Flinders Bay is approximately 100 km south of Cape N aturaliste, the wild stocks of greenlip abalone in this area are towards the north- and westernmost distribution of the species along the Western Australian coast.
Flinders Bay covers a large area, all generally shallower than 20 m. The southern part of
Sea ranching trials for commercial production of greenlip (Haliotis /aevigata) abalone in Western Austra lia 9
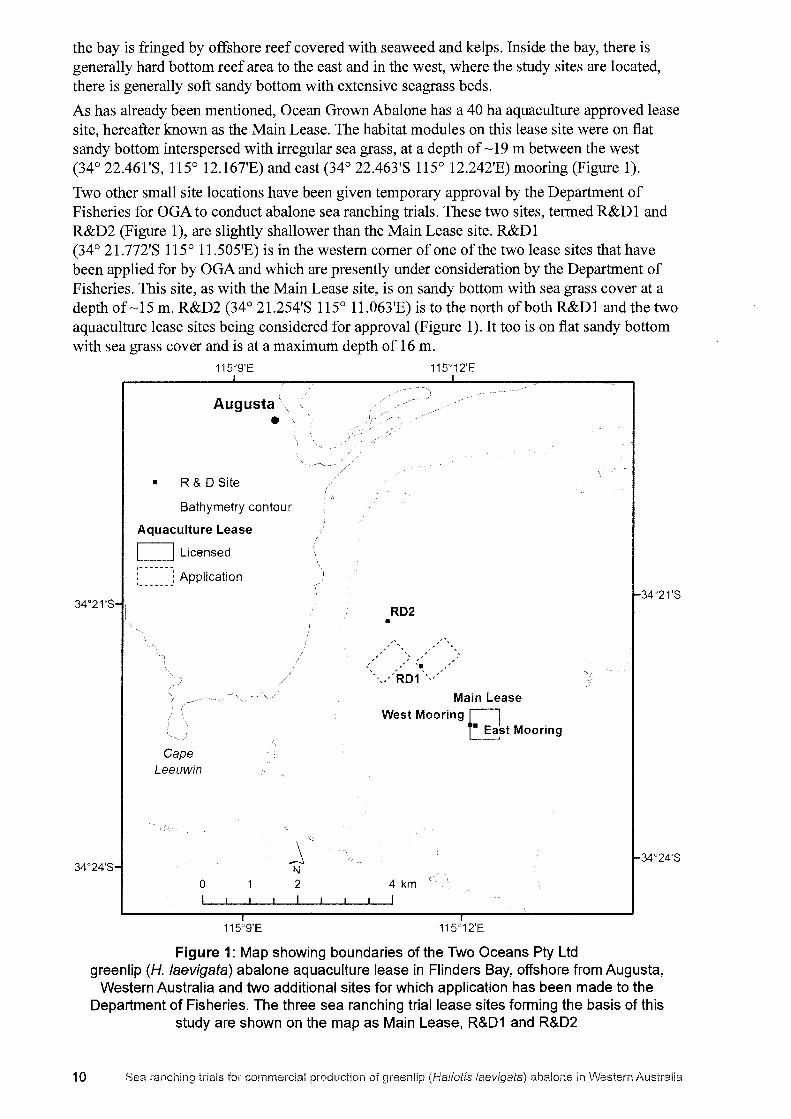
the bay is fringed by offshore reef covered with seaweed and kelps. Inside the bay, there is generally hard bottom reef area to the east and in the west, where the study sites are located, there is generally soft sandy bottom with extensive seagrass beds.
As has already been mentioned, Ocean Grown Abalone has a 40 ha aquaculture approved lease site, hereafter known as the Main Lease. The habitat modules on this lease site were on flat sandy bottom interspersed with irregular sea grass, at a depth of -19 m between the west (34° 22.461'S, 115° 12.167'E) and east (34° 22.463'S 115° 12.242'E) mooring (Figure 1).
Two other small site locations have been given temporary approval by the Department of Fisheries for OGA to conduct abalone sea ranching trials. These two sites, termed R&D 1 and R&D2 (Figure 1 ), are slightly shallower than the Main Lease site. R&D 1 (34 ° 21. 772'S 115° 1 l .505'E) is in the western comer of one of the two lease sites that have been applied for by OGA and which are presently under consideration by the Department of Fisheries. This site, as with the Main Lease site, is on sandy bottom with sea grass cover at a depth of-15 m. R&D2 (34° 2I.254'S 115° 1I.063'E) is to the north of both R&Dl and the two aquaculture lease sites being considered for approval (Figure 1 ). It too is on flat sandy bottom with sea grass cover and is at a maximum depth of 16 m.
34°21'S
34"24'S
115°9'E
Augusta
•
• R& 0Site
Bathymetry contour
Aquaculture Lease
D Licensed
r----· 1 Application ................
Cape Leeuwin o •
i~ 0
\
115°9'E
N 2
115°12'E
RD2 •
,, ,,, ,,'' '·,,
'',.",, .... ~ ; ,' ,'
.,,' .... ,, '·,,,,',RD1 ',,,,,
Main Lease West Mooring LI
~st Mooring
115°12'E
Figure 1: Map showing boundaries of the Two Oceans Pty Ltd
34•21·s
34"24'S
greenlip (H. /aevigata) abalone aquaculture lease in Flinders Bay, offshore from Augusta, Western Australia and two additional sites for which application has been made to the
Department of Fisheries. The three sea ranching trial lease sites forming the basis of this study are shown on the map as Main Lease, R&D1 and R&D2
10 Sea ranching trials for commercial production of greenlip (Haliotis laevigata) abalone in Western Australia
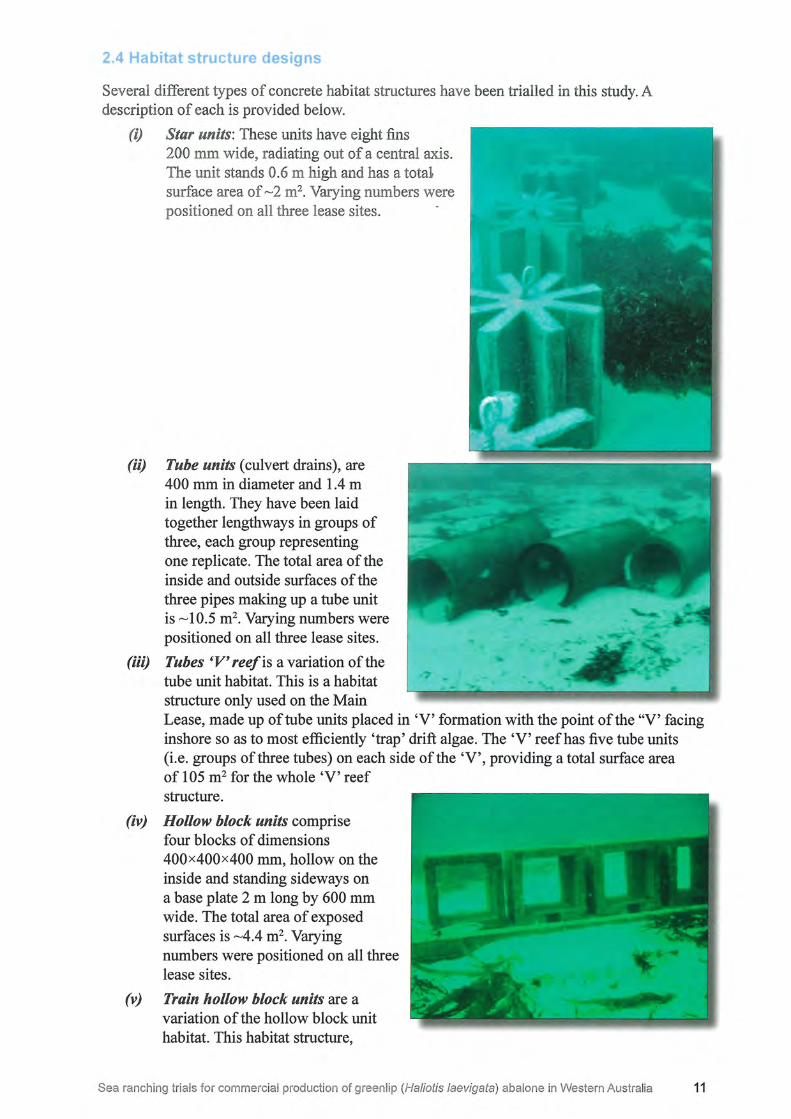
2.4 Habitat structure designs
Several different types of concrete habitat structures have been trialled in this study. A description of each is provided below.
(i) Star units: These units have eight fins 200 mm wide, radiating out of a central axis. The unit stands 0.6 m high and has a tota1 surface area of - 2 m2• Varying numbers were positioned on all three lease sites.
(ii) Tube units ( culvert drains), are 400 mm in diameter and 1.4 m in length. They have been laid together lengthways in groups of three, each group representing one replicate. The total area of the inside and outside surfaces of the three pipes making up a tube unit is -10.5 m2• Varying numbers were positioned on all three lease sites.
(iii) Tubes 'V' reef is a variation of the tube unit habitat. This is a habitat structure only used on the Main
; ..
Lease, made up of tube units placed in 'V' formation with the point of the "V' facing inshore so as to most efficiently 'trap' drift algae. The 'V' reef has five tube units (i.e. groups of three tubes) on each side of the 'V', providing a total surface area of 105 m2 for the whole 'V' reef structure.
(iv) Hollow block units comprise four blocks of dimensions 400x400x400 mm, hollow on the inside and standing sideways on a base plate 2 m long by 600 mm wide. The total area of exposed surfaces is -4.4 m2• Varying numbers were positioned on all three lease sites.
(v) Train hollow block units are a variation of the hollow block unit habitat. This habitat structure,
Sea ranch ing trials for commercial production of greenlip (Haliotis /aevigata) abalone in Western Austra lia 11
only used on the Main Lease, is made up of square units placed in line formation approximately O - 10 cm apart. The line on the Main Lease comprised of 10 hollow block units placed in a roughly east-west direction to 'trap' drift algae being washed inshore. The Main Lease was the only site to have a train hollow block unit.
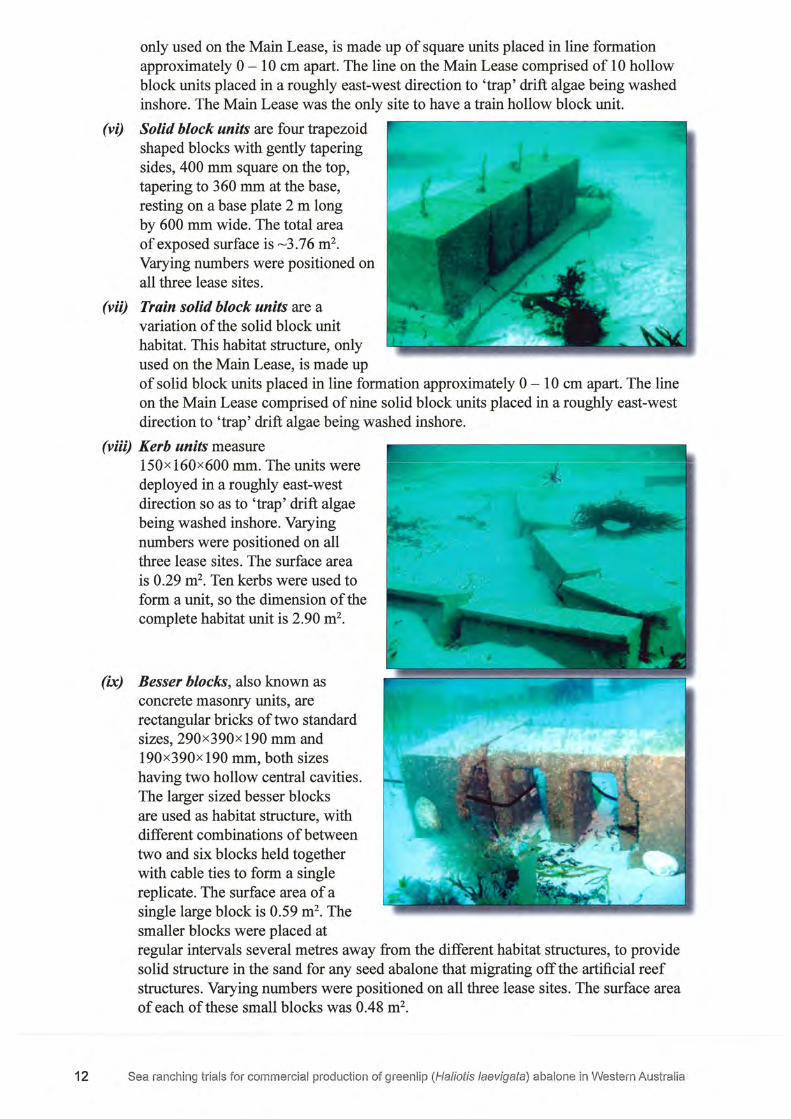
(vi) Solid block units are four trapezoid shaped blocks with gently tapering sides, 400 mm square on the top, tapering to 360 mm at the base, resting on a base plate 2 m long by 600 mm wide. The total area of exposed surface is -3.76 m2•
Varying numbers were positioned on all three lease sites.
(vii) Train solid block units are a variation of the solid block unit habitat. This habitat structure, only used on the Main Lease, is made up of solid block units placed in line formation approximately O - 10 cm apart. The line on the Main Lease comprised of nine solid block units placed in a roughly east-west direction to 'trap' drift algae being washed inshore.
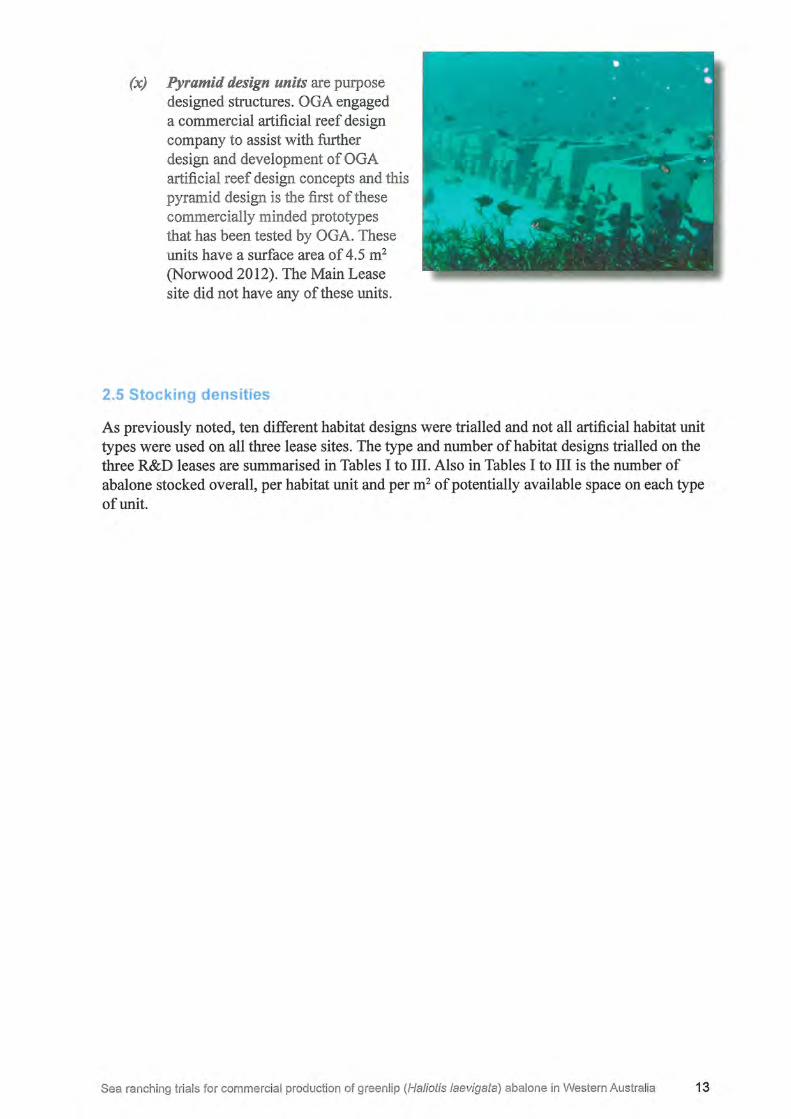
(viii) Kerb units measure 150xl60x600 mm. The units were deployed in a roughly east-west direction so as to 'trap' drift algae being washed inshore. Varying numbers were positioned on all three lease sites. The surface area is 0.29 m2• Ten kerbs were used to form a unit, so the dimension of the complete habitat unit is 2.90 m2•
(ix) Besser blocks, also known as concrete masonry units, are rectangular bricks of two standard sizes, 290x390x190 mm and 190x390x 190 mm, both sizes having two hollow central cavities. The larger sized besser blocks are used as habitat structure, with different combinations of between two and six blocks held together with cable ties to form a single replicate. The surface area of a single large block is 0.59 m2• The smaller blocks were placed at regular intervals several metres away from the different habitat structures, to provide solid structure in the sand for any seed abalone that migrating off the artificial reef structures. Varying numbers were positioned on all three lease sites. The surface area of each of these small blocks was 0.48 m2•
12 Sea ranching trials for commercial production of greenlip (Haliotis laevigata) abalone in Western Australia
(x) Pyramid design units are purpose designed structures. OGA engaged a commercial artificial reef design company to assist with further design and development of OGA artificial reef design concepts and this pyramid design is the first of these commercially minded prototypes that has been tested by OGA. These units have a surface area of 4.5 m2
(Norwood 2012). The Main Lease site did not have any of these units.
2.5 Stocking densities
As previously noted, ten different habitat designs were trialled and not all artificial habitat unit types were used on all three lease sites. The type and number of habitat designs trialled on the three R&D leases are summarised in Tables I to III. Also in Tables I to III is the number of abalone stocked overall, per habitat unit and per m2 of potentially available space on each type of unit.
Sea ranching trials for commercial production of greenlip (Ha/iotis /aevigata) abalone in Western Australia 13
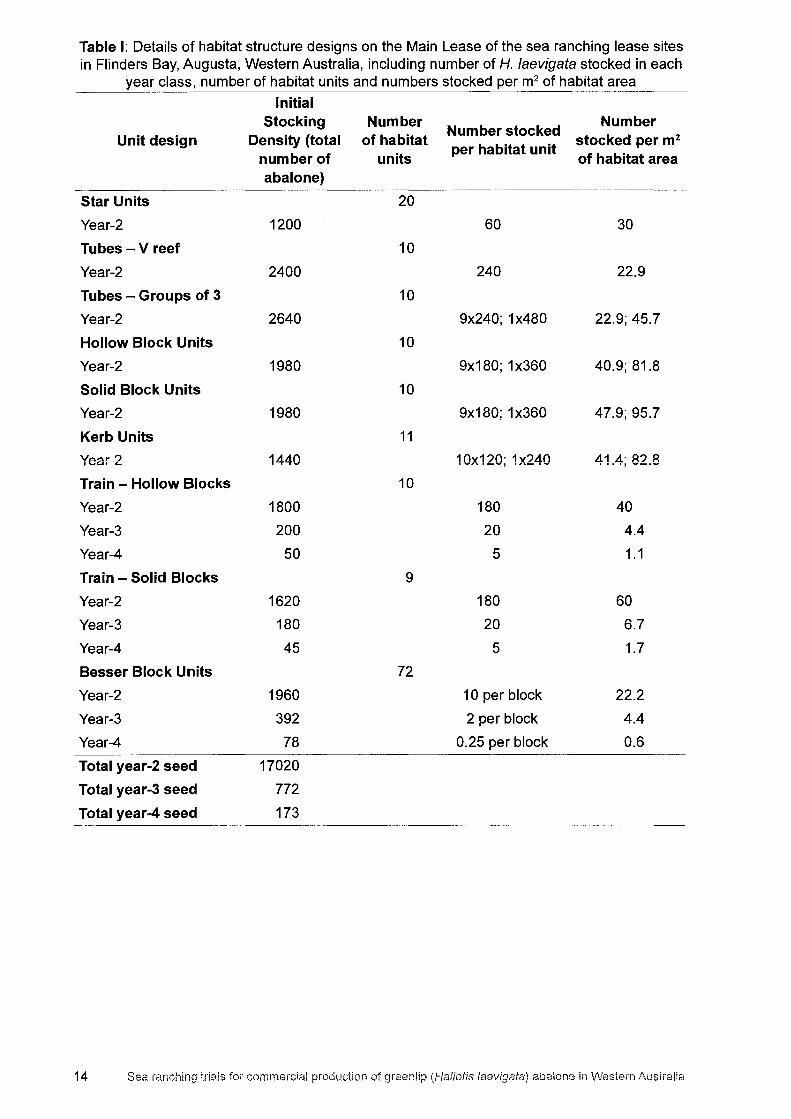
Table I: Details of habitat structure designs on the Main Lease of the sea ranching lease sites in Flinders Bay, Augusta, Western Australia, including number of H. laevigata stocked in each
year class, number of habitat units and numbers stocked per m2 of habitat area
Initial Stocking Number
Number stocked Number
Unit design Density (total of habitat per habitat unit
stocked per m2
number of units of habitat area abalone)
Star Units 20
Year-2 1200 60 30
Tubes - V reef 10
Year-2 2400 240 22.9
Tubes - Groups of 3 10
Year-2 2640 9x240; 1x480 22.9; 45.7
Hollow Block Units 10
Year-2 1980 9x180; 1x360 40.9; 81.8
Solid Block Units 10
Year-2 1980 9x180; 1x360 47.9; 95.7
Kerb Units 11
Year-2 1440 10x120; 1x240 41.4; 82.8
Train - Hollow Blocks 10
Year-2 1800 180 40
Year-3 200 20 4.4
Year-4 50 5 1.1
Train - Solid Blocks 9
Year-2 1620 180 60
Year-3 180 20 6.7
Year-4 45 5 1.7
Besser Block Units 72
Year-2 1960 10 per block 22.2
Year-3 392 2 per block 4.4
Year-4 78 0.25 per block 0.6
Total year-2 seed 17020
Total year-3 seed 772
Total year-4 seed 173
14 Sea cor11mercial
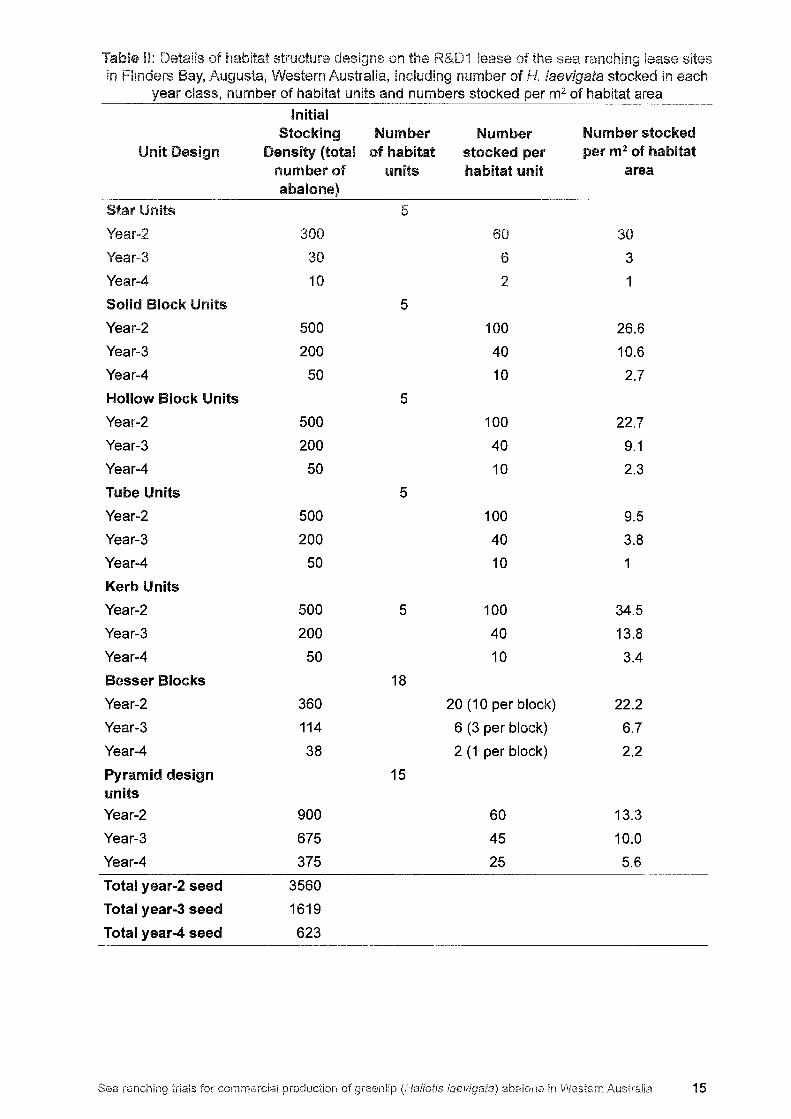
Table II: Details of habitat structure designs on the R&D1 lease of the sea ranching lease sites in Flinders Bay, Augusta, Western Australia, including number of H. laevigata stocked in each
year class, number of habitat units and numbers stocked per m2 of habitat area
Initial Stocking Number Number Number stocked
Unit Design Density (total of habitat stocked per per m2 of habitat number of units habitat unit area abalone)
Star Units 5
Year-2 300 60 30
Year-3 30 6 3
Year-4 10 2 1
Solid Block Units 5
Year-2 500 100 26.6
Year-3 200 40 10.6
Year-4 50 10 2.7
Hollow Block Units 5
Year-2 500 100 22.7
Year-3 200 40 9.1
Year-4 50 10 2.3
Tube Units 5
Year-2 500 100 9.5
Year-3 200 40 3.8
Year-4 50 10 1
Kerb Units
Year-2 500 5 100 34.5
Year-3 200 40 13.8
Year-4 50 10 3.4
Besser Blocks 18
Year-2 360 20 (10 per block) 22.2
Year-3 114 6 (3 per block) 6.7
Year-4 38 2 (1 per block) 2.2
Pyramid design 15 units
Year-2 900 60 13.3
Year-3 675 45 10.0
Year-4 375 25 5.6
Total year-2 seed 3560
Total year-3 seed 1619
Total year-4 seed 623
Sea ranching trials for commercial production of greenlip (Haliotis laevigata) abalone in Western Australia 15
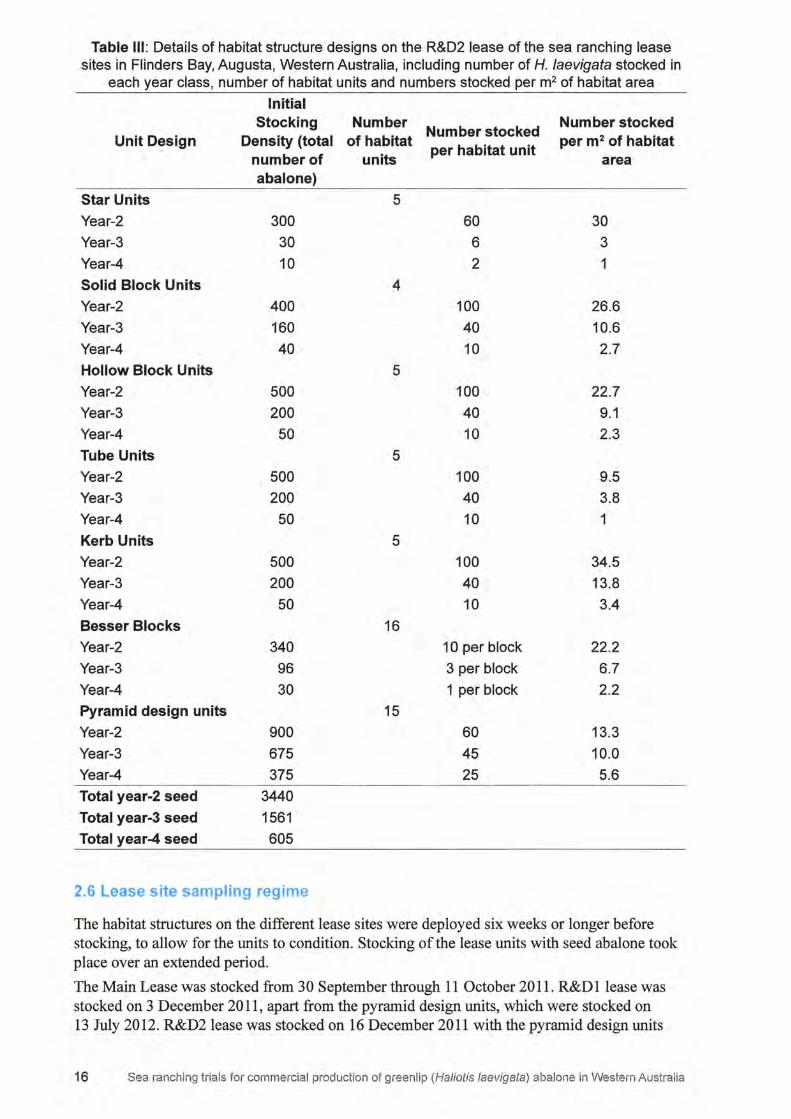
Table Ill: Details of habitat structure designs on the R&D2 lease of the sea ranching lease sites in Flinders Bay, Augusta, Western Australia, including number of H. /aevigata stocked in
each year class, number of habitat units and numbers stocked per m2 of habitat area
Initial Stocking Number
Number stocked Number stocked
Unit Design Density {total of habitat per habitat unit
per m2 of habitat number of units area abalone)
Star Units 5
Year-2 300 60 30
Year-3 30 6 3
Year-4 10 2 1
Solid Block Units 4
Year-2 400 100 26.6
Year-3 160 40 10.6
Year-4 40 10 2.7
Hollow Block Units 5
Year-2 500 100 22.7
Year-3 200 40 9.1
Year-4 50 10 2.3
Tube Units 5
Year-2 500 100 9.5
Year-3 200 40 3.8
Year-4 50 10 1
Kerb Units 5
Year-2 500 100 34.5
Year-3 200 40 13.8
Year-4 50 10 3.4
Besser Blocks 16
Year-2 340 10 per block 22.2
Year-3 96 3 per block 6.7
Year-4 30 1 per block 2.2
Pyramid design units 15
Year-2 900 60 13.3
Year-3 675 45 10.0
Year-4 375 25 5.6
Total year-2 seed 3440 Total year-3 seed 1561
Total year-4 seed 605
2.6 Lease site sampling regime
The habitat structures on the different lease sites were deployed six weeks or longer before stocking, to allow for the units to condition. Stocking of the lease units with seed abalone took place over an extended period.
The Main Lease was stocked from 30 September through 11 October 2011. R&D 1 lease was stocked on 3 December 2011, apart from the pyramid design units, which were stocked on 13 July 2012. R&D2 lease was stocked on 16 December 2011 with the pyramid design units
16 Sea ranching trials for commercial production of greenlip (Haliotis laevigata) abalone in Western Australia
stocked separately on 13 July 2012. We have referred to stock sizes at this point in time as being the initial stock size on each R&D lease.
The main focus of this study, being the monitoring of long-term growth and survival of the seed stock, began in early January 2012 and went through to early January 2013. Sampling took place at quarterly intervals, thereby providing an estimate of the number of seed abalone at the start of the experiment and four quarterly estimates of the number surviving on each of the habitat types on each lease site.
The first estimate of seed stock survival in January 2012 is considered to be the stocking density excluding mortality attributable to transport stress and associated factors. We have termed this 'initial' survival and all subsequent quarterly survival estimates as 'long term' survival.
Each of the five sampling events took several consecutive days to complete. The same diver, Brad Adams, counted every abalone on each habitat structure to provide an actual (not estimated) number of individuals of each year class on the units at that point in time. Additionally, he measured a random subsample of generally N > l 00 year-2, N >50 year-3 and N >40 year-4 abalone on each habitat type on the Main Lease and an amalgamation of several habitat types on R&D 1 and R&D2. These measurements were to provide estimates of growth for the three size classes over the course of the experiment.
In addition to the quarterly sampling, Brad Adams and his staff also undertook regular dives, at least once a week on the lease site, to monitor and remove any octopus, which are potential abalone predators, and to record indices of food availability.
The numbers of octopus ( Octopus tetricus) removed when the study site was visited, were recorded separately for each of the three lease sites. Any empty abalone shells from the study site were also retained to examine for external indicators of predator damage. Aside from octopus, small numbers of lobster (Jasus edwardsii; Panulirus cygnus) and baler shells (Melo miltonis) were encountered and removed from the study site.
Greenlip abalone feed on a wide range of algae, but prefer red algal species which are often attached as epiphytes on seagrass. Food availability in the form of edible algae was estimated for each lease site when the study area was visited, using a scale of O to 10. Small numbers indicated less food available than large numbers.
2.7 Environmental data
Data on water temperature, wind speed and direction and swell height were collected whenever the lease sites were inspected. Although the sites were inspected on a weekly or even more frequent basis over the course of the experiment, there were days that were unsuitable for diving due to wind or sea conditions. Clearly, the use of these data would therefore have biased interpretation of environmental conditions on the experiment sites.
Environmental data on sea temperature and swell conditions were therefore sought from the Department of Transport, Western Australia (DOT). The DOT had two potential data sources suitable for providing information for this project. They have had an acoustic wave and current profile (AWAC) recording instrument in place in Flinders Bay on the seabed at a depth of 9.4 m for the full duration of this project, while the marina close to the sampling sites is being constructed. This instrument records hourly significant wave height, mean period, peak period and swells direction for sea and swell as well as temperature. The use of this data source would have been ideal; however, use of the sea and swell data showed there to be serious errors in what had been recorded over certain periods which rendered this information unusable. DOT is now in the process of attempting to validate and rectify the data. The temperature information recorded by the AWAC instrument did however correlate well with OGA water temperature records and these data have therefore been used in this report.
Sea ranching trials for commercial production of greenlip (Haliotis laevigata) abalone in Western Australia 17
Given that the DOT Augusta sea and swell data is unusable at this time, we have made use of the DOT's next closest swell recording instrument, a wave-rider buoy located at a depth of 50 m off Cape Naturaliste (33°32'05"S; 114°45'52"E).
2.8 Validation of OGA stock counts and measurements
As noted in the introduction, OGA was responsible for the design and monitoring of this experiment. One of the tasks of Curtin University in writing up the results from the OGA sampling was to independently validate the accuracy of the measuring and counting of the stock.
The validation process involved two Curtin University divers (Roy Melville-Smith and Simon Longbottom) repeating Brad Adams' counting and measurement subsamples from his last sampling event which he had undertaken between 30/12/12 and 8/01/13. The validation sampling occurred on 15 and 16 January 2013.
There were exceptions where either more or less habitat structures were measured, but in general all the seed stock on two of each type of habitat were counted and compared with Brad Adams' counts for the same units. A subsample of -100 abalone was also measured on tube, star and hollow block habitat structures and the mean sizes as measured by the validation divers were compared with the mean size estimates recorded by Brad Adams for those habitat types.
2.9 Data analysis
2.9.1 Growth
Subsampling of the lengths of the abalone provided quarterly estimates of the three cohorts in the trials. As individuals were not tracked over time, each quarterly sample was independent of previous samples.
Mean growth per quarter was calculated for each habitat type in the Main Lease and for all habitats combined in the two R&D leases. Comparisons of growth increments across the year between all nine habitat types in the Main Lease were made using 1-way ANOVA. To compare growth between lease sites (and therefore depth), data for all habitat types in the Main Lease were combined and the average growth increment per quarter was compared with that of the two other sites.
Growth data for the three year classes monitored in this study have been combined and fitted to a Gompertz growth model (L 1 = L00 ef-,,(- k(t- tOJJJ>, where L I is length (mm) at age t; L00 the maximum theoretical length; Ka growth coefficient and t0 the theoretical length (mm) at age 0. The modelled growth has enabled comparisons to be made between similar growth models for greenlip abalone grown under aquaculture conditions and as an enhancement experiment on natural reefs in the wild (Hart et al., in press a).
2.9.2 Survival
Survival rates were established at each quarterly count. The first count of the experimental abalone post-seeding was made in early January 2012 at all habitats. The difference between the numbers of abalone stocked and the numbers counted in January 2012 have been used to establish initial mortality. Quarterly counts from January 2012 to January 2013 were analysed separately and comparisons of survival between each habitat and across all sites were made using 1-way ANOVA.
Stocking densities on some individual habitat units were "doubled up" (see Tables I, II and Ill). These single, unreplicated units have been removed from the analysis.
18 Sea ranching trials for commercial production of greenlip (Haliotis /aevigata) abalone in Western Austral ia
Besser block habitat units were made up of different numbers of blocks stocked with the relevant multiple of abalone. In most cases, particularly on R&D 1 and R&D2, two blocks were joined together and this arrangement has been considered to be the standard. Variations from the standard two block arrangement have been removed from the analysis in R&D 1 and R&D2, but in the Main Lease non-standard combinations were too common and have therefore been included in the analysis.
There was some discrepancy between the stocking densities on individual units between lease sites (see Table I, II and III). For example, all kerb units in the Main Lease are stocked with 120 2-year old abalone only, whereas in the other two sites there are only 100 2-year old abalone, but also 40 3-year olds and 10 4-year olds per unit. For the purposes of this analysis, these inconsistencies in stocking density have been overlooked.
As mentioned previously (see (ix) in 2.4 Habitat structure designs) small besser blocks have been placed several metres away from some habitat types to provide a refuge for abalone migrating off those habitat units. In one instance, the number of migrating animals on besser blocks close to tube units amounted to nearly 25% of the total count for that particular habitat type (tubes, January 2012). In the analysis, it has been assumed that all abalone found on besser blocks close to a particular habitat type originated from those units. However, this cannot be determined with any certainty.
Similarly, it is not possible to determine whether abalone counted on a particular habitat type were originally seeded to that habitat. In occasional cases this has led to survival rates of over 100% being recorded for some habitat types and presumably to erroneously low survival rates in adjoining habitat types that contributed stock to the neighbouring habitat units.
2.9.3 Environmental Factors
Daily indices of food abundance that were recorded whenever the R&D sites were visited through the year have been averaged by month. ANOVA has been used to test for differences in food supply across the three R&D sites. Linear regression analysis has been used to test for possible relationships between quarterly growth increments and food abundance for the three seed stock year classes in the different R&D leases.
Drift algae, which are the basis of the food index, become detached in bigger volumes after rough sea conditions. We have examined the daily frequency of extreme swell conditions (2:3 m, as measured on the Cape Naturaliste wave-rider buoy) and compared that with quarterly mean size increments on the three R&D lease sites.
2.9.4 Pyramid design units
Due to the shorter time period between when the pyramid design units were installed compared to other habitat types, the analysis of that data has largely been undertaken separately to that for other habitat types and is of a preliminary nature.
The pyramid design habitats were only installed on R&D 1 and R&D2 and the seed stock on those units was not measured at the time that they were seeded. Comparative growth data between abalone stocked on the pyramid design units and other habitat types is therefore only available for quarter 4 (October 2012 to January 2013). Compounding the limitations of comparing growth between pyramid design and other habitat types over just one quarter, is the fact that the seed stock on the pyramid design units was smaller than their corresponding cohorts on the other units.
Comparisons between seed stock survival rates on pyramid design and other habitat types are also potentially flawed. The pyramid design units were stocked for 2.5 months between the seeding and the first count to follow after seeding, whereas similar initial counts for other habitats on R&D 1 and R&D2 were done after just two weeks. Additionally, stocking of the
Sea ranching trials for commercial production of greenlip (Haliotis /aevigata) abalone in Western Australia 19
I
pyramid design units took place at a very different time of year to other units, and the mean size of the abalone used were slightly larger, given that the seed stock were seven months older at time of stocking than those stocked on the other habitat types.
Even though there are important dissimilarities between the seed stock and the timing of stocking, this information has been used in the absence of other data to provide an indication of the performance of pyramid design units against other habitat types.
The analysis of mean quarterly growth increments, standardised increments and initial and long-term survival measurements was largely similar to that done for other habitats, but for a shorter time period.
3.0 Results
3.1 Validation of OGA sampling
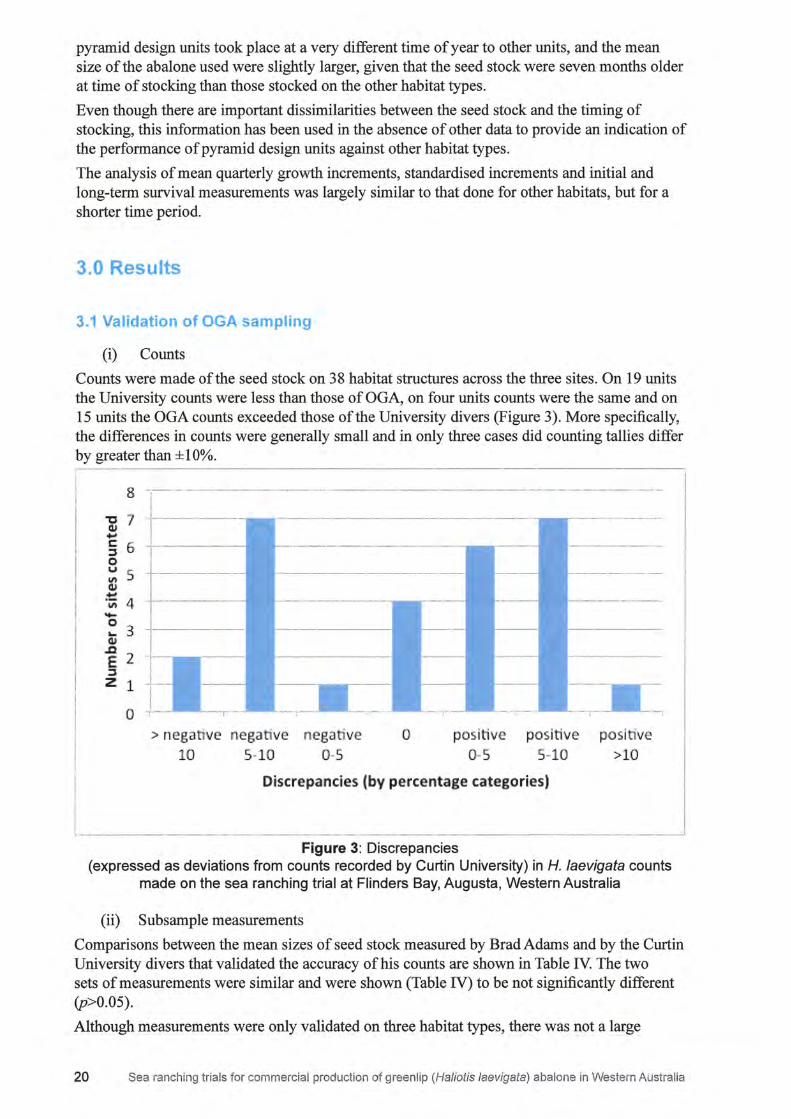
(i) Counts
Counts were made of the seed stock on 38 habitat structures across the three sites. On 19 units the University counts were less than those of OGA, on four units counts were the same and on 15 units the OGA counts exceeded those of the University divers (Figure 3). More specifically, the differences in counts were generally small and in only three cases did counting tallies differ by greater than ±10%.
8
'C 7 Cl.I ... C 6 :::s 0 u 5 I.It Cl.I ~ 4 I.It -0
3 Ii-Cl.I .a
2 E :::s z 1
0
---------------------
-------------~ > negative negati v,e negative 0
10 5-10 0-5 positive
0-5 positive
S-10
Discrepancies (by percentage categories.)
' '
positive >10
L---------------Figure 3: Discrepancies
(expressed as deviations from counts recorded by Curtin University) in H. laevigata counts made on the sea ranching trial at Flinders Bay, Augusta, Western Australia
(ii) Subsample measurements
Comparisons between the mean sizes of seed stock measured by Brad Adams and by the Curtin University divers that validated the accuracy of his counts are shown in Table IV. The two sets of measurements were similar and were shown (Table IV) to be not significantly different (p>0.05).
Although measurements were only validated on three habitat types, there was not a large
20 Sea ranching trials for commercial production of greenlip (Haliotis laevigata) abalone in Western Australia
83.4
Hollow (0.8) (1.6)
= 173, t = 1.
=1 ,t=1.17
p
>0.05
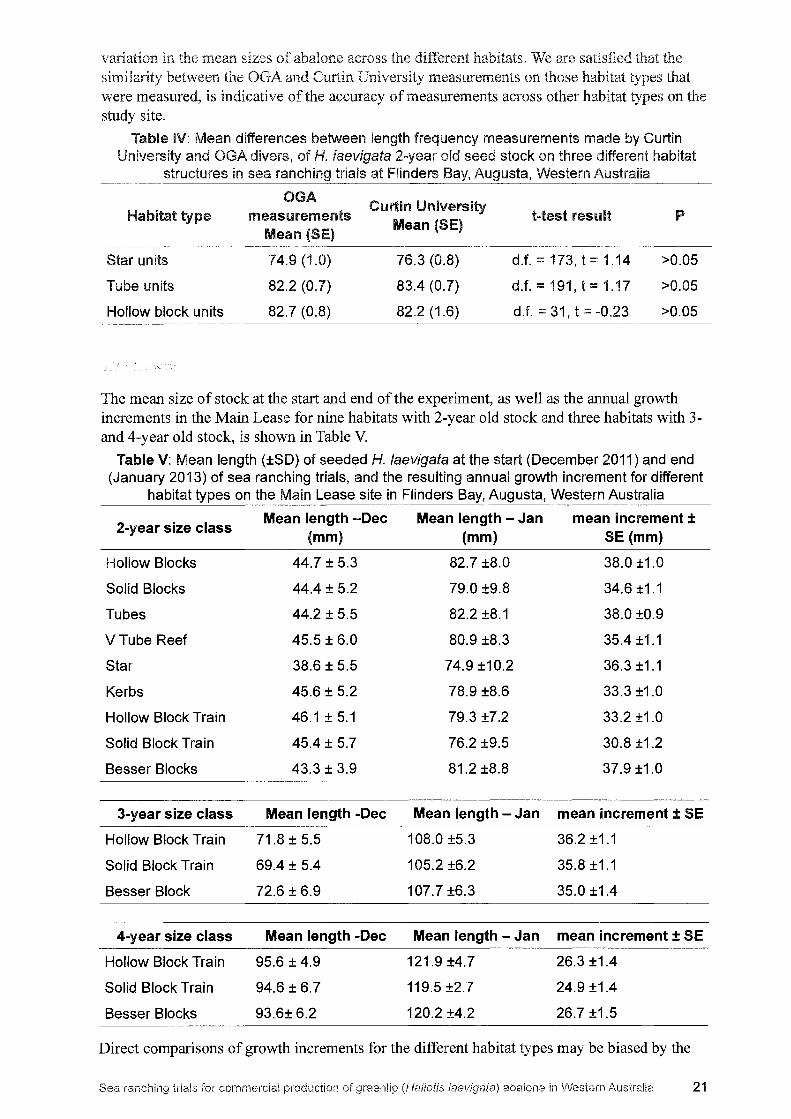
The mean of stock at the start and end of the experiment, as well as the annual growth increments in the Main Lease for nine habitats with 2-year old stock and three habitats with 3-and 4-year old stock, is shown in Table V.
Table V: Mean length (±SD) of seeded H. laevigata at the start (December 2011) and end (January 2013) of sea ranching trials, and the resulting annual growth increment for different
habitat types on the Main Lease site in Flinders Bay, Augusta, Western Australia
2-year size class Mean length -Dec Mean length - Jan mean increment ±
(mm} (mm) SE (mm}
Hollow Blocks 44.7 ± 5.3 82.7 ±8.0 38.0 ±1.0
Solid Blocks 44.4 ± 5.2 79.0 ±9.8 34.6 ±1.1
Tubes 44.2 ± 5.5 82.2 ±8.1 38.0 ±0.9
VTube Reef 45.5 ± 6.0 80.9 ±8.3 35.4 ±1.1
Star 38.6 ± 5.5 74.9 ±10.2 36.3 ±1.1
Kerbs 45.6 ± 5.2 78.9 ±8.6 33.3 ±1.0
Hollow Block Train 46.1 ± 5.1 79.3 ±7.2 33.2 ±1.0
Solid Block Train 45.4 ± 5.7 76.2 ±9.5 30.8 ±1.2
Besser Blocks 43.3 ± 3.9 81.2 ±8.8 37.9 ±1.0
3-year size class Mean length $Dec Mean length - Jan mean increment :t SE
Hollow Block Train 71.8 ± 5.5 108.0 ±5.3 36.2 ±1.1
Solid Block Train 69.4 ± 5.4 105.2 ±6.2 35.8 ±1.1
Besser Block 72.6 ± 6.9 107.7 ±6.3 35.0 ±1.4
4-year size class Mean length -Dec Mean length - Jan mean increment ± SE
Hollow Block Train 95.6 ± 4.9 121.9 ±4.7 26.3 ±1.4
Solid Block Train 94.6 ± 6.7 119.5 ±2.7 24.9 ±1.4
Besser Blocks 93.6± 6.2 120.2 ±4.2 26.7 ±1.5
Direct comparisons of growth increments for the different habitat types may be biased by the
21
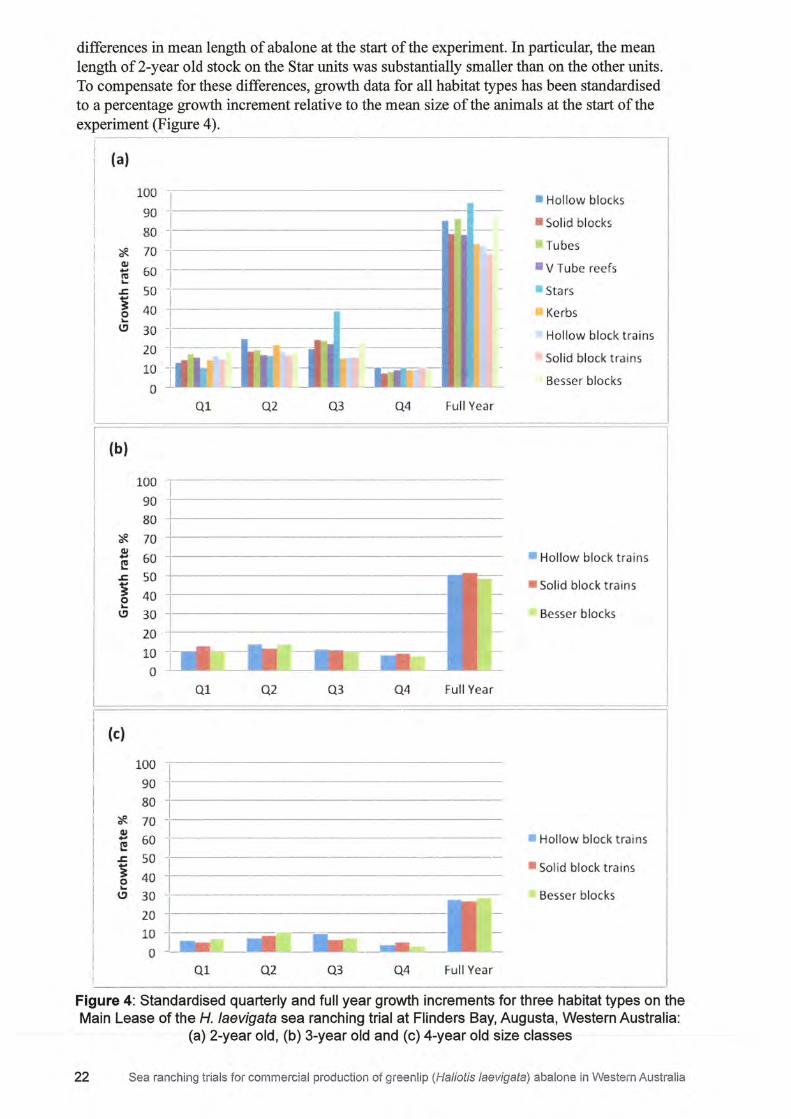
differences in mean length of abalone at the start of the experiment. In particular, the mean length of 2-year old stock on the Star units was substantially smaller than on the other units. To compensate for these differences, growth data for all habitat types has been standardised to a percentage growth increment relative to the mean size of the animals at the start of the experiment (Figure 4).
(a)
100 -1
90 -,--------------•
80 -I
~ 70 -, ~ 60 1 ------------~ so -1 40 ~-------------•
C) 30 I
(b)
20 1---10 _T 0 ----
100 90
Ql Q2 Q3 Q4 Full Year
80 -•-------------------
! 10 -1
... 60 J ~ so ---------------! 40 -+--1 --------------.. e> 30 -i----------------
20 -+-----------------
10 0 -
Ql Q2 Q3 Q4 Ful l Yea r
(c)
100 I 90 --------
80 +1------------------
! 70 ~1---------------~ 60 I ~ 50 -+-i----1 40 -1 e> 30 -i---------------;;;;;:::=:;=-
20 -10 J ______ ,__, 0 J,----~ --
Ql Q2 Q3 Q4 Full Year
• Hollow blocks
• Solid b locks
Tubes
• V Tube reefs
• Stars
Ke rbs
Hollow block t rains
Sol id block trainsj Besser blocks
• Hollow block t rains
• Solid block t rains
Besser blocks
• Hollow block t rains
• Solid block trains
Besser blocks
Figure 4: Standardised quarterly and full year growth increments for three habitat types on the Main Lease of the H. /aevigata sea ranching trial at Flinders Bay, Augusta, Western Australia:
(a) 2-year old, (b) 3-year old and (c) 4-year old size classes
22 Sea ranching tria ls for commercial production of greenl ip (Haliotis /aevigata) abalone in Western Austra lia
were not available for the lease However, pooled rLm.G:;icr,_
types in R&D l and R&D2 mean growth increments for all habitats "'".u,..,,,,..,
Main Lease, have allowed lengths to compared across leases 2, 3 (Table VII).
Table VII: Mean length (±SO) seeded H. laevigata at start (late December 1) and end (early January 201 of sea ranching trials in Flinders Bay, Augusta, Western Australia,
and the resulting annual growth increment the three R&D lease sites
length - Dec Mean length - Jan mean increment ±SE (mm) (mm) (mm)
2-year size class
Main Lease 44.1 ± 5.7 79.6 ± 9.1 35.5 ± 0.4
R&D1 Lease 38.0 ± 5.2 75.0 ± 8.3 36.9 ± 1.0
R&D2 lease 40.8 ± 4.9 71.1 ± 7.1 30.3 ± 0.9
3-year size class
Main Lease 71.0 ± 6.0 107.0 ± 6.0 36.0 ± 0.7
R&D1 Lease 70.2 ± 6.1 108.3 ± 7.3 38.1 ± 1.3
R&D2 Lease 69.4 ± 6.4 103.6 ± 7.2 34.2 ± 1.1
4~year size class
Main Lease 94.6 ± 6.0 120.6 ± 4.1 26.0 ± 0.8
R&D1 lease 96.4 ± 4.0 123.6 ± 4.4 27.2 ± 1.0
R&D2 Lease 93.6 ± 5.8 118.5 ± 5.5 24.9 ± 1.2
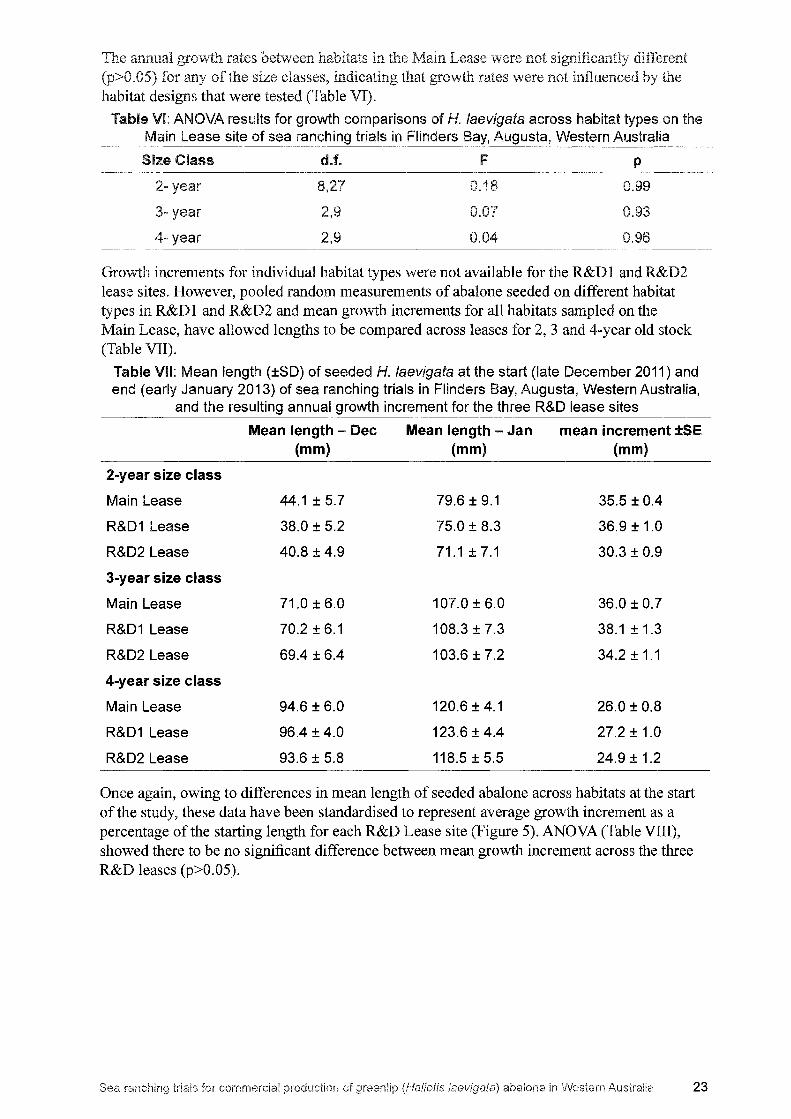
Once again, owing to differences in mean length of seeded abalone across habitats at the start of the study, these data have been standardised to represent average growth increment as a percentage of the starting length for each R&D Lease site (Figure 5). ANOVA (Table VIII), showed there to be no significant difference between mean growth increment across the three R&D leases (p>0.05).
23
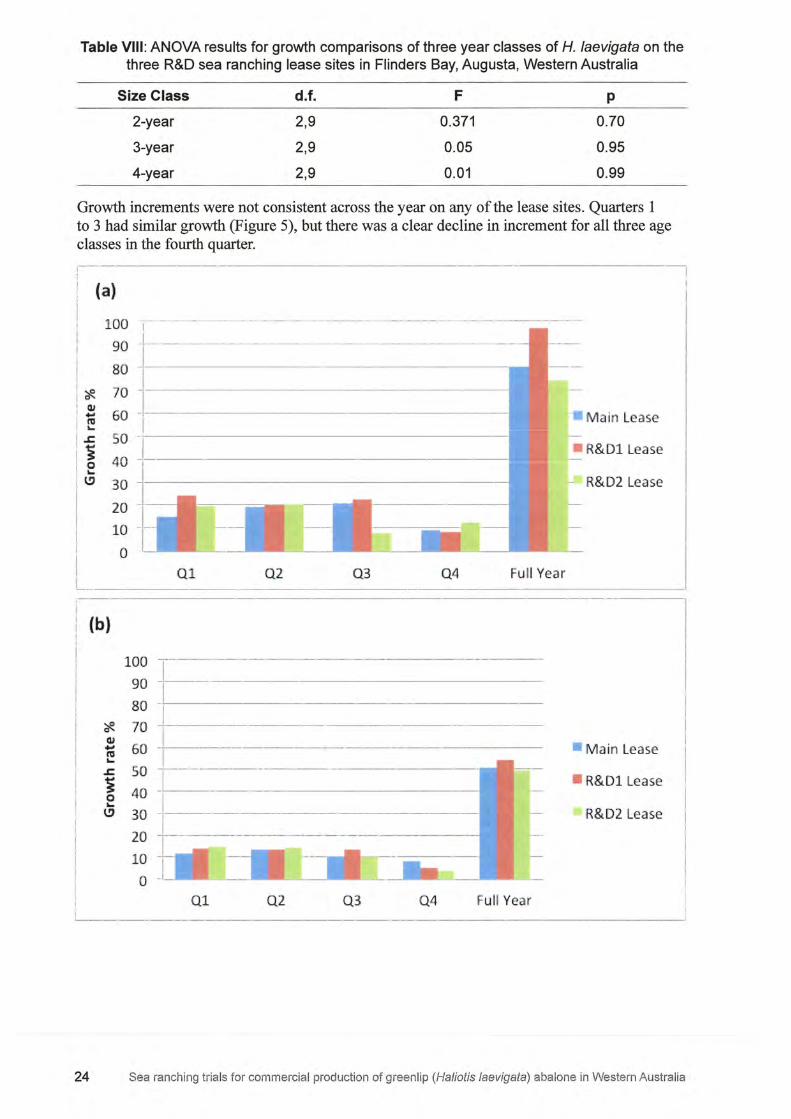
Table VIII: ANOVA results for growth comparisons of three year classes of H. /aevigata on the three R&D sea ranching lease sites in Flinders Bay, Augusta, Western Australia
Size Class d.f. F p
2-year 2,9 0.371 0.70
3-year 2,9 0.05 0.95
4-year 2,9 0.01 0.99
Growth increments were not consistent across the year on any of the lease sites. Quarters 1 to 3 had similar growth (Figure 5), but there was a clear decline in increment for all three age classes in the fourth quarter.
(a)
Ql 02 03 04 Full Year
(b)
100 j 90 - --------
* ~~ ±------------------- ---·----ell I ,; 60 -+---... ~ 50 j 0 40 ... ~ 30 -+---
20 10
0 Ql
L_ ____________ _ Q2 Q3 Q4 Full Year
• M ain Lease
• R&Dl Lease
R&D2 Lease
24 Sea ranching trials for commercial production of green lip (Haliotis laevigata) abalone in Western Australia
(c)
100 90 80 -,-----·
* 70 Cl.I ,;;; 60 _, ____________________ _ t..
.s:. so -----------------------------------j 0 t..
40 -i--------------------
e> 30
20 I 10 ~----·--==--~.---.--.. ------0 _I
Ql Q2 Q3 Q4 Full Year
Ma in Lease
• R&D1 Lease
R&D2 Lease
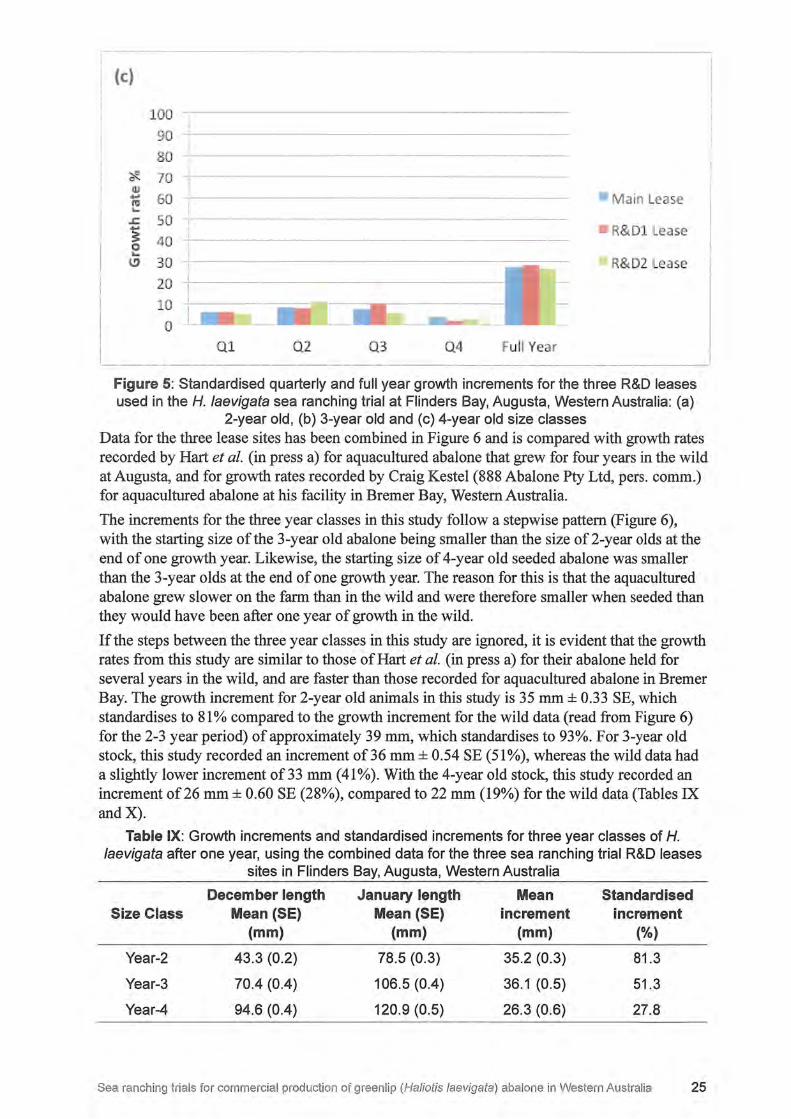
Figure 5: Standardised quarterly and full year growth increments for the three R&D leases used in the H. /aevigata sea ranching trial at Flinders Bay, Augusta, Western Austral ia: (a)
2-year old, (b) 3-year old and (c) 4-year old size classes Data for the three lease sites has been combined in Figure 6 and is compared with growth rates recorded by Hart et al. (in press a) for aquacultured abalone that grew for four years in the wild at Augusta, and for growth rates recorded by Craig Kestel (888 Abalone Pty Ltd, pers. comm.) for aquacultured abalone at his facility in Bremer Bay, Western Australia.
The increments for the three year classes in this study follow a stepwise pattern (Figure 6), with the starting size of the 3-year old abalone being smaller than the size of 2-year olds at the end of one growth year. Likewise, the starting size of 4-year old seeded abalone was smaller than the 3-year olds at the end of one growth year. The reason for this is that the aquacultured abalone grew slower on the farm than in the wild and were therefore smaller when seeded than they would have been after one year of growth in the wild.
If the steps between the three year classes in this study are ignored, it is evident that the growth rates from this study are similar to those of Hart et al. (in press a) for their abalone held for several years in the wild, and are faster than those recorded for aquacultured abalone in Bremer Bay. The growth increment for 2-year old animals in this study is 35 mm± 0.33 SE, which standardises to 81 % compared to the growth increment for the wild data (read from Figure 6) for the 2-3 year period) of approximately 39 mm, which standardises to 93%. For 3-year old stock, this study recorded an increment of 36 mm ± 0 .54 SE ( 51 % ), whereas the wild data had a slightly lower increment of33 mm (41%). With the 4-year old stock, this study recorded an increment of26 mm± 0.60 SE (28%), compared to 22 mm (19%) for the wild data (Tables IX andX).
Table IX: Growth increments and standardised increments for three year classes of H. /aevigata after one year, using the combined data for the three sea ranching trial R&D leases
sites in Flinders Bay, Augusta, Western Australia
Size Class
Year-2
Year-3
Year-4
December length January length Mean Mean (SE) Mean (SE) increment
(mm) (mm) (mm)
43.3 (0.2) 78.5 (0.3) 35.2 (0.3)
70.4 (0.4)
94.6 (0.4)
106.5 (0.4)
120.9 (0.5)
36.1 (0.5)
26.3 (0.6)
Standardised increment
(%)
81.3
51.3
27.8
Sea ranching trials for commercial production of greenlip (Haliotis /aevigata ) abalone in Western Australia 25
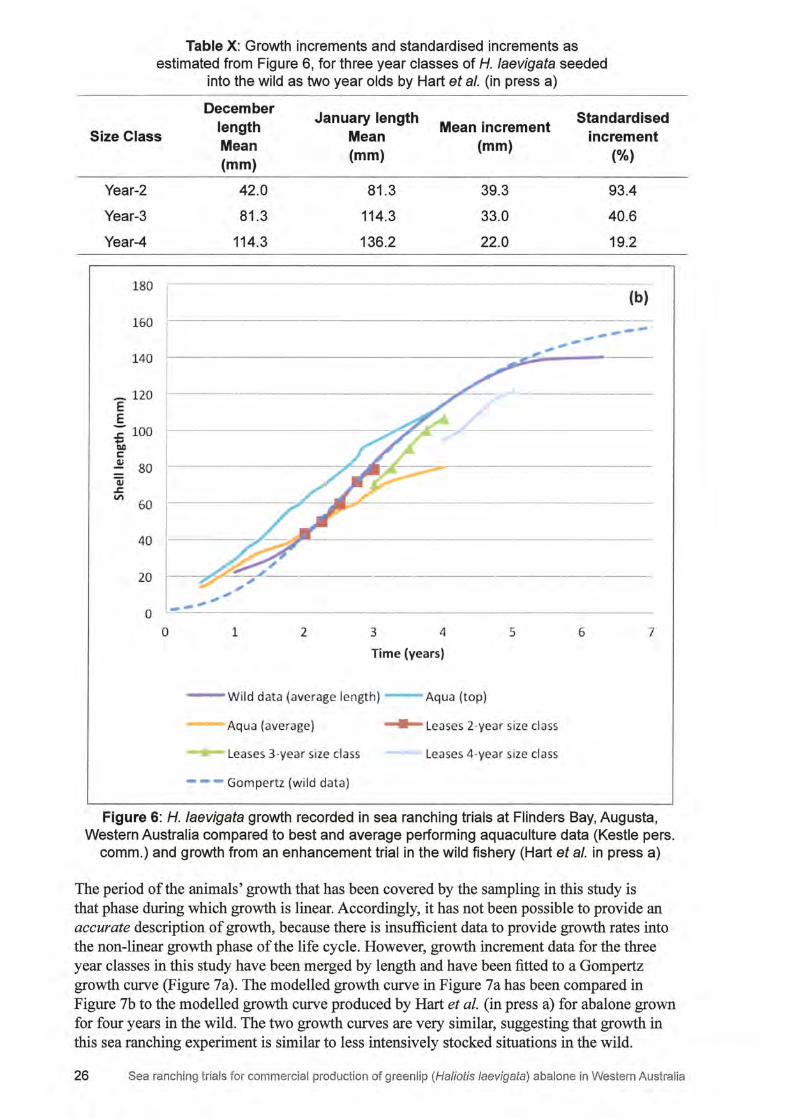
Table X: Growth increments and standardised increments as estimated from Figure 6, for three year classes of H. laevigata seeded
into the wild as two year olds by Hart et al. (in press a)
December January length Standardised
Size Class length Mean increment
Mean increment Mean {mm)
Year-2
Year-3
Year-4
180
160
140
_ 120 E E ;; 100 ....
QO C:
~ 80 cij ~ in
60
40
20
0
{mm) {mm) {%)
42.0 81.3 39.3 93.4
81.3 114.3 33.0 40.6
114.3 136.2 22.0 19.2
(b)
---__ ,,., .. !
--
i I I I r ,, , 1~--
0 1 2 3 4 5 6 7
Time (years}
- Wild data (average length) - Aqua (top)
Aq ua (average) _,._ Leases 2-year size cl ass
Leases 3-year size class Leases 4-year size cl ass
- - - Gom pertz (wi ld dat a)
Figure 6: H. laevigata growth recorded in sea ranching trials at Flinders Bay, Augusta, Western Australia compared to best and average performing aquaculture data (Kestle pers.
comm.) and growth from an enhancement trial in the wild fishery (Hart et al. in press a)
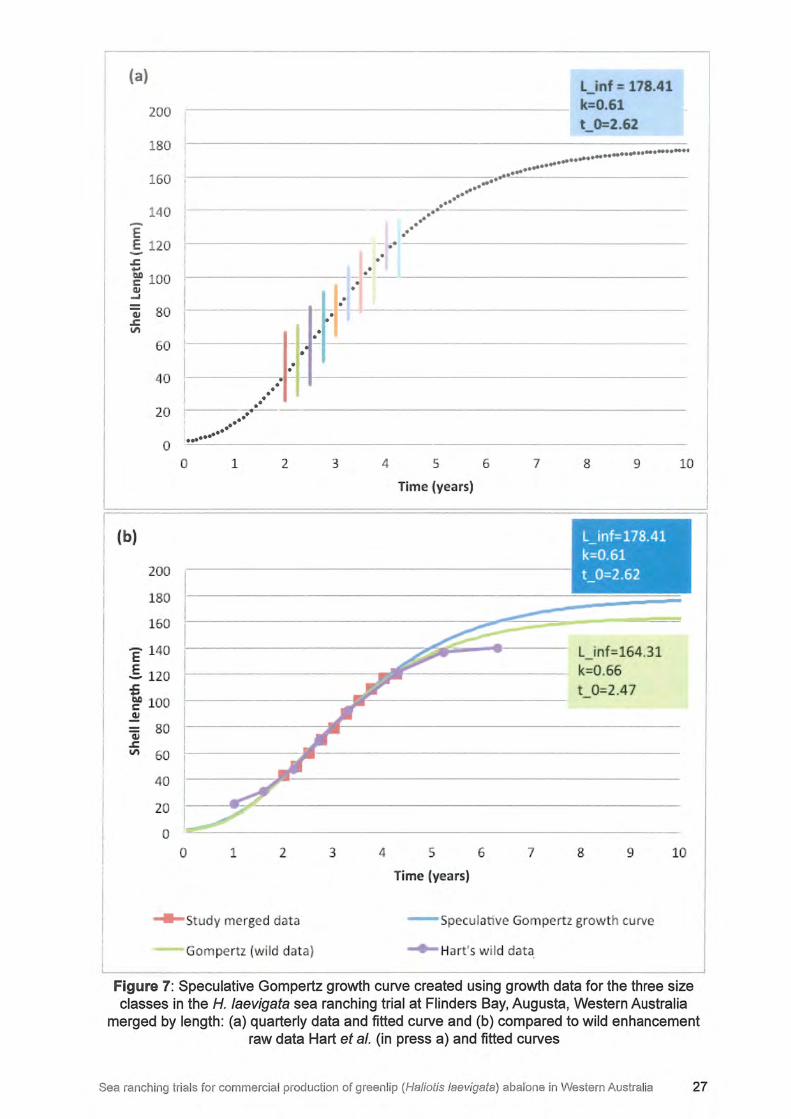
The period of the animals' growth that has been covered by the sampling in this study is that phase during which growth is linear. Accordingly, it has not been possible to provide an accurate description of growth, because there is insufficient data to provide growth rates into the non-linear growth phase of the life cycle. However, growth increment data for the three year classes in this study have been merged by length and have been fitted to a Gompertz growth curve (Figure 7a). The modelled growth curve in Figure 7a has been compared in Figure 7b to the modelled growth curve produced by Hart et al. (in press a) for abalone grown for four years in the wild. The two growth curves are very similar, suggesting that growth in this sea ranching experiment is similar to less intensively stocked situations in the wild.
26 Sea ranching trials for commercial production of greenlip (Haliotis /aevigata) abalone in Western Austral ia
I (a) L_inf = 178.41 k=0.61 t_0=2.62 I
I 200
180
160 .. .. .... ...... ........... ................... .............
140 .. ,--------------~ ~ ---------------E .. ··
. .. .§. 120 ------------~----------------s:. ... ~ 100 ~
...I
41 80 s:. 11'1
60
40
20
0
(b)
200
180
160
-140 E .§. 120 s:. ... ~ 100 ~
ui 80 s:. U'I 60
40
20
0
I I I I i i I l
! I .. .. .. : ...... . .... 0 1
0 1
. . .
. • •
··1 • I . • .
2
2
- Study merged data
Gompertz (wild dat a)
• . -. . .
3
3
• . . . . .
4
4
5 6 7
Time (years)
s 6 7
Time (years)
8 9
L_inf=178.41 k=0.61 t_0=2.62
L_inf=164.31 k=0.66 t 0=2.47
8 9
- peculative Gompertz growth curve
_._Hart's wild data,
10
10
Figure 7: Speculative Gompertz growth curve created using growth data for the three size classes in the H. laevigata sea ranching trial at Flinders Bay, Augusta, Western Australia
merged by length: (a) quarterly data and fitted curve and (b) compared to wild enhancement raw data Hart et al. (in press a) and fitted curves
Sea ranching trials for commercial production of greenlip (Haliotis /aevigata) abalone in Western Australia 27
3.3 Survival
Survival of seeded abalone is best considered in two phases. The first phase is initial survival in the weeks following stocking, because this phase has more to do with the quality of the abalone being stocked, the method used to attach them to their new habitat and how they adjust to their new surroundings. The second phase is long-term survival and is about how the animals adapt to their surroundings over time. This phase is considered over a one-year time frame in this study.
3.3.l Initial survival
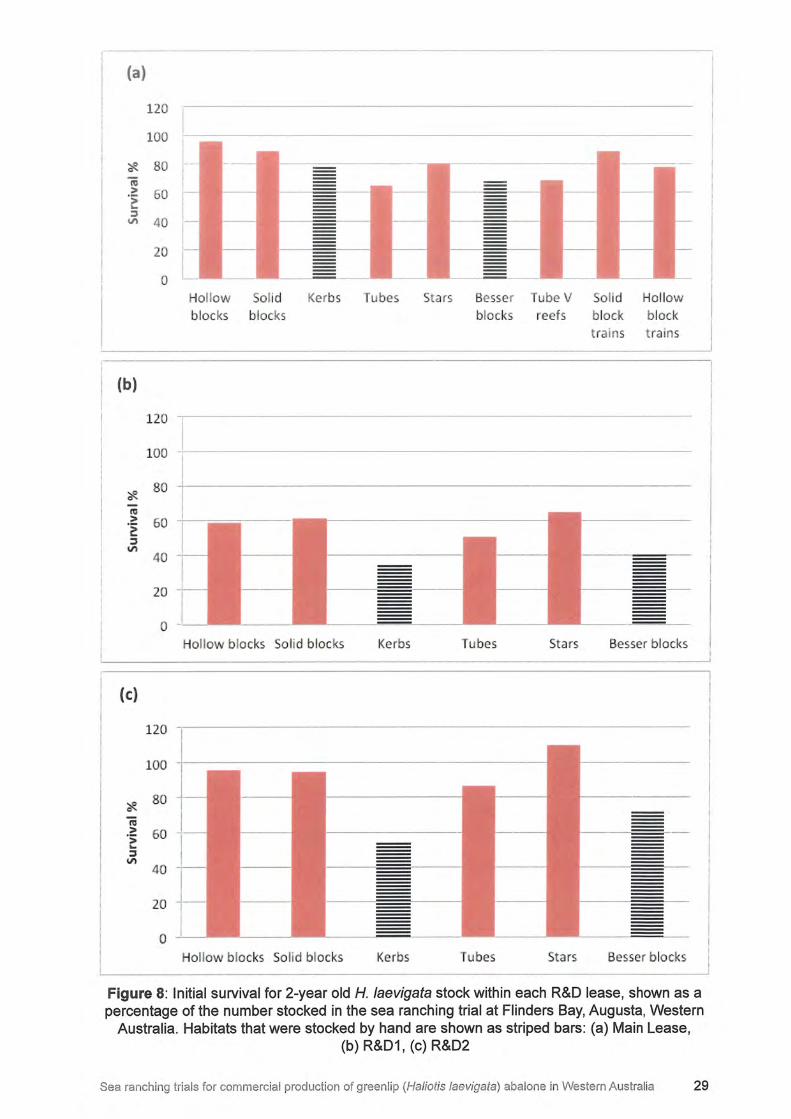
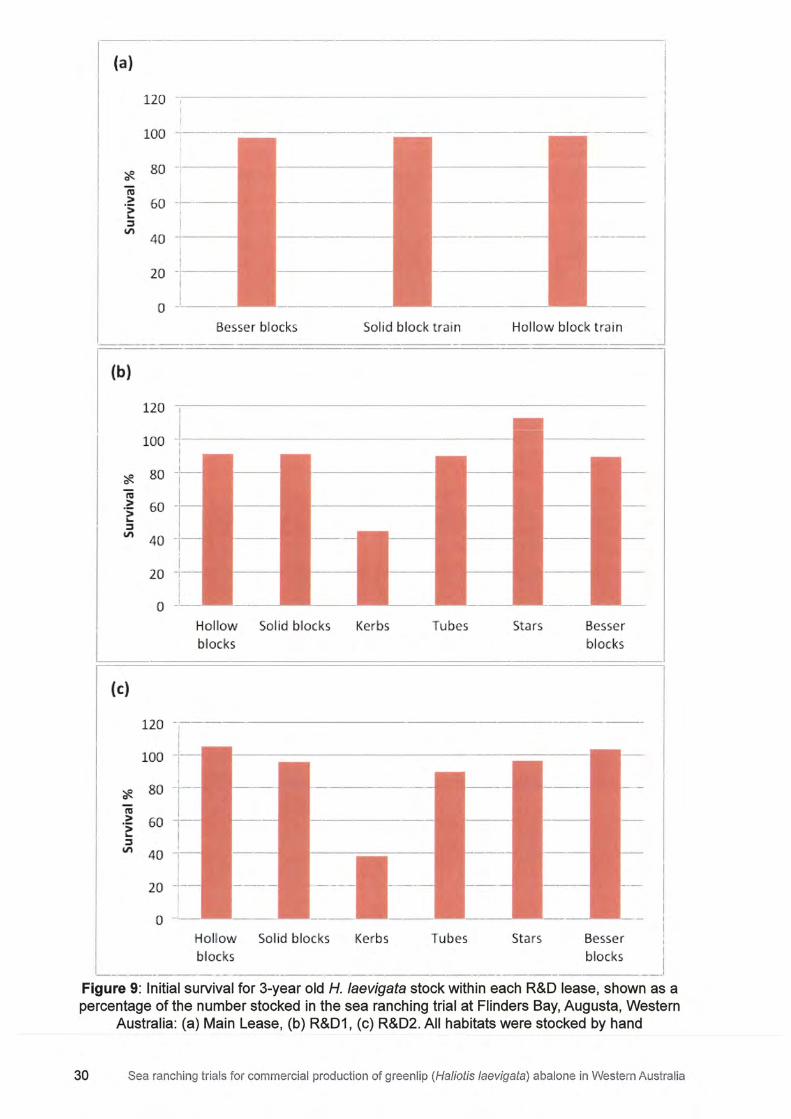
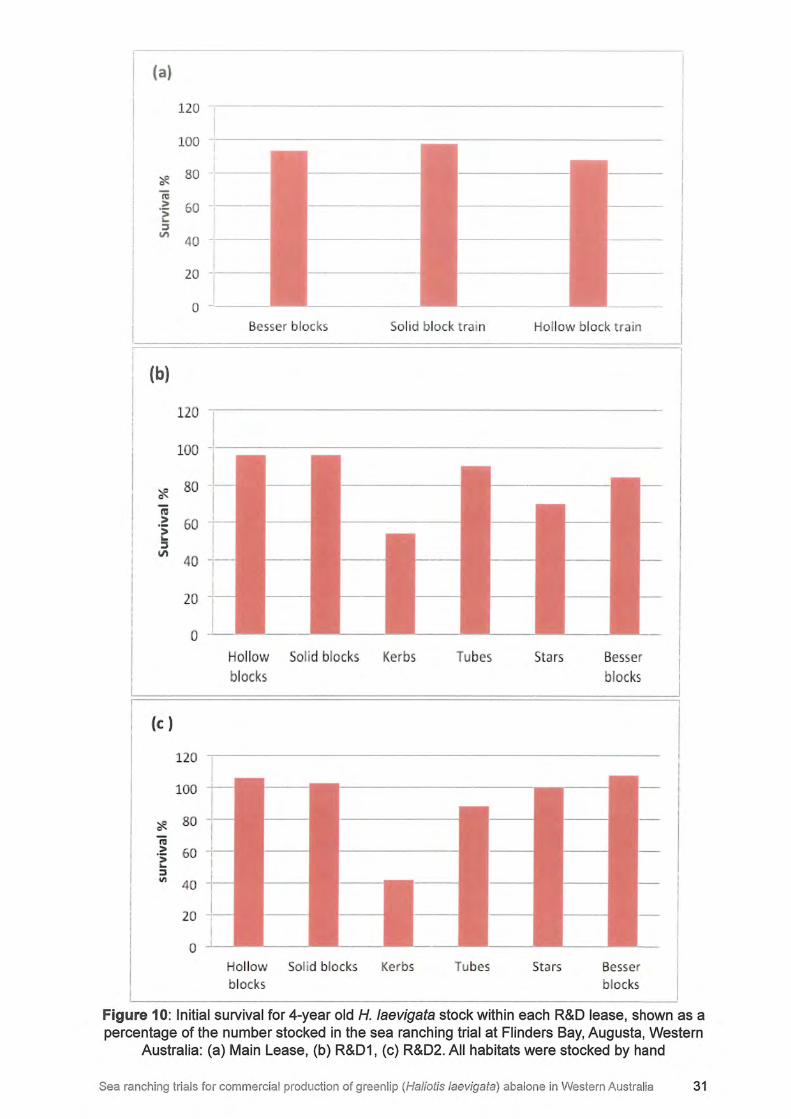
The percentage of abalone surviving after approximately three months after stocking on the Main Lease and one month after stocking on R&Dl and R&D2 is shown in Figures 8 to 10. From the three Figures, it is clear that survival is substantially lower on all three R&D leases for the 2-year old seed stock (Figure 8) than for the 3 (Figure 9) and 4-year old (Figure 10) animals. It is also apparent from the three Figures, that survival was substantially lower at the R&D 1 lease site compared to the other two leases. This may indicate that the condition of the seed stock used to populate that lease site was compromised in some way, possibly through travel stress prior to stocking.
28 Sea ranching trials for commercial production of greenl ip (Haliotis laevigata) abalone in Western Australia
(a)
120
100
* 80 RI > 60 -·~ :::J -V, 40
20 -0 -
Hollow Solid Kerbs blocks blocks
(b)
120 I
100 J
I * 80
RI > 60 ·~ :::J
V,
40
20
0 -
Hollow blocks Solid b locks
(c)
120
* 80
iii > 60 ·~ :::J
V,
40
20
0 Hollow blocks So lid blocks
ubes
--
--Kerbs
--
--Kerbs
------
----
Stars Besser blocks
Tubes
Tubes
ube V Solid Hollow reefs block block
t rains t rains
------
Stars Besser blocks
>---------
St ars Besser blocks
Figure 8: Initial survival for 2-year old H. /aevigata stock within each R&D lease, shown as a percentage of the number stocked in the sea ranching trial at Flinders Bay, Augusta, Western
Australia. Habitats that were stocked by hand are shown as striped bars: (a) Main Lease, (b) R&D1, (c) R&D2
Sea ranching trials for commercial production of greenlip (Haliotis /aevigata) abalone in Western Australia 29
(a)
120 ----·
100
'* 80 ---
RI
·~ 60 -[-::::,
"'
(b)
'* RI > -~ ::::,
"'
40 -·
i 20 -i---
1
0 ----
120
100
80
60
40
20
0
I I I
Besser blocks
--r-1
I -j j I I
_! __
Hollow Solid blocks
L_ blocks
r (c)
120
I 100
'* 80
RI
I ·~ 60 ::::,
"' 40 -I
I 20 I I
Solid block train
Kerbs Tubes
Hollow block t rain
St ars Besser blocks
-------- - ---
I O -
Hollow Solid blocks Kerbs ubes Stars Besse r ,
L ________ blo~~s__________ ______________ blocks ___ ,
Figure 9: Initial survival for 3-year old H. /aevigata stock within each R&D lease, shown as a percentage of the number stocked in the sea ranching trial at Flinders Bay, Augusta, Western
Australia: (a) Main Lease, (b) R&D1 , (c) R&D2. All habitats were stocked by hand
30 Sea ranching trials for commercial production of greenlip (Haliotis laevigata) abalone in Western Australia
(a)
120 -
'* 80 -i
Ill I I > 60 -~ 1--
::I
"' 40
(b)
20
0
120
100
* 80 Ill > -~ 0 ::::J
v, 40
20
(c)
120
100
'#. 80 Ill
-~ 60 ::I II) 40
20
0
-
I l I
J
Besser blocks Solid block train
Hollow Solid blocks Kerbs Tubes blocks
Hollow Solid blocks Kerbs Tubes blocks
Hollow block train
tars
Stars
Besser blocks
Besser blocks
Figure 10: Initial survival for 4-year old H. laevigata stock within each R&D lease, shown as a percentage of the number stocked in the sea ranching trial at Flinders Bay, Augusta, Western
Australia: (a) Main Lease, (b) R&D1, (c) R&D2. All habitats were stocked by hand
Sea ranching trials for commercial production of greenlip (Haliotis /aevigata) abalone in Western Australia 31
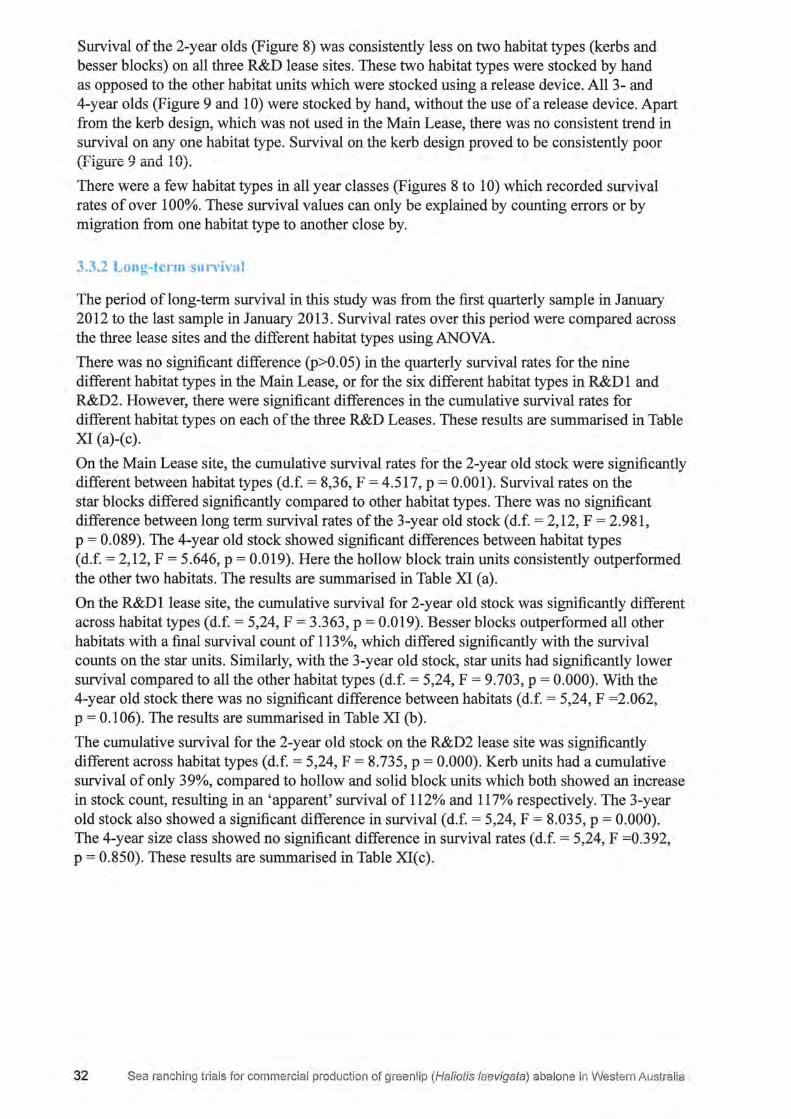
Survival of the 2-year olds (Figure 8) was consistently less on two habitat types (kerbs and besser blocks) on all three R&D lease sites. These two habitat types were stocked by hand as opposed to the other habitat units which were stocked using a release device. All 3- and 4-year olds (Figure 9 and 10) were stocked by hand, without the use of a release device. Apart from the kerb design, which was not used in the Main Lease, there was no consistent trend in survival on any one habitat type. Survival on the kerb design proved to be consistently poor (Figure 9 and 10).
There were a few habitat types in all year classes (Figures 8 to 10) which recorded survival rates of over 100%. These survival values can only be explained by counting errors or by migration from one habitat type to another close by.
3.3.2 Long-term survival
The period of long-term survival in this study was from the first quarterly sample in January 2012 to the last sample in January 2013. Survival rates over this period were compared across the three lease sites and the different habitat types usingANOVA.
There was no significant difference (p>0.05) in the quarterly survival rates for the nine different habitat types in the Main Lease, or for the six different habitat types in R&D 1 and R&D2. However, there were significant differences in the cumulative survival rates for different habitat types on each of the three R&D Leases. These results are summarised in Table XI (a)-(c).
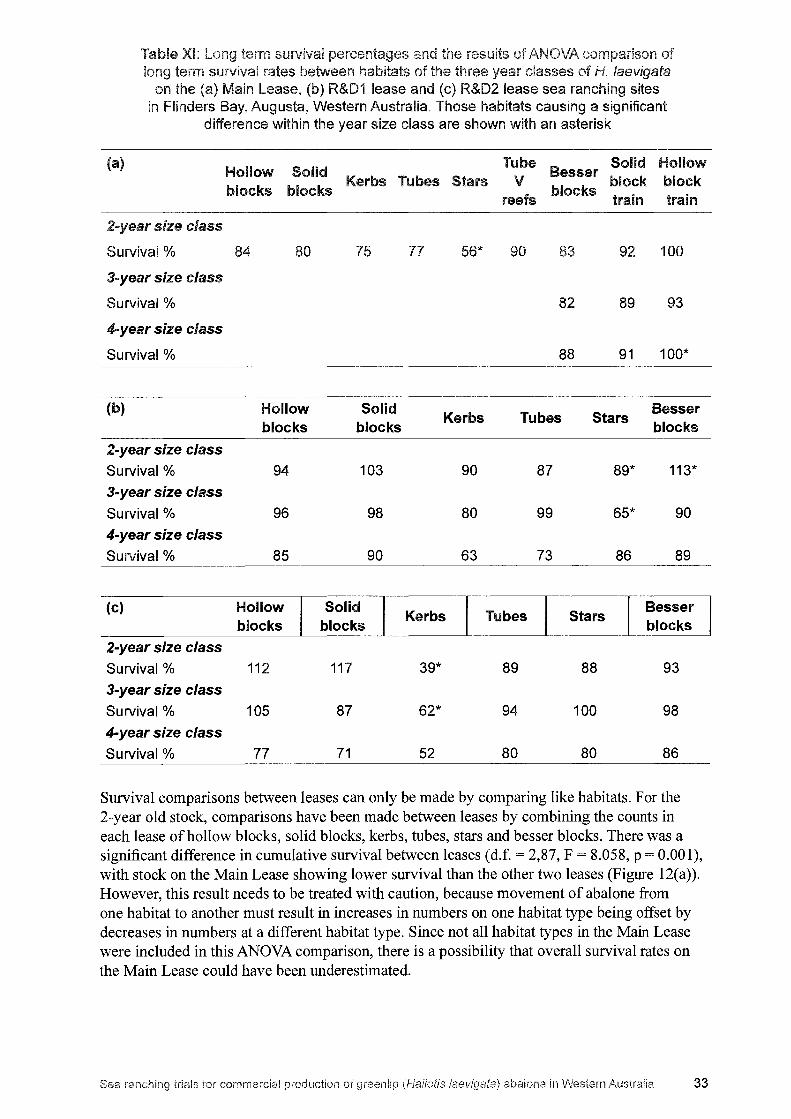
On the Main Lease site, the cumulative survival rates for the 2-year old stock were significantly different between habitat types (d.f. = 8,36, F = 4.517, p = 0.001). Survival rates on the star blocks differed significantly compared to other habitat types. There was no significant difference between long term survival rates of the 3-year old stock (d.f. = 2,12, F = 2.981, p = 0.089). The 4-year old stock showed significant differences between habitat types (d.f. = 2,12, F = 5.646, p = 0.019). Here the hollow block train units consistently outperformed the other two habitats. The results are summarised in Table XI (a).
On the R&D 1 lease site, the cumulative survival for 2-year old stock was significantly different across habitat types (d.f. = 5,24, F = 3.363, p = 0.019). Besser blocks outperformed all other habitats with a final survival count of 113%, which differed significantly with the survival counts on the star units. Similarly, with the 3-year old stock, star units had significantly lower survival compared to all the other habitat types (d.f. = 5,24, F = 9.703, p = 0.000). With the 4-year old stock there was no significant difference between habitats (d.f. = 5,24, F =2.062, p = 0.106). The results are summarised in Table XI (b).
The cumulative survival for the 2-year old stock on the R&D2 lease site was significantly different across habitat types (d.f. = 5,24, F = 8.735, p = 0.000). Kerb units had a cumulative survival of only 39%, compared to hollow and solid block units which both showed an increase in stock count, resulting in an 'apparent' survival of 112% and 117% respectively. The 3-year old stock also showed a significant difference in survival (d.f. = 5,24, F = 8.035, p = 0.000). The 4-year size class showed no significant difference in survival rates ( d.f. = 5,24, F =0.392, p = 0.850). These results are summarised in Table XI(c).
32 Sea ranching trials for commercial production of greenlip (Haliotis /aevigata) abalone in Western Austral ia
1
89
class
Survival% 88 100*
Hollow Solid Kerbs Tubes Stars
Besser blocks blocks blocks
2ayear size class Survival% 94 103 90 87 89* 113*
3-year size class Survival% 96 98 80 99 65* 90
4,.year size class
Survival% 85 90 63 73 86 89
(c) Hollow Solid Kerbs Tubes Stars
Besser blocks blocks blocks
2-year size class
Survival% 112 117 39* 89 88 93 3°year size class Survival% 105 87 62* 94 100 98
4syear size class
Survival% 77 71 52 80 80 86
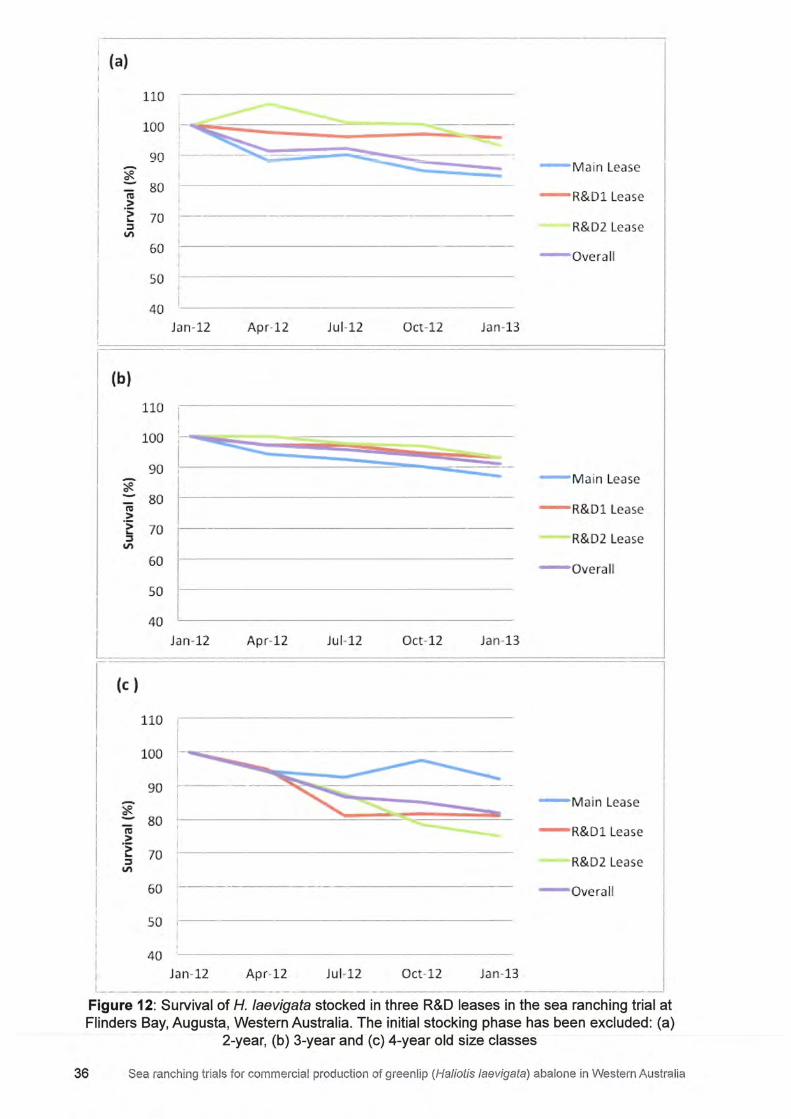
Survival comparisons between leases can only be made by comparing like habitats. For the 2-year old stock, comparisons have been made between leases by combining the counts in each lease of hollow blocks, solid blocks, kerbs, tubes, stars and besser blocks. There was a significant difference in cumulative survival between leases (d.f. = 2,87, F = 8.058, p = 0.001), with stock on the Main Lease showing lower survival than the other two leases (Figure 12(a)). However, this result needs to be treated with caution, because movement of abalone from one habitat to another must result in increases in numbers on one habitat type being offset by decreases in numbers at a different habitat type. Since not all habitat types in the Main Lease were included in this ANOVA comparison, there is a possibility that overall survival rates on the Main Lease could have been underestimated.
33
Comparing survival between leases for the 3- and 4-year old stock has been restricted to besser block units, because that was the only habitat type common to all R&D lease sites for these age classes. There was no significant difference in cumulative survival across lease sites for either the 3-year old (d.f. = 2,12. F = 2.041, p = 0.173), or 4-year old (d.f.= 2,12, F = 0.515, p = 0.610) year classes (Figure 12b-c).
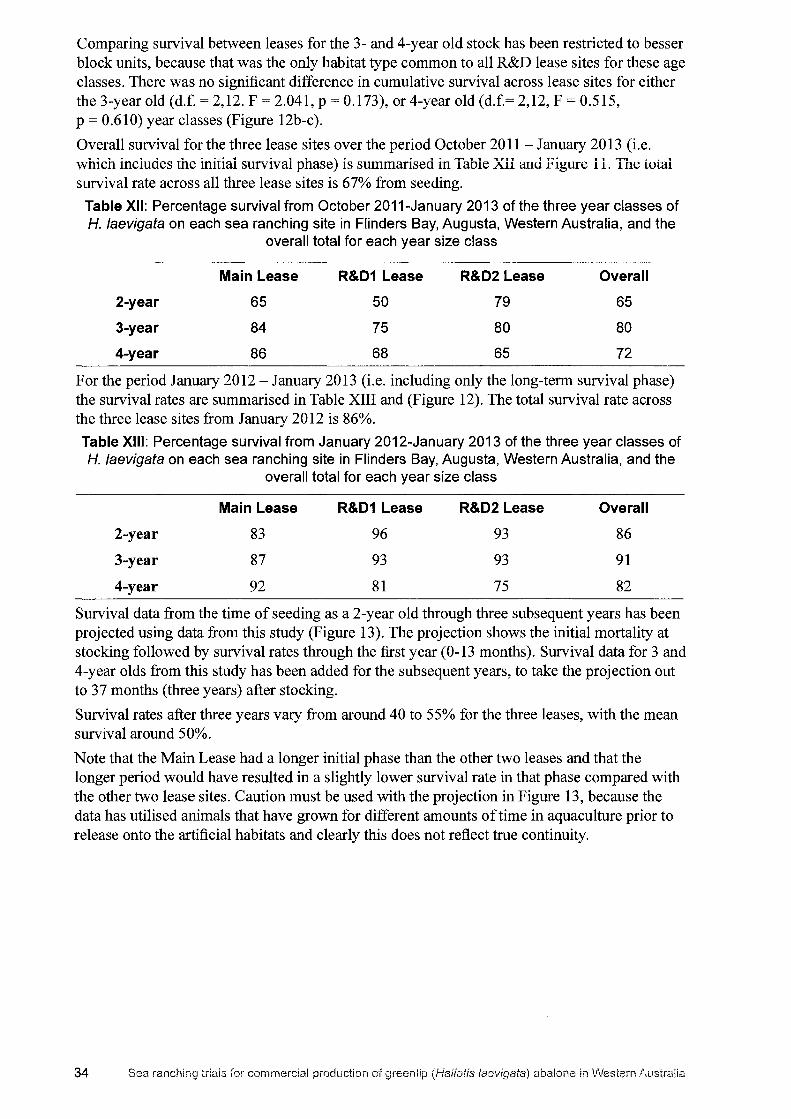
Overall survival for the three lease sites over the period October 2011 - January 2013 (i.e. which includes ihe initial survival phase) is summarised in Table XII and Figure 11. The total survival rate across all three lease sites is 67% from seeding.
Table XII: Percentage survival from October 2011-January 2013 of the three year classes of H. laevigata on each sea ranching site in Flinders Bay, Augusta, Western Australia, and the
overall total for each year size class
2-year
3-year
Main lease
65
84
R&D1 lease
50
75
R&D2 lease
79
80
Overall
65
80
4-year 86 68 65 72
For the period January 2012 -January 2013 (i.e. including only the long-term survival phase) the survival rates are summarised in Table XIII and (Figure 12). The total survival rate across the three lease sites from January 2012 is 86%.
Table XIII: Percentage survival from January 2012-January 2013 of the three year classes of H. /aevigata on each sea ranching site in Flinders Bay, Augusta, Western Australia, and the
overall total for each year size class
2-year
3-year
4-year
Main lease
83
87
92
R&D1 Lease
96
93
81
R&D2 Lease
93
93
75
Overall
86
91
82
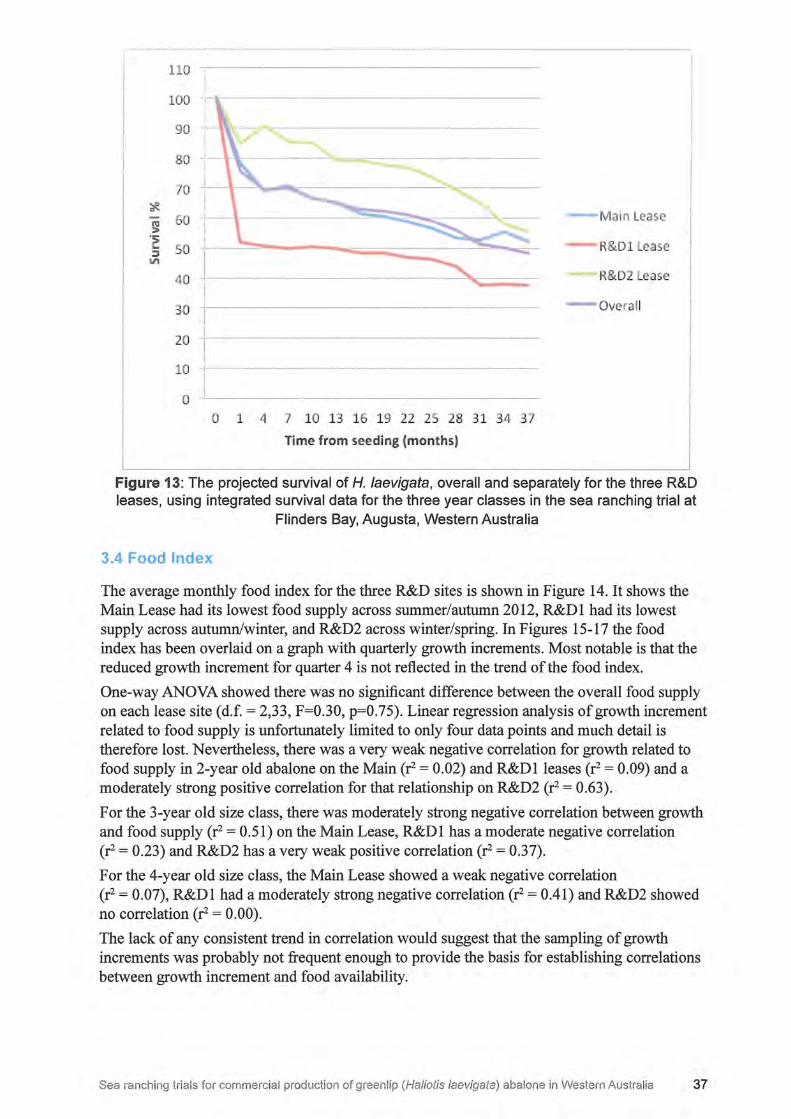
Survival data from the time of seeding as a 2-year old through three subsequent years has been projected using data from this study (Figure 13). The projection shows the initial mortality at stocking followed by survival rates through the first year (0-13 months). Survival data for 3 and 4-year olds from this study has been added for the subsequent years, to take the projection out to 37 months (three years) after stocking.
Survival rates after three years vary from around 40 to 55% for the three leases, with the mean survival around 50%.
Note that the Main Lease had a longer initial phase than the other two leases and that the longer period would have resulted in a slightly lower survival rate in that phase compared with the other two lease sites. Caution must be used with the projection in Figure 13, because the data has utilised animals that have grown for different amounts of time in aquaculture prior to release onto the artificial habitats and clearly this does not reflect true continuity.
34 commercial Western
(a)
110 I
10 I --I
90 I
I e Main Lease
iii 80 I R&Dl Lease >
·~ 70 ' :,
I R&D2 Lease ~
60 [
Overa ll
so I
40 Initial Jan-12 Apr-12 Jul-12 Oct -12 Jan-13
(b)
110
100
~ 90
* = - Main Lease
80 ::sa
ru - R&Dl Lease > ·~ 70 I
:, R&D2 Lease ~
60 - overal l
so
40 Initial Jan-12 Apr-12 Jul-12 Oct-12 Jan-13
(c)
110
100
90
* - Main Lease
80 - R&D1 Lease ru
> ·~ 70 :, R&D2 Lease ~
60 - overall
so
40 Initial Jan-12 Apr-12 Jul-12 Oct-12 Jan-13
Figure 11: Survival from seeding, of H. /aevigata stocked in three R&D leases, in the sea ranching trial at Flinders Bay, Augusta, Western Australia: (a) 2-year, (b) 3-year and
(c) 4-year old size classes
Sea ranching trials for commercial production of greenlip (Haliotis /aevigata) abalone in Western Australia 35
I (a)
Ill >
80
-~ 70 ~----:l
V\
60
50
40 Jan -12
r-· (b)
I
I
I
110
100 -
90 I
iii 80 > I
Apr-12 Ju 1-12 Oct-12 Jan-13
-~ 70 :l
r--------------------V\
(c )
~
1 601-50 t
40 Jan -12
110 1-·
! I 100 t-1 I
Apr-12 Jul -12
90 L----------:.oi-..-...ac:--
Oct-12
- 80 Ill > -~ 70 :l
V\
60 :-----------------!
Jan-13
50 f----------------------
I 40 I l Jan-12 Ap r-12 -------------
Jul-12 Oct-12 Jan-13
- Main Lease
- R&Dl Lease
R&0 2 Le.ase
- overall
-1 - Main Lease
- R&Dl Lease
R&0 2 Lease
- overall
- Main Lease
- R&Ol Lease
R&0 2 Lease
- overa ll
--------Figure 12: Survival of H. /aevigata stocked in three R&D leases in the sea ranching trial at Flinders Bay, Augusta, Western Australia. The initial stocking phase has been excluded: (a)
2-year, (b) 3-year and (c) 4-year old size classes
36 Sea ranching trials for commercial production of greenl ip (Haliotis /aevigata) abalone in Western Australia
110
100 -1-
90
80 -· i
70 '$.
~ 60 l i 50 -,1 --=~-------;;;;;;;;;;;;;;;;::::::--~........_;;--
40
3 -1-------------------i
20 -f-------------1
10 ,-------------------
.! 0
0 1 4 7 10 13 16 19 22 25 28 31 34 37
Time from seeding (months)
Main Lease
- R&D1 Lcase
R&D2 ease
- overall
Figure 13: The projected survival of H. /aevigata, overall and separately for the three R&D leases, using integrated survival data for the three year classes in the sea ranching trial at
Flinders Bay, Augusta, Western Australia
3.4 Food Index
The average monthly food index for the three R&D sites is shown in Figure 14. It shows the Main Lease had its lowest food supply across summer/autumn 2012, R&Dl had its lowest supply across autumn/winter, and R&D2 across winter/spring. In Figures 15-17 the food index has been overlaid on a graph with quarterly growth increments. Most notable is that the reduced growth increment for quarter 4 is not reflected in the trend of the food index.
One-way ANOVA showed there was no significant difference between the overall food supply on each lease site (d.f. = 2,33, F=0.30, p=0.75). Linear regression analysis of growth increment related to food supply is unfortunately limited to only four data points and much detail is therefore lost. Nevertheless, there was a very weak negative correlation for growth related to food supply in 2-year old abalone on the Main (r2 = 0.02) and R&Dl leases (r2 = 0.09) and a moderately strong positive correlation for that relationship on R&D2 (r2 = 0.63).
For the 3-year old size class, there was moderately strong negative correlation between growth and food supply (r2 = 0.51) on the Main Lease, R&Dl has a moderate negative correlation (r2 = 0.23) and R&D2 has a very weak positive correlation (r2 = 0.37).
For the 4-year old size class, the Main Lease showed a weak negative correlation (r2 = 0.07), R&Dl had a moderately strong negative correlation (r2 = 0.41) and R&D2 showed no correlation (r2 = 0.00).
The lack of any consistent trend in correlation would suggest that the sampling of growth increments was probably not frequent enough to provide the basis for establishing correlations between growth increment and food availability.
Sea ranching trials for commercial production of greenlip (Haliotis laevigata) abalone in Western Australia 37
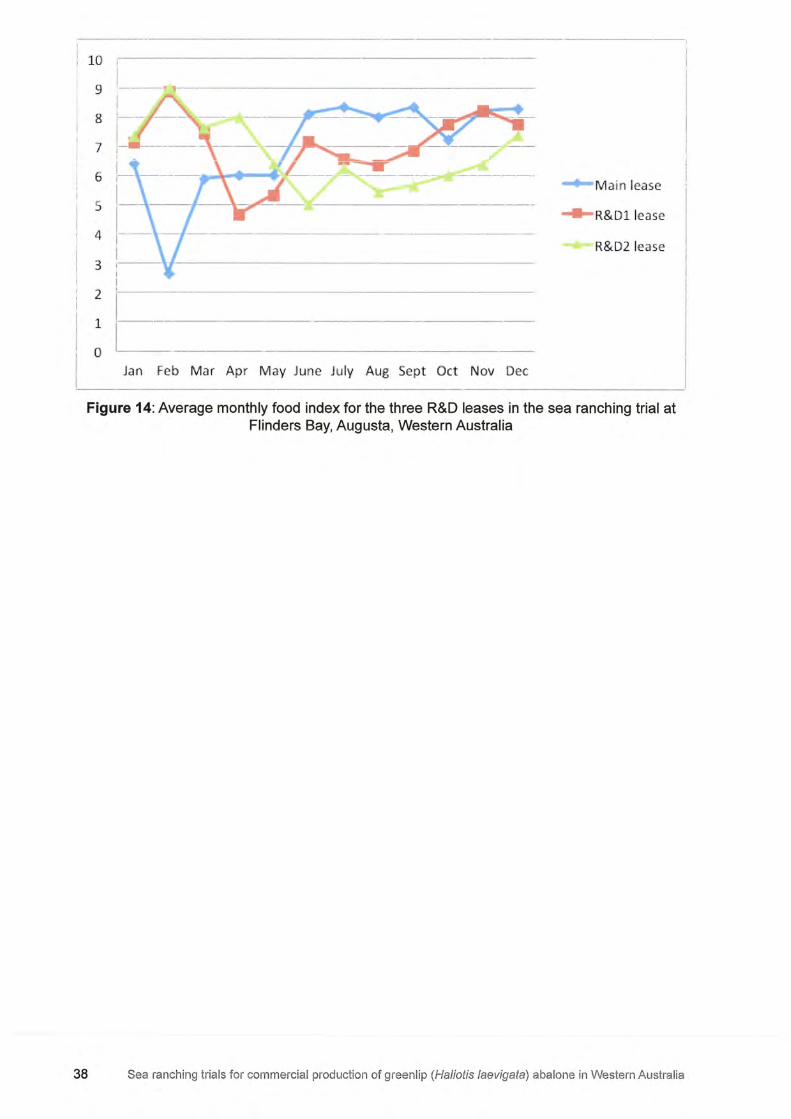
10 1--------
9 I
8
7
6
s
4
3 ,----+------------------------1
2 I
: C ____ _ Jan Feb Mar Apr M ay June July Aug Sept Oct Nov Dec
-+-M ain lease
- R&Dl lease
R&D2 lea se
Figure 14: Average monthly food index for the three R&D leases in the sea ranching trial at Flinders Bay, Augusta, Western Australia
38 Sea ranching trials for commercial production of greenlip (Haliotis /aevigata) abalone in Western Austral ia
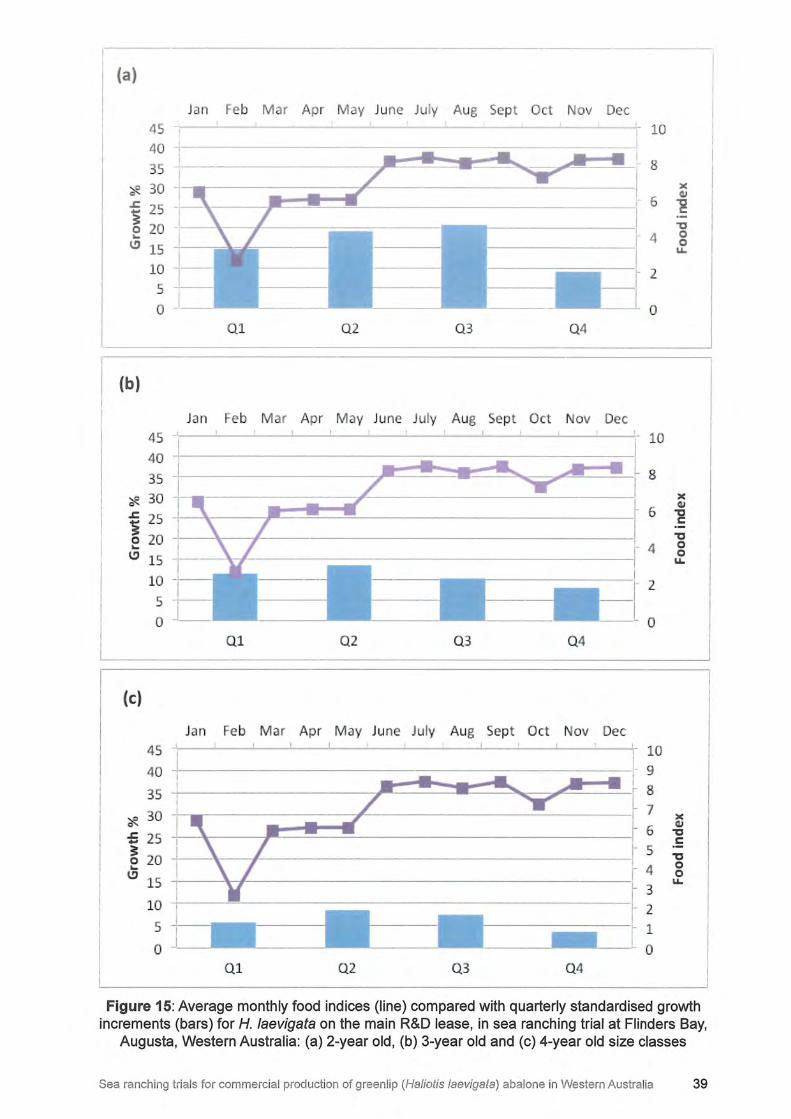
(a)
Jan Feb Mar Apr May June July Aug Sept Oct Nov Dec
45 - 10 40 -3
~ 8 I i
* 30 I ~ 6
i 2 20 0 ...
C) 15 -10 2 5 I
0 _I 0
Ql Q2 Q3 Q4
(b)
Jan Feb Mar Apr May June July Aug Sept Oct Nov Dec
45 -'- ' - 10 I l 40 -8 35 I
* f
~ 25 6
~ 20 0 I ... r 4 .., 15 I
I
r- 2 5 l 0 0
Q1 Q2 Q3 Q4
(c)
Jan Feb Mar Apr May June July Aug Sept Oct Nov Dec 45 _,,_I _ __.. __ .._ _ __._ _ __.. __ ;....__..___....__ _ _,__ _ _..__ __L_ 10
40 ~ 9
35 -t---------,-----------------"'~.J'C----t 8
*- 30 I 7
-s 2s 1-~.....---J~~t:~L _______________ f 6
~ 20 J __ 1- s ... I ~ 4 C) 15 I
' 3 10 -+---=------------------------~ 2 I
S --------~ 1
0 0 Q1 Q2 Q3 Q4
)( Q.I
"C C
"C 0 0
u..
X Q.I
"C C ·-
"C 0 0 u.
X Q.I
"C C
"C 0 0 u.
Figure 15: Average monthly food indices (line) compared with quarterly standardised growth increments (bars) for H. /aevigata on the main R&D lease, in sea ranching trial at Flinders Bay,
Augusta, Western Australia: (a) 2-year old, (b) 3-year old and (c) 4-year old size classes
Sea ranching trials for commercial production of greenlip (Haliotis laevigata) abalone in Western Australia 39
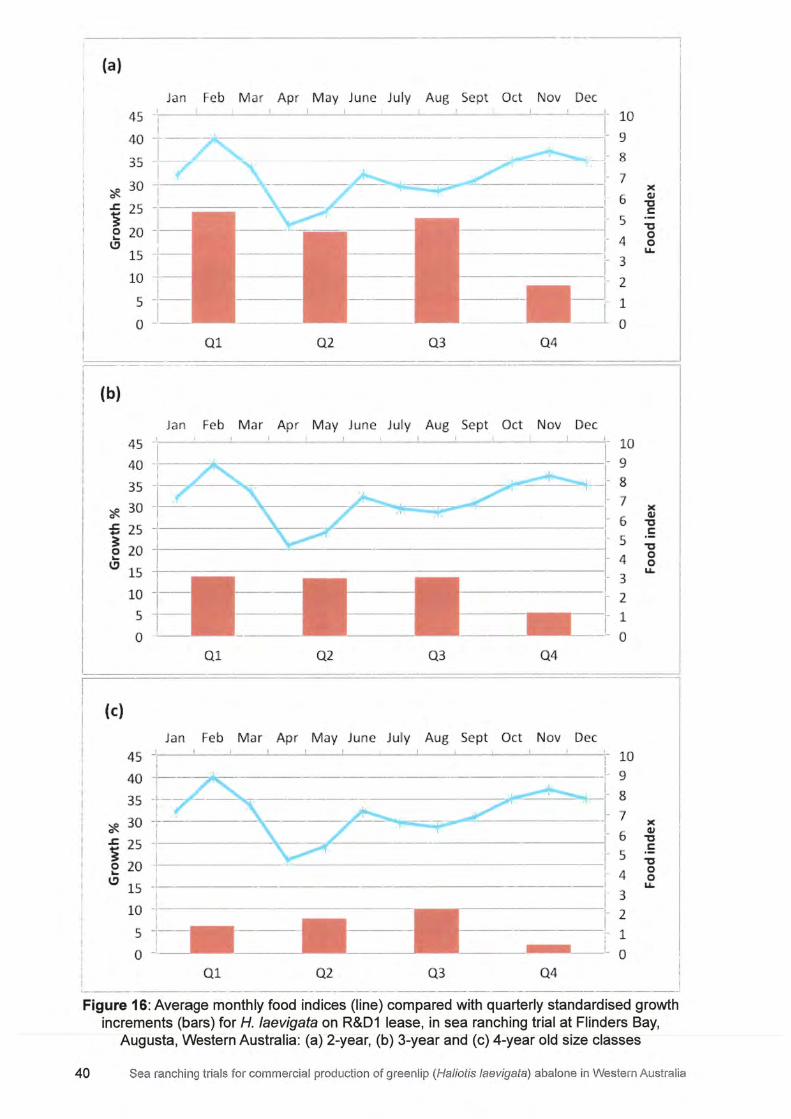
I
---, I
(a)
Jan Feb M ar Apr M ay Ju ne Ju'ly Aug Sept Oct Nov Dec
45 ' I
.l. ' --·- ---l 10 I
40 9
35 8
'$. 30 .c 25 -3 0 20 ...
C) 15
7 )(
6 QJ "t:I C
5 "t:I
4 0 0 u.
3 10 2 5 1
0 0
I Ql Q2 Q3 Q4
~---_-_-__ -_-__ -_._-_-_-__ -:::._-_:_============-=-c====-==-=--=-=--=-=-=--=-=-=-=------··-------1
! (b)
Jan Feb Mar Apr May June July Aug Sept Oct Nov Dec
45 .l___.i
40 I l -
I 35 µ __ · -~ 30 '$. ---~
-5 25 J +-- t ~ 20 ...
C) 15 I
J_ --1 10 I -1: 5 -t-I ___ Ill( __ .
0 -
Ql Q2 Q3 Q4 ---- -----
(c)
Jan Feb Mar Apr M ay June July Aug Sept Oct Nov Dec
45
40
35 ·t-1
'$. 30 -,
.c 25
l 20 -i c, 15
i
10 :-------------!
5 1--· 0 -
Ql Q2
-I l.
-t -l
I C
------1 t· I f·
! :· i
Q3 Q4
10
9
8
7 )(
6 QJ
'"C C
5 '"C
4 0 0
3 u.
2 1
0
10 9
8
7 )(
6 QJ
'"C C
5 '"C
4 0 0
LI.
3 2
1
0
·------- -----------~ Figure 16: Average monthly food indices (line) compared with quarterly standardised growth
increments (bars) for H. laevigata on R&D1 lease, in sea ranching trial at Flinders Bay, Augusta, Western Australia : (a) 2-year, (b) 3-year and (c) 4-year old size classes
40 Sea ranching trials for commercial production of greenlip (Haliotis laevigata) abalone in Western Austral ia
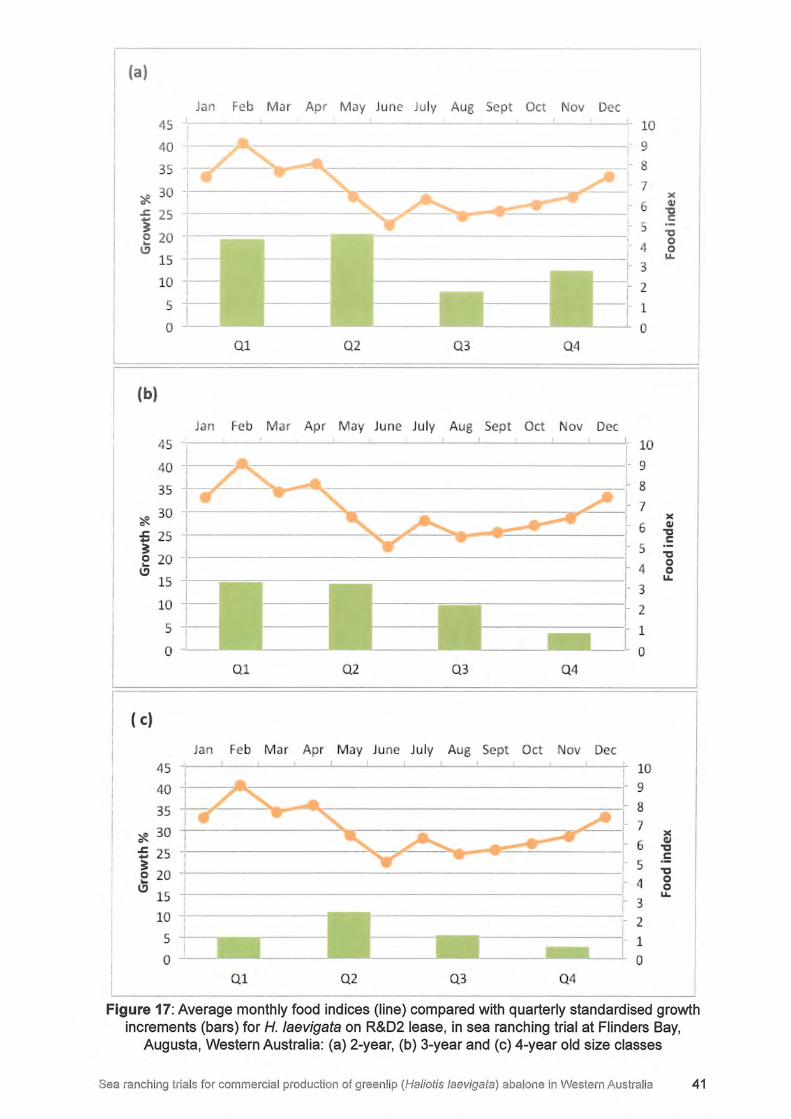
(a)
Jan Feb Mar Apr May June July Aug ept Oct Nov Dec
45 - 10
40 ,---~ .... ----------------------,- 9
35 - 8
"#.. 30 i .t:. 25 _l! _________ __::~ ------:,~ :...::__:~ .... - .. ~~-----
7
6
i 20 -1i-- ---;::::=::::::;-----r-.--------------, C) ! 4
15 I ---- :- 3
10 -1- 2
5 I 1 0 -1~ 0
Ql Q2 Q3 Q4
)( (IJ
"'C C
"'C 0 0
u..
~ I I Jan Feb M ar Apr May June July Aug Sept Oct Nov Dec
45 -.-- ..___ ' .1.. 10 I I
I 40 +1---.a.:---------------------i- 9
35 11- ~ 8 I 7
"#.. 30 +------------''-""------------.,.,;,::..--~ G ~
-,5 25 ! C
~ I I "'C
~ 20 -I 4 g
( c)
0 Ql Q2 Q3 Q4
Jan eb M ar Apr May June July Aug Sept Oct Nov Dec
3
2
1
0
45 - ---- .1. ~ 1. +- 10 I
40 -+---~Ilk-----------------------; 9
35 ~ 8 L 7 "#.. 30 +-------~----''-""-----=-----------,.,,JC.---!
-5 25 r 6 ~ ~1- s ~ 20 -'------------------------... L 4 e> 15 --r----------------------------;!.. 3
1~ j if : o , ___ L _ _._._~ o Ql Q2 Q3 Q4
u..
)( QJ
't::I .5 't::I 0 0
u..
Figure 17: Average monthly food indices (line) compared with quarterly standardised growth increments (bars) for H. /aevigata on R&D2 lease, in sea ranching trial at Flinders Bay,
Augusta, Western Australia: (a) 2-year, (b) 3-year and (c) 4-year old size classes
Sea ranching trials for commercial production of green lip (Haliotis /aevigata) abalone in Western Australia 41
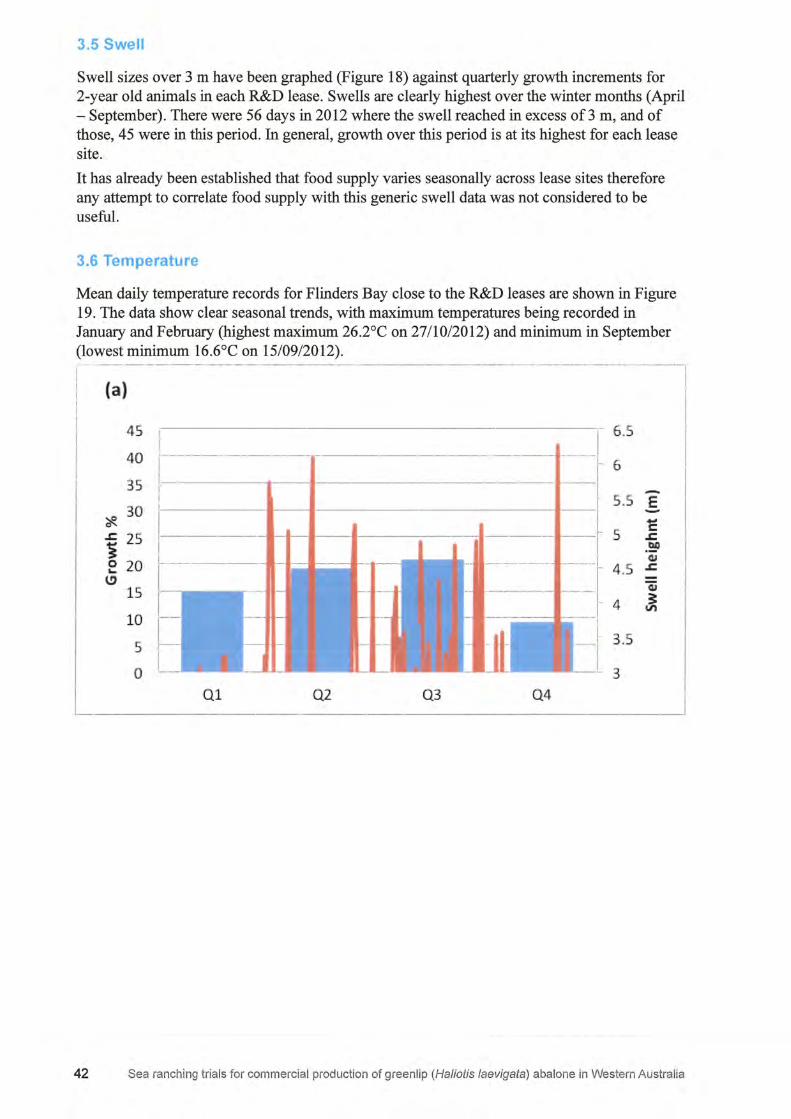
3.5 Swell
Swell sizes over 3 m have been graphed (Figure 18) against quarterly growth increments for 2-year old animals in each R&D lease. Swells are clearly highest over the winter months (April - September). There were 56 days in 2012 where the swell reached in excess of 3 m, and of those, 45 were in this period. In general, growth over this period is at its highest for each lease site.
It has already been established that food supply varies seasonally across lease sites therefore any attempt to correlate food supply with this generic swell data was not considered to be useful.
3.6 Temperature
Mean daily temperature records for Flinders Bay close to the R&D leases are shown in Figure 19. The data show clear seasonal trends, with maximum temperatures being recorded in January and February (highest maximum 26.2°C on 27/10/2012) and minimum in September (lowest minimum 16.6°C on 15/09/2012). r ---------------------------- ------------- ------1
I iai ,--------------------- i Ii 45 j -- -~ ----- 6.S 1,·
,,· :~ ~~---- ---------- --11- :.s g
* ---------- -------- r c --- -r- s ~ -~
f QI
4-.S ~
-------- "ii 4 j ----,
..c 25 i 0 20 ...
C)
15
10 j 3.5
3
5
0 Q1 Q2 Q3 Q4 I
I __J
42 Sea ranching trials for commercial production of greenl ip (Ha/iotis /aevigata) abalone in Western Austral ia
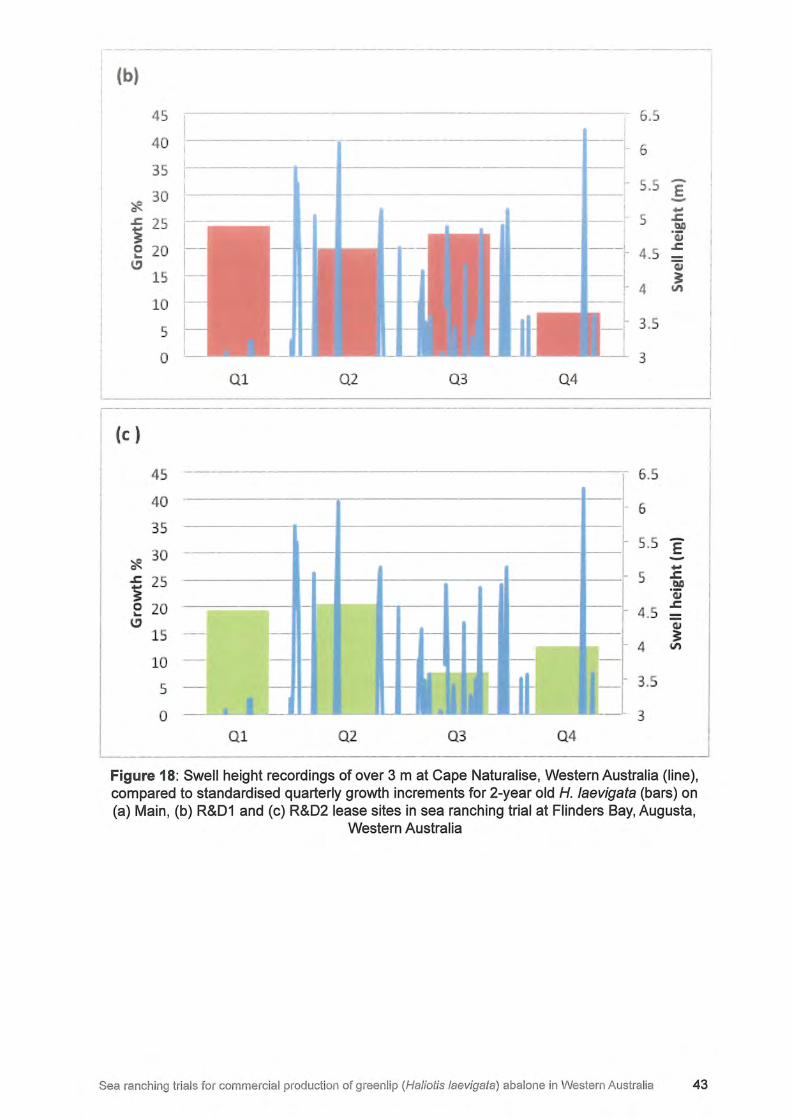
I (b)
4 6.
40 ---------- -------------
35
'*-30
,... -e .c 2 i 0 20 ...
l!) 15
10
5
0 0 1 Q2 Q3 04
·--i (c)
4 6.
40 - 6 35
'$.. 30 - e
.... .c 2 3 0 20 ...
l!) 1
10
,...
-
- ,- - - I_
5 ..c Ill) ·;
4.5 ..c
C1.I
4 3 tn
5
0
- Lut: 1 -
• I I 3.
3 Q1 Q2 Q3 ,04
Figure 18: Swell height recordings of over 3 mat Cape Naturalise, Western Australia (line), compared to standardised quarterly growth increments for 2-year old H. laevigata (bars) on (a) Main, (b) R&D1 and (c) R&D2 lease sites in sea ranching trial at Flinders Bay, Augusta,
Western Australia
Sea ranching trials for commercial production of greenlip (Ha/iotis laevigata) abalone in Western Australia 43
I
I I
I
I
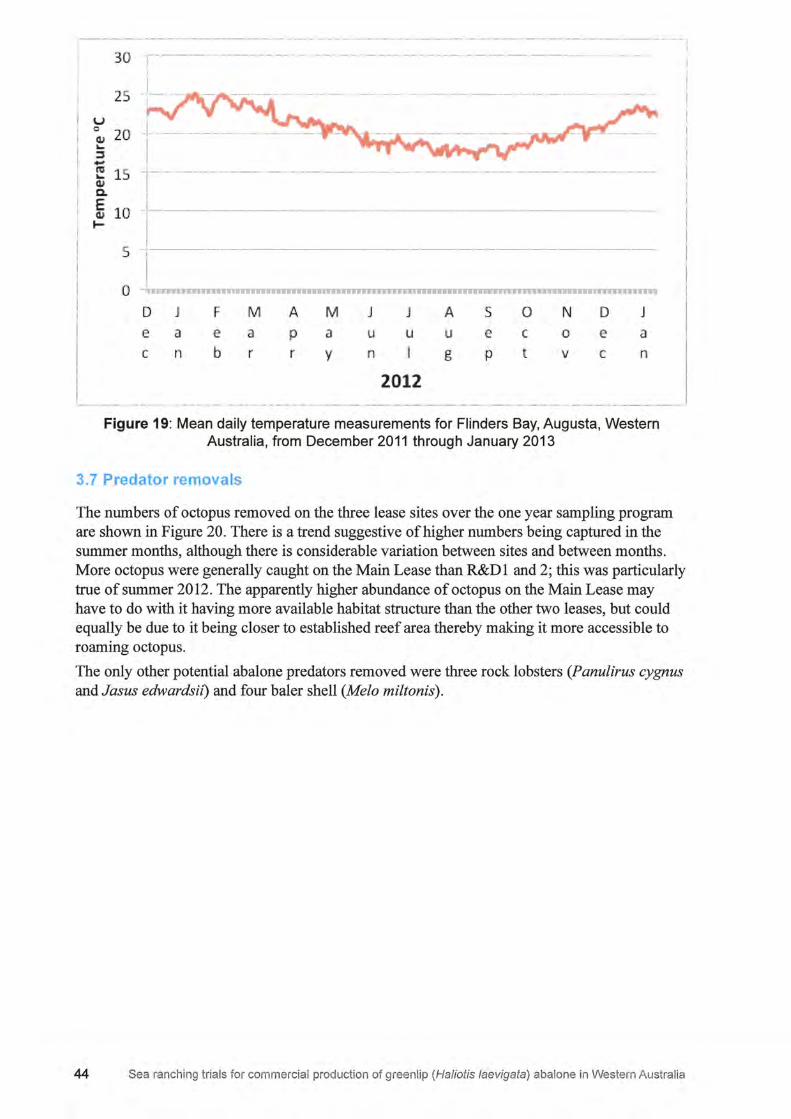
30 :----·---
25
u I 0 20 --i- ------ -- -- ··-
Cl.I ... ::I -nl 15 -i- --·----- ------... Cl.I Q. I E 10 -J-Cl.I I- I
I 5 -r
---·-------·----------·
I 0 -hi 1•••••••••••••••••1111aa1111wa1111111111111a11111aa11aaw1 nrm
D J F M A M e a e a p a C n b r r y
J J A u u u n I g
s e
p
0 C
t
N
0
V
D e C
J a n
! 2012 L_ .. ______ ----- ----- - - -·-·---·- --------·- ---·-----·- -----·--·------ - ·-·- -- -- -- --- .
Figure 19: Mean daily temperature measurements for Flinders Bay, Augusta, Western Australia, from December 2011 through January 2013
3.7 Predator removals
The numbers of octopus removed on the three lease sites over the one year sampling program are shown in Figure 20. There is a trend suggestive of higher numbers being captured in the summer months, although there is considerable variation between sites and between months. More octopus were generally caught on the Main Lease than R&D 1 and 2; this was particularly true of summer 2012. The apparently higher abundance of octopus on the Main Lease may have to do with it having more available habitat structure than the other two leases, but could equally be due to it being closer to established reef area thereby making it more accessible to roaming octopus.
The only other potential abalone predators removed were three rock lobsters (Panulirus cygnus and Jasus edwardsii) and four baler shell (Melo miltonis).
44 Sea ranching trials for commercial production of greenlip (Haliotis laevigata) abalone in Western Austral ia
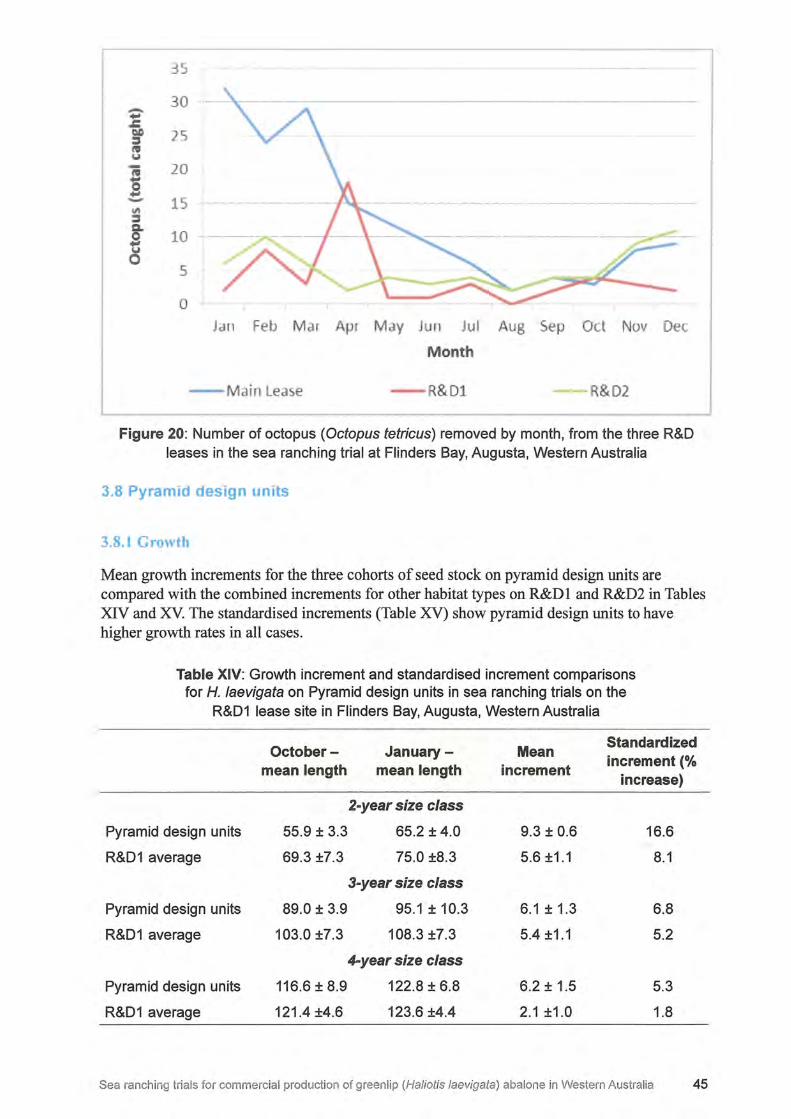
3~
30 -.... .I: tlO = 25 C'O 1,1
ii 20 0 .t=. 15 Ill = c.
10 0 ... 1,1
0 5
0
Jan Feb Mar Apr May Jun Jui Aug Sep Oct Nov Dec
Month
Main Lease R&D1 R&D2
Figure 20: Number of octopus (Octopus tetricus) removed by month, from the three R&D leases in the sea ranching trial at Flinders Bay, Augusta, Western Australia
3.8 Pyramid design units
3.8.1 Growth
Mean growth increments for the three cohorts of seed stock on pyramid design units are compared with the combined increments for other habitat types on R&D 1 and R&D2 in Tables XIV and XV. The standardised increments (Table XV) show pyramid design units to have higher growth rates in all cases.
Table XIV: Growth increment and standardised increment comparisons for H. /aevigata on Pyramid design units in sea ranching trials on the
R&D1 lease site in Flinders Bay, Augusta, Western Australia
October- January- Mean Standardized increment (%
mean length mean length increment increase)
2-year size class
Pyramid design units 55.9 ± 3.3 65.2 ± 4.0 9.3 ± 0.6 16.6
R&D1 average 69.3 ±7.3 75.0 ±8.3 5.6 ±1.1 8.1
3-year size class
Pyramid design units 89.0 ± 3.9 95.1±10.3 6.1 ± 1.3 6.8
R&D1 average 103.0 ±7.3 108.3 ±7.3 5.4 ±1.1 5.2
4-year size class
Pyramid design units 116.6 ± 8.9 122.8 ± 6.8 6.2 ± 1.5 5.3
R&D1 average 121.4 ±4.6 123.6 ±4.4 2.1 ±1.0 1.8
Sea ranching trials for commercial production of greenlip (Haliotis /aevigata) abalone in Western Australia 45
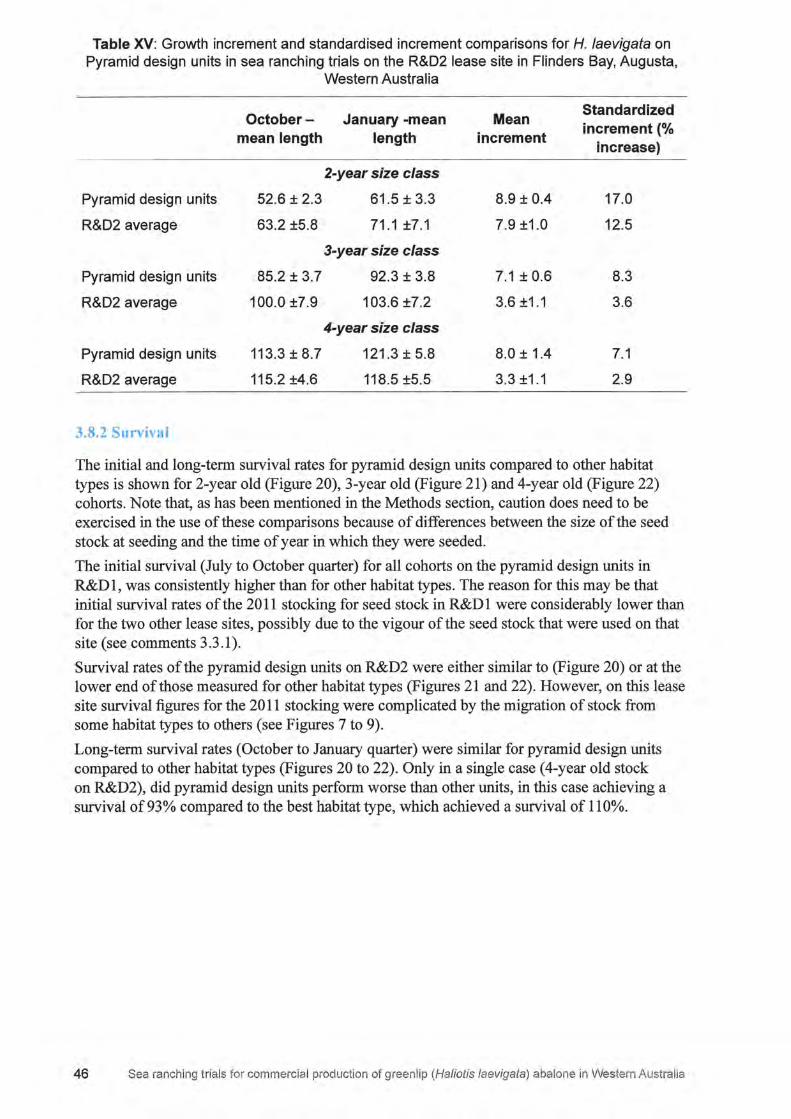
Table XV: Growth increment and standardised increment comparisons for H. /aevigata on Pyramid design units in sea ranching trials on the R&D2 lease site in Flinders Bay, Augusta,
Western Australia
October- January -mean Mean Standardized increment (%
mean length length increment increase)
2-year size class
Pyramid design units 52.6 ± 2.3 61.5 ± 3.3 8.9 ± 0.4 17.0
R&D2 average 63.2 ±5.8 71.1 ±7.1 7.9 ±1.0 12.5
3-year size class
Pyramid design units 85.2 ± 3.7 92.3 ± 3.8 7.1 ± 0.6 8.3
R&D2 average 100.0 ±7.9 103.6 ±7.2 3.6 ±1.1 3.6
4-year size class
Pyramid design units 113.3 ± 8.7 121.3 ± 5.8 8.0 ± 1.4 7.1
R&D2 average 115.2 ±4.6 118.5 ±5.5 3.3 ±1.1 2.9
3.8.2 Survival
The initial and long-term survival rates for pyramid design units compared to other habitat types is shown for 2-year old (Figure 20), 3-year old (Figure 21) and 4-year old (Figure 22) cohorts. Note that, as has been mentioned in the Methods section, caution does need to be exercised in the use of these comparisons because of differences between the size of the seed stock at seeding and the time of year in which they were seeded.
The initial survival (July to October quarter) for all cohorts on the pyramid design units in R&D 1, was consistently higher than for other habitat types. The reason for this may be that initial survival rates of the 2011 stocking for seed stock in R&D 1 were considerably lower than for the two other lease sites, possibly due to the vigour of the seed stock that were used on that site (see comments 3.3.1).
Survival rates of the pyramid design units on R&D2 were either similar to (Figure 20) or at the lower end of those measured for other habitat types (Figures 21 and 22). However, on this lease site survival figures for the 2011 stocking were complicated by the migration of stock from some habitat types to others (see Figures 7 to 9).
Long-term survival rates (October to January quarter) were similar for pyramid design units compared to other habitat types (Figures 20 to 22). Only in a single case ( 4-year old stock on R&D2), did pyramid design units perform worse than other units, in this case achieving a survival of93% compared to the best habitat type, which achieved a survival of 110%.
46 Sea ranching trials for commercial production of greenl ip (Haliotis /aevigata) abalone in Western Australia
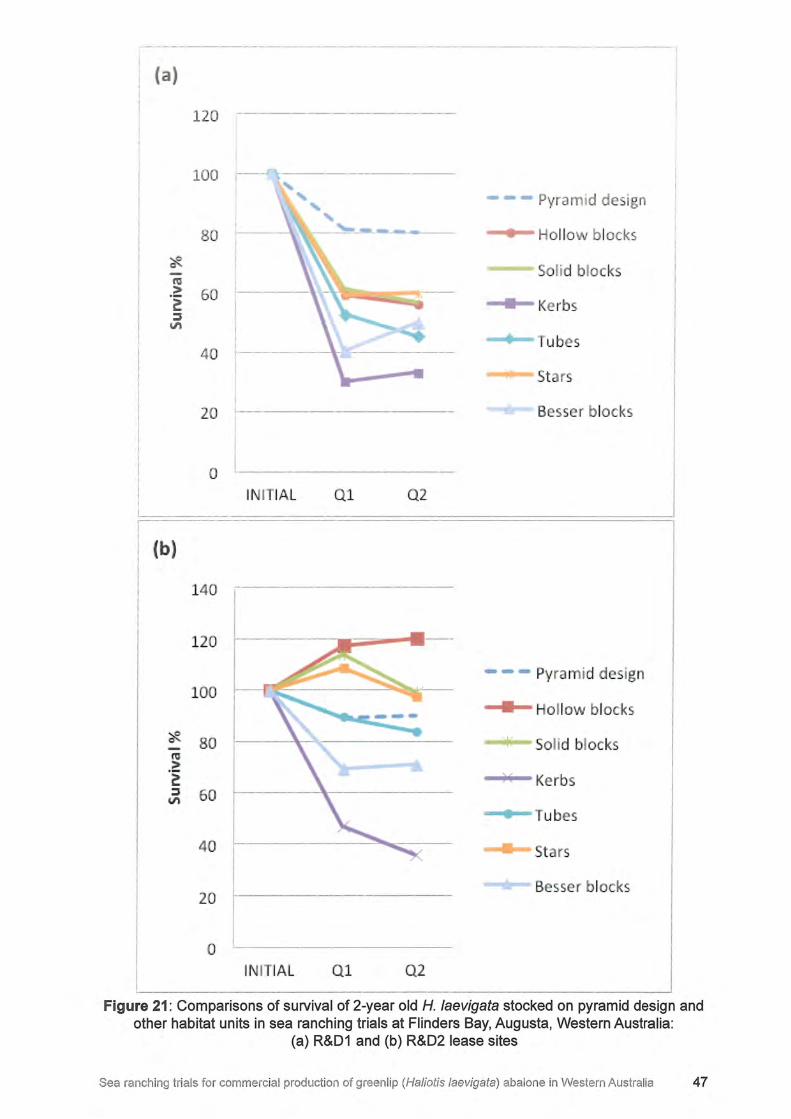
(a)
120
100 I ---- ---------------~
' - - - Pyramid design
' ' 80 ~---------- • Hollow blocks
'#.. Solid b lock ~
> 60 -----~ • Kerbs :::s
"' • ;ubes 40 !---------
I I Stars
I Besser b locks 20 r-
i
I I
' I
I
0 L I I
I INI IAL Ql Q2 I [__ ___
I (b)
I 140 I
120
- - - Pyramid design 100 • Hollow blocks
'#.. 80 Solid blocks ~ > -~ Kerbs :::s 60 "' • ubes
40 St ars
20 Besser blocks
0 INI IAL Ql Q2
Figure 21: Comparisons of survival of 2-year old H. /aevigata stocked on pyramid design and other habitat units in sea ranching trials at Flinders Bay, Augusta, Western Australia:
(a) R&D1 and (b) R&D2 lease sites
Sea ranching trials for commercial production of greenlip (Haliotis /aevigata) abalone in Western Australia 47
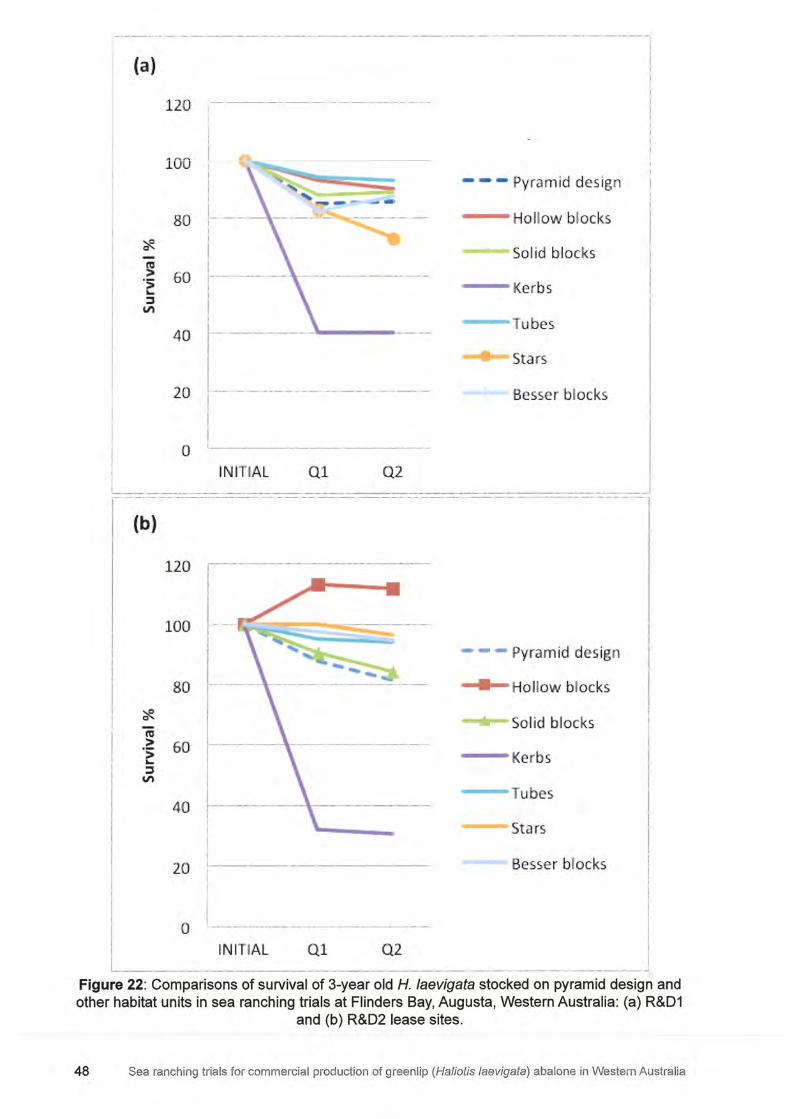
(a)
120
100 ,
80
' I 60 t-·-' I I
40 [--- ------- -----1
I I 20 r--- - - -- - ----- ------- -- -----
1
0 -- ------ ------- -
- :
- - - Pyramid design
---Ho.llow blocks
Sol:id b:locks
---Kerbs
---Tubes
Besser blocks
i ! I I I
I I
I I lrNI IAL Q1 Q2 1
[_______ ------------------------------- --· j ,- -- -------- --------------------- ---- -··--·-·--- -- --·--·-
(b)
120
100
80
'*' n, > 60 -~ ::J
VI
40
l_ -I
I t------
1 I
~------------
1 ,-----i
20 [ __________ _
I i
l_ ------------I I o L lNt IAL
-·-------Q1 Q2
- - - Pyramid des1ign
• Ho llow blocks
SoHd blocks
---Kerbs
---Tubes
Sta rs
Besse r blocks
I
I i
·-- ____________ __J
Figure 22: Comparisons of survival of 3-year old H. /aevigata stocked on pyramid design and other habitat units in sea ranching trials at Flinders Bay, Augusta, Western Australia: (a) R&D1
and (b) R&D2 lease sites.
48 Sea ranching trials for commercial production of greenlip (Haliotis laevigata) abalone in Western Australia
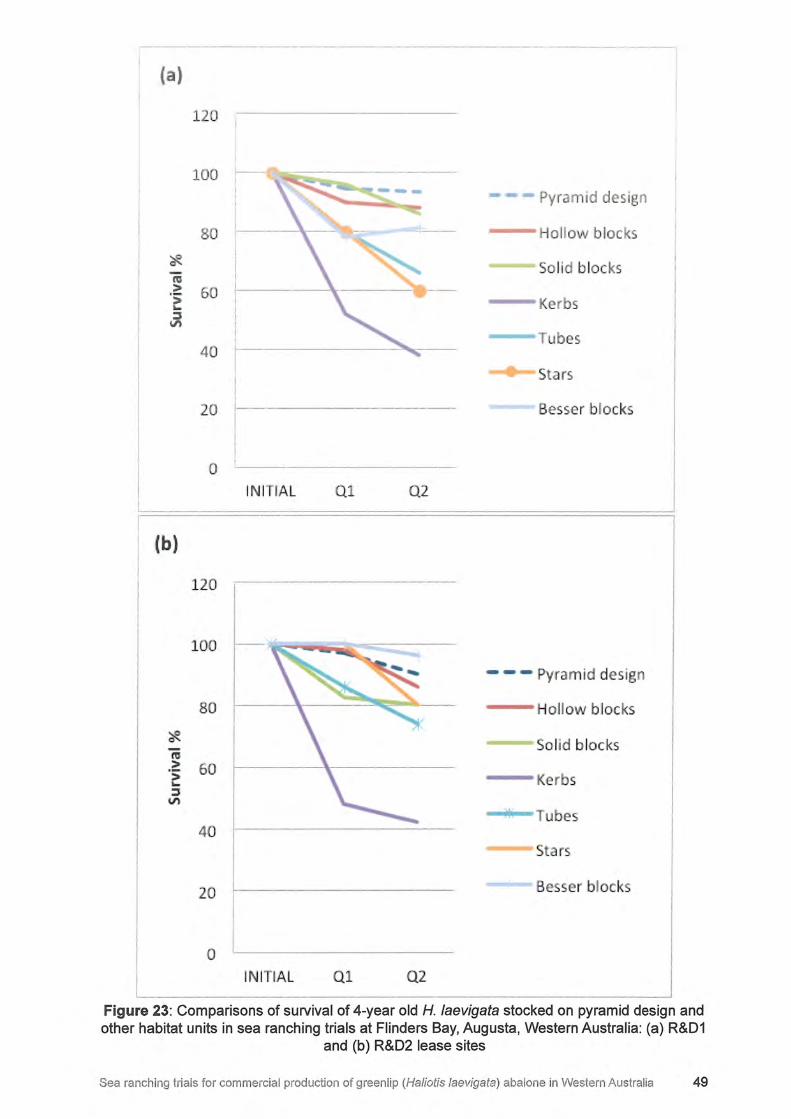
(a)
120
100 - - - Pyramid design
80 Hollow b locks
'*- So lid blocks ro I
> 60 I
·~ r-I Kerbs I :::, I
U'\ I
! Tubes 40
I St ars I
20 I Besser b locks
I 0
INI IAL Ql Q2
(b)
120 I
100
- - - Pyramid design
80 Hollow hlocks
'* Soliid b locks ro > 60 -~ Kerbs :::,
U'\
Tubes 40
Stars
20 Be ser b locks
0 INI IAL Ql Q2
Figure 23: Comparisons of survival of 4-year old H. laevigata stocked on pyramid design and other habitat units in sea ranching trials at Flinders Bay, Augusta, Western Australia: (a) R&D1
and (b) R&D2 lease sites
Sea ranching trials for commercial production of green lip (Haliotis laevigata) abalone in Western Australia 49
4.0 Discussion
It is important to understand that this abalone sea ranching feasibility trial was undertaken as a proof-of-concept initiative, with the focus on establishing a commercial venture and was not an academic exercise. With a more research orientated focus it is likely that more rigor would have been applied to the sampling design and perhaps the length of the experiment may have been longer to provide better long-term estimates of growth. The sampling design has for example: not maintained similar stocking densities for all abalone year classes across all habitat types, has only measured abalone on individual habitat types on the Main Lease, has not maintained similar habit types across the three R&D sites and various other shortcomings. However, while these pose challenges for statistical comparisons of the performance of different habitat types across R&D sites, they do not detract from the obvious potential for this form of abalone aquaculture shown by the trial.
The idea of sea ranching of abalone on artificial habitat in Australia is not new. The seeding of juvenile abalone onto concrete modules was apparently practiced commercially at Flinders Island, Tasmania (Shepherd et al. 2000), although this has been discontinued in more recent times (Gardner, University of Tasmania, pers. comm.). Additionally, the stocking of artificial habitat with greenlip abalone have previously been undertaken at Port Lincon, South Australia (Shepherd et al. 2000) and Port Phillip Bay, Victoria (James 2005; James et al. 2007). Neither of these trials translated into subsequent commercial ventures, in the former case because there was no further uptake by Industry and in the latter case because the study site was shown not to be suitable for sea ranching of abalone.
Compared to the results from the above Australian sea ranching investigations and to the many published stock enhancement research studies (inter alia Masuda and Tsukamoto (19980; Sweijd et al. (1998); Tegner (2000); Hart et al. (in press a)), the results from this pilot abalone sea ranching project are very promising in terms of the ability to stock at relatively high densities and at the same time to support excellent survival and growth rates.
4.1 Validation
The validation work was done up to a couple of weeks after the counts were completed and there were variations (mostly small) between Brad Adams' counts and those of the Curtin University dive team. Those variations could have been the result of a number of different causes. They could have been counting errors by one or other party. Alternatively, they could have been caused by small movements of the abalone between habitat units and between days that the stock was counted. An equally likely, cause for these discrepancies in counts is that at any one time there can be a portion of the seed stock covered by sand. Changing sea conditions continually lead to movements of sand on the lease sites and this can result in abalone being covered for short periods of time until a different set of sea conditions move the sand and expose previously buried animals.
4.2 Survival
While there was an initial spike in mortality in the weeks following the seeding of juvenile abalone onto the artificial habitats, survival rates thereafter were well beyond expectations based on the results of published enhancement studies (e.g. Hart et al. (in press a)). The size of juvenile abalone at seeding is a critical aspect, with smaller individuals having substantially higher initial mortality rates. A spike in mortality following the placement of aquacultured juvenile abalone in the wild environment is a well-known feature of newly settled animals (Saito 1984; de Waal and Cook 2001) which has been attributed to a multitude of factors.
De Waal and Cook (2001) have suggested that some aquaculture-reared animals may not develop sufficient muscle strength to withstand wave action in the natural environment, leading
50 Sea ranching trials for commercial production of greenl ip (Haliotis /aevigata) abalone in Western Australia
greenlip abalone populations.
physical -~·•-A••~AA -~•••~•-<- seeding is an obvious :::;:;:;r,c?,lT,cuu cause for elevated mortality ,un·~n, process of transporting animals from a growout facility to the of release in the wild is, even the best of intentions planning, always going to be stressful to the animal. Much can be done to uu,.u,,,,.,...,.., the stress and developing protocols for the holding and transport of seed stock from the hatchery to the point of release such as has been done for H rubra by Heasman et al. (2004 ), is a worthwhile investment. Tegner and Butler (1985) reported that the mucus produced by stressed abalone attracted predators and this led to the development of "planting modules" along the lines of the module reported on in McCormick et al. (1994). The function of these modules is to provide shelter to newly settled abalone, and thereby protect them from predators for a day or two until they have become more settled and therefore less stressed in their new environment. The success of these units in improving immediate post-settlement survival is universally accepted and various adaptations of the modules are used in most abalone seed stocking deployments.
This study showed higher initial mortality rates for the three year classes across and within each R&D site compared to any single subsequent quarterly period sampled. It is not clear which of the above possible causes contributed to the high initial mortality, but two habitat types in this study (kerb and besser) had significantly higher mortality rates compared to other habit structures. These two habitat types were the only ones seeded by hand without a planting module, because of difficulties in attaching the modules to those structures. Their higher mortality rate substantiates the importance of providing protection for seed stock at deployment.
The seed stock that were released by hand were slotted into the sand around the sides of the reef leaving the sand to hold the abalone against the surface of the star and besser blocks until the foot had attached to the structure. Brad Adams, who was doing the seeding, was aware that the mortality rates were likely to be higher on these structures than other habit types because he observed fish predators (mainly wrasses) predating on the abalone before they had chance to firmly attach themselves.
The results from this study show that size at seeding is an important determinant of survival. Across habitat types, 4-year old seed stock had higher survival than 3-year olds and 3-year olds better survival rates than 2-year olds. Decreasing mortality rates with size and age are a feature common to most animals and are therefore not an unexpected result. Improved survival rates using larger/older seed stock have been reported on in numerous enhancement studies for a variety of different abalone species ( e.g. H iris (Roberts et al. 2007); H midae ( de Waal and Cook 2001); H. discus hannai (Saito 1984)). The relevance of this finding lies in its economic application, which is the need for any commercial sea ranching operation to optimize the lower survival of small individuals against the higher cost of large individuals.
Several abalone stock enhancement studies (Shepherd et al. 2000; Heasman et al. 2004; James 2005; Roberts et al. 2007) have reported on relationships between stocking density and survival. The conclusions from these studies were similar in that all showed their data
51
to indicate a tendency suggestive of decreasing survival with increased stocking density, but in no case were these observed trends significant. Both Heasman (2004) and James (2005) commented on their data being suggestive of their different initial stocking densities converging towards a longer term range that probably reflected the carrying capacity of the habitat. More recent work by (Hart et al. in press a; Hart et al. in press b) has adopted these considerations in a practical sense, by using a size-dependent mortality model to tailor release densities of greenlip abalone used to enhance experimental sites, to match surrounding wildstock densities.
Despite the lack of consistency in the stocking density of different habitat structures in this study, differences in survival after the initial drop off following seeding were not significant. This suggests that the stocking densities which ranged between 20-60 m-2, were within the bounds of what could be supported by the habitat.
This range of stocking density is a theoretical level which is based on the area of available surface for abalone to colonise on the habitat structures. It assumes that the habitat structure rests on one surface and that all other surfaces are colonized. In reality, the abalone aggregate on the sides of the habitat structures at the interface between where the habitat structures lie above the sandy seabed on which they are located. This interface between sand and colonisable surface periodically changes in response to sand movement caused by strong sea conditions and therefore the amount of actual surface available for colonization is variable, but always below the theoretical available surface area. Routine diving on the habitat structures has shown that the abalone are content to remain attached to the habitat structures while covered by sand for several days.
Some habitat structures have been less successful in providing available habitat for colonization than others. Because of their low relief, the kerb units for example, have been shown to become submerged under sand more easily than some of the other habitat types. This has particularly been the case on R&D2, where the sand sediment is finer than on the other two sites (Brad Adams pers. comm.). Other habitat types such as the tubes, while apparently providing a large amount of surface area, provide far less actual colonisable area. Approximately a third to even a half of the pipe can be buried and therefore unavailable for habitation. In addition, the greenlip abalone avoid colonizing the large amount of available area inside the pipes and only utilize the inside front 20 cm at the opening of the pipes.
The pyramid design units have not been a focus of this study because trials for these units are still underway. However, it is obvious from observing these structures underwater, that they will be less affected by the buildup of sand against their surfaces than the other units, which will mean that more surface will consistently be available for colonization. Furthermore, the design with its holes and crevices leading into the central open area appears to be ideal for trapping algae and circulating water. It is clear from observing the behavior of the abalone, that they utilize most of the surfaces and seem to particularly favor the inside chamber which funnels the water upwards and out of the chimney, in the process putting the algae into suspension where it is trapped and fed on by the animals occupying the inside surface.
Although survival rates of pyramid design habitat units have been compared to other habitat types in this study, it does need to be borne in mind that such comparisons are not ideal, because the units were seeded at different times of the year and by abalone of the same age, but different mean size. Survival rates are closely related to the size at which they are seeded and the time of year that seeding takes place could also be an important determinant of survival if the type and abundance of predators were to show seasonal differences through the year.
4.3 Growth
Growth increments over the one-year sampling was found to be similar ( differences were not significant) across all habitat types and across the three R&D sites. To some extent this result
52 Sea ranching trials for commercial production of greenlip (Haliotis /aevigata) abalone in Western Australia
Other ~iL~VH 2004) have enhanced n•n,,,,~ of a reduction density of as little as 40%, but a different study manipulated densities of Haliotis iris (McShane and Naylor 1995a), to show any response in the growth rate that species. Growth rates of abalone have been shown to be more responsive to experiments where animals have been translocated to areas of more ab~ridant or better quality food and various authors (Emmett and Jamieson 1989; McShane and Naylor 1995b; Dixon and Day 2004) have shown increased growth rates in different species of abalone as a result of such translocation experiments. While growth increments in this study were not impacted by the stocking densities, they did show seasonal differences across the board for all size classes (Figures 15 to 17).
The smaller growth increments recorded in the fourth quarter for all size classes in this study are most likely due to the animals redirecting their energy away from somatic growth and into gonadal production. Greenlip abalone mature at around three years and - 7 5 mm in size and spawn in spring and summer from October through March (Shepherd and Laws 1974). Other possible causes for the downturn in growth in the fourth quarter could be due to a response to food quality or physical environmental variable such as temperature.
Growth increments decreased with age, particularly between 3 and 4-year old seed stock. This is because there is a non-linear relationship between length and weight, which means that small increases in length result in proportionally much larger increases in weight. The 2, 3 and 4-year old year classes in this study were still in a very strong growth phase in terms of increases in both their length and meat weight (meat weight increases not shown) and this is why these three year classes could not be used to estimate an asymptotic length (Loo).
The growth rates recorded in this study were very similar to the average growth rates recorded by Hart et al. (in press a) for H laevigata in the wild at Augusta, close to the experimental sea ranching sites reported on in this study. A I-way ANOVA analysis of the merged data from this study ( as seen in figure 7b) compared with data from the Hart study shows there is no significant difference in the growth rates across the period 2.25 -4.25 years (d.f. = 1,6, F = 0.000, p = 0.996). Caution must again be used with this result owing to the study data being merged.
Preliminary growth data have been included in this report for stock seed on pyramid design habitat units. There are important differences between data for pyramid design units and that for all other units, which necessitate considering any comparisons of growth between these habitat types being treated with caution.
The pyramid design units were seeded seven months after the other habitat types and during this time the seed stock abalone were held under aquaculture conditions. As a result of this longer holding period in tanks, their growth had been compromised and they were substantially smaller compared to the same aged abalone that had been stocked on other units at the start of these trials. The standardized increment (percentage increase in size) is probably the most useful index of comparison between growth on pyramid design and other habitat types and in
of 53
all cases this showed the abalone on pyramid design units to be faster growing. However, it may be that smaller individuals, even of the same age, increase in size proportionally faster and this needs to be borne in mind when considering these data.
4.4 Environmental data
The temperature for Flinders Bay is at the warm end of the range considered by Gilroy and Edwards (1998) to be optimal for growth of greenlip abalone. These authors showed the species to have a preferred temperature of - l 9°C and they regarded - l 8°C as being most favourable for growth. They showed temperatures of>25°C to be detrimental to the well being of the animals, with increasing numbers of experimental animals being unable to survive temperatures above 25°C. Lethal (i.e. 100% mortality) of Gilroy and Edwards' (1998) experimental greenlip abalone occurred at around 30°C.
4.5 Comparisons with other abalone enhancement and ranching studies
The results recorded by this abalone sea ranching trial have surpassed all expectations in terms of the survival of the seed stock. The reason for this is that expectations of what might be achievable were based on previous stock enhancement and sea ranching research which while showing some promise, had not achieved outstanding rates of survival.
Whereas the integrated survival data for the three different year classes in this trial suggests that survival rates after three years would have been around 40 to 50% (Figure 13), those for Hart et al. (in press a) were suggestive of survival rates for a similar period of 6 to 20%. Dixon et al. (2006) recorded variable survival rates in their experiment of between O and 57%, but this was after the seed stock had only been at large for nine months.
The high survival rates of the two year old abalone seed stock (-40 mm) in this study was particularly unexpected, because previous studies have reported that greenlip occupy in cryptic habitats at this size. Dixon et al. (2006) for example, found in their study that 97% of juveniles with a mean size of 44 mm were cryptic and even when they had reached a mean size of 56 mm, only 17% had emerged into the open. The habitat structures in this study offered only exposed surfaces.
The reason for the very high survival rates recorded here might actually lie in the artificial habitats used in this study being non-complex in terms of structure and being relatively barren in terms of biological diversity compared to wild reefs. Exposed surfaces may harbor fewer predators than cryptic habitat. Additionally, invertebrate abalone predators were regularly removed from the habitats throughout the trials. We believe this ecologically artificial and uncomplicated environment might be a major contributor to its success, because without many of its known predators, the abalone had much greater chance of surviving.
Greenlip abalone, depending on their size, have numerous predators. Shepherd (1986) and Shepherd et al (2000) listed stingrays, wrasses, sea stars, crabs and whelks as potential predators and they specifically stated that they had not observed, nor did they suspect octopus of being predators of abalone. Other studies on H laevigata and other species of abalone, have recorded octopus as being predators ( e.g. (Hart et al. in press b) and Tegner and Butler (1985) recorded over 30% of seeded red abalone (H rufescens) shells that they recovered as having been predated on by octopus. Tegner and Butler (1985) also recorded spiny lobsters predating on seed stock.
Octopus were observed predating on seeded abalone on several occasions in this sea ranching trial and there is little doubt in our view that had the 265 octopus that were removed during the course been allowed to remain, that survival rates would have been seriously impacted compared to those that were recorded. Only three spiny lobsters were removed from the study site over the course of the trial and it is well known that they can remain resident in one area
54 Sea ranching trials for commercial production of greenlip (Haliotis /aevigata) abalone in Western Austral ia
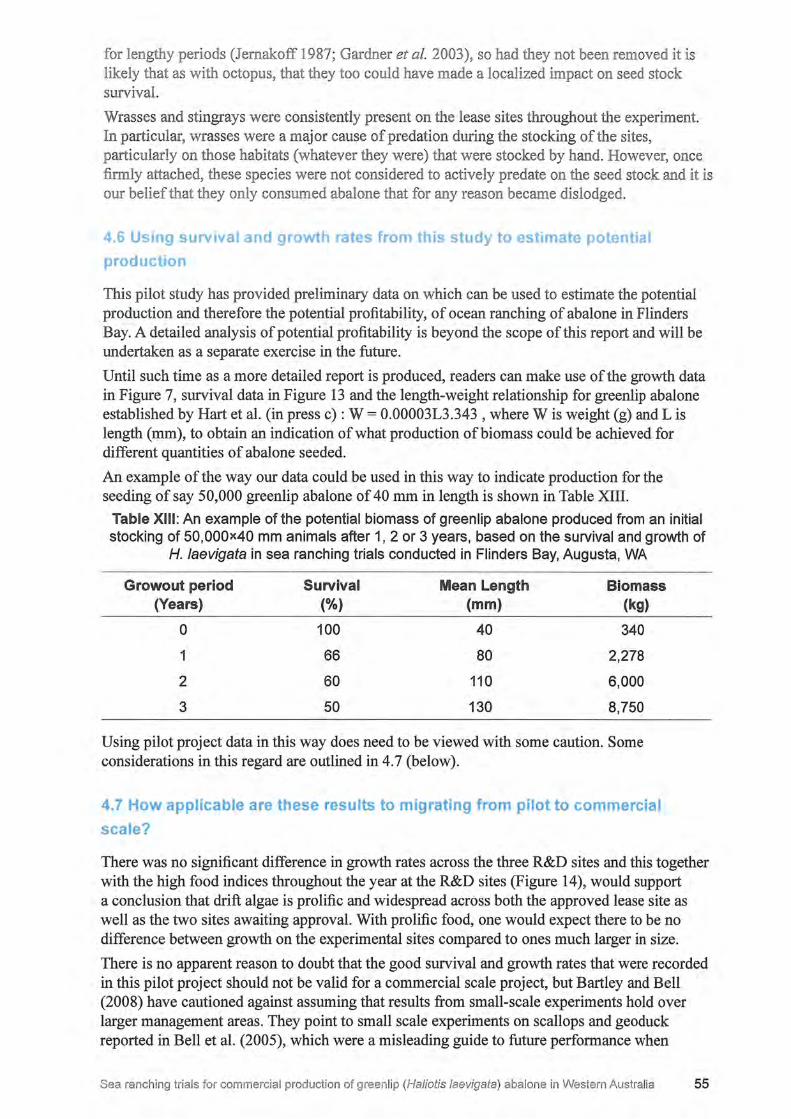
for lengthy periods (Jemakoff 1987; Gardner et al. 2003), so had they not been removed it is likely that as with octopus, that they too could have made a localized impact on seed stock survival.
Wrasses and stingrays were consistently present on the lease sites throughout the experiment. In particular, wrasses were a major cause of predation during the stocking of the sites, particularly on those habitats (whatever they were) that were stocked by hand. However, once firmly attached, these species were not considered to actively predate on the seed stock and it is our belief that they only consumed abalone that for any reason became dislodged.
4.6 Using survival and growth rates from this study to estimate potential
production
This pilot study has provided preliminary data on which can be used to estimate the potential production and therefore the potential profitability, of ocean ranching of abalone in Flinders Bay. A detailed analysis of potential profitability is beyond the scope of this report and will be undertaken as a separate exercise in the future.
Until such time as a more detailed report is produced, readers can make use of the growth data in Figure 7, survival data in Figure 13 and the length-weight relationship for greenlip abalone established by Hart et al. (in press c): W = 0.00003L3.343, where W is weight (g) and Lis length (mm), to obtain an indication of what production of biomass could be achieved for different quantities of abalone seeded.
An example of the way our data could be used in this way to indicate production for the seeding of say 50,000 greenlip abalone of 40 mm in length is shown in Table XIII.
Table XIII: An example of the potential biomass of green lip abalone produced from an initial stocking of 50,000x40 mm animals after 1, 2 or 3 years, based on the survival and growth of
H. /aevigata in sea ranching trials conducted in Flinders Bay, Augusta, WA
Growout period Survival Mean Length Biomass (Years) (%) (mm) (kg)
0 100 40 340
1 66 80 2,278
2 60 110 6,000
3 50 130 8,750
Using pilot project data in this way does need to be viewed with some caution. Some considerations in this regard are outlined in 4.7 (below).
4.7 How applicable are these results to migrating from pilot to commercial
scale?
There was no significant difference in growth rates across the three R&D sites and this together with the high food indices throughout the year at the R&D sites (Figure 14), would support a conclusion that drift algae is prolific and widespread across both the approved lease site as well as the two sites awaiting approval. With prolific food, one would expect there to be no difference between growth on the experimental sites compared to ones much larger in size.
There is no apparent reason to doubt that the good survival and growth rates that were recorded in this pilot project should not be valid for a commercial scale project, but Bartley and Bell (2008) have cautioned against assuming that results from small-scale experiments hold over larger management areas. They point to small scale experiments on scallops and geoduck reported in Bell et al. (2005), which were a misleading guide to future performance when
Sea ranching trials for commercial production of greenlip (Ha/iotis /aevigata ) abalone in Western Australia 55
scaled up to larger research trials.
If expanded to commercial scale, the relatively small and isolated R&D sites reported here would presumably form larger, probably self-sustaining, reef ecosystems. Whether or not ecological changes in competition and predation pressure would result, or whether such change would impact the results from this pilot ranching project are unpredictable. Furthermore, the substantial primary production available in Flinders Bay does have a finite carrying capacity and the only way of determining what that will be on rows of habitat structures spread across the lease sites, will be by regular monitoring of growth and survival of the stock.
The results in this pilot program are for seeding with largely 2-year old animals and lesser quantities of 3 and 4-year old abalone. A commercial project will probably seed habitats with 2-year old animals and let them grow for a couple of years before harvesting. The same habitat structures would probably be seeded annually with a fresh cohort, to coincide with the removal of the grown out cohort. It is unlikely that the ratios of 2, 3 and 4-year old animals would be in the proportions stocked in this experiment, which would mean that stocking densities of the cohorts will need to be carefully evaluated prior to scaling up to the commercial operation.
4.8 How applicable are these results to other study sites?
The results from this study are not directly applicable to other sites. In one list of lessons learned from restocking, stock enhancement and sea ranching initiatives to date, Bartley and Bell (2008) state that "good survival of released juveniles at one site is no guarantee that the methods can be transferred to other sites". Another lesson learned (Bartley and Bell 2008) is that "there are no generic methods for restocking and stock enhancement". Both of these lessons point to the fact that successful seeding into the wild is dependent on a multitude of different, often interacting, factors. Because of sedentary existence and dependency on drift algae for their food source, abalone survival and/or growth is particularly inconsistent and significant differences in these variables are often detected over small distances ( e.g. (Dixon and Day 2004; Hart et al. in press a).
Across the distribution range of greenlip abalone, the stocks appear to have very different predation threats. For example Dixon et al. (2006) attributed high mortality of abalone seed stock in their study, to predation by starfish (Coscinasterias muricata) at one site, and to C. muricata and Notolabrus tetricus (a wrasse fish) at another site. Shepherd (1973) pointed to eagle-rays and stingrays as being serious predators of young greenlip abalone in South Australia and leather jacket fish were suggested as being serious predators of juvenile abalone in an enhancement experiment conducted in Tasmania (Brad Adams, OGA, pers. comm.). This variation of abalone predators across the fishery implies that some sites will be less suitable than others for abalone sea ranching, due to the type and abundance of predators.
Suitable areas for ranching would also need to take into account the likelihood of storm damage which could impact either the food source ( e.g. through destruction of sea grass beds), or the artificial habitat structures.
Appropriate stretches of coastlines and embayments are therefore likely to be extremely limited and all would need careful evaluation before being selected for commercial abalone ranching.
5.0 Benefits and adoption
This research is of direct benefit to investment in the fishing industry. Ocean Grown Abalone Pty Ltd is embarking on a capital raising exercise in order to commercialise greenlip abalone ranching in Flinders Bay. The results from his proof of concept trial will provide potential investors with insight into potential production capabilities of a commercial operation and figures that can be used as a basis for modelling the economic viability of such a venture.
56 Sea ranching trials for commercial production of greenlip (Haliotis /aevigata) abalone in Western Australia
6.0 Further Development
It is intended to raise capital for the commercialization of abalone sea ranching in Flinders Bay towards the middle of this year (2013). During the development of the farm and once commercial operations are underway there will be a strong need for this new industry to be supported by innovative research. Three particular areas stand out:
The financial viability of greenlip abalone ranching is clearly a top priority. Considerable work has already been done in this area, but this will be an ongoing task as more data, both on marketing and production, become available with the commercialization of abalone sea ranching.
The second critical area will be to gain insight into how the growth and survival of seed stock respond to up-scaling from proof of concept to commercialization. This goal will require research into developing an understanding of "limiting density" (the density where growth and/ or survival is significantly reduced as a result of stocking density). Adding to the complexity of this task is that it the research will also need to consider density in terms of optimising the ongoing rotation of stocking new year classes and harvesting marketable sized animals.
As part of this research there will be a need to identify water circulation within Flinders Bay and specifically across the farm, so as to understand the movement of the drift algae food source across the leases.
Other research needs include:
Investigating methods to minimize mortality rates at stocking through improved release technology and animal husbandry during transport.
Investigating seasonal differences in the quality and species composition of drift algae that provide the food source of the abalone seed stock. This will be important for determining seasonal and year-to-year variations in growth rates of the abalone.
Identifying the ecological significance of artificial structures as habitat for juvenile reef fish (such as dhufish and pink snapper).
7.0 Planned outcomes
The planned outcomes identified in the original funding application for this project were to determine an artificial habitat type that optimizes the survival and growth of seed stock and as well, to determine a preferential size and depth for their release.
The outputs from the project have established that several habitat types were suitable, but that the pyramid design units appear to be most promising. The depths that were trialed were not particularly important in terms of long term survival and growth of the seed stock, but size (age) was particularly important. In the end it will be an economic question as to whether seeding at a small size with lower survival at that size is preferable to a larger ( older) size with better survival. This project has provided the data that will enable the cost-benefit analysis of size at seeding to be evaluated.
8.0 Conclusion
Bell et al. (2008) noted that there are several invertebrate species ideally suited to enhancement or sea ranching because of being sedentary, low down on the food chain and having a high economic value. Abalone are one of the ideal invertebrate species which fit all of these criteria.
The focus of introducing hatchery reared stock into the wild in Australia has been, and continues to be, for the purpose of enhancement rather than ranching. The reason that sea ranching has been neglected is twofold: firstly, there are relatively few species that are
Sea ranching trials for commercial production of greenlip (Haliotis /aevigata) abalone in Western Australia 57
sufficiently sedentary to allow for sea ranching and secondly, aquaculture policy has been inadequate, certainly in Western Australia. However, this is in the process of being rectified. The Government of Western Australia has recently released a policy document clarifying deployment of habitat enhancement structures in the marine environment (Department of Fisheries 2012) and there is a soon-to-be released proposed abalone aquaculture policy document (Anon. 2012).
The promising outcomes from this proof of concept trial together with progressive aquaculture policy, could be expected to provide a way forward for orderly expansion of abalone sea ranching in the state.
Key contributors to the potential future success of abalone sea ranching in Western Australia identified from the results of this trial are:
That once seeded (with two-year old abalone) and having suffered the initial mortality phase, that thereafter mortality rates can, with good management, be limited to as little as 5 to 10% a year. This is a very significant result given that the habitat is non-complex and the abalone are very exposed and therefore visible to predators.
That growth rates comparable with abalone in the wild environment can be achieved at relatively high stocking densities on artificial habitat.
That growth and survival rates of seeded abalone are similar in different lease sites within Flinders Bay. This shows that food availability and sea conditions for abalone sea ranching are suitable over a wide area and that depending on the success of future commercial ventures, that there will be opportunity for Government to allow for orderly expansion within the Bay.
9.0 References
Anon. (2012) Aquaculture branch information update - 10 August 2012 URL: http://www. aquaculturecouncilwa.com/assets/files/pdf/ 120800 Department of Fisheries information update.pdf.
Bartley DM, Bell JD (2008). Restocking, Stock Enhancement, and Sea Ranching: Arenas of Progress. Reviews in Fisheries Science 16: 357-365.
Bell ID, Leber KM, Blankenship HL, Loneragan NR, Masuda R (2008). A New Era for Restocking, Stock Enhancement and Sea Ranching of Coastal Fisheries Resources. Reviews in Fisheries Science 16: 1-9.
Bell JD, Munro JL, Nash WJ, Rothlisberg PC, Loneragan NR, Ward RD, Andrew NR (2005). Restocking and stock enhancement of marine invertebrate fisheries. Advances in Marine Biology 49: xi-374.
de Waal S, Cook PA (2001 ). Quantifying the physical and biololgical attributes of successful ocean seeding sites for farm-reared juvenile abalone (Haliotis midae). Journal of Shellfish Research 20: 857-861.
Department of Fisheries WA (2012). Policy on habitat enhancement structures in Western Australia. Fisheries Management Paper 256: 8 pp.
Dixon CD, Day RW (2004). Growth responses in emergent greenlip abalone to density reductions and translocations. Journal of Shellfish Research 23: 1223-1228.
Dixon CD, Day RW, Huchette SMH, Shepherd SA (2006). Successful seeding of hatcheryproduced juvenile greenlip abalone to restore wild stocks. Fisheries Research 78: 179-185.
58 Sea ranching trials for commercial production of greenlip (Haliotis /aevigata) abalone in Western Australia
FP, Brown J, Western Australian abalone
\Vestern Australia 90
M, J ecological effects.
c).Biology, and assessment Fisheries Research Report, Department
Hart .AM, Strain LWS, Fabris F, Brown J, Davidson M (in press a). Stock enhancment greenlip abalone: Long-term growth and survival. Reviews in Fisheries Science
Heasman M, Chick R, Savva N, Worthington D, Brand C, Gibson P, Diemar J (2004). Enhancement of populations of abalone in NSW using hatchery-produced seed. Fisheries Research and Development Corporation Final Repmi, Project No. 1998/219
Hillborn R (1998). The economic performance of marine stock enhancement projects. Bulletin of Marine Science 62: 661-674.
Imamura K (1999). The organization and development of sea farming in Japan. In: Stock Enhancement and Sea Ranching, Eds: BR Howell, E Moskness, T Svasand. Pp. 91-101. Fishing News Books Ltd, Oxford
James DS (2005). Environmental site assessment for abalone ranching on artificial reef. Unpublished PhD thesis, Deakin University, Victoria, Australia: 290 pp.
James DS, Day RW, Shepherd SA (2007). Experimental abalone ranching on artificial reef in Port Phillip Bay, Victoria. Journal of Shellfish Research 26: 687-695.
Jemakoff P (1987). Foraging patterns of juvenile western rock lobsters Panulirus cygnus George. Journal of Experimental Marine Biology and Ecology 113: 125-144.
Masuda R, Tsukamoto K (1998). Stock enhancement in Japan: review and perspective. Bulletin of Marine Science 62: 337-358.
McCormick TB, Herbinson K, Mill TS, Altick J (1994). A review of abalone seeding, possible significance and a new seeding device. Bulletin of Marine Science 55: 680-693.
McShane PE, Naylor JR (1995a). Density independent growth of Haliotis iris Martyn (Mollusca: Gastropoda). Journal of Experimental Marine Biology and Ecology 190: 51-60.
McShane PE, Naylor JR (1995b ). Small-scale spatial variation in growth, size at maturity, and yield- and egg-per-recruit relations in the New Zealand abalone Haliotis iris. New Zealand Journal of Marine and Freshwater Research 29: 603-612.
Norwood C (2012). Reef it up. Fish 20: 28-31.
59
Roberts RD, Keys BF, Prendeville G, Pilditch CA (2007). Viability of abalone (Haliotis iris) stock enhancement by release of hatchery-reared seed in Marlborough, New Zealand. Journal of Shellfish Research 26: 697-703.
Saito K (1984). Ocean ranching of abalones and scallops in northern Japan. Aquaculture 39: 361-373
Shepherd S (1973). Studies on southern Australian abalone (genus Haliotis). I. Ecology of five sympatric species. Marine and Freshwater Research 24: 217-258.
Shepherd S, Laws H (1974). Studies on southern Australian abalone (Genus Haliotis). II. Reproduction of five species. Marine and Freshwater Research 25: 49-62.
Shepherd SA (1986). Studies on southern Australian abalone (genus Haliotis). VII. Aggregative behavior of H. Laevigata in relation to spawning. Marine Biology 90: 231-236.
Shepherd SA, Preece PA, White RWG (2000). Tired nature's sweet restorer? Ecology of abalone (Haliotis spp.) stock enhancement in Australia. Canadian Special Publication of Fisheries and Aquatic Sciences 130: 84-97.
Sweijd N, Snethlage Q, Harvey D, Cook PA (1998). Experimental abalone (Haliotis midae) seeding in South Africa. Journal of Shellfish Research 17: 897-904.
Tegner MJ (2000). Abalone (Haliotis spp.) enhancement in California: what we've learned and where we go from here. Canadian Special Publication of Fisheries and Aquatic Sciences 130: 61-71.
Tegner MJ, Butler RA (1985). Survival and mortality of seeded and native red abalones, Haliotis rufescens, on the Palos Verdes Peninsula. California Fish and Game 91: 150-163.
Appendix 1: Intellectual Property
There is no new intellectual property arising from this project
Appendix 2: Staff
Dr Roy Melville-Smith
Mr Brad Adams
Mrs Nicola Wilson
Dr Lou Caccetta
Curtin University
Ocean Grown Abalone Pty Ltd
Curtin University
Curtin University
60 Sea ranching trials for commercial production of greenlip (Haliotis /aevigata ) abalone in Western Austral ia