sean m. graham - thesis.extension.harvard.edu · sean m. graham a thesis in the field of biology...
TRANSCRIPT

Hemin Decreases Pro-Inflammatory Th17 Cells and Cytokines in an Adoptive Transfer
Model of Colitis
Sean M. Graham
A Thesis in the Field of Biology
for the Degree of Master of Liberal Arts in Extension Studies
Harvard University
November 2016


Abstract
The goal of this research was to reduce disease in an adoptive transfer model of
colitis using an immunomodulatory therapy, hemin, while correlating this response to
changes in cytokines and effector T-cell differentiation. Inflammatory bowel disease
(IBD) is a consequence of immune system dysregulation, mediated by the microbiomes
composition (Gálvez, 2014). IBD is most prevalent and rising in developed parts of the
world such as the United States where 1.5 million people and Europe where 2.2 million
people are affected (Ananthakrishnan, 2015). Research for IBD in recent years has
significantly advanced our knowledge of the complex pathways and interactions
involved, however a complete and long lasting treatment remains unidentified. The rate-
limiting enzyme HO-1 has been found to increase pools of regulatory T-cells (T-regs),
while decreasing pools of pro-inflammatory Th17 cells in a chemically induced model of
colitis. Here, the in-life phase which focused on body weight and video endoscopy
support other primary outcomes from multiplex immunoassays and fluorescence
activated cell sorting (FACS) from blood, colon, spleen, and mesenteric lymph node
samples in an adoptive transfer model of colitis in mice. Pro-inflammatory cytokines
IFN-γ and TNF-α and CD4+ T-cells in the blood at study conclusion were found to be
significantly decreased in the hemin group, as were CD4+CD39+ T-cells in the blood
from days 28-56. Further, in life data suggests a positive treatment effect showing a trend
with higher body weights and lower endoscopy scores. Together these data demonstrate
that hemin acts in an anti-inflammatory manner by modulating pathogenic T-cell
proliferation and production of key pro-inflammatory cytokines.

iv
Acknowledgments
I would not have been able to complete this work were it not for many people
supporting my goals. First, thank you to Dr. Stephen Sonis and Dr. Gregory Lyng, my
thesis directors whom without, this work would not have been possible. Your
encouragement, advice, support, and generosity throughout my thesis project and
obtaining my Master’s degree has been invaluable and greatly enhanced the quality of my
experience and education at Harvard Extension School and for that I am extremely
appreciative. Biomodels has been an incredible resource not only for the advanced
equipment and animal models, but for the intelligent scientists and technicians who are
always willing to help. As such, I would like to give a special thank you to Dr. Dominic
Beal, Dr. Paulette Wright-Andreotta and the entire staff at Biomodels for all of your
advice and help throughout this project.
Thank you to Dr. James Morris my thesis advisor who has been very helpful from
start to finish and I appreciate the time taken to ensure my projects completion.
Finally, but of course by no means least, thank you to Ashlee who has supported
me throughout this now 3-year journey with unwavering confidence and patience. I
would not have been able to do this without you.

v
Table of Contents
Acknowledgments…………………………………....……………………...…………...iv
List of Tables………………………………………………………………….........……vii
List of Figures/Graphs…………………………………………………….…..…….......viii
I. Introduction……………………………………………………………………………..1
Inflammatory Bowel Disease Background……………………….………….……1
Gut Microbiome and T-Cells..…………………………………………..…..….…4
Effector T-Cell Differentiation and Cytokines……………………………..……..6
T-Regs and Th17 Cells in Inflammatory Bowel Disease……...…………….……9
Animal Models of Inflammatory Bowel Disease………………………...…..….11
Current Inflammatory Bowel Disease Treatments………………………..….….12
Heme Oxygenase-1 as a Treatment Target………………………..…………..…13
Research Aims, Goals, and Hypothesis……………………………..…...………14
II. Materials and Methods…………………………………………......………..……….16
Adoptive Transfer Model of Colitis….…………………………..…….………...16
FACS Analysis…………………………………………...……………..……….18
Multiplex Magnetic Bead Immunoassay…………………..…………...………..18
Video Endoscopy………………………………………………..…….………....19
Histopathology…………………………………………………..…….…………20
Heme Oxygenase-1 Activity Assay……………………………..…..…………...20
Statistical Analysis……………………………………………..….….………….21

vi
III. Results……………………………………………………………………….…………..22
In-Life Phase…………………………………………………………………..…22
Weight Change, Survival, and Diarrhea/Blood………………………….22
FACS Analysis………………………………………………..…………23
Endoscopy Score……………………………………………….……...…23
Post-Life Phase……………………………………………………..……………24
Tissue Cytokine Levels……………………………………..……………24
Histopathology………………………………………………………...…25
Heme Oxygenase-1 Activity Assay………………………………...……26
IV. Discussion……………………………………………………………………………….27
Significance of Results……………………………………………….………….27
Study Limitations……………………………………………………….…….….31
Future Research Directions….……………………………………………...……33
Conclusions…………………………………………………………..……….….34
Appendix…………………………………………………………………………………35
References……………………………………………………………………………..…75

vii
List of Tables
Table 1. In-Life Study Design……………………………………………………..…….35

viii
List of Figures
Figure 1. Insult to gut results in loss of bacterial balance and a dysregulated
immune response……………………………………………………………………….36
Figure 2. T-Cell Lineage…………………………………………………………….…...36
Figure 3. Complex relationship between T-reg and Th17 balance…………………...….37
Figure 4. CD62L+CD44- and CD45+CD25- T-cell sort express CD45RB+ ……….…..38
Figure 5. Degradation of heme by HO-1 leads to anti-inflammatory byproducts such as
biliverdin……………………………………………………………………………...….39
Figure 6. Representative Blood FACS Histogram measuring CD4+ T-cell counts…..…40
Figure 7. Representative Mesenteric Lymph Node FACS analysis ………………...…..41
Figure 8. Representative Spleen FACS analysis………………………….………….…..42
Figure 9. FACS Gating strategy……………………………………………….…………42
Figure 10. Day 28 Histology……………… ………………………………………...…..43
Figure 11. Day 56 Histology……………………………………………………………..44
Figure 12. Colon Histology Scoring Guide……........……………………………...……45
Figure 13. Weight changes represented by Area Under the Curve.…………………..…46
Figure 14. Mean Group Weight Change………………………………………..……….47
Figure 15. Individual Weight Change.…………………………………………………..48
Figure 16. Mean Group Colon Length/Weight.…………………………………………49
Figure 17. Mean blood CD4+ T-cell percentages.………………………………………50
Figure 18. Mean blood CD4+CD39+ T-cell percentages.………………………………51
Figure 19. Mean Tissue CD4+ T-cell percentages…………………………….………..52
Figure 20. Mean Tissue CD4+ CD39+ T-cell percentages.………………….…………53

ix
Figure 21. Mean Video Endoscopy Scores………………………………………………54
Figure 22. Video Endoscopy Scoring Scale...…………………………………………...55
Figure 23. Day 14 and Day 21 Representative Endoscopy Images …………………......56
Figure 24. Day 28 and Day 35 Representative Endoscopy Images…………………...…57
Figure 25. Day 42 and Day 49 Representative Endoscopy Images …………………..…58
Figure 26. Day 56 Representative Endoscopy Images ………………………….………59
Figure 27. Day 28 Plasma Multiplex Graph Part 1…………………………..…………..60
Figure 28. Day 28 Plasma Multiplex Graph Part 2...…………………………………….61
Figure 29. Day 35 Plasma Multiplex Graph Part 1………………………………………62
Figure 30. Day 35 Plasma Multiplex Graph Part 2…………………................................63
Figure 31. Day 49 Plasma Multiplex Graph Part 1………………………………………64
Figure 32. Day 49 Plasma Multiplex Graph Part 2……………………………..………..65
Figure 33. Day 56 Plasma Multiplex Graph Part 1………………………………………66
Figure 34. Day 56 Plasma Multiplex Graph Part 2……………………………..………..67
Figure 35. Day 56 Mesenteric Lymph Node Multiplex Graph Part 1……………...……68
Figure 36. Day 56 Mesenteric Lymph Node Multiplex Graph Part 2……………..…….69
Figure 37. Day 56 Spleen Multiplex Graph Part 1………………………………...…….70
Figure 38. Day 56 Spleen Multiplex Graph Part 2………………………………………71
Figure 39. Day 56 Colon Multiplex Graph Part 1…………………………...…………..72
Figure 40. Day 56 Colon Multiplex Graph Part 2…………………………...…………..73
Figure 41. Representative Necropsy Photos…………….…………………….…………74

1
Chapter I
Introduction
Inflammatory Bowel Disease Background
Crohn's disease (CD) and ulcerative colitis (UC) are diseases where chronic
inflammation of the epithelial lining within the intestines results from a dysregulated
immune system. Together, these ailments are classified as inflammatory bowel disease
(IBD). Although there has been significant progress treating IBD, many studies have
shown that the incidence and prevalence of IBD has been on the rise over the past half
century in developed continents such as North America and Europe. Annual incidences
of UC in North America and Europe were 24.3 and 19.2(12.7 and 20.2 for CD) per
100,000 persons-years, respectively, whereas in Asia and the Middle East were only
6.3(5.0 for CD) per 100,000 persons-years. (Molodecky et al., 2012). 1.5 million
Americans and 2.2 million Europeans are affected, and meta-analysis has shown time
trend incidence increases in these continents (Ananthakrishnan, 2015). The increased
incidence of IBD and the differences between populations are likely due to a variety of
factors. Since IBD is an autoimmune regulated disease, data support that responses can
be affected by factors such as commensal bacteria, genetic predisposition, immune
response, and environmental conditions (FIOCCHI, 2005). Furthermore, disease is
perpetuated by factors produced after the initiation of disease such as oxidative stress
from reactive oxygen species which damage tissue health (Rezaie, Parker, & Abdollahi,

2
2007). Supporting this, genetically modified mice lacking antioxidant enzymes develop
spontaneous colitis (Esworthy, Kim, Doroshow, Leto, & Chu, 2013). Patients with IBD
suffer from symptoms such as weight loss, pain, diarrhea, and rectal bleeding. These
symptoms can often be severe and cause hospitalization during bouts of IBD (Gálvez,
2014,). The standard of care is currently up for discussion, as the emergence of
immunomodulatory therapies like infliximab are becoming increasingly used over
traditional therapies like 5-aminosalicylic acid or corticosteroids (Travis, 2006, Lee,
Sanderson, & Irving, 2012). Typically, when treating IBD, the first goal is to limit the
damage during inflammatory bouts by using 5-aminosalicylic acid and/or corticosteroids
however, steroids can lead to a dependency and difficulty remaining in remission. To
combat this, patients can begin treatments with immunosuppressive therapies
azathioprine and methotrexate but each has several limiting factors such as a significant
increase in lymphoma in azathioprine patients and hepatotoxicity in Methotrexate
patients (Engel & Neurath, 2010). New biologic therapies have targeted cytokines known
to be pathogenic in IBD, such the anti-TNFα monoclonal antibody Infliximab. The
efficacies of these treatments are under debate and could have diminished effects due to
anti-Infliximab antibodies (Nanda, Cheifetz, & Moss, 2012). Additionally, the cost of
IBD in the United States per patient is over $18,000 per year, with anti-TNFα therapies
costing up to $4,000 per infusion compared to 5-aminosalicylic acid compounds like
sulfasalazine, which cost $50 per month (Park & Bass, 2011). The newest approved
therapies are integrin inhibitors like vedolizumab, which block T-cell transportation to
the gut (Feagan et al., 2013).
3
The main cell type involved in the autoimmune response is T-cells. The potential
for T-cells to differentiate into a specific lineage: Th1, Th2, Th17, or T-regs plays a key
role in the development of the autoimmune response in IBD and other autoimmune
diseases (Cheng et al., 2009, Dieleman et al., 1998, Luger et al., 2008). Therefore, it is
critical to fully understand and characterize T-cell distribution, differentiation, and
activation pathways when researching this complex disease. Immune system
dysregulation is a hallmark of IBD, the balance of T-cell subsets plays a critical role in
establishing gut homeostasis but can be disrupted by a combination of genetic,
environmental, and host microbiome factors. Furthermore, the balance between and
effect of each subset is largely mediated by cytokines (Gálvez, 2014, Kucharzik et al.,
2006). More recently, there has been a strong interest in understanding the role of genetic
factors, such as mutations to the IL-10 receptor being associated with early onset CD
(Colombel, 2014). Findings such as these highlights the importance of treating IBD
patients individually, as there may be very specific differences leading to different
treatment avenues. Combination therapy based on individual patient immune responses,
microbiota, and genetic factors are likely the next approach in developing new IBD
treatments. Identifying and fully elucidating the pathways involved in IBD remains the
most important treatment variable. As such, research that focuses on further unravelling
these pathways and how they interact with each other is highly needed.

4
Gut Microbiome and T-Cells
The intestinal lining is the first barrier in host defense, limiting pathogenic
responses by functioning as a semi-permeable wall. When this barrier is damaged by
local inflammation, it becomes more permeable, allowing passage of bacteria,
electrolytes, antigens, and other macromolecules, which attribute to the pathogenesis of
IBD (Berkes, 2003, Liu, Li, & Neu, 2005). While paracellular and transcellular passage
are normal functions of the epithelium, these are increased during the inflammatory
response and coupled with passage through lesions and can lead to the development of
disease (Lewis & McKay, 2009, Lewis et al., 2010). This insult to the tissue coincides
with changes in the way the host microbiota is recognized by T-cells, ultimately leading
to dysregulation of the immune system signified by increased T-cell activation and
differentiation of pathogenic T-cells (Figure 1) (Gálvez, 2014). The immune response
and dysregulation in IBD is in large part mediated by effector T-cells Th1, Th2, Th17,
and T-regs. Th1 and Th2 cells were initially the focus of IBD research, however since the
discovery of Th17 cells and T-regs a large importance has been placed on eluding their
roles in autoimmune disorders. The balance between Th17 cells and T-regs, discussed in
detail later, has been established as a chief regulator of autoimmune disease (Abdulahad,
Boots, & Kallenberg, 2010, Berger, 2000).
The bacterial flora composition in the gut is of particular importance in the
context of IBD due to its ability to either stabilize or initiate an immune response by
affecting T-cell responses. Decreased complexity of the gut microbiome has been linked
to increased disease; stress, diet, genetics, drugs, and other factors can lead to losing the

5
stability of gut homeostasis and allow the development of chronic inflammation (Kostic,
Xavier, & Gevers, 2014). Demonstrating how vital the microbiome is to disease, studies
conducted in germ free animals show that disease severity in the DSS model is repressed
(KITAJIMA, MORIMOTO, SAGARA, SHIMIZU, & IKEDA, 2001). Indeed, bacteria
such as Escherichia coli and the genus Fusobacterium have been found at increased
levels in IBD patients (Kostic, Xavier, & Gevers, 2014). While the microbiome as a
whole is needed and partially responsible for disease development, there are specific
bacteria that can be helpful. For instance, Clostridium, a common intestinal bacterium
can be anti-inflammatory by inducing T-reg proliferation (Chiba & Seno, 2011). Findings
such as these indicate that researching responses to specific bacteria could potentially
lead to new therapeutic targets. The microbiome, having this bimodal functionality to
stimulate and inhibit disease highlights the importance and complexity of the microbiome
when considering the pathogenesis of IBD by T-cells. Also playing a role in immune
system sensitivity to the microbiome are genetics. NOD2, responsible for activation of
transcription factor NF-κB in monocytes is associated with CD when mutated (Hugot et
al., 2001). While NOD2 can have different variations of mutations, pathogenic mutations
lead to over activation of NOD2/ NF-κB leading to increased monocyte proliferation and
microbial recognition (Hugot et al., 2001). Advancements increasing our understanding
of the relationship between host microbiome and genetics are important due to the
complexity of IBD’s pathogenesis. With these new findings, it appears that treatments in
the future will need to consider the patients’ specific immune response, bacterial flora,
and genetic background.

6
Effector T-Cell Differentiation and Cytokines
T-cell precursors go through negative selection in the thymus, which forces cells
that have self-reactivity to undergo apoptosis, thus preventing the adaptive immune
response from attacking its own healthy cells. Self-tolerant T-cells then become effector
T-cells, derived from these naïve precursors, and the conditions in the cell, the
microbiome, and genetics can drive the proliferation of specific T-cell subsets (Gálvez,
2014, Josefowicz, Lu, & Rudensky, 2012). While there is a range of phenotypically
distinct effector T-cells, they can be identified based on the expression of particular cell
surface molecules; these markers not only allow for the identification of subsets, but also
directly determine effector functionality. The most basic subsets of T-cells are the CD4+
and CD8+ lineages. The CD8+ lineage T-cells become cytotoxic killers, whereas the
CD4+ lineage have the potential to become Th1, Th2, Th17, or T-regs (Germain, 2002,
Harty, Tvinnereim, & White, 2000) (Figure 2.). The differentiation into Th1, Th2, Th17,
or T-reg lineages is determined by interactions between the naïve T-cell, antigen
presenting cells, and the cytokine milieu. Cytokines can either be produced by the T-cell
or surrounding cells and effect the immune response. One of the ways cytokines affects
the immune response is by driving T-cell differentiation toward a specific T-cell
phenotype. Certain cytokines are strongly associated with each subset, for example, TGF-
β is associated with more Th17 differentiation and IFN-γ both stimulates differentiation
into and is produced by Th1 T-cells (Zhu, Yamane, & Paul, 2010). Improperly balanced
effector T-cells Th1/Th2/Th17 and T-reg patterns are associated with numerous disease
states (Cheng et al., 2009, Dieleman et al., 1998, Luger et al., 2008). Cytokines are
7
therefore very important in maintaining the balance between these cell lineages which is
vital for sustaining a healthy immune system.
Th1 cells are typically associated with a pro-inflammatory cytokine profile, of
which the quintessential cytokine is interferon-γ (INF-γ). T-cell precursors are stimulated
to differentiate into Th1 cells by INF-γ, Th1-cells then also produce INF-γ, generating a
feedback loop (Zhu, Yamane, & Paul, 2010). This feedback loop is associated with
unregulated autoimmune responses and tissue damage and is a treatment target due to its
ability to potentiate disease (Berger, 2000, Resta–Lenert & Barrett, 2006, Zhu, Yamane,
& Paul, 2010). Indeed, inflammation in CD is mediated Th1 and Th17 cells again
signifying the importance of INF-γ in IBD (Fuss, 2008, Zhang, Fuss, Yang, & Strober,
2013). Research however also indicates that disease may be shunted towards a Th1 or
Th17 response, finding that INF- γ can promote Th17 development and stop Th1
development through interactions with antigen presenting cells (Kryczek et al., 2008). By
contrast, Th2 cells are involved in anti-heminthic and allergic responses, while also being
antagonistic to the Th1 response in allergic responses (Rotmagnani, 1998). Th2 responses
are associated with the cytokines IL-4 and IL-13, which have been associated with the
pathogenesis of UC (Fuss, 2008). IL-4 stimulates naïve T-cell differentiation into Th2
cells, which then produce both IL-4 and IL-13, treatments targeting these have not been
successful (Fuss, 2008, Zhu, Yamane, & Paul, 2010).
IL-12 and IL-23 are dimers, which both consist of one p40 subunit. IL-12 has
been implicated in Th1 type inflammatory responses, while IL-23 is important in the
activation of innate immunity such as monocyte activation (Langrish et al., 2004). Past
research had indicated that treatment with anti-p40 monoclonal antibodies worked by

8
repressing Th1 T-cells, but it has since been discovered that anti-p40 is also responsible
for repressing Th17 responses through an IL-23 blockade (Luger et al., 2008). Th17 cells,
like Th1 cells have been described in many autoimmune diseases, are induced by IL-6
and IL-23 and are most well known for producing the pro inflammatory cytokine IL-17
(Weaver, Harrington, Mangan, Gavrieli, & Murphy, 2006). Th17 cells also produce the
transcription factor ROR-γ which further induces the generation of Th17 cells,
perpetuating inflammation. When ROR-γ is missing, disease dwindles and the affected
tissue does not have large infiltrates of pathogenic Th17 cells (Ziegler & Buckner, 2009).
T-regs on the other hand are the primary suppressive cells involved in the reduction of
pro-inflammatory responses, which are characterized by the expression of transcription
factor Foxp3 and production of the immunosuppressive cytokine IL-10 (Maynard et al.,
2007). The presence of Foxp3 allows T-regs to act as potent immune suppressors, and
when missing from the immune system a homeostatic environment cannot be established
resulting in autoimmune disorders (Josefowicz, Lu, & Rudensky, 2012). The balance
between the expression levels of these two transcription factors ROR- γ and Foxp3,
observed in healthy individuals, is the result of a complex pathway with multiple routes
of induction and repression of Th17 cells and T-regs; when perturbation of this delicate
balance is thought to be a major factor in the pathogenesis of autoimmune disorders
(Ziegler & Buckner, 2009).

9
T-Regs and Th17 Cells in Inflammatory Bowel Disease
In recent years, researchers have identified Th17 cells as a powerful driving force
in the inflammatory cascade causing irregular autoimmune function. As such, studies in
animal models of colitis have shown that disease can be attenuated by either blocking
differentiation of Th17 cells, or blocking IL-17, the main inflammatory cytokine
produced by Th17 cells (Gálvez, 2014). Additionally, blocking the Th17 associated
transcription factor ROR-γ also results in diminished diseased (Zhang, Fuss, Yang, &
Strober, 2013). Further research has shown that a portion of Th17 cells can shift their
function towards a Th1 like phenotype that are necessary for the pathogenesis of IBD
(Harbour, Maynard, Zindl, Schoeb, & Weaver, 2015).
T-regs play a critical role suppressing autoimmune responses including the
inflammation caused by these pathogenic Th17 cells. T-regs express the co-stimulatory
molecule CTLA-4, which is critical for T-reg mediated suppression (Josefowicz, Lu, &
Rudensky, 2012). IL-2 was initially a target for IBD treatment, however it became clear
that it was not imperative to have IL-2 present in order to perpetuate disease (Schimpl et
al., 2002). When CTLA-4 is blocked however, T-regs lose their suppressive effectiveness
allowing autoimmune disease to arise (Sakaguchi, Wing, Onishi, Prieto-Martin, &
Yamaguchi, 2009). This vital suppression function allowing gut homeostasis is supported
by the findings that when CD4+CD25+ cells, markers associated with T-regs, are
adoptively transferred into diseased SCID CD4+CD25- mice, disease is fully reversed
(Liu, Hu, Xu, & Liew, 2003). The balance between pathogenic T-cells and non-
pathogenic T-regs represents a weak spot of the immune response, viruses have been

10
found to target this by causing T-regs to undergo apoptosis resulting in a dysregulated
autoimmune response and chronic infections, using a correlate human respiratory viral
infection mouse model using sendai viral infections (Bharat et al., 2010).
Research has shown that the relationship between T-regs and Th17 cells is very
complex (Figure 3). Under inflammatory autoimmune conditions where IL-6 is being
secreted, such as found in rheumatoid arthritis, it has been shown that T-regs can be
converted into the Th17 phenotype, further driving the inflammatory response (Komatsu
et al., 2013). Clinical data from IBD patients supports this discovery; patients had
increased CD4+ T-cells expressing both IL-17 and Foxp3, suggesting phenotype
conversion from T-reg to Th17 (Ueno et al., 2013). Conversely, Th17 cells have also
been shown to stop secreting pro-inflammatory cytokine IFN-γ and promote generation
of IL-22, which decreases epithelial tissue damage by promoting microbial resistance
responsible for disease abrogation (Gálvez, 2014). While both cells have been found to
have functions opposite of their normal state, they can also inhibit one another. When the
receptor for immunosuppressive cytokine IL-10 loses function in patients, the Th17
levels increase dramatically (Shouval et al., 2015). The regulation of T-reg proliferation
is also controlled by epigenetic factors such as the recently described methyltransferase
Uhrf1. Silencing of Uhrf1 results in spontaneous colitis due to an increased load of Th17
cells and loss of function of T-regs. (Obata et al., 2014). Finally, corroborating these
results, further research has shown that Uhrf1 loss results in a TNFα based inflammatory
cascade leading to the loss of immune homeostasis in the gut (Marjoram et al., 2015).
Together these recent findings represent an important connection between T-reg function
and development of IBD due to the actions of Th17 cells.

11
Animal Models of Inflammatory Bowel Disease
The complexity of IBD has been difficult to unravel. Until recently, the only
options for inducing colitis in an experimental setting were chemical, such as dextran
sodium sulfate (DSS), tri-nitrobenzene sulfonic acid (TNBS), and oxazolone (Wirtz,
Neufert, Weigmann, & Neurath, 2007). TNBS predominantly confers a Th1 response,
oxazolone a Th2 response, and DSS a mixed Th1/Th2 response (Wirtz, Neufert,
Weigmann, & Neurath, 2007, Dieleman et al., 1998) While these models have been
useful in the research of IBD, the field has been focusing further on the microbiome and
T-cells. The development of adoptive transfer mediated models of colitis allows the
investigation of the pathogenesis pathways in a setting where T-regs are missing and
naive T-cells are undergoing differentiation into their effector subsets (Kanai et al.,
2006). With such importance having been found in the balance between Th17 cells and
T-regs, as discussed in the previous section, being able to evaluate a treatment’s effect on
T-cell proliferation is of high interest. The CD45+CD25- T-cell adoptive transfer model
researchers are now able evaluate the differentiation and homing of T-cells beginning
from the naïve state, a truly unique aspect to the model made possible by isolating naïve
CD45RB HIGH T-cells (Ostanin et al., 2008). A similar naive T-cell sort and transfer for
CD62L+CD44-, used in this research, also induces disease by isolating the CD45RB
HIGH T-cells (Figure 4). Some advantages of this model include being able to study the
earliest stages of disease while focusing T-cell differentiation and proliferation (Ostanin
et al., 2008). The details of this model will be discussed further in Chapter II.

12
Current Inflammatory Bowel Disease Treatments
The most effective treatments have aimed to alter the T-cell response through
cytokine inhibition/depletion efforts such as anti-p40 and anti-TNFα. Anti-p40 which
depletes IL-12 and IL-23 results in the blunting of Th1 and Th17 responses by
suppressing a key Th17 cytokine IL-17A, has shown efficacy in early testing (Kim et al.,
2012). The discovery of treatments targeting the highly pro-inflammatory cytokine TNFα
with antagonistic monoclonal antibodies resulted in the most currently viable treatment
option (Rutgeerts, van Assche, & Vermeire, 2004). The ability of TNFα antagonists to
trigger apoptosis in monocytes and lymphocytes has led some to question the
susceptibility of anti-TNFα patients to infectious disease however, little evidence has
been found to support this concern (Targownik & Bernstein, 2013). Instead, the primary
worry of anti-TNFα therapy is patient variability, there is a significant number of patients
that do not have either a short or long term response to treatment. In clinical trials, up to
40% of patients to not respond to anti-TNFα therapy and up to 46% of responders lose
response within one year of treatment (Ben-Horin, Kopylov, & Chowers, 2014). When
drugs such as Infiximab, a common anti-TNFα antibody and IBD treatment, or other
standards of care such as antibiotics and steroids do not work, the last resort for patients
is to undergo colectomy in order to surgically remove diseased portions of the intestines
(Sandborn et al., 2009). Antibiotics have been found to have moderate but varied success
in treatment (Khan et al., 2011). Steroids are also used in IBD patients, but long term
steroid treatment is not ideal due to its limited response window (Hanauer, 2002). Even
with great progression in recent years, the large number of non-responders found among

13
the best treatment option, anti-TNFα, indicate alternate routes in the pathways leading
towards IBD related inflammation.
As discussed in previous sections, the balance between Th17 and T-regs has
advanced to the forefront of IBD research. As recently as 2016, it has been shown that
mTOR inhibition can function as an IBD treatment due to its ability to restore this critical
balance in a DSS model of colitis (Hu et al., 2016). Another possible route to treat the
Th17/T-reg balance is by modulating the microbiome; short chain fatty acid producing
bacteria, such as the Clostridia species are implicated in the proliferation of T-regs is
significantly reduced in IBD patient fecal samples (Omenetti & Pizarro, 2015).
Considering how many treatments show efficacy, it is clear that there are many pathways
leading to the complexity and downfall in identifying a complete cure. Instead, it appears
that the long term treatment of IBD will require an approach that involves multiple
mechanisms of action.
Heme Oxygenase-1 as a Treatment Target
Heme oxygenase-1(HO-1) has been identified recently as a new treatment target
in IBD (Onyiah et al., 2013). HO-1 is an enzyme which degrades heme into the
antioxidants biliverdin, iron, and carbon monoxide (CO) (Naito, Takagi, & Yoshikawa,
2004). Biliverdin is possibly the most important product of this reaction, it leads to
reactive oxygen species scavenging, anti-complement, and inhibition of neutrophil and
CD8+ T-cell influx (Naito, Takagi, & Yoshikawa, 2004) (Figure 5). Oxidative stress
plays a major role in the pathogenesis of colitis, and the byproducts generated by HO-1

14
makes it a natural source of induced antioxidants, which have been found to provide
protection against IBD (Oz, Chen, McClain, & de Villiers, 2005). Additionally, oxidative
stress has been found to result in dysfunctional DNA methyltransferases, which normally
act as anti-inflammatory molecular switches by repressing TNFα production (Low, 2013,
Marjoram et al., 2015). In relation to recent work in T-regs and Th17 cell balance, in a
recent DSS model based study, HO-1 induced by hemin was found to not only result in a
depletion of Th17 cells but also an increase in the pool of T-regs compared to untreated
controls (Zhang et al., 2014).
Research Aims, Goals, and Hypothesis
The primary research goal of this thesis was to assess the efficacy of heme
oxygenase-1 (HO-1) on altering T-cell differentiation and ratios in an adoptive transfer
model of CD4+ T-cell colitis in mice. Based on previous literature, it was hypothesized
that hemin would have a profound effect in diminishing disease in an adoptive transfer
model of colitis, measured by weight loss and video endoscopy score. Moreover, this
effect would correlate with a reduction in pro-inflammatory cytokines and more
specifically a skew away from a Th17 response. To assess this hypothesis, two specific
aims work together to answer the primary objective. Details of the study design can be
found in Table 1.
Primary objective: Show disease reduction in an in vivo model of colitis and correlate
this change with T-cell profile modulation and cytokine differences.

15
Specific Aim 1: Show disease reduction by treatment with hemin using
compilation of measurements in a standard model of IBD.
Methods: Track weight change, evaluate disease via video
endoscopy, monitor blood/diarrhea presence around the rectum,
and colon weight/length change.
Expected results: There will be a reduction in disease
represented by reduction in weight loss, endoscopy score,
blood/diarrhea presence, and colon weight/length ratio.
Specific Aim 2: Show a reduction in proinflammatory T-cells and cytokines
using FACS and immunoassays in a standard model of IBD.
Methods: Quantitate CD4+, CD4+CD25+, and CD4+CD39+ T-
cells using FACS analysis on the blood, spleen, and mesenteric
lymph nodes. Additionally, the blood, spleen, mesenteric lymph
nodes, and colon will be analyzed using immunoassays for IFN-γ,
IL-1b, IL-4, IL-6, IL-22, IL-10, IL-23, IL-12, IL-13, IL-17A, TNF-
α, and TGF-β1.
Expected Results: There will be a reduction in CD4+ and
CD4+CD39+ T-cells in the hemin treatment group as well
as an increase in CD4+CD25+ T-cells. Furthermore,
proinflammatory cytokines will be reduced in blood and
tissue samples.

16
Chapter II
Materials and Methods
Animals
A total of 16 male C57BL/6-Rag2tm1Cgn/J and 10 male C57Bl/6 mice from
Taconic Biosciences (Germantown, NY) were used in this study. RAG2 (recombination
activating gene) is transcribed and translated into a protein primarily responsible for the
rearrangement of genes encoding T and B cells receptors; without proper functional
rearrangement the cells are signaled for apoptosis (Shinkai, 1992). The donor C57BL/6
mice provide CD4+ T-cells that are able to be stimulated to differentiate and proliferate
in the RAG2 knockout mice. The KO mice were bred on a C57BL/6 background and are
MHC matched. These KO mice were used for the disease phase portion of the study,
comprising two groups of 8 mice each.
Adoptive Transfer Model of Colitis
To obtain naive T-cells to induce colitis with, the spleens were harvested from the
10 C57BL/6 donor mice and prepared for magnetic bead separation. First, the spleens
were placed in ice cold PBS upon excision. Next, the spleens were homogenized using a
gentleMACS dissociator (Miltenyi, San Diego, CA) in order to create a single cell
suspension. Finally, the suspension of splenocytes was sorted using a MACS column

17
(Miltenyi, San Diego, CA) to isolate naïve T-cells, defined by the cell surface molecules
CD4+CD62L+CD44-. Once sorted, the cells were counted and resuspended in PBS such
that each recipient RAG2-/- mouse received a 200μl intraperitoneal dose containing
0.5x10^6 naive CD4+ T-cells. When injected, the naive CD4+ T-cells are stimulated by
interactions with the microbiome to proliferate and differentiate (Feng, Wang, Schoeb,
Elson, & Cong, 2010).
Outward signs of inflammation begin at 5-8 weeks after transfer, and can be
detected by weight loss, video endoscopy, and the presence of blood and/or diarrhea near
the rectum. After induction (Day 0), weight change and incidence of blood/diarrhea was
recorded daily, and endoscopy performed once a week beginning day 14. On day 0
animals began treatment with either PBS or hemin (50μg/kg) intraperitoneally twice a
week until study conclusion. Additionally, at the time points indicated in Table 1, retro-
orbital blood collections were performed to count CD4+, CD25+, and CD39+ T-cells
using fluorescence activated cell sorting(FACS) and IFN-γ, IL-1b, IL-4, IL-6, IL-22, IL-
10, IL-23, IL-12, IL-13, IL-17A, TNF-α, and TGF-β1 immunoassays. Also, mesenteric
lymph nodes and spleen were collected at sacrifice and analyzed using the same methods
as the blood. Finally, on day 28 and 56 animals were sacrificed for organ collection,
specifically the colon, spleen, mesenteric lymph nodes, and blood. When the colon was
excised it was measured, weighed, contents flushed, and trimmed to a length of 5 cm
from the rectum where disease was assessed by endoscopy. From the 5 cm section a 1 cm
middle piece was taken for multiplex ELISA cytokine immunoassays and HO-1 activity
assay. The remaining two 2 cm sections were used for histopathological analysis,
discussed further in the following sections.
18
FACS Analysis
Whole blood samples were prepared in K2EDTA tubes each week beginning day
14, except for day 49 due to equipment restrictions. Also, mesenteric lymph nodes and
spleen were collected at sacrifice. Tissue and blood samples were prepared for analysis
by FACS for the expression of cell surface markers CD4, CD8, CD25, and CD39, as
follows: solid tissues were dissociated in ice cold FACS buffer (5% BSA, 5mmol
K3EDTA in 1x PBS) using the gentleMACS system to yield a single cell suspension.
Blood and spleen were RBC lysed (BD Pharmlyse, Franklin Lakes, NJ) 1.0x10^6 cells
were aliquoted and stained with fluorescent antibodies specific for CD4, CD8, CD25, and
CD39, and run through a miltenyi MACSquant flow cytometer (Miltenyi, San Diego,
CA). Data was analyzed using FlowJo software and representative FACS plots are seen
in Figures 6 to 8. CD39+ T-cells were calculated as a percentage of CD4+ T-cells. The
gating strategy, seen in Figure 9, was used to identify populations of CD4+ T-cells that
are also CD39+ and CD25+.
Multiplex Magnetic Bead Immunoassay
A portion of the colon was used in multiplex cytokine panel immunoassays, to
detect IFN-γ, IL-1b, IL-4, IL-6, IL-22, IL-10, IL-23, IL-12, IL-13, IL-17A, TNF-α, and
TGF-β1 (EMD Millipore Corporation). Colon samples were prepared by low to medium
homogenization for 30 seconds in PBS while on ice to prevent degradation. The protocol
supplied by the vendor was as followed; briefly, the 96 well immunoassays were loaded

19
with appropriate standards and controls provided by the Milliplex MAP Kit, magnetic
beads to mark the specific cytokines of interest, and homogenized sample. Following the
2 hour incubation period, the plate was read using a Luminex200 to obtain the median
fluorescent intensity (MFI) which was then used to calculate cytokine concentrations
using the curve generated by the standards for each analyte. Day 28 tissues were not used
in this analysis due to limited reagents.
Video Endoscopy
Beginning on Day 14 and then once weekly throughout the study duration, colitis
severity was assessed in all animals using high definition video endoscopy where images
were taken and colitis severity scored by a blinded observer according to the scoring
scale seen in Figure 22 (Hamilton et al., 2011, Lyng, Stevens, Gordon, Watkins, & Sonis,
2008). Animals were anesthetized using 2.5% isoflurane vapor, for each animal at each
time point, the endoscope was placed into the rectum using a small amount of lubricant.
A high definition camera was attached to the endoscope (Karl Storz, Germany) which
was 14cm in length and rigid with a beveled tip. When the endoscope passed the rectum,
a small amount of air was pushed into the colon through the endoscope biopsy channel to
inflate, allowing visualization of the tissue. The endoscope was then carefully moved
down the length of the colon pushing any stool, mucous, or blood towards the proximal
end. While removing the endoscope the tissue was clear of debris and inflated to
visualize and give the appropriate score by a blinded observer. Following the procedure
all animals’ recovery from anesthesia was monitored. Video endoscopy can be a

20
powerful measure of colitis severity, in the adoptive transfer model used here the disease
is mild-moderate compared to the more severe chemically induced models like DSS and
TNBS.
Histopathology
Colon samples obtained from sacrificed animals were sectioned for
histopathology. Of the 6-8cm colon tissue, two 2 cm sections were collected in 10%
neutral buffered formalin. These sections were then stained with hematoxylin and eosin
(H&E) and sectioned 8-10 times at 5-8µm thickness per 2cm tissue on each slide.
Histology photos displaying disease progression for each group on days 28 and 56 are
shown in Figures 10 and 11, selected by an unblinded observer guided by the colon
histopathology scoring scale (Figure 12).
Heme Oxygenase-1 Activity Assay
A previously described enzyme activity assay for HO-1 was used, with
modifications (Zhang et al., 2014). After running test samples using C57Bl/6 colon
tissue, steps were taken to increase the sensitivity of the assay. In order to compensate
for the small protein content and sample size, changes were made to decrease the dilution
of the sample. The original protocol is as follows “The colons were homogenized in 10
mmol/liter HEPES, 32 mmol/liter sucrose, 1 mmol/liter dithiotreitol (DTT), 0.1
mmol/liter EDTA, 10 μg/ml soybean trypsin inhibitor, 10 μg/ml leupeptin, and 2 μg/ml

21
aprotinin and centrifuged at 18,000 × g for 30 min at 4 °C. The supernatant was used to
measure HO activity. The reaction mixture, consisting of 200 μl of sample homogenate,
100 μl of normal liver cytosol (source of biliverdin reductase), 20 μmol/liter hemin, and
0.8 mmol/liter NADPH, was incubated at 37 °C for 1 h. The optical density (OD) was
measured between 464 and 530 nm (extinction coefficient, 40 mmol/liter/cm for
bilirubin) to assess bilirubin production once the reaction was terminated by putting
samples in an ice bath. Values were expressed as pmol of bilirubin formed per hour per
milligram protein” (Zhang et al., 2014). Here, the reaction mixture consisted of 100 μl of
sample homogenate and 50 μl of normal liver cytosol. The OD was measured at 450 nm
and 540 nm which were the closest filters available.
Statistical Analysis
All quantitative values are expressed as the average of the group ± standard error
of the mean (SEM). All statistics except for endoscopy scores were analyzed and graphed
using a one-tailed t-test between Vehicle and Treatment groups in Prism (Graphpad).
Endoscopy scores were tested using Mann-Whitney U tests. P-values were considered
significant if p≤0.05. Values falling below the limit of detection in the cytokine panels
were expressed as 50% of the lowest standard. Values above the limit of detection in the
cytokine panels were expressed as the highest standard detected. Animal number 4 had
extremely high outliers found in the immunoassay data, as such the data was not included
in the analysis.

22
Chapter III
Results
In-Life Phase
Weight Change, Survival, and Diarrhea/Blood
Weights were obtained daily throughout the course of the study and percent
change was calculated each day relative to the baseline weight set on day 0. Over the
duration of the study, no animals were sacrificed due to weight loss or morbidity
however, one hemin treated animal was found dead on day 52. Disease in the adoptive
transfer model takes roughly 25 to 40 days to initiate weight loss. Here, weight loss was
observed in this window, beginning day 28. Weight change through day 28 and 56
expressed as area under the curve (Figure 13) shows nearly identical weights on day 28
and higher weights for the hemin group on day 56. Overall, the hemin group was trending
with less weight loss than the vehicle group, however statistical significance was not
reached until the final two days of the study (Days 55 and 56). Mean daily group weights
(Figure 14) show similar weight change patterns, however the hemin group tended to
have less weight loss especially towards the end of the study. Individual animal weight
change (Figure 15) shows distribution within groups, the hemin group was mostly higher
than the vehicle group other than one animal. Diarrhea and blood checks were performed
daily, however there were no observed bouts of either. Colon weight and length was

23
measured when harvested and found no significant difference between the two groups
(Figure 16). Additionally, although no toxic side effects were noticed, upon sacrifice the
hemin treated animals had deposits of hemin in the abdomen (Figure 41).
FACS Analysis
Labels for CD4, CD8, CD25, and CD39 were used to determine T-cell levels. No
distinct CD25+HIGH (T-regs) or CD8+ (Cytotoxic T-Cell) populations were identified
indicating an accurate cell sort for naïve CD4+ T-cells. On day 56, the blood CD4+ T-
cell percentage was significantly higher in the vehicle group (Figure 17). Further, on days
28, 35, 42, and 56 there were significantly increased levels of CD39+ cells, calculated as
a percentage of CD4+ T-cells (Figure 18). In the mesenteric lymph nodes collected on
days 28 and 56, CD4+ T-cells and CD4+CD39+ T-cells were the same for each group,
however in the spleen while not significant there tended to be higher CD4+ and
CD4+CD39+T-cell percentages in the vehicle group (Figures 19 and 20).
Endoscopy Score
Video endoscopic evaluation of the colon performed weekly beginning on day 14
resulted in no significant differences between groups, however the average scores in the
hemin group were trending lower beginning on day 35 (Figure 21). Representative
images from each week (Figure 23 to 26), show gross morphological changes between
groups. These images best represent the mean group values, selected by an unblinded

24
observer, and a trend can be seen with more disease severity in the vehicle group
particularly at the last 3 evaluations where each animal reached a colitis score of 2,
whereas the hemin group has animals with colitis scores of 1.
Post-Life Phase
Tissue Cytokine Levels
Twelve cytokines were evaluated, IFN-γ, IL-1b, IL-4, IL-6, IL-22, IL-10, IL-23,
IL-12, IL-13, IL-17A, TNF-α, and TGF-β1. Values were obtained for each in the blood
plasma on day 28, 35, 49, and 56 and at sacrifice on day 56 the mesenteric lymph nodes,
spleen, and colon. Figures displaying the complete results can be found in the appendix
(Figures 27 to 40)
On day 28 in the blood plasma, there were no significant differences between
groups (Figure 27 and 28). However, the pro-inflammatory cytokines IFN-γ and TNF-α
levels in the vehicle group were trending higher than the hemin group. This observation
was confirmed by following findings on days 35 and 49 where the trend was still
widening, and on day 56 where ultimately there was a significant difference (Figures 29
to 34). Mean IL-17A values for each week of plasma samples were below the limit of
detection (LOD), but on day 35 the findings showed a significant decrease in of IL-17A
in the hemin treatment group (Figure 30). Again on days 49 and 56, IL-17A values were
below the LOD but still trending with higher values for the vehicle group (Figures 32 and

25
34). Additionally, on days 49 and 56 TGF-β1 levels were trending with higher values in
the hemin group (Figures 32 and 34).
Mesenteric lymph nodes taken at study conclusion showed significant differences
with higher values in the vehicle than the hemin for cytokines IL-12, IL-23, and IL-13
(Figure 36). IL-1b, IL-4, IL-6, IL-10, and TNF-α tended to be higher in the vehicle group,
while IL-22 and TGF-β1 were higher in the hemin group (Figures 35 and 36). The spleen
samples had significant values for 10 of 12 cytokines tested, only IL-4 and TGF-β1 were
not found to be significant. IL-4 appeared to be higher in the vehicle group but not
significant (Figures 37 and 38). In the colon, TGF-β1 was significantly higher in the
vehicle group (Figure 40). IFN-γ, IL-1b, IL-4, IL-6, IL-23, IL-12, IL-13, IL-17A, and
TNF-α were trending higher in the vehicle group but not significant (Figures 38 and 39).
Histopathology
Representative histopathology images show gross morphological changes in the
epithelial and muscular layer of the colon (Figures 10 and 11). Disease progression
marked by morphological changes can be seen including edema, neutrophil infiltrate, and
crypt morphology loss. Figure 12 is a representative histopathology colon scoring scale
with scoring descriptions.

26
Heme Oxygenase-1 Activity Assay
No detectable changes in optical density were observed, therefor the presence of
HO-1 was not confirmed. Limitations and future research based on this is discussed in the
study limitations section.

27
Chapter IV
Discussion
Significance of Results
Heme oxygenase-1 (HO-1) is an oxidative stress response enzyme that catalyzes
the breakdown of heme into carbon monoxide, biliverdin, and iron (Figure 5) (Naito,
Takagi, & Yoshikawa, 2004). HO-1 is a rate-limiting enzyme that has been identified as
an autoimmune suppressor in a variety of disease models (Choi & Alam, 1996, Panahian,
Yoshiura, & Maines, 2008). Recently, treatment with the HO-1 inducer hemin has been
shown to have efficacy in the DSS-induced colitis model (Zhang et al., 2014).
Specifically, numbers of pro-inflammatory Th17 cells were decreased and suppressor T-
regs were increased which resulted in a significant treatment effect, diminishing disease
(Zhang et al., 2014). Here, we saw a similar effect on T-cell modulation in an adoptive
transfer model of colitis using FACS analysis and immunoassays while monitoring
disease severity using weight loss and video endoscopy as primary endpoints.
Throughout the course of the 57 day study, animal body weights were obtained
daily. Notably, both groups had similar weight change until separation began after day
42, with the hemin treated animals tending to show less weight loss (Figure 14). Near
study conclusion on days 55 and 56 the difference in weight change reached statistical
significance, where the hemin group has shown an overall gain in weight. The individual
weight change graph shows the distribution of weight loss within groups, where it can be
seen that the hemin group animals are trending higher than vehicle with one exception

28
(animal #11) (Figure 15). Importantly, weekly endoscopic evaluation revealed that the
vehicle group reached a peak score of 2 for all animals on day 42 which persisted until
study conclusion, while the hemin group had an average score of 1.6, 1.6, and 1.8 on days
42, 49, and 56 respectively. However, this effect did not reach statistical significance
(Figure 21). Although endoscopy was not significant, a trend is seen in the representative
photos, Figures 23 to 26, where the hemin treated animals have less tissue friability
and/or bleeding. These findings together suggest a positive treatment trend for the hemin
group. Colon weight to length ratios were calculated to determine gross physiological
changes, but differences were not found between groups.
To support these in-life endpoints, beginning on day 14, a small volume of
peripheral blood (100µL) was collect from each animal once per week; plasma was
collected for subsequent immunoassays, and the cellular portion was reserved for FACS
analysis. In addition to blood, mesenteric lymph nodes, spleen, and colon were harvested
and homogenized for these analyses at time of sacrifice (Table 1). First, CD4+ T-cell
populations were identified by FACS analysis, which showed a significant increase of
CD4+ numbers in the vehicle group compared to the hemin group on day 56 in the blood.
We measured for CD25 and CD39 expression within the CD4+ populations, finding that
there were no CD25 high events (Figure 6). T-regs are characterized by high expression
levels of the cell surface marker CD25 (IL-2R) (Josefowicz, Lu, & Rudensky, 2012).
With the results showing no CD25 high populations, and knowing that CD25+ cells were
removed during the initial cell sort, we can conclude there are no significant true T-reg
populations (Beyer, 2006). While this initially was seen as a deviation from the findings
from the DSS models, we found that CD4+CD39+ T-cells were significantly increased in

29
the vehicle group each week beginning day 28 and persisted until study conclusion
(Figure 18). The cell surface marker CD39 has been shown to be present on both
pathogenic Th17 and T-regs (Bai et al., 2014, Dwyer et al., 2010). Since there are no T-
regs present as (defined here as CD4+CD25high), these data indicate a significant
increase in the pool of Th17 cells in the vehicle group compared to the hemin. No
significant differences were found in the spleen and mesenteric lymph nodes, using
FACS analysis (Figures 19 and 20).
Multiplex immunoassays were used to detect the presence of IFN-γ, IL-1b, IL-4,
IL-6, IL-22, IL-10, IL-23, IL-12, IL-13, IL-17A, TNF-α, and TGF-β1 in the peripheral
blood plasma, mesenteric lymph nodes, spleen, and colon. IFN-γ and TNF-α levels were
both significantly elevated in the vehicle group compared to the hemin group on day 56
in the blood. This finding suggests that hemin is suppressing the secretion and/or
production of pro-inflammatory cytokines. Interestingly, IL-17A levels were found to be
significantly increased on day 35 in the vehicle group, while trending similarly for the
remainder of the study (the significance of this result is limited due to the mean IL-17A
levels were below the limit of detection). Low levels of IL-17A suggest low overall
levels of Th17 cells and/or a diminished response, however, the number of T-cells in the
adoptive transfer model is much less than that of a wild type C57Bl/6 mouse; this would
account for multiple target cytokines falling below the limit of detection (Figures 27 to
40). In a wild type C57Bl/6 mouse lymphocytes comprise over 60% of the cells in the
blood, compared to just over 10% on day 56 in the vehicle group (Figure 17) (JAX
Physiological Data Summary - C57BL/6J, 2016). Supporting this is the finding that there
were significantly increased levels of IL-17A in the spleen well over the limit of
30
detection (Figure 38) and the level of T-cells in the spleen were close to that of a wild
type C57Bl/6 mouse spleen (Figure 19) (JAX Physiological Data Summary - C57BL/6J,
2016). In the colon, TGF-β1, levels were significantly higher in the vehicle group than
the hemin group (Figure 40). This finding is interesting because literature references
indicate that TGF-β1 has a role in immunosuppression by modulating the activation,
proliferation, and differentiation of T-cells (Letterio & Roberts, 1998). Further research
has shown that TGF-β1 is needed for the function of Foxp3+ T-regs (Marie, Letterio,
Gavin, & Rudensky, 2005). However, more recent research has shown that TGF-β1 is
needed for the development of Th17 cells from naive T-precursors (Mangan et al., 2006,
Qin et al., 2009). Here, our results corroborate the pro-Th17 activity of TGF-β1 findings,
observing increased blood CD4+CD39+ T-cells and pro-inflammatory cytokines in the
vehicle group in conjunction with higher TGF-β1 levels in the colon compared to the
hemin treated group. In the mesenteric lymph nodes, IL-12 and IL-23 levels were
significantly increased in the vehicle group again indicating an increase in Th17 load
(Figure 36). Recent research that has found that IL-12 and IL-23 are primary cytokines in
the development of Th17 cells (Teng et al., 2015). IL-13, also significantly increased in
the vehicle group, is known to suppress inflammatory cytokine production, however,
other research has shown that IL-13’s suppressive capabilities are lessened in diseased
patients and in addition, IL-13 is involved in the induction of TGF-β1 secretion which we
saw in this research (Fichtner-Feigl, Strober, Kawakami, Puri, & Kitani, 2005,
KUCHARZIK et al., 1996, Wynn, 2003). Finally, the spleen saw significant cytokine
changes in 10 of 12 cytokines evaluated (all except IL-17A and IL-4), with higher
concentrations in the vehicle group which highlights the overall immunosuppressive

31
capabilities of hemin as a treatment leading to the effector subset (Th17) changes seen
here (Figures 37 and 38). While IL-10 levels were significantly increased in the spleen,
the fact that a suppressive cytokine is upregulated could simply indicate enhanced
inflammation and disease which strengthens the case for hemin as an immunosuppressive
treatment. Indeed, in the intestinal epithelium of CD patients IL-10 is significantly
increased during inflammation in associated with IL-10 producing monocyte infiltrate
(Marlow, 2013).
The HO-1 activity assay did not detect any changes in activity between groups,
the primary value needed to identify an increase in HO-1 as a product of bilirubin
production. This could be due to lack of sensitivity of the assay, or the limited quantity of
tissue available for use. Additionally, in the transgenic strain RAG2-/- mice there is likely
to be different levels of expression of multiple factors in response to stress as a results of
the absence of B or T-cells, other than the naive T-cells used to induce disease.
Study Limitations
While it is possible that treatment did not have a large effect on disease, the trends
seen in the weight changes, AUC, endoscopy scores, and cytokine panels suggest an
increase in group size would yield statistically significant differences. In addition to
larger group sizes, additional groups could have been added, such as a naïve (no cell
transfer) control and a Sn-protoporphyrin IX (SnPP) treatment group. SnPP, is a
competitive inhibitor which also induces HO-1 but blocks enzyme activity (Zhang et al.,
2014). Another limitation could be the hemin dose and/or frequency and duration of

32
dose. No toxic effects were observed, indicating that a larger or more frequent dose
would be a possibility. Histopathology scoring, which requires a board certified
pathologist and was outside of the budget could have been a more sensitive detection of
disease than video endoscopy due to the low severity in the disease model compared to
chemical models.
The HO-1 activity assay did not result in any usable data, this could be due to the
sensitivity of the assay. Researchers who have used this is the past did not indicate mass
of tissue required for the assay; a relatively small 1 cm piece was used here to allow for
the remained to be used for histopathology sectioning. Th17 cells were a main focus of
these experiments, and IL-17A was used to infer an active Th17 response. However, the
IL-17A ELISA yielded results below the limit of detection for many of the samples. It is
possible that a more complete picture would be obtained by assessing the concentration
of other IL-17 isoforms rather than solely focusing on IL-17A. Additionally, the lower T-
cell load and complete absence of B-cells in the adoptive transfer model compared to a
naïve wild type mouse could be a major factor influencing the concentrations of
cytokines; C57Bl/6 mice have on average 60% lymphocytes in their blood compared to
just over 10% seen here (JAX Physiological Data Summary - C57BL/6J, 2016). Finally,
there are commercially available assays used to quantify Th17, HO-1, and T-Reg
ELISAs, however limited resources precluded their use in this case. and other methods of
detection were chosen as substitutes (Th17/TGF-β1 multiplex, HO-1 activity assay, and
FACS analysis).

33
Future Research Directions
Research building on these results should include additional T-cell markers for
FACS analysis, as the field has become increasingly aware that subsets of effector T-cells
can be differentiated from one another using multiple disctinct cell markers. For example,
CD161 combined with CD39 indicates a pathogenic Th17 cell, while Foxp3 with CD39
indicates a T-regs (Bai et al., 2014, Dwyer et al., 2010). Moreover, analyzing
transcription factors Foxp3 and ROR-γ by FACS would allow further characterization of
T-cells. Using an ELISA to detect HO-1 would be a more accurate and reliable method
for detection and would likely require less sample, allowing for more effective analysis
using that tissue. In the adoptive transfer model of colitis, disease typically presents less
severely than in chemical models as shown by the peak score of 2 via endoscopy (Figure
21), as compared with an average peak score >2.5 in the DSS model
("Colitis/Inflammatory Bowel Disease (IBD) | Biomodels", 2016). Due to this,
histopathological scoring by a trained pathologist may be essential to identify subtle
inflammatory damage by morphological changes
An avenue to explore and expand upon these results would be to look at the role
of integrins in Th17 development in this model using hemin as treatment. Research has
shown that integrin αvβ8 activation of TGF-β1 is needed to induce Th17 differentiation
(Pociask & Kolls, 2010). Here, we showed a significant increase in TGF-β1 in colon
tissue; it would be important to determine if integrins are being affected as part of
treatment and/or as part of the overall immunosuppressive capabilities of hemin. Finally,
the data presented suggest the adoptive transfer model is a prime candidate for future

34
research focusing on TGF-β1 and T-cell development, which has reported conflicting
results in the past. (Letterio & Roberts, 1998, Mangan et al., 2006, Marie, Letterio,
Gavin, & Rudensky, 2005, Qin et al., 2009).
Conclusion
I hypothesized that hemin would upregulate HO-1 which then would have a
powerful effect in diminishing disease determined by weight loss and video endoscopy
outcomes and this effect would be associated with decreased pro-inflammatory cytokines
and Th17 cell differentiation. Data from the adoptive transfer induced colitis model is
presented showing significant decreases in CD4+ and CD4+CD39+ T-cells counts and
pro-inflammatory cytokines IFN-γ and TNF-α together with positive trends in weight
change, video endoscopy score, and other cytokines in the hemin treatment group. HO-1
was unable to be detected and therefore cannot be positively identified as the treatment
target. Additionally, since no T-reg population was identified it does not appear that
hemin induces the proliferation of T-regs from naïve T-cells. Together, these data
strongly suggest that hemin acts as an anti-inflammatory agent with T-cell modulatory
effects.

35
Appendix
Table 1. In-Life Study Design: 10 donor mice provided naïve CD4+ T-cells to induce
colitis in 16 RAG2-/- mice. Collections, measurements, and dosing provided valuable
data on disease progression. Sacrifice endpoints were used to detect changes in tissue
samples colon, spleen, and mesenteric lymph nodes.

36
Figure 1. Insult to gut results in loss of bacterial balance and dysregulated immune
response. Beneficial bacteria no longer provide protection against pathogens leading to an
inflammatory cascade marked by Th17 proliferation (Gálvez, 2014).
Figure 2. Naïve T-cells “Tn” have the potential to become many effector and T-regs. The
cytokine milieu present drives production of specific subsets (Weaver, Harrington,
Mangan, Gavrieli, & Murphy, 2006).

37
Figure 3.The complex relationship between T-reg and Th17 plays a significant role in the
pathogenesis of IBD and highlights the importance in understanding the characteristics of
each subset (Omenetti & Pizarro, 2015).
38
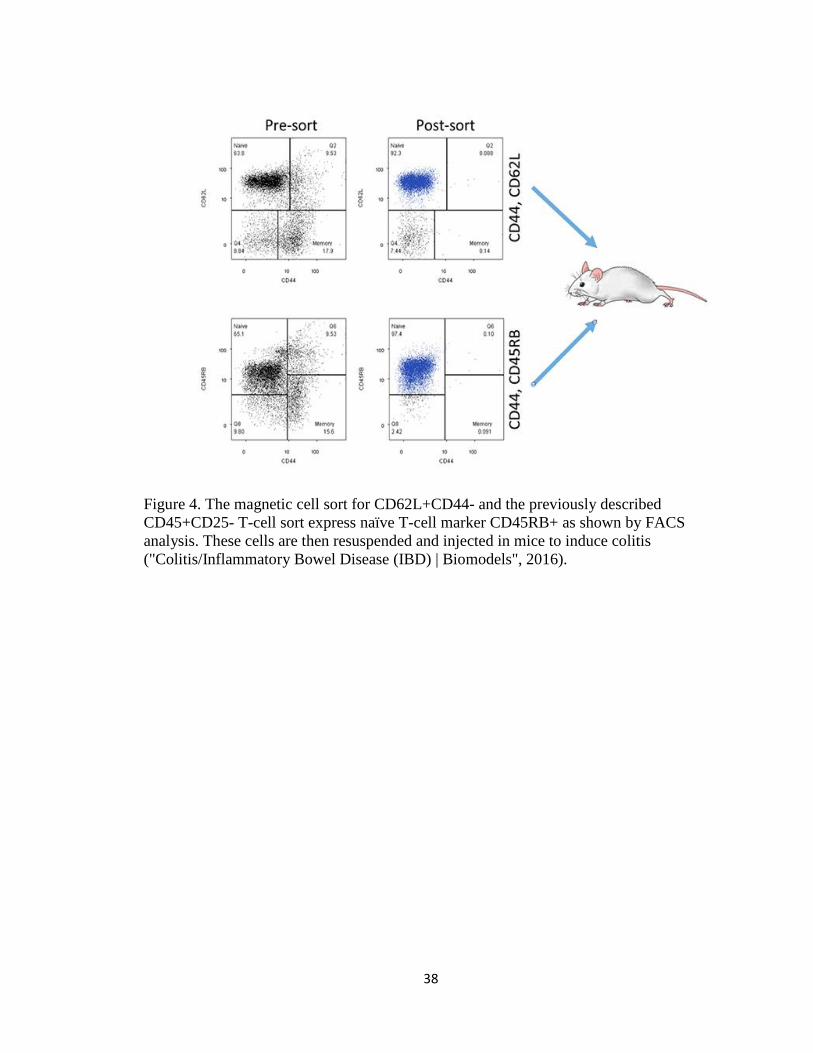
Figure 4. The magnetic cell sort for CD62L+CD44- and the previously described
CD45+CD25- T-cell sort express naïve T-cell marker CD45RB+ as shown by FACS
analysis. These cells are then resuspended and injected in mice to induce colitis
("Colitis/Inflammatory Bowel Disease (IBD) | Biomodels", 2016).

39
Figure 5. Degradation of heme by HO-1 produces anti-inflammatory byproducts
biliverdin, carbon monoxide, and Fe2+. These products lead to several anti-inflammatory
effects such as ROS scavenging, neutrophil infiltrate inhibition, and anti-apoptosis
(Naito, Takagi, & Yoshikawa, 2004).
40
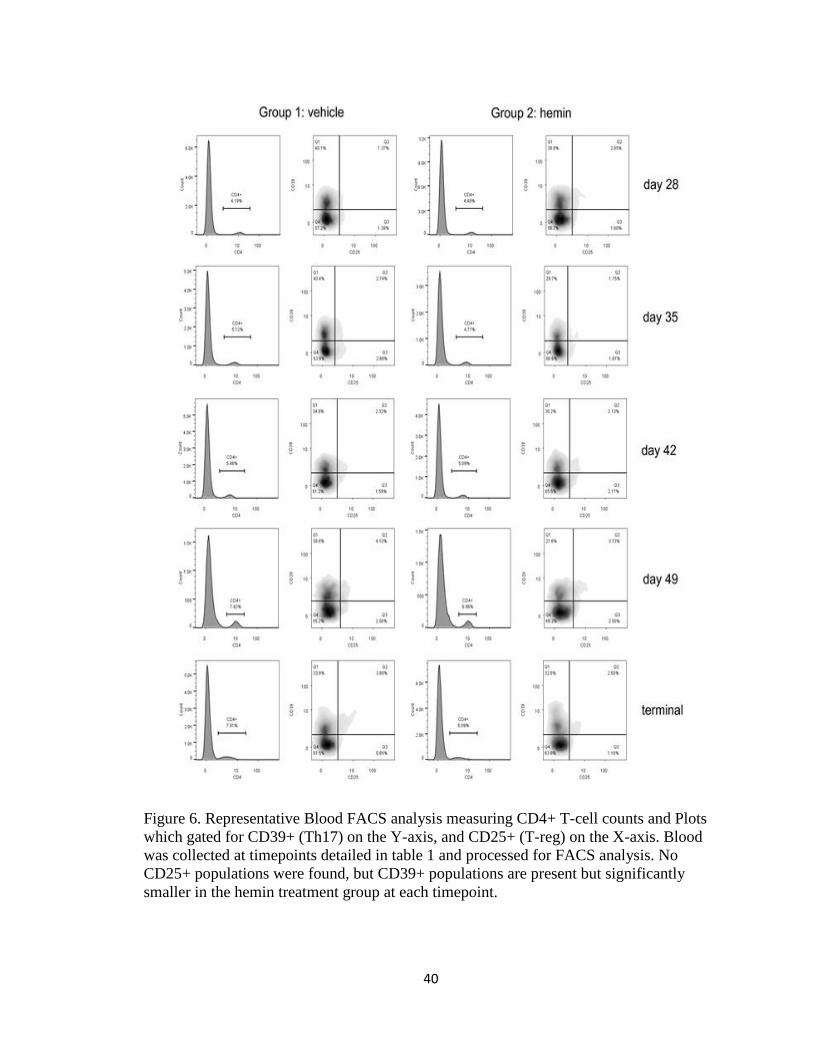
Figure 6. Representative Blood FACS analysis measuring CD4+ T-cell counts and Plots
which gated for CD39+ (Th17) on the Y-axis, and CD25+ (T-reg) on the X-axis. Blood
was collected at timepoints detailed in table 1 and processed for FACS analysis. No
CD25+ populations were found, but CD39+ populations are present but significantly
smaller in the hemin treatment group at each timepoint.

41
Figure 7. Representative Mesenteric Lymph Node FACS analysis measuring CD4+ T-
cell counts and Plots which gated for CD39+ on the Y-axis, and CD25+ on the X-axis.
Tissue was collected at timepoints detailed in table 1 and processed for FACS analysis.
No CD25+ populations were seen but CD39+ populations are higher compared to blood,
but no significant differences were found.
42
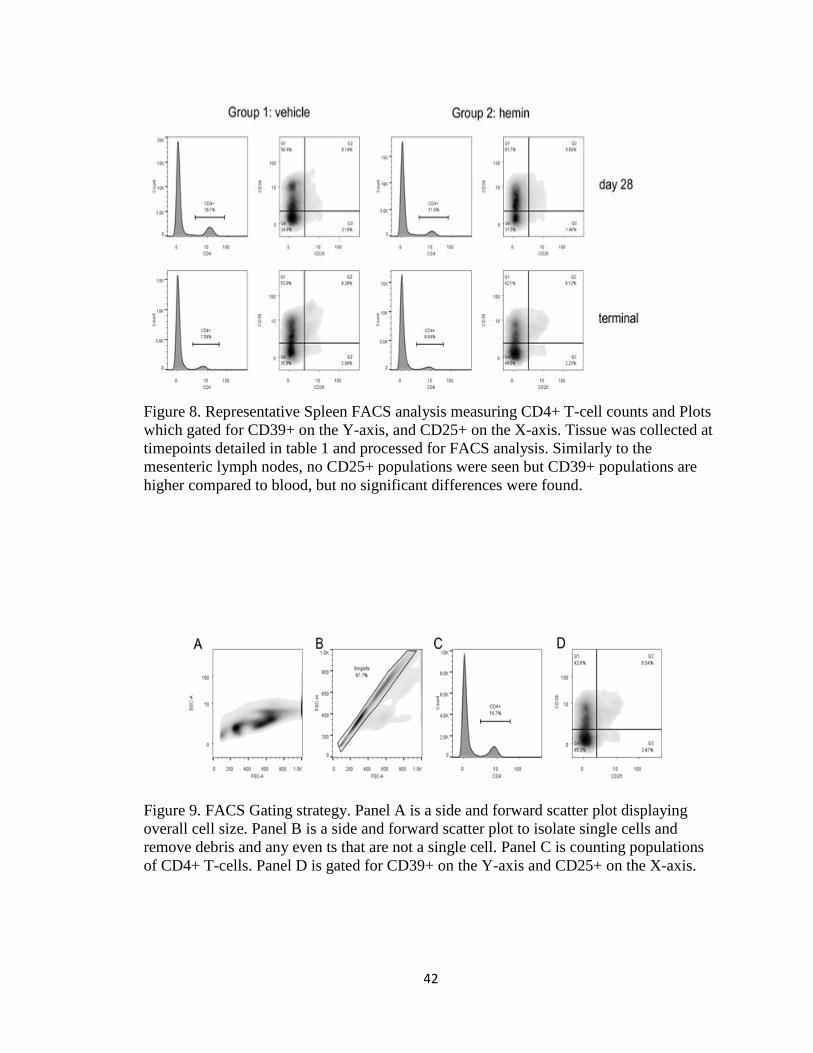
Figure 8. Representative Spleen FACS analysis measuring CD4+ T-cell counts and Plots
which gated for CD39+ on the Y-axis, and CD25+ on the X-axis. Tissue was collected at
timepoints detailed in table 1 and processed for FACS analysis. Similarly to the
mesenteric lymph nodes, no CD25+ populations were seen but CD39+ populations are
higher compared to blood, but no significant differences were found.
Figure 9. FACS Gating strategy. Panel A is a side and forward scatter plot displaying
overall cell size. Panel B is a side and forward scatter plot to isolate single cells and
remove debris and any even ts that are not a single cell. Panel C is counting populations
of CD4+ T-cells. Panel D is gated for CD39+ on the Y-axis and CD25+ on the X-axis.

43
Figure 10: Example Day 28 Histopathology analysis on colon sample shows sufficient
disease induction. Panel A/C are a 100x magnification and Panel B/D are 200x. Black
arrows indicate areas of increased edema and red arrows indicate areas of monocyte
infiltrate indicating mild to moderate disease severity.

44
Figure 11: Example Day 56 Histopathology analysis on colon sample shows disease
progress and severity. Panel A/C are a 100x magnification and Panel B/D are 200x. Black
arrows indicate areas of increased edema, red arrows indicate areas of monocyte
infiltrate, and blue arrows indicate areas where crypt morphology is perturbed indicating
moderate to high disease severity.

45
Figure 12: “Histomorphology of colon tissue after transfer of CD4+CD45RBhi T cells into
Rag1-ko mice representing scores according to scheme 3 (adoptive transfer colitis scale).
A. Score 0: normal colon mucosa with intact epithelium; B. Score 1: scattered
inflammatory cell infiltrates in the mucosa; C. Score 2: diffuse mucosal infiltrates
without submucosal spreading and intact epithelial layer; D. Score 3: moderate
infiltration of inflammatory cells into mucosa and submucosa with epithelial hyperplasia
and goblet cell loss; E. Score 4: marked inflammatory cell infiltrates in mucosa and
submucosa accompanied by crypt abscesses and loss of goblet cells and crypts; F. Score
5: marked inflammatory cell infiltrates within the mucosa spreading to the submucosa
going along with crypt loss and hemorrhage. Original magnification ×100; scale bars 100
μm; arrows-inflammatory cell infiltrates within mucosa (solid) and submucosa (dotted);
black arrowhead-crypt abscess, blue arrowhead-goblet cell loss; yellow arrowhead-crypt
loss; red arrowhead-hemorrhage.” (Erben et al., 2014)

46
Figure 13. Weight changes represented by Area Under the Curve (AUC). Animal weights
were measured daily throughout the study. Data is represented as group average ±SEM.
n=3 at day 28, n=5 at day 56 for group 1 and n=4 on day 56 for group 2.

47
Figure 14. Mean Group Weight Change. Yellow = Vehicle, Blue= Hemin. Animal
weights were measured daily throughout the study. Percent weight change was calculated
relative to the starting weight on day 0. Data is represented as group average ±SEM. n=8
per group.

48
Figure 15. Individual Weight Change. Yellow = Vehicle, Blue= Hemin. Animal weights
were measured daily throughout the study. Percent weight change was calculated relative
to the starting weight on day 0.

49
Figure 16. Mean Group Colon Length/Weight (g/cm). Colon was excised at sacrifice on
day 28 and 56, flushed with saline and measured for weight and length. Data is
represented as group average ±SEM. n=3 at day 28, n=5 at day 56 for group 1 and n=4 on
day 56 for group 2.

50
Figure 17. Mean blood CD4+ T-cell percentages. Blood was collected at timepoints in
table 1 and processed for FACS analysis of CD4 expression. Data is represented as group
average ±SEM. n=8 per group on days 14 and 28, n=5 per group on days 35 and 42, and
n=5 at day 56 for group 1 and n=4 on day 56 for group 2. *: p<0.05 as assessed by one
tailed Student’s T test.

51
Figure 18. Mean blood CD4+CD39+ T-cell percentages. Blood was collected at
timepoints in table 1 and processed for FACS analysis of CD4 and CD39 expression.
Data is represented as group average ±SEM. n=8 per group on days 14 and 28, n=5 per
group on days 35 and 42, and n=5 at day 56 for group 1 and n=4 on day 56 for group 2.
*: p<0.05 as assessed by one tailed Student’s T test.

52
Figure 19. Mean tissue CD4+ T-cell. Tissue was collected at timepoints in table 1 and
processed for FACS analysis of CD4 expression. Data is represented as group average
±SEM. n=3 on day 28, and n=5 at day 56 for group 1 and n=4 on day 56 for group 2.

53
Figure 20. Mean tissue CD4+ CD39+ T-cell. Tissue was collected at timepoints in table 1
and processed for FACS analysis of CD4 and CD39 expression. Data is represented as
group average ±SEM. n=3 on day 28, and n=5 at day 56 for group 1 and n=4 on day 56
for group 2.

54
Figure 21. Mean video endoscopy scores. Colitis was assessed by video endoscopy at the
timepoints indicated in table 1 and scored using the colitis scoring scale shown in Figure
10. Data is represented as group average ±SEM. n=8 per group on days 14, 21, and 28,
n=5 per group on days 35, 42, and 49 and n=5 at day 56 for group 1 and n=4 on day 56
for group 2.

55
Figure 22. Video Endoscopy Scoring Scale developed by Biomodels, LLC with
descriptions for each score. Escalating from a score of 0-4 disease progression is
identified by changes in vascularity, edema, bleeding, erosion, and ulceration (Hamilton
et al., 2011, Lyng, Stevens, Gordon, Watkins, & Sonis, 2008)

56
Figure 23. Day 14 and Day 21 representative endoscopy images. Video endoscopy
performed at timepoints indicated in table 1 and pictures were taken of the most diseased
area. Group averages are shown for comparison purposes. n=8 per group
57
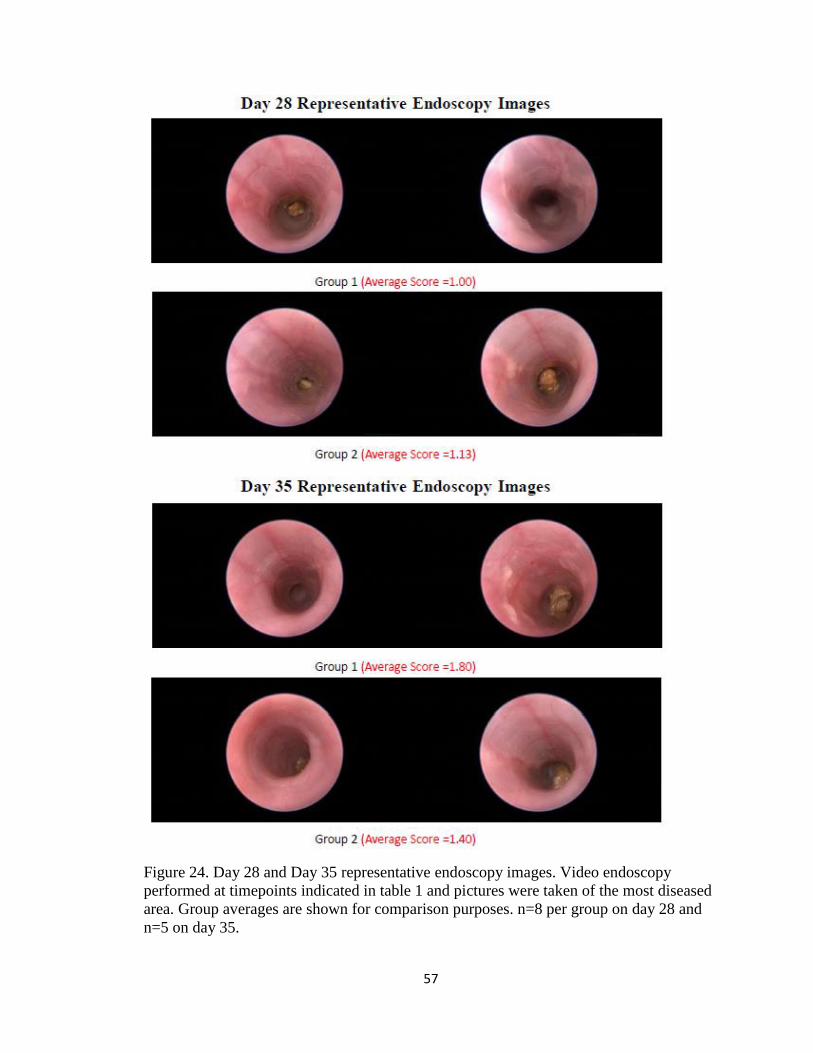
Figure 24. Day 28 and Day 35 representative endoscopy images. Video endoscopy
performed at timepoints indicated in table 1 and pictures were taken of the most diseased
area. Group averages are shown for comparison purposes. n=8 per group on day 28 and
n=5 on day 35.

58
Figure 25. Day 42 and Day 49 representative endoscopy. Video endoscopy performed at
timepoints indicated in table 1 and pictures were taken of the most diseased area. Group
averages are shown for comparison purposes. n=5 per group

59
Figure 26. Day 56 representative endoscopy images. Video endoscopy performed at
timepoints indicated in table 1 and pictures were taken of the most diseased area. Group
averages are shown for comparison purposes. n=5 for group 1 and n=4 for group 2.

60
Figure 27. Day 28 Plasma Multiplex Graph Part 1. Plasma was collected at the timepoints
indicated in Table 1. Samples were analyzed using multiplex ELISA. Data is represented
as group average ±SEM. n=8 per group. LOD: Limit of detection.

61
Figure 28. Day 28 Plasma Multiplex Graph Part 2. Plasma was collected at the timepoints
indicated in Table 1. Samples were analyzed using multiplex ELISA. Data is represented
as group average ±SEM. n=8 per group. LOD: Limit of detection.

62
Figure 29. Day 35 Plasma Multiplex Graph Part 1. Plasma was collected at the timepoints
indicated in Table 1. Samples were analyzed using multiplex ELISA. Data is represented
as group average ±SEM. n=8 per group. LOD: Limit of detection.

63
Figure 30. Day 35 Plasma Multiplex Graph Part 2. Plasma was collected at the timepoints
indicated in Table 1. Samples were analyzed using multiplex ELISA. Data is represented
as group average ±SEM. n=8 per group. LOD: Limit of detection. *: p<0.05 as assessed
by one tailed Student’s T test.

64
Figure 31. Day 49 Plasma Multiplex Graph Part 1. Plasma was collected at the timepoints
indicated in Table 1. Samples were analyzed using multiplex ELISA. Data is represented
as group average ±SEM. n=8 per group. LOD: Limit of detection.

65
Figure 32. Day 49 Plasma Multiplex Graph Part 2. Plasma was collected at the timepoints
indicated in Table 1. Samples were analyzed using multiplex ELISA. Data is represented
as group average ±SEM. n=8 per group. LOD: Limit of detection.

66
Figure 33. Day 56 Plasma Multiplex Graph Part 1. Plasma was collected at the timepoints
indicated in Table 1. Samples were analyzed using multiplex ELISA. Data is represented
as group average ±SEM. n=8 per group. LOD: Limit of detection. *: p<0.05 as assessed
by one tailed Student’s T test.

67
Figure 34. Day 56 Plasma Multiplex Graph Part 2. Plasma was collected at the timepoints
indicated in Table 1. Samples were analyzed using multiplex ELISA. Data is represented
as group average ±SEM. n=8 per group. LOD: Limit of detection. *: p<0.05 as assessed
by one tailed Student’s T test.

68
Figure 35. Day 56 Mesenteric Lymph Node Multiplex Graph Part 1. Plasma was
collected at the timepoints indicated in Table 1. Samples were analyzed using multiplex
ELISA. Data is represented as group average ±SEM. n=8 per group. LOD: Limit of
detection.

69
Figure 36. Day 56 Mesenteric Lymph Node Multiplex Graph Part 2. Plasma was
collected at the timepoints indicated in Table 1. Samples were analyzed using multiplex
ELISA. Data is represented as group average ±SEM. n=8 per group. LOD: Limit of
detection. *: p<0.05 as assessed by one tailed Student’s T test.

70
Figure 37. Day 56 Spleen Multiplex Graph Part 1. Plasma was collected at the timepoints
indicated in Table 1. Samples were analyzed using multiplex ELISA. Data is represented
as group average ±SEM. n=8 per group. LOD: Limit of detection. *: p<0.05 as assessed
by one tailed Student’s T test.

71
Figure 38. Day 56 Spleen Multiplex Graph Part 2. Plasma was collected at the timepoints
indicated in Table 1. Samples were analyzed using multiplex ELISA. Data is represented
as group average ±SEM. n=8 per group. LOD: Limit of detection. *: p<0.05 as assessed
by one tailed Student’s T test.

72
Figure 39. Day 56 Colon Multiplex Graph Part 1. Plasma was collected at the timepoints
indicated in Table 1. Samples were analyzed using multiplex ELISA. Data is represented
as group average ±SEM. n=8 per group. LOD: Limit of detection.

73
Figure 40. Day 56 Colon Multiplex Graph Part 2. Plasma was collected at the timepoints
indicated in Table 1. Samples were analyzed using multiplex ELISA. Data is represented
as group average ±SEM. n=8 per group. LOD: Limit of detection. *: p<0.05 as assessed
by one tailed Student’s T test.

74
Figure 41. Representative Necropsy Photos. Group 1 (top) is normal and Group 2
(bottom) hemin deposits (red arrows) are seen in peritoneal cavity.
75
References
Abdulahad, W., Boots, A., & Kallenberg, C. (2010). FoxP3+ CD4+ T cells in systemic
autoimmune diseases: the delicate balance between true regulatory T cells and effector
Th-17 cells. Rheumatology, 50(4), 646-656.
http://dx.doi.org/10.1093/rheumatology/keq328
Ananthakrishnan, A. (2015). Epidemiology and risk factors for IBD. Nature Reviews
Gastroenterology & Hepatology, 12(4), 205-217.
http://dx.doi.org/10.1038/nrgastro.2015.34
Bai, A., Moss, A., Kokkotou, E., Usheva, A., Sun, X., & Cheifetz, A. et al. (2014). CD39 and
CD161 Modulate Th17 Responses in Crohn's Disease. The Journal Of Immunology,
193(7), 3366-3377. http://dx.doi.org/10.4049/jimmunol.1400346
Ben-Horin, S., Kopylov, U., & Chowers, Y. (2014). Optimizing anti-TNF treatments in
inflammatory bowel disease. Autoimmunity Reviews, 13(1), 24-30.
http://dx.doi.org/10.1016/j.autrev.2013.06.002
Berger, A. (2000). Science commentary: Th1 and Th2 responses: what are they?. BMJ,
321(7258), 424-424. http://dx.doi.org/10.1136/bmj.321.7258.424
Berkes, J. (2003). Intestinal epithelial responses to enteric pathogens: effects on the tight
junction barrier, ion transport, and inflammation. Gut, 52(3), 439-451.
http://dx.doi.org/10.1136/gut.52.3.439
Beyer, M. (2006). In vivo peripheral expansion of naive CD4+CD25high FoxP3+ regulatory T
cells in patients with multiple myeloma. Blood, 107(10), 3940-3949.
http://dx.doi.org/10.1182/blood-2005-09-3671
Bharat, A., Kuo, E., Saini, D., Steward, N., Hachem, R., & Trulock, E. et al. (2010).
Respiratory Virus-Induced Dysregulation of T-Regulatory Cells Leads to Chronic
Rejection. The Annals Of Thoracic Surgery, 90(5), 1637-1644.
http://dx.doi.org/10.1016/j.athoracsur.2010.06.048

76
Cheng, X., Yu, X., Ding, Y., Fu, Q., Xie, J., & Tang, T. et al. (2009). Corrigendum to “The
Th17/Treg imbalance in patients with acute coronary syndrome― [Clin. Immunol. 127
(2008) 89–97]. Clinical Immunology, 133(3), 447.
http://dx.doi.org/10.1016/j.clim.2009.09.015
Chiba, T. & Seno, H. (2011). Indigenous Clostridium Species Regulate Systemic Immune
Responses by Induction of Colonic Regulatory T Cells. Gastroenterology, 141(3), 1114-
1116. http://dx.doi.org/10.1053/j.gastro.2011.07.013
Choi, A. & Alam, J. (1996). Heme oxygenase-1: function, regulation, and implication of a
novel stress-inducible protein in oxidant-induced lung injury. American Journal Of
Respiratory Cell And Molecular Biology, 15(1), 9-19.
http://dx.doi.org/10.1165/ajrcmb.15.1.8679227
Colitis/Inflammatory Bowel Disease (IBD) | Biomodels. (2016). Biomodels.com. Retrieved 19
June 2016, from http://www.biomodels.com/animal-models/inflammatory-
diseases/colitis/
Colombel, J. (2014). Decade in review—IBD: IBD—genes, bacteria and new therapeutic
strategies. Nature Reviews Gastroenterology & Hepatology, 11(11), 652-654.
http://dx.doi.org/10.1038/nrgastro.2014.170
Dieleman, Palmen, Akol, Bloemena, PENA, Meuwissen, & Van Rees,. (1998). Chronic
experimental colitis induced by dextran sulphate sodium (DSS) is characterized by Th1
and Th2 cytokines. Clinical And Experimental Immunology, 114(3), 385-391.
http://dx.doi.org/10.1046/j.1365-2249.1998.00728.x
Dwyer, K., Hanidziar, D., Putheti, P., Hill, P., Pommey, S., & McRae, J. et al. (2010).
Expression of CD39 by Human Peripheral Blood CD4+CD25+ T Cells Denotes a
Regulatory Memory Phenotype. American Journal Of Transplantation, 10(11), 2410-
2420. http://dx.doi.org/10.1111/j.1600-6143.2010.03291.x
Engel, M. & Neurath, M. (2010). New pathophysiological insights and modern treatment of
IBD. Journal Of Gastroenterology, 45(6), 571-583. http://dx.doi.org/10.1007/s00535-
010-0219-3

77
Erben, U., Loddenkemper, C., Doerfel, K., Spieckermann, S., Haller, D., Heimesaat, M. M.,
… Kühl, A. A. (2014). A guide to histomorphological evaluation of intestinal
inflammation in mouse models. International Journal of Clinical and Experimental
Pathology, 7(8), 4557–4576.
Esworthy, R., Kim, B., Doroshow, J., Leto, T., & Chu, F. (2013). Tu1711 Gpx1, Gpx2 and
Gdac1 Each Have a Distinct Impact on Spontaneous and Salmonella-Induced Colitis in
Mice. Gastroenterology, 144(5), S-828. http://dx.doi.org/10.1016/s0016-5085(13)63075-
9
Feagan, B., Rutgeerts, P., Sands, B., Hanauer, S., Colombel, J., & Sandborn, W. et al. (2013).
Vedolizumab as Induction and Maintenance Therapy for Ulcerative Colitis. New England
Journal Of Medicine, 369(8), 699-710. http://dx.doi.org/10.1056/nejmoa1215734
Feng, T., Wang, L., Schoeb, T., Elson, C., & Cong, Y. (2010). Microbiota innate stimulation is
a prerequisite for T cell spontaneous proliferation and induction of experimental colitis.
The Journal Of Experimental Medicine, 207(6), 1321-1332.
http://dx.doi.org/10.1084/jem.20092253
Fichtner-Feigl, S., Strober, W., Kawakami, K., Puri, R., & Kitani, A. (2005). IL-13 signaling
through the IL-13α2 receptor is involved in induction of TGF-β1 production and
fibrosis. Nature Medicine, 12(1), 99-106. http://dx.doi.org/10.1038/nm1332
FIOCCHI, C. (2005). Inflammatory bowel disease pathogenesis: therapeutic implications.
Chinese Journal Of Digestive Diseases, 6(1), 6-9. http://dx.doi.org/10.1111/j.1443-
9573.2005.00191.x
Fuss, I. (2008). Is the Th1/Th2 paradigm of immune regulation applicable to IBD?.
Inflammatory Bowel Diseases, 14, S110-S112. http://dx.doi.org/10.1002/ibd.20683
Galvez, J. (2014). Role of Th17 Cells in the Pathogenesis of Human IBD. ISRN Inflammation,
2014, 1-14. http://dx.doi.org/10.1155/2014/928461
Germain, R. (2002). T-cell development and the CD4–CD8 lineage decision. Nat Rev
Immunol, 2(5), 309-322. http://dx.doi.org/10.1038/nri798

78
Hamilton, M., Sinnamon, M., Lyng, G., Glickman, J., Wang, X., & Xing, W. et al. (2010).
Essential role for mast cell tryptase in acute experimental colitis. Proceedings Of The
National Academy Of Sciences, 108(1), 290-295.
http://dx.doi.org/10.1073/pnas.1005758108
Hanauer, S. (2002). New steroids for IBD: progress report. Gut, 51(2), 182-183.
http://dx.doi.org/10.1136/gut.51.2.182
Harbour, S., Maynard, C., Zindl, C., Schoeb, T., & Weaver, C. (2015). Th17 cells give rise to
Th1 cells that are required for the pathogenesis of colitis. Proceedings Of The National
Academy Of Sciences, 112(22), 7061-7066. http://dx.doi.org/10.1073/pnas.1415675112
Harty, J., Tvinnereim, A., & White, D. (2000). CD8+ T Cell Effector Mechanisms in
Resistance to Infection. Annual Review Of Immunology, 18(1), 275-308.
http://dx.doi.org/10.1146/annurev.immunol.18.1.275
Hu, S., Chen, M., Wang, Y., Wang, Z., Pei, Y., & Fan, R. et al. (2016). mTOR Inhibition
Attenuates Dextran Sulfate Sodium-Induced Colitis by Suppressing T Cell Proliferation
and Balancing TH1/TH17/Treg Profile. PLOS ONE, 11(4), e0154564.
http://dx.doi.org/10.1371/journal.pone.0154564
Hugot, J., Chamaillard, M., Zouali, H., Lesage, S., Cézard, J., & Belaiche, J. et al. (2001).
Nature, 411(6837), 599-603. http://dx.doi.org/10.1038/35079107
Iwakura, Y. (2006). The IL-23/IL-17 axis in inflammation. Journal Of Clinical Investigation,
116(5), 1218-1222. http://dx.doi.org/10.1172/jci28508
JAX Physiological Data Summary - C57BL/6J. (2016) (1st ed., p. 1). Retrieved from
https://www.jax.org/strain/000664
Josefowicz, S., Lu, L., & Rudensky, A. (2012). Regulatory T Cells: Mechanisms of
Differentiation and Function. Annual Review Of Immunology, 30(1), 531-564.
http://dx.doi.org/10.1146/annurev.immunol.25.022106.141623
79
Kanai, T., Kawamura, T., Dohi, T., Makita, S., Nemoto, Y., Totsuka, T., & Watanabe, M.
(2006). TH1/TH2-mediated colitis induced by adoptive transfer of CD4+CD45RBhigh T
lymphocytes into nude mice. Inflammatory Bowel Diseases, 12(2), 89-99.
http://dx.doi.org/10.1097/01.mib.0000197237.21387.ml
Khan, K., Ullman, T., Ford, A., Abreu, M., Abadir, A., & Marshall, J. et al. (2011). Antibiotic
Therapy in Inflammatory Bowel Disease: A Systematic Review and Meta-Analysis. Am J
Gastroenterol, 106(4), 661-673. http://dx.doi.org/10.1038/ajg.2011.72
Kim, D., Kim, K., Song, M., Seo, S., Kim, S., & Yang, B. et al. (2012). Delivery of IL-12p40
ameliorates DSS-induced colitis by suppressing IL-17A expression and inflammation in
the intestinal mucosa. Clinical Immunology, 144(3), 190-199.
http://dx.doi.org/10.1016/j.clim.2012.06.009
KITAJIMA, S., MORIMOTO, M., SAGARA, E., SHIMIZU, C., & IKEDA, Y. (2001).
Dextran Sodium Sulfate-Induced Colitis in Germ-Free IQI/Jic Mice. Exp. Anim., 50(5),
387-395. http://dx.doi.org/10.1538/expanim.50.387
Komatsu, N., Okamoto, K., Sawa, S., Nakashima, T., Oh-hora, M., & Kodama, T. et al.
(2013). Pathogenic conversion of Foxp3+ T cells into TH17 cells in autoimmune
arthritis. Nature Medicine, 20(1), 62-68. http://dx.doi.org/10.1038/nm.3432
Kostic, A., Xavier, R., & Gevers, D. (2014). The Microbiome in Inflammatory Bowel Disease:
Current Status and the Future Ahead. Gastroenterology, 146(6), 1489-1499.
http://dx.doi.org/10.1053/j.gastro.2014.02.009
Kryczek, I., Wei, S., Gong, W., Shu, X., Szeliga, W., & Vatan, L. et al. (2008). Cutting Edge:
IFN-Â Enables APC to Promote Memory Th17 and Abate Th1 Cell Development. The
Journal Of Immunology, 181(9), 5842-5846.
http://dx.doi.org/10.4049/jimmunol.181.9.5842
KUCHARZIK, T., LUGERING, N., WEIGELT, H., ADOLF, M., DOMSCHKE, W., &
STOLL, R. (1996). Immunoregulatory properties of IL-13 in patients with inflammatory
bowel disease; comparison with IL-4 and IL-10. Clinical And Experimental Immunology,
104(3), 483-490. http://dx.doi.org/10.1046/j.1365-2249.1996.39750.x

80
Kucharzik, T., Maaser, C., Lügering, A., Kagnoff, M., Mayer, L., Targan, S., & Domschke,
W. (2006). Recent understanding of IBD pathogenesis: Implications for future therapies.
Inflammatory Bowel Diseases, 12(11), 1068-1083.
http://dx.doi.org/10.1097/01.mib.0000235827.21778.d5
Langrish, C., McKenzie, B., Wilson, N., de Waal Malefyt, R., Kastelein, R., & Cua, D. (2004).
IL-12 and IL-23: master regulators of innate and adaptive immunity. Immunol Rev,
202(1), 96-105. http://dx.doi.org/10.1111/j.0105-2896.2004.00214.x
Lee, L., Sanderson, J., & Irving, P. (2012). Anti-infliximab antibodies in inflammatory bowel
disease. European Journal Of Gastroenterology & Hepatology, 24(9), 1078-1085.
http://dx.doi.org/10.1097/meg.0b013e32835558cf
Letterio, J. & Roberts, A. (1998). REGULATION OF IMMUNE RESPONSES BY TGF-β*.
Annual Review Of Immunology, 16(1), 137-161.
http://dx.doi.org/10.1146/annurev.immunol.16.1.137
Lewis, K. & McKay, D. (2009). Metabolic Stress Evokes Decreases in Epithelial Barrier
Function. Annals Of The New York Academy Of Sciences, 1165(1), 327-337.
http://dx.doi.org/10.1111/j.1749-6632.2009.04036.x
Lewis, K., Lutgendorff, F., Phan, V., Söderholm, J., Sherman, P., & McKay, D. (2010).
Enhanced translocation of bacteria across metabolically stressed epithelia is reduced by
butyrate†. Inflammatory Bowel Diseases, 16(7), 1138-1148.
http://dx.doi.org/10.1002/ibd.21177
Li, C., Hossieny, P., Wu, B., Qawasmeh, A., Beck, K., & Stocker, R. (2007). Pharmacologic
Induction of Heme Oxygenase-1. Antioxidants & Redox Signaling, 9(12), 2227-2240.
http://dx.doi.org/10.1089/ars.2007.1783
Liu, H., Hu, B., Xu, D., & Liew, F. (2003). CD4+CD25+ Regulatory T Cells Cure Murine
Colitis: The Role of IL-10, TGF-Â , and CTLA4. The Journal Of Immunology, 171(10),
5012-5017. http://dx.doi.org/10.4049/jimmunol.171.10.5012

81
Liu, Z., Li, N., & Neu, J. (2005). Tight junctions, leaky intestines, and pediatric diseases. Acta
Paediatrica, 94(4), 386-393. http://dx.doi.org/10.1111/j.1651-2227.2005.tb01904.x
Low, D. (2013). DNA methylation in inflammatory bowel disease and beyond. World Journal
Of Gastroenterology, 19(32), 5238. http://dx.doi.org/10.3748/wjg.v19.i32.5238
Luger, D., Silver, P., Tang, J., Cua, D., Chen, Z., & Iwakura, Y. et al. (2008). Either a Th17 or
a Th1 effector response can drive autoimmunity: conditions of disease induction affect
dominant effector category. The Journal Of Experimental Medicine, 205(4), 799-810.
http://dx.doi.org/10.1084/jem.20071258
Lyng, G., Stevens, C., Gordon, G., Watkins, B., & Sonis, S. (2008). S1750 Rodent Video
Endoscopy and Biopsy: A New Method for the Development of Novel Inflammatory
Bowel Disease Therapies. Gastroenterology, 134(4), A-262.
http://dx.doi.org/10.1016/s0016-5085(08)61220-2
Mangan, P., Harrington, L., O'Quinn, D., Helms, W., Bullard, D., & Elson, C. et al. (2006).
Transforming growth factor-β induces development of the TH17 lineage. Nature,
441(7090), 231-234. http://dx.doi.org/10.1038/nature04754
Marie, J., Letterio, J., Gavin, M., & Rudensky, A. (2005). TGF-β1 maintains suppressor
function and Foxp3 expression in CD4 + CD25 + regulatory T cells. The Journal Of
Experimental Medicine, 201(7), 1061-1067. http://dx.doi.org/10.1084/jem.20042276
Marjoram, L., Alvers, A., Deerhake, M., Bagwell, J., Mankiewicz, J., & Cocchiaro, J. et al.
(2015). Epigenetic control of intestinal barrier function and inflammation in zebrafish.
Proceedings Of The National Academy Of Sciences, 112(9), 2770-2775.
http://dx.doi.org/10.1073/pnas.1424089112
Marlow, G. (2013). Why interleukin-10 supplementation does not work in Crohn’s disease
patients. World Journal Of Gastroenterology, 19(25), 3931.
http://dx.doi.org/10.3748/wjg.v19.i25.3931
Maynard, C., Harrington, L., Janowski, K., Oliver, J., Zindl, C., Rudensky, A., & Weaver, C.
(2007). Regulatory T cells expressing interleukin 10 develop from Foxp3+ and Foxp3−
precursor cells in the absence of interleukin 10. Nature Immunology, 8(9), 931-941.
http://dx.doi.org/10.1038/ni1504

82
Molodecky, N., Soon, I., Rabi, D., Ghali, W., Ferris, M., & Chernoff, G. et al. (2012).
Increasing Incidence and Prevalence of the Inflammatory Bowel Diseases With Time,
Based on Systematic Review. Gastroenterology, 142(1), 46-54.e42.
http://dx.doi.org/10.1053/j.gastro.2011.10.001
Naito, Y., Takagi, T., & Yoshikawa, T. (2004). Heme oxygenase-1: a new therapeutic target
for inflammatory bowel disease. Alimentary Pharmacology And Therapeutics, 20(s1),
177-184. http://dx.doi.org/10.1111/j.1365-2036.2004.01992.x
Nanda, K., Cheifetz, A., & Moss, A. (2012). Impact of Antibodies to Infliximab on Clinical
Outcomes and Serum Infliximab Levels in Patients With Inflammatory Bowel Disease
(IBD): A Meta-Analysis. Am J Gastroenterol, 108(1), 40-47.
http://dx.doi.org/10.1038/ajg.2012.363
Obata, Y., Furusawa, Y., Endo, T., Sharif, J., Takahashi, D., & Atarashi, K. et al. (2014). The
epigenetic regulator Uhrf1 facilitates the proliferation and maturation of colonic
regulatory T cells. Nature Immunology, 15(6), 571-579. http://dx.doi.org/10.1038/ni.2886
Omenetti, S. & Pizarro, T. (2015). The Treg/Th17 Axis: A Dynamic Balance Regulated by the
Gut Microbiome. Front. Immunol., 6. http://dx.doi.org/10.3389/fimmu.2015.00639
Onyiah, J., Sheikh, S., Maharshak, N., Steinbach, E., Russo, S., & Kobayashi, T. et al. (2013).
Carbon Monoxide and Heme Oxygenase-1 Prevent Intestinal Inflammation in Mice by
Promoting Bacterial Clearance. Gastroenterology, 144(4), 789-798.
http://dx.doi.org/10.1053/j.gastro.2012.12.025
Ostanin, D., Bao, J., Koboziev, I., Gray, L., Robinson-Jackson, S., & Kosloski-Davidson, M.
et al. (2008). T cell transfer model of chronic colitis: concepts, considerations, and tricks
of the trade. AJP: Gastrointestinal And Liver Physiology, 296(2), G135-G146.
http://dx.doi.org/10.1152/ajpgi.90462.2008
Oz, H., Chen, T., McClain, C., & de Villiers, W. (2005). Antioxidants as novel therapy in a
murine model of colitis. The Journal Of Nutritional Biochemistry, 16(5), 297-304.
http://dx.doi.org/10.1016/j.jnutbio.2004.09.007

83
Panahian, N., Yoshiura, M., & Maines, M. (2008). Overexpression of Heme Oxygenase-1 Is
Neuroprotective in a Model of Permanent Middle Cerebral Artery Occlusion in
Transgenic Mice. Journal Of Neurochemistry, 72(3), 1187-1203.
http://dx.doi.org/10.1111/j.1471-4159.1999.721187.x
Park, K. & Bass, D. (2011). Inflammatory bowel disease-attributable costs and cost-effective
strategies in the United States. Inflammatory Bowel Diseases, 17(7), 1603-1609.
http://dx.doi.org/10.1002/ibd.21488
Pociask, D. & Kolls, J. (2010). Integral role of integrins in Th17 development. Journal Of
Clinical Investigation, 120(12), 4185-4187. http://dx.doi.org/10.1172/jci45450
Qin, H., Wang, L., Feng, T., Elson, C., Niyongere, S., & Lee, S. et al. (2009). TGF-
 Promotes Th17 Cell Development through Inhibition of SOCS3. The Journal Of
Immunology, 183(1), 97-105. http://dx.doi.org/10.4049/jimmunol.0801986
Resta-Lenert, S. & Barrett, K. (2006). Probiotics and Commensals Reverse TNF-α and IFN-γ
Induced Dysfunction in Human Intestinal Epithelial Cells. Gastroenterology, 130(3),
731-746. http://dx.doi.org/10.1053/j.gastro.2005.12.015
Rezaie, A., Parker, R., & Abdollahi, M. (2007). Oxidative Stress and Pathogenesis of
Inflammatory Bowel Disease: An Epiphenomenon or the Cause?. Dig Dis Sci, 52(9),
2015-2021. http://dx.doi.org/10.1007/s10620-006-9622-2
Rotmagnani, S. (1998). The Th1/Th2 paradigm and allergic disorders. Allergy, 53, 12-15.
http://dx.doi.org/10.1111/j.1398-9995.1998.tb04951.x
Rutgeerts, P., van Assche, G., & Vermeire, S. (2004). Optimizing anti-TNF treatment in
inflammatory bowel disease. Gastroenterology, 126(6), 1593-1610.
http://dx.doi.org/10.1053/j.gastro.2004.02.070
Sakaguchi, S., Wing, K., Onishi, Y., Prieto-Martin, P., & Yamaguchi, T. (2009). Regulatory T
cells: how do they suppress immune responses?. International Immunology, 21(10),
1105-1111. http://dx.doi.org/10.1093/intimm/dxp095

84
Sandborn, W., Rutgeerts, P., Feagan, B., Reinisch, W., Olson, A., & Johanns, J. et al. (2009).
Colectomy Rate Comparison After Treatment of Ulcerative Colitis With Placebo or
Infliximab. Gastroenterology, 137(4), 1250-1260.
http://dx.doi.org/10.1053/j.gastro.2009.06.061
Schimpl, A., Berberich, I., Kneitz, B., Krämer, S., Santner-Nanan, B., & Wagner, S. et al.
(2002). IL-2 and autoimmune disease. Cytokine & Growth Factor Reviews, 13(4-5), 369-
378. http://dx.doi.org/10.1016/s1359-6101(02)00022-9
Shih, D. & Targan, S. (2009). Insights into IBD pathogenesis. Current Gastroenterology
Reports, 11(6), 473-480. http://dx.doi.org/10.1007/s11894-009-0072-9
Shinkai, Y. (1992). RAG-2-deficient mice lack mature lymphocytes owing to inability to
initiate V(D)J rearrangement. Cell, 68(5), 855-867. http://dx.doi.org/10.1016/0092-
8674(92)90029-c
Shouval, D., Griffith, A., Bousvaros, A., Weiss, B., Somech, R., & Loizides, A. et al. (2015).
Mo1210 Loss of IL-10 Receptor Signaling in Patients With Infantile IBD Results in
Aberrant Th17 Responses and Enhanced T-Cell Proliferation. Gastroenterology, 148(4),
S-639. http://dx.doi.org/10.1016/s0016-5085(15)32155-7
Targownik, L. & Bernstein, C. (2013). Infectious and Malignant Complications of TNF
Inhibitor Therapy in IBD. Am J Gastroenterol, 108(12), 1835-1842.
http://dx.doi.org/10.1038/ajg.2013.294
Teng, M., Bowman, E., McElwee, J., Smyth, M., Casanova, J., Cooper, A., & Cua, D. (2015).
IL-12 and IL-23 cytokines: from discovery to targeted therapies for immune-mediated
inflammatory diseases. Nature Medicine, 21(7), 719-729.
http://dx.doi.org/10.1038/nm.3895
Travassos, W. & Cheifetz, A. (2005). Infliximab: Use in inflammatory bowel disease. Curr
Treat Options Gastro, 8(3), 187-196. http://dx.doi.org/10.1007/s11938-005-0011-2
Travis, S. (2006). European evidence based consensus on the diagnosis and management of
Crohn's disease: current management. Gut, 55(suppl_1), i16-i35.
http://dx.doi.org/10.1136/gut.2005.081950b

85
Ueno, A., Jijon, H., Chan, R., Ford, K., Hirota, C., & Kaplan, G. et al. (2013). Increased
Prevalence of Circulating Novel IL-17 Secreting Foxp3 Expressing CD4+ T Cells and
Defective Suppressive Function of Circulating Foxp3+ Regulatory Cells Support
Plasticity Between Th17 and Regulatory T Cells in Inflammatory Bowel Disease
Patients. Inflammatory Bowel Diseases, 19(12), 2522-2534.
http://dx.doi.org/10.1097/mib.0b013e3182a85709
Weaver, C., Harrington, L., Mangan, P., Gavrieli, M., & Murphy, K. (2006). Th17: An
Effector CD4 T Cell Lineage with Regulatory T Cell Ties. Immunity, 24(6), 677-688.
http://dx.doi.org/10.1016/j.immuni.2006.06.002
Wirtz, S., Neufert, C., Weigmann, B., & Neurath, M. (2007). Chemically induced mouse
models of intestinal inflammation. Nat Protoc, 2(3), 541-546.
http://dx.doi.org/10.1038/nprot.2007.41
Wynn, T. (2003). IL-13 E FFECTOR F UNCTIONS *. Annual Review Of Immunology, 21(1),
425-456. http://dx.doi.org/10.1146/annurev.immunol.21.120601.141142
Xavier, R. & Podolsky, D. (2007). Unravelling the pathogenesis of inflammatory bowel
disease. Nature, 448(7152), 427-434. http://dx.doi.org/10.1038/nature06005
Zhang, F., Fuss, I., Yang, Z., & Strober, W. (2013). Transcription of RORγt in developing
Th17 cells is regulated by E-proteins. Mucosal Immunol, 7(3), 521-532.
http://dx.doi.org/10.1038/mi.2013.69
Zhang, L., Zhang, Y., Zhong, W., Di, C., Lin, X., & Xia, Z. (2014). Heme Oxygenase-1
Ameliorates Dextran Sulfate Sodium-induced Acute Murine Colitis by Regulating
Th17/Treg Cell Balance. Journal Of Biological Chemistry, 289(39), 26847-26858.
http://dx.doi.org/10.1074/jbc.m114.590554
Zhu, J., Yamane, H., & Paul, W. (2010). Differentiation of Effector CD4 T Cell Populations *.
Annual Review Of Immunology, 28(1), 445-489. http://dx.doi.org/10.1146/annurev-
immunol-030409-101212
Ziegler, S. & Buckner, J. (2009). FOXP3 and the regulation of Treg/Th17 differentiation.
Microbes And Infection, 11(5), 594-598. http://dx.doi.org/10.1016/j.micinf.2009.04.002