searching for google’s value: using prediction markets to ... · using prediction markets to...
TRANSCRIPT
Searching for Google’s Value:
Using Prediction Markets to Forecast Market Capitalization Prior to an Initial Public Offering
by
Joyce E. Berg
George R. Neumann
Thomas A. Rietz*
December 2005
Abstract
IPO underpricing is endemic. Many theories have been developed to explain it. To inform theory and to investigate the practical application of prediction markets in an IPO setting, we conducted markets designed to forecast post-IPO valuations before a particularly unique IPO: Google. The combination of results from these markets and the unique features of the IPO help us distinguish between underpricing theories. The evidence leans against theories which require large payments to buyers to overcome problems of asymmetric information between issuers and buyers. It is most consistent with theories where underpricing is in exchange for future benefits. The prediction market results also show that it is possible to forecast post-IPO market values and, therefore, avoid losses associated with underpricing when a firm wishes to do so. JEL Classification Codes: C53, C93, G10, G14, G24, G32
Keywords: Initial public offering, underpricing, asymmetric information, prediction markets
* Berg: Department of Accounting; Neumann: Department of Economics; and Rietz: Department of Finance; Tippie
College of Business, University of Iowa, Iowa City, Iowa 52242-1994. IEM Price data used in this paper are available at http://www.biz.uiowa.edu/iem/. We thank Thomas George, Bruce Johnson, Thomas Noe participants at the University of Iowa Accounting and Finance Department workshops, and the members of the IEM project team, especially Forrest D. Nelson, for their many insightful comments and suggestions.
Corresponding Author: Thomas A. Rietz Phone: 319-335-0856 Department of Finance Fax: 319-335-3690 University of Iowa e-mail: [email protected] Iowa City, Iowa 52246

Searching for Google’s Value:
Using Prediction Markets to Forecast Market Capitalization Prior to an Initial Public Offering
December 2005
Abstract
IPO underpricing is endemic. Many theories have been developed to explain it. To inform theory and to investigate the practical application of prediction markets in an IPO setting, we conducted markets designed to forecast post-IPO valuations before a particularly unique IPO: Google. The combination of results from these markets and the unique features of the IPO help us distinguish between underpricing theories. The evidence leans against theories which require large payments to buyers to overcome problems of asymmetric information between issuers and buyers. It is most consistent with theories where underpricing is in exchange for future benefits. The prediction market results also show that it is possible to forecast post-IPO market values and, therefore, avoid losses associated with underpricing when a firm wishes to do so. JEL Classification Codes: C53, C93, G10, G14, G24, G32
Keywords: Initial public offering, underpricing, asymmetric information, prediction markets
Searching for Google’s Value:
Using Prediction Markets to Forecast Market Capitalization Prior to an Initial Public Offering
1. Introduction
Underpricing of initial public offerings (IPOs) is a well-documented phenomenon. Jenkinson and
Ljunqvist (2001, p.27) report average underpricing of 15.3% for U.S. IPOs.1 Smart and Zutter (2003),
restricting their examination to IPOs between 1990 and 1998 for companies with dual-class shares, find a
similar, though slightly lower, rate (11.9% on average). Causes of underpricing have been modeled in a
variety of ways. Some examples include underpricing resulting from (1) information asymmetries across
investors (e.g., Rock, 1986), (2) information asymmetries between issuers and investors that are overcome
with large payments to investors (e.g., Chemmanur, 1993, Benveniste and Spindt, 1989, and Sherman and
Titman, 2002), (3) future benefits to underpricing (in particular, Welch, 1989, discusses underpricing to
drive out bad firms and, as a result, attain benefits in future secondary offerings; Booth and Chua, 1996,
discuss future benefits arising from ownership dispersion; and Tinic, 1988, and Hughes and Thakor,
1992, discuss future benefits in the form of reduced potential future legal liabilities).2
Our study provides new evidence about IPO underpricing. We use small-scale, real-money
markets designed to predict Google’s post-IPO capitalization. These IPO prediction markets are valuable
for two reasons. First, IPO prediction markets can inform theory. In the case of Google, the combination
of the prediction market and Google’s unique auction mechanism provide particularly compelling
evidence on theory. Second, IPO prediction markets can have a practical application in setting optimal
IPO prices.
1 Similar underpricing is found in Ritter and Welch (2002), who document an average 18.8% first day return (15.8%
underpricing) in a sample of 6,249 U.S. firms between 1980 and 2001. Loughran and Ritter (2004) document that underpricing appears to change over time with average underpricing of 7% in the 1980s, 15% in the period 1990-1998, 65% in 1999-2000 (the Internet bubble), and 12% in 2001-2003.
2 We note that there are other types of theories. For example, Loughran and Ritter (2002) discuss a role for prospect theory and Khanna, Noe, and Sonti (2005) discuss the role of labor market shortages for investment bankers. We do not discuss these models because our evidence does not address them.
2

Because traders reveal their information in a prediction market, the prediction market alone
provides evidence on IPO underpricing theories that rely on assumptions about the distribution of
information before an IPO. Our evidence suggests that traders were able to estimate accurately the post
IPO value of Google. Further, they revealed this information for very little payment. In addition, we
show that the correlation between ex ante forecasts of underpricing and the implied degree of uncertainty
in traders’ forecasts runs counter to models based on asymmetric information across traders. Because this
evidence does not depend on Google’s unique IPO auction mechanism in any way, we argue that this is
general evidence against three types of asymmetric information based theories: (1) theories that rely on
outsiders being relatively uninformed, (2) theories that rely on outsiders being relatively informed and
revealing that information only in exchange for large payments and (3) theories that rely on significant
winner’s curse problems.
Google’s IPO provides a particularly constructive setting for prediction markets because of its
unique features. Google’s specific and clearly stated goal was to avoid IPO underpricing. To achieve this
goal, they used an auction mechanism for gathering information, setting prices and allocating shares.
Thus, the IPO price provides a natural benchmark for evaluating the accuracy of prediction markets and
their potential usefulness in aggregating information in an IPO setting. But, more importantly, the
auction mechanism provides unique evidence on theory. First, evidence from the auction outcome allows
us to make inferences about Google’s pre-IPO information. The evidence suggests that Google also knew
the degree of underpricing that would result from the price they set. Combined with the prediction market
evidence, we think it makes a compelling case against asymmetric information based theories of IPO
underpricing in the specific case of Google. Second, Google’s auction mechanism gives two additional
pieces of evidence relevant to theory: (1) the auction severely restricted the investment bankers’
discretion in issuing shares and (2) the auction did not allow Google to pre-commit to underpricing.
Because of this design, the underpricing that occurred in Google’s case cannot be explained by models
that rely on either of these features.
3

IPO prediction markets can have a significant practical application as well. If they are accurate
and obvious strategic manipulation problems can be addressed, companies can use the forecasts to set IPO
prices that either (1) avoid underpricing when it is optimal to do so or (2) know in advance and set
optimally the degree of underpricing when it is optimal to underprice (say, in exchange for future
benefits). The overall impact could be substantial. For example, Google’s underpricing left more than
$300 million on the table.3 Prediction markets can help eliminate the underpricing or determine whether
it is the optimal amount.
Our results complement recent research on when-issued trading in German IPOs. Löffler,
Panther and Theissen (2002) and Aussenegg, Pichler and Stomper (2004) both show that when-issued
trading on German IPOs helps forecast post-IPO trading prices.4 From one perspective, our prediction
market evidence is similar: through a market mechanism traders reveal information in advance of the IPO
that forecasts post IPO prices. However, our research differs from the when-issued research in a variety
of important ways. First, our markets provided valuation forecasts before the initial price ranges were set.
German when-issued market runs only after initial price ranges are set, typically one week before the
issue. Löffler, Panther and Theissen (2002, p. 10) report that “pre-IPO prices appear to be unbiased
estimates of the first price established on the exchange only in the second half of the subscription period”
(that is, the last few days). This is important because it severely limits the usefulness of the when-issued
market in setting IPO prices. German IPO price ranges are never adjusted; IPO prices never exceed the
top of the range, prices seldom fall below the bottom and more than half of the IPOs are set at the top of
the range (Aussenegg, Pichler and Stomper, 2004). Thus, the relevant pricing information needs to be
gathered before when-issued trading commences. In contrast, our markets ran for six weeks before the
IPO and two and a half weeks before any initial price ranges or issue quantities were announced. We find
that our market prices were surprisingly accurate even before initial price ranges were set. Second, our
3 This statistic comes from Table II, discussed later in the text. 4 Löffler, Panther and Theissen (2002) find that when-issued prices are “highly informative” and Aussenegg, Pichler
and Stomper (2004) find that when-issued prices are indicative but do not “fully supplant information gathering through book building.”
4
market design allows us to build a forecast distribution of post-IPO prices, not just point estimates of the
expected post-IPO price. As a result, our markets show both the amount of uncertainty surrounding the
future post-IPO market price and the degree to which this uncertainty is resolved as the IPO process
evolves. This is an important contribution that is left unaddressed by the when-issued research. Third,
since our results are on the Google IPO with its unique auction design, we provide additional evidence on
what models are likely to explain underpricing.5
The rest of the paper is organized as follows. In Section 2, we outline the history and unique
features of the Google IPO. In Section 3, we describe the prediction markets we conducted to predict the
post-IPO Google value. In Section 4, we present our results and we conclude in Section 5.
2. The Google IPO
A. Overview
The Google initial public offering (IPO) was closely watched and unique. A search of
Lexis/Nexis for the words “Google” with “IPO” or “initial public offering” within 25 words, yields 769
hits between October 24, 2003 (when the potential for an IPO was first mentioned in the Wall Street
Journal) and August 19, 2004 (when trading in the stock began). Google’s use of an auction mechanism
to help set the IPO price is uncommon in the U.S., especially for an IPO of Google’s size. The stated goal
was to set an IPO price close to the ensuing market price. While there is debate over whether auction
mechanisms mitigate underpricing (see Sherman, 2004, for example), evidence from the French stock
market (Derrien and Womack, 2003) suggests an auction mechanism could have helped Google achieve
its goal. However, Google’s IPO price fell short of both its opening and its closing market prices on the
first day of trading by just over 15%, an amount close to the average initial underpricing of 15.3% for
U.S. IPOs reported by Jenkinson and Ljungqvist (2001, p. 27) and somewhat higher than the 11.9%
5 There are several other smaller distinctions as well. For example, we incorporate a variety of prediction market
design features that encourage accurate price forecasts. The small size of our markets and evidence from other IEM markets lead us to believe that hedging and strategic manipulation are unlikely to bias prices in our prediction markets. Short selling is limited in when-issued markets. In prediction markets, synthetic short selling is constrained only by the budgets of traders.
5
average underpricing reported by Smart and Zutter (2003) for IPOs of companies with dual-class shares
(like Google) between 1990 and 1998.
B. Timeline of Events
Google’s potential IPO was first reported by the Wall Street Journal on October 24, 2003. The
Journal reported that Google had contacted an investment banker and that an IPO was under
consideration for 2004. Speculation about the IPO continued until the initial filing with the SEC on April
29, 2004 (SEC file number 333-114984). Google filed nine amended prospectuses. Its final prospectus
was approved on August 18, 2004 and officially filed the next day. Table I lists the filing dates and
summarizes major changes included in each amendment.
The initial filing contained little information about quantities of shares.6 There was no initial
price range and there was no target IPO date. The fourth amended filing on July 26 supplied projected
share quantities, the initial price range ($108 to $135) and an August target IPO date. Issue quantities
were revised in Amendment 5 on August 9 and in Amendment 9 on August 18. Amendment 9 also
adjusted the initial price range down to $85-$95. The final prospectus, declared effective on August 18
and filed on August 19, set the IPO price at $85. On August, 19, Google’s stock opened at $100.00 and
closed at $100.34. On August 21, the San Francisco Chronicle reported that the underwriters had
exercised the full over-allotment option to purchase 2.94 million more shares.7 Google stock closed at
$108.31 on August 20, even with this exercise.
6 Missing were the total quantity of shares expected after the offering, the number sold to the public by the company,
the number sold by existing shareholders, the size of the over-allotment option and the numbers of shares subject to various lock up rules. While the joint issue of new shares and sales by existing shareholders may seem unusual, Jenkinson and Ljungqvist (2001, p. 3) point out that “many” IPOs share this feature.
7 According to prospectus rules, these shares could be purchased by the investment bankers from pre-IPO shareholders (at a net price of $82.6161) only to cover shorts created in the IPO (sold to the public at $85).
6
C. Unique Features and Stated Goals of the Google IPO
Instead of using the usual bookmaking process to determine the IPO price, Google used an
auction process.8 The auction mechanism was similar to a second price auction: there would be a single
market price with all bids above that price receiving shares at that price. However, unlike a second price
auction, Google reserved the right to set the IPO price below the market clearing price,9 creating excess
demand. In such a case, bid quantities would be used to determine actual shares allocated to successful
bidders using one of two pre-specified apportionment rules. This effectively limited discretion in the
allocation of shares. The Google IPO auction opened on August 13, 2004 and closed on August 18.
While IPO auctions have been common in other countries10 and the potential of using the Internet
to dis-intermediate U.S. IPOs has been discussed (e.g., Jenkinson and Ljungqvist, 2001, p. 9), the use of
an auction mechanism for an IPO of this size in the United States is novel. The major features of this
process were outlined in the initial filing on April 29 and refined throughout the amended filings. The
stated goal of the auction process was to set “an initial public offering price that results in the trading
price for our Class A common stock not moving significantly up or down relative to the market in the
days following our offering” (page 28 of the initial S-1 filing); “to have a share price that reflects a fair
market valuation of Google” (page v of the initial S-1 filing); and to avoid “boom-bust cycles” (page v of
the initial S-1 filing).11 Thus, the goal was to set the IPO price near the actual market price in the days
following the IPO, avoiding the typical underpricing that characterizes most IPOs. This would be
beneficial for Google. The typical 15% underpricing of IPOs in the United States and other developed
countries leaves a great deal of money on the table. If companies could set IPO prices closer to eventual
8 Interested readers can obtain details of the Google auction process from the prospectus available at the SEC
through EDGAR (http://www.sec.gov/edgar.shtml) by searching for file number 333-114984. 9 We note that Google defines market clearing as the bid price at which all shares, including the over allotment
option, are sold. We will use the same definition. When we estimate the demand curve below, we are consistent with this.
10 According to Jenkinson and Ljungqvist (2001) they have been common in Israel, England (in the 1980’s), and Japan (in the 1990’s). France uses a mixture of auctions and bookmaking. Sherman (2004) notes that IPO auctions have been tried in many countries, but have been abandoned in most.
11 To further emphasize this objective , the prospectus and amendments also state “Our goal is to have an efficient market price—a rational price set by informed buyers and sellers—for our shares at the IPO and afterward. Our goal is to achieve a relatively stable price in the days following the IPO” (on page v of the initial S-1 filing).
7

market prices, they would raise substantially more money and/or incur substantially less dilution on
average. Given Google’s stated goals, their IPO provides a natural benchmark for the performance of our
prediction markets: we can compare the difference between Google’s IPO valuation and the post-IPO
market valuation to the difference between the prediction market forecast and the post-IPO market
valuation.
Though Google’s auction process was used to gauge interest from potential shareholders and,
with sufficient confirmation, used to generate binding orders for shares, it was not, strictly speaking, a
direct auction of shares. For example, Google and its underwriters retained the right to reject bids they
found manipulative or disruptive at their sole discretion without notifying bidders who submitted these
bids. Moreover, the prospectus clearly states that the IPO price need not be the auction clearing price.
Page 38 of the amended S-1 filing on August 13, 2004 (the day the auction began) states (emphasis
added):
The initial public offering price will be determined by us and our underwriters after the auction closes. We intend to use the auction clearing price to determine the initial public offering price and, therefore, to set an initial public offering price that is equal to the clearing price. However, we and our underwriters have discretion to set the initial public offering price below the auction clearing price. As a result, the IPO price could fall below the actual auction market clearing price. This
possibility required a potential allocation mechanism in which bidders would not receive the full number
of shares for which they bid. Two allocation mechanisms were described in the prospectus, with the
decision about which would be used left to management discretion. Because the auction order book and
clearing prices have not been made public (in accordance with prospectus rules), we do not know
precisely how much “discretion” was exercised and how far the IPO price was set below the auction
market clearing price. Nor do we know exactly how close the auction market clearing price may have
been to eventual trading prices. 12 However, we can estimate Google’s demand curve using information
12 We note that another possible reason for using the auction mechanism is to decrease underwriting fees.
According to Google’s final prospectus, underwriting discounts and commissions accounted for $2.3839 of the $85 offer price. Thus, fees were 2.8% of the offer price. Only one IPO in Chen and Ritter’s (2000) data set on fees in IPOs approaches Google’s size. The fees on this $1.3 billion IPO were 2.97%. The next two largest
8
from Google’s prospectus and information released by investors after the IPO. This will provide evidence
about whether the prices in our prediction market could have been market clearing IPO prices for Google.
3. The Iowa Electronic Markets Google IPO Markets
Though other markets have a predictive component (e.g., futures markets), prediction markets
are designed specifically for forecasting purposes. Contracts in prediction markets have payoffs tied
directly to a future event of interest (in this paper, Google’s eventual market capitalization) and the
markets have design features that encourage revelation of true underlying expectations. Prices in
prediction markets provide forecasts about features of the associated event, for example its probability of
occurring or the consequences of its occurrence. The most well-known prediction markets are the Iowa
Electronic Markets (IEM for short, reviewed in Berg, Forsythe, Nelson and Rietz, 2003), which have been
used for more than 17 years to forecast election outcomes, other political and economic events, prices and
returns of stocks, corporate earnings and movie box office receipts. These real-money, small-scale
markets have proven remarkably accurate in the short run (Berg, Forsythe, Nelson and Rietz, 2003) and
the long run (Berg, Nelson and Rietz, 2003).
A. Description of the Google IPO Markets
The IEM conducted two markets associated with the Google IPO. Both markets traded contracts
with liquidation values based on the total market capitalization implied by the closing price of Google
stock at the end of the first day of trading. Contracts were based on total market capitalization rather than
share price so that the markets could open before initial price ranges and share quantities were announced.
IPOs had fees of 4%. So, while fees for smaller IPOs typically average 7%, the fee here seems in line after considering IPO size. The auction may have allowed Google to more accurately assess demand and avoid the costs associated with over-allotment options. However, Google’s over-allotment option was exactly 15%, the “typical” amount in the U.S. according to Brealey and Myers (2003, p. 413).
9

The market structure was the same as other IEM markets. Since descriptions of IEM markets are
available elsewhere, our description here will be brief.13
In IEM markets, traders invest their own money (initial investments can range from $5 to $500)
and reap the real money benefits or pay the real money costs associated with their trading activities and
contract holdings at liquidations.14 Each market is organized as a continuous, electronic, multiple-unit,
double auction. Traders can place limit orders (acting as endogenous market makers) or market orders at
any time.15 Bids and asks are kept in queues ordered by price and time. Traders set their own bid and ask
expiration dates and withdraw any bids or asks that have not yet traded. Traders buy or sell risk-free sets
of contracts (one of each contract in the market at a fixed price of $1, called “fixed price bundles”) from
or to the exchange at any time. They can trade individual contracts purchased as parts of bundles. And,
they can trade bundles at market prices (selling at the sum of the best bid prices or buying at the sum of
the best ask prices). At all times traders see the best available bids and asks for all contracts, and they can
retrieve histories of daily trading summaries (daily high, low, last, and average trade prices as well as
volumes in both units and dollars).
The IEM Google contracts expired after the first day of trading following the Google IPO.
Contract liquidation values were tied to Google’s market capitalization at the end of the first day of
trading in its public shares. As a result, we can build forecasts of Google’s capitalization using IEM
market prices. We use these forecasts, the quantity of stock issued, the IPO price of Google and the first-
day closing price of Google to:
(1) judge whether the forecasted market capitalization was close to the actual capitalization; (2) determine whether the forecasted market capitalization was closer to the actual capitalization
than that implied by the IPO price;
13 See Forsythe, Nelson, Neumann and Wright (1992), Berg, Forsythe and Rietz (1997) and Forsythe, Rietz and
Ross (1999). 14 This differs from traditional experimental markets in which the experimenter funds the subjects for money used in
the experiment and other experimental prediction markets in which no real money is used at all. 15 The Google markets were open to all traders, not just academic traders. Any person, worldwide, could become a
trader by sending an investment to the IEM.
10

(3) determine the impact of announcements or news on the forecasted capitalization during the course of the prediction market;
(4) learn about how and when the price formation process aggregated information for these
markets; and (5) estimate the degree of ex ante uncertainty about the post-IPO market price and show how it
varied through time and surrounding events.
In addition, the combination of the two markets we conducted allows us to generate two different
forecasts for Google’s market capitalization, compare them and analyze whether contract structure
matters for prediction markets.
i. The Google Linear Market
The Google Linear market opened on June 29, 2004 with two contracts.16 Contract liquidation
values were determined as follows:
Contract Contract Liquidation Values IPO_UP = $0 if the IPO does not take place by March 31, 2005;
= (Market Cap.)/$100 billion if $0 bil. < Market Cap. <= $100 bil; = $1 if Market Cap. > $100 bil.
IPO_DN = $1 if the IPO does not take place by March 31, 2005; = ($100 bil.-Market Cap.)/$100 billion if $0 bil. < Market Cap. <= $100 bil; = $0 if Market Cap. > $100 bil.
In the absence of hedging demand, prices should equal expected values in this market.17 Thus, the price
of IPO_UP times $100 billion is the IEM’s forecast of the market capitalization of Google stock after the
16 The appendix contains the prospectus for this market. 17 This argument can be made in numerous ways. For example, modern option pricing theory implies that prices
should equal expected liquidation values according to the risk neutral distribution discounted back at the risk free rate. Risk neutral probabilities are driven away from true probabilities by imbalances in hedging demand. The small size of these markets along with evidence on behavior and prices in political markets (e.g., Forsythe, Nelson, Neumann and Wright, 1992; Forsythe, Rietz and Ross, 1999; and Oliven and Rietz, 2004) suggest that hedging demands are not significant factors in determining prices. The risk free rate in these markets is zero because contract bundles (one risk free asset) and cash (the other risk free asset) both earn a zero return and can be freely exchanged for one another. As a result of these two factors, option pricing theory implies that prices should equal actual expected liquidation values at each point in time. Similar arguments (using the absence of systematic risk factors and a zero risk free rate) can be made using CAPM, APT or general equilibrium theory to get the same result. Whether prices actually reflect expected values is an empirical matter and the evidence suggests that they do in IEM markets in general (see, for example, Berg, Forsythe, Nelson and Rietz, 2003; and Berg, Nelson and Rietz, 2003).
11
first day of trading according to the closing market price.18
ii. The Winner-Takes-All Market
The Google Winner-Takes-All (WTA) market opened on June 29, 2004 with six “interval”
contracts.19 Liquidation values of the initial contracts were determined as follows:
Contract Contract Liquidation Values IPO_0-20 $1 if market cap is less than or equal to $20 billion
or if the IPO does not occur by March 31, 2005. IPO_20-25 $1 if market cap is greater than $20 billion but less than or equal to $25 billion. IPO_25-30 $1 if market cap is greater than $25 billion but less than or equal to $30 billion IPO_30-35 $1 if market cap is greater than $30 billion but less than or equal to $35 billion IPO_35-40 $1 if market cap is greater than $35 billion but less than or equal to $40 billion IPO_gt40 $1 if market cap is greater than $40 billion.
On August 5, the IPO_gt40 contract was split into three contracts: IPO_40-45, IPO_45-50 and IPO_gt50
each with a $1 payoff in the associated capitalization range.20 At the split, traders holding IPO_gt40
contracts received 1 share of each of the three new contracts in exchange for each IPO_gt40 contract they
held so that they incurred neither a gain nor loss in expected value from their previous portfolio position.
Again, in the absence of hedging demand, prices should equal expected values in this market (see
footnote 17). Expected value pricing implies that the price of each contract should equal the probability
that the actual market capitalization will be in the associated capitalization range (E(value) =
p×$1+(1-p)×$0 = p, where p is the probability of being in the range). Thus, at each point in time prices
map out discrete parts of a forecast distribution for the future market capitalization. From this
distribution, we can estimate the expected post-IPO valuation of Google and obtain a direct measure of
the ex ante uncertainty surrounding this forecast.
18 Technically, we need two further assumptions to make this the forecasting relationship. We need to assume that
the probability of no IPO before March 2005 is zero, which is consistent with Google’s stated strong intention to issue in the summer of 2004. We also need to assume that the probability of a market capitalization greater than $100 is effectively zero. Below, we will estimate a distribution of expected market capitalizations from the other IEM market we ran. This distribution is consistent with essentially zero likelihood of a market capitalization above $100 billion.
19 The appendix contains the prospectus for this market. 20 This was done because of sustained high prices for the IPO_gt40 contract. It was intended to expand the price
ranges covered by contracts to more closely match the apparent range of potential outcomes forecast by our traders.
12

B. Fitting a Forecast Distribution with the WTA Market
The WTA markets can be used to forecast the expected distribution of future market
capitalizations, not just a point estimate for the expected capitalization. In its simplest form, the WTA
price vector is a vector of (risk-neutral) probabilities of six events (and after August 4, eight events).
Knowledge of the CDF of a random variable allows one to calculate any moments of interest. However,
because the highest interval (greater than $40 billion prior to August 4 and greater than $50 billion
afterwards) is unbounded from above, some assumption must be made about the distribution of outcomes
in this range when this contract trades above a zero price. For this reason, we assume that at any point in
time, t, the future (unknown) capitalization is distributed log normally with mean µ t and standard
deviation tσ . We further assume that the probability of no IPO equals zero.21
Intuitively, we assume that the normalized closing prices of contracts on date t reflect estimates of
the probabilities of observing outcomes in each range each day. For given tµ and tσ , integrating the
log normal distribution over each range yields predicted probabilities of being in each range. We deri
estimates of the distribution mean and standard deviation by minimizing the distance between observed
and predicted probabilities.
ve
Formally, assume there are K securities traded each day and that they have a payoff, Xi, of
Ki
ZZX iii
1,...,for otherwise 0$
(MC)tion CapitalizaMarket if 1$ 1
==
≤<= −
(1)
For concreteness assume that Z0=0 and that ZK= ∞ . The probability that market capitalization (MC) lies in
interval i is
)|()|()( 1 tititt ZFZFP θθθ −−= (2)
where F is the cumulative distribution function of the random variable MC. One of these securities is
21 The log normal distribution is uncontroversial while assuming that the probability of no IPO is zero is consistent
with Google’s stated strong intention to issue in the summer of 2004 and the long horizon on the contracts.
13
redundant because both the normalized prices and actual probabilities of being in each range always sum
to 1.
On date t, the log normal distribution parameter vector is characterized completely by the mean,
µt and the standard deviation σt (i.e., θt=(µt,σt)). Because there are K >2 securities traded, it is possible
to estimate the parameter vector tθ for each trading date, t. There are several methods that could be used
to estimate θt. We chose a minimum χ2 criterion as the method, although we also estimated the
parameters using generalized method of moments and maximum average log likelihood criteria to see
whether any significant differences existed. None were found.
Specifically, for each day, denote the objective function as ( )tV θ and solve the following for the
estimates of µt and σt:
2
,
1
( (ˆ ( )( )t
Ki t i t
t ti i t
p PArgMin V
Pθ
θθ θ
θ=
−= = ∑
)) (3)
where pi,t is the price of security i (or market based probability forecast for range i) on date t and Pi( tθ ) is
its expected value according to the estimated log normal distribution. Note that this results in both an ex
ante forecast of the post-IPO market capitalization and a direct ex ante measure of uncertainty
surrounding this forecast.
4. Results
A. Market Performance
Figure 1 shows the normalized prices of the IPO_UP contract.22 Trading in the Google Linear
market was light.23 From July 8, the first day after which all contracts had traded, through August 17, the
22 Note that the price of IPO_UP should equal 1 minus the price of the IPO_DN contract. However, due to
asynchronous trading and bid/ask bounce, prices of IPO_UP and IPO_DN do not necessarily sum to exactly $1 at any given point in time. To adjust for this, we use normalized prices. The normalized price of each contract is the price of the contract divided by the sum of contract prices. The graph starts with July 8, the first day by which all contracts had traded.
23 While these markets are thin, this does not necessarily imply an inefficient market. Prediction market research
14

day before the final registration statement was approved, 143 contracts traded. There was no discernable
trend in prices. The lowest normalized closing price for the IPO_UP contract was $0.248 and the highest
was $0.375, implying a forecasted market capitalization of $24.8 to $37.5 billion. On August 18, the date
the prospectus was declared effective, trading volume was 228 contracts and the normalized closing price
was $0.267 implying a predicted market capitalization of $26.7 billion. While the capitalization
according to the August 18th IPO price was considerably below this (23.1 billion), Google’s market
capitalization at the open on August 19th was 27.1 billion. It closed at a market capitalization of $27.2
billion (resulting in contract payoffs of $0.272).
Trading in the Google WTA market was much heavier than in the linear market.24 From July 8
through August 17, 3,021 contracts traded. Figure 2 shows prices of the WTA contracts as an area chart.
Each band corresponds to one contract. The width of the band is the normalized price of the contract.
Each contract price is interpreted as the probability that Google’s market capitalization would be within
the associated range (in billions of dollars) after the first day of trading. The sum of normalized prices
(forecast probabilities) equals 1. The actual first-day, closing market capitalization of Google was $27.2
billion. Figure 2 shows that the median of the predicted distribution was in the range corresponding to the
actual market capitalization from August 8 through the end of the market on August 17.
As news came out, various IEM contracts changed in price. Late in the market (around August
10), IPO_25-30 and IPO_30-35 emerged as the most likely outcomes and the median of the distribution
fell in the 25-30 billion range (as shown in Figure 2). On August 18, the volume of trade on the IEM
Google WTA market was 3,148 contracts. Prices collapsed to less than $0.05 for all but the IPO_20-25
and IPO_25-30 contracts and most queues were cleared.
typically relies on higher volume markets with thick queues in the argument for efficiency (e.g., Berg, Forsythe and Rietz, 1996). However, experimental research suggests that even small double auction markets (e.g., with as few as four traders) can converge to efficient outcomes (e.g., Smith, Williams, Bratton and Vannoni, 1982). Further, IEM prediction markets are similar to those modeled theoretically by Milgrom and Stokey (1982). We should see no trade according to their theory if traders have concordant preferences and are risk averse (which would make holding only cash and unit portfolios a Pareto optimal distribution). In this case, shadow prices would, nevertheless, be efficient.
24 This trading pattern also holds in our political markets, with much heavier trading in WTA contracts than in linear (vote share) contracts. See Berg, Nelson and Rietz (2003).
15

Figure 3 shows the expected market capitalization according to the distribution estimated from
the WTA prices each day. Figure 3 also includes the predicted market capitalization from the linear
market for comparison. The forecasts from the WTA market follow the linear market forecasts quite
closely. Their correlation is 0.71. The WTA low forecast was $23.2 billion and the high was $36.5
billion (compared to $24.8 billion and $37.5 billion from the linear market). On August 18 (the day of
the final S-1 approval), several WTA contract prices fell to zero, which made identification of the two
parameters imprecise without finer contract intervals (i.e., we cannot estimate the parameters precisely
when all or nearly all of the forecast distribution lies in one interval). However, from August 11 through
August 17, the estimates of market capitalization fell between $28.2 and $28.9 billion and closed at $28.3
billion on August 17.
While volumes differ considerably, forecast market capitalizations are similar across the two IEM
prediction markets at any point in time. They are highly correlated even though the different contract
structures and thin trading in the linear market make inter-market arbitrage difficult at best. A similar
analysis of data from the 2004 WTA Presidential Election markets on the IEM shows a similar inter-
market pattern. The election market analysis suggests that, while forecasts are similar, those derived from
WTA markets may be more stable than those derived from the linear (vote share) markets. This evidence,
combined with the higher volumes in the WTA market, leads us to have more confidence in the estimates
from the Google WTA market predictions, so we will focus on the WTA predictions through the rest of
the paper.
As Figure 3 shows, the predictions were remarkably accurate. Inaccurate early predictions would
not be surprising. As noted above, there was no information about quantities of shares and price ranges in
early versions of the prospectus. Even though all such information is known at the time when-issued
markets open, Löffler, Panther and Theissen (2002) document that when-issued markets are only
informative in the last few days of trading. Nevertheless, from July 8 (the first day after which all
contracts had traded) through July 25 (the day before the filing of Amendment 4, which contained the first
estimates of share quantities and price ranges), the forecasted market capitalization from the WTA market
16

ranged from $23.2 to $32.1 billion with an average of $29.0 billion. This is higher than most independent
estimates reported in the press. While two news reports forecast a maximum market capitalization of
Google at $30 billion, typical reports forecast a maximum of 20-25 billion.25 The actual market
capitalization on the close of the first day of trading (August 19) was $27.2 billion, only 6.16% less than
the average prediction over this early forecast period. By the next day, the market capitalization had risen
to $29.4 billion, significantly closer to the early IEM forecasts. This early indication of market
capitalization would be valuable in setting initial price ranges and, as a result, makes our prediction
markets very different from existing when-issued markets in other countries.
After Amendment 4 was filed on July 26, the IEM forecasted market capitalization rose, likely in
response to the relatively high preliminary price range ($108-$135 per share). This indicated a
capitalization range of $29.3 billion to $36.6 billion with a midpoint of $33.0 billion. The IEM prices
gave an average prediction of $33.9 billion from July 26 through August 8. That this is near the midpoint
of the price range (instead of at or above the top of the range) contrasts with what one would expect from
the when-issued market evidence. There, the eventual market capitalization of typical IPOs significantly
exceeds the top of the indicated range (Aussenegg, Pichler and Stomper, 2004).
The IEM predicted market capitalization had fallen to $30.4 billion by the date of the 5th
Amendment (August 9) and to $28.3 billion by the date of the 6th Amendment (August 11). From
August 11 through August 17, the IEM forecasts ranged from $28.2 to $28.9 billion and averaged $28.5
billion, just 4.8% above the actual August 19 capitalization of $27.2 billion (a price of $100.34 per share).
The IEM closing prices the night before the final prospectus was approved forecasted a market
capitalization of $28.3 billion and, given the number of shares in the prospectus, a market price of
$104.34. The actual closing market capitalization was only 3.84% less than this final IEM forecast.
25 Wall Street Journal stories on 10/24/03, 4/23/04, 4/26/04, 4/28/04, 4/30/04 and 5/10/04 all capped the estimated
market capitalization at $25 billion. A separate Wall Street Journal story on 4/30/04 stated only a $25 billion estimate. A Wall Street Journal story on 5/13/04 estimated the range to be $20 to $22 billion. Washington Post stories estimated the market capitalization at $15 to $20 billion on 1/13/04. Stories in the Wall Street Journal on 7/19/04 and the Washington Post on 5/2/04 both give a maximum of $30 billion. Later articles did not make independent capitalization estimates. Most articles simply quoted price and capitalization ranges that were derived from Google’s own indicated price range and quantities as given in their prospectus.
17

Given the apparent difficulty in forecasting eventual market capitalizations of IPOs, this is remarkably
accurate. It is consistent with mounting evidence that prediction markets forecast accurately (see Berg,
Forsythe, Nelson and Rietz, 2003; Berg, Nelson and Rietz, 2003; among others).
B. The Evolution of Uncertainty Surrounding the IPO
By documenting a forecast distribution through time, we can document the degree of uncertainty
and the reduction of uncertainty as the IPO unfolded. We view this direct evidence on the evolution of
uncertainty during an IPO process as a significant contribution. In Figure 4, we plot the estimated
(implied) volatility of the WTA market forecast ( tσ̂ ). Implied volatility (i.e., uncertainty about the
market capitalization forecast) is high, but falls dramatically as the IPO date approaches. Volatility,
measured by the standard deviation of the logarithm of the forecasted market capitalization, declined by
about two thirds from a high point (the day after all contracts had traded in the market) to the day before
the SEC’s final approval.
As one would predict from an informationally efficient market, significant changes in uncertainty
follow events with significant informational content. Figure 4 shows that uncertainty peaked shortly after
all contracts had traded in the markets (on July 9th and 10th). The largest reductions in uncertainty appear
to occur when announcements and amendments resolved important issues. Volatility fell on every
amendment filing date except one: Amendment 7, the amendment in which the potential fallout from
Playboy’s interview (Sheff, 2004) of Google’s founders was addressed. Every other amendment seems to
have reduced uncertainty, especially Amendment 4 (which outlined the initial price range and quantities
expected to be offered and resulted in the largest single daily reduction in uncertainty) and Amendment 3
(which resolved uncertainty about where Google would be listed and resulted in the third largest single
daily reduction in uncertainty). Also of note was the settlement of a potential Yahoo lawsuit, which was
reported in newspapers on August 10th and appeared in Amendment 6 on August 11th (resulting in the 4th
and 7th largest single daily reductions in uncertainty, respectively). Overall, the average change
18

uncertainty (change in tσ̂ ) on days of amendment filings was -0.066. The change on other days averaged
less than 0.001. According to a Mann-Whitney two-sample rank sum statistic, this difference is
significant (z=2.717, p-value=0.0066). This correspondence between the reductions in uncertainty
implied by prices and what one would expect from significant information releases leads further credence
to IEM prices as efficient forecasts.
C. Estimating the Demand Curve for the Google IPO
If we knew the demand curve for Google stock, we could determine whether the IEM predicted
post-IPO market price could have been a feasible market clearing price for the IPO. While Google has
not released information about the bids in its auction, publicly available information combined with
Google’s allocation mechanism, allows us to estimate the demand curve.
It seems likely that the IPO price was set below the market clearing price. Page 40 of the
amended S-1 filing on August 13, 2004 (the day the auction began) states, “If the initial public offering
price is equal to the auction clearing price, all successful bidders will be offered share allocations that are
equal or nearly equal to the number of shares represented by their successful bids” (italics added). If
Google set the price lower than the auction market clearing price, it stated that it would ration shares
using one of two mechanisms (pro rata or maximum share allocation) with a goal of allocating to
successful bidders at least 80% of their quantities bid. While it is possible that there was a highly elastic
demand at or very near the market clearing price that necessitated rationing, it is clear that Google
expected little rationing at the market clearing price and that significant rationing would indicate pricing
below the auction market clearing price.26
26 One might also argue that the $85 price resulted from tacit or explicit collusion among large investors to lower the
price below true value in a Wilson (1979) style share auction equilibrium. However, free entry breaks this equilibrium. Further, supposing it did occur, this outcome would not change the implications for theory developed here because it would not change the evidence on the distribution of information, the lack of discretionary allocations of shares and the inability to pre-commit to underpricing. However, it would mean that underpricing was unavoidable given Google’s auction mechanism.
19

On August 20, a Wall Street Journal article (Lucchetti, Sidel and Simon, 2004) reported that
Turner Investment Partners bid for 1 million shares at $85 per share and received only 700,000 shares or
70% of its bid. Internet reports (e.g., Kawamoto and Olsen, 2004, www.buygoogle.com, 8/19/04, and
messages at the Google Stock discussion board at http://www.google-ipo.com) suggest that small bidders
were also rationed and put the percentage at up to 75%. This indicates that Google used the pro rata
allocation process, which means that the quantity sold (22,545,809 shares including the over-allotment
option) was 70%-75% of the total bid quantity at the $85 price. This would imply total bids of
30,061,079 to 32,208,299 shares at or above $85 per share (i.e., an excess demand of 33.3% to 42.9% of
the quantity sold).27 These allocations are consistent with significant underpricing.
Publicly available data allows us to approximate two apparent points on the demand function.
Investors were willing to buy roughly 30 million shares at a price of $85 according to the allocation
information available. The next day’s opening price implied that they were willing to buy the actual 22.5
million shares (including the over-allotment option that had been issued) at about $100. Assuming
overnight information changed the demand curve little, we can estimate the demand curve. From this, we
can determine whether Google could have expected to sell 19.6 million shares at the IEM suggested price
of $104.34.28 Solving for a linear demand curve (as an approximation) given the two points ($85, 30
million) and ($100, 22.5 million) gives a demand curve of QD = 72.5 million – 0.5P. Using the IEM
suggested price of $104.34 yields a predicted sales quantity of 20.33 million > 19.6 million. A constant
elasticity demand curve (fit to the same data points) gives a predicted sales quantity of 20.10 million >
19.6 million. The estimated demand curves are shown in Figure 5. Overall, the information available
suggests that the IEM implication of foregone revenues of greater than $300 million (see Table II below)
is reasonable.
27 22,545,809/0.75=30,061,079 and 22,545,809/0.70=32,208,299. (30,061,079-22,545,809)/22,545,809=33.3% and
(32,208,200-22,545,809)/22,545,809=42.9%. 28 The original 19.6 million includes all of the shares issued by Google itself. The over-allotment option was filled
completely by existing shareholders. So, how much of the over-allotment option that would have been exercised at the IEM price is irrelevant to the proceeds raised by Google itself.
20
D. Evidence on Theories of IPO Underpricing
1. Asymmetric Information I: Evidence on Theories Where Issuers Know More than
Investors
Many theories suggest that IPO underpricing is a means of making payments to IPO purchasers to
counter problems caused by asymmetric information. Some theorize that issuers have more information
than outsiders and large payments to investors are required to provide incentives for them to acquire
costly information that overcomes the asymmetry (e.g., Chemmanur, 1993). Accuracy of our prediction
markets is evidence against such models. The information necessary to determine the value of the IPO
appears to have been in the hands of our traders and aggregated by our markets. Further, the traders
generated these accurate forecasts in exchange for very small profits. The mean profit in the market was
zero (by construction) and the most any trader earned was $241.
2. Asymmetric Information II: Evidence on Theories Where Investors Know More than
Issuers
Other researchers theorize that outsiders have more information than issuers and that they require
large payments to reveal their information (e.g., Benveniste and Spindt, 1989). Accuracy of the
prediction markets could be consistent with the informational assumption of such models. However,
again, we obtained the information nearly costlessly in our prediction markets. Further, the evidence
from the demand estimates above suggests that Google also knew that the demand would have supported
a higher price. Thus, the overall evidence is against such models.
3. Asymmetric Information III: Evidence on Theories with Information Asymmetry across
Investors
The evidence is more consistent, though not entirely so, with asymmetric information across
investors. For example, Rock (1986) argues that uninformed investors will demand a high average initial
21
IPO return to overcome adverse selection problems. Informed investors will only participate in an IPO if
they know that the IPO is by a “good” company. In this case, uninformed investors receive partial
allocations of shares. However, when the IPO is by a “bad” company, the informed investors do not
participate and uninformed investors receive full allocations. This creates an adverse-selection-based
winner’s curse that must be overcome by underpricing on average to get uninformed investors into the
IPO market. Google’s auction process may have been prone to such a winner’s curse. If so, uninformed
auction participants would need to expect Google to underprice on average to create sufficient returns
(again, on average) to overcome the winner’s curse. Our estimates of the demand curve above suggest
that Google deliberately underpriced, possibly to overcome this problem. In contrast, Reny and Perry
(2003) show that, under the right conditions, double auction markets (like our prediction markets) are not
prone to the winner’s curse and converge to the fully revealing rational expectations equilibrium
(explaining our accurate prices). Finally, differences of opinion (between investors) can also drive the
observed trading in prediction markets (e.g., Harris and Raviv, 1993). This evidence is consistent with
asymmetric information across investors.
However, several pieces of evidence run counter to Rock’s (1986) winner’s curse model. First,
given Google’s stated goals and IPO mechanism, it is unclear whether investors could have reasonably
expected underpricing as an outcome even if Google was a “good” company. Second, according to this
model “good” companies should have a higher than expected actual IPO return ex post and “bad”
companies should have a lower than expected actual IPO return ex post (because the information about
the company is revealed through the IPO process).29 In neither case will the actual IPO return ex post
equal the ex ante expected IPO return. In Google’s case, the ex post return and the ex ante expected
return (derived from IEM prices) were approximately equal. Further, Rock (1986) argues that the ex ante
level of uncertainty will be positively correlated with predicted underpricing. While we cannot estimate a
cross-sectional correlation, we can estimate the correlation for this IPO through time. We estimate the ex
29 In Rock’s, 1986, model, this would be revealed by the presence of informed investors. Uninformed investors can
infer the quality of the issue by seeing whether they were allocated the full number of shares for which they bid.
22

ante expected degree of underpricing as t
ttt
midU
µµ
ˆˆ−
= , where midt serves as a estimate of the expected
issue price and is defined to be the market capitalization computed from the midpoint of the announced
price range and the announced share quantities30 and tµ̂ is the ex ante market forecast of the post-IPO
market value estimated from equation (3). We correlate this with tσ̂ , the ex ante market uncertainty
estimated from equation (3). From the date that the first initial price ranges and share quantities were
announced (with Amendment 4 on 7/26/04) through the IPO date (8/18/04), the correlation coefficient
was -0.62 (t = -2.56, p-value = 0.018). While this result is not strictly counter to Rock’s (1986)
prediction,31 it is indicative of a relationship between underpricing and uncertainty that would go in the
opposite direction of his model.
4. Evidence on Theories that Involve Discretionary Allocations of Shares or Pre-
commitment to IPO Prices
Further evidence on theory comes from Google’s unique auction mechanism. Benveniste and
Spindt (1989) and other models (e.g., Loughran and Ritter, 2002) rely on discretionary allocations of
shares by the investment banker. Some models rely on pre-commitment to underprice (e.g., Benveniste
and Spindt, 1989). Others rely on pre-commitment to a price, after which investors gather information
(e.g., Chemmanur, 1993). Because the auction mechanism severely restricted discretion in allocating
shares and determined the allowable maximum IPO price after bids were submitted, underpricing here is
evidence against models that rely on such factors. If these factors alone explained underpricing, we
should not have observed it in Google’s case.
30 Whether we use the midpoint, the upper end or the lower end makes no substantive difference to the results that
follow. 31Again, his model would predict a positive cross-sectional correlation between ex ante uncertainty and average
levels of ex post under pricing. Here, we show a positive time series correlation between ex ante uncertainty and ex ante forecasts of underpricing.
23

5. Evidence on Theories Where there are Future Benefits to Underpricing
In contrast, the evidence is consistent with symmetric information models when there is a future
benefit to underpricing. We discuss three such models here. In these models, both the issuers and the
investors know the degree of underpricing in advance, which is consistent with our evidence. For each
model, there is one additional piece of corroborating evidence. First, in Booth and Chua’s (1996) model,
issuers deliberately underprice to achieve ownership dispersion. This creates more market liquidity and
future benefits from the resulting lower required return of investors. Consistent with this model, Google’s
prospectus states that, counter to its primary goal of price stability, it may have chosen to underprice its
shares deliberately to “achieve a broader distribution of our Class A common stock” (final prospectus, p.
38). Second, Tinic (1988) and Hughes and Thakor (1992) model underpricing to avoid potential future
lawsuits that may result if prices fall dramatically after the IPO. Consistent with this model, Google’s
prospectus goes on to state that it may have chosen to underprice its shares deliberately to “potentially
reduce the downward price volatility in the trading price of our shares in the period shortly following our
offering relative to what would be experienced if the initial public offering price were set at the auction
clearing price” (final prospectus, pp 38-39). Finally, Welch (1989) argues that high quality firms will
underprice IPO’s deliberately to signal firm quality and drive bad firms from the market in a fully
revealing separating equilibrium. They will recoup their losses in subsequent secondary offerings. The
evidence that both Google (from the estimated demand curve) and outsiders (from the prediction markets)
knew that Google would be underpriced is consistent with the fully revealing equilibrium. Also
consistent with this model, Google made a secondary offering on September 14, 2005 at a price of $295
per share, raising more than $4.18 billion. Thus, the overall evidence is consistent with Google
deliberately underpricing by an amount known to both investors and the issuer in exchange for future
benefits. Overall, the evidence is consistent with Ritter and Welch’s (2002) sentiment that underpricing is
not caused by asymmetric information between the issuer and investors.
24

6. Summary of the Evidence on Theory
Some of the results above are driven only by the outcomes of the IEM prediction markets. In
particular, the fact that the prediction markets aggregated trader information, creating an accurate forecast
at little cost drives results 1 and 2 above. Evidence on the correlation of uncertainty and underpricing
(part of result 3 above) is also independent of the auction mechanism. Combined, this evidence leans
against IPO underpricing theories that rely on asymmetric information. Further, since the evidence is
independent of the unique features of Google’s IPO, we argue that these results should apply to IPO’s in
general. Some of the results shown above arise because of the Google auction mechanism, but shed light
on all IPO’s. The auction mechanism eliminates some factors that lead theorists to predict underpricing.
Specifically, the auction eliminates pre-commitment to prices or underpricing and discretionary
allocations of shares as sources of underpricing (result 4 above). Since underpricing still occurs, this casts
doubt on these as reasons for underpricing in general. Some results depend on the combination of the
prediction markets and the unique features of the Google IPO. In particular, the combination drives part
of the mixed evidence on winner’s curse models in result 3 above and the evidence for models of
underpricing in exchange for future benefits in result 5 above. This constellation of results highlight why
Google is a particularly informative case to study.
E. Practical Implications
Setting IPO prices according to predictions would have made a substantial difference in funds
raised. Table II shows the difference it might have made. Google actually set an IPO price of $85,
implying a market capitalization of $23.1 billion. The closing market price and market capitalization
were 18% above this after the first day of trading. According to the final prospectus, Google sold
14,142,135 shares and existing shareholders sold 5,462,917 shares for a total of 19,605,052 shares at a net
price of $82.6161. At the IPO price, Google raised $1,168.4 million for itself and selling shareholders
received $451.3 million (Table II, column 1). Had Google managed to set the price equal to the closing
25

price on the first day, sold the same number of shares and paid the same percentage spread to investment
bankers, Google would have raised $1,379.2 million (or $210.9 million more) for itself and Google’s
existing shareholders would have received $532.8 million (or $81.5 million more), without the exercise of
the over-allotment option.32 Adding the difference in investment bank proceeds brings the total difference
to $300.7 million that was clearly “left on the table” (see calculations in Table II, column 4). Had Google
set its IPO price at the IEM forecast and managed to sell the same number of shares (which seems likely,
according to the estimated demand curve as discussed above), the total foregone proceeds increases to
$379.19 million (calculations in Table II, column 5).33
The overall evidence is consistent with known, equilibrium underpricing, suggesting that Google
may not have wanted to price at the full post-IPO market level. In such cases, prediction markets can still
serve a valuable role. They can serve as low cost mechanisms for forecasting post-IPO market prices.
These forecasts can be used to set IPO prices to achieve the desired levels of underpricing. In such cases,
we would not argue that prediction markets should replace road shows, book building and other means of
gathering information. Instead, we argue that prediction markets can supplement other mechanisms. This
mirrors observations from political markets. Election prediction markets do not replace polls. Instead,
they provide an additional information aggregation mechanism. Given the stakes involved, any
mechanism that provides additional information about IPO valuations would be extremely valuable.
5. Conclusions and Discussion
Underpricing of IPOs is of great theoretical and practical interest. The distinctive features of the
Google IPO and the IEM prediction markets run in advance of the IPO provide unique evidence on
underpricing theories. From a practical point of view, given the initial underpricing of IPOs, companies
32 The entire over-allotment option was sold by existing shareholders. Had they sold the full over-allotment at the
IEM predicted net price (assuming the same spread) instead of the actual $82.6161, existing shareholders would have made $158.0 million more than they actually did.
33 We have already discussed how the excess demand information can be used to judge the likelihood that the same number of shares could have been sold at the IEM predicted price. In addition, Google closed above the IEM forecasted price on the second day of trading and has risen above this level even after the exercise of the over-allotment option had been made public.
26

have incentives to set IPO prices closer to ensuing market values if the factors causing the low prices can
be circumvented. Underpricing results in lost IPO proceeds and greater dilution, and typically represents
the largest cost of the issue. On the other hand, if a degree of underpricing is optimal, companies have
every incentive to accurately set the IPO prices to achieve optimal underpricing given the level of the
stakes involved.
Our results contribute to IPO research in general in a variety of ways. The prediction market
results show that the information necessary to forecast the post-IPO price of Google’s stock existed in a
public forum and could be aggregated cheaply well in advance of the IPO. This provides evidence
against models where large payments to investors are required to overcome problems of asymmetric
information (whether issuers have more information about IPO values than investors as in Chemmanur,
1993, or investors have more information than issuers as in Benveniste and Spindt, 1989). This evidence
is independent of the unique features of the Google IPO and, hence, is generalizable. Because of the
restrictions that the auction mechanism put on allocations of shares, underpricing here is also inconsistent
with models that rely on pre-commitment to prices or underpricing and/or discretionary allocations of
shares (e.g., Benveniste and Spindt, 1989, Chemmanur, 1993, Loughran and Ritter, 2002) as a general
cause of IPO underpricing. The evidence is mixed on models in which underpricing addresses the
winner’s curse caused by asymmetric information across investors (as in Rock, 1986). Evidence from the
combination of the prediction markets and the unique features of the Google IPO is consistent with
symmetric information models when there is a future benefit to underpricing (e.g., Welch’s, 1989, model
of underpricing to drive bad firms from the market and achieve higher secondary offering prices; Booth
and Chua’s, 1996, future benefits of ownership dispersion increasing liquidity and decreasing the overall
cost of borrowing; or Tinic’s, 1988, and Hughes and Thakor’s, 1992, future benefits of reduced legal
risk).
On the practical side, there are a number of mechanisms that may help firms set IPO prices closer
to market values or set them closer to optimal underpricing. Here, we introduce the idea of using a
prediction market to do so. Our evidence suggests that such markets can be successful in forecasting
27

post-IPO values of stocks. The forecasts were quite accurate for Google even before many aspects of the
issue (e.g., the number of shares, initial price range indications, etc.) were revealed.
What can explain the accuracy of these markets? At one level, given the pervasive underpricing,
one might argue that prediction markets may perform well by simply forecasting a market capitalization
higher than that indicated using preliminary price ranges from the prospectus. However, two pieces of
evidence counter this. First, IEM prices predicted well even before preliminary price ranges and share
quantities were available. Second, shortly after the initial ranges were announced, the IEM prices
predicted a market capitalization near the average of the price range, not above the range, and the
prediction fell long before the price range was revised down. Thus, prediction market traders appear to
do more than simply “mark up” preliminary price ranges from the prospectus. Why might this be
possible? Recent evidence suggests that the degree of underpricing may be predicted from publicly
available information that underwriters and/or companies do not build into prices (e.g., Bradley and
Jordan, 2002, Loughran and Ritter, 2002, and Lowry and Schwert, 2004). Participants in prediction
markets may be able to incorporate this information without the biases and conflicts frequently
hypothesized to affect firms, investment bankers and investors.
One might argue that the results here are weakened because Google is a single IPO. We believe
this is not the case for three reasons. First, we argue that unique features of the Google IPO strengthen
the results. Both the unique features of the Google IPO alone and the outcomes of the prediction market
alone provide interesting evidence on theories of IPO underpricing. When combined, the evidence is
particularly compelling. For example, the ability to estimate the demand curve through information about
the auction allows us to determine whether both Google (the issuer) and outsiders (our market
participates) were both informed about the degree of underpricing, allowing for a more complete analysis
of asymmetric information models. Second, we argue that the evidence here is interesting in spite being
generated by a single IPO because the evidence comes from the evolution of prediction market prices
through the entire IPO process. For example, the evolution of ex ante uncertainty through time and the
correlation of uncertainty with ex ante forecasts of underpricing can shed light on theory even from a
28

single IPO prediction market. Third, we argue that Google’s unique goals and mechanism make it an
interesting IPO to study in its own right. Google provides a natural and conservative benchmark for
evaluating the efficiency of IPO prediction markets because of their stated intentions of avoiding large
post-IPO price changes and their auction mechanism.
Some issues cause difficulties for prediction markets. For example, expected value pricing in
such markets depends on traders not using the markets for hedging purposes. Significant hedging
demand could drive prices away from the fundamental values that markets are trying to forecast. But this
simply means that a model of hedging demand needs to be grafted onto market prices to reveal true
probabilities. Other mechanisms also have the potential for improving IPO prices. But, these
mechanisms have limitations, too.34 Given the importance of IPOs, the stakes involved in pricing them
and the lack of agreement on the theoretical reasons for underpricing, we suggest that all potential means
of forecasting IPO values, setting optimal IPO prices and evaluating theory, including prediction markets,
are worthy of further study.
34 As discussed above “when-issued” markets for IPO stock are run in other countries including Germany.
However, as currently structured, they cannot be used in setting the initial price range and, because the initial price range generally creates binding restrictions, they are of little practical use in setting IPO prices. Another alternative would be an actual direct auction to the public. Appropriately designed, auctions can be incentive compatible and truth revealing. However, auctions are often afflicted by the winners curse, as Rock (1986) points out. And, when participation is endogenous, auction mechanisms may lead to increased risk (because of uncertainty about the number of bidders) and a sub-optimal level of information production (Sherman, 2004).
29
References
Aussenegg, Wolfgang, Pegaret Pichler and Alex Stomper, 2004, “IPO Pricing with Bookbuilding and a When-
Issued Market,” working paper, the Fondazione Eni Enrico Mattei Note di Lavoro Series.
Benveniste, Lawrence M., and Paul A. Spindt, 1989, “How Investment Bankers Determine the
Offer Price and Allocation of New Issues,” Journal of Financial Economics, 24, 343–362.
Berg, Joyce E., Robert Forsythe, Forrest D. Nelson and Thomas A. Rietz, 2003, “Results from a Dozen Years of
Election Futures Markets Research,” forthcoming in Charles R. Plott and Vernon Smith, eds.: Handbook of
Experimental Economic Results (North Holland, Amsterdam).
Berg, Joyce E., Robert Forsythe and Thomas A. Rietz, 1996, “What Makes Markets Predict Well? Evidence from
the Iowa Electronic Markets,” in Wulf Albert, Werner Güth, Peter Hammerstein, Benny Moldovanu and Eric
Van Damme, eds.: Essays in Honor of Reinhard Selten (Springer-Verlag, Berlin).
Berg, Joyce E., Robert Forsythe and Thomas A. Rietz, 1997, “The Iowa Electronic Market,” in Dean Paxson and
Douglas Wood, eds.: Blackwell Encyclopedic Dictionary of Finance (Blackwell, Oxford UK).
Berg, Joyce E., Forrest D. Nelson and Thomas A. Rietz, 2003, “Accuracy and Forecast Standard Error of Prediction
Markets,” working paper, University of Iowa, Department of Finance.
Booth, James R., and Lena Chua, 1996, “Ownership Dispersion, Costly Information, and IPO Underpricing,”
Journal of Financial Economics, 41, 291-310.
Bradley Daniel J., and Bradford D. Jordan, 2002, “Partial Adjustment to Public Information and IPO Underpricing,”
Journal of Financial and Quantitative Analysis, 37, 595-616.
Brealey, Richard A., and Stewart C. Myers, 2003. Principles of Corporate Finance, 7th ed. (McGraw-Hill Irwin,
Burr Ridge, Illinois).
Chemmanur, Thomas J., 1993, “The Pricing of Initial Public Offerings: A Dynamic Model with Information
Production,” Journal of Finance, 48, 285-304.
Chen, Hsuan-Chi, and Jay R. Ritter, 2000, “The Seven Percent Solution,” Journal of Finance, 55, 1105-1131.
Derrien François, and Kent L. Womack, 2003, “Auctions vs. Bookbuilding and the Control of Underpricing in Hot
IPO Markets,” Review of Financial Studies, 16, 31-61.
Forsythe, Robert, Forrest D. Nelson, George R. Neumann and Jack Wright, 1992, “Anatomy of an Experimental
Political Stock Market,” American Economic Review, 82, 1142-1161.
30
Forsythe, Robert, Thomas A. Rietz and Thomas W. Ross, 1999, “Wishes, Expectations and Actions: Price
Formation in Election Stock Markets,” Journal of Economic Behavior and Organization, 39, 83-110.
Harris, Milton, and Artur Raviv, 1993, “Differences of Opinion Make a Horse Race,” Review of Financial Studies,
6, 473-506.
Hughes, Patricia J., and Anjan V. Thakor, 1992, “Litigation Risk, Intermediation and the Underpricing of Initial
Public Offerings,” Review of Financial Studies, 5, 709–742.
Jenkinson, Tim, and Alexander Ljungqvist, 2001, Going Public: The Theory and Evidence on How Companies
Raise Equity Finance, 2nd ed. (Oxford University Press, Oxford, England).
Kawamoto, Dawn, and Stefanie Olsen, 2004, “Google gets to Wall Street--and Lives,” CNET News.com, August
19, 2004.
Khanna, Naveen, Thomas H. Noe, and Ramana Sonti, 2005, “Good IPOs drive in bad: Inelastic banking capacity
and persistently large underpricing in hot IPO markets,” working paper, Tulane University.
Löffler, Gunter, Patrick F. Panther and Erik Theissen, 2002, “Who Knows What When? The Information Content
of Pre-IPO Market Prices,” working paper, Goethe-University, Frankfurt, Germany.
Loughran, Tim, and Jay R. Ritter, 2002, “Why Don’t Issuers Get Upset about Leaving Money on the Table in
IPOs?” Review of Financial Studies, 15, 413–443.
Loughran, Tim, and Jay R. Ritter, 2004, “Why has IPO Underpricing Changed Over Time?” Financial Management,
Autumn, 5-37.
Lowry, Michelle, and William G. Schwert, 2004, “Is the IPO pricing process efficient?” Review of Financial
Studies, 71 (1), 3-26.
Lucchetti, Aaron, Robin Sidel and Ruth Simon, 2004, “The Searchers: With Eyes for Google, 3 Investors Ride a
111-day Roller Coaster--An Amateur and Two Pros Experience Highs and Lows of Quirky, Coveted Offering--
'Awwww, Man!' to 'Nice Job',” The Wall Street Journal, August, 20, 2004.
Milgrom, Paul, and Nancy Stokey, 1982, “Information, Trade, and Common Knowledge,” Journal of Economic
Theory, 26, 17–27.
Oliven, Kenneth, and Thomas A. Rietz, 2004, “Suckers are Born but Markets are Made: Individual Rationality,
Arbitrage and Market Efficiency on an Electronic Futures Market,” Management Science, 50, 336-351.
31

Reny, Philip J., and Motty Perry, 2003, “Toward a Strategic Foundation for Rational Expectations Equilibrium,”
Working Paper, Department of Economics, University of Chicago.
Ritter, Jay R., and Ivo Welch, 2002, “A Review of IPO Activity, Pricing, and Allocations,” Journal of Finance, 57,
1795-1828.
Rock, Kevin, 1986, “Why New Issues are Underpriced,” Journal of Financial Economics, 15, 187–212.
Sheff, David, 2004, “Playboy Interview: Google Guys,” Playboy, 51, 9, 55-60 and 142-145.
Sherman, Ann E., 2004, “Global Trends in IPO Methods: Book Building vs. Auctions with Endogenous Entry,”
Journal of Financial Economics, forthcoming.
Sherman, Ann E., and Sheridan Titman, 2002, “Building the IPO Order Book: Underpricing and Participation
Limits With Costly Information”, Journal of Financial Economics 65, 3-29.
Smart, Scott B., and Chad J. Zutter, 2003, “Control as a Motivation for Underpricing: A Comparison of Dual and
Single-Class IPOs,” Journal of Financial Economics, 69, 85-110.
Smith, Vernon L., Arlington W. Williams, W. Kenneth Bratton and Michael G. Vannoni, 1982, “Competitive
Market Institutions: Double Auctions vs. Sealed Bid-Offer Auctions,” American Economic Review, 71, 58-77.
Tinic, Seha M., 1988, “Anatomy of Initial Public Offerings of Common-Stock,” Journal of Finance, 43, 789-822.
Welch, Ivo, 1989, “Seasoned Offerings, Imitation Costs, and the Underpricing of Initial Public Offerings,” Journal
of Finance 44, 421–450.
Wilson, Robert, 1979, “Auctions of Shares,” Quarterly Journal of Economics, 93, 675-689.
32
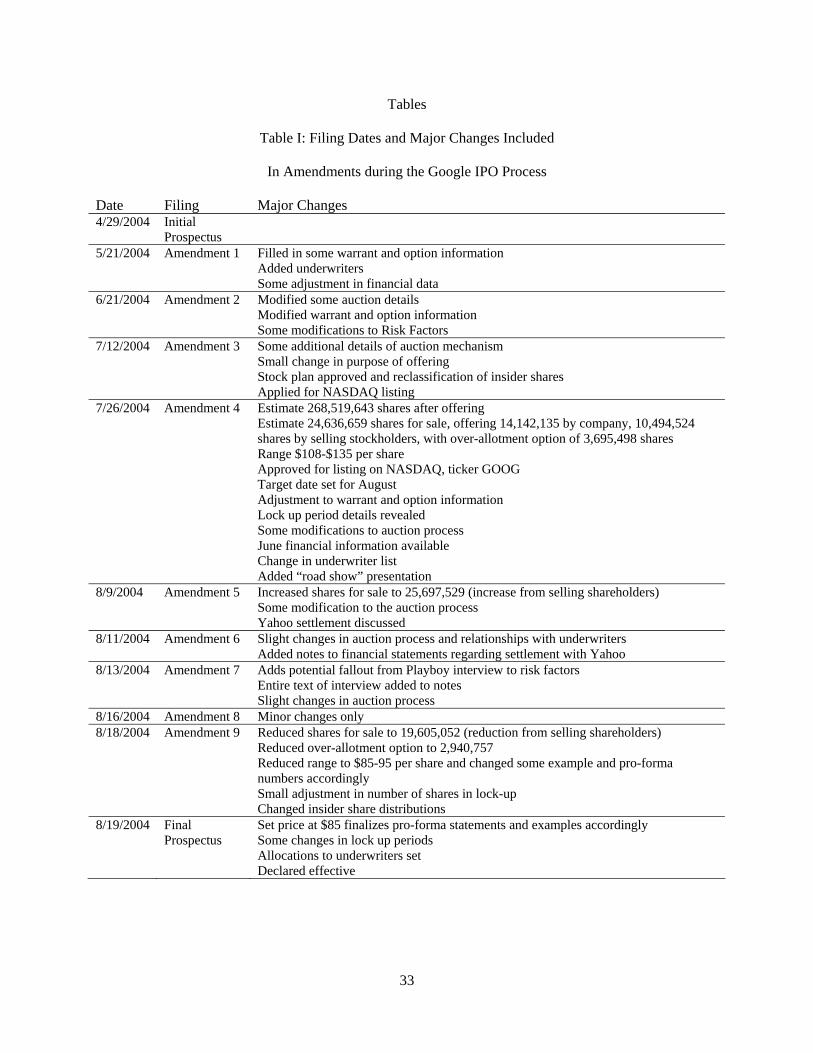
33
Tables
Table I: Filing Dates and Major Changes Included
In Amendments during the Google IPO Process
Date Filing Major Changes 4/29/2004 Initial
Prospectus
5/21/2004 Amendment 1 Filled in some warrant and option information Added underwriters Some adjustment in financial data
6/21/2004 Amendment 2 Modified some auction details Modified warrant and option information Some modifications to Risk Factors
7/12/2004 Amendment 3 Some additional details of auction mechanism Small change in purpose of offering Stock plan approved and reclassification of insider shares Applied for NASDAQ listing
7/26/2004 Amendment 4 Estimate 268,519,643 shares after offering Estimate 24,636,659 shares for sale, offering 14,142,135 by company, 10,494,524 shares by selling stockholders, with over-allotment option of 3,695,498 shares Range $108-$135 per share Approved for listing on NASDAQ, ticker GOOG Target date set for August Adjustment to warrant and option information Lock up period details revealed Some modifications to auction process June financial information available Change in underwriter list Added “road show” presentation
8/9/2004 Amendment 5 Increased shares for sale to 25,697,529 (increase from selling shareholders) Some modification to the auction process Yahoo settlement discussed
8/11/2004 Amendment 6 Slight changes in auction process and relationships with underwriters Added notes to financial statements regarding settlement with Yahoo
8/13/2004 Amendment 7 Adds potential fallout from Playboy interview to risk factors Entire text of interview added to notes Slight changes in auction process
8/16/2004 Amendment 8 Minor changes only 8/18/2004 Amendment 9 Reduced shares for sale to 19,605,052 (reduction from selling shareholders)
Reduced over-allotment option to 2,940,757 Reduced range to $85-95 per share and changed some example and pro-forma numbers accordingly Small adjustment in number of shares in lock-up Changed insider share distributions
8/19/2004 Final Prospectus
Set price at $85 finalizes pro-forma statements and examples accordingly Some changes in lock up periods Allocations to underwriters set Declared effective
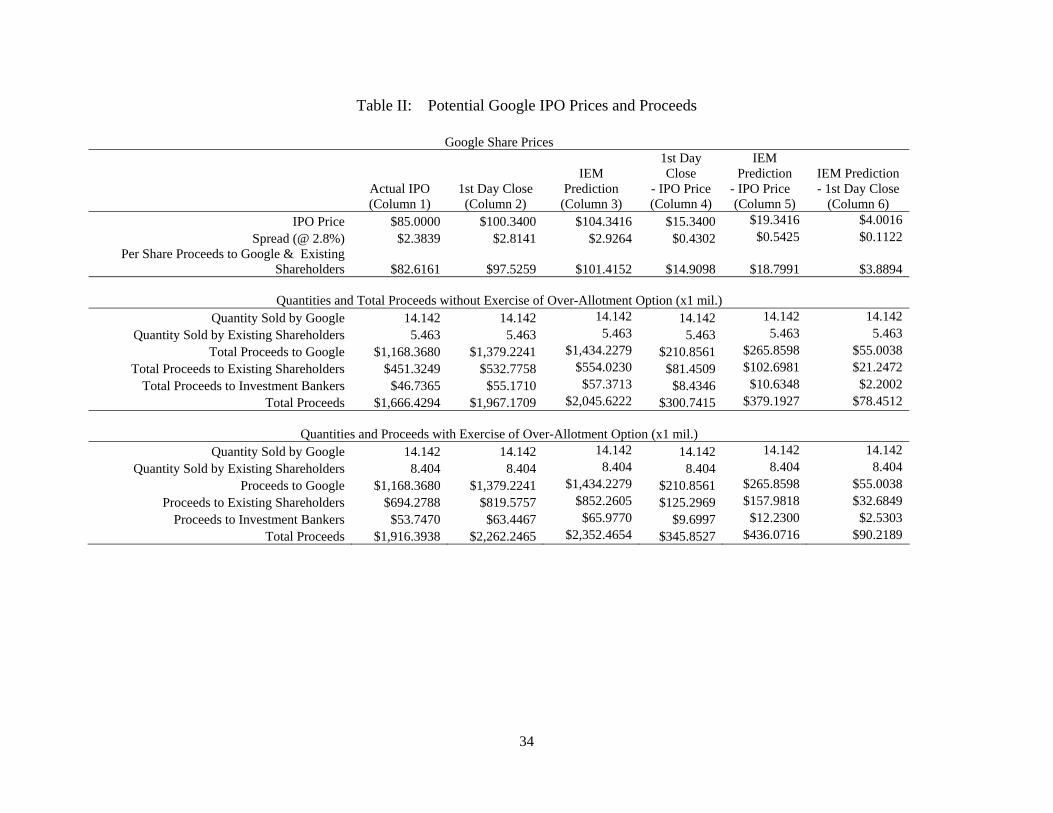
Google Share Prices
Actual IPO (Column 1)
1st Day Close (Column 2)
IEM Prediction
(Column 3)
1st Day Close
- IPO Price (Column 4)
IEM Prediction
- IPO Price (Column 5)
IEM Prediction - 1st Day Close
(Column 6) IPO Price $85.0000 $100.3400 $104.3416 $15.3400 $19.3416 $4.0016
Spread (@ 2.8%)
$2.3839 $2.8141 $2.9264 $0.4302 $0.5425 $0.1122Per Share Proceeds to Google & Existing
Shareholders $82.6161 $97.5259 $101.4152 $14.9098 $18.7991 $3.8894
Quantities and Total Proceeds without Exercise of Over-Allotment Option (x1 mil.) Quantity Sold by Google 14.142 14.142 14.142 14.142 14.142 14.142
Quantity Sold by Existing Shareholders 5.463 5.463 5.463 5.463 5.463
5.463Total Proceeds to Google $1,168.3680 $1,379.2241 $1,434.2279 $210.8561 $265.8598 $55.0038
Total Proceeds to Existing Shareholders $451.3249 $532.7758 $554.0230 $81.4509 $102.6981 $21.2472Total Proceeds to Investment Bankers $46.7365 $55.1710 $57.3713 $8.4346 $10.6348 $2.2002
Total Proceeds $1,666.4294 $1,967.1709 $2,045.6222 $300.7415 $379.1927 $78.4512
Quantities and Proceeds with Exercise of Over-Allotment Option (x1 mil.) Quantity Sold by Google 14.142 14.142 14.142 14.142 14.142 14.142
Quantity Sold by Existing Shareholders 8.404 8.404 8.404 8.404 8.404
8.404Proceeds to Google $1,168.3680 $1,379.2241 $1,434.2279 $210.8561 $265.8598 $55.0038
Proceeds to Existing Shareholders $694.2788 $819.5757 $852.2605 $125.2969 $157.9818 $32.6849Proceeds to Investment Bankers $53.7470 $63.4467 $65.9770 $9.6997 $12.2300 $2.5303
Total Proceeds $1,916.3938 $2,262.2465 $2,352.4654 $345.8527 $436.0716 $90.2189
Table II: Potential Google IPO Prices and Proceeds
34

Figures
$-
$5
$10
$15
$20
$25
$30
$35
$40
$45
$507/
8
7/10
7/12
7/14
7/16
7/18
7/20
7/22
7/24
7/26
7/28
7/30 8/
1
8/3
8/5
8/7
8/9
8/11
8/13
8/15
8/17
Fore
cast
Mar
ket C
apita
lizat
ion
(x $
1,00
0,00
0,00
0)
Filing Dates Mean(Lin) IPO Cap Closing Cap
Am
endm
ent 3
Am
endm
ent 4
Am
endm
ent 5
Am
endm
ent 6
Am
endm
ent 7
Am
endm
ent 8
Am
endm
ent 9
Figure 1: Predicted Google market capitalization from normalized closing prices in the IEM Google
Linear Market (Mean(Lin)). For comparison the actual market capitalization according to the IPO price
(IPO Cap) and first-day closing price (Closing Cap) are shown. For context, S1 amendment filing dates
are also shown.
35
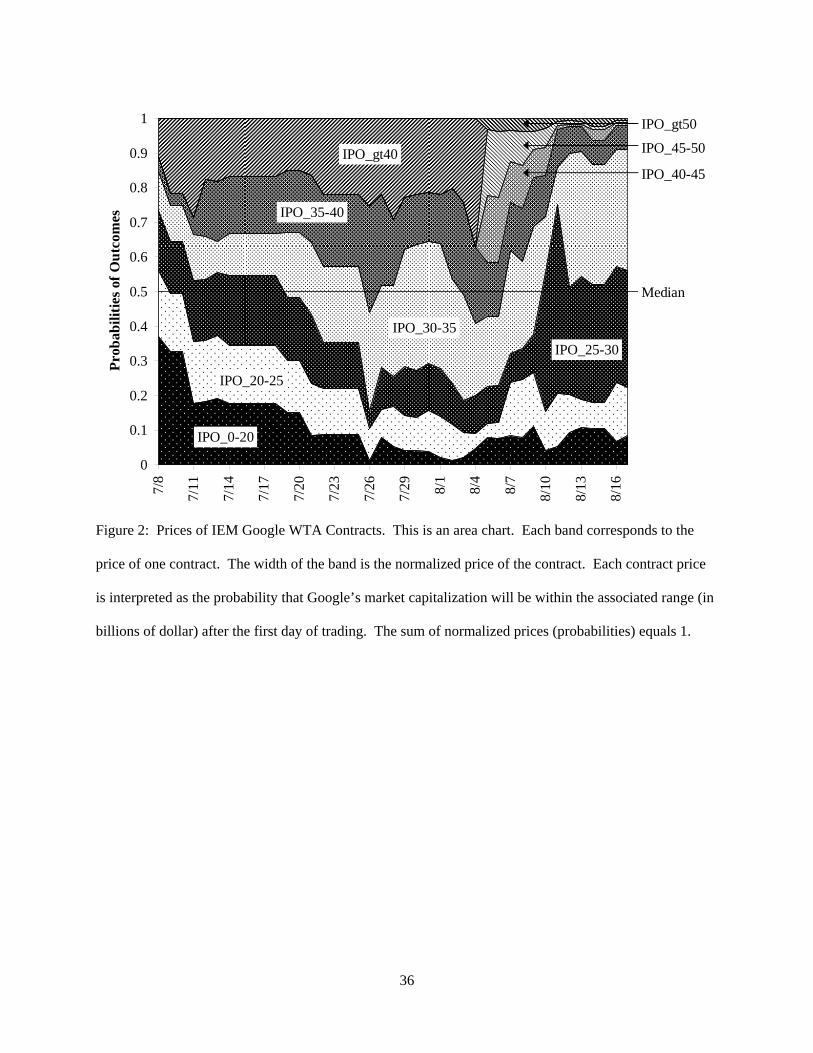
0
0.1
0.2
0.3
0.4
0.5
0.6
0.7
0.8
0.9
1
7/8
7/11
7/14
7/17
7/20
7/23
7/26
7/29 8/
1
8/4
8/7
8/10
8/13
8/16
Prob
abili
ties o
f Out
com
es
IPO_0-20
IPO_20-25
IPO_25-30IPO_30-35
IPO_35-40
IPO_gt40IPO_40-45
IPO_45-50
IPO_gt50
Median
Figure 2: Prices of IEM Google WTA Contracts. This is an area chart. Each band corresponds to the
price of one contract. The width of the band is the normalized price of the contract. Each contract price
is interpreted as the probability that Google’s market capitalization will be within the associated range (in
billions of dollar) after the first day of trading. The sum of normalized prices (probabilities) equals 1.
36

$-
$5
$10
$15
$20
$25
$30
$35
$40
$45
$50
7/8
7/10
7/12
7/14
7/16
7/18
7/20
7/22
7/24
7/26
7/28
7/30 8/
1
8/3
8/5
8/7
8/9
8/11
8/13
8/15
8/17
Fore
cast
Mar
ket C
apita
lizat
ion
(x $
1,00
0,00
0,00
0)
Filing Dates Mean(Lin) IPO Cap Closing Cap Mean(WTA)
Am
endm
ent 3
Am
endm
ent 4
Am
endm
ent 5
Am
endm
ent 6
Am
endm
ent 7
Am
endm
ent 8
Am
endm
ent 9
Figure 3: Predicted Google market capitalization from normalized closing prices in the IEM Google
Winner-Takes-All Market (Mean(WTA)). For comparison, the prediction from the IEM Google Linear
Market (Mean(Lin)), the actual market capitalization according to the IPO price (IPO Cap) and the first-
day closing price (Closing Cap) are shown. For context, S1 amendment filing dates are also shown.
37

0
0.1
0.2
0.3
0.4
0.5
0.6
7/8
7/10
7/12
7/14
7/16
7/18
7/20
7/22
7/24
7/26
7/28
7/30 8/
1
8/3
8/5
8/7
8/9
8/11
8/13
8/15
8/17
Stan
dard
Dev
iatio
n of
Log
Mar
ket C
apita
lizat
ion
(x$1
,000
,000
,000
)
Filing Dates Std.Dev.(WTA)
Am
endm
ent 3
Am
endm
ent 4
Am
endm
ent 5
Am
endm
ent 6
Am
endm
ent 7
Am
endm
ent 8
Am
endm
ent 9
Figure 4: Estimated (log) Google market capitalization forecast volatility from the IEM Google Winner-
Takes-All market.
38
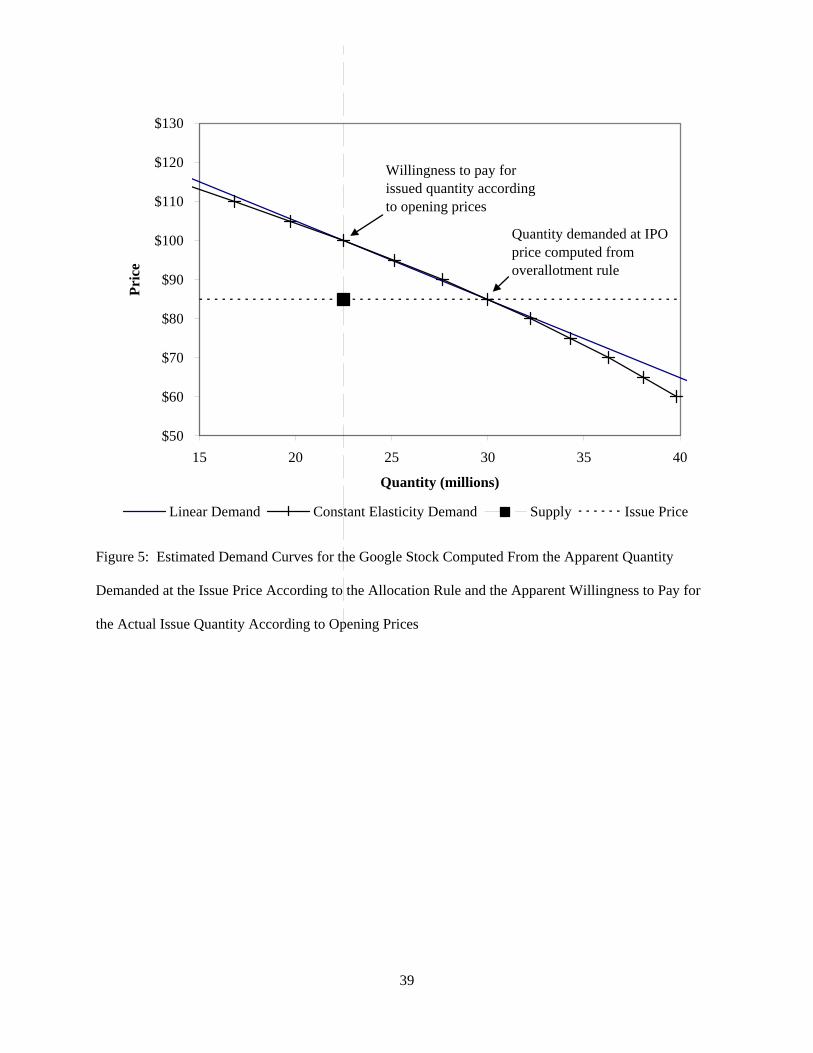
$50
$60
$70
$80
$90
$100
$110
$120
$130
15 20 25 30 35 40
Quantity (millions)
Pric
e
Linear Demand Constant Elasticity Demand Supply Issue Price
Willingness to pay for issued quantity according to opening prices
Quantity demanded at IPO price computed from overallotment rule
Figure 5: Estimated Demand Curves for the Google Stock Computed From the Apparent Quantity
Demanded at the Issue Price According to the Allocation Rule and the Apparent Willingness to Pay for
the Actual Issue Quantity According to Opening Prices
39

Appendix: Google Market Prospectuses
IEM PROSPECTUS: GOOGLE_LIN GOOGLE IPO MARKET CAPITALIZATION
LINEAR MARKET On Tuesday, June 29, 2004, at 1:00pm CDT, the Iowa Electronic Market (IEM) will open trading in a market based on the market capitalization value (closing price multiplied by the number of Class A and Class B shares outstanding) of Google Inc.’s stock at the end of the first day of trading on the stock exchange named in Google’s S-1 filing. Two contracts with linear payoff rules will trade in this market. The liquidation value of the first (up) contract will increase from $0.00 to $1.00 as Google’s market capitalization increases from $0 billion to $100 billion. The second (down) contract will have a liquidation value that decreases from $1.00 to $0.00 as Google’s market capitalization increases from $0 billion to $100 billion. This document describes that market and should be viewed as a supplement to the Trader's Manual. Except as specified in this prospectus, trading rules for this market are the same as those specified in the Trader's Manual for the Iowa Electronic Market. CONTRACTS The contracts traded in this market have the payoff structure shown in column 2 of the following table: Code Contract Description
Code Contract Description IPO_UP = $0 if the IPO does not take place by March 31, 2005;
= (Market Cap bil.)/100 billion if $0 bil. < Market Cap <= $100 bil; = $1 if Market Cap > $100 bil.
IPO_DN = $1 if the IPO does not take place by March 31, 2005; = ($100 bil.-Market Cap)/100 billion if $0 bil. < Market Cap <= $100 bil; = $0 if Market Cap > $100 bil.
DETERMINATION OF LIQUIDATION VALUES This is a linear market. Each security will have a liquidation value based on the exact market capitalization achieved on the first trading day on the market named in Google Inc.’s S-1 filing to the SEC. For example, if there are (hypothetically) 100 million shares of Class “A” and Class “B” stock and the closing price on the first trading day is $210.00, then market capitalization is $210 x 100 million = $21.0 billion. Each share of IPO_UP will pay $0.210 (=(21)/100 ) and each share of IPO_DN will pay $0.790 (=(100-21)/100). The print edition of the Wall Street Journal will be the official source for the closing price of Google stock and the final, completed S-1 filing (that is, the last filing – including any re-filings — prior to the IPO) with the SEC will be the source for the outstanding number of shares The judgment of the IEM Directors will be final in resolving questions of interpretation and typographical or clerical errors.
40

CONTRACT BUNDLES Fixed price contract bundles, each consisting of one share of IPO_UP and one share of IPO_DN, can be purchased from or sold to the IEM system at any time. The price of each contract bundle is $1.00. The determination of liquidation values described above guarantees that the total payoff from holding a contract bundle until the market closes is $1.00. To buy or sell fixed price contract bundles from the system, use the "Market Orders" option from the Trading Console. Select "GOOGLE_LIN (buy at fixed price)" from the Market Orders list to buy bundles. Select "GOOGLE_LIN (sell at fixed price)" to sell bundles. Bundles consisting of one share of each of the contracts in this market may also be purchased and sold at current aggregate market prices rather than the fixed price of $1.00. To buy a market bundle at current ASK prices, use the "Market Order" option as above but select " GOOGLE_LIN (buy at market prices)." To sell a bundle at current market BID prices, select " GOOGLE_LIN (sell at market prices)." Bundle purchases will be charged to your cash account and bundle sales will be credited to your cash account. MARKET CLOSING This market will remain open until contract liquidation. Liquidation values will be credited to the cash accounts of market participants. MARKET ACCESS Current and newly enrolled IEM traders will automatically be given access rights to the GOOGLE_LIN Market. Access to this market is achieved by logging into the IEM and choosing "GOOGLE_LIN" from the Navigation Bar. Funds in a trader's cash account are fungible across markets so new investment deposits are not required. Additional investments up to the maximum of $500 can be made at any time. New traders can open accounts using the IEM OnLine Account Application page (http://iemweb.biz.uiowa.edu/signup). There is a one-time account registration fee of $5.00, and investments are limited to the range of $5.00 to $500. Requests to withdraw funds may be submitted at any time by completing the IEM's Online Withdrawal Request form (www.biz.uiowa.edu/iem/accounts/withdrawalrequestform.html) or by completing and mailing the paper version of the request form. Additional information about requesting withdrawals is available at the IEM website at http://www.biz.uiowa.edu/iem/accounts/withdrawals.html.
41

IEM PROSPECTUS: GOOGLE_WTA GOOGLE IPO MARKET CAPITALIZATION
WINNER-TAKES-ALL Market On Tuesday, June 29, 2004, at 1:00pm CDT, the Iowa Electronic Market (IEM) will open trading in a market based on the market capitalization value (closing price multiplied by the number of Class A and Class B shares outstanding) of Google Inc.’s stock at the end of the first day of trading on the stock exchange named in Google’s final S-1 filing. Initially, six contracts will trade in this market, each representing one of six possible unique and exhaustive outcomes. The liquidation value of the contract which represents the actual outcome of the IPO will be $1.00. All other contracts will have a value of zero. This document describes that market and should be viewed as a supplement to the Trader's Manual. Except as specified in this prospectus, trading rules for this market are the same as those specified in the Trader's Manual for the Iowa Electronic Market. CONTRACTS The initial financial contracts traded in this market are as follows:
Symbol Description IPO_0-20 $1 if market cap is less than or equal to $20 billion
or if the IPO does not occur by March 31, 2005. IPO_20-25 $1 if market cap is greater than $20 billion but less than or equal to $25 billion. IPO_25-30 $1 if market cap is greater than $25 billion but less than or equal to $30 billion IPO_30-35 $1 if market cap is greater than $30 billion but less than or equal to $35 billion IPO_35-40 $1 if market cap is greater than $35 billion but less than or equal to $40 billion IPO_gt40 $1 if market cap is greater than $40 billion.
The range of values in the contract symbol represent the threshold values at which that contract will pay off. DETERMINATION OF LIQUIDATION VALUES This is a winner-takes-all market. The contract that corresponds to the actual market capitalization according to the closing price and shares outstanding at the end of the first trading day after the IPO will have a liquidation value of $1.00; all others will have values of $0.00. For example, if there are (hypothetically) 100 million shares of Class “A” and Class “B” stock and the closing price on the first trading day is $210.00, then market capitalization is $210 x 100 million = $21 billion and a share of IPO_20-25 will pay $1.00 while all other contracts pay $0. The print edition of the Wall Street Journal will be the official source for the closing price of Google stock and the final, completed S-1 filing (that is, the last filing – including any re-filings – prior to the IPO) with the SEC will be the source for the outstanding number of shares. The judgment of the IEM Directors will be final in resolving questions of interpretation and typographical or clerical errors.
42

CONTRACT SPIN-OFFS The Directors of the IEM reserve the right to introduce new contracts to the market as spin-offs of existing contracts. When a contract spin-off occurs, an original contract will be replaced by new contracts which divide the payoff range of the original contract into sub-intervals. No holder of the pre-spinoff contracts will be adversely affected. Traders will receive the same number of each of the new contracts as they held in the original, and the sum of the liquidation values of the new contracts will equal the liquidation value of the original. Decisions to spin-off a contract will be announced at least two days in advance of the spin-off. The new contract names, the specifications regarding liquidation values and the timing of the spin-off will be included in the announcement. This announcement will appear as an Announcement on your WebEx login screen. CONTRACT BUNDLES Fixed price contract bundles consisting of one share of each of the contracts in this market can be purchased from or sold to the IEM system at any time. The price of each fixed price contract bundle is $1.00. Because exactly one of the market capitalization outcomes will result from the Google IPO, the total payoff from holding a contract bundle until the market closes is $1.00. To buy or sell fixed price contract bundles from the system, use the "Market Orders" option from the Trading Console. Select "GOOGLE_WTA (buy at fixed price)" from the Market Orders list to buy bundles. Select "GOOGLE_WTA (sell at fixed price)" to sell bundles. Bundles consisting of one share of each of the contracts in this market may also be purchased and sold at current aggregate market prices rather than the fixed price of $1.00. To buy a market bundle at current ASK prices, use the "Market Order" option as above but select " GOOGLE_WTA (buy at market prices)." To sell a bundle at current market BID prices, select " GOOGLE_WTA (sell at market prices)." Bundle purchases will be charged to your cash account and bundle sales will be credited to your cash account. MARKET CLOSING This market will remain open until contract liquidation. Liquidation values will be credited to the cash accounts of market participants. MARKET ACCESS Current and newly enrolled IEM traders will automatically be given access rights to the GOOGLE_WTA Market. Access to this market is achieved by logging into the IEM and choosing " GOOGLE_WTA " from the Navigation Bar. Funds in a trader's cash account are fungible across markets so new investment deposits are not required. Additional investments up to the maximum of $500 can be made at any time. New traders can open accounts using the IEM OnLine Account Application page (http://iemweb.biz.uiowa.edu/signup). There is a one-time account registration fee of $5.00, and investments are limited to the range of $5.00 to $500.
Requests to withdraw funds may be submitted at any time by completing the IEM's Online Withdrawal Request form (www.biz.uiowa.edu/iem/accounts/withdrawalrequestform.html) or by completing and mailing the paper version of the request form. Additional information about requesting withdrawals is available at the IEM website at http://www.biz.uiowa.edu/iem/accounts/withdrawals.html.
43