searching for health insurance for ghana - home - chronic poverty
TRANSCRIPT
Demand for voluntary health insurance by the poor in developing countries: Evidence from rural Ghana
Isaac Osei-Akoto Center for Development Research (ZEFb)
University of Bonn, Germany e-mail: [email protected]
Abstract In recent years the number of formal risk-sharing schemes for health care services in Ghana has risen rapidly. At present about 42 out of 110 districts are operating some form of formal community-based health insurance, which are voluntary and to a greater extent integrated to health care facilities. The success of these schemes depend largely on the extent to which they directly or indirectly lessen the financial burden of people who have suffered most since the inception of economic reforms in the health sector. The paper looked at the social inclusion aspects of the schemes by studying demand for the two oldest schemes by the poor and exploring design features that could enhance better coverage and improve financial protection for health care services. The findings portray a remarkable exclusion of the poorest of the poor, even from other forms of risk-sharing arrangements in the informal sector. The paper also identifies limitation on plan choice as a constraining factor and highlights re-direction of subsidies from urban areas to favour rural health infrastructure.

1 Introduction Ghana has prioritised universal coverage of health care and has therefore put in place policies and programmes to meet this goal. Even though success has been achieved in different aspects of the health sector, health care delivery remains inadequate especially for poor people and other disadvantage groups. The task confronting the health sector remains difficult; life expectancy remains low (60years), morbidity of preventable diseases remains high; malaria, diarrhoea and other preventable diseases account for about 40% of child mortality, and maternal mortality is still high (240 per 100,000 births). Several reasons, including financing as a major one, account for the slow pace of improvement in the health sector. In particular reductions of public spending on health care and the introduction of user fees have created problems of inaccessibility and inequity in health care (Asenso-Okyere et al., 1998). The financing response by creation of insurance schemes suitable for poor people and other disadvantage groups remains weak due to design and implementation difficulties. Different health insurance schemes are emerging in Ghana (Atim et al., 2001). They include market-based arrangements and many informal risk-sharing schemes1 that present an immense opportunity to gather experience and design suitable health care financing mechanism in the long run. To increase scope and exploit economies of scale for these schemes in developing countries, recent suggestions centre on linkages between formal and informal schemes (Criel, 1998; Morduch, 1999; WHO, 2000). There is however little information in the Ghanaian context on the effects of these schemes on beneficiaries in terms of equity in financial protection against economic cost of illness and access to health care services. This study provides further empirical details for the understanding of the issues, thereby contributing to the design and implementation of universal health insurance for Ghana. Specifically it examines the extent of use of rural health insurance schemes in Ghana by poor households. The paper is organised as follows. Section 2 briefly describes the emerging health insurance schemes in Ghana and comments on two issues that affect their demand; selection and poverty. Section 3 presents the analytical models, data and findings. Discussions on the findings and recommendations end the paper. 2 Evolving health insurance schemes in Ghana Different actors finance the health care system in Ghana: government of Ghana through direct budget allocation and local government common fund; households, non-governmental organisations (NGOs) that assist religious hospitals and clinics; and the donor community.
1 Informal risk sharing involves mutual support network of members of a community, extended household, or
ethnic groups; among members of the same occupation; or between migrants of similar origin (Criel, 1998; Atim, 1999; World Bank, 2000). Those that provide any health related benefit is referred to as informal health insurance scheme in this paper. By formal health insurance scheme, the paper includes private health insurance schemes, hospital-based health insurance schemes and well-organised form of group-based associations, which are primarily set-up for medical insurance.
1
Others include employment-based arrangements in the form of direct payment of medical bills by employers or re-imbursement after employees have paid. A sketchy overview of health insurance schemes in Ghana is shown in figure 2.1. Two forms of schemes are quite distinctive. These are private insurance companies in the cities and other bigger towns and hospital-based schemes in the districts. The private insurance companies are few and are patronised by employers and few individuals. With the support of development partners various forms formal health insurance are growing in the districts (see Atim et al., 2001). At present about 42 out of 110 districts operate at least one form of district-based health insurance schemes, which are voluntary and to a greater extent integrated to health care facilities. Examples include schemes like the Dangme West District Health Insurance Scheme and Ejisu/Juaben District Health Insurance Scheme. The two oldest provider-based schemes in Ghana are the Nkoranza Community Health Insurance Scheme and the West Gonja District Health Insurance Scheme set up in 1992 and 1995 respectively. These schemes receive financial support in the form of salaries and other administrative logistics from the state and NGOs. The rest of the population, mainly in the informal sector have been using out of pocket payment for health care services. This form of payment is financed individually or through social networks. Under the economic reforms in the 1980s, public health care facilities instituted user charges for drugs and other supplies. From January 1992 drugs for instance were priced at 100% recovery level and in most cases the policy was implemented on cash down before service basis (“cash and carry”). Under the policy there is fee exemption for the under 5 and above 70 years in public health care facilities and also for some conditions like limited pregnancy expenses, leprosy and TB treatment. 2.1 Selection problems in health insurance schemes Most of the emerging health insurance schemes in rural areas are borrowing the regulatory properties of the “pilot schemes”. Few have designs that are intended to use risk-adjustment mechanisms based on age. The two strategies, risk-adjustment and regulation are usually designed to provide financial access to health care for high-risk individuals; whilst risk-adjustment provides explicit subsidies to high-risk individuals, regulating plan design creates implicit cross-subsidies from low-risk to high-risk individuals. Although they foster risk-solidarity principle, they predictable losses for the schemes on their high-risk individuals and thereby creates incentives for them to avoid them. This eventually leads to selection that adversely affects access to care, quality of care and efficiency (van de Ven and Ellis, 2000). The selection effects arise because of two actions on both sides of the insurance markets, adverse selection and cream skimming. The effects of adverse selection on access depend on the relative weights of contract costs and cross-subsidy that will be expected of low-risk individuals (Wilson, 1977; Newhouse, 1996). If contracting costs are relatively lower or if cross-subsidy expected from low-risk individuals are high, health insurance markets could be unstable or there could be a situation where high-risk individuals pay high premium for generous coverage and low-risk individuals pay low premium for stingy coverage. The implication for situations like the case in Ghana where various schemes are evolving is that coverage for non-affluent high-risk individuals could be reduced drastically. Low-risk individuals could also be denied of insurance coverage they wish if contracting costs were higher.
2
The schemes could “cream skim” or select low-risk consumers to obtain high “profits” because of regulation and high transaction costs related to premium differentiation. Experiences from advanced countries indicate that where schemes are not aware of the relevant risk factors ex-ante, they may structure their coverage for plans to appear unattractive for the high-risk individuals. They could also make plans unattractive for high-risk individuals if they know the risk factors but cannot ex-ante identify the individuals with those characteristics. Even if schemes can identify unprofitable individuals based on risk factors, they will rather focus their selection strategy directly on them when they cannot use risk-adjustment mechanism to set premium. Examples of strategies used in cream skimming include providing poor quality of care or poor services to the high–risk individuals, selective advertising and contracting with providers who operate in “healthy areas” (van de Ven and Ellis, 2000). Also when the schemes are constrained in mobilising resources they may prefer to invest the limited resources in cream skimming rather than in improving efficiency. Efficient schemes that do not cream skim applicants, may loose market share to inefficient schemes that do, resulting in welfare loss to society. 2.2 Social inclusion of rural health insurance schemes The problems of selection do not rule out formal health insurance for the poor completely because the inherent problems in self-insurance and informal insurance are equally or largely difficult to overcome. This is especially the case for Ghana because of the re-organisation of the Ghanaian economy to respond to market incentives. In the setting where poverty is pronounced the growth of formal insurance requires strong inputs from the informal economy. Robison and others (2002) emphasized this point in a discussion on the role of social capital and poverty reduction. In developing institutions like this, their argument calls for creation of formal institutions to permit strangers to exchange with each other. Also realising the role of informal institutions in organising exchanges, which require productive social capital the argument states, “… Unless the poor accept formal institutions they will be excluded from the advantages of the formal economy. However, if formal institutions are to gain attachment values from the poor, the poor must participate in their creation and maintenance and realize some benefit from their existence”. Studies on effects of health insurance on health care systems have touched on three main criteria to assess the performance of community based health financing arrangements (Jakab and Krishnan, 2002). They are resource mobilization capacity of the schemes, social inclusiveness of the schemes and the ability to protect people against cost of illness. The extensive review by Jakab and Krishnan reports among other findings that “the poorest of the poor and socially excluded groups are not automatically reached” even though the schemes are effective in reaching a large number of low-income populations who would otherwise have no financial protection against the cost of illness. It was also noted that high-income groups are frequently under represented relative to the entire population. The determinants of success in their review include the ability of the schemes to address adverse selection and rent-seeking provider behaviour, pooling, and purchasing mechanism instruments. Results from case studies in Ghana (reported in Atim 2000 and also reviewed in Jakab and Krishnan, 2002) are to some extent consistent with above findings. The review also reported a finding by Arhin (1994) that rural health insurance could serve as a viable alternative to user fees by removing the barriers to utilization of health care. These studies had relied quite heavily on data from records and also on qualitative information from focus group discussions and in-depth interviews with community leaders. This study addresses the same
3
issues with quantitative data for insured and non-insured to address selection issues in rural health insurance. 3 Estimating demand for rural health insurance The choice of a health insurance plan is driven by two sets of determinants, which are closely related, but are analytically separable- the characteristics of the plan itself, and the personal, household and community characteristics of the individual making the choice (Shaw and Ainsworth, 1995). Characteristics of plans include type of medical services offered, the degree of freedom to choose providers, the extent of compensation given (Zweifel and Breyer, 1997; Sanhueza and Ruiz-Tagle, 2002). Others are quality of care given by the chosen provider and perceived credibility of the insurer (Wiesmann and Jütting, 2001; Asenso-Okyere et al., 1997). Asymmetric information between insured and insurers and plan regulation also lead to situations where low-risk or high-risk individuals do not buy insurance, as it is socially desired. Personal characteristics underlying the decision to opt for insurance include risk aversion, price sensitivity of medical care and health status of the individual. Explanation in Cutler and Zeckhauser (2000) shows that the value of risk spreading increases with risk aversion and variability of medical spending. Zweifel and Breyer (1997) also show that in the situation of ex-post moral hazard full insurance coverage is sub optimal and the optimal rate of coinsurance increases if the price elasticity of demand increases. The necessary condition for informal risk sharing schemes to grow is the existence of voluntary reciprocity (Coate and Ravallion, 1993; Plateau, 1997). This type exchange is sustained if discount rates of people are lower. That is if their degree of relative risk aversion is higher, and the differences between their respective incomes are larger. Other important factors are the rates at which transfers are made and the nature of risks covered under each arrangement. 3.1 Analytical models In a cross-section study where one scheme or few schemes offer limited plans to individuals, it is difficult to incorporate plan characteristics in choice analysis that deal with actual data. Like most revealed-preference studies important decision variables such as premium and benefit packages do not vary. In this paper only the characteristics of individuals, households and communities are used to analyse actual decisions of households concerning participation in formal and informal risk sharing schemes and their level of participation. Sanhueza and Ruiz-Tagle (2002) used a similar technique to estimate the determinants of choice for public or private health insurance in Chile2. Household demand for health insurance There are two dependent variables for this part of the study, the number of people in a household that are members of hospital based health insurance schemes in the study area and the other is the number of adults in a household that belong to any association which provide 2 In another paper by the author (forthcoming) stated-preference data is used to accommodate both types of
variables through conjoint analysis. That analysis deals with decision in hypothetical situations, which incorporates quality of care, different levels of premium and different benefit packages to examine relative weights individuals give to these variables and also estimate willingness to pay for enhanced plans.
4

health related benefits for its members. The former is referred to as formal health insurance and the latter informal health insurance. These forms of insurance are not mutually exclusive for households and there are households who belong to both. I crudely assumed that membership in informal schemes influence the demand for formal insurance but not the reverse. Even though medical insurance and health insurance refer to related but different things they are used interchangeably in the paper. The unit of analysis in the paper is the household. However when a household decides to insure some of its members but not all, the characteristics of individual members are important for the analysis and in that case the individual member of the household is used as a unit of analysis. Case I: Household demand for formal health insurance It is assumed that a household’s demand for formal health insurance is made in two stages. At the first stage, the household decides whether to join an insurance scheme or not and at the second stage it decides how many of its members to insure. There are two regimes at the first stage, regime 1 is the ex ante demand case where the household decides to stay out completely and hence registers none of its members. The hospital insurance schemes allow households to pay individual premium by installment. However at the end of the registration period if the premium for an individual is not fully paid, that household member is considered a non-member of the scheme for that insurance year. Therefore regime 2 begins when the household decides to join the scheme and at the end of the registration period the number of fully paid members constitutes the demand for formal health insurance for the household at stage 2. The level of demand could be zero if the household is not able to pay for any members fully. Case II: Household demand for informal health insurance Household demand for informal insurance is formulated in a similar way as in case I. The associations or networks do not have any fixed time for membership, some have been around for so many years and others could collapse in some few months after they are set up. They are also noted for high degree of defection. At the time of the survey one could have observed a household with no adult as a member of such networks in two situations; (i) the household did not have an adult in any scheme for the reference period or (ii) some or all adults joined but all of them had stopped at the time the household was visited. Model for case I and case II The descriptions in the two situations can be analysed by a count data regression model, which has excess zeros. The formulation of the splitting model is as follows (see Greene, 2000): Define if regime 1 holds (household has never joined insurance) 0=R
if regime 2 holds (household ever joined) 1=R be the outcome in regime 2, which is a Poisson process *y
be the partially observed response *yRy ×= The probabilities for the observed y are given as:
)|0*(Pr)1(Pr)0(Pr)0(Pr PoissonyobRobRobyob =×=+=== )|*(Pr)1(Pr)0(Pr PoissonjyobRobjyob =×==>=
5
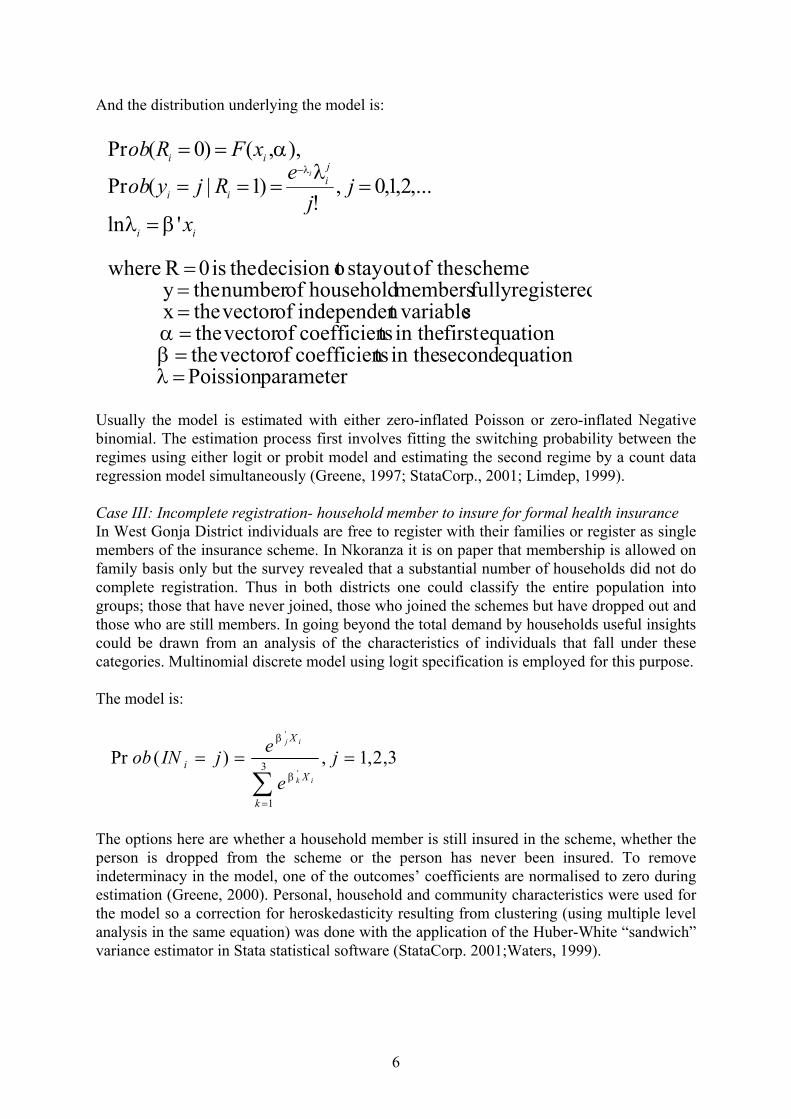
And the distribution underlying the model is:
parameterPoission equation second in the tscoefficien of vector the
equationfirst in the tscoefficien of vector the st variableindependen of vector the x
registeredfully members household ofnumber they scheme theofout stay odecision t theis 0 R where
'ln
,...2,1,0 ,!
)1|(Pr
),,()0(Pr
======
=
====
==−
λβα
βλ
λα
λ
ii
ji
ii
ii
x
jj
eRjyob
xFRobi
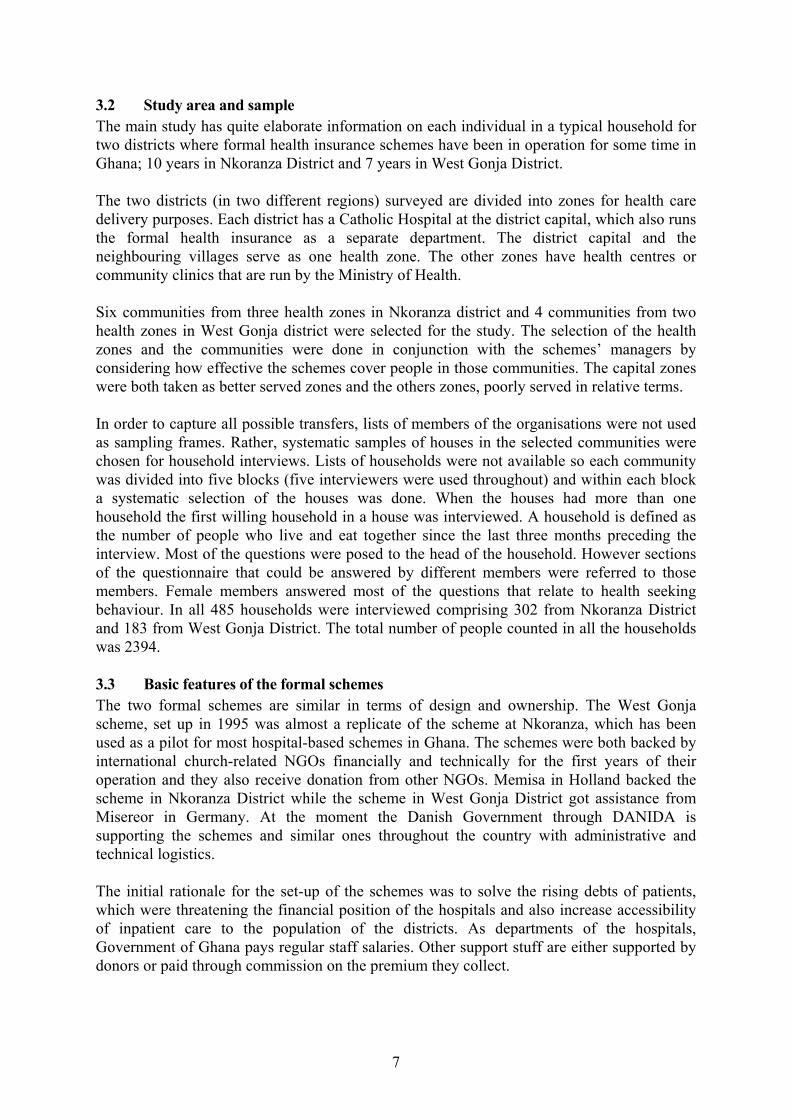
Usually the model is estimated with either zero-inflated Poisson or zero-inflated Negative binomial. The estimation process first involves fitting the switching probability between the regimes using either logit or probit model and estimating the second regime by a count data regression model simultaneously (Greene, 1997; StataCorp., 2001; Limdep, 1999). Case III: Incomplete registration- household member to insure for formal health insurance In West Gonja District individuals are free to register with their families or register as single members of the insurance scheme. In Nkoranza it is on paper that membership is allowed on family basis only but the survey revealed that a substantial number of households did not do complete registration. Thus in both districts one could classify the entire population into groups; those that have never joined, those who joined the schemes but have dropped out and those who are still members. In going beyond the total demand by households useful insights could be drawn from an analysis of the characteristics of individuals that fall under these categories. Multinomial discrete model using logit specification is employed for this purpose. The model is:
3,2,1,)(Pr 3
1
'
'
===
∑=
je
ejINob
k
X
X
iik
ij
β
β
The options here are whether a household member is still insured in the scheme, whether the person is dropped from the scheme or the person has never been insured. To remove indeterminacy in the model, one of the outcomes’ coefficients are normalised to zero during estimation (Greene, 2000). Personal, household and community characteristics were used for the model so a correction for heroskedasticity resulting from clustering (using multiple level analysis in the same equation) was done with the application of the Huber-White “sandwich” variance estimator in Stata statistical software (StataCorp. 2001;Waters, 1999).
6
3.2 Study area and sample The main study has quite elaborate information on each individual in a typical household for two districts where formal health insurance schemes have been in operation for some time in Ghana; 10 years in Nkoranza District and 7 years in West Gonja District. The two districts (in two different regions) surveyed are divided into zones for health care delivery purposes. Each district has a Catholic Hospital at the district capital, which also runs the formal health insurance as a separate department. The district capital and the neighbouring villages serve as one health zone. The other zones have health centres or community clinics that are run by the Ministry of Health. Six communities from three health zones in Nkoranza district and 4 communities from two health zones in West Gonja district were selected for the study. The selection of the health zones and the communities were done in conjunction with the schemes’ managers by considering how effective the schemes cover people in those communities. The capital zones were both taken as better served zones and the others zones, poorly served in relative terms. In order to capture all possible transfers, lists of members of the organisations were not used as sampling frames. Rather, systematic samples of houses in the selected communities were chosen for household interviews. Lists of households were not available so each community was divided into five blocks (five interviewers were used throughout) and within each block a systematic selection of the houses was done. When the houses had more than one household the first willing household in a house was interviewed. A household is defined as the number of people who live and eat together since the last three months preceding the interview. Most of the questions were posed to the head of the household. However sections of the questionnaire that could be answered by different members were referred to those members. Female members answered most of the questions that relate to health seeking behaviour. In all 485 households were interviewed comprising 302 from Nkoranza District and 183 from West Gonja District. The total number of people counted in all the households was 2394. 3.3 Basic features of the formal schemes The two formal schemes are similar in terms of design and ownership. The West Gonja scheme, set up in 1995 was almost a replicate of the scheme at Nkoranza, which has been used as a pilot for most hospital-based schemes in Ghana. The schemes were both backed by international church-related NGOs financially and technically for the first years of their operation and they also receive donation from other NGOs. Memisa in Holland backed the scheme in Nkoranza District while the scheme in West Gonja District got assistance from Misereor in Germany. At the moment the Danish Government through DANIDA is supporting the schemes and similar ones throughout the country with administrative and technical logistics. The initial rationale for the set-up of the schemes was to solve the rising debts of patients, which were threatening the financial position of the hospitals and also increase accessibility of inpatient care to the population of the districts. As departments of the hospitals, Government of Ghana pays regular staff salaries. Other support stuff are either supported by donors or paid through commission on the premium they collect.
7
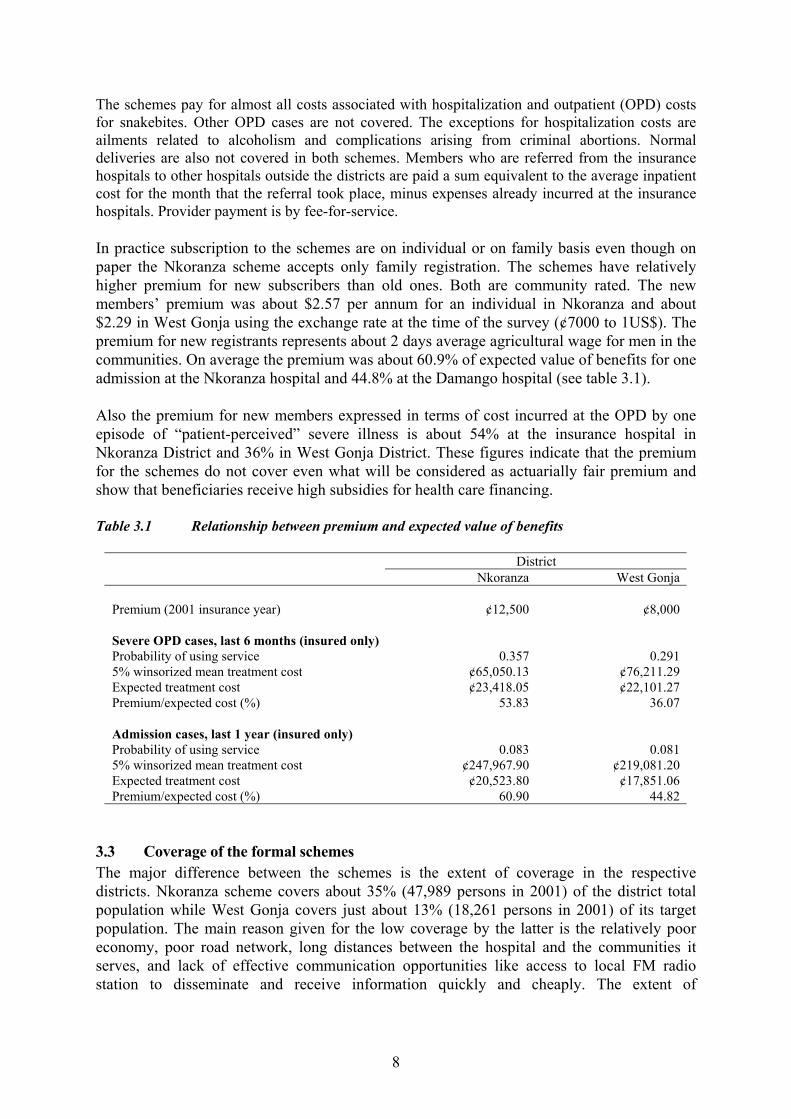
The schemes pay for almost all costs associated with hospitalization and outpatient (OPD) costs for snakebites. Other OPD cases are not covered. The exceptions for hospitalization costs are ailments related to alcoholism and complications arising from criminal abortions. Normal deliveries are also not covered in both schemes. Members who are referred from the insurance hospitals to other hospitals outside the districts are paid a sum equivalent to the average inpatient cost for the month that the referral took place, minus expenses already incurred at the insurance hospitals. Provider payment is by fee-for-service. In practice subscription to the schemes are on individual or on family basis even though on paper the Nkoranza scheme accepts only family registration. The schemes have relatively higher premium for new subscribers than old ones. Both are community rated. The new members’ premium was about $2.57 per annum for an individual in Nkoranza and about $2.29 in West Gonja using the exchange rate at the time of the survey (¢7000 to 1US$). The premium for new registrants represents about 2 days average agricultural wage for men in the communities. On average the premium was about 60.9% of expected value of benefits for one admission at the Nkoranza hospital and 44.8% at the Damango hospital (see table 3.1). Also the premium for new members expressed in terms of cost incurred at the OPD by one episode of “patient-perceived” severe illness is about 54% at the insurance hospital in Nkoranza District and 36% in West Gonja District. These figures indicate that the premium for the schemes do not cover even what will be considered as actuarially fair premium and show that beneficiaries receive high subsidies for health care financing. Table 3.1 Relationship between premium and expected value of benefits
District Nkoranza West Gonja
Premium (2001 insurance year) ¢12,500 ¢8,000 Severe OPD cases, last 6 months (insured only) Probability of using service 0.357 0.291 5% winsorized mean treatment cost ¢65,050.13 ¢76,211.29 Expected treatment cost ¢23,418.05 ¢22,101.27 Premium/expected cost (%) 53.83 36.07 Admission cases, last 1 year (insured only) Probability of using service 0.083 0.081 5% winsorized mean treatment cost ¢247,967.90 ¢219,081.20 Expected treatment cost ¢20,523.80 ¢17,851.06 Premium/expected cost (%) 60.90 44.82
3.3 Coverage of the formal schemes The major difference between the schemes is the extent of coverage in the respective districts. Nkoranza scheme covers about 35% (47,989 persons in 2001) of the district total population while West Gonja covers just about 13% (18,261 persons in 2001) of its target population. The main reason given for the low coverage by the latter is the relatively poor economy, poor road network, long distances between the hospital and the communities it serves, and lack of effective communication opportunities like access to local FM radio station to disseminate and receive information quickly and cheaply. The extent of
8
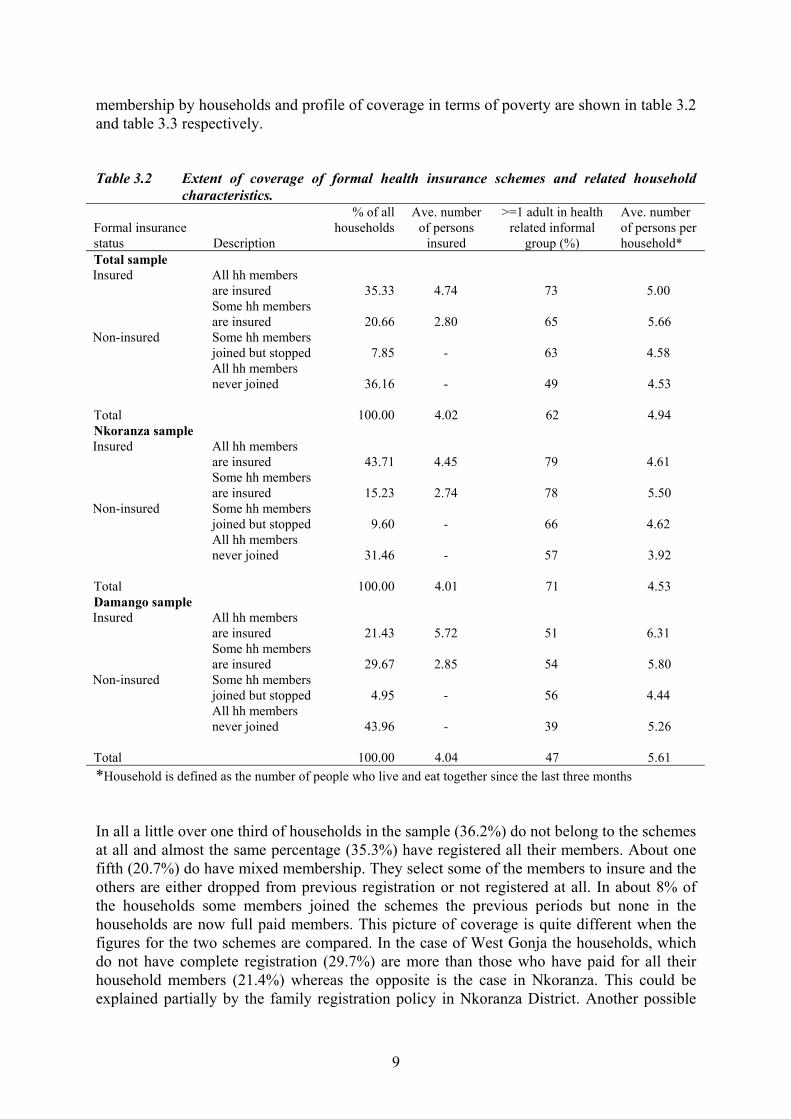
membership by households and profile of coverage in terms of poverty are shown in table 3.2 and table 3.3 respectively. Table 3.2 Extent of coverage of formal health insurance schemes and related household
characteristics.
Formal insurance status Description
% of all households
Ave. number of persons
insured
>=1 adult in health related informal
group (%)
Ave. number of persons per household*
Total sample All hh members are insured 35.33 4.74 73 5.00
Insured
Some hh members are insured 20.66 2.80 65 5.66 Some hh members joined but stopped 7.85 - 63 4.58
Non-insured
All hh members never joined 36.16 - 49 4.53
Total 100.00 4.02 62 4.94 Nkoranza sample
All hh members are insured 43.71 4.45 79 4.61
Insured
Some hh members are insured 15.23 2.74 78 5.50 Some hh members joined but stopped 9.60 - 66 4.62
Non-insured
All hh members never joined 31.46 - 57 3.92
Total 100.00 4.01 71 4.53 Damango sample
All hh members are insured 21.43 5.72 51 6.31
Insured
Some hh members are insured 29.67 2.85 54 5.80 Some hh members joined but stopped 4.95 - 56 4.44
Non-insured
All hh members never joined 43.96 - 39 5.26
Total 100.00 4.04 47 5.61 *Household is defined as the number of people who live and eat together since the last three months In all a little over one third of households in the sample (36.2%) do not belong to the schemes at all and almost the same percentage (35.3%) have registered all their members. About one fifth (20.7%) do have mixed membership. They select some of the members to insure and the others are either dropped from previous registration or not registered at all. In about 8% of the households some members joined the schemes the previous periods but none in the households are now full paid members. This picture of coverage is quite different when the figures for the two schemes are compared. In the case of West Gonja the households, which do not have complete registration (29.7%) are more than those who have paid for all their household members (21.4%) whereas the opposite is the case in Nkoranza. This could be explained partially by the family registration policy in Nkoranza District. Another possible
9
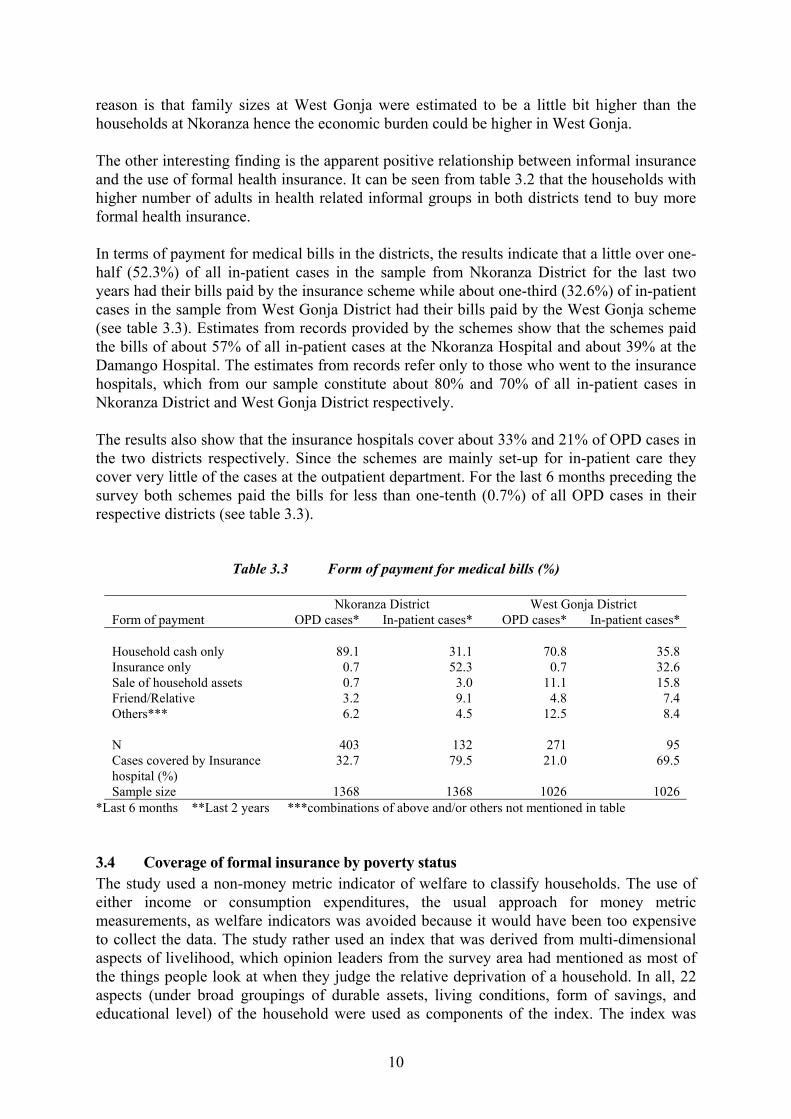
reason is that family sizes at West Gonja were estimated to be a little bit higher than the households at Nkoranza hence the economic burden could be higher in West Gonja. The other interesting finding is the apparent positive relationship between informal insurance and the use of formal health insurance. It can be seen from table 3.2 that the households with higher number of adults in health related informal groups in both districts tend to buy more formal health insurance. In terms of payment for medical bills in the districts, the results indicate that a little over one-half (52.3%) of all in-patient cases in the sample from Nkoranza District for the last two years had their bills paid by the insurance scheme while about one-third (32.6%) of in-patient cases in the sample from West Gonja District had their bills paid by the West Gonja scheme (see table 3.3). Estimates from records provided by the schemes show that the schemes paid the bills of about 57% of all in-patient cases at the Nkoranza Hospital and about 39% at the Damango Hospital. The estimates from records refer only to those who went to the insurance hospitals, which from our sample constitute about 80% and 70% of all in-patient cases in Nkoranza District and West Gonja District respectively. The results also show that the insurance hospitals cover about 33% and 21% of OPD cases in the two districts respectively. Since the schemes are mainly set-up for in-patient care they cover very little of the cases at the outpatient department. For the last 6 months preceding the survey both schemes paid the bills for less than one-tenth (0.7%) of all OPD cases in their respective districts (see table 3.3).
Table 3.3 Form of payment for medical bills (%)
Nkoranza District West Gonja District Form of payment OPD cases* In-patient cases* OPD cases* In-patient cases* Household cash only 89.1 31.1 70.8 35.8 Insurance only 0.7 52.3 0.7 32.6 Sale of household assets 0.7 3.0 11.1 15.8 Friend/Relative 3.2 9.1 4.8 7.4 Others*** 6.2 4.5 12.5 8.4 N 403 132 271 95 Cases covered by Insurance hospital (%)
32.7 79.5 21.0 69.5
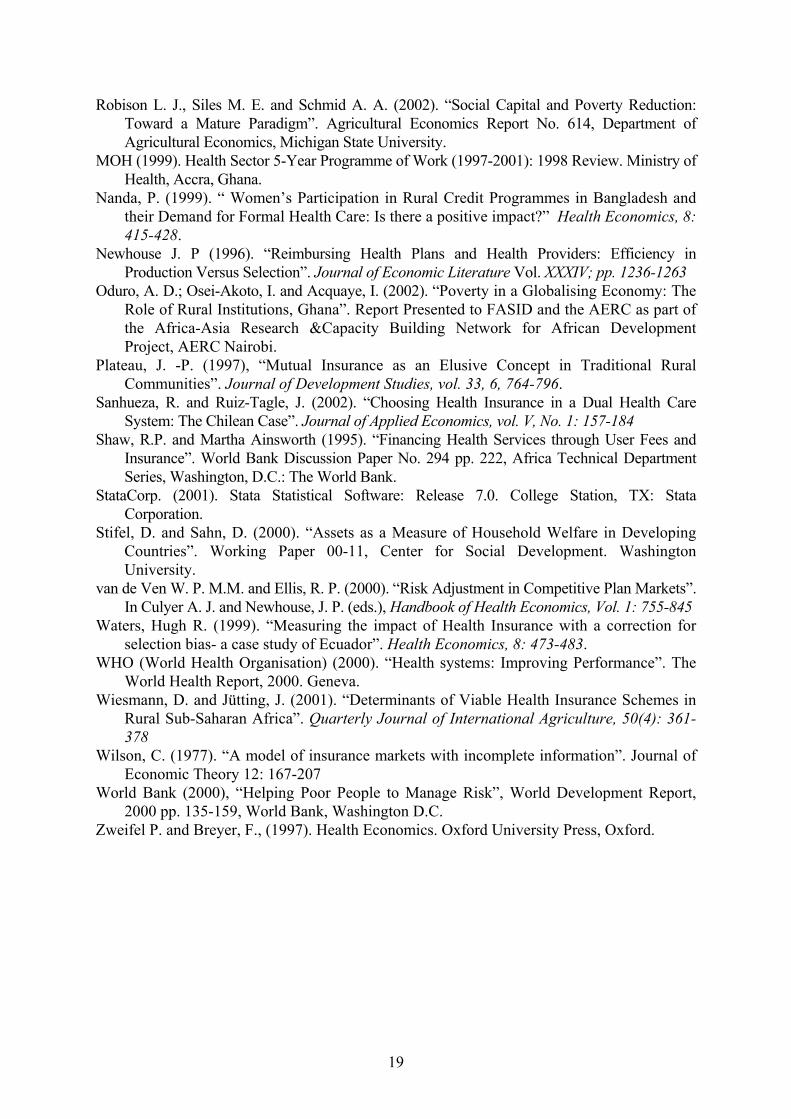
Sample size 1368 1368 1026 1026 *Last 6 months **Last 2 years ***combinations of above and/or others not mentioned in table 3.4 Coverage of formal insurance by poverty status The study used a non-money metric indicator of welfare to classify households. The use of either income or consumption expenditures, the usual approach for money metric measurements, as welfare indicators was avoided because it would have been too expensive to collect the data. The study rather used an index that was derived from multi-dimensional aspects of livelihood, which opinion leaders from the survey area had mentioned as most of the things people look at when they judge the relative deprivation of a household. In all, 22 aspects (under broad groupings of durable assets, living conditions, form of savings, and educational level) of the household were used as components of the index. The index was
10
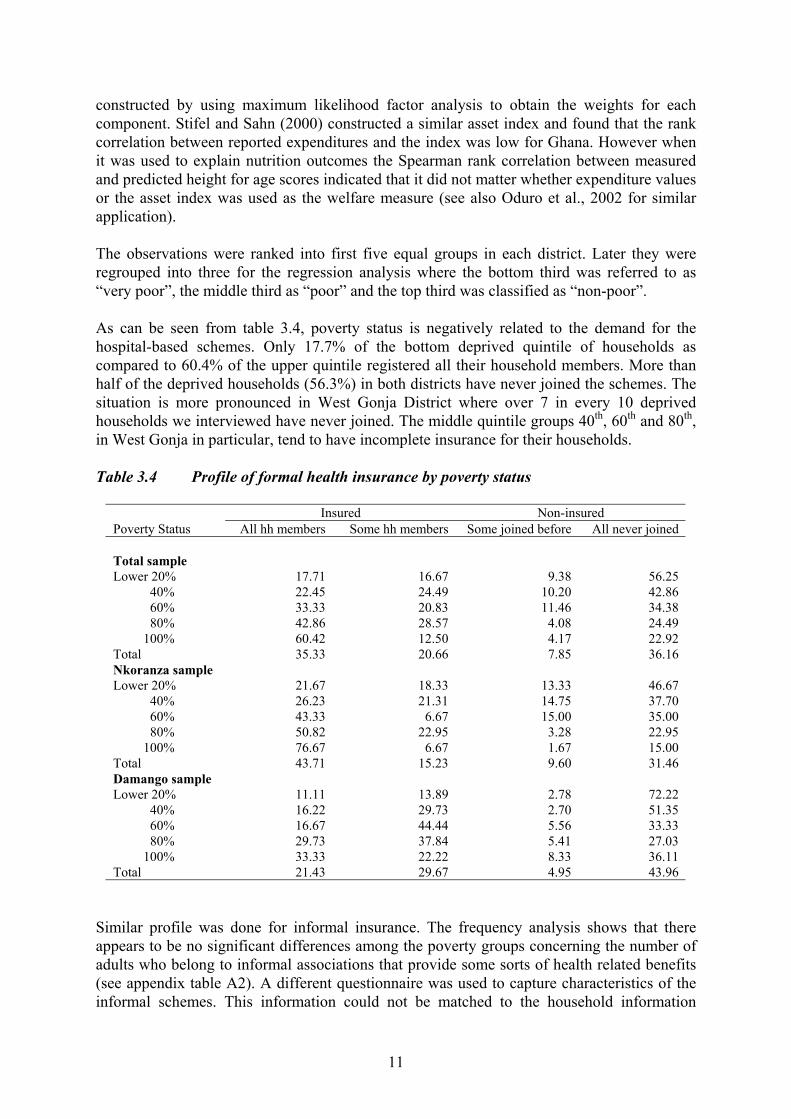
constructed by using maximum likelihood factor analysis to obtain the weights for each component. Stifel and Sahn (2000) constructed a similar asset index and found that the rank correlation between reported expenditures and the index was low for Ghana. However when it was used to explain nutrition outcomes the Spearman rank correlation between measured and predicted height for age scores indicated that it did not matter whether expenditure values or the asset index was used as the welfare measure (see also Oduro et al., 2002 for similar application). The observations were ranked into first five equal groups in each district. Later they were regrouped into three for the regression analysis where the bottom third was referred to as “very poor”, the middle third as “poor” and the top third was classified as “non-poor”. As can be seen from table 3.4, poverty status is negatively related to the demand for the hospital-based schemes. Only 17.7% of the bottom deprived quintile of households as compared to 60.4% of the upper quintile registered all their household members. More than half of the deprived households (56.3%) in both districts have never joined the schemes. The situation is more pronounced in West Gonja District where over 7 in every 10 deprived households we interviewed have never joined. The middle quintile groups 40th, 60th and 80th, in West Gonja in particular, tend to have incomplete insurance for their households. Table 3.4 Profile of formal health insurance by poverty status
Insured Non-insured Poverty Status All hh members Some hh members Some joined before All never joined Total sample Lower 20% 17.71 16.67 9.38 56.25 40% 22.45 24.49 10.20 42.86 60% 33.33 20.83 11.46 34.38 80% 42.86 28.57 4.08 24.49 100% 60.42 12.50 4.17 22.92 Total 35.33 20.66 7.85 36.16 Nkoranza sample Lower 20% 21.67 18.33 13.33 46.67 40% 26.23 21.31 14.75 37.70 60% 43.33 6.67 15.00 35.00 80% 50.82 22.95 3.28 22.95 100% 76.67 6.67 1.67 15.00 Total 43.71 15.23 9.60 31.46 Damango sample Lower 20% 11.11 13.89 2.78 72.22 40% 16.22 29.73 2.70 51.35 60% 16.67 44.44 5.56 33.33 80% 29.73 37.84 5.41 27.03 100% 33.33 22.22 8.33 36.11 Total 21.43 29.67 4.95 43.96
Similar profile was done for informal insurance. The frequency analysis shows that there appears to be no significant differences among the poverty groups concerning the number of adults who belong to informal associations that provide some sorts of health related benefits (see appendix table A2). A different questionnaire was used to capture characteristics of the informal schemes. This information could not be matched to the household information
11
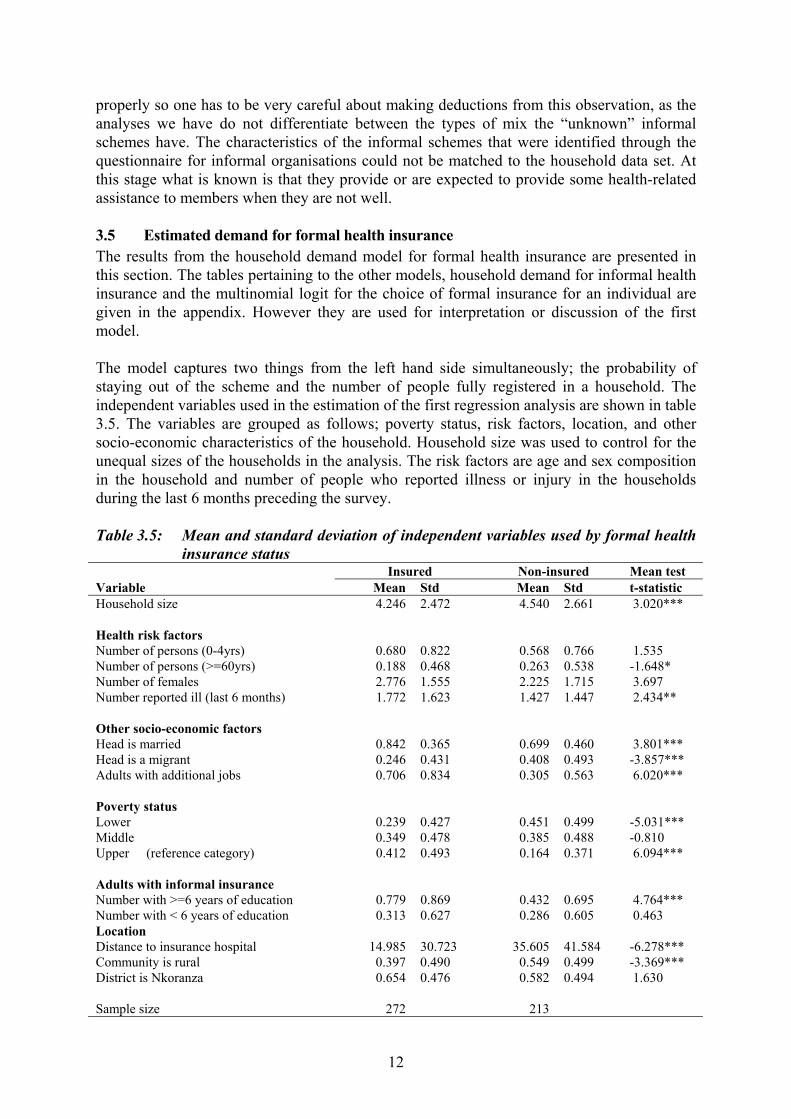
properly so one has to be very careful about making deductions from this observation, as the analyses we have do not differentiate between the types of mix the “unknown” informal schemes have. The characteristics of the informal schemes that were identified through the questionnaire for informal organisations could not be matched to the household data set. At this stage what is known is that they provide or are expected to provide some health-related assistance to members when they are not well. 3.5 Estimated demand for formal health insurance The results from the household demand model for formal health insurance are presented in this section. The tables pertaining to the other models, household demand for informal health insurance and the multinomial logit for the choice of formal insurance for an individual are given in the appendix. However they are used for interpretation or discussion of the first model. The model captures two things from the left hand side simultaneously; the probability of staying out of the scheme and the number of people fully registered in a household. The independent variables used in the estimation of the first regression analysis are shown in table 3.5. The variables are grouped as follows; poverty status, risk factors, location, and other socio-economic characteristics of the household. Household size was used to control for the unequal sizes of the households in the analysis. The risk factors are age and sex composition in the household and number of people who reported illness or injury in the households during the last 6 months preceding the survey. Table 3.5: Mean and standard deviation of independent variables used by formal health
insurance status Insured Non-insured Mean test Variable Mean Std Mean Std t-statistic Household size 4.246 2.472 4.540 2.661 3.020*** Health risk factors Number of persons (0-4yrs) 0.680 0.822 0.568 0.766 1.535 Number of persons (>=60yrs) 0.188 0.468 0.263 0.538 -1.648* Number of females 2.776 1.555 2.225 1.715 3.697 Number reported ill (last 6 months) 1.772 1.623 1.427 1.447 2.434** Other socio-economic factors Head is married 0.842 0.365 0.699 0.460 3.801*** Head is a migrant 0.246 0.431 0.408 0.493 -3.857*** Adults with additional jobs 0.706 0.834 0.305 0.563 6.020*** Poverty status Lower � 0.239 0.427 0.451 0.499 -5.031*** Middle � 0.349 0.478 0.385 0.488 -0.810 Upper � (reference category) 0.412 0.493 0.164 0.371 6.094*** Adults with informal insurance Number with >=6 years of education 0.779 0.869 0.432 0.695 4.764*** Number with < 6 years of education 0.313 0.627 0.286 0.605 0.463 Location Distance to insurance hospital 14.985 30.723 35.605 41.584 -6.278*** Community is rural 0.397 0.490 0.549 0.499 -3.369*** District is Nkoranza 0.654 0.476 0.582 0.494 1.630 Sample size 272 213
12
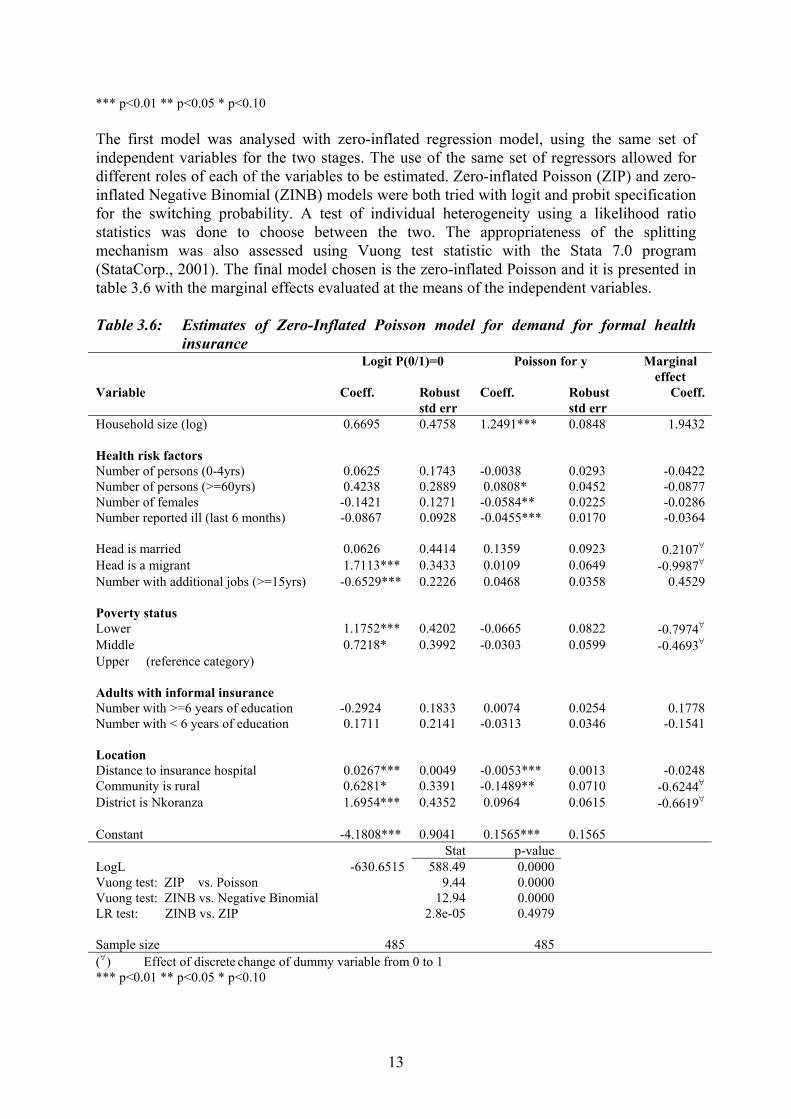
*** p<0.01 ** p<0.05 * p<0.10 The first model was analysed with zero-inflated regression model, using the same set of independent variables for the two stages. The use of the same set of regressors allowed for different roles of each of the variables to be estimated. Zero-inflated Poisson (ZIP) and zero-inflated Negative Binomial (ZINB) models were both tried with logit and probit specification for the switching probability. A test of individual heterogeneity using a likelihood ratio statistics was done to choose between the two. The appropriateness of the splitting mechanism was also assessed using Vuong test statistic with the Stata 7.0 program (StataCorp., 2001). The final model chosen is the zero-inflated Poisson and it is presented in table 3.6 with the marginal effects evaluated at the means of the independent variables. Table 3.6: Estimates of Zero-Inflated Poisson model for demand for formal health
insurance Logit P(0/1)=0 Poisson for y Marginal
effect Variable Coeff. Robust
std err Coeff. Robust
std err Coeff.
Household size (log) 0.6695 0.4758 1.2491*** 0.0848 1.9432 Health risk factors Number of persons (0-4yrs) 0.0625 0.1743 -0.0038 0.0293 -0.0422 Number of persons (>=60yrs) 0.4238 0.2889 0.0808* 0.0452 -0.0877 Number of females -0.1421 0.1271 -0.0584** 0.0225 -0.0286 Number reported ill (last 6 months) -0.0867 0.0928 -0.0455*** 0.0170 -0.0364 Head is married 0.0626 0.4414 0.1359 0.0923 0.2107∀ Head is a migrant 1.7113*** 0.3433 0.0109 0.0649 -0.9987∀ Number with additional jobs (>=15yrs) -0.6529*** 0.2226 0.0468 0.0358 0.4529 Poverty status Lower � 1.1752*** 0.4202 -0.0665 0.0822 -0.7974∀ Middle � 0.7218* 0.3992 -0.0303 0.0599 -0.4693∀ Upper � (reference category) Adults with informal insurance Number with >=6 years of education -0.2924 0.1833 0.0074 0.0254 0.1778 Number with < 6 years of education 0.1711 0.2141 -0.0313 0.0346 -0.1541 Location Distance to insurance hospital 0.0267*** 0.0049 -0.0053*** 0.0013 -0.0248 Community is rural 0.6281* 0.3391 -0.1489** 0.0710 -0.6244∀ District is Nkoranza 1.6954*** 0.4352 0.0964 0.0615 -0.6619∀ Constant -4.1808*** 0.9041 0.1565*** 0.1565 Stat p-value LogL -630.6515 588.49 0.0000 Vuong test: ZIP vs. Poisson 9.44 0.0000 Vuong test: ZINB vs. Negative Binomial 12.94 0.0000 LR test: ZINB vs. ZIP 2.8e-05 0.4979 Sample size 485 485 (∀) Effect of discrete change of dummy variable from 0 to 1 *** p<0.01 ** p<0.05 * p<0.10
13
On interpretation of the model, a positive sign in the first equation shows a high likelihood for the probability of no formal health insurance for the household, whereas a positive sign in the Poisson model shows that demand for a formal health insurance rises with that variable. The results indicate that probability of membership depends on poverty status, employment status, migration status and the location of the households relative to the location of the schemes. Households with adults who have additional jobs are more likely to join the scheme whilst the very poor, migrant households or households that are far from the hospitals hosting the schemes are less likely to subscribe any of their members. Households in rural areas, irrespective of the distance from the district capitals are also less likely to register their members than households in urban areas. The risk factors are not significant for explaining the likelihood of joining the schemes and the signs for age variables are different from the other risk factors. Whereas the number of children under 5 years and the number of the aged influence the likelihood of joining the insurance scheme negatively, the likelihood of joining the schemes are higher in households with more females or higher for households with probability of reporting illness. On the level of demand for the formal health insurance schemes, location variables are also significant but quite a different set of variables came out as significant factors. There risk factors, the number of people who reported ill during the last 6 months, the number of females and the number of adults aged 60 years or more were the additional significant factors. For those that join the schemes household with aged people register more individuals but households with high frequency of reported illness and more females are more likely to register fewer individuals. The directions of effects for the risk factors differ in the two equations. For number of children (under 5 years) the effects are similar, more children under 5 years lead to less probability of registering at least a member and less number of people being registered. However having more adults over 60 years leads to less probability of joining the schemes but leads to more number of people being registered. The opposite is the case for households with more number of females or number of people reporting illness. Such households are more likely to join the schemes but they register less number of persons. When the effects of the 2 equations are combined the marginal effects of the risk factors are all negative implying that high-risk households do not get the desired number of formal insurance. It is also interesting to note that once households join the schemes their economic status relative to other households in their villages do not determine the number of household members to register. The implication is that rich or poor, the households do incomplete registration. 3.6 Discussions and recommendations Methods The sampling methods applied in this study makes generalisation of the results to all the rural health insurance schemes quite difficult. Ideally more of the schemes with different design features should have been studied to see which institutional characteristics could serve the interest of the poor better. The other schemes have not existed for long and the time frame for this study was too short to do extensive sampling. Despite this fact, the findings are relevant for most districts in Ghana that have borrowed or will be borrowing this form of rural health insurance.
14

Rural households and demand for formal health insurance The two location variables, distance to the insurance hospital and whether the household lives in a rural area happen to be the only variables that significantly affect both the probability of joining a formal health insurance scheme and the level of demand. The overall marginal effect of the rural variable for example indicates that on average rural households register 0.624 persons than urban households, implying that if households in urban areas register 1000 people, households in rural areas will register about 376 people. This is expected particularly because of the distribution of health care facilities in rural areas and the benefit package of the schemes. The closest health care facilities for the rural households are the health centres, which most of them use as first contact points. These facilities are usually run by medical assistants and do not have simple equipment for laboratory investigations. Most of the cases they handle are primary health care and hence patients do not spend as much as people who utilise the hospitals, even though the ailments could be similar. The implication is that the expectations about costs of care for rural households are much lower. A related disincentive factor for households in distant locations is the restriction to use only the insurance hospitals at the district capital. The implication is that the schemes or similar ones are likely to loose substantial members if alternative insurers enter their coverage area and cover OPD services at affordable premium. Also the insurance schemes do not pay for any costs at the health centres even if the costs are higher. Thus whilst the use of primarily health care facilities is good for gate-keeping purposes for the insurance schemes, they at same time reduce the perception about the usefulness of the schemes for the rural households. Also as hospitalisation insurance policy, most of the costs incurred at the outpatients department of the insurance hospitals are pushed to the households, making the total benefit package less attractive. The solution to this problem is not simple. Expansion of the benefit package could lead to higher premium if the pool is not large enough and external health care facilities could also abuse this option if proper control or appropriate contracting instruments are not put in place. Also setting up laboratory facilities in rural areas for example, need state or NGO support since that could be difficult for the schemes to do. However with the growth of insurance for government and other formal sector workers, the subsidies formal sector workers used to get in urban areas could be channelled to develop rural health infrastructure and at least improve the quality of care in such areas. Also for ailments that end up at the insurance hospitals there should be a consideration to cover the costs of at least laboratory investigations at the OPD level. As provider-based schemes with semi-autonomous functions it would be less difficult for the schemes to control abuses by patients and hospital staff. Demand side cost sharing will be needed with the suggested expansion in benefit to minimise moral hazard. Selection problems in emerging rural health insurance schemes The results also indicate that there is high degree of selection. High-risk households do not get the desired level of insurance. It is a bit more complicated to explain the source of this selection. Information asymmetry between consumers and the insurers cannot be main reason for this selection problem and hence it could be far from correct to say that the pool of the schemes is small because of high degree of adverse selection. In that case one would have expected low-risk households to buy less insurance. The results of the demand for informal schemes and the individual demand model confirm this point; the high-risk households are more likely to join informal health insurance schemes and an individual is more likely to be
15
withdrawn from the formal scheme the higher the number of high-risk individuals the household has (see appendix tables A4 and A5). Even though the schemes cover all hospitalisation costs one could argue that the schemes are to some extent stingy for high-risk households. Hospitalisation is a low-frequency event; in the two districts the probability for its about 8% for all insured (see table 3.1). Most OPD costs are excluded and there are reasons to believe that the schemes do cream skim for low-risk individuals; the premium is low, they do not have any risk-adjustment mechanism and they are not allowed to institute co-payments to control moral hazard. So one of the ways for the managers to sustain the pool without external assistance is to employ techniques to discourage high-risk individuals or to focus their attention on attracting only low-risk individuals. Most respondents were particularly against the idea of detaining patients at the recovery ward for almost 23 hours and asking them to go home and come for review later. Care should be taken in drawing implications from the results concerning selection problems. The fact that high-risk households do not register more people does not mean that high-risk individuals are not registered. For example results from table A5 in the appendix indicate that at the individual level households with more females or those with high frequency of reporting illness are more likely to withdraw members but females in general are less likely to be withdrawn or stay out of the schemes. What can be deduced from here is that high risk-households register less people but those they register are more likely to be high-risk individuals. This happens because of the difficulty the schemes face to implement family registration. Possible remedies to minimise the selection problems include applying simplistic risk-adjustment to set premium, using risk-sharing mechanism on the supply side of the market and varying the insurance plans they sell for people with different health risks. In particular, one way to enforce family registration is to design a basic plan for all household members that register but allow the households to have generous but subsidised plans for high-risk individuals. These issues need further investigation. Effects of poverty on demand for rural health insurance The estimated marginal effects shown in table 3.4 imply that on average the very poor households register about 0.797 less individuals than the non-poor. This means that if the non-poor households register 1000 individuals in the surveyed communities, the very poor households will register only 203 individuals. This is mainly because many of the poor households do not register at all. Even for participation in the informal schemes, the results from the demand for informal health insurance (see appendix table A4) indicate that for every 1000 individuals registered in non-poor households the corresponding figure for very poor and poor households will be 812 and 730 respectively. This finding implies a remarkably poor social inclusion of the hospital-based schemes, especially in rural areas and it is understandable why in total many people in the districts are not covered by the schemes. Particularly notable is the case in West Gonja District, which is situated in the rural Savannah ecological zone where poverty is more pronounced in Ghana (Ghana Statistical Service, 2000). Perhaps the most challenging issue is how to include the poorest of the poor in such schemes. Several suggestions have been put forward; setting aside health fund to pay premium for the poor, exempting the aged from paying premium, encouraging the poor to use informal
16
schemes and others. Experience in Ghana show that exemptions do not work well mainly because it is often difficult to identify the poor and central government delays a lot in reimbursing providers who exempt them (Asenso-Okyere et al., 2001; Atim et al., 2001). How the informal schemes operate now does not favour the poor, but if they are organised well they could be used as a medium of identifying the poor for state support. Currently, church groups dominate them and they are predominantly urban based (see appendix table A4). Scaling up or linking informal risk sharing schemes to formal health insurance schemes The role of informal health insurance on formal health insurance is more pronounced on the effects on probability of joining the schemes than the level of demand. The nature of the relationship depends on the level of education of those who belong to the informal groups in the household. The parametized effects of informal insurance show that probability of joining formal insurance increases with number of adults in informal groups who have at least 6 years of education and decreases with those who have less than 6 years of education. This is expected as informal groups made up of more educated people will tend to have more of “a linking or a bridging social capital” than the others and hence will be in a position to be functional and better used by the formal insurance schemes (e.g. group-based registration). Other motives for joining rural health insurance schemes The study identified migration status as a very significant determinant of demand for rural health insurance. This observation needs considerable attention in further studies where migration decisions are captured quite extensively. The migrants in the survey area were more likely to stay out of the formal schemes as compared to non-migrants in both the household and individual level demand models. The same variable had very little or no contribution in the explanation of the demand for informal schemes so it cannot be said that migrants prefer informal schemes to formal schemes. The only explanation that can be given in this study is the sense of ownership the people have for the schemes. Throughout the survey period the team observed that people who consider themselves as indigenes of the two districts (both insured and non-insured), were proud to refer to their districts as “pioneers” for a concept that is going to be nationally used. The limitation in the study that can easily be corrected in further studies is an omission of length of stay in the district as a variable. That was not captured explicitly in the questionnaire. Households that have been leaving in the districts for less than 6 months were rather excluded from the interviews. To attract migrants the periodic advertisements should go a little bit beyond ownership and explain to inhabitants that insurance is important for everyone so far as the person is expected to stay in the district even one day after the waiting period to get benefits is over. 3.7 Conclusion The study looked at the demand for two rural health insurance schemes that are voluntary and to a greater extent integrated to health care facilities. It examined how the schemes cover people who need the advantages of insurance most; poor people and high-risk individuals, who would have found it difficult to pay for health care services in the absence of insurance. The results from this study and records from the schemes indicate that they perform quite well in terms of paying hospitalisation bills for beneficiaries. However the findings portray a remarkable exclusion of the poorest of the poor, even from other forms of risk-sharing
17
arrangements in the informal sector. Apart from poverty, the analysis also reveals that high-risk households are less likely to participate fully in the insurance schemes suggesting limitations in the design of the schemes. Among other suggestions, the study recommends that the schemes should be redesigned to benefit rural and poor households more than it is now. References Arhin, D. (1994). The Health Card Insurance Scheme in Burundi: A social asset or a non-
viable venture? Social Science and Medicine, 39 (6): 861-870. Asenso-Okyere W. K., Osei-Akoto I., Anum A., and Adukonu A. (1999). ”The Behaviour of
Health Workers in an Era of Cost Sharing: A Study of Ghana’s Cash and Carry System”. Tropical Medicine and International Health 4(8).
Asenso-Okyere W.K., Anum A., Osei-Akoto, I. and Adukonu A. (1998). "Cost recovery in Ghana: Are there any changes in health care seeking behaviour? Health Policy and Planning, 13(2).
Asenso-Okyere, W. K., Osei-Akoto, I., Anum, A. and Appiah, E. N. (1997). “Willingness to pay for health insurance in a developing economy. A pilot study of the informal sector of Ghana using contingent valuation”. Health Policy 42: 223-237.
Atim, C. (1999). “Social movements and health insurance: a critical evaluation of voluntary, non-profit insurance schemes with case studies from Ghana and Cameroon, Social Science & Medicine 48: 881-896
Atim, C. and Sock, M. (2000). An External Evaluation of the Nkoranza Community Financing Health Insurance Scheme, Ghana. Technical Report No. 50. Bethesda, MD. Partnership for Health for Health Reform, Abt. Associates Inc.
Atim, C., Grey S., Apoya P. Anie, S. J. and Aikins, M. (2001). “A Survey of Health Financing Schemes in Ghana”. Bethesda, MD: The Partners for Health Reformplus Project, Abt Associates Inc.
Coate , S. and M. Ravallion, (1993). “Reciprocity without Commitment: Characterisation and Performance of Informal Insurance Arrangements”, Journal of Development Economics, 40, 1-24.
Criel, B. (1998). “District-based Health Insurance in Sub-Saharan Africa. Part 1: From theory to Practice”. Studies in Health Services Organisation and Policy, 9. Antwerp, Belgium.
Cutler David. M. and Zeckhauser Richard, (2000). “The Anatomy of Health Insurance”. The Handbook of Health Economics, Vol. 1
Ghana Statistical Service, (2000). “Ghana Living Standards Survey, Report of the Fourth Round (GLSS4)”, Ghana Statistical Service, Accra.
Ghana Statistical Service (2000). “Poverty Trends in Ghana in the 1990s”, Ghana Statistical Service, Accra.
Greene, W.H., (2000). Econometric Analysis. Fourth Ed., New York: Macmillan Publishing Company, New York.
Greene, W. H., (1997). “FIML Estimation of Sample Selection Models for Count Data”. Stern School of Business, New York University.
Jakab M. and Krishnan C, (2002). “Community Involvement in Health Care Financing: Impact, Strengths and Weaknessess. A Synthesis of the Literature. (Forthcoming)
Jütting, J. (1999), “Strengthening Social Security Systems in Rural Areas of Developing Countries, ZEF Discussion Paper No.9, Center for Development Research, University of Bonn.
Limdep. (1999). Limdep Econometric Software, version 7.0
18
Robison L. J., Siles M. E. and Schmid A. A. (2002). “Social Capital and Poverty Reduction: Toward a Mature Paradigm”. Agricultural Economics Report No. 614, Department of Agricultural Economics, Michigan State University.
MOH (1999). Health Sector 5-Year Programme of Work (1997-2001): 1998 Review. Ministry of Health, Accra, Ghana.
Nanda, P. (1999). “ Women’s Participation in Rural Credit Programmes in Bangladesh and their Demand for Formal Health Care: Is there a positive impact?” Health Economics, 8: 415-428.
Newhouse J. P (1996). “Reimbursing Health Plans and Health Providers: Efficiency in Production Versus Selection”. Journal of Economic Literature Vol. XXXIV; pp. 1236-1263
Oduro, A. D.; Osei-Akoto, I. and Acquaye, I. (2002). “Poverty in a Globalising Economy: The Role of Rural Institutions, Ghana”. Report Presented to FASID and the AERC as part of the Africa-Asia Research &Capacity Building Network for African Development Project, AERC Nairobi.
Plateau, J. -P. (1997), “Mutual Insurance as an Elusive Concept in Traditional Rural Communities”. Journal of Development Studies, vol. 33, 6, 764-796.
Sanhueza, R. and Ruiz-Tagle, J. (2002). “Choosing Health Insurance in a Dual Health Care System: The Chilean Case”. Journal of Applied Economics, vol. V, No. 1: 157-184
Shaw, R.P. and Martha Ainsworth (1995). “Financing Health Services through User Fees and Insurance”. World Bank Discussion Paper No. 294 pp. 222, Africa Technical Department Series, Washington, D.C.: The World Bank.
StataCorp. (2001). Stata Statistical Software: Release 7.0. College Station, TX: Stata Corporation.
Stifel, D. and Sahn, D. (2000). “Assets as a Measure of Household Welfare in Developing Countries”. Working Paper 00-11, Center for Social Development. Washington University.
van de Ven W. P. M.M. and Ellis, R. P. (2000). “Risk Adjustment in Competitive Plan Markets”. In Culyer A. J. and Newhouse, J. P. (eds.), Handbook of Health Economics, Vol. 1: 755-845
Waters, Hugh R. (1999). “Measuring the impact of Health Insurance with a correction for selection bias- a case study of Ecuador”. Health Economics, 8: 473-483.
WHO (World Health Organisation) (2000). “Health systems: Improving Performance”. The World Health Report, 2000. Geneva.
Wiesmann, D. and Jütting, J. (2001). “Determinants of Viable Health Insurance Schemes in Rural Sub-Saharan Africa”. Quarterly Journal of International Agriculture, 50(4): 361-378
Wilson, C. (1977). “A model of insurance markets with incomplete information”. Journal of Economic Theory 12: 167-207
World Bank (2000), “Helping Poor People to Manage Risk”, World Development Report, 2000 pp. 135-159, World Bank, Washington D.C.
Zweifel P. and Breyer, F., (1997). Health Economics. Oxford University Press, Oxford.
19

Appendix Figure 2.1 Evolving health insurance schemes in Ghana
Legend for lines Services Payment for services Premium contribution Financial & other support
Employers Government
& donors
Private insurance firms
Informal
& comm’ty
based schemes
Hospital
based schemes
Households
Health care
facilities
20
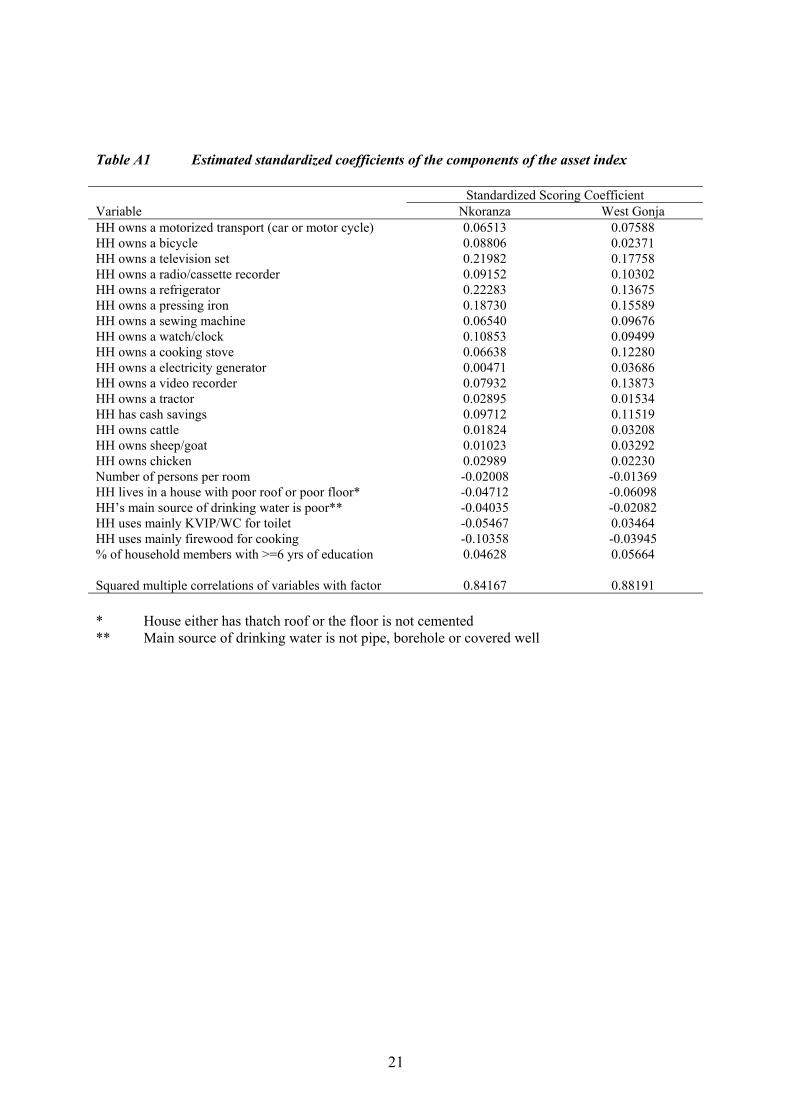
Table A1 Estimated standardized coefficients of the components of the asset index Standardized Scoring Coefficient Variable Nkoranza West Gonja HH owns a motorized transport (car or motor cycle) 0.06513 0.07588 HH owns a bicycle 0.08806 0.02371 HH owns a television set 0.21982 0.17758 HH owns a radio/cassette recorder 0.09152 0.10302 HH owns a refrigerator 0.22283 0.13675 HH owns a pressing iron 0.18730 0.15589 HH owns a sewing machine 0.06540 0.09676 HH owns a watch/clock 0.10853 0.09499 HH owns a cooking stove 0.06638 0.12280 HH owns a electricity generator 0.00471 0.03686 HH owns a video recorder 0.07932 0.13873 HH owns a tractor 0.02895 0.01534 HH has cash savings 0.09712 0.11519 HH owns cattle 0.01824 0.03208 HH owns sheep/goat 0.01023 0.03292 HH owns chicken 0.02989 0.02230 Number of persons per room -0.02008 -0.01369 HH lives in a house with poor roof or poor floor* -0.04712 -0.06098 HH’s main source of drinking water is poor** -0.04035 -0.02082 HH uses mainly KVIP/WC for toilet -0.05467 0.03464 HH uses mainly firewood for cooking -0.10358 -0.03945 % of household members with >=6 yrs of education 0.04628 0.05664 Squared multiple correlations of variables with factor 0.84167 0.88191 * House either has thatch roof or the floor is not cemented ** Main source of drinking water is not pipe, borehole or covered well
21
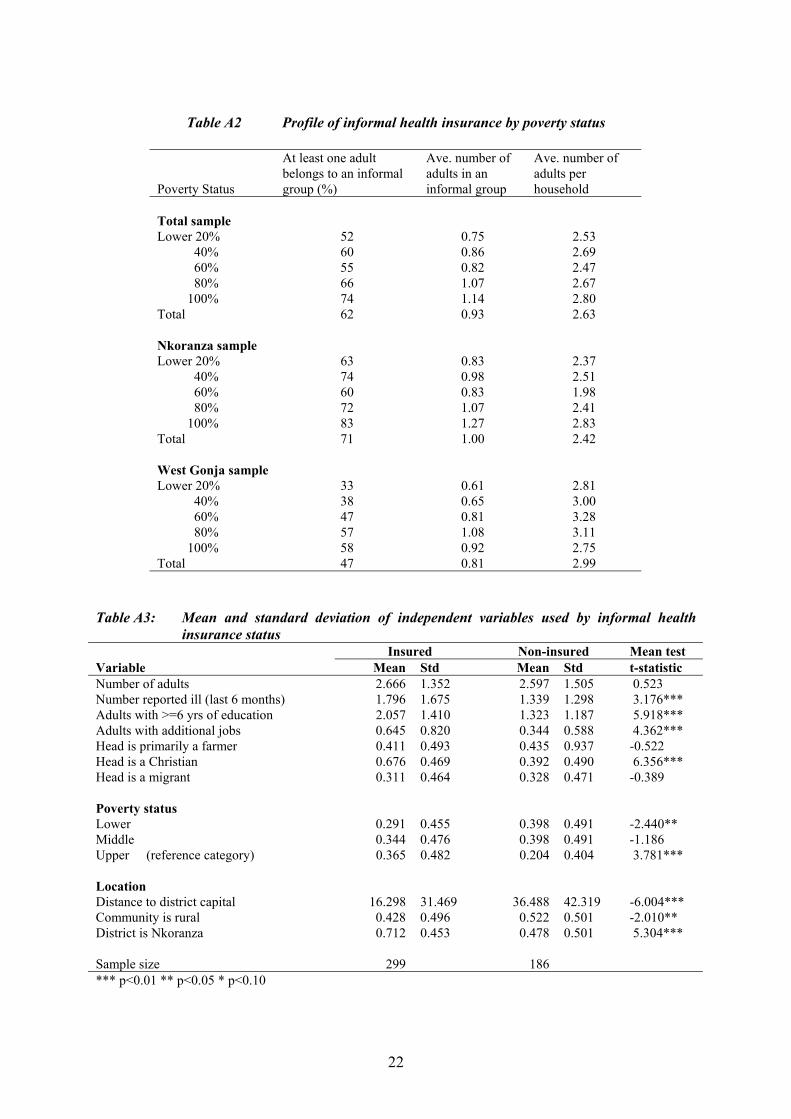
Table A2 Profile of informal health insurance by poverty status
Poverty Status
At least one adult belongs to an informal group (%)
Ave. number of adults in an informal group
Ave. number of adults per household
Total sample Lower 20% 52 0.75 2.53 40% 60 0.86 2.69 60% 55 0.82 2.47 80% 66 1.07 2.67 100% 74 1.14 2.80 Total 62 0.93 2.63 Nkoranza sample Lower 20% 63 0.83 2.37 40% 74 0.98 2.51 60% 60 0.83 1.98 80% 72 1.07 2.41 100% 83 1.27 2.83 Total 71 1.00 2.42 West Gonja sample Lower 20% 33 0.61 2.81 40% 38 0.65 3.00 60% 47 0.81 3.28 80% 57 1.08 3.11 100% 58 0.92 2.75 Total 47 0.81 2.99
Table A3: Mean and standard deviation of independent variables used by informal health
insurance status Insured Non-insured Mean test Variable Mean Std Mean Std t-statistic Number of adults 2.666 1.352 2.597 1.505 0.523 Number reported ill (last 6 months) 1.796 1.675 1.339 1.298 3.176*** Adults with >=6 yrs of education 2.057 1.410 1.323 1.187 5.918*** Adults with additional jobs 0.645 0.820 0.344 0.588 4.362*** Head is primarily a farmer 0.411 0.493 0.435 0.937 -0.522 Head is a Christian 0.676 0.469 0.392 0.490 6.356*** Head is a migrant 0.311 0.464 0.328 0.471 -0.389 Poverty status Lower � 0.291 0.455 0.398 0.491 -2.440** Middle � 0.344 0.476 0.398 0.491 -1.186 Upper � (reference category) 0.365 0.482 0.204 0.404 3.781*** Location Distance to district capital 16.298 31.469 36.488 42.319 -6.004*** Community is rural 0.428 0.496 0.522 0.501 -2.010** District is Nkoranza 0.712 0.453 0.478 0.501 5.304*** Sample size 299 186 *** p<0.01 ** p<0.05 * p<0.10
22
Table A4 Estimates of Zero-Inflated Poisson model for demand for formal health insurance Logit P(0/1)=0 Poisson for y Marginal
effect Variable Coeff Robust
std err. Coeff. Robust
std err. Coeff.
Number of adults 2.3392*** 0.7391 0.0667 0.0458 0.0618 Number reported ill (last 6 months) -4.7765** 2.2015 -0.0009 0.0252 -0.0009 Number with >=6 years of education -2.1641** 0.8947 0.0949** 0.0393 0.0879 Number with additional jobs (>=15yrs) -0.0307 0.7286 0.0096 0.0568 0.0089 Head is primarily a farmer 0.1656* 0.0909 0.1557∀ Head is a Christian -20.3654*** 3.2736 0.2697** 0.1117 0.2462∀ Head is a migrant 0.0332 0.0956 0.0310∀ Poverty status Lower � -2.8532 1.8448 -0.2105* 0.1141 -0.1886∀ Middle � -17.5249*** 5.7181 -0.3025*** 0.1046 -0.2702∀ Upper � (reference category) Location Distance to district capital 0.9543** 0.0376 -0.0039** 0.0018 -0.0037 Community is rural 0.7750 1.3718 -0.0001∀ District is Nkoranza -0.5163 1.6962 -0.2535* 0.1419 -0.2430∀ Constant -3.6004 2.2256 -0.2239 0.1725 Stat p-value LogL -252.39124 92.88 0.0000 Vuong test: ZIP vs. Poisson 3.77 0.0001 Vuong test: ZINB vs. Negative Binomial LR test: ZINB vs. ZIP Predicted P(0) 0.3958 Sample size 485 485 (∀) Effect of discrete change of dummy variable from 0 to 1 *** p<0.01 ** p<0.05 * p<0.10
23
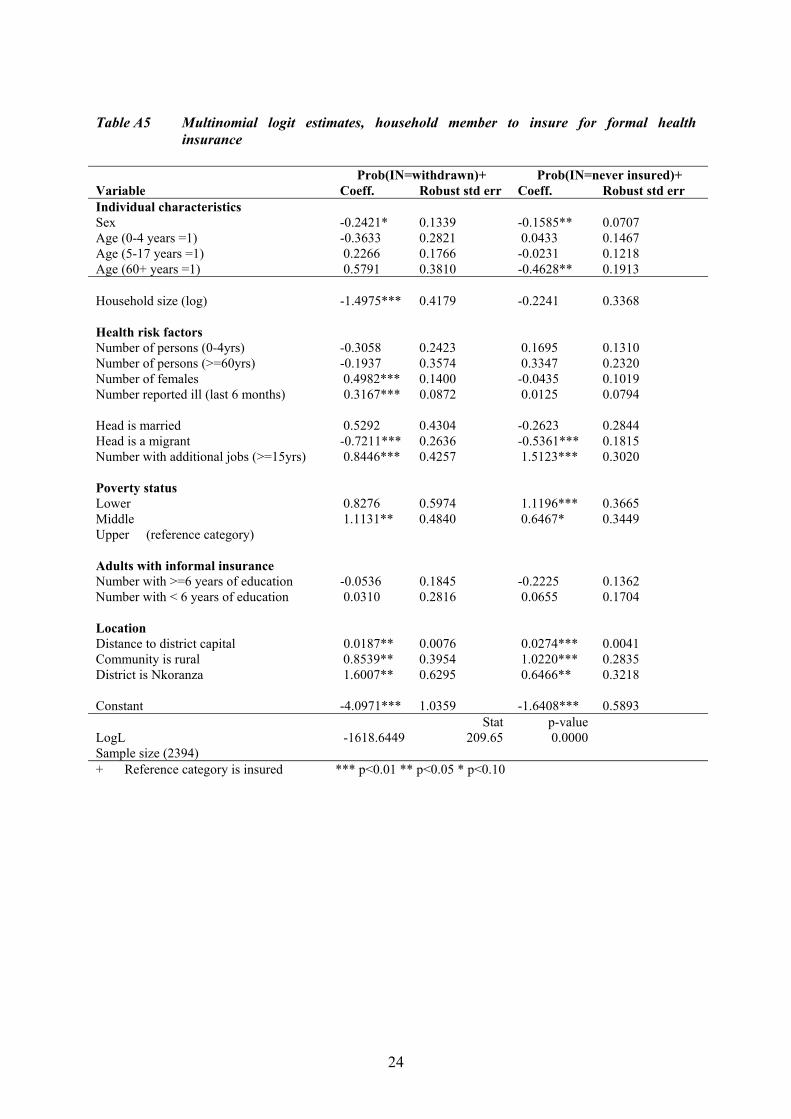
Table A5 Multinomial logit estimates, household member to insure for formal health
insurance Prob(IN=withdrawn)+ Prob(IN=never insured)+ Variable Coeff. Robust std err Coeff. Robust std err Individual characteristics Sex -0.2421* 0.1339 -0.1585** 0.0707 Age (0-4 years =1) -0.3633 0.2821 0.0433 0.1467 Age (5-17 years =1) 0.2266 0.1766 -0.0231 0.1218 Age (60+ years =1) 0.5791 0.3810 -0.4628** 0.1913 Household size (log) -1.4975*** 0.4179 -0.2241 0.3368 Health risk factors Number of persons (0-4yrs) -0.3058 0.2423 0.1695 0.1310 Number of persons (>=60yrs) -0.1937 0.3574 0.3347 0.2320 Number of females 0.4982*** 0.1400 -0.0435 0.1019 Number reported ill (last 6 months) 0.3167*** 0.0872 0.0125 0.0794 Head is married 0.5292 0.4304 -0.2623 0.2844 Head is a migrant -0.7211*** 0.2636 -0.5361*** 0.1815 Number with additional jobs (>=15yrs) 0.8446*** 0.4257 1.5123*** 0.3020 Poverty status Lower � 0.8276 0.5974 1.1196*** 0.3665 Middle � 1.1131** 0.4840 0.6467* 0.3449 Upper � (reference category) Adults with informal insurance Number with >=6 years of education -0.0536 0.1845 -0.2225 0.1362 Number with < 6 years of education 0.0310 0.2816 0.0655 0.1704 Location Distance to district capital 0.0187** 0.0076 0.0274*** 0.0041 Community is rural 0.8539** 0.3954 1.0220*** 0.2835 District is Nkoranza 1.6007** 0.6295 0.6466** 0.3218 Constant -4.0971*** 1.0359 -1.6408*** 0.5893 Stat p-value LogL -1618.6449 209.65 0.0000 Sample size (2394) + Reference category is insured *** p<0.01 ** p<0.05 * p<0.10
24