seasonal adjustment - oic-statcom · seasonal adjustment. training course on short -term business...
TRANSCRIPT
Training Course on Short -term Business Statistics,
Pakistan Bureau of Statistics, 5-7 Nov 2012Abd Latib Talib - Department of Statistics Malaysia 1
Short-term Business Statistics
Seasonal Adjustment
Training Course on Short -term Business Statistics,
Pakistan Bureau of Statistics, 5-7 Nov 2012Abd Latib Talib - Department of Statistics Malaysia2
•First Day
• Overview of BCI
• Malaysia BCI
•Time series Decomposition
• Seasonal Adjustment
• Second Day
• Indicators selection
• The Composite Index
• The Diffusion Index
Outline
Training Course on Short -term Business Statistics,
Pakistan Bureau of Statistics, 5-7 Nov 2012Abd Latib Talib - Department of Statistics Malaysia
3
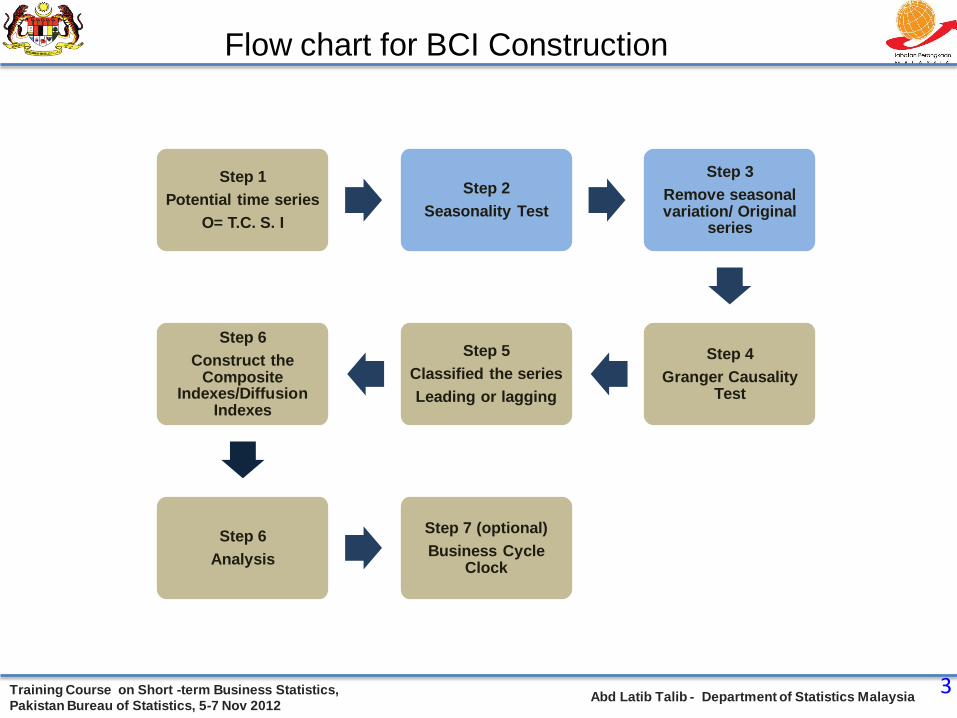
Step 1
Potential time series
O= T.C. S. I
Step 2
Seasonality Test
Step 3
Remove seasonal variation/ Original
series
Step 4
Granger Causality Test
Step 5
Classified the series
Leading or lagging
Step 6
Construct the Composite
Indexes/Diffusion Indexes
Step 6
Analysis
Step 7 (optional)
Business Cycle Clock
Flow chart for BCI Construction
Training Course on Short -term Business Statistics,
Pakistan Bureau of Statistics, 5-7 Nov 2012Abd Latib Talib - Department of Statistics Malaysia
INTRODUCTION
The time series components discussed earlier can be
separated using the decomposition method /software.
In practice, researchers only separate the seasonal
component in the data series for analysis purpose.
While, for the purpose of short-term analysis, most
researchers also separate the trend component of the
data series.
4

Training Course on Short -term Business Statistics,
Pakistan Bureau of Statistics, 5-7 Nov 2012Abd Latib Talib - Department of Statistics Malaysia
5
Seasonal factors only occur on a monthly and
quarterly time series data.
Usually, the seasonal element exist in the data of
production, sales, income/revenue and prices.
It is important to note that, not all monthly/ quarterly
time series data (ii) should be seasonal adjustment.
The seasonality test must be made before deciding
to implement a series of seasonality adjustment.
INTRODUCTION
Training Course on Short -term Business Statistics,
Pakistan Bureau of Statistics, 5-7 Nov 2012Abd Latib Talib - Department of Statistics Malaysia
6
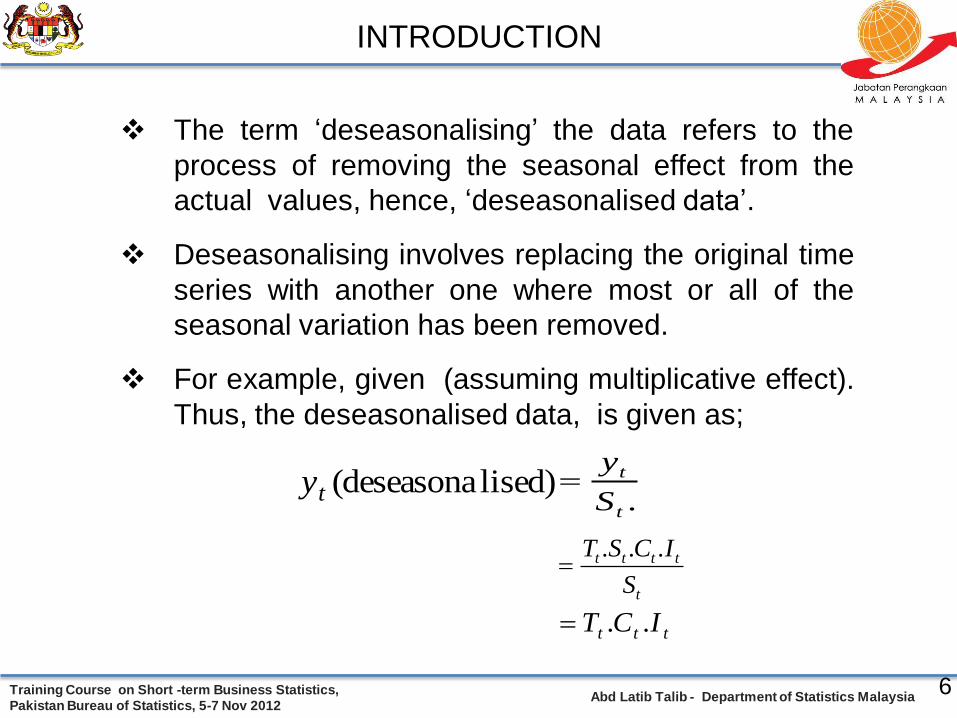
The term ‘deseasonalising’ the data refers to the
process of removing the seasonal effect from the
actual values, hence, ‘deseasonalised data’.
Deseasonalising involves replacing the original time
series with another one where most or all of the
seasonal variation has been removed.
For example, given (assuming multiplicative effect).
Thus, the deseasonalised data, is given as;
lised)(deseasonaty.t
t
S
y
t
tttt
S
ICST ...
ttt ICT ..
INTRODUCTION

Training Course on Short -term Business Statistics,
Pakistan Bureau of Statistics, 5-7 Nov 2012Abd Latib Talib - Department of Statistics Malaysia
7
Additive Assumption
Under additive assumption, deseasonalised data
is obtained by taking the difference between the
actual and the adjusted seasonal effect, that is,
tt Sy lised)(deseasona tt Sy
ttttt SICST )(
ttt ICT
INTRODUCTION
Training Course on Short -term Business Statistics,
Pakistan Bureau of Statistics, 5-7 Nov 2012Abd Latib Talib - Department of Statistics Malaysia
WHY DO WE WANT
SEASONALLY ADJUSTED DATA?
8
“…Seasonal movements can make features
difficult or impossible to see…”
Training Course on Short -term Business Statistics,
Pakistan Bureau of Statistics, 5-7 Nov 2012Abd Latib Talib - Department of Statistics Malaysia
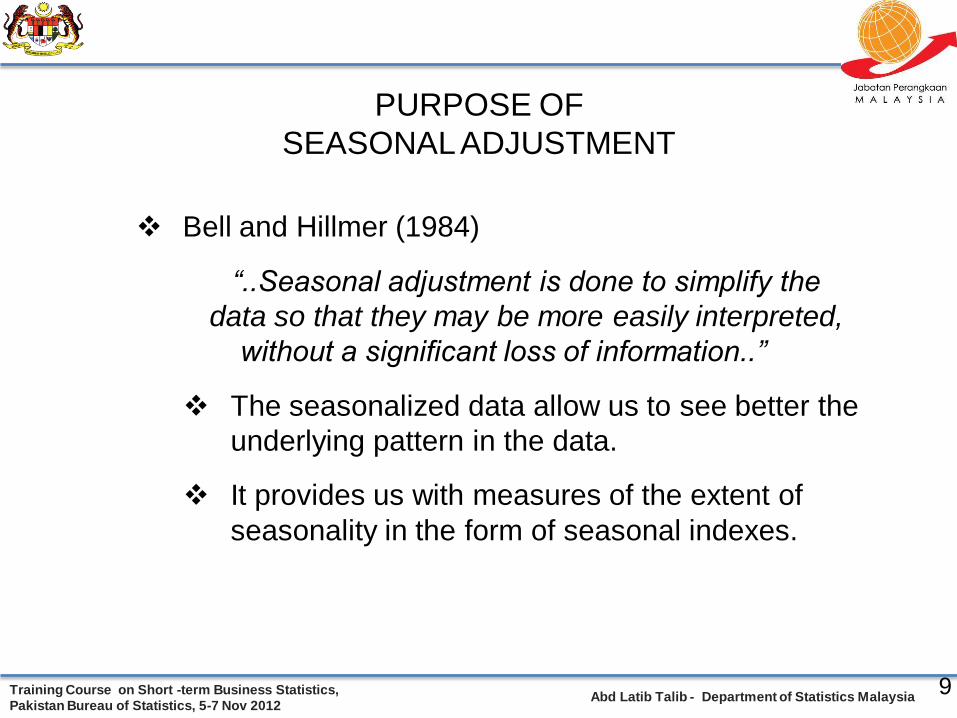
PURPOSE OF
SEASONAL ADJUSTMENT
9
Bell and Hillmer (1984)
“..Seasonal adjustment is done to simplify the
data so that they may be more easily interpreted,
without a significant loss of information..”
The seasonalized data allow us to see better the
underlying pattern in the data.
It provides us with measures of the extent of
seasonality in the form of seasonal indexes.

Training Course on Short -term Business Statistics,
Pakistan Bureau of Statistics, 5-7 Nov 2012Abd Latib Talib - Department of Statistics Malaysia
10
80
100
120
1990:01
1991:01
1992:01
1993:01
1994:01
1995:01
1996:01
1997:01
1998:01
1999:01
2000:01
2001:01
2002:01
2003:01
2004:01
2005:01
2006:01
2007:01
2008:01
2009:01
2010:01
2011:01
2012:01
P
1/ 08
T
3/ 09
P
1/ 01
T
2/ 02
P
12/ 97
T
11/ 98
Shaded areas are growth cycle recessions
P
1/ 92
T
1/ 93
P
4/ 04
T
11/ 05
Cyclical Development of Salaries and Wages (Original Series)

Training Course on Short -term Business Statistics,
Pakistan Bureau of Statistics, 5-7 Nov 2012Abd Latib Talib - Department of Statistics Malaysia
11
Cyclical Development of Salaries and Wages (Seasonally Adjusted Series)
80
100
120
1990:01
1991:01
1992:01
1993:01
1994:01
1995:01
1996:01
1997:01
1998:01
1999:01
2000:01
2001:01
2002:01
2003:01
2004:01
2005:01
2006:01
2007:01
2008:01
2009:01
2010:01
2011:01
2012:01
P
1/ 08
T
3/ 09
P
1/ 01
T
2/ 02
P
12/ 97
T
11/ 98
Shaded areas are growth cycle recessions
P
1/ 92
T
1/ 93
P
4/ 04
T
11/ 05

Training Course on Short -term Business Statistics,
Pakistan Bureau of Statistics, 5-7 Nov 2012Abd Latib Talib - Department of Statistics Malaysia
SEASONALITY TEST
USING SAS – X11 PROCEDURE
12
Probability of a Larger F is < 0.0001
Result of Seasonality Test for
Number of Investment Project Approved
Stable Seasonality Test
Source Sum of Squares DF Mean Square F Value
Between Months 8358 11 759.8 0.79
Error 355902 372 956.7
Total 364260 383
Probability of a Larger F is 0.6460
Moving Seasonality Test
Source Sum of Squares DF Mean Square F Value
Between Years 301349293 31 9720945 2.51
Error 1318291189 341 3865957
Training Course on Short -term Business Statistics,
Pakistan Bureau of Statistics, 5-7 Nov 2012Abd Latib Talib - Department of Statistics Malaysia
13
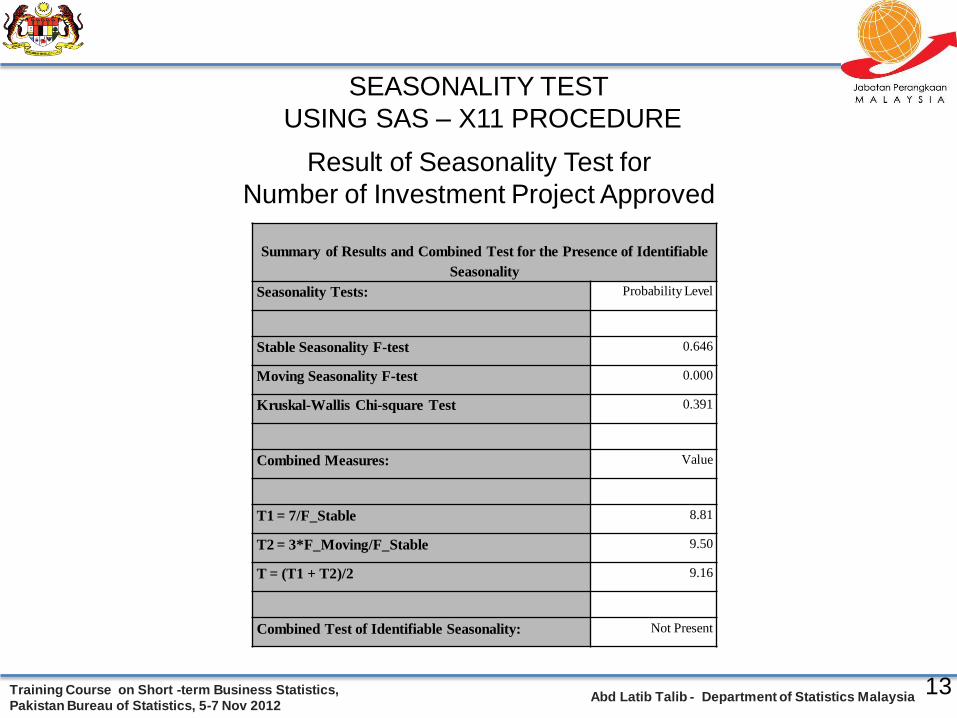
SEASONALITY TEST
USING SAS – X11 PROCEDURE
Result of Seasonality Test for
Number of Investment Project Approved
Summary of Results and Combined Test for the Presence of Identifiable
Seasonality
Seasonality Tests: Probability Level
Stable Seasonality F-test 0.646
Moving Seasonality F-test 0.000
Kruskal-Wallis Chi-square Test 0.391
Combined Measures: Value
T1 = 7/F_Stable 8.81
T2 = 3*F_Moving/F_Stable 9.50
T = (T1 + T2)/2 9.16
Combined Test of Identifiable Seasonality: Not Present
Training Course on Short -term Business Statistics,
Pakistan Bureau of Statistics, 5-7 Nov 2012Abd Latib Talib - Department of Statistics Malaysia
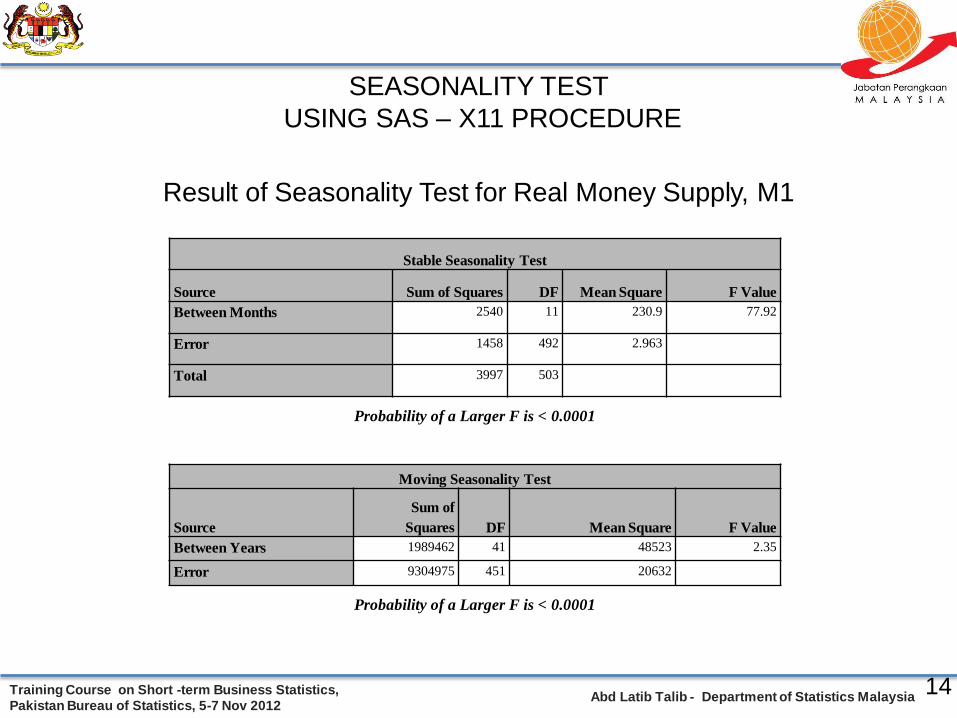
SEASONALITY TEST
USING SAS – X11 PROCEDURE
14
Stable Seasonality Test
Source Sum of Squares DF Mean Square F Value
Between Months 2540 11 230.9 77.92
Error 1458 492 2.963
Total 3997 503
Probability of a Larger F is < 0.0001
Moving Seasonality Test
Source
Sum of
Squares DF Mean Square F Value
Between Years 1989462 41 48523 2.35
Error 9304975 451 20632
Probability of a Larger F is < 0.0001
Result of Seasonality Test for Real Money Supply, M1
Training Course on Short -term Business Statistics,
Pakistan Bureau of Statistics, 5-7 Nov 2012Abd Latib Talib - Department of Statistics Malaysia 15
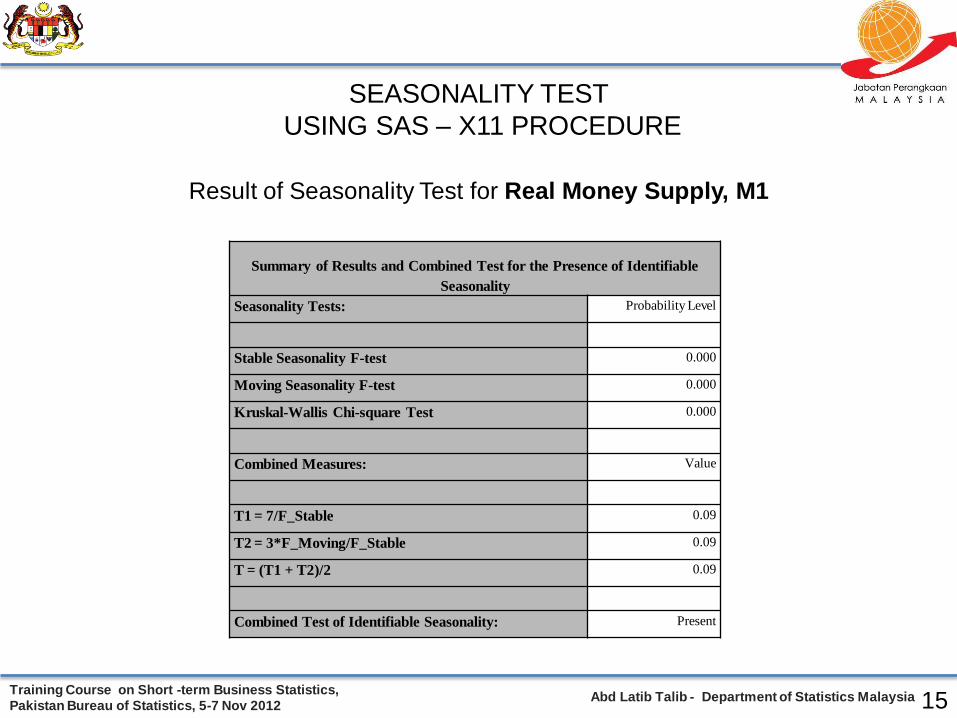
Summary of Results and Combined Test for the Presence of Identifiable
Seasonality
Seasonality Tests: Probability Level
Stable Seasonality F-test 0.000
Moving Seasonality F-test 0.000
Kruskal-Wallis Chi-square Test 0.000
Combined Measures: Value
T1 = 7/F_Stable 0.09
T2 = 3*F_Moving/F_Stable 0.09
T = (T1 + T2)/2 0.09
Combined Test of Identifiable Seasonality: Present
SEASONALITY TEST
USING SAS – X11 PROCEDURE
Result of Seasonality Test for Real Money Supply, M1
Training Course on Short -term Business Statistics,
Pakistan Bureau of Statistics, 5-7 Nov 2012Abd Latib Talib - Department of Statistics Malaysia
16
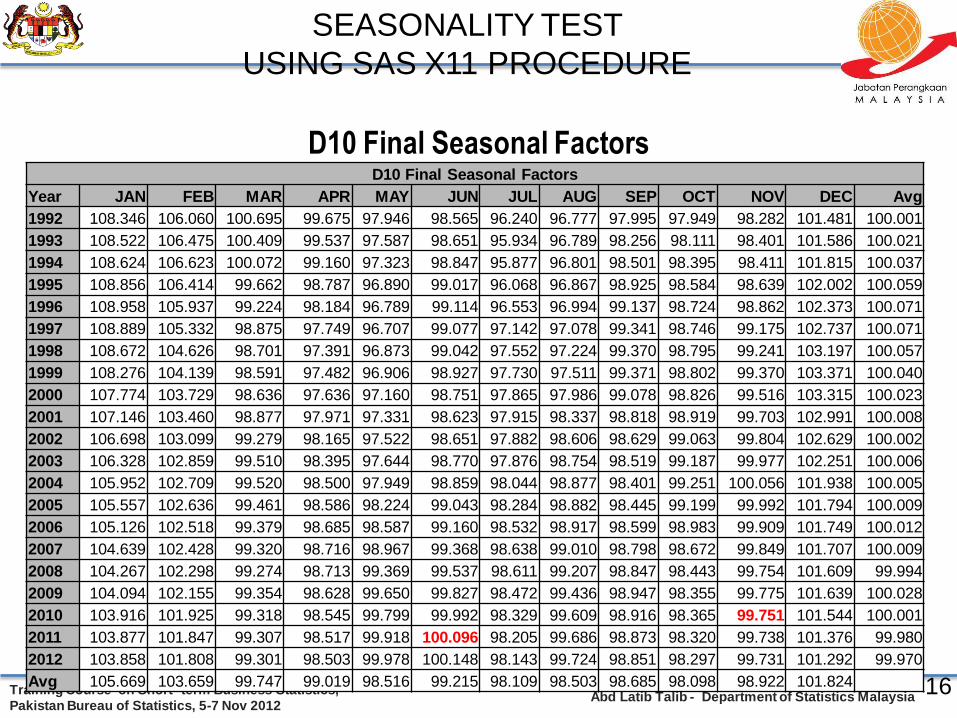
D10 Final Seasonal FactorsD10 Final Seasonal Factors
Year JAN FEB MAR APR MAY JUN JUL AUG SEP OCT NOV DEC Avg
1992 108.346 106.060 100.695 99.675 97.946 98.565 96.240 96.777 97.995 97.949 98.282 101.481 100.001
1993 108.522 106.475 100.409 99.537 97.587 98.651 95.934 96.789 98.256 98.111 98.401 101.586 100.021
1994 108.624 106.623 100.072 99.160 97.323 98.847 95.877 96.801 98.501 98.395 98.411 101.815 100.037
1995 108.856 106.414 99.662 98.787 96.890 99.017 96.068 96.867 98.925 98.584 98.639 102.002 100.059
1996 108.958 105.937 99.224 98.184 96.789 99.114 96.553 96.994 99.137 98.724 98.862 102.373 100.071
1997 108.889 105.332 98.875 97.749 96.707 99.077 97.142 97.078 99.341 98.746 99.175 102.737 100.071
1998 108.672 104.626 98.701 97.391 96.873 99.042 97.552 97.224 99.370 98.795 99.241 103.197 100.057
1999 108.276 104.139 98.591 97.482 96.906 98.927 97.730 97.511 99.371 98.802 99.370 103.371 100.040
2000 107.774 103.729 98.636 97.636 97.160 98.751 97.865 97.986 99.078 98.826 99.516 103.315 100.023
2001 107.146 103.460 98.877 97.971 97.331 98.623 97.915 98.337 98.818 98.919 99.703 102.991 100.008
2002 106.698 103.099 99.279 98.165 97.522 98.651 97.882 98.606 98.629 99.063 99.804 102.629 100.002
2003 106.328 102.859 99.510 98.395 97.644 98.770 97.876 98.754 98.519 99.187 99.977 102.251 100.006
2004 105.952 102.709 99.520 98.500 97.949 98.859 98.044 98.877 98.401 99.251 100.056 101.938 100.005
2005 105.557 102.636 99.461 98.586 98.224 99.043 98.284 98.882 98.445 99.199 99.992 101.794 100.009
2006 105.126 102.518 99.379 98.685 98.587 99.160 98.532 98.917 98.599 98.983 99.909 101.749 100.012
2007 104.639 102.428 99.320 98.716 98.967 99.368 98.638 99.010 98.798 98.672 99.849 101.707 100.009
2008 104.267 102.298 99.274 98.713 99.369 99.537 98.611 99.207 98.847 98.443 99.754 101.609 99.994
2009 104.094 102.155 99.354 98.628 99.650 99.827 98.472 99.436 98.947 98.355 99.775 101.639 100.028
2010 103.916 101.925 99.318 98.545 99.799 99.992 98.329 99.609 98.916 98.365 99.751 101.544 100.001
2011 103.877 101.847 99.307 98.517 99.918 100.096 98.205 99.686 98.873 98.320 99.738 101.376 99.980
2012 103.858 101.808 99.301 98.503 99.978 100.148 98.143 99.724 98.851 98.297 99.731 101.292 99.970
Avg 105.669 103.659 99.747 99.019 98.516 99.215 98.109 98.503 98.685 98.098 98.922 101.824
SEASONALITY TEST
USING SAS X11 PROCEDURE

Training Course on Short -term Business Statistics,
Pakistan Bureau of Statistics, 5-7 Nov 2012Abd Latib Talib - Department of Statistics Malaysia
17
SEASONALITY TEST
USING SAS X11 PROCEDURE
Description based on the result from D10
Final Seasonal Factors:
99.751 Seasonal factor in November 2010 means that
Real Money Supply, M1 is 0.249% lower in that
period with the absence of seasonality.
100.096 Seasonal factor in June 2011 means that
Real Money Supply, M1 is 0.096% higher in that
period with the absence of seasonality.

Training Course on Short -term Business Statistics,
Pakistan Bureau of Statistics, 5-7 Nov 2012Abd Latib Talib - Department of Statistics Malaysia
18
Example based on the result from D10 Final Seasonal Factors:
Period Original Data (M1) Seasonal Factor Deseasonalized data
2011:01 239973.5 103.877
2011:02 233770.8 101.847
2011:03 229361.3 99.307
2011:04 231001.8 98.517
2011:05 234031.6 99.918
2011:06 239440.0 100.096
2011:07 235476.8 98.205
2011:08 243857.8 99.686
2011:09 241927.9 98.873
2011:10 248334.6 98.320
2011:11 250230.7 99.738
2011:12 258223.9 101.376
231017.0
229531.4
230961.9
234479.1
234223.7
239210.4
239780.9
244625.9
244685.5
252577.9
250888.0
254719.0
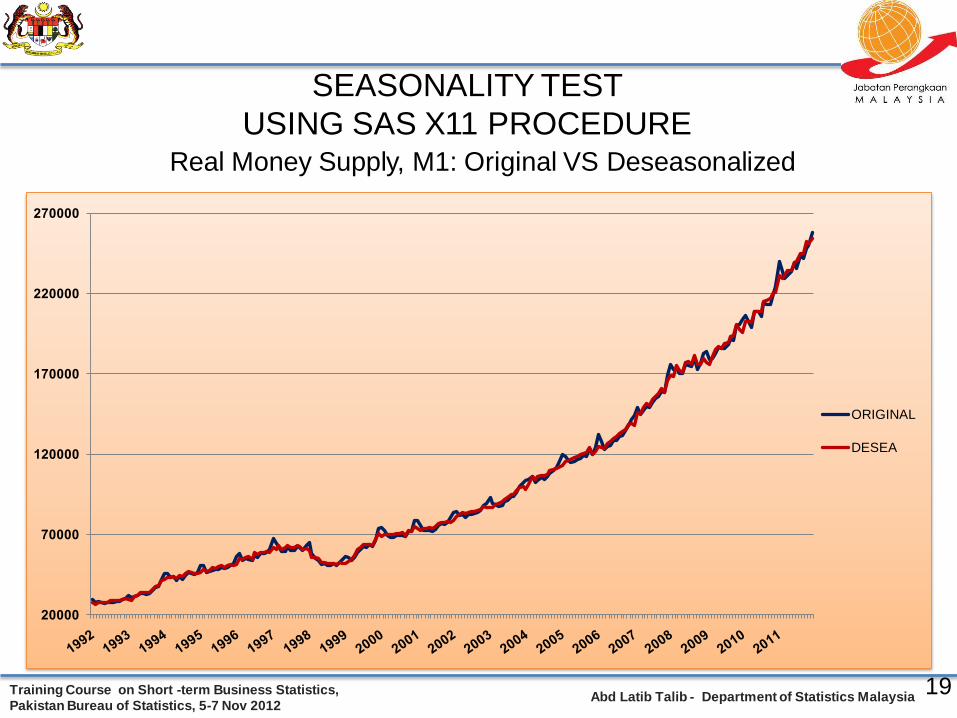
SEASONALITY TEST
USING SAS X11 PROCEDURE
Training Course on Short -term Business Statistics,
Pakistan Bureau of Statistics, 5-7 Nov 2012Abd Latib Talib - Department of Statistics Malaysia
Real Money Supply, M1: Original VS Deseasonalized
19
20000
70000
120000
170000
220000
270000
ORIGINAL
DESEA
SEASONALITY TEST
USING SAS X11 PROCEDURE
Training Course on Short -term Business Statistics,
Pakistan Bureau of Statistics, 5-7 Nov 2012Abd Latib Talib - Department of Statistics Malaysia
20
SEASONAL ADJUSTMENT IN MALAYSIA
Malaysian economic time series data are effected by major
religious festivals such as the Eid-ul Fitr of the Muslims, the
Chinese New Year of the Chinese and the Deepavali of the
Indian.
The major festivals in this country are usually related to the
religious activities and as such, the dated are determined by
the respective religious calendar which are not in line with the
Gregorian calendar.
Hence, they tend to move along the Gregorian calendar and
strong seasonal influence on many economic time series.
Training Course on Short -term Business Statistics,
Pakistan Bureau of Statistics, 5-7 Nov 2012Abd Latib Talib - Department of Statistics Malaysia
21
SEASONAL ADJUSTMENT CASE IN MALAYSIA (con’t)
Since these non-fixed holidays have large impacts on the time
series data, they need to be taken into account when
performing seasonal adjustment process as to avoid confusion
in seasonally adjusted data and trend estimates.
Therefore, the approach used for seasonal adjustment is the
Seasonal Adjustment for Malaysia (SEAM).
SEAM is a procedure to remove moving holiday effect on the
selected Malaysian economic time series data by introducing
the next steps that can be used to overcome the limitations of
the existing seasonal adjustment procedure as shown before.
Training Course on Short -term Business Statistics,
Pakistan Bureau of Statistics, 5-7 Nov 2012Abd Latib Talib - Department of Statistics Malaysia 22
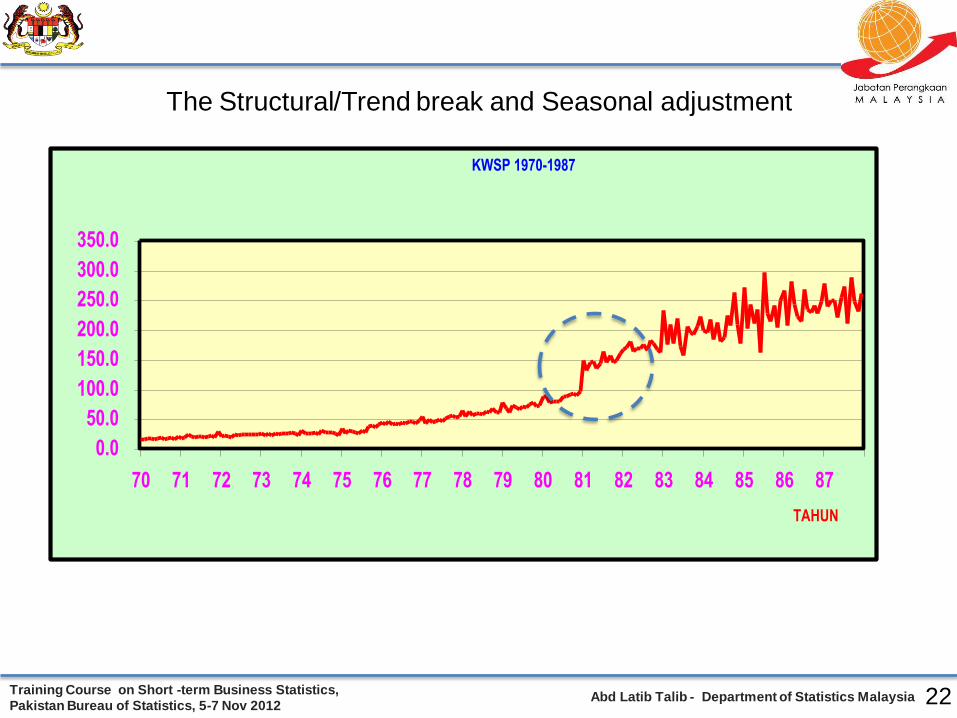
The Structural/Trend break and Seasonal adjustment
KWSP 1970-1987
0.0
50.0
100.0
150.0
200.0
250.0
300.0
350.0
70 71 72 73 74 75 76 77 78 79 80 81 82 83 84 85 86 87
TAHUN
Training Course on Short -term Business Statistics,
Pakistan Bureau of Statistics, 5-7 Nov 2012Abd Latib Talib - Department of Statistics Malaysia
23
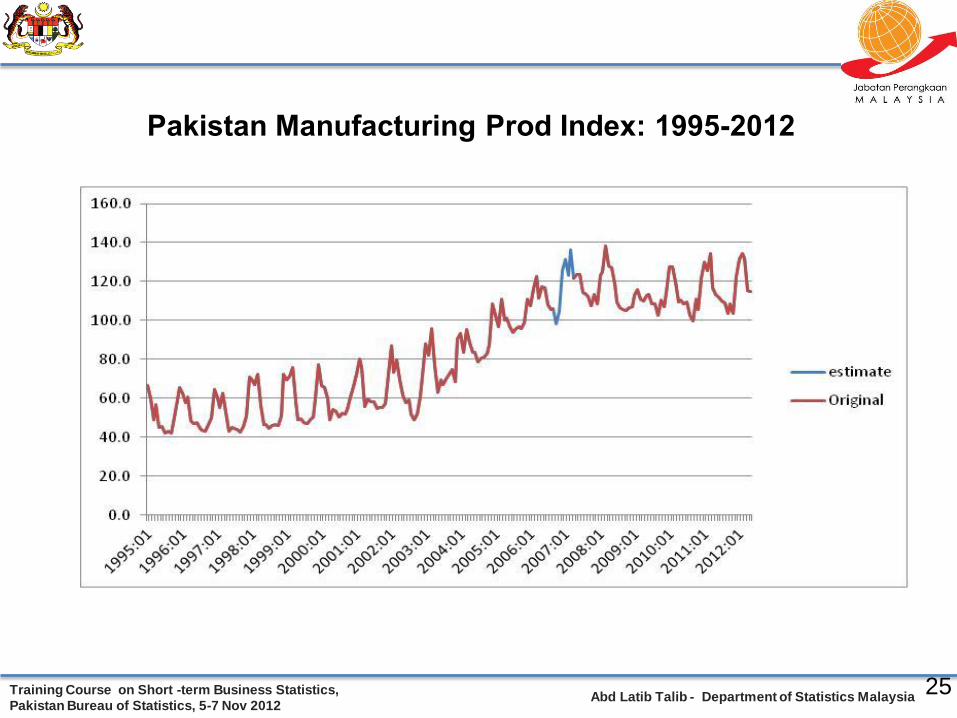
Example Seasonal Adjustment Using SAS X11
Procedure: Testing Pakistan Manufacturing Prod Index
1995-2012

Training Course on Short -term Business Statistics,
Pakistan Bureau of Statistics, 5-7 Nov 2012Abd Latib Talib - Department of Statistics Malaysia
24
Check if any trend break of the series
Check also if any missing values
Training Course on Short -term Business Statistics,
Pakistan Bureau of Statistics, 5-7 Nov 2012Abd Latib Talib - Department of Statistics Malaysia
25
Pakistan Manufacturing Prod Index: 1995-2012

Training Course on Short -term Business Statistics,
Pakistan Bureau of Statistics, 5-7 Nov 2012Abd Latib Talib - Department of Statistics Malaysia
26
Findings
Stable Seasonality Test
Source Sum of
Squares
DF Mean Square F Value
Between
Months
23788 11 2163 41.58
Error 10245 197 52.01
Total 34033 208
Moving Seasonality Test
Source Sum of
Squares
DF Mean Square F Value
Between Years 38610042 16 2413128 10.18
Error 41719048 176 237040
Probability of a Larger F is < 0.0001
Probability of a Larger F is < 0.0001
Training Course on Short -term Business Statistics,
Pakistan Bureau of Statistics, 5-7 Nov 2012Abd Latib Talib - Department of Statistics Malaysia
27
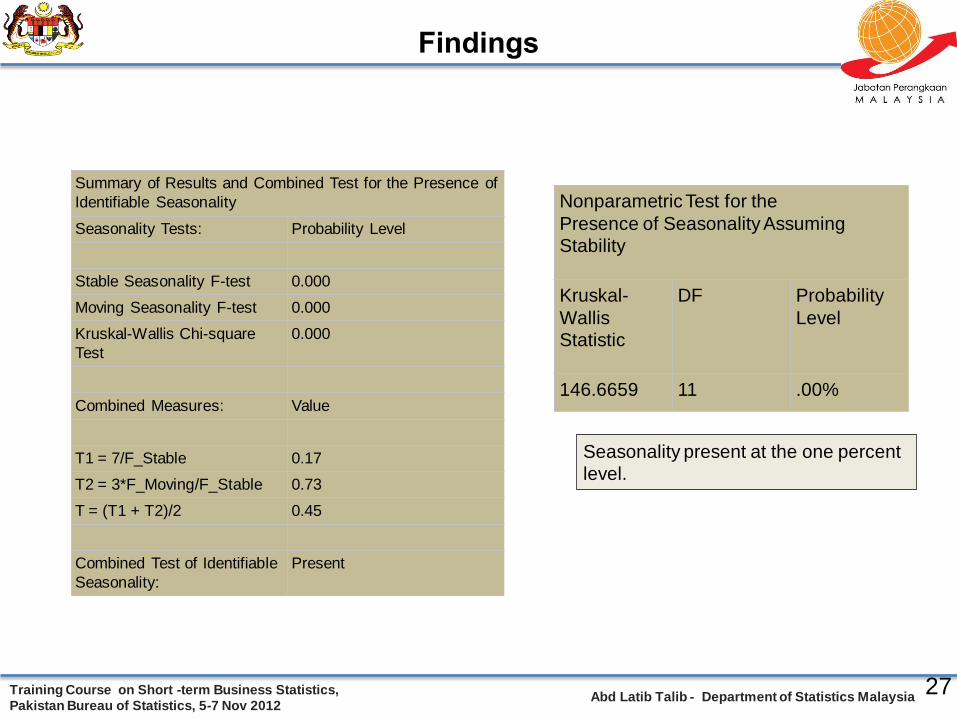
Findings
Nonparametric Test for the
Presence of Seasonality Assuming
Stability
Kruskal-
Wallis
Statistic
DF Probability
Level
146.6659 11 .00%
Summary of Results and Combined Test for the Presence of
Identifiable Seasonality
Seasonality Tests: Probability Level
Stable Seasonality F-test 0.000
Moving Seasonality F-test 0.000
Kruskal-Wallis Chi-square
Test
0.000
Combined Measures: Value
T1 = 7/F_Stable 0.17
T2 = 3*F_Moving/F_Stable 0.73
T = (T1 + T2)/2 0.45
Combined Test of Identifiable
Seasonality:
Present
Seasonality present at the one percent
level.

Training Course on Short -term Business Statistics,
Pakistan Bureau of Statistics, 5-7 Nov 2012Abd Latib Talib - Department of Statistics Malaysia
28
Seasonal Factors

Training Course on Short -term Business Statistics,
Pakistan Bureau of Statistics, 5-7 Nov 2012Abd Latib Talib - Department of Statistics Malaysia
29
Findings

Training Course on Short -term Business Statistics,
Pakistan Bureau of Statistics, 5-7 Nov 2012Abd Latib Talib - Department of Statistics Malaysia
30
SUMMARY
Seasonally adjusted series is only for monthly or quarterly time
series.
But not all monthly or quarterly time series need to be adjusted
It is subjected to your decision based on the appropriate
statistical test.

Training Course on Short -term Business Statistics,
Pakistan Bureau of Statistics, 5-7 Nov 2012Abd Latib Talib - Department of Statistics Malaysia
31
THANK YOU
Abd Latib Talib
Economic Indicators Division
Department of Statistics Malaysia