seasonal and regional variations in plankton community ... · were measured as in vitro changes in...
TRANSCRIPT

Vol. 116: 217-231,1995 MARINE ECOLOGY PROGRESS SERIES Mar. Ecol. Prog. Ser. Published January 12
Seasonal and regional variations in plankton community production and respiration
for Chesapeake Bay
Erik M. Smith, W. Michael Kemp
University of Maryland System, Center for Environmental and Estuarine Studies, Horn Point Environmental Laboratory, Cambridge, Maryland 21613, USA
ABSTRACT: Plankton community production and respiration rates were examined at 3 stations repre- sentmg distinct regions along the estuanne gradient in the main stem of Chesapeake Bay, USA. Rates were measured as in vitro changes in oxygen concentration, as determined by Winkler titration with an automated photometric end-point detection system. At each station rates of both processes exhibited annual patterns which followed that of water temperature. There were distinct differences, however, among the 3 stations in the relative magnitude of metabolic rates measured. Annual rates of daytime net plankton community production were estimated to be 265, 1680, and 2040 g O2 n r 2 yrW1, while annual night-time plankton community respiration rates in the upper water column were estimated as 130, 1090, and 490 g 0; m 2 y r l at the upper, middle and lower Bay stations, respectively. Thus, whereas rates of net daytime production increased substantially moving downbay, highest measured rates of community respiration were, m fact, found in the middle region of the Bay. Annual cycles of production and respiration rates were significantly related to each other at the upper and middle stations, but unrelated at the lower station. Integrated estimates of net plankton community metabolism (production minus respiration) at the 3 stations exhibited seasonal patterns departing from balanced metabolism (production = respiration) during winter-spring and converging on zero net metabolism in summer-fall. During the cooler months net plankton metabolism was negative (net heterotrophic) at the upper station and positive (net autotrophic) at the middle and lower stations. Over the annual cycle, the 3 stations showed a longitudinal pattern of increasing die1 net plankton community metabolism, progressing from a net heterotrophy of -70 g O2 m 2 y r l in the turbid, upper Bay, to shghtly positive metabolism of 160 g 0; m-2 yr-I m the mid-region, to strong net autotrophy of 760 g Oa m 2 y r l in the less turbid, lower Bay.
KEY WORDS' Plankton. Production Respiration. Net community metabohsm . Oxygen. Chesapeake Bay
INTRODUCTION
Primary production of planktonic communities rep- resents a critical link between inputs o f n e w nutri- ents and production of fish in estuaries and other aquatic ecosystems (e.g. Nixon et al. 1986, Iverson 1990). The proportion of phytoplankton production which is available for transfer to higher trophic levels depends in part, however, on the degree of coupling between autotrophic production ( P ) and hetero- trophic respiration (R) within the plankton commu- nity. Although P and R tend to converge at large
scales, physical and biological interactions within a given environment, or between adjacent systems, often cause the 2 processes to be separated in time or space (Williams 1984). In general, most biogeo- chemical cycles are driven b y the flux o f organic matter which accompanies the uncoupling of photo- synthesis and respiration (Geider 1992). Consequently, it is the net ( P minus R) rather than total (P) produc- tion of the planktonic community that defines the amount of organic matter available for export to the benthos or to adjacent ecosystems or for transfer to higher pelagic trophic levels.
63 Inter-Research 1995 Resale of full article not permitted

218 Mar. Ecol. Prog. Ser. 116: 217-231, 1995
Over the last several decades, research on plankton community production has tended to focus on meas- urement of phytoplankton photosynthesis, particularly since the introduction of the "C technique (Steemann- Nielsen 1952). Associated with this trend was the general loss of favor for use of oxygen (04 as a tracer of metabolic rates (as employed by e.g. Gaarder &
Gran 1927, Ryther 1954), due in part to the ease and precision of the 14C method (Peterson 1980). As a result there has been a relatively limited availability of direct measures of planktonic respiration (Williams 1984) and a tendency to equate phytoplankton photosynthesis with net production for whole plankton communities (Nixon & Pilson 1984). Recent technological advances in O2 measurements using automated versions of the traditional Winkler titration (e.g. Hartwig & Michael 1978, Williams & Jenkinson 1982, Oudot et al. 1988), im- proved electrode sensors (e.g. Griffith 1988, Langdon 1984) and 0 isotopic techniques (e.g. Bender & Grande 1987, Kana 1990) have resulted in a renewed interest in oxygen as a suitably sensitive tracer for the measurement of both respiration and production of planktonic communities.
Several previous studies have reported rates of plankton oxygen production and respiration in Chesapeake Bay (e.g. Kemp & Boynton 1980, Taft et al. 1980, Tuttle et al. 1987, Kemp et al. 1992), but these have been for limited sites and/or seasons. In the present paper we describe annual cycles of plankton community production and respi- ration for 3 main regions of this estuary, and consider the relationship between these 2 metabolic processes. We also exam- ine how the balance between plankton pro- duction and respiration varies between sea- sons and stations, as well as the ecological implications of these variations.
MATERIALS AND METHODS
Sample locations and frequency. Three stations ('Upper Bay', UB: 39' 20.9' N, 76' 10.9' W; 'Mid Bay', MB: 38'28.4' N, 76'22.8' W; 'Lower Bay', LB: 37O16.1' N, 76'09,O' W) along the main axis of the Chesapeake Bay (Fig. 1) were occupied at approximately 2 mo intervals from April to November in 1989 and 1990 and at monthly intervals from Februar to November in 1991. On several occasions, however, data for specific stations were not collected due to logistical difficulties involving equipment or weather. Additionally, during 1989 and
1990, 18 stations along the vertical axis of the main channel were sampled for vertical profiles of salinity, temperature and light penetration (as measured by Secchi disk depth). Nominal water column depths at the 3 main stations ranged from 6 to 8, 18 to 23, and 10 to 12 m at the UB, MB and LB stations, respec- tively. Water samples at these stations were obtained from surface (2 m below air-sea interface) and bottom layers (2 m above sediment-water interface) at each station during morning (07:OO to 10:OO h) using an array of Niskin bottles (20 1) mounted on a CTD (Neil Brown Instruments), which provided concurrent verti- cal profiles of temperature, salinity, oxygen and in situ fluorescence. Immediately after completion of the hydrocast, water was gently combined from several Niskin bottles into low-density polyethylene (Nalgen) carboys (50 1) to ensure homogeneity in the sample. Water was then siphoned into standard, clear, acid- washed, glass BOD incubation bottles (300 ml), which were flushed, filled, and capped with ground glass stoppers.
Fig. 1 Chesapeake Bay, USA, with 3 stations along the axis of the main stem. Solid lines indicate divisions between Bay regions used in Table 3
Smith & Kemp: Variations in plankton community production and respiration 219
Production and respiration rate measurements. Net planktonic community production and respiration rates were measured as changes in dissolved oxygen in replicate clear and opaque incubation bottles (Kemp et al. 1992). All oxygen concentrations were deter- mined b y Winkler titration of whole samples in the incubation bottles (Carritt & Carpenter 1966), with visual end-point detection in 1989 and b y a computer- controlled, photometric detector system (Sensoren Instrumente Systeme, Kiel, Germany) in subsequent years. This automated titration system had a minimum precision o f 0.01 %.
Plankton production was measured using duplicate clear BOD bottles containing surface water incubated for 4 to 5 h at in situ temperatures (Â 1 ' C ) , in an incu- bator equipped with high-output, cool-white fluores- cent lamps, at each of 5 irradiance levels (ca 25, 30, 65, 130, 250, 450 pEin m 2 s ) using neutral-density screening of individual bottles (e.g. Harding et al. 1986). Ambient incident photosynthetically active radi- ation (PAR, 400 to 700 nm) was measured on shipboard for the day of each rate measurement using an inte- grating PAR sensor (Licor model Ll-1000). Light reach- ing each bottle was expressed as a percentage of mean integrated ambient PAR (pEin m 2 s ' ) for the day of incubation.
Production of oxygen at each light level was nor- malized to measured in situ chlorophyll a (chl a) concentrations. Chl a was extracted from fresh par- ticulate material collected b y filtration (Whatman GF/F glass fiber filters, 1.2 pm) with aqueous acetone (90 %) and quantified fluorometrically before and after acidi- fication (Parsons et al. 1984) with a Turner Fluoro- meter. T h e chlorophyll-specific production (PB) versus irradiance ( I ) relationship was modeled as the non- linear hyperbolic tangent function (Jassby & Platt 1976):
PB = PL tanh [s) + RB
where a [ m g O2 m g l chl a (pEin rn-' h h " ) ' ] is the mitial slope of the light-saturation curve, P 3 m g O2 m g l chl a h ) is the light-saturated biomass-specific production rate, and RB is the biomass-specific respira- tion rate. Values o f a and Pk that best described each data set were estimated b y least-squares fit (Mar- quardt 1963). Once the specific relationship for PB ver- sus Iwas determined, community production ( g O2 m-2 h ) was integrated over the depth of the euphotic zone (to 1 % surface irradiance) based on vertical attenua- tion o f light ( f rom Secchi disk depth) and chl a distrib- utions ( c f . Malone et al. 1988). Integrated rates o f net community production ( g O2 m 2 d l ) were then calcu- lated as hourly production rates multiplied b y hours o f the day in which incident PAR exceeded 100 pEin m 2
s l . This value is referred to as daytime net plankton community production (Pn).
Dark respiration rates were measured as decreases in oxygen concentration in replicate (4 or 5 ) bottles containing surface or bottom water samples. Bottles were incubated in removable opaque sleeves, at in situ temperatures (Â 1 O C ) for 4 to 12 h , with 5 bottles o f both surface and bottom water initially fixed for Winkler titrations. Vertically integrated areal ( m 2 ) rates for the upper layer were calculated as the product o f volumet- ric ( m 3 ) rates and the mean depth to the pycnocline. Integrated areal rates for the lower layer were obtained b y multiplying volumetric rates b y the aver- age height o f the lower layer water column, estimated from hypsographic information of the Bay cross-- section at each station (Cronin & Pritchard 1975). This integration for the lower layer accounted for the rela- tive reduction in volume in the lower layer with increasing depth of the pycnoclme, due to the triangu- lar shape of the main channel (Kemp et al. 1992).
Net community metabolism calculations. Concep- tual framework: To compare the relative balance between the processes o f phytoplankton production and plankton community respiration on an areal basis, discrete volumetric respiration rates had to be depth- integrated to obtain units comparable to that o f net community production ( g O2 m 2 d l ) . In this regard, the vertical structure of the water column at each sta- tion, as well as the stations' mean vertical dimensions, become important factors in the calculation. The 3 stations sampled in this study exhibited distinct dif fer- ences in overall depth and the nature of their vertical structure (Fig. 2) . For purposes of integration, the structure o f the water column at the 3 stations was par- titioned into 2 distinct layers, each assumed to be ver- tically mixed, based on vertical profiles o f salinity and temperature.
Overall, annual mean values o f pycnocline depth (estimated as the pomt of maximum salinity and/or temperature change) and depth of the euphotic zone (as 1 % light penetration) tended to track each other remarkably well (Wofsy 1983) along the entire axis of the bay (Fig. 2 ) , suggesting a logical depth division for the water column integration. There were, however, some important differences among the stations. At the UB station, there was often no discernible vertical struc- ture to the water column, in which case the upper mixed layer was taken to b e the depth of the euphotic zone. At the MB station, the depth o f the euphotic zone was con- sistently at or just slightly above the determined pycno- cline depth. The situation was, however, reversed at the LB station. Here, although the depth of 1 % light pene- tration was comparable to that found at MB, the pycno- cline depth was more variable and would occasionally shoal above the euphotic depth, enough such that the

220 Mar. Ecol. Prog. Ser. 116: 217-231, 1995
Fig. 2. Longitudinal section of main-stem Chesapeake Bay showing annual mean depths of the euphotic zone (Zen), pycno- cline (Zpy,;), and maximum chan- nel depth (ZmaiJ The width of the shaded area (Hi) bounded at the top by ZPyc represents the mean height of the lower layer of the water column (see text for explanation of calculation). Plankton metabolism stations (+) and longitudinal mapping stations (=) are indicated at
50 - I I I . t rn the top of the figure. (Light 320 280 240 200 160 120 80 40 0 data from Kemp et al. un-
publ., hypsographic data from Distance from mouth of Bay, km Cronin & Pntchard 1975)
annual mean depth of the euphotic zone exceeded the mean of the pycnocline. At this station, the observed strength of the pycnocline was also typically much less than that seen at MB, thus allowing for the possibility of increased mixing between layers. As a result, when this situation occurred, the base of the euphotic zone was used as the boundary of the upper layer, to be conserva- tive in calculating integrated aphotic respiration rate. In the single most extreme case, however, the resultmg difference was on the order of 15 %.
The appropriate height of the lower mixed layer was somewhat more problematic due to the irregular nature of the bottom topography in the main channel of the Bay. To obtain a representative mean height of the lower layer at each of the 3 stations, cross-sectional hypsographic data from Cronin & Pritchard (1975) were used to calculate the average cross-sectional channel depth lying below the given depth of the pycnocline (Fig. 2), the difference in depths being the mean height of the lower layer (Fig. 2 shaded area; Kemp et al. 1992). It can be seen there were dramatic differences between the maximum depth of the chan- nel and its mean depth for large portions of the Bay. Thus, the vertical dimension of the lower layer be- comes important in the integration of lower layer respi- ration rates. This integration applies only to the plank- ton community metabolism of the main channel (where water column depth exceeds euphotic depth). Because of differences in vertical dimensions, integrated plank- ton community metabohsm over the shallow flank regions could have a differing metabolic balance, so that the focus of this paper is restricted to the main channel region. Based on hypsographic data from Cronin & Pritchard (1975), this main channel region represents approximately 52 % of the total Bay surface area but 76 % of the total Bay volume.
Die1 rates of net metabolism of the planktonic com- munity were calculated for both the upper mixed layer (NPMu) and for the entire water column (NPM). NPM,, was calculated as daytime net community production (Pnr g O2 m 2 d l ) minus nighttime respiration in the upper layer (Ru, g O2 m 2 d l ) . Nighttime respiration for the upper layer is the vertically integrated hourly rate multiplied by the hours of darkness. Thus, NPM,, is the net diel plankton community production of the upper layer. NPM represents the net diel plankton metabolism of the entire water column and is therefore equal to NPMu minus the respiration in the aphotic lower layer (Rl, g 0; m 2 d l ) , which is calculated as the depth-integrated lower layer hourly rate multiplied by 24 h. Ratios of production: respiration were calcu- lated for the upper layer as Pn: Ru and for the entire water column as Pn: (Ru + Ri).
For the MB station during summer, when the bottom waters were anoxic, vertical profiles revealed that waters between 1 and 5 m below the pycnocline still contained some oxygen. Therefore, when estimating NPM during these time periods, Rl was calculated for a water column of variable height, based on the thick- ness of the oxygenated layer (down to approximately 0.5 mg O2 1 1 ) below the pycnocline. Vertical sampling of respiration rates during this period indicated no sig- nificant variations in respiration rates within this layer relative to the upper water column layer.
Error propagation analysis: Calculations of NPM often involve relatively small differences between large numbers, so that it was critical to estimate the errors associated with these means. Because mean rates were based on a series of computations, vari- ances were estimated by error propagation methods using the following model (Bevington 1969). For any function x = f (urv) , the associated variance is

Smith & Kemp: Variations in plankton community production and respiration 22 1
We assumed that the ratio of variance (4, a2,} to covariance (24") for factors used in this calculation (a, P i , I, chl a, depth, day length) was relatively small, so that the last term in Eq. (2) could be ignored (Bevington 1969). For the hyperbolic tangent function (Eq. I), with Pk and (alp;) replaced by BO and B l , respectively, the propagated error associated with mean values of PB can be calculated by differentiating Eq. (1) with respect to each of the other variables and substituting into Eq. (2) to obtain the following:
The error for PB was thus calculated for each incubation light level, and these were integrated by simple linear interpolation to the 1 % irradiance level and then multi- plied by day length to produce an error estimate for Pn.
RESULTS AND DISCUSSION
Data were collected during the years 1989 to 1991. When data were separated seasonally by year, mean measured rates for seasonal periods were not signifi- cantly different among years (ANOVA, p < 0.05), either for daytime net community production or community respiration. Data were thus pooled into a single com- posite year to develop a robust characterization of general seasonal patterns for Chesapeake Bay.
Seasonal and regional variations in production and biomass
Rates of daytime net community production at the 3 stations followed a clear seasonal cycle, with winter minima and summer maxima (Fig. 3). In general, these seasonal extreme values of Pn coincide with annual maximal and minimal temperatures (Fig. 4, upper panels). Although the 3 stations exhibited similar seasonal patterns in the maxima and minima of Pn, there were clear longitudinal differences in the sea- sonal range of measured rates, as well as the relative magnitude of production at the stations. The annual range in Pn values increased markedly in the downbay direction, from 1.8, to 5.4, to 10.9 g Oz m-2 d-I, at the UB, MB, and LB stations respectively. A similar longi- tudinal trend is also evident in the magnitude of Pn at
J ' F ' M ' A ' M ' J ' J ' A ' S ' O ' N ' D l
Month
Fig. 3. Seasonal patterns of net community production (with standard errors as calculated from Eq. 3) at the 3 stations, 1989 to 1991 Dashed lines indicate estimated monthly mean values based on multiple regression equations in Table 1 Data points
in parentheses were not included in regression estimates
the 3 stations. Annual mean Pn values increased from 0.8 Â 0.5 g 0, m-2 d-I at UB, to 5.4 Â 2.2 g 0, mA2 d-I at MB, to 6.5 Â 3.1 g 0, m-2 dbl at LB. Thus, on an annual mean basis, there is a substantial, and significant (p < 0.01), mcrease in daytime net community pro- duction values from UB to MB, but a small, and non- significant, increase between MB and LB. If, however, one compares peak summer (July-August) rates, there is a significant (p < 0.01) increase in Pn between MB (6.9 Â 0.8 g 0, m-2 d-l) and LB (9.4 Â 2.2 g 0, m-* d-I ), In many temperate estuarine environments, annual cycles of phytoplankton production are characterized by strong seasonality, with peak rates coinciding with the summer temperature maximum (Boynton et al.

222 Mar. Ecol. Prog. Ser. 116: 217-231,1995
o Upper Layer
S 10
30
J F M A M J J A S O N D Month
$ - 20 rt
Fig 4 Seasonal patterns of water temperature ('C) in the upper layer and lower layer, and salinity ( % o ) m the upper
layer and lower layer, for the 3 stations, 1989 to 1991
- Upper Bay l * o m 0 - 0 .-
- a*
1982). Most previous reports for plankton production in the mesohaline region o f Chesapeake Bay indicated a seasonal timing i n maximal and minimal rates similar to those found i n this study (Flemer 1970, Boynton et al. 1982, Malone et al. 1986, 1988). N o other
stratification within t he mid-Bay region (Fig. 4 ) wh ich injected h igh nutrient levels into t he nutrient-poor euphotic zone. This event will b e considered more fully i n a later section. At t h e LB station, t h e June (1991) measured rate o f Pn dropped substantially f rom the expected trend (Fig. 3 ) . Wi th in t he MB station data there is also a suggestion o f a decrease in rates during June , bu t not o f t h e magnitude seen in the LB station. This late spring period corresponds to t h e timing o f t he annual transition f rom the spring diatom bloom t o t he summer phytoplankton assemblages dominated b y smaller flagellated chlorophytes and dinoflagellates (Sellner 1987, Malone e t al. 1988). Although this scenario i s based o n limited data for June i n this study, it is apparent also in previous reports o n annual cycles o f phytoplankton production i n t h e mesohaline region o f Chesapeake Bay (Boynton et al. 1982).
T o derive a n estimate o f annual ne t community pro- duction for t he 3 stations, for comparison wi th pub- lished annual rates, a multiple regression model using daily PAR (Ein m 2 d l ) and surface-layer temperature (OC) for each station (Table 1) was used t o estimate monthly values o f Pn based o n m e a n monthly value o f PAR (T . R. Fisher unpubl . data) and temperature (Fig. 4 ) . T h e observed Pn values were compared wi th those predicted given t he daily PAR and temperature at t he t ime o f measurement (Fig. 5a). T h e precision o f t h e regression estimates was such that 70 % o f t he pre- dicted values were within  25 % o f t he measured val- ue s , and 94 % were within  50 % o f those measured. T h e monthly modeled estimates o f Pn are shown i n Fig. 3 as a dashed line. From these regression equa- tions w e derived annual (365) values o f ne t community production for t he period f rom 1989 to 1991 o f 265, 1680, and 2040 g Oz m-2 yr-l, for t he U B , M B , and LB stations respectively. Values o f annual production for t h e mesohaline region, based o n C uptake tech- niques, range f rom 350 t o 850 g C m-2 yr-' (Taf t et al. 1980, Boynton et al. 1982). More recently, Malone et al. (1986, 1988) have reported annual production esti- mates , for a station i n t h e near vicinity o f t h e present MB station, that range f rom 430 t o 550 g C m-2 yrrl. Converting our daytime ne t community production rate at MB t o carbon units , assuming a photosynthetic
studies o f Chesapeake Bay have reported Table 1. Multiple linear regression analysis of net community production annual ranges of production rates for stations (Pn) in relation to daily insolation (PAR, E m m-2 d- I ) and in situ tem- distributed over t he length o f t he estuarine perature (T, ' C ) in Chesapeake Bay. Values for PAR taken from T. R.
gradient. Fisher (unpubl. data) and for temperature from Fig. 3
There were 2 exceptions to t he general 1 seasonal pattern observed for production 1 Station Multiple regression r2 n
ured for this station (Fig. 3 ) . This h igh rate 1 LB P: = -1.27 + 0.109 PAR + 0.197 T 0.72 13 < 0.01
rates at t he 3 stations. In September 1991, Pn at t he MB station was t he highest rate meas-
coincided wi th a fall break-down event i n t h e
UB Pn = -0.24 + 0.008 PAR + 0.045 T 0.78 10 p < 0.01 M B P- = 1.48 + 0.014 PAR + 0.169 T 0.73 14 v < 0.01
Smith & Kemp: Variations in plankton community production and respiration 223
Measured Production, g O2 m-2 d-1
Measured Respiration, mg O2 I-I h-I
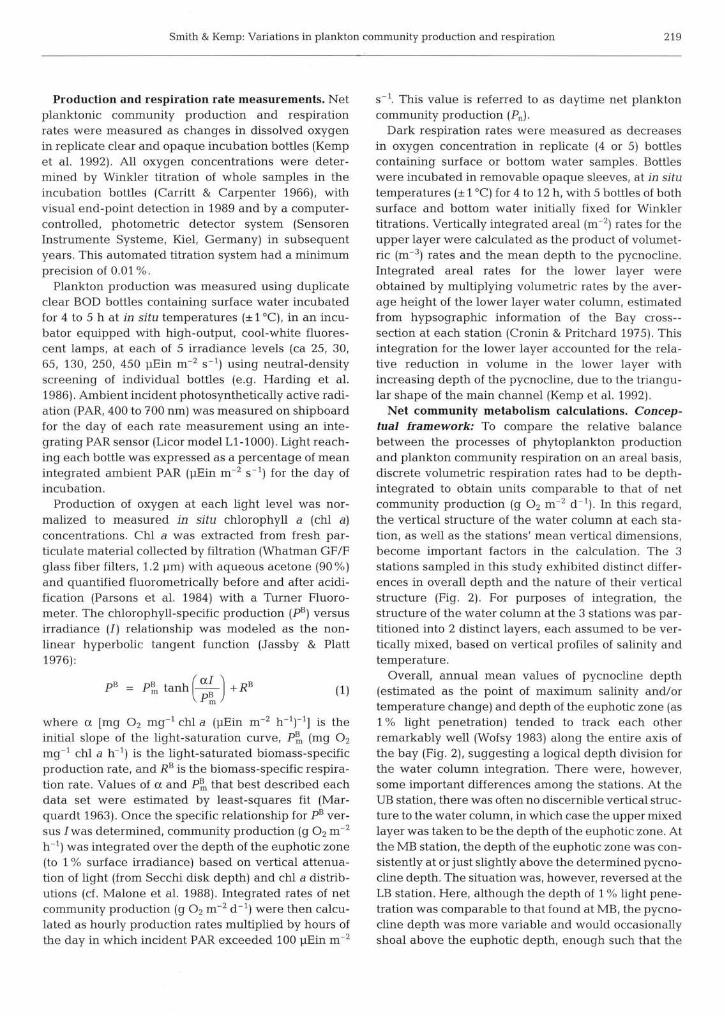
Fig 5. Comparison of predicted and measured plankton community metabolic rates of (a) net community production (g O-, m-2 d"'), and (b) respiration (mg O2 1 ' h l ) Solid line indicates 1:l relationship; r2 values for each station given
separately
quotient (C02: 02) of 1.2, yields a value of 525 g C m-2 y r l , which is towards the upper end of reported annual estimates for this region of the Bay. There is only 1 previous report of plankton production for the upper region of Chesapeake Bay (Flemer 1970). These rates (200 g O2 m 2 y r l ) are somewhat lower than those obtained in this study (265 g O2 m 2 y r l ) . There are presently no published accounts in the literature regarding annually integrated production rates for the lower region of the Chesapeake Bay. Thus, the daytime net plankton community production rates
reported here for LB station (2040 g O2 m 2 y r l , or 637 g C m-2 y r l ) represent the first annual estimate for plankton production in the polyhaline southern region of the Bay.
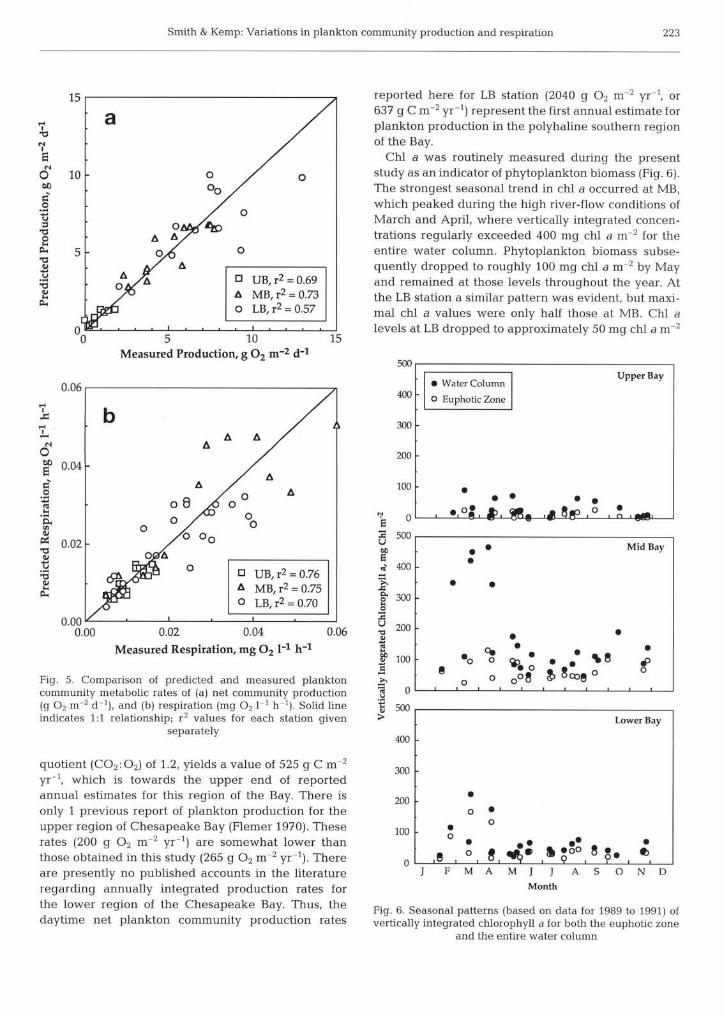
Chl a was routinely measured during the present study as an indicator of phytoplankton biomass (Fig. 6). The strongest seasonal trend in chl a occurred at MB, which peaked during the high river-flow conditions of March and April, where vertically integrated concen- trations regularly exceeded 400 mg chl a m"2 for the entire water column. Phytoplankton biomass subse- quently dropped to roughly 100 mg chl a m-2 by May and remained at those levels throughout the year. At the LB station a similar pattern was evident, but maxi- mal chl a values were only half those at MB. Chl a levels at LB dropped to approximately 50 mg chl a m-2
Upper Bay
500
 ¥ Mid Bay 60 Â
5 500
Month
>
400
300
200
100
Fig. 6. Seasonal patterns (based on data for 1989 to 1991) of vertically integrated chlorophyll a for both the euphotic zone
and the entire water column
Lower Bay
-
-
- Â
o a
- Â O
O a  ¥ a*  ; o 8 q a à ˆ e o 8 8 . e 0 , I I I , , ,
J F M A M J J A S O N D

Mar. Ecol. Prog. Ser. 116: 217-231, 1995 -
for the remainder of the year The highly turbid UB, on the other hand, showed only a very weak seasonal pattern in chl a , with low biomass throughout the year, and an annual mean chl a value of only 28 m g chl a m 2 . Thus, for the MB and LB stations, plankton pro- duction rates are in fact out o f phase with biomass levels, a finding also found previously b y Malone et al. (1986, 1988) for the mesohaline region o f the Bay. In their review of estuarine production, however, Boyn- ton et al. (1982) however, found that in the majority of estuaries sampled, annual plankton production patterns paralleled those of algal biomass, as indicated b y chl a.
Seasonal and regional variations in respiration
As with rates o f Pn, plankton community respiration rates at each station exhibited clear seasonal patterns (Fig. 7 ) , with peak volumetnc rates occurring during summer and minimal rates during the colder months (Fig. 4 ) . The greatest seasonal variation m respiration rates occurred in the upper layer of the MB station, which ranged from 0.005 Â 0.002 to 0.077 Â 0.010 m g O2 1 ' h i . Although upper and lower layer rates for MB were comparable during the colder months (November, February, March), as upper layer rates began to increase rapidly during the vernal warming, lower layer rates declined, approaching zero in the July and August periods of anoxia. As with production rates, MB respiration showed a substantial increase at the September 1991 sampling date. As was the case for production rates, the seasonal pattern in respiration at the UB station exhibited the narrowest range in rates (0.003 Â 0.001 to 0.022 Â 0.003 m g 0, I-' h-I) o f the 3 stations. Measured rates in the upper and lower layers showed no significant difference from each other throughout the year, in line with the observation o f little or no distinct vertical stratification at this station, based on salinity and temperature data (Fig. 4 ) . While, on average, rates at both MB and LB tended to be com- parable, rates at LB exhibited a smaller seasonal range. Upper layer respiration rates at LB tended to exceed lower layer rates throughout the vernal warming and peaked during June and July. Lower layer water tem- peratures in the southern Bay, however, did not reach their maximum until August (Fig. 4) . At this t ime, lower layer respiration rates not only were at their annual peak, but were in fact higher than surface layer rates. This pattern of peak respiration rates coinciding with annual temperature maxima has been reported for other estuaries (Lima & Williams 1978, Turner 1978, Hopkinson 1985, Kenney et al. 1988, Hopkinson et al. 1989), as well as previously for the mesohaline region of Chesapeake Bay (Kemp et al. 1992, Sampou & Kemp
0.05 Upper Bay
'< 0.10 fQ - cx Lower Bay
0 . 0 ~ 1 1 1 0.02 ''.
------ 'p-- 0.00
J F M A M J J A S O N D
Month
Fig. 7. Seasonal patterns (based on data for 1989 to 1991) of plankton community respiration rates (mean  SE) within the upper (R") and lower (R,) water column at the 3 stations. Estimated monthly mean values for upper layer (solid lines) and lower layer (dashed lines) are based on exponential
relationships with temperature (shown in Fig. 8)
1994). Although this same pattern has been reported for an open-water area o f the Baltic (Kuparinen 1987), an exception to this seasonal trend was indicated in a Danish estuary, where peak respiration rates occurred during the spring, coincident with peak production rates (Jensen et al. 1990).
Mean measured daily volumetric respiration rates (here expressed as m g O2 m 3 d d l for comparison with other published rates) for the upper layers of both MB and LB (658 and 518 m g 0, m-3 d-', respectively) observed in this study are among the highest annual mean rates reported for temperate estuarine environ- ments (Table 3 in Hopkinson 1985). Previous investiga-
Smith & Kemp: Variations in plankton community production and respiration -
tors have reported planktonic respiration rates for the mesohaline region of Chesapeake Bay that range from approximately 200 to 1700 m g O z irr3 d"' over the course of the annual cycle (Kemp & Boynton 1980, Taf t et al. 1980, Tuttle et al. 1987, Kemp et al. 1992). Al- though rates from these studies are generally similar to those presented here for MB, minimum and maximum respiration rates found in this study (120 and 1848 m g O2 m 3 d l ) slightly exceed any previous reports. In contrast to the MB and LB stations, the UB station showed markedly lower annual mean respiration rates (250 m g O z m 3 d l ) . In attempting to balance a carbon budget for this upper Bay region, taking account o f the large inputs of organic matter, Biggs & Flemer (1972) calculated (by dif ference) a total water column respira- tion of 39 000 t C yr-I, or 0.24 g C m-2 d-*. This value (assuming a RQ of 1 .O: Hopkinson 1985) is roughly half the annual mean areal rate o f 0.4 Â 0.1 g C m 2 d i for planktonic respiration at UB measured in this study. No previous direct measures of plankton community respiration have thus far been reported in the litera- ture for any region in the upper Chesapeake Bay. In addition, as with plankton production, no previous reports o f plankton community respiration rates are available in the literature for comparison with those rates reported here for the lower polyhaline region o f the Bay.
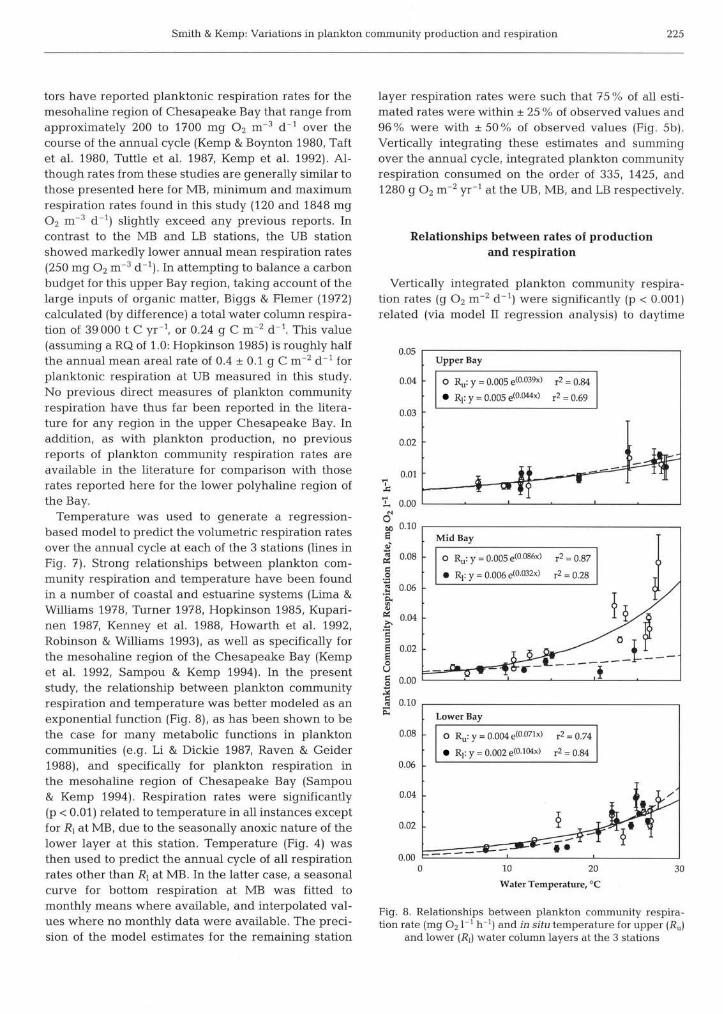
Temperature was used to generate a regression- based model to predict the volumetric respiration rates over the annual cycle at each of the 3 stations (lines in Fig. 7 ) . Strong relationships between plankton com- munity respiration and temperature have been found in a number of coastal and estuarine systems (Lima & Williams 1978, Turner 1978, Hopkinson 1985, Kupari- nen 1987, Kenney et al. 1988, Howarth et al. 1992, Robinson & Williams 1993), as well as specifically for the mesohaline region of the Chesapeake Bay (Kemp et al. 1992, Sampou & Kemp 1994). In the present study, the relationship between plankton community respiration and temperature was better modeled as an exponential function (Fig. 8 ) , as has been shown to b e the case for many metabolic functions in plankton communities (e.g. Li & Dickie 1987, Raven & Geider 1988), and specifically for plankton respiration in the mesohaline region of Chesapeake Bay (Sampou & Kemp 1994). Respiration rates were significantly ( p < 0.01) related to temperature in all instances except for Ri at MB, due to the seasonally anoxic nature o f the lower layer at this station. Temperature (Fig. 4 ) was then used to predict the annual cycle o f all respiration rates other than Ri at MB. In the latter case, a seasonal curve for bottom respiration at MB was fitted to monthly means where available, and interpolated val- ues where no monthly data were available. T h e preci- sion of the model estimates for the remaining station
layer respiration rates were such that 75 % of all esti- mated rates were within  25 % o f observed values and 96% were with  50% o f observed values (Fig. 5b) . Vertically integrating these estimates and summing over the annual cycle, integrated plankton community respiration consumed on the order of 335, 1425, and 1280 g Oa m-2 yr-l at the UB, MB, and LB respectively.
Relationships between rates of production and respiration
Vertically integrated plankton community respira- tion rates ( g O2 m 2 d l ) were significantly ( p < 0.001) related (via model I1 regression analysis) to daytime
Upper Bay
0 Ru: y = 0.005 e(0-039x) r2 = 0.84
Ri: y = 0.005 e(O 044x) r^ 0.69
0 03
CLi Lower Bay
0 RU: y = 0.004 e(Oo71x) r2 = 0.74
R,: y = 0.002 e(0 ̂ x) 1-2 = 0.84 0 06
0 10 20 30
Water Temperature, O C
Fig. 8. Relationships between plankton community respira- tion rate (mg 0; 1 ' h l ) and in situ temperature for upper (R")
and lower (Ri) water column layers at the 3 stations

226 Mar, Ecol, Prog Ser. 116: 217-231, 1995
net community production at the UB and MB stations, but no such relationship was seen at the LB station (Fig. 9). The slope of the regression equation for the MB station was not significantly different from unity (Student's t-test at p < 0.01) and showed little variation around the line (r2 = 0.90). This would suggest a closely balanced coupling of production and respiration at the annual scale. For the UB station, although the slope of the regression was significantly below unity (p < 0.01), respiration values were great enough such that respi- ration generally exceeded Pn and the regression line converged on the 1:l line only at the highest rates measured. The positive y-intercept of the regression
5 ^ Upper Bay ^
Y o ^ I fi 0 1 2 3 4 5 6 15 no " MidBay a ? . * . y = 1.03 + 1.12 x, r2 = 0.90
O ^ ~ ~ - a ' ~ ~ s ~ ' ~ ~ ~ * 1 0 5 10 15
Net Plankton Community Production Rate, g Oy m-2 d-1
Fig. 9. Relationships between integrated plankton community respiration (g O2 m 2 d l ) and net community production (g 0; m 2 d l ) at the 3 stations. Dashed line indicates 1:l relationship, solid line represents linear (model 11) regression estimate. Error bars equal estimate of the propagated standard
error for each rate
was significantly different from zero (p < 0.05), imply- ing a background respiration rate of 0.46 g O2 m 2 d l not associated with the in situ planktonic production. This value is equivalent to nearly half the annual mean respiration rate measured at this station. For the LB station, there was no significant (p < 0.05 level) slope or intercept to the relationship between production and respiration, with most of the data points lying well to the production side of the 1:l line. This seems to suggest, then, that over the time scale of this regres- sion, there is little or no coupling between the 2 meta- bolic processes within the plankton community at this station.
A close coupling between plankton production and respiration does not immediately imply causality by either variable. Heterotrophic respiration can be de- pendent on the supply of organic matter from contem- poraneous autotrophic production. Conversely, under nutrient limited conditions, autotrophic productivity can be limited by nutrient regeneration associated with heterotrophic respiration. Although the question of control in this autotrophic-heterotrophic coupling is largely circular, differences in environmental condi- tions at the 2 stations suggest different causal direc- tions. The strong correlation between production and respiration at UB suggests the responsiveness of heterotrophic metabolism to in situ phytoplankton production at this station, even with the high organic loading to this region (Biggs & Flemer 1972). Daytime net production levels at the UB station are substantially lower than those at the other 2 stations, however, and this is also reflected m respiration rates. The high turbidity, even m the face of high nutrient loading (Schubel & Pritchard 1986), results in Pn being light- limited (Fisher et al. 1988, 1992). The MB station, on the other hand, is well below the turbidity maximum and has been shown to be nutrient hmited throughout the year (Fisher et al. 1992). Within this region, nutri- ent levels are, in fact, at their lowest concentrations when rates of Pn are greatest (Malone et al. 1988). For estuaries in general, high summer productivities under low ambient inorganic nutrient concentrations has often been interpreted as an indication of the impor- tance of temperature-dependent heterotrophic nutri- ent recycling in regulating primary production (Boyn- ton et al. 1982, Kemp & Boynton 1984, Kenney et al. 1988). The tightly balanced relationship between res- piration and production seen at the MB station in the present study would then appear to be a reflection of the efficient nutrient recycling, at the annual scale, within the mesohaline region of Chesapeake Bay.
Over shorter time scales, close coupling between production and respiration was dramatically demon- strated in the September (1991) sampling date at the MB station. The timing of this sampling cruise was

228 Mar. Ecol. Prog. Ser 116: 217-231, 1995
and organic matter were greatest, P: R ratios at each station deviated significantly from zero. During spring at the UB station, when turbidity and light extinction coefficients were at their highest (data not shown), levels of Pn were low. Relatively high rates of commu- nity respiration at this time, however, combined to drive P : R ratios significantly below 1. This spring period of net heterotrophic plankton community metabolism was coincident with the timing of maximum allochthonous organic input from the Susquehanna River (Biggs & Flemer 1972). For MB and LB, the pattern was re- versed. Here the plankton community metabolism was distinctly autotrophic in nature during the springtime period. P : R ratios reached a maximum of almost 2 at MB and slightly over 4 at LB, although the variation at LB was much greater, possibly reflecting the uncou- pled nature of production and respiration seen at this station. Evidently, for the MB and LB stations, spring- time allochthonous inputs of inorganic nutrients were more important than inputs of organic matter. This, coupled with the fact that daytime net plankton pro- duction was less temperature-dependent than respira- tion, led to relatively high P:R ratios in spring. The differential responses of respiration and production to temperature, however, resulted in P : R converging on unity over the course of the vernal warming. As a result, when individual metabolic rates were at their maximal measured rates, P:R ratios were, in fact, clos- est to unity (Figs. 3, 7 & 10).
It is interesting to note that the convergence of P and R appeared to occur between May and June at each station, when water temperatures were in the range of 18 to 20° (Fig. 4). At least for the well-documented mesohaline region of the Bay, it is during this tune that the annual transition from a spring bloom of large diatoms to a summer assemblage of smaller flagellated cells occurs (Sellner 1987, Malone et al. 1988). Also at this time, pico- and nanoplankton increase to become substantial contributors of phytoplankton primary pro- duction (McCarthy et al. 1984, Malone et al. 1991) and it appears that a large fraction of organic production is shunted through the microbial loop (Jonas & Tuttle 1990, Malone et al. 1991, Ducklow & Shiah 1993). At
the LB station, the decline in diel plankton community metabolism to heterotrophy observed in June (Fig. 10) was followed by a modest increase during July and August (on 4 of 5 occasions during this period P:R was distinctly positive).
While the ratio P: R indicates the relative degree of autotrophy or heterotrophy, the absolute amount of net organic matter production or consumption is a function of the magnitude of P and R. Seasonal means for diel net plankton community metabohsm have been calcu- lated for both the upper (euphotic) layer (NPMu) and for the entire water column (NPM) at the 3 stations (Table 2). NPMu was net autotrophic in all cases except in the spring at UB and fall at LB, when Pn levels were markedly lower, and was thus capable of supplying in situ organic matter to fuel lower layer heterotrophic consumption at each station. Highest rates of NPMu occurred at the LB station during summer and aver- aged roughly 7.0 g O2 m 2 d l . The longitudinal pro- gression m springtime plankton P : R ratios discussed above can clearly be seen in mean NPM values as going from a net consumption of -0.40 g O2 m 2 d l at UB to a net production of 1.05 g O2 m-2 d" at MB and 4.15 g O2 m 2 d l at LB. As water column P : R ratios approached unity in warmer seasons, NPM was zero during summer and fall at both UB and MB; at the LB station, however, NPM was positive, reaching almost 3.0 g O2 m^ d-I.
It appears that the negative NPMvalue of -0.40 g O2 m 2 d l at the UB station during spring reflects a sub- stantial subsidy of allochthonous organic inputs to the plankton community. Because mean in situ rates of Pn at this time were only 0.55 g O2 m 2 d l r plankton com- munity respiration was dependent on an additional external source of organic matter equivalent to some 70% Pn. A reasonable alternative source of organic matter supporting this net heterotrophy at the UB station would be that transported by the Susquehanna River. The average mean delivery rate of total organic carbon for the period of March to May, over an 11 yr record from 1978 to 1988, was 6.7 x lo5 kg C d-I (B. Summers unpubl. data). Assuming this load is evenly distributed over the upper Bay area from the Susque-
Table 2. Seasonal mean values for net plankton community metabolism (g O2 m 2 d l ) for the upper layer (NPMu) and entire water column (NPM) of Chesapeake Bay during winter-spring (January-May), summer (July-August), and Fall (Septem- ber-December). Zero values indicate rates not significantly different (at the p > 0.05 level) from balanced metabolism. Values in
parentheses are standard errors of the means
Season Upper Bay NPM, NPM
Mid Bay NPMn NPM
Lower Bay NPM, NPM
Winter-spring 0 -0.4 (0.2) Summer 0.7 (0.2) 0 Fall 0.2 (0.1) 0
Smith & Kemp: Variations in plankton community production and respiration 229
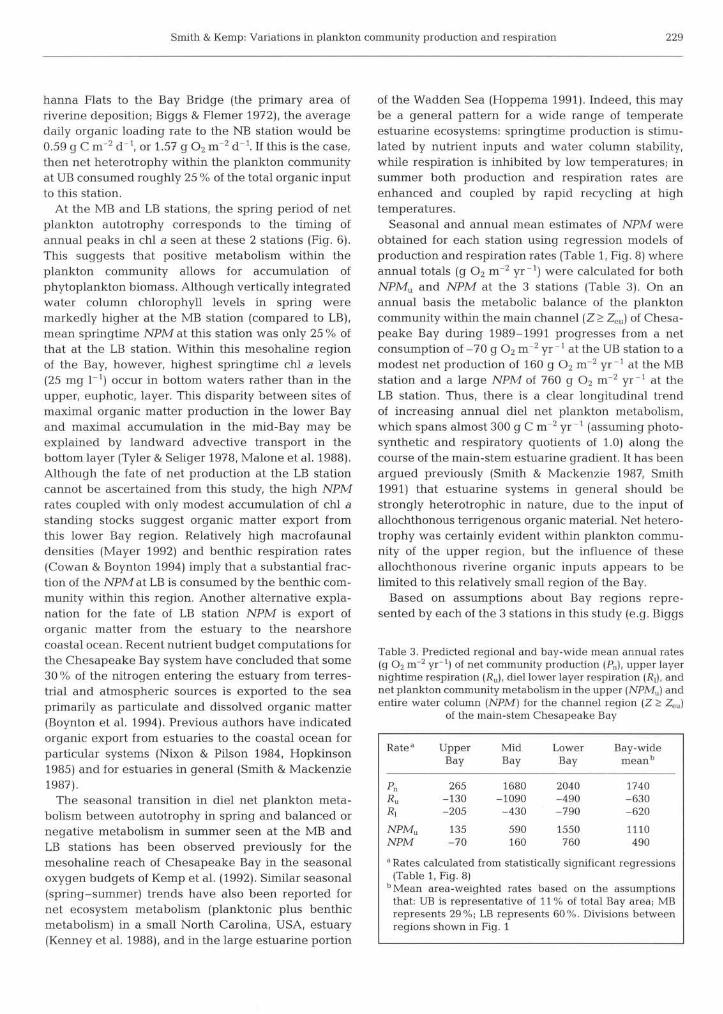
hanna Flats to the Bay Bridge (the primary area of riverine deposition; Biggs & Flemer 1972), the average daily organic loading rate to the NB station would be 0.59 g C m-2 d-I, or 1.57 g O2 m-2 dA1. If this is the case, then net heterotrophy within the plankton community at UB consumed roughly 25 % of the total organic input to this station.
At the MB and LB stations, the spring period of net plankton autotrophy corresponds to the timing of annual peaks in chl a seen at these 2 stations (Fig. 6). This suggests that positive metabolism within the plankton community allows for accumulation of phytoplankton biomass. Although vertically integrated water column chlorophyll levels in spring were markedly higher at the MB station (compared to LB), mean springtime NPM at this station was only 25 % of that at the LB station. Within this mesohaline region of the Bay, however, highest springtime chl a levels (25 mg 1 ' ) occur in bottom waters rather than in the upper, euphotic, layer. This disparity between sites of maximal organic matter production in the lower Bay and maximal accumulation in the mid-Bay may be explained by landward advective transport in the bottom layer (Tyler & Seliger 1978, Malone et al. 1988). Although the fate of net production at the LB station cannot be ascertained from this study, the high NPM rates coupled with only modest accumulation of chl a standing stocks suggest organic matter export from this lower Bay region. Relatively high macrofaunal densities (Mayer 1992) and benthic respiration rates (Cowan & Boynton 1994) imply that a substantial frac- tion of the NPM at LB is consumed by the benthic com- munity within this region. Another alternative expla- nation for the fate of LB station NPM is export of organic matter from the estuary to the nearshore coastal ocean. Recent nutrient budget computations for the Chesapeake Bay system have concluded that some 30 % of the nitrogen entering the estuary from terres- trial and atmospheric sources is exported to the sea primarily as particulate and dissolved organic matter (Boynton et al. 1994). Previous authors have indicated organic export from estuaries to the coastal ocean for particular systems (Nixon & Pilson 1984, Hopkinson 1985) and for estuaries in general (Smith & Mackenzie 1987).
The seasonal transition in diel net plankton meta- bolism between autotrophy in spring and balanced or negative metabolism in summer seen at the MB and LB stations has been observed previously for the mesohaline reach of Chesapeake Bay in the seasonal oxygen budgets of Kemp et al. (1992). Similar seasonal (spring-summer) trends have also been reported for net ecosystem metabolism (planktonic plus benthic metabolism) in a small North Carolina, USA, estuary (Kenney et al. 1988), and in the large estuarine portion
of the Wadden Sea (Hoppema 1991). Indeed, this may be a general pattern for a wide range of temperate estuarine ecosystems: springtime production is stimu- lated by nutrient inputs and water column stability, while respiration is inhibited by low temperatures; in summer both production and respiration rates are enhanced and coupled by rapid recycling at high temperatures.
Seasonal and annual mean estimates of NPM were obtained for each station using regression models of production and respiration rates (Table 1, Fig. 8) where annual totals (g O2 m 2 y r ) were calculated for both NPMu and NPM at the 3 stations (Table 3). On an annual basis the metabolic balance of the plankton community within the mam channel (Z > Zeu) of Chesa- peake Bay during 1989-1991 progresses from a net consumption of -70 g O2 m 2 yr at the UB station to a modest net production of 160 g O2 m 2 yr-l at the MB station and a large NPM of 760 g Oz m-- yr-I at the LB station. Thus, there is a clear longitudinal trend of increasing annual diel net plankton metabolism, which spans almost 300 g C m 2 yr-I (assuming photo- synthetic and respiratory quotients of 1.0) along the course of the main-stem estuarine gradient. It has been argued previously (Smith & Mackenzie 1987, Smith 1991) that estuarine systems in general should be strongly heterotrophic in nature, due to the input of allochthonous terrigenous orgamc material. Net hetero- trophy was certainly evident within plankton commu- nity of the upper region, but the influence of these allochthonous riverine organic inputs appears to be limited to this relatively small region of the Bay.
Based on assumptions about Bay regions repre- sented by each of the 3 stations in this study (e.g. Biggs
Table 3. Predicted regional and bay-wide mean annual rates (g 0; m 2 y r ) of net community production ( P J , upper layer nightime respiration (R"), diel lower layer respiration (R,), and net plankton community metabolism in the upper (NPMu) and entire water column (NPM) for the channel region (2 > Zeu)
of the main-stem Chesapeake Bay
Ratea Upper Mid Lower Bay-wide Bay Bay Bay mean
NPM,, 135 590 1550 1110 NPM -70 160 760 490
a Rates calculated from statistically significant regressions (Table 1, Fig. 8)
"Mean area-weighted rates based on the assumptions that: UB is representative of 11 % of total Bay area; MB represents 29 %; LB represents 60%. Divisions between regions shown in Fig. 1

230 Mar. Ecol, Prog. Ser. 116: 217-231, 1995
& Flemer 1972) and published hypsographic data (Cronin & Pritchard 1975) we were able to estimate the bay wide mean rate of die1 net plankton community metabolism. While the overall (plankton plus benthic) organic balance has yet to be quantified for Chesa- peake Bay, it is clear that the plankton community within the main-stem Bay is strongly autotrophic in nature, despite respiration rates that were among the highest recorded for aquatic systems. On a mean bay-wide level the positive net plankton production (494 g Oz m - yr-l; 185 g C m-2 yr-I assuming PQ = RQ = 1.0) represents a substantial source of organic matter available for export to the benthos, to higher pelagic trophic levels, or to the adjacent coastal eco- system,
Acknowledgements. This study was supported in part by the NOAA, Maryland Sea Grant College (RIP-32) and NSF LMER Program (No. BSR-8814272). We acknowledge contributions of W. Boicourt, W. Boynton, J . Cornwell and T. Malone in their reviews of an earher version of this manuscript, as well as the contributions of anonymous reviewers. We are indebted to Lisa Rossman who help collect field data, and to Steve Kelly and Sherry Pike for chlorophyll a data. We thank T. R. Fisher for use of unpublished light data. Linda May and Lee May were generous in assisting with both SAS applications and error analyses, particularly in differentiating the error-propa- gation equation. We also express thanks to the captains and crew of the RV 'Warfield', 'Cape Hatteras', and especially the 'Cape Henlopen'.
LITERATURE CITED
Bender, M L., Grande, K. D. (1987). Production, respiration, and the isotope geochemistry of oxygen in the upper water column. Global biogeochem. Cycles 1: 49-59
Bevington, P. R. (1969). Data reduction and error analysis for the physical sciences. McGraw-Hill, New York
Biggs, R. B , Flemer, D. A. (1972). The flux of particulate carbon in an estuary. Mar. Biol. 12: 11-17
Boynton, W. R., Garber, J. H., Summers, R. , Kemp, W. M. (1994). Inputs, transformations and transport of nitrogen and phosphorus in Chesapeake Bay and selected tribu- taries. Estuaries (in press)
Boynton, W. R. , Kemp, W M., Keefe, C. W. (1982). A compar- ative analysis of nutrients and other factors influencing estuarine phytoplankton production. In: Kennedy, V. (ed.) Estuarine compansons. Academic Press, New York, p 67-90
Carntt, D. E., Carpenter, J. H. (1966). Comparison and evalu- ation of currently employed modifications of the Winkler method for determining dissolved oxygen in seawater; a NASCO report. J. mar. Res. 24: 286-319
Cowan, J L. W., Boynton, W. R. (1994). Sediment-water oxygen and nutrient exchanges along the longitudinal axis of Chesapeake Bay. Estuaries (in press)
Cromn, W. B., Pritchard, D. W. (1975). Additional statistics on the dimensions of the Chesapeake Bay and its tributaries: cross-sectional widths and segment volumes per meter depth. Ches, Bay Inst. Spec. Rep. 42
Ducklow, H. W., Shiah, F. (1993). Bacterial production in estu- aries. In: Ford, T. (ed.) Aquatic microbiology: an ecological
approach. Blackwell Scientific, New York, p. 261-288 Fisher, T. R., Harding, L. W., Stanley, D. W., Ward, L. G.
(1988). Phytoplankton, nutrients, and turbidity in the Chesapeake, Delaware, and Hudson estuaries. Estuar. coast. Shelf Sci. 27: 61-93
Fisher, T. R., Peele, E. R., Ammerman, J . W., Harding, L. W. (1992). Nutrient limitation of phytoplankton in Chesa- peake Bay. Mar. Ecol. Prog. Ser. 82: 51-63
Flemer, D. A. (1970). Pnmary production in Chesapeake Bay. Chesapeake Sci. 11: 117-129
Gaarder, T., Gran, H. H. (1927). Investigation of the produc- tion of plankton in the Oslo Fjord. Rapp. P.-v. Cons. int. Explor. Mer 42: 1-48
Geider, R. J . (1992). Respiration: taxation without representa- tion. In: Falkowski, P. G., Woodhead, A. D. (eds.) Primary productivity and biogeochemical cycles in the sea. Plenum Press, New York, p. 333-360
Goodrich, D. M., Boicourt, W. C. , Hamilton, P., Pritchard, D. W. (1987). Wind-induced destratification in Chesa- peake Bay. J . phys. Oceanogr. 17: 2232-2240
Gnffith, P. C. (1988). A high-precision respuometer for meas- uring small rates of change in the oxygen concentration of natural waters. Limnol. Oceanogr. 33: 632-638
Hardmg, L. W,, Messon, B. W., Fisher, T. R. (1986). Phyto- plankton production m two east coast estuaries' photo- synthesis-hght functions and patterns of carbon assimila- tion in Chesapeake and Delaware Bays. Estuar. coast. Shelf Sci. 23: 773-806
Hartwig, E. O., Michael, J. A. (1978). A sensitive photoelectric Winkler titrator for respiration measurements. Environ. Sci. Technol. 12: 712-715
Hopkinson, C. S. (1985). Shallow-water benthic and pelagic metabolism: evidence of heterotrophy in the nearshore Georgia Bight. Mar. Biol. 87: 19-32
Hopkinson, C. S., Sherr, B., Wiebe, W. J . (1989). Size fraction- ated metabohsm of coastal microbial plankton Mar. Ecol Prog Ser. 51: 155-166
Hoppema, J . M. (1991). The oxygen budget of the western Wadden Sea, The Netherlands. Estuar. Coast. Shelf Sci. 32: 483-502
Howarth, R. W., Marino, R., Garret, R., Sherman, D. (1992). Ecosystem respiration and organic carbon processing in a large, tidally influenced river- the Hudson River. Biogeo- chemistry 16: 83-102
Iverson, R. L. (1990). Control of marine fish production. Limnol. Oceanogr. 35: 1593-1604
Jassby, A. D., Platt, T. (1976). Mathematical formulation of the relationship between photosynthesis and light for phyto- plankton. Limnol. Oceanogr. 21: 540-547
Jensen, L. M., Sand-Jenson, K., Marcher, S., Hansen, M. (1990). Plankton community respiration along a nutrient gradient in a shallow Danish estuary. Mar. Ecol. Prog. Ser. 61: 75-85
Jonas, R. B., Tuttle, J . H. (1990). Bacterioplankton and organic carbon dynamics in the lower mesohahne Chesapeake Bay. Appl. environ. Microbiol. 56: 747-757
Kana, T. M. (1990). Light-dependent oxygen cycling meas- ured by an oxygen-18 isotope dilution technique. Mar. Ecol. Prog. Ser. 64: 293-300
Kemp, W. M., Boynton, W. R. (1980). Influence of biological and physical factors on dissolved oxygen dynamics in an estuarine system: implications for measurement of com- mumty metabolism. Estuar. coast. mar. Sci. 11: 407-431
Kemp, W. M., Boynton, W. R. (1984). Spatial and temporal coupling of nutrient inputs to primary production: the role of particulate transport and decomposition. Bull. mar. Sci. 35: 522-535

Smith & Kemp: Variations in plankton community production and respiration 23 1
Kemp, W. M., Sampou, P. A,, Garber, J , , Tuttle, J., Boynton, W. R. (1992). Seasonal depletion of oxygen from bottom waters of Chesapeake Bay: roles of benthic and planktonic respiration and physical exchange processes. Mar. Ecol. Prog. Ser 85: 137-152
Kenney, B. E., Litaker, W., Duke, C. S., Ramus, J . (1988). Com- munity oxygen metabolism in a shallow tidal estuary. Estuar. coast. Shelf Sci. 27: 33-43
Kuparinen, J . (1987). Production and respiration of overall plankton and ultraplankton communities at the entrance to the Gulf of Finland in the Baltic Sea. Mar. Biol 93: 591-607
Langdon, C (1984) Dissolved oxygen monitoring system using a pulsed electrode: design, performance and evalu- ation. Deep Sea Res. 31- 1357-1367
Li, W. K W., Dickie, P M. (1987) Temperature characteristics of photosynthetic and heterotrophic activities: seasonal variations in temperate microbial plankton. Appl environ. Microbiol. 53- 2282-2295
Lima, H. d S., Williams, P. J . LeB. (1978). Oxygen consump- tion by the planktonic population of an estuary - Southampton Water. Estuar. coast. mar. Sci. 6: 515-521
Malone, T. C., Crocker, L. H., Pike, S. E., Wendler, B. W. (1988). Influences of river flow on the dynamics of phyto- plankton production in a partially stratified estuary. Mar. Ecol. Prog. Ser, 48: 235-249
Malone, T, C., Ducklow, H. W., Peele, E. R., Pike, S. E. (1991) Picoplankton carbon flux in Chesapeake Bay. Mar. Ecol. Prog. Ser 78: 11-22
Malone, T. C., Kemp, W. M , Ducklow, H. W., Boynton, W. R., Tuttle, J . H., Jonas, R. B (1986). Lateral variation in the production and fate of phytoplankton in a partially strati- fied estuary. Mar. Ecol. Prog. Ser. 32: 149-160
Marquardt, D. W. (1963). An algorithm for least squares esti- mation of nonlinear parameters. J. Soc. Ind. Appl. Math. 11: 431-441
Mayer, M. S. (1992). Effects of benthic macrofauna on nitro- gen cycling and oxygen consumption of estuanne sedi- ments. Ph.D. thesis, University of Maryland, College Park
McCarthy, J. J., Kaplan, W., Nevins, J. L. (1984). Chesapeake Bay nutrients and phytoplankton dynamics. 2. Sources and sinks of NO2-. Limnol. Oceanogr. 29: 84-98
Nixon, S. W., Oviatt, C. A , Frithsen, J., Sullivan, B. (1986). Nutrients and the productivity of estuarine and coastal marine ecosystems. J. Limnol. Soc. S. Afr. 12: 43-71
Nixon, S. W., Pilson, M. E. Q. (1984). Estuarine total system metabolism and organic exchange calculated from nutrient ratios: an example from Narragansett Bay. In: Kennedy, V. S. (ed.) The estuary as a filter. Academic Press, New York, p. 261-290
Odum, H. T. (1956). Primary production in flowing waters. Limnol. Oceanogr. 1: 102-1 17
Oudot, C., Gerard, R., M o m , P. (1988). Precise shipboard determination of dissolved oxygen (Winkler procedure) for productivity studies with a commercial system. Limnol Oceanogr. 33: 146-150
Parsons, T. R., Malta, Y., Lalli, C. (1984). A manual of chemi- cal and biological methods for seawater analysis. Perga- mon Press, Oxford
Peterson, B. J . (1980). Aquatic primary productivity and the 14C-C02 method: a history of the productivity problem. A. Rev. Ecol. Syst. 11: 359-385
Raven, J . A,, Geider, R. J. (1988). Temperature and algal growth. New Phytol. 110: 441-461
Robinson, C., Williams, P. J . L. (1993). Temperature and arctic plankton community respiration. J . Plankton Res 15- 1035-1052
Ryther, J. H. (1954). The ecology of phytoplankton blooms in Monches Bay and Great South Bay, Long Island, New York. Biol. Bull. 106: 198-209
Sampou, P , Kemp, W. M. (1994). Factors regulating plankton community respiration in Chesapeake Bay. Mar. Ecol. Prog. Ser. 110: 249-258
Schubel, J . R., Pritchard, D W (1986) Responses of upper Chesapeake Bay to variations in discharge of the Susque- hanna River Estuaries 9: 236-249
Sellner, K. (1987). Phytoplankton in Chesapeake Bay. role in carbon, oxygen and nutrient dynamics In- Majumdar, S. K., Hall, J . L W., Austin, H M. (eds ) Contaminant problems and management of living Chesapeake Bay resources. The Pennsylvania Academy of Science, Easton, p. 134-157
Smith, S. V. (1991). Stoichometry of C:N:P fluxes in shallow- water marine ecosystems. In- Cole, J , Lovett, G , Findlay, S. (eds.) Comparative analyses of ecosystems. Patterns, mechamsms, and theories. Springer-Verlag, New York, p. 259-286
Smith, S. V., Mackenzie, F. T. (1987). The ocean as a net heterotrophic system: Implications from the carbon bio- geochemical cycle. Global biogeochem Cycles 1: 187-198
Steemann-Nielsen, E. (1952). The use of radioactive carbon (14C) for measuring organic production in the sea. J. Cons. int. Explor. Mer 18: 117-140
Taft, J L., Taylor, W. R., Hartwig, E O., Loftus, R. (1980). Sea- sonal oxygen depletion in Chesapeake Bay. Estuaries 3: 242-247
Turner, R. E. (1978). Community plankton respiration in a salt marsh estuary and the importance of macrophytic leachates. Limnol. Oceanogr. 23' 442-451
Tuttle, J. H., Jonas, R. R., Malone, T C (1987). Origin, devel- opment and significance of Chesapeake Bay anoxia. In. Majumdar, S. K., Hall, L W , Austin, H M. (eds.) Contam- inant problems and management of living Chesapeake Bay Resources. The Pennsylvania Academy of Science, Easton, p. 442-472
Tyler, M. A,, Seliger, H. H. (1978). Annual subsurface trans- port of a red tide dinoflagellate to its bloom area: water circulation patterns and organism distributions in the Chesapeake Bay. Limnol. Oceanogr. 23: 227-246
Van Es, F. B. (1982). Community metabolism of intertidal flats in the Ems-Dollard estuary. Mar. Biol. 66- 95-108
Williams, P. J. LeB. (1984). A review of measurements of res- piration rates of marine plankton populations. In: Hobble, J . E., Wilhams, P. J. LeB. (eds.) Heterotrophic activity in the sea. Plenum Press, New York, p 357-389
Williams, P. J. LeB., Jenkmson, N. W. (1982). A transport- able microprocessor-controlled precise Winkler titration suitable for field stations and shipboard use. Limnol. Oceanogr. 27: 576-584
Wofsy, S. C. (1983). A simple model to predict extinction coef- ficients and phytoplankton biomass in eutrophic waters. Lunnol. Oceanogr. 28: 1144-1155
This article was submitted to the editor Manuscript first received: March 14, 1994 Revised version accepted: September 30, 1994