seasonal effects of water quality changes in neyyar river ... · pdf fileseasonal effects of...
TRANSCRIPT

International Journal of Scientific and Research Publications, Volume 7, Issue 7, July 2017 703 ISSN 2250-3153
www.ijsrp.org
Seasonal Effects of Water Quality Changes in Neyyar River, Kerala, India
Badusha M* and S Santhosh*
* P.G. & Research Department of Zoology, N.S.S. College, Pandalam, Kerala, India Abstract- The seasonal fluctuations in various physico-chemical parameters in the water were investigated in the six sampling sites namely Neyyar Dam, Kallikkadu, Mandapathinkadavu, Aruvippuram, Neyyattinkara and Poovar of Neyyar River on the basis of their physiographic distribution during north east monsoon and pre-monsoon. Water temperature broadly fluctuated between 27.00C at Neyyar dam in north east monsoon to 33.20C at Neyyattinkara in pre-monsoon. Though, seasonal influence was marginal, a lowering in pH was generally visible during north east monsoon. In the station near coast, impact of saline intrusion was obvious in the distribution of EC. TDS varied broadly between 20.4mg/l to 16000mg/l, respectively in the reservoir and the Poovar. Correspondingly the chloride also has been gradually increasing towards downstream. In general turbidity is found to be low except occasional high values at Kallikadu. Our study indicates that alkalinity values are very less all along the river during both seasons and total hardness exceeds the prescribed limits in downstream stretches. The samples in the midland and lowland invariably showed considerable concentrations of the nutrient. Inverse to the distribution of DO, the BOD value was the minimum at reservoir and the maximum at Poovar. Significant correlations between the parameters were observed by using SPSS software. Index Terms- Neyyar, North east monsoon, Physico-chemical parameters, Physiography, Pre-monsoon.
I. INTRODUCTION ivers play an important role in human progress by providing drinking water, making the earth fertile and serving as a
medium for transport. The ecosystem services provided by rivers have been utilizing by humans without knowing the functions and vitality of river (Naiman, 1992). The nature of many of the rivers around the world are changed due to unscientific construction of bunds across the river, reclamation of water holding and purifying regions, overexploitation of their living and non-living resources and disposal of various waste materials directly in to the river. Indian river system is polluted mainly because of the human impact (Goel et al., 2001, Patil et al., 2003 and Maity et al., 2004) and major rivers are grossly polluted, especially beside the cities (Srivastava, 1992). The river water quality has been greatly influenced not only by such activities but natural and climatic determinants may also contribute. Pollution of river with the seasonal change in water quality is of great environmental concern worldwide. The Neyyar River is one of the important small catchment rivers in the south-western coast of India, originates from
Agasthya malai in the Western Ghat mountain ranges at an elevation of about 1866km above mean sea level. This small river flows through highly varied geologic and physiographic provinces of the area for a length of about 56km. Though, this river ecosystem face severe pollution threats because of the huge disposal of various waste materials, sand mining and agricultural practices at its bank, it is extensively used for domestic, recreational, drinking and irrigation purposes in the area. The water related issues are very critical in the small catchment rivers of developing economies with high incidence of human stress (Padmalal et al., 2011). The water quality of a riverine ecosystem can be assessed mostly by studying its physico-chemical characteristics. The seasonal change in surface water quality is an important aspect for evaluating temporal variations of river pollution (Ouyang et al., 2006). Under this context, the present study tries to focus on the water quality changes along the course of Neyyar River from the upstream stretch to the downstream during pre-monsoon and north east monsoon.
II. MATERIALS AND METHODS Neyyar is the southern-most river of Kerala State having a total basin area of 483sq. km, lies between 8o15′ to 8o40′-N latitudes and 77o00′ to 77o20′-E longitudes (Fig. 1). The river’s main tributaries are Chittar, Aruvikod thodu and Maruthur thodu. Six sites located along the upstream to downstream course of the river were sampled. The sampling sites such as Neyyar Dam (S1), Kallikadu (S2), Mandapathinkadavu (S3), Aruvippuram (S4), Neyyattinkara (S5) and Poovar (S6) are fixed along the river considering the physiography (Table 1). The sampling locations at Neyyar dam and Kallikkadu are situated at the highland physiographic area, whereas Mandapathinkadavu station is located at the transition area of highland and midland, Aruvippuram at the midland and Neyyattinkara and Poovar at the lowland. Water samples were collected from six sampling stations of the river monthly for two seasons namely Northeast monsoon (October to November-2015) and Pre-monsoon (March to April-2016). Water sample is analyzed for physico-chemical parameters such as Water temperature (WT), PH, Electrical Conductivity (EC), TDS, Turbidity (Turb.), Chloride (Cl), Total Alkalinity (T.Alk), Total Hardness (T.H), Nitrate (NOR3R-N), Phosphate (POR4R), Sulphate (SOR4R), DO and BOD. In-situ determination is done for parameters such as Water temperature, pH and alkalinity and samples of DO and BOD is chemically fixed in the field itself. All the analyses are carried out following standard methods (APHA, 2005). Seasonal average and standard deviation of data on water quality were calculated using
R

International Journal of Scientific and Research Publications, Volume 7, Issue 7, July 2017 704 ISSN 2250-3153
www.ijsrp.org
Microsoft Excel. The significance of the result was statistically verified by correlation coefficient analysis using SPSS package 16.00 and also significant difference in the value of each
parameter between sampling stations and between seasons was plotted graphically with the help of MS Excel.
Fig 1: Water sampling locations in Neyyar River
Table 1: Land use characteristics in the Neyyar River basin
Location Latitude &Longitude General Physiography Land use pattern
Neyyar Dam (S1) N08°32′6.3″ E77°08′44.0″ Highland Reserve forest
Kallikadu (S2) N08°31′46.4″ E77°07′39.4″ Highland Rubber and Mixed crops
Mandapathinkadavu (S3) N08°29′27.9″ E77°07′27.6″ Transition area Settlement with mixed crops
Aruvippuram (S4) N08°25′16.0″ E77°05′34.1″ Midland Mixed crops and settlement with mixed
tree crops
Neyyattinkara (S5) N08°24′9.6″ E77°05′19.6″ Lowland Settlement with mixed tree crops,
Municipal region
Poovar (S6) N08°18′30.5″ E77°04′36.9″ Lowland Coconut with mixed tree crops, Coastal
area

International Journal of Scientific and Research Publications, Volume 7, Issue 7, July 2017 705 ISSN 2250-3153
www.ijsrp.org
III. RESULTS AND DISCUSSION
The seasonal variations in the water quality parameters of the six sampling sites have summarized in Table-2 and Table-
3 and correlation between the parameters is shown in Table-4 and Table-5.
Table 2: Physico-chemical parameters of Neyyar River
Table 3: Range and SD of various water quality parameters
Rainfall indicates astonishingly higher north east monsoon than the south west monsoon (Fig -2), which has been observed in the southern districts of Kerala during the last 2-3 years. Such a shift in the rainfall pattern may have tremendous influence on the water availability and cropping pattern which needs to be investigated. Water temperature broadly fluctuated between 27.00C at Neyyar dam in north east monsoon to 33.20C at Neyyattinkara in pre-monsoon (Fig-3). The study indicates that the fluctuation in water temperature has a relative influence of rainfall. The pH in general varied between 6.6 and 8.15, the minimum value at the reservoir during north east monsoon and the maximum at Poovar in pre-monsoon. Though, seasonal influence was marginal, a lowering in pH was generally visible during north east monsoon (Fig-4). The pH is of near neutral to alkaline range suggesting well buffered river waters. Similar pH
ranges were also recorded by Gautam et al., (2000) in river Ganga at Rishikesh and Verma (2006) in river Narmada. Electrical conductivity in general varied between 29.5µmhos/cm at reservoir during north east monsoon (Fig-5) and 26410µmhos/cm at Poovar in pre-monsoon (Fig-6). Electrical conductivity of water also shows a marginal influence of rain. In the station near coast, impact of saline intrusion was visible. Its increase towards downstream could be due to the urban and agriculture drainage. The various ions added to the water from catchment areas regulate the conductivity of the water. TDS follows the trend of EC in all seasons, as TDS is directly proportional to EC. TDS varied broadly between 20.4mg/l to 16000mg/l, respectively in the reservoir during north east monsoon and the Poovar in pre-monsoon (Fig-7 and Fig-8).
Parameter Pre-monsoon North east monsoon
BIS S1 S2 S3 S4 S5 S6 S1 S2 S3 S4 S5 S6 WT(°C) 30.75 31 32.25 32.25 33.25 32.25 27 28 29 29.5 30 29 ….. PH 6.95 7.1 7.15 7.15 7.3 8.15 6.62 6.75 6.97 6.75 6.9 7.75 6.5-8.5 EC(μS/cm) 35 54.5 63.0 60.5 68.0 26410 29.5 43.0 47.5 52.0 50.2 19682.5 1500 TDS(mg/l) 24.5 34.8 37.35 38.45 41.7 16000 20.4 29.35 27.6 32.52 32.5 12355 500 Turbidity(NTU) 0.5 1 1 0.5 1 2 1 2 1.5 1.5 2.5 6.25 1 Chloride(mg/l) 7.3 9.5 15.4 15.35 24.65 16938 4.6 7.7 9.9 10.1 12.8 3614 250 Alkalinity(mg/l) 21 24.5 24.5 27 35 75.5 12.5 17 16.5 20 27.5 50 120 Hardness(mg/l) 11.1 14.6 15.6 15.4 18.3 594 7.3 12.6 10.5 12.1 14.7 472.2 300 Nitrate(mg/l) 0.24 0.33 0.36 0.33 1.36 2.39 0.41 0.46 0.52 0.49 2.41 3.96 45 Phosphate(mg/l) 0.039 0.06 0.045 0.05 0.06 0.07 0.045 0.075 0.055 0.075 0.105 0.175 0.1 Sulphate(mg/l) 0.26 0.34 0.39 0.39 3.08 1462 ND 0.11 0.13 0.12 0.98 664.5 200 DO(mg/l) 5.76 4.72 5.07 5.71 4.52 3.99 6.66 5.07 5.86 6.49 4.79 4.13 5 BOD(mg/l) 0.36 2.58 1.97 2.11 2.59 3.27 0.19 1.03 0.78 0.59 2.26 2.94 <3
Pre-monsoon WT pH Cond. Turb. TDS Cl T.Alk T.H SO4 NO3 PO4 DO BOD Min 30.75 6.95 35.0 0.5 24.5 7.3 21 11.1 0.26 0.24 0.039 3.99 0.36 Max 33.25 8.15 26410.0 2 16000 16938 75.5 594 1462 2.39 0.07 5.76 3.27
Range 30.75-33.25
6.95-8.15
35-26410 0.5-2 24.5-
16000 7.3-16938
21-75.5
11.1-594
0.26-1462
0.24-2.39
0.039-0.07
3.99-5.76
0.36-3.27
Average 31.96 7.3 4448.50 1 2696.13 2835.033 34.58 111.50 244.41 0.84 0.05 4.96 2.15 SD 0.93 0.43 10758.90 0.55 6517.54 6909.02 20.59 236.39 596.50 0.87 0.01 0.69 0.99
North east monsoon WT pH Cond. Turb. TDS Cl T.Alk T.H SO4 NO3 PO4 DO BOD Min 27 6.62 29.5 1 20.4 4.6 12.5 7.3 0 0.41 0.045 4.13 0.19 Max 30 7.75 19682.5 6.25 12355 3614 50 472.2 664.5 3.96 0.175 6.66 2.94
Range 27-30 6.62-7.75
29.5-19682.5
1-6.25
20.4-12355
6.5-14680
12.5-50
7.3-472.2
0-664.5
0.41-3.96
0.045-0.175
4.13-6.66
0.19-2.94
Average 28.75 6.96 3317.45 2.458 2082.90 609.85 23.92 88.23 110.97 1.38 0.09 5.5 1.30 SD 1.08 0.41 8017.21 1.93 5032.29 1471.729 13.72 188.12 271.17 1.49 0.05 1.00 1.07

International Journal of Scientific and Research Publications, Volume 7, Issue 7, July 2017 706 ISSN 2250-3153
www.ijsrp.org
Fig 2: Monthly variations of rainfall at Amaravila gauging station of Neyyar river basin (Indian Meteorological Department (IMD) data)
Fig 3: Seasonal distribution of Water temperature in Neyyar river
Fig 4: Seasonal distribution of Hydrogen ion concentration in Neyyar river water
Fig 5: Seasonal distribution of Electrical conductivity in Neyyar river water
Fig 6: Seasonal distribution of Electrical conductivity at Poovar
Fig 7: Seasonal distribution of TDS in Neyyar river water
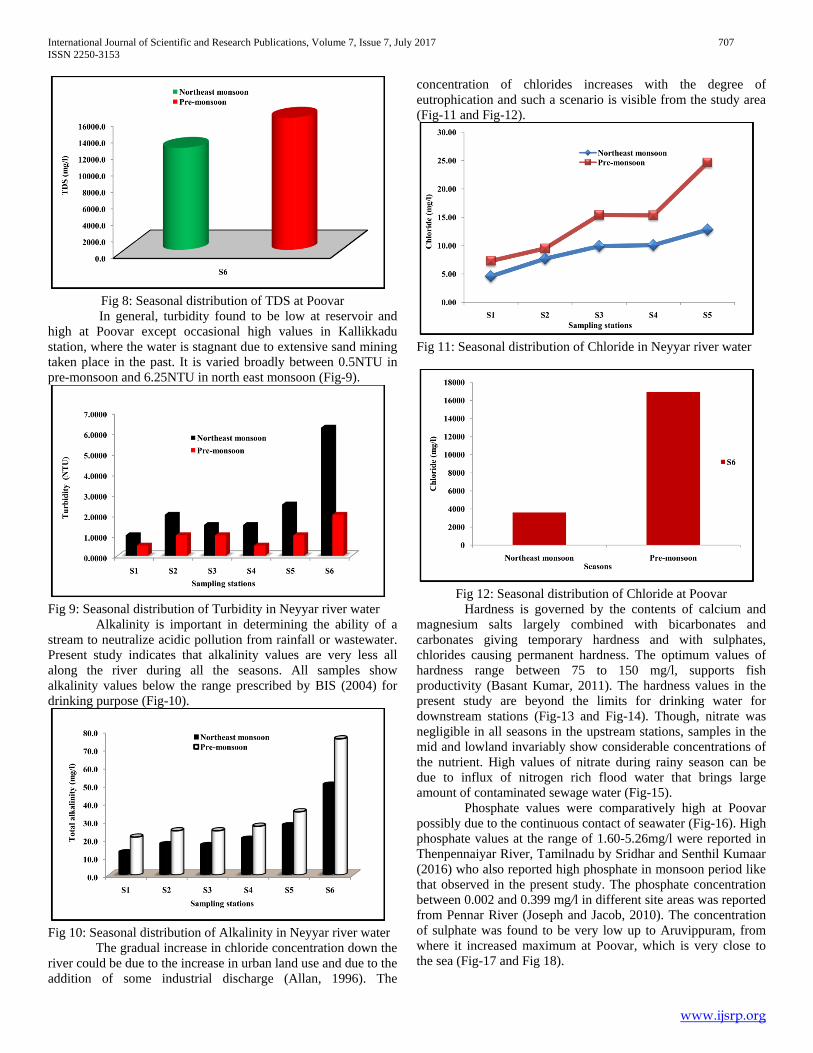
International Journal of Scientific and Research Publications, Volume 7, Issue 7, July 2017 707 ISSN 2250-3153
www.ijsrp.org
Fig 8: Seasonal distribution of TDS at Poovar In general, turbidity found to be low at reservoir and high at Poovar except occasional high values in Kallikkadu station, where the water is stagnant due to extensive sand mining taken place in the past. It is varied broadly between 0.5NTU in pre-monsoon and 6.25NTU in north east monsoon (Fig-9).
Fig 9: Seasonal distribution of Turbidity in Neyyar river water Alkalinity is important in determining the ability of a stream to neutralize acidic pollution from rainfall or wastewater. Present study indicates that alkalinity values are very less all along the river during all the seasons. All samples show alkalinity values below the range prescribed by BIS (2004) for drinking purpose (Fig-10).
Fig 10: Seasonal distribution of Alkalinity in Neyyar river water The gradual increase in chloride concentration down the river could be due to the increase in urban land use and due to the addition of some industrial discharge (Allan, 1996). The
concentration of chlorides increases with the degree of eutrophication and such a scenario is visible from the study area (Fig-11 and Fig-12).
Fig 11: Seasonal distribution of Chloride in Neyyar river water
Fig 12: Seasonal distribution of Chloride at Poovar Hardness is governed by the contents of calcium and magnesium salts largely combined with bicarbonates and carbonates giving temporary hardness and with sulphates, chlorides causing permanent hardness. The optimum values of hardness range between 75 to 150 mg/l, supports fish productivity (Basant Kumar, 2011). The hardness values in the present study are beyond the limits for drinking water for downstream stations (Fig-13 and Fig-14). Though, nitrate was negligible in all seasons in the upstream stations, samples in the mid and lowland invariably show considerable concentrations of the nutrient. High values of nitrate during rainy season can be due to influx of nitrogen rich flood water that brings large amount of contaminated sewage water (Fig-15). Phosphate values were comparatively high at Poovar possibly due to the continuous contact of seawater (Fig-16). High phosphate values at the range of 1.60-5.26mg/l were reported in Thenpennaiyar River, Tamilnadu by Sridhar and Senthil Kumaar (2016) who also reported high phosphate in monsoon period like that observed in the present study. The phosphate concentration between 0.002 and 0.399 mg/l in different site areas was reported from Pennar River (Joseph and Jacob, 2010). The concentration of sulphate was found to be very low up to Aruvippuram, from where it increased maximum at Poovar, which is very close to the sea (Fig-17 and Fig 18).

International Journal of Scientific and Research Publications, Volume 7, Issue 7, July 2017 708 ISSN 2250-3153
www.ijsrp.org
Fig 13: Seasonal distribution of Total hardness in Neyyar river water
Fig 14: Seasonal distribution of Total hardness at Poovar
Fig 15: Seasonal distribution of Nitrate in Neyyar river water The DO values ranged from 3.9mg/l during pre-monsoon at Poovar to 6.1mg/l during north east monsoon at reservoir station (Fig 19). The higher concentration of DO during winter can be attributed to the fact that cold water contains more oxygen as compared to warm water as the DO is inversely proportional to the water temperature (Hynes, 1988). In addition photosynthesis could have some kind of effect on DO. Inverse to the distribution of DO, the BOD values fluctuates between the lowest in reservoir to the highest in Poovar (Fig.20). The BOD values are obtained maximum in pre-monsoon at all sampling stations, which may be due to high
temperature, this in turn promotes microbial activities and minimum BOD values obtained may be due to low temperature and sufficient amount of water in the river. Similar observations were confirmed by many other workers such as Pathak and Mudgal (2005). The biological oxygen demand seems to be high during premonsoon probably due to stagnation of contaminants which shows the degradation of the river system from the highland portion onwards
Fig 16: Seasonal distribution of Phosphate in Neyyar river water
Fig 17: Seasonal distribution of Sulphate in Neyyar river water
Fig 18: Seasonal distribution of Sulphate at Poovar Correlation coefficient analysis of the water quality parameters demonstrates clearly the type and degree of relationship among them. In north-east monsoon, water temperature showed moderately significant positive correlation

International Journal of Scientific and Research Publications, Volume 7, Issue 7, July 2017 709 ISSN 2250-3153
www.ijsrp.org
with PH, alkalinity, nitrate, phosphate and BOD and negative correlation with DO. The PH, conductivity, turbidity, TDS, chloride, alkalinity, total hardness, sulphate, nitrate and phosphate showed highly significant positive correlation with all parameters except DO. Dissolved oxygen showed significant negative correlation with all parameters. BOD showed significant positive correlation with all parameters except DO.
Fig 19: Seasonal distribution of DO in Neyyar river water
Fig 20: Seasonal distribution of BOD in Neyyar river water. But in pre-monsoon DO showed marginal increase in negative correlation values with all parameters except BOD. Inverse to DO, BOD in pre-monsoon showed marginal decrease in positive correlation values with PH, conductivity, turbidity, TDS, chloride, total alkalinity, total hardness, sulphate, nitrate and phosphate and negative correlation values with BOD except water temperature.
Table 4: Correlation coefficient analysis of various water quality parameters during Northeast monsoon
Table 5: Correlation coefficient analysis of various water quality parameters during pre-monsoon
WT pH Cond. Turb. TDS Cl T.Alk T.H SO4 NO3-N PO4 DO BOD WT 1 pH 0.326 1 Cond. 0.144 0.953** 1 Turb. 0.281 0.961** 0.964** 1 TDS 0.114 0.953** 1.000** 0.965** 1 Cl 0.115 0.953** 1.000** 0.965** 1.000** 1 T.Alk 0.422 0.946** 0.931** 0.981** 0.931** 0.932** 1 T.H 0.123 0.955** 1.000** 0.968** 0.999** 0.999** 0.935** 1 SO4 0.114 0.953** 1.000** 0.965** 1.000** 0.999** 0.932** 0.999** 1 NO3 0.427 0.884* 0.853* 0.932** 0.853* 0.853* 0.964** 0.857* 0.853* 1 PO4 0.430 0.909* 0.900* 0.975** 0.900* 0.900* 0.990** 0.905* 0.900* 0.957** 1 DO -0.388 -0.758 -0.670 -0.830* -0.670 -0.671 -0.801* -0.677 -0.670 -0.831* -0.847* 1 BOD 0.535 0.835* 0.754 0.893* 0.754 0.755 0.921** 0.761 0.755 0.962** 0.940** -0.934** 1 * Correlation is significant at the 0.05 level (2-tailed) ** Correlation is significant at the 0.01 level (2-tailed)
WT pH Cond. Turb. TDS Cl T.Alk T.H SO4 NO3 PO4 DO BOD
WT 1 pH 0.387 1
Cond. 0.155 0.966** 1 Turb. 0.295 0.931** 0.895* 1
TDS 0.155 0.966** 1.000** 0.895* 1 Cl 0.155 0.966** 1.000** 0.895* 1.000** 1
T.Alk 0.349 0.996** 0.974** 0.913** 0.974** 0.974** 1 T.H 0.163 0.968** 0.999** 0.897* 0.999** 0.999** 0.976** 1
SO4 0.155 0.966** 0.999** 0.895* 0.999** 0.999** 0.974** 0.999** 1 NO3 0.508 0.948** 0.876* 0.884* 0.876* 0.876* 0.956** 0.879* 0.877* 1
PO4 0.397 0.797 0.688 0.817* 0.688 0.688 0.785 0.693 0.688 0.811* 1 DO -0.416 -0.792 -0.687 -0.918** -0.687 -0.686 -0.772 -0.691 -0.687 -0.837* -0.899* 1
BOD 0.564 0.717 0.558 0.752 0.558 0.558 0.670 0.565 0.558 0.682 0.920** -0.836* 1 * Correlation is significant at the 0.05 level (2-tailed) ** Correlation is significant at the 0.01 level (2-tailed)
International Journal of Scientific and Research Publications, Volume 7, Issue 7, July 2017 710 ISSN 2250-3153
www.ijsrp.org
IV. SUMMARY AND CONCLUSIONS The present study on the physico-chemical quality of river water reveals that the total alkalinity and nitrate values are within the water quality standards prescribed by BIS and the concentration of all other parameters especially in downstream stations are above the limit set by BIS. From this study it is revealed that degradation of water quality is very high at the downstream stretches of the river. This is due to high anthropogenic disturbances associated with the region and the cumulative effect of all pollutants from upstream. Wild use of chemical fertilizers and pesticides, devious dumping of domestic wastes are also the major causes of rapid fall in water quality. The quality of water is depleting also with the change in climate and other natural processes. Under this context, it is discovered that surface water pollution is comparatively high in pre-monsoon season. Apart from the lowering of water quality, these factors may adversely impact biodiversity of the riverine ecosystem. So this study indicates the need for control measures for a broader perspective to regulate these problems in Neyyar River.
ACKNOWLEDGMENT We are grateful to University of Kerala for the financial assistance. The facilities provided by PG and Research Department of Zoology, NSS College, Pandalam are greatly acknowledged. We thank Department of Botany and Chemistry (NSS College, Pandalam) for permission to work at their labs.
REFERENCES
[1] Allan, J. D. (1996). Catchment-scale analysis of aquatic ecosystems. Freshwater Biology, 37: 107-111.
[2] APHA. (2005). Standard methods for the examination of water and waste water. American Public Health Association 21st ed. Washington DC, p. 948.
[3] Basant Kumar, A., Senthil Murugan., Babu Nand Chaudhary. (2011). Seasonal Variation of Physico-Chemical Properties of Kamala Basin of Darbhanga District, Bihar. I.J.A.B.R, 1 (1): 123-125.
[4] Bureau of Indian Standards, Indian Standards (IS: 10500). (2004). Drinking Water Specification, New Delhi.
[5] Gautam, A., Khanna, D. R., Sarkar, P. (2000). Diurnal variation in the physico-chemical characteristics of the Ganga water at Rishikesh during winter season. Indian J. Environ & Ecoplan, 3 (2): 369-371.
[6] Goel, P. K., Bhosale, P. M. (2001). Studies on the river Panchganga at Kolhapur with special reference to human impact on water quality. Current topics in environmental sciences (S.l). ABD Publishers, p. 108-122.
[7] Hynes, H. B. N. (1988). Biogeography and origins of the North American Stone flies (Plecoptera). Mem. Ent. Soc. Can, 44: 31-37.
[8] Joseph, P. V. and Jacob, C. (2010). Physico-chemical characteristics of Pennar River, A Fresh Water Wetland in Kerala. Indian E-Journal of Chemistry, 7 (4): 1266-1273.
[9] Maity, P. B., Saha, T., Ghosh, P. B. and Bandopadhyay, T. S. (2004). Studies on pollution status of Jalangi River around Krishnanagar city in West Bengal. Science and Culture, 70 (5/6): 191- 194.
[10] Naiman, R. J. (1992). New Perspectives for Watershed Management. In: R. J. Naiman (ed.), Watershed Management: Balancing Sustainability and Environmental Change. New York: Springer-Verlag, pp. 3-11.
[11] Ouyang, Y., Nkedi-Kizza, P., Wu, Q. T., Shinde, D. and Huang, C. H. (2006). Assessment of seasonal variations in surface water quality. Water Res, 40: 3800-3810.
[12] Padmalal, D., Remya, S. I., Jyothi, S. J., Baijulal, B., Babu, K. N. and Baiju, R. S. (2011). Water Quality and Dissolved Inorganic Fluxes of N, P, SO4 and K of a Small Catchment River in the Southwestern Coast of India. Environ. Monit. Assess, 84: 1541-1557.
[13] Pathak, S. K. and Mudgal, L. K. (2004). Biodiversity of zooplankton of Virla reservoir, Khargone (M.P.), India, In: Arvind Kumar (ed.) Biodiversity and Environment. A.P.H. Publishing Corporation, New Delhi, pp. 317-321.
[14] Patil, Y. S., Patil, S. K., Dhande, A. D. and Pawar, N. S. (2003). Water quality of river Tapti at Bhusawal Town. Indian Journal of Environment Protection, 23(6): 620- 623.
[15] Srivastava, C. P. (1992). Pollutants and nutrients status in raw sewage. Indian Journal Environment Protection, 18: 109-111.
[16] Roshinebegam, K. and Selvakumar, S. (2014). Seasonal changes in physico-chemical parameters of Mullai Periyar River, Tamil Nadu, India. Chem. Sci. Rev. Lett, 3(9): 66-73.
[17] Sridhar, N. and Senthil Kumaar, J. S. (2016). Evaluation of Physical and Chemical Parameters of Water Samples Collected from Thenpennaiyar River at Kelavarapalli, Krishnagiri District, South India. Asian Journal of Research, 6 (5): 990-1002.
[18] Verma, D. (2006). Studies of water pollution of the river Narmada in western zone. Ph. D. Thesis, Devi Ahilya Vishwavidyalaya, Indore (M.P.), India, pp. 1-137.
AUTHORS First Author– Badusha. M, MSc; BEd; MPhil, PG and Research Department of Zoology, NSS College, Pandalam (University of Kerala), [email protected] Second Author– Lt. Dr. Santhosh. S, PhD; FSESc, PG and Research Department of Zoology, NSS College, Pandalam (University of Kerala), [email protected] Correspondence Author– Badusha. M, [email protected] +91 9447788226.